22
FUNDAMENTALS VALUATION ALOK INDUSTRIES LIMITED 13 th September 2010

FUNDAMENTALS VALUATION
ALOK INDUSTRIES LIMITED
13th
September 2010

ANALYTICAL CONTACT
Ms. Revati Kasture +91-22-6754 3465 [email protected]
BUSINESS DEVELOPMENT CONTACTS
MUMBAI
Mr. P. N. Satheeskumar +91-22-6754 3555 [email protected]
KOLKATA
Mr. Sukanta Nag +91-33- 2283 1800 [email protected]
CHENNAI
Mr. V Pradeep Kumar +91-44-2849 7812 [email protected]
AHMEDABAD
Mr. Mehul Pandya +91-79-40265656 [email protected]
NEW DELHI
Ms. Swati Agrawal +91- 11- 2331 8701 [email protected]
BANGALORE
Mr. G. Sundara Vathanan +91-80-2211 7140 [email protected]
HYDERABAD
Mr. Ashwini Kumar Jani +91-40-40102030 [email protected]
CARE EQUITY RESEARCH OFFERS
Independent Research of equities on fundamentals or valuations or both
IPO Grading
White Label Research
Valuation of companies for Institutional Investors, Asset Managers and Corporates
Sector Write-ups for Offer Documents of securities

ALOK INDUSTRIES LTD.
1 www.careratings.com
EQUIGRADE
EQUI-GRADE – Analytical Power for Investment Decision
ALOK INDUSTRIES LIMITED Integrated Textiles
Good Fundamentals; Moderate Upside Potential CMP : Rs. 20.35 / CIV: Rs. 23.00 1
13 September 2010
CARE Equity Research assigns 3/5 on fundamental grade to Alok
Industries Limited
CARE Equity Research assigns fundamental grade of 3/5 to Alok.
This indicates „Good Fundamentals‟. The grading draws its strength
from Alok‟s large integrated textile manufacturing capacities which
would not only help the company in garnering export market share
but also in becoming preferred sourcing point under the vendor
consolidation scenario by major global retailers. Furthermore,
CARE Equity Research views Alok‟s intentions to exit from its non-
core realty business as positive development that would significantly
reduce its debt from the sales proceeds.
However, CARE Equity Research expects Alok‟s domestic retail
business (H&A) to pick up slowly and thus is not value accretive in
the near term. Though Alok‟s business model is only cash and
carry, intense competition and slim margins would restrict
aggressive scalability. Finally, CARE Equity Research believe that
the concerns over high leverage and frequent equity dilution are of
lesser concern now, as the fund inflows are used in augmenting its
manufacturing capacities with potential to increase company‟s
future revenue and earnings.
Valuation
CARE Equity Research assigns valuation grade of 4/5 to Alok based
on the current Intrinsic Value (CIV) of Rs. 23 as against Current
Market Price (CMP) of 20.35, indicating „Moderate Upside
Potential‟ from CMP.
Financial Information Snapshot
(Rs Crore) FY09 FY10 FY11 P FY12 P
Operating Income 3,518 4,730 6,594 7,887
EBITDA 769 1,165 1,702 2,138
PAT (After minority interest) 74 138 382 667
Fully Diluted EPS* (Rs.) 3.0 2.5 4.8 8.5
Dividend Per Share (Rs.) 0.2 0.2 0.3 0.3
P/E (times) 8.0 4.2 2.4
EV/EBITDA (times) 8.8 6.2 5.1
* Calculated on Current Face Value of Rs. 10/- per share

ALOK INDUSTRIES LTD.
www.careratings.com 2
EQUIGRADE
Global economic recovery to boost export potential
Alok‟s product mix is balanced and the geographical markets are also diverse. Direct exports contributed close to
36% to Alok‟s top-line in FY10. The company‟s domestic market customers include various manufacturer and
traders, who in turn, export Alok‟s products with or without further processing. Therefore, sustainable demand
growth for textiles and made-ups in the international market becomes important for Alok to achieve overall
volume growth. During FY09, the global economy slowdown led to shrinkage in textile trade and closure of several
manufacturing capacities globally. Consecutively, share of Alok‟s exports revenue in its total revenue mix
decreased from 48% in FY08 to 35% in FY09. However, going forward, the global economy is projected to grow at
healthy rates of 4.6% in 2010 and 4.3% in 2011, as per International Monetary Fund (IMF) estimates. The US and
Europe, together contributing close to 60% of Alok‟s total export portfolio, are also expected to grow at about 1.0-
3.5%. It may be noted that this growth rates take into account the recent European debt crisis and tightening of
China‟s credit policy. Asia-Pacific, the second largest export market for Alok after the US, is also likely to report
one of the highest growth rates in the world. This augurs well for Alok, as recovery in the global economy would
inevitably increase demand for textile and made-ups industry.
World GDP Growth Rates (in %) Alok: Geographic Exposure
(as % of Exports-FY09)
Source: CARE Equity Research and International Monetary Fund (IMF)
FUNDAMENTAL GRADE Good Fundamentals 3/5
2008 2009 2010(F) 2011(F)
World 3.0 –0.6 4.6 4.3
US 0.4 –2.4 3.3 2.9
Europe 0.6 –4.1 1.0 1.3
Middle East and North Africa 5.3 2.4 4.5 4.9
Sub-Saharan Africa 5.6 2.2 5.0 5.9
South America 4.2 –1.8 4.8 4.0
Rest-of-North America
Canada 0.5 –2.5 3.6 2.8
Mexico 1.5 –6.5 4.5 4.4
Developing Asia 7.7 6.9 9.2 8.5
China 9.6 9.1 10.5 9.6
India 6.4 5.7 9.4 8.4
US, 43%
Asia
Pacific, 24%
Europe,
18%
South
America, 11%
North
America, 3%
Africa,
1%
ALOK INDUSTRIES LTD.
3 www.careratings.com
EQUIGRADE
Strong business model given Alok‟s presence across the entire textile value chain
Alok is currently one of the largest vertically integrated textile players in India having its presence across the entire
textile value chain. From yarn production, both cotton and synthetic, to garment and home textile production, the
company is providing end-to-end textile solutions. To cover the last mile connectivity, the company also ventured
into retail business through its wholly owned subsidiaries Alok H&A Ltd. in the domestic market and Grabal Alok
(UK) Ltd. in the United Kingdom market.
CARE Equity Research views this business model extremely robust as it gives Alok lot of flexibility in terms of
pricing, quality, adhering to delivery schedules and product selection. Company‟s backward integration to
cotton/synthetic yarn manufacturing enhances input cost efficiencies.
Alok plans to strengthen its presence in synthetic textile as well. The company is increasing the installed capacity
for producing partially oriented yarn (POY) from current 200,000 tonnes per annum to 400,000 tonnes per
annum. The POY is then further texturised and sold in the market. Furthermore, Alok is also building a
production facility for manufacturing various value added products such as Full Drawn Yarn (FDY) and Dyed
Polyester Yarn (DPY) and other products like cationic yarn. The polyester segment is expected to witness healthy
growth on account of polyester yarn being relatively cheaper to cotton yarn and its multiple utility.
Large integrated capacity to benefit Alok in the vendor consolidation scenario by major global retailers
The global retail industry is currently going through the phase of vendor consolidation. Major global retailers are
attempting to reduce the number of vendors in order to reduce their logistics and procurement costs. To illustrate,
JCPenney has reduced its sourcing locations from 50 countries in 2004 to 35 countries in 2006, and aims to
reduce it to about 20 countries in the next few years. By doing so, the company is expecting to reduce cost of its
apparel imports by 10%. China, the main beneficiary of this shift, is now becoming expensive primarily due to
rising yuan and a strong local demand and accordingly India, a cotton-rich country with end-to-end textile solutions
and good designing capabilities, is increasingly becoming preferred sourcing destination.
Under such scenario, Alok is likely to continue to be amongst the preferred vendors of global retail giants due to
its presence across the textile value chain with proven quality standards. The company has also significantly scaled
up its manufacturing capacities making it one of the largest integrated textile players in India. Such coverage
throughout the breadth and width of textile industry would not only help Alok in securing bulk and repeat orders
but also help in achieving economies of scale.
ALOK INDUSTRIES LTD.
www.careratings.com 4
EQUIGRADE
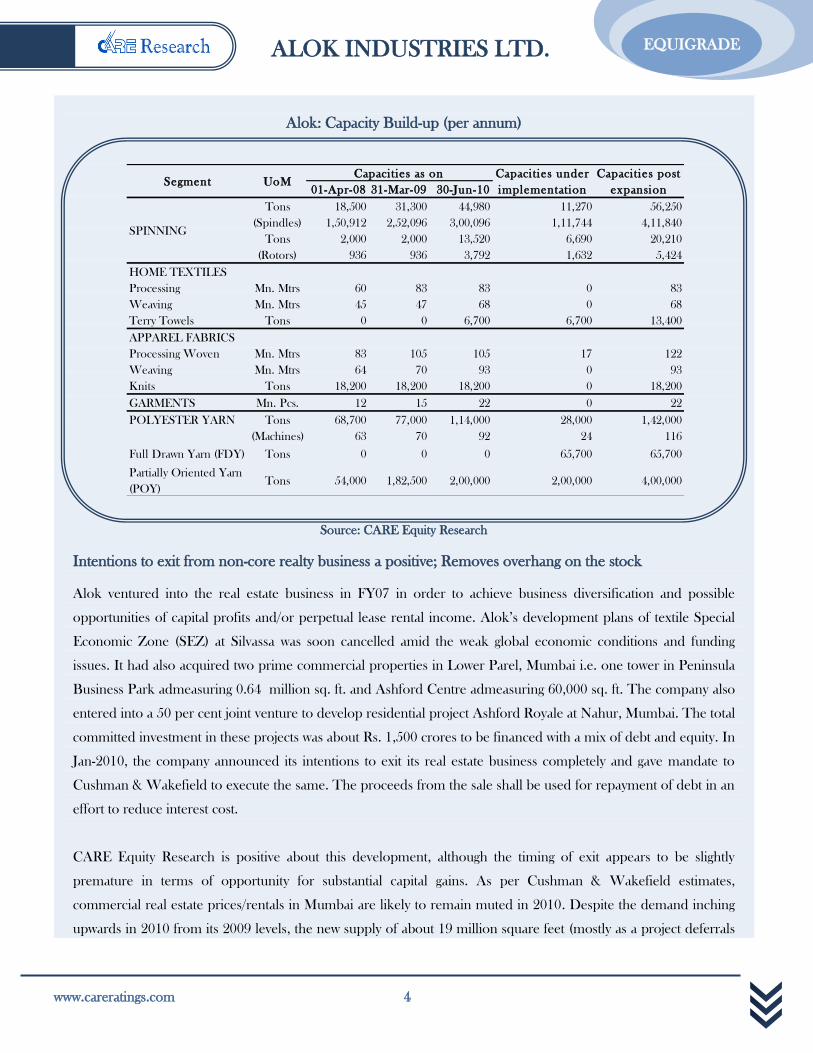
Alok: Capacity Build-up (per annum)
Source: CARE Equity Research
Intentions to exit from non-core realty business a positive; Removes overhang on the stock
Alok ventured into the real estate business in FY07 in order to achieve business diversification and possible
opportunities of capital profits and/or perpetual lease rental income. Alok‟s development plans of textile Special
Economic Zone (SEZ) at Silvassa was soon cancelled amid the weak global economic conditions and funding
issues. It had also acquired two prime commercial properties in Lower Parel, Mumbai i.e. one tower in Peninsula
Business Park admeasuring 0.64 million sq. ft. and Ashford Centre admeasuring 60,000 sq. ft. The company also
entered into a 50 per cent joint venture to develop residential project Ashford Royale at Nahur, Mumbai. The total
committed investment in these projects was about Rs. 1,500 crores to be financed with a mix of debt and equity. In
Jan-2010, the company announced its intentions to exit its real estate business completely and gave mandate to
Cushman & Wakefield to execute the same. The proceeds from the sale shall be used for repayment of debt in an
effort to reduce interest cost.
CARE Equity Research is positive about this development, although the timing of exit appears to be slightly
premature in terms of opportunity for substantial capital gains. As per Cushman & Wakefield estimates,
commercial real estate prices/rentals in Mumbai are likely to remain muted in 2010. Despite the demand inching
upwards in 2010 from its 2009 levels, the new supply of about 19 million square feet (mostly as a project deferrals
01-Apr-08 31-Mar-09 30-Jun-10
Tons 18,500 31,300 44,980 11,270 56,250
(Spindles) 1,50,912 2,52,096 3,00,096 1,11,744 4,11,840
Tons 2,000 2,000 13,520 6,690 20,210
(Rotors) 936 936 3,792 1,632 5,424
HOME TEXTILES
Processing Mn. Mtrs 60 83 83 0 83
Weaving Mn. Mtrs 45 47 68 0 68
Terry Towels Tons 0 0 6,700 6,700 13,400
APPAREL FABRICS
Processing Woven Mn. Mtrs 83 105 105 17 122
Weaving Mn. Mtrs 64 70 93 0 93
Knits Tons 18,200 18,200 18,200 0 18,200
GARMENTS Mn. Pcs. 12 15 22 0 22
POLYESTER YARN Tons 68,700 77,000 1,14,000 28,000 1,42,000
(Machines) 63 70 92 24 116
Full Drawn Yarn (FDY) Tons 0 0 0 65,700 65,700
Partially Oriented Yarn
(POY)Tons 54,000 1,82,500 2,00,000 2,00,000 4,00,000
SPINNING
Capacities as onUoMSegment
Capacities under
implementation
Capacities post
expansion

ALOK INDUSTRIES LTD.
5 www.careratings.com
EQUIGRADE
from 2009) and high vacancy rates of about 14% observed in 2009 will effectively act as a cap on rental
values/selling prices.
Nevertheless, the exit is likely to remove overhang from the stock as the proceeds from the sale would enable
company to allocate resources more efficiently to its core textile business. Our interaction with Alok management
has given us the confidence that Alok management is committed and making significant progress in this direction
given its reasonable price expectations and progress on financial closure of Peninsula Business Park project with
developers. CARE Equity Research has taken a more conservative outlook that Alok would lease-out its two
commercial properties at Lower Parel (Peninsula Corporate Park & Ashford Complex) at average rental values of
about Rs 150-175 per square feet per month till FY14x and would conclude the final sale in FY15 at a rate of
about Rs 26,000 per square feet and about Rs. 6,50,000 per slot of parking space. In light of these assumptions,
the exit from reality business would help Alok in reducing its debt by about Rs 2,000 crore by 2014-15.
De-risking revenue stream across all parameters
Over the years, Alok has diversified its revenue mix across all parameters. It forayed into cotton yarn business and
ramped up its garments business, bringing contribution of its apparel fabric division from 51% in FY05 to 44% in
FY10. The company also substantially increased its export revenue in order to reap the benefit of removal of
textile quota, but maintained its domestic focus with 64% revenue share. Prior to FY06, Alok was over-exposed to
the US market with more than 60% of its export revenue coming from that country. Realizing that any adverse
macroeconomic events, such as slowdown or unfavorable government policy may hit its profitability, Alok started
mitigating this risk by diversifying into other geographies especially in Central Europe, Africa, Asia and South
America. Alok currently supplies to over 70 countries in the world.
Alok: Revenue Diversification
*Export Revenue Break-up Source: CARE Equity Research
Across Segments Across Country Across Geography*
8
5144
22 16
1 3
26 28
0%
20%
40%
60%
80%
100%
FY06 FY10
Polyester
Yarn
Garments
Home
Textiles
Apparel
Fabric
Cotton
Yarn
2836
7264
0%
20%
40%
60%
80%
100%
FY06 FY10
Domestic
Sales
Export
Sales
6043
21
24
718
5 116 3
0%
20%
40%
60%
80%
100%
FY06 FY09
Africa
N. America
S. America
Europe
Asia-Pac
US

ALOK INDUSTRIES LTD.
www.careratings.com 6
EQUIGRADE
Domestic cash and carry expansion not value accretive in near term
Alok entered into domestic retail segment in FY07 through its “Home & Apparels” stores to capture the growing
domestic demand. The company adopted value retailing approach with franchise business model in order to lower
its capital expenditure requirement. Over the years, Alok has massively expanded its retail distribution network
from 14 stores in FY07 to 226 stores as on 30-June-2010, and aims to expand it to 450 operational stores by
March-2011.
Although, CARE Equity Research is positive about the prospects of value retailing in India and acknowledges
Alok‟s competitive advantage over other retailers in the form of a) integrated textile manufacturing capacity b) wide
textile experience and c) lower capex and working capital requirement amid franchise model, the company‟s
growth plans appears to be aggressive in medium term. Competition in domestic retail industry has intensified in
recent years leading to major retail players booking slim margins. For example, PAT margins for typical value
retailers merely ranges between 1.00 to 3.00%. Alok is unlikely to break-in the more profitable lifestyle segments
due to relatively lower brand recognition compared to PRIL, Shopper‟s Stop, Trent and Provogue. Under such
competitive scenario and razor thin margins, CARE Equity Research does not see the domestic retail segment
adding significant revenue or profitability to the company in FY11. Nevertheless, the cash and carry business
contributes less than 1 per cent of the company‟s consolidated top-line and hence no major impact is expected in
the operations of Alok.
Profitability Comparison of Major Retail Players
Notes: [1] Margins as reported for FY10. [2] Retail players in italics are active in life-style
Segment. PRIL is active in both life-style and value retail segment.
Source: CARE Equity Research
PRIL
Shopper's Stop
Trent
Provogue (India) Ltd.
Alok (H&A-
2012E)
5.00
7.00
9.00
11.00
13.00
15.00
2.00 3.00 4.00 5.00 6.00 7.00
PB
ILD
T M
argi
n (
%)
PAT Margin (%)
ALOK INDUSTRIES LTD.
7 www.careratings.com
EQUIGRADE
Reasonable corporate Governance practices
Alok‟s board comprises of 12 directors, of which 7 are independent directors. 5 independent directors are
nominees of various banks and financial institutions. This suggests well diversified composition of board with
adequate separation of ownership and management. Alok is in compliance with the provisions of the Listing
Agreement in respect of corporate governance, especially with respect to broad basing of the Board of Directors
and constituting committees. There are four Board level committees in Alok - (i) Audit Committee, (ii)
Shareholders‟/Investors‟ Grievances Committee; (iii) Remuneration Committee and (iv) Executive Committee.
The audit, the shareholders‟/investors‟ grievances and the remuneration committees are chaired by independent
directors. The board is supported by well experienced senior level managerial personnel.
Frequent equity dilution a sentiment negative but unfounded amid rapid expansion in capacity
In last few years, Alok has rapidly augmented its textile manufacturing capacities and forayed into new business
ventures such as realty. Apart from substantial debt financing under the Technology Upgradation Fund Scheme
(TUFS), the company has also raised equity capital in order to fund its sizeable growth plans.
Alok has significantly diluted its equity capital base from about Rs. 170 crore in FY07 to Rs 788 crore in FY10.
This equity dilution has lead to EPS falling at a faster annual rate of 34.0% compared to net profit declining at a
annual rate of about 6.0 per cent. Nevertheless, CARE Equity Research believes that the risk of frequent equity
dilution is unfounded as Alok has opted to invest the funds in augmenting its textile manufacturing capacities. The
additional production facilities have potential to increase company‟s future revenue and earnings. Furthermore,
accelerated economic recovery may lead to demand rising quickly than supply, and Alok, with already in-place
world-class manufacturing facilities across segments, can scale up its volumes promptly to take advantage of the
strengthening demand.
ALOK INDUSTRIES LTD.
www.careratings.com 8
EQUIGRADE
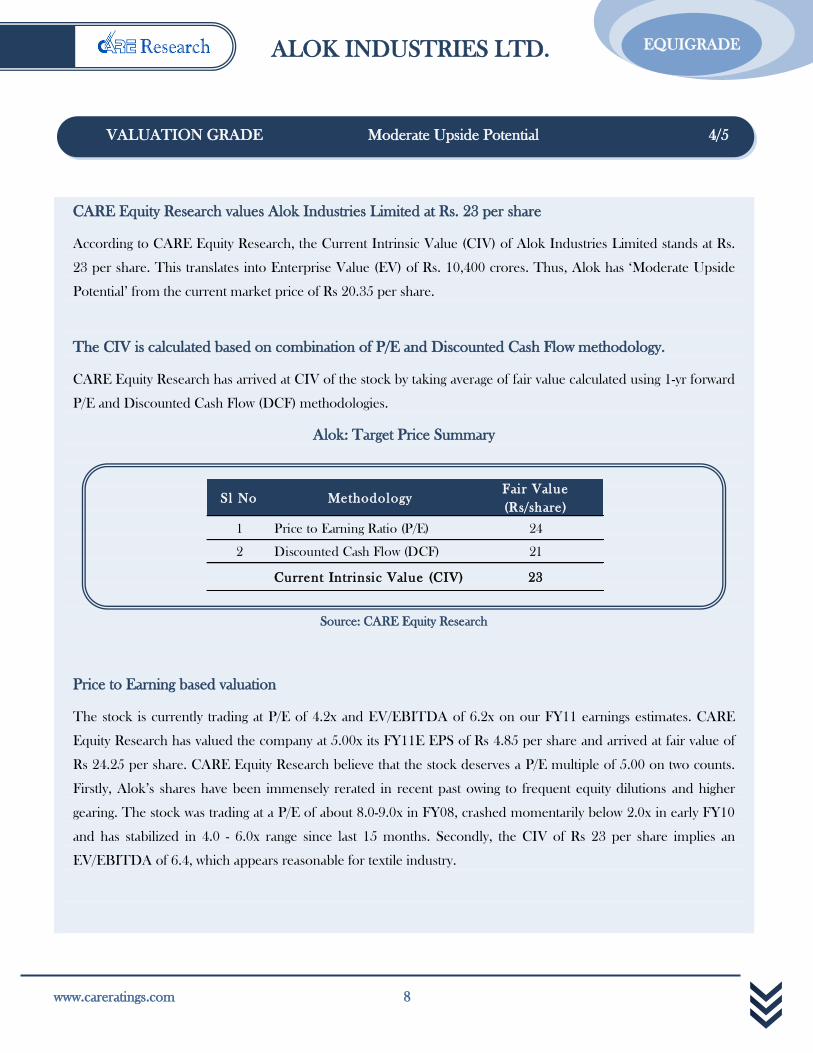
CARE Equity Research values Alok Industries Limited at Rs. 23 per share
According to CARE Equity Research, the Current Intrinsic Value (CIV) of Alok Industries Limited stands at Rs.
23 per share. This translates into Enterprise Value (EV) of Rs. 10,400 crores. Thus, Alok has „Moderate Upside
Potential‟ from the current market price of Rs 20.35 per share.
The CIV is calculated based on combination of P/E and Discounted Cash Flow methodology.
CARE Equity Research has arrived at CIV of the stock by taking average of fair value calculated using 1-yr forward
P/E and Discounted Cash Flow (DCF) methodologies.
Alok: Target Price Summary
Source: CARE Equity Research
Price to Earning based valuation
The stock is currently trading at P/E of 4.2x and EV/EBITDA of 6.2x on our FY11 earnings estimates. CARE
Equity Research has valued the company at 5.00x its FY11E EPS of Rs 4.85 per share and arrived at fair value of
Rs 24.25 per share. CARE Equity Research believe that the stock deserves a P/E multiple of 5.00 on two counts.
Firstly, Alok‟s shares have been immensely rerated in recent past owing to frequent equity dilutions and higher
gearing. The stock was trading at a P/E of about 8.0-9.0x in FY08, crashed momentarily below 2.0x in early FY10
and has stabilized in 4.0 - 6.0x range since last 15 months. Secondly, the CIV of Rs 23 per share implies an
EV/EBITDA of 6.4, which appears reasonable for textile industry.
VALUATION GRADE Moderate Upside Potential 4/5
Sl No MethodologyFair Value
(Rs/share)
1 Price to Earning Ratio (P/E) 24
2 Discounted Cash Flow (DCF) 21
Current Intrinsic Value (CIV) 23

ALOK INDUSTRIES LTD.
9 www.careratings.com
EQUIGRADE
Alok: 1-yr forward P/E contour Alok: Historic 1-yr forward EV/EBITDA
Source for all above graphs and tables: CARE Equity Research and Prowess
Discounted Cash Flow
The overall firm Weighted Average Cost of Capital (WACC) is calculated based on our long term
assumptions of cost of financing summarized in below table.
CARE Equity Research has used Free Cash Flow (FCF) methodology to arrive at the firm value as Alok
has shown considerable volatility in its gearing ratio in last few years. The forecasted FCF is as per CARE
Equity Research estimates.
Alok: Fair Value Estimation using
P/E Multiple Method
Alok: Implied EV/EBITDA Calculation
based on Fair Value
PAT (2011) 382
No. of Shares (crore) 79
EPS(2011) 4.85
CMP 19.20
P/E (1 yr fwd P/E) 3.96
Justified P/E 5.00
Fair Value 24.25
P/E
EBITDA (2011) 1,702
Fair Value 23.17
No. of Shares (crore) 79
Market Cap (Rs crore) 1,825
Net Debt (2010) 9,050
EV 10,875
Implied EV/EBITDA 6.39
Implied EV/EBITDA
0
20
40
60
80
100
120
Oct
-05
Ap
r-06
Oct
-06
Ap
r-07
Oct
-07
Ap
r-08
Oct
-08
Ap
r-09
Oct
-09
Ap
r-10
Sh
are
Pri
ce (R
s.)
Share Price 2x 4x 6x 8x
4.00
6.00
8.00
10.00
12.00
14.00
Oct-05 Oct-06 Oct-07 Oct-08 Oct-09
EV
/EB
ITD
A (
1-y
r fo
rward
)
ALOK INDUSTRIES LTD.
www.careratings.com 10
EQUIGRADE
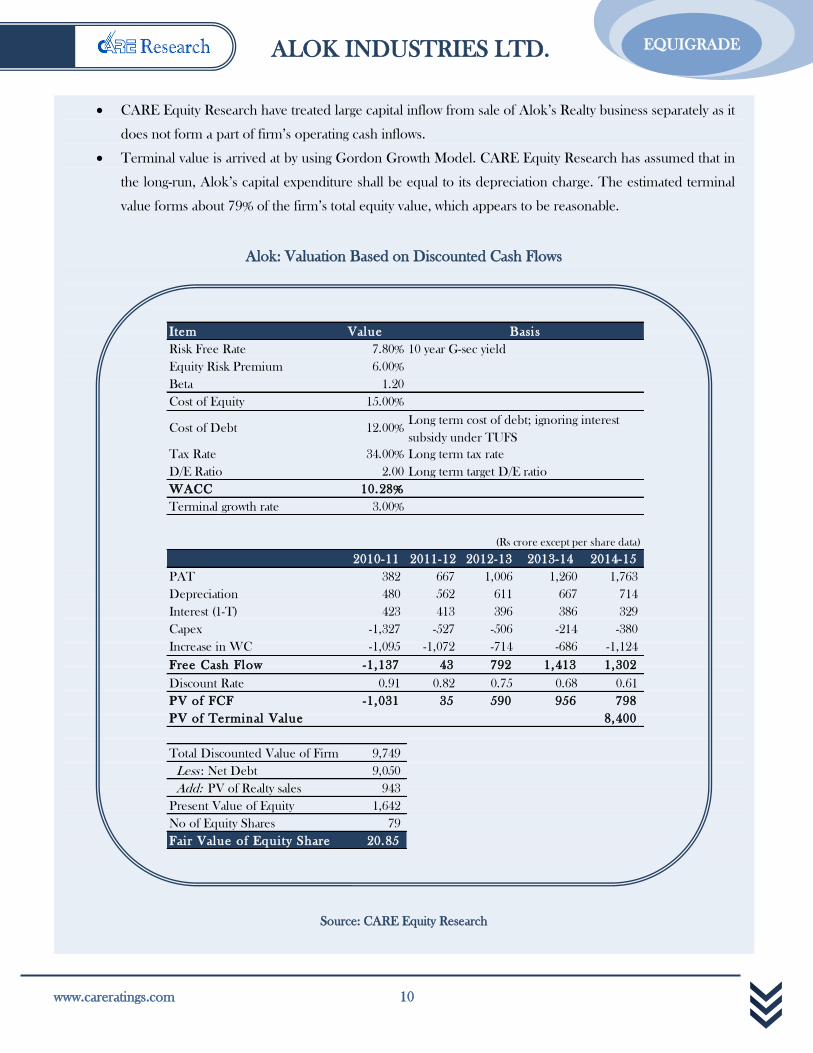
CARE Equity Research have treated large capital inflow from sale of Alok‟s Realty business separately as it
does not form a part of firm‟s operating cash inflows.
Terminal value is arrived at by using Gordon Growth Model. CARE Equity Research has assumed that in
the long-run, Alok‟s capital expenditure shall be equal to its depreciation charge. The estimated terminal
value forms about 79% of the firm‟s total equity value, which appears to be reasonable.
Alok: Valuation Based on Discounted Cash Flows
Source: CARE Equity Research
Item Value
Risk Free Rate 7.80% 10 year G-sec yield
Equity Risk Premium 6.00%
Beta 1.20
Cost of Equity 15.00%
Cost of Debt 12.00%
Tax Rate 34.00% Long term tax rate
D/E Ratio 2.00 Long term target D/E ratio
WACC 10.28%
Terminal growth rate 3.00%
(Rs crore except per share data)
2010-11 2011-12 2012-13 2013-14 2014-15
PAT 382 667 1,006 1,260 1,763
Depreciation 480 562 611 667 714
Interest (1-T) 423 413 396 386 329
Capex -1,327 -527 -506 -214 -380
Increase in WC -1,095 -1,072 -714 -686 -1,124
Free Cash Flow -1,137 43 792 1,413 1,302
Discount Rate 0.91 0.82 0.75 0.68 0.61
PV of FCF -1,031 35 590 956 798
PV of Terminal Value 8,400
Total Discounted Value of Firm 9,749
Less : Net Debt 9,050
Add: PV of Realty sales 943
Present Value of Equity 1,642
No of Equity Shares 79
Fair Value of Equity Share 20.85
Long term cost of debt; ignoring interest
subsidy under TUFS
Basis

ALOK INDUSTRIES LTD.
11 www.careratings.com
EQUIGRADE
Alok: Sensitivity Analysis – Share price
Source: CARE Equity Research
9.5% 10.0% 10.6% 11.0% 11.5%
2.0% 11.6 8.7 7.1 3.0 0.3
2.5% 18.3 15.2 13.5 9.2 6.4
3.0% 25.9 22.6 20.8 16.3 13.3
3.5% 34.6 31.2 29.3 24.5 21.3
4.0% 44.8 41.1 39.0 33.9 30.5
Te
rmin
al
Ye
ar
Gro
wth
Rate
(%
)
Weighted Average Cost of Capital (%)

ALOK INDUSTRIES LTD.
www.careratings.com 12
EQUIGRADE
Company Background
Alok Industries Ltd (Alok) was established in 1986 as private limited company and subsequently became a public
limited company in 1993. Alok is currently one of the largest vertically integrated textile players in India having its
presence across the textile value chain. The company is headquartered in Mumbai with its manufacturing units at
Silvassa, Vapi, Navi Mumbai and Bhiwandi. Alok has ventured into retail segment through its fully owned
subsidiary Alok H&A Ltd, which currently executes Alok‟s cash & carry operations through 248 stores across India.
The company intends to exit from its non-core real estate business in which it forayed in FY07.
Organization Chart
Source: CARE Equity Research
Business Mix
Alok has diversified revenue stream through five divisions namely, Cotton Yarn, Apparel Fabric, Home Textiles,
Garments and Polyester Yarn. The Apparel Fabric division is largest in terms of its contribution to the company‟s
overall revenue stream followed by Polyester Yarn division. Alok backward-integrated into the Cotton Yarn
COMPANY BACKGROUND
Alok Industries Ltd.
(textile manufacturing)
Alok Industries
International (BVI)100% subsidiary
(international business)
Alok H&A Ltd.
100% subsidiary
(domestic cash & carry)
Alok Infrastructure Ltd
100% subsidiary
(infrastructure & realty)
Alok Apparels Pvt Ltd
100% subsidiary(domestic garment
manufacturing)
Mileta International
93.2% holding Czech Republic
(textile man.)
Grabal Alok (UK) Ltd
42% holding (Store “Twenty one”
& qs)
Alok Realtors Pvt Ltd.
100% Subsidiary(Peninsula Project)
Ashford Infotech Pvt Ltd
50% holding
(Nahur Project)

ALOK INDUSTRIES LTD.
13 www.careratings.com
EQUIGRADE
business in FY07 in order to de-risk the overall business and enhance input cost efficiencies. Contribution of the
Cotton Yarn business to the company‟s overall sales dropped sharply in FY09 primarily due to the lack of profitable
trading opportunities and sluggish export markets, but rebounded in FY10. The Garment division was benefited the
most by removal of the textiles and clothing quotas in 2005. Subsequently, Alok increased its garment
manufacturing capacity from 1.0 million pieces in FY05 to 22.0 million pieces in FY09. As a result, share of the
Garments division in the company‟s revenue mix increased from about 1.0% in FY05 to 3.1% in FY10.
Nevertheless, Alok is currently not envisaging any further capacity addition in this segment.
Division-wise Revenue Break-up (in %)
Source: CARE Equity Research
Export Business
Removal of the textiles and clothing quotas in Jan-2005 changed the trade pattern of global textile industry
substantially. Low cost textile producers such as India and China benefited immensely as big importers like Wal-
Mart, GAP, Marks & Spencer, JC Penney, Macy's, Target, Liz Claiborne and IKEA set substantially higher long-
term sourcing targets. Consecutively, Alok‟s export sales surged by about 175% on y-o-y basis, as against India‟s
overall textile export growth rate of 25% in FY05. Since then, Alok has exhibited impressive growth on its export
sales, increasing at a CAGR of about 38% in last five year ending March-2010. Export sales stagnated during FY09
primarily due to the global economic conditions when global textile trade shrunk and several manufacturing
capacities were shut-down.
4.61 13.55 3.73 8.22
51.2 49.141.2 54.1 44.5
21.8 18.3 17.9 16.716.2
1.0 1.6 4.6 4.73.1
25.9 26.3 22.7 20.8 28.1
0%
20%
40%
60%
80%
100%
FY06
(1,421 Cr)
FY07
(1,825 Cr)
FY08
(2,170 Cr)
FY09
(2,977 Cr)
FY10
(4,311 Cr)
Cotton Yarn Apparel Fabric Home Textiles
Garments Polyester Yarn

ALOK INDUSTRIES LTD.
www.careratings.com 14
EQUIGRADE
Alok: Export Sales & Export as % of Total Sales
Source: CARE Equity Research
Geographic Exposure
Alok exports to over seventy countries across the US, Asia Pacific, Europe, South America, North America and
Africa. Although the US has remained as one of the biggest markets for Alok, the company has diversified its
export market to other regions such as Asia-Pacific and Europe. On the divisional side, the Home Textiles and
Garments businesses are primarily focused on export markets exporting almost 100% of their output.
Alok: Geographic Exposure as % of Exports
2004-05 2008-09
Source: CARE Equity Research
0
10
20
30
40
50
60
0
200
400
600
800
1,000
1,200
1,400
1,600
1,800
FY04 FY05 FY06 FY07 FY08 FY09 FY10
Ex
po
rt (
% o
f T
ota
l S
ales)
Ex
po
rt S
ales
(Rs
Cro
re)
Export Sales Export (% of total sales-RHS)
US, 57%
Asia
Pacific, 9%
Europe,
16%
South
America, 10%
North
America, 7%
Africa,
1%
US, 43%
Asia
Pacific, 24%
Europe,
18%
South
America, 11%
North
America, 3%
Africa,
1%

ALOK INDUSTRIES LTD.
15 www.careratings.com
EQUIGRADE
Division-wise Export/Domestic Revenue Break-up (in %)
Source: CARE Equity Research
Promoters
Mr. Ashok Jiwrajka: (Executive Chairman) is a commerce graduate and one of the founding members of Alok. He
has over three decades of experience in textile industry and currently overseeing Alok‟s marketing and export
activities.
Mr. Dilip B. Jiwrajka (Managing Director) is one of the founding members of Alok. He has done his post-
graduation in Business Entrepreneurship and Management and is associated with the textile industry for more than
25 years. His responsibilities at Alok include forming the Company's growth strategy, responsibility for the Apparel
Fabric and Garment divisions and overseeing the overall working of Alok and other group companies.
Mr. Surendra B. Jiwrajka (Jt. Managing Director) is one of the founding members of Alok. He is a commerce
graduate with over two decades of experience in textile industry. His functions at Alok include forming the
Company's growth strategy, overseeing the manufacturing, marketing functions of the polyester and spinning
businesses and project implementation.
96
45
66
19 16 14
100 99 9890 91 93
21 20 21
34
81 84 86
10 9 7
79 80 79
0%
20%
40%
60%
80%
100%
FY
08
FY
09
FY
10
FY
08
FY
09
FY
10
FY
08
FY
09
FY
10
FY
08
FY
09
FY
10
FY
08
FY
09
FY
10
Cotton
Yarn
Apparel
Fabric
Home
Textiles
Garments Polyester
Yarn
Export Sales Domestic Sales

ALOK INDUSTRIES LTD.
www.careratings.com 16
EQUIGRADE
Abolition of quotas has opened up sea of opportunities for low cost producers like India
Abolition of quota regime from 1st January, 2005 has drastically changed the paradigm of the global textiles and
apparel trade. The T&A trade increased manifold between the nations with the manufacturing base being shifted to
relatively low cost Asian countries like India, China, Bangladesh, Indonesia and Malaysia. Asian countries became
the key exporters and the high cost centers as well as key consumers like US and EU became the key importers.
Asian countries account for approximately 71 per cent of the total apparel production, while US and EU contribute
11 per cent and 14 per cent respectively. However, US and EU account for more than 65 per cent of apparel
consumption.
Indian textile industry is fragmented in nature
India‟s textile industry primarily comprises of small-scale, non-integrated spinning, weaving, processing and made-
ups making units. There are only a few integrated units; fully integrated units like Alok are unique in this industry.
Close to 90 per cent of the spinning production is accounted for by more than 2,500 stand-alone units, with
integrated units accounting for merely 10 per cent of spun yarn production. Similarly, weaving and knitting sector is
too is highly fragmented, with unorganised sector accounting for close to 95 per cent of the total cloth production.
The processing industry is also largely decentralized, marked largely by hand processing units and independent
processing units. Composite mill sectors are very few falling into the organized category. Overall, there are about
2,300 – 2,500 processors operating in India, but only about 200 units are integrated with spinning, weaving or
knitting units. Small-scale fabricators dominate garment and home textile manufacturing. The bulk of apparel is
produced by more than 1,00,000 sub-contractors.
Indian textile industry projected to be on high growth trajectory
CARE Research estimates India‟s textile industry to be worth Rs. 2,700 billion in FY10, of which Rs. 950 billion
worth textile products are exported. The domestic market is estimated by CARE Research to grow at CAGR of 11
– 12 per cent in the next five years from Rs. 1,750 billion to Rs. 2,600 billion in FY15. Textile exports are expected
by CARE Research to grow at a faster CAGR of 17 – 18 per cent to Rs. 2,100 billion by FY15. Buoyant economy
will drive domestic sales, while increase in sourcing from low cost centers like India would drive textile exports.
SNAPSHOT OF THE INDIAN TEXTILE INDUSTRY

ALOK INDUSTRIES LTD.
17 www.careratings.com
EQUIGRADE
FINANCIAL STATISTICS
ALOK INDUSTRIES LTD.
www.careratings.com 18
EQUIGRADE
CARE Equigrade Grid (CEG)
Through CEG, CARE Equity Research addresses two critical factors considered by an investor while investing in a
particular company‟s equity shares:
1. Fundamentals: Whether the company is fundamentally sound with respect to its business, its financial position, its
management and its prospects.
2. Valuation: What is the Current Intrinsic Value (CIV) of the stock and how it compares vis-a-vis its Current
Market Price (CMP)
These factors are answered assigning quantitative grades to both these parameters. CEG is the snapshot of
„Fundamental Grade‟ and „Valuation Grade‟ assigned by CARE Equity Research.
Fundamental Grade
This grade represents how sound the company is fundamentally, vis-à-vis other listed companies in India. This grade
captures:
1. Business Fundamentals and Prospects
2. Financial Soundness
3. Management Quality
4. Corporate Governance Practices
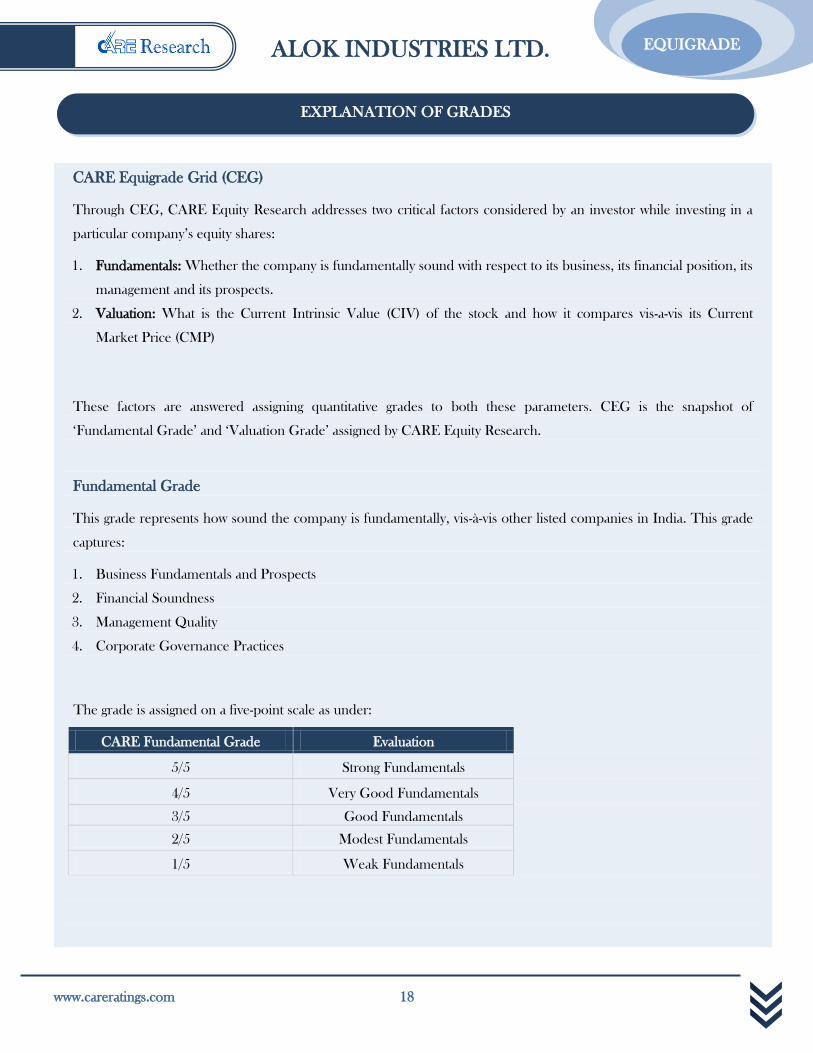
The grade is assigned on a five-point scale as under:
CARE Fundamental Grade Evaluation
5/5 Strong Fundamentals
4/5 Very Good Fundamentals
3/5 Good Fundamentals
2/5 Modest Fundamentals
1/5 Weak Fundamentals
EXPLANATION OF GRADES

ALOK INDUSTRIES LTD.
19 www.careratings.com
EQUIGRADE
Valuation Grade
This grade represents the potential value in the company‟s equity share for the investor over a 1 year period. The
Current Intrinsic Value (CIV) or the price arrived by CARE Equity Research on fundamental basis is compared with
the current market price (CMP) of the stock and the grade is assigned based on the gap between CIV and CMP of the
stock.
The grade is assigned on a five-point scale as under:
CARE Valuation Grade Evaluation
5/5 Considerable Upside Potential
(>25% from CMP)
4/5 Moderate Upside Potential
(10-25% from CMP)
3/5 Fairly Priced
(+/- 10% from CMP)
2/5 Moderate Downside Potential
(Negative 10-25 from CMP)
1/5 Considerable Downside Potential
(<25% from CMP)
Grading determination is a matter of experienced and holistic judgment, based on relevant quantitative and qualitative factors of
the company in relation to other listed companies.
DISCLOSURES
Each member of the team involved in the preparation of this grading report, hereby affirms that there exists no conflict of interest that can bias
the grading recommendation of the company.
This report has been sponsored by the company.
DISLCLAIMER
This report is prepared by CARE Research, a division of Credit Analysis & REsearch Limited [CARE]. CARE Research has taken utmost care to
ensure accuracy and objectivity while developing this report based on information available in public domain or from sources considered reliable.
However, neither the accuracy nor completeness of information contained in this report is guaranteed. CARE Research operates independently of
ratings division and this report does not contain any confidential information obtained by ratings division, which they may have obtained in the
regular course of operations. Opinions expressed herein are our current opinions as on the date of this report. Nothing in this report can be
construed as either investment or any other advice or any solicitation, whatsoever. The subscriber / user assumes the entire risk of any use made of
this report or data herein. CARE specifically states that it or any of its divisions or employees have any financial liabilities whatsoever to the
subscribers / users of this report. This report is for personal information only of the authorised recipient in India only. This report or part of it
should not be reproduced or redistributed or communicated directly or indirectly in any form to any other person, especially outside India or
published or copied for any purpose.
Published by Credit Analysis & REsearch Ltd., 4th Floor Godrej Coliseum, Off Eastern Express Highway, Somaiya Hospital Road, Sion
East, Mumbai – 400 022.
CARE Research is not responsible for any errors or omissions in analysis/inferences/views or for results obtained from the use of information
contained in this report and especially states that CARE (including all divisions) has no financial liability whatsoever to the user of this product. This
report is for the information of the intended recipients only and no part of this report may be published or reproduced in any form or manner
without prior written permission of CARE Research.

ALOK INDUSTRIES LTD.
www.careratings.com 20
EQUIGRADE
+
Credit Analysis & REsearch Ltd. (CARE) is a full service rating company that offers a wide range of rating and grading services
across sectors. CARE has an unparallel depth of expertise. CARE Ratings methodologies are in line with the best international
practices.
CARE Research
CARE Research is an independent research division of CARE Ratings, a full service rating company. CARE Research is
involved in preparing detailed industry research reports with 5 year demand and 2 year profitability outlook on the industry
besides providing comprehensive trend analysis and the current state of the industry. CARE Research also offers research that
is customised to client requirements. CARE Research currently offers reports on more than 21 industries that include Cement,
Steel, Aluminium, Construction, Shipping, Ship-building, Commercial Vehicles, Two-Wheelers, Tyres, Auto Components,
Pipes, Natural Gas, Retail, Sugar, etc. CARE Research now offers independent research of equities through its product
„EQUIGRADE‟.
CREDIT ANALYSIS & RESEARCH LTD
HEAD OFFICE |Mr. P. N. Satheeskumar | Cell: +91-9820416004 | Tel: +91-22-6754 3555 | E-mail:
4th Floor, Godrej Coliseum, Somaiya Hospital Road, Off Eastern Express Highway, Sion (East), Mumbai - 400 022 |
Tel: +91-022- 6754 3456 | E-mail: [email protected] | Fax: +91-022- 6754 3457
KOLKATA | Mr. Sukanta Nag | Cell: +91-98311 70075 | Tel: +91-33- 2283 1800/ 1803, 2280 8472 |
E- mail: [email protected] | 3rd Flr., Prasad Chambers (Shagun Mall Bldg), 10A, Shakespeare Sarani, Kolkata -700 071
CHENNAI | Mr. V Pradeep Kumar | Cell: +91 9840754521 | Tel: +91-44-2849 7812/2849 0811 | Fax: +91-44-2849 0876 |
Email: [email protected] | Unit No. O-509/C, Spencer Plaza, 5th Floor, No. 769, Anna Salai, Chennai - 600 002
AHMEDABAD | Mr. Mehul Pandya | Cell: +91-98242 56265 | Tel: +91-79-40265656 | Fax: +91-79-40265657 |
E-mail:[email protected] | 32, Titanium, Prahaladnagar Corporate Road, Satellite, Ahmedabad - 380 015.
NEW DELHI | Ms. Swati Agrawal | Cell: +91-98117 45677 | Tel: +91- 11- 2331 8701/ 2371 6199 |
E-mail: [email protected] | 710 Surya Kiran,19 K.G. Road, New Delhi - 110 001.
BANGALORE | Mr. G. Sundara Vathanan | Cell: +91 98860 24430 | Tel:+91-80-2211 7140 |
E-mail: [email protected] | Unit No. 8, I floor, Commander's Place, No. 6, Raja Ram Mohan Roy Road,
(Opp. P F Office), Richmond Circle, Bangalore - 560 025.
HYDERABAD | Mr. Ashwini Kumar Jani | Cell: +91-91766 47599 | Tel: +91-40-40102030 |
E-mail: [email protected] | 401, Ashoka Scintilla | 3-6-520, Himayat Nagar | Hyderabad - 500 029
ABOUT US


