26
Funding Public Pensions Seventh Annual Employee Benefits Symposium John Marshall Law School April 20, 2009 by Jon Forman Alfred P. Murrah Professor of Law University of Oklahoma
| Date post: | 03-Jan-2016 |
| Category: |
Documents |
| Upload: | dale-lynch |
| View: | 215 times |
| Download: | 0 times |

Funding Public PensionsSeventh Annual Employee Benefits
SymposiumJohn Marshall Law School
April 20, 2009
by Jon FormanAlfred P. Murrah Professor of Law
University of Oklahoma

Overview Operation and funding of public plans Financial, accounting, and legal issues How to ensure adequate funding now
and in the future
2

Overview of Public Plans
State and local governments typically provide their employees with a traditional defined benefit pension plan A supplemental defined contribution plan
Employer and employee contributions
3

Funding Public Plans
Plan actuary Makes assumptions Estimates the plan’s future liabilities to
its retirees Discounts those liabilities to present
value And compares that liability value to the
actuarial value of the plan’s assets
4

Table 1. Actuarial Valuationfor OPERS, June 30, 2008
1. Participant Data
Number of
Active Members 45,120
Retired and Disabled Members & Beneficiaries
26,033
Inactive Members 5,580
Total Members 76,733
Projected Annual Salaries of Members $1,682,663,413
Annual Retirement Payments for Retired Members and Beneficiaries
$376,147,494
5

Table 1. Actuarial Valuation
for OPERS, 2008, cont.
2. Assets and Liabilities
Total Actuarial Accrued Liability $8,894,287,254
Market Value of Assets $6,255,207,565
Actuarial Value of Assets $6,491,928,362
Unfunded Actuarial Accrued Liability $2,402,358,892
Funded Ratio 73.0%
6
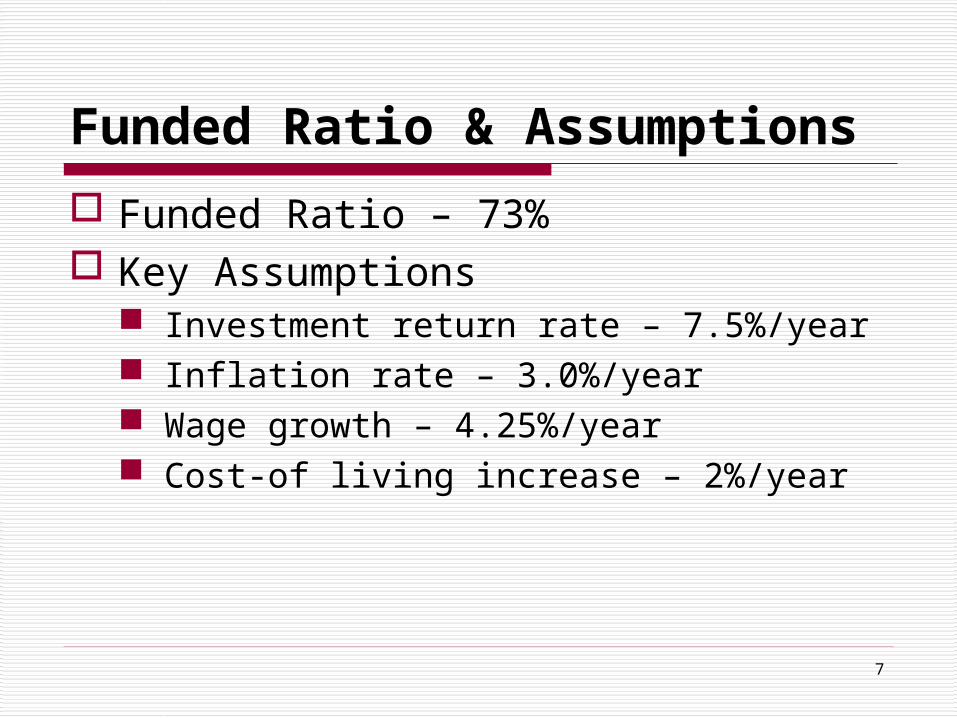
Funded Ratio & Assumptions
Funded Ratio – 73% Key Assumptions
Investment return rate – 7.5%/year Inflation rate – 3.0%/year Wage growth – 4.25%/year Cost-of living increase – 2%/year
7

Table 1. Actuarial Valuation
for OPERS, 2008, cont.
3. Employer Contribution Rates as a Percent of Payroll Normal Cost Rate 12.46% Amortization of Unfunded Actuarial Accrued Liability
10.13%
Budgeted Expenses 0.39% Actuarial Required Contribution Rate 22.98% Less Estimated Member Contribution Rate 4.04% Employer Actuarial Required Contribution Rate 18.94% Less Statutory State Employer Contribution Rate 14.50% Contribution Shortfall 4.44%
8

Method & Contribution Rate
Entry-age normal actuarial cost method
Contribution Rates as a % of Payroll Normal cost – 12.46% Amortization of UAAL –10.13% Actuarial Required Contribution (ARC) –
22.98% Contribution shortfall – 4.44%
9

Table 2. Asset Class Assumptions
Expected Return RiskU.S. Equity 8.50% 16.0%Non-U.S. Equity 8.50% 17.0%Private Equity 11.55% 26.0%Real Estate 7.00% 15.0%U.S. Bonds 4.00% 5.0%Non-U.S. Bonds 3.75% 10.0%
10

Table 3. Asset Allocation of the OPERS, June 30, 2008
Actual Allocation
Low Target High
U.S. Equity 38.6% 37.3% 40.0% 42.7%Non-U.S. Equity 37.8% 31.9% 36.0% 40.1%U.S. Bonds 23.2% 21.0% 24.0% 27.0%Non-U.S. Bonds 0.4% 0.0% 0.0% 0.0%
11

Figure 1. Average Asset Allocation for State Pensions
12

Table 4. Asset Allocation for 125 State Pension Plans (%)
2003 2008 ChangeEquity US Equity 42.3 38.1 -4.2 Non-US Equity 12.9 18.8 5.9 Real Estate 4.0 5.9 1.9 Private Equity 4.2 5.6 1.4 Equity Subtotal 63.4 68.4 5.0Debt US Bonds 35.2 26.7 -8.5 Non-US Bonds 1.4 0.9 -0.5 Other 0.0 4.0 4.0 Debt Subtotal 36.6 31.6 -5.0Return 7.3 7.5 0.2Risk 10.3 10.9 0.6 13

Table 5. Contributions Needed to Fully Fund Pensions, 2006
Simulation assumption for the rate of return on investment
Projected government contribution level needed to fully fund the liability
Difference between projected contribution level and the actual 9.0% of salaries
Higher return scenario: 6% real
5.0% of salaries per year
- 4.0% of salaries per year
Base case: 5% real 9.3% of salaries + 0.3% of salariesLower-return scenario: 4% real
13.9% of salaries + 4.9% of salaries
Risk-free scenario: 3% real
18.6% of salaries per year
+ 9.6% of salaries
14

Financial Pressures on Public Plans
Fiscal pressures on state and local governments
Demographic pressures Pension envy
15

16Standard & Poor’s, Ratings Direct: Market Declines Will Shake Up U.S. State Pension Fund Stability (February 26, 2009), at 3.

17National Association of State Retirement Administrators & National Council on Teacher Retirement, Market Declines and Public Pensions (NASRA/NCTR Issue Brief, December 2008), at 3.

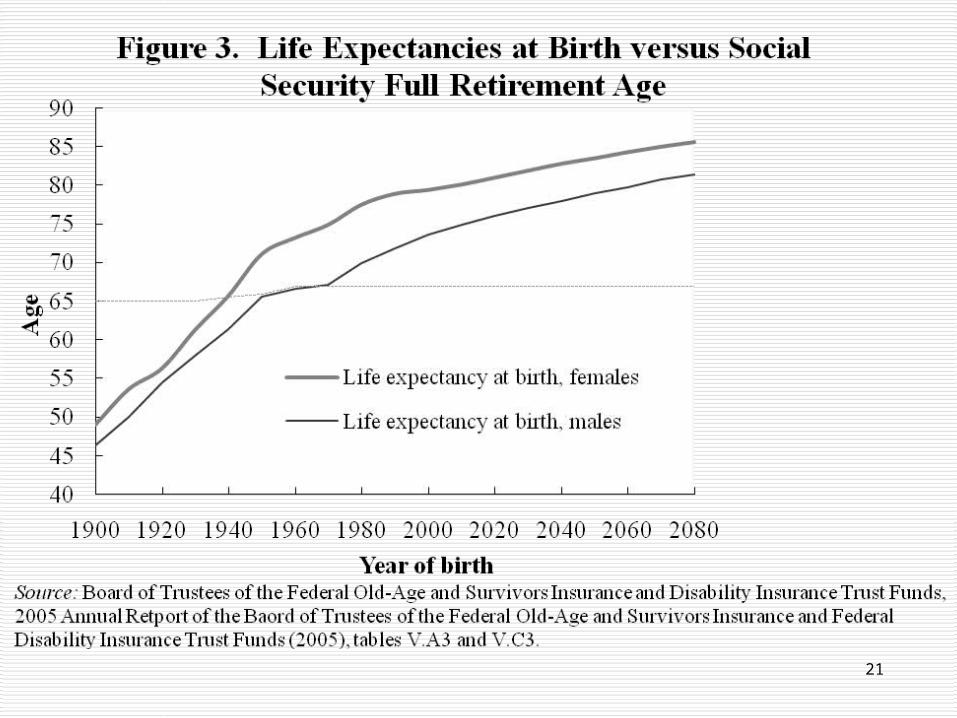
Table 6. Life Expectancy for Men and Women, 1940–2060
Year
Life expectancy at birth Life expectancy at age 65
Male Female Male FemaleActual 1940 61.4 65.7 11.9 13.4 1960 66.7 73.2 12.9 15.9 1980 69.9 77.5 14.0 18.4 2000 74.0 79.4 15.9 19.0 2007 75.2 79.9 16.7 19.2Projected 2020 76.9 80.9 17.6 19.8 2040 79.0 82.6 18.8 20.9 2060 80.8 84.2 19.8 21.9 2080 82.4 85.6 20.8 22.8
18

19

Table 7. Percentage of Workers Electing SS Retirement Benefits
Year Age 62Ages
63–64 Age 65Ages 66+
Average age
1965 23.0 17.7 23.4 35.9 65.91975 35.7 24.5 31.1 8.7 63.91985 57.2 21.1 17.7 4.0 63.61995 58.3 19.5 16.3 6.0 63.62004 57.5 19.0 18.6 4.8 63.7
20
21

Table 8. Public and Private Sector Compensation, 2008
Cost per hour BenefitsRetirement and Savings
State and local government
$39.18 $13.41 (34.2%) $3.09 (7.9%)
Private sector $27.07 $7.93 (29.3%) $0.79 (3.0%)
22

Table 9. Public and Private Sector Retirement Benefits
Public Sector Employees
Private Sector Employees
Defined benefit plan 90% 20%
Median pension in 2005 $17,640 $7,692
Retiree health benefit of any kind
82% 33%
23

Accounting for Public Pensions
Government Accounting Standards Board (GASB)
80 percent funding target Actuarial versus market valuation of
assets and liabilities
24

Public Plans Are in a Hole
Stop digging Stop promising benefits w/o funding
Climb out Make Actuarial Required Contributions Improve governance
Avoid future holes Restructure Public Pensions
At least for new workers
25

About the Author Jonathan Barry Forman (“Jon”) is the Alfred P.
Murrah Professor of Law at the University of Oklahoma College of Law, where he teaches courses on tax and pension law.
Professor Forman is also Vice Chair of the Board of Trustees of the Oklahoma Public Employees Retirement System (OPERS) and the author of Making America Work (Washington, DC: Urban Institute Press, 2006).
Prior to entering academia, Professor Forman served in all three branches of the federal government. He has a law degree from the University of Michigan and master’s degrees in economics and psychology.
Jon can be reached at [email protected], (405) 325-4779, or www.law.ou.edu/faculty/forman.shtml.
26


