137
Invesco Funds Unaudited Semi-Annual Report Société d’Investissement à Capital Variable For the six months ended 31 August 2011 (R.C.S. Luxembourg B34457)

Invesco Funds Unaudited Semi-Annual Report Société d’Investissement à Capital Variable For the six months ended 31 August 2011 (R.C.S. Luxembourg B34457)

Registered Office: 2-4 rue Eugène Ruppert, L-2453 Luxembourg No subscription can be accepted on the basis of financial reports alone. Subscriptions, in order to be valid, must be made on the basis of the current Prospectus supplemented by a copy of the latest available Audited Annual Report and a copy of the latest Semi-Annual Report, if later than such Audited Annual Report. Copies of the Prospectus, Audited Annual Report and Semi-Annual Report may be obtained at the Registered Office of the Company (Invesco Funds), 2-4 rue Eugène Ruppert, L-2453 Luxembourg, as well as from the offices of the Global Distributor in Dublin. Notices of all General Meetings will be published in the Luxemburger Wort and, to the extent required by law, in the Mémorial, Recueil des Sociétés et Associations (“Mémorial”) and will be sent to holders of registered Shares at their address in the Register of Shareholders by post at least 8 days prior to meetings. In the event of any discrepancy between translations from English text into foreign languages, please note that the English text will prevail. The notice required by Luxembourg law in respect of the issue and sale of Shares by the Fund has been deposited with the Greffe du Tribunal d’Arrondissement of Luxembourg. Equalisation is calculated for tax reporting purposes and is not disclosed in the Audited Annual Report.

3 Invesco Funds
Contents Page(s) Statement of Investments Equity Funds Global Invesco Global Structured Equity Fund 4 Invesco Emerging Market Quantitative Equity Fund 7 America Invesco US Structured Equity Fund 10 Invesco Latin American Equity Fund 12 Europe Invesco Pan European Structured Equity Fund 14 Invesco Pan European Equity Fund 17 Invesco Pan European Small Cap Equity Fund 19 Invesco European Growth Equity Fund 23 Invesco Pan European Equity Income Fund 25 Invesco Emerging Europe Equity Fund 28 Invesco Pan European Focus Equity Fund 30 Japan Invesco Nippon Small/Mid Cap Equity Fund 32 Invesco Nippon Select Equity Fund 34 Asia Invesco Asia Opportunities Equity Fund 36 Invesco Greater China Equity Fund 38 Invesco Asia Infrastructure Fund 40 Invesco India Equity Fund 43 Invesco Asia Consumer Demand Fund 45 Theme Funds Invesco Global Leisure Fund 48 Invesco Energy Fund 50 Invesco Asia Pacific Real Estate Securities Fund 52 Invesco Global Income Real Estate Securities Fund 54 Invesco Gold & Precious Metals Fund 57 Reserve Funds Invesco USD Reserve Fund 58 Invesco Euro Reserve Fund 59 Bond Funds Invesco Global Bond Fund 60 Invesco European Bond Fund 61 Invesco Absolute Return Bond Fund 63 Invesco Euro Inflation-Linked Bond Fund 65 Invesco Euro Corporate Bond Fund 66 Invesco UK Investment Grade Bond Fund 70 Invesco Emerging Local Currencies Debt Fund 72 Invesco Global Investment Grade Corporate Bond Fund 74 Invesco Global Unconstrained Bond Fund 77 Invesco Global Total Return (EUR) Bond Fund 78 Invesco Emerging Market Corporate Bond Fund 80 Invesco Euro Short Term Bond Fund 81 Mixed Funds Invesco Capital Shield 90 (EUR) Fund 83 Invesco Asia Balanced Fund 85 Invesco Pan European High Income Fund 89 Invesco Global Absolute Return Fund 94 Invesco Balanced-Risk Allocation Fund 95 Financial Statements Statement of Net Assets 96-103 Notes to the Financial Statements and Other Information 104-136 Board of Directors 137 Organisation 137

Invesco Global Structured Equity Fund
4 Invesco Funds
Statement of Investments as at 31 August 2011
Investment Nominal/Shares Market Value Net Assets USD %TRANSFERABLE SECURITIES ADMITTED TO AN OFFICIAL STOCK EXCHANGE LISTING OR DEALT IN ON ANOTHER REGULATED MARKET
EQUITIES AUSTRALIA Amcor Ltd 32,177 229,797 0.62Ansell Ltd 16,098 238,347 0.65Brambles Ltd 43,481 311,918 0.85Caltex Australia Ltd 11,338 130,922 0.36Campbell Brothers Ltd 2,683 132,611 0.36Coca-Cola Amatil Ltd 29,905 375,305 1.02Cochlear Ltd 1,104 89,160 0.24Iluka Resources Ltd 39,788 694,783 1.89Metcash Ltd 28,167 121,837 0.33Origin Energy Ltd 19,462 293,967 0.80Ramsay Health Care Ltd 9,371 177,832 0.48TABCORP Holdings Ltd 17,530 52,452 0.14Telstra Corp Ltd 54,570 176,669 0.48Woolworths Ltd 12,754 343,183 0.93
3,368,783 9.15
BELGIUM Mobistar SA 3,165 207,004 0.56Solvay SA 3,446 424,449 1.15
631,453 1.71
BERMUDA Catlin Group Ltd 50,105 299,090 0.81
CANADA Alimentation Couche Tard Inc 6,000 174,237 0.47Barrick Gold Corp 10,800 548,462 1.49Baytex Energy Corp 2,100 106,795 0.29BCE Inc 16,800 666,571 1.81CGI Group Inc 9,100 180,831 0.49Enbridge Inc 19,698 638,448 1.73Fairfax Financial Holdings Ltd 191 76,592 0.21George Weston Ltd 2,100 143,983 0.39IGM Financial Inc 3,000 133,632 0.36Intact Financial Corp 4,900 274,113 0.74Loblaw Cos Ltd 3,000 110,368 0.30Metro Inc 4,900 231,740 0.63National Bank of Canada 8,300 606,127 1.64Saputo Inc 5,700 232,497 0.63TELUS Corp 8,400 458,337 1.24TELUS Corp (Non-voting) 4,700 244,102 0.66Tim Hortons Inc 8,900 425,728 1.16Valeant Pharmaceuticals International Inc 7,700 340,160 0.92Vermilion Energy Inc 1,900 85,273 0.23
5,677,996 15.39
DENMARK Coloplast A/S 1,512 227,698 0.62Novo Nordisk A/S 5,682 603,019 1.64
830,717 2.26
FINLAND Kesko OYJ 2,925 113,357 0.31Orion OYJ 9,695 219,249 0.60
332,606 0.91
GERMANY Suedzucker AG 11,416 396,606 1.08

Invesco Global Structured Equity Fund
5 Invesco Funds
Statement of Investments as at 31 August 2011
Investment Nominal/Shares Market Value Net Assets USD %HONG KONG CLP Holdings Ltd 42,000 388,742 1.06Power Assets Holdings Ltd 50,000 386,939 1.05SJM Holdings Ltd 295,000 676,652 1.84
1,452,333 3.95
ITALY Terna Rete Elettrica Nazionale SpA 156,685 569,112 1.54
JAPAN Ajinomoto Co Inc 36,000 423,833 1.15Benesse Holdings Inc 6,500 275,941 0.75Brother Industries Ltd 10,700 140,008 0.38Central Japan Railway Co 12 99,615 0.27Dainippon Screen Manufacturing Co Ltd 19,000 124,245 0.34Daito Trust Construction Co Ltd 5,100 468,962 1.27Hisamitsu Pharmaceutical Co Inc 3,900 165,692 0.45Kao Corp 23,200 613,196 1.66Lawson Inc 5,600 304,066 0.83Miraca Holdings Inc 5,700 240,677 0.65Nippon Telegraph & Telephone Corp 12,700 590,119 1.60Nomura Research Institute Ltd 8,400 189,347 0.51Osaka Gas Co Ltd 162,000 654,428 1.78Sega Sammy Holdings Inc 16,400 377,169 1.02Shionogi & Co Ltd 13,700 219,676 0.60Takeda Pharmaceutical Co Ltd 13,200 636,181 1.73TonenGeneral Sekiyu KK 30,000 342,622 0.93Tosoh Corp 80,000 304,379 0.83Toyo Suisan Kaisha Ltd 8,000 210,768 0.57Yamada Denki Co Ltd 3,510 256,097 0.70Yamato Holdings Co Ltd 24,300 420,885 1.14
7,057,906 19.16
NEW ZEALAND Telecom Corp of New Zealand Ltd 311,199 672,756 1.83
PORTUGAL Jeronimo Martins SGPS SA 17,455 325,064 0.88
SPAIN Ebro Foods SA 14,969 291,139 0.79
SWEDEN Swedish Match AB 16,547 592,771 1.61
SWITZERLAND Allied World Assurance Co Holdings AG 2,190 117,066 0.32Swisscom AG 1,006 447,778 1.22
564,844 1.54
UNITED KINGDOM AstraZeneca Plc 13,886 652,678 1.77BT Group Plc 166,727 455,331 1.24De La Rue Plc 16,064 211,244 0.57Provident Financial Plc 6,083 109,909 0.30Reckitt Benckiser Group Plc 11,514 606,018 1.64Royal Dutch Shell Plc 15,572 513,647 1.39Stagecoach Group Plc 103,123 432,939 1.17
2,981,766 8.08
UNITED STATES Activision Blizzard Inc 11,400 134,463 0.36Amgen Inc 12,000 662,880 1.80Apollo Group Inc 5,700 268,100 0.73Biogen Idec Inc 6,500 608,595 1.65

Invesco Global Structured Equity Fund
6 Invesco Funds
Statement of Investments as at 31 August 2011
Investment Nominal/Shares Market Value Net Assets USD %UNITED STATES (CONTINUED) Cardinal Health Inc 14,700 620,193 1.68Chevron Corp 6,500 639,665 1.74Coca-Cola Enterprises Inc 24,100 656,845 1.78Domtar Corp 4,500 361,327 0.98Eli Lilly & Co 18,300 680,119 1.85Forest Laboratories Inc 17,700 604,367 1.64Hershey Co 3,300 191,911 0.52Hormel Foods Corp 19,200 527,808 1.43Humana Inc 8,500 652,673 1.77InterActiveCorp 18,200 714,623 1.94Magellan Health Services Inc 3,400 167,399 0.45Motorola Solutions Inc 15,800 661,309 1.79Pfizer Inc 34,300 647,413 1.76Sprint Nextel Corp 79,400 283,061 0.77Verizon Communications Inc 17,200 624,274 1.69
9,707,025 26.33
TOTAL EQUITIES 35,751,967 97.02
TOTAL TRANSFERABLE SECURITIES ADMITTED TO AN OFFICIAL STOCK EXCHANGE LISTING OR DEALT IN ON ANOTHER REGULATED MARKET 35,751,967 97.02
Total Investments 35,751,967 97.02
The accompanying notes form an integral part of these financial statements.

Invesco Emerging Market Quantitative Equity Fund
7 Invesco Funds
Statement of Investments as at 31 August 2011
Investment Nominal/Shares Market Value Net Assets USD %TRANSFERABLE SECURITIES ADMITTED TO AN OFFICIAL STOCK EXCHANGE LISTING OR DEALT IN ON ANOTHER REGULATED MARKET
EQUITIES BRAZIL Banco do Brasil SA 11,900 195,527 0.80Banco do Estado do Rio Grande do Sul 4,700 48,702 0.20Bradespar SA 7,000 152,096 0.62Braskem SA 3,200 35,849 0.15Cia de Bebidas das Americas ADR 1,400 48,587 0.20Cia Siderurgica Nacional SA 2,600 25,213 0.10Cosan SA Industria e Comercio 30,500 445,278 1.82CPFL Energia SA 34,300 436,211 1.78Itausa - Investimentos Itau SA 47,800 280,487 1.14Klabin SA 14,200 47,162 0.19Localiza Rent a Car SA 26,200 435,089 1.77Lojas Renner SA 2,400 87,125 0.36Natura Cosmeticos SA 1,200 28,569 0.12Petroleo Brasileiro SA 13,000 167,529 0.68Porto Seguro SA 3,800 45,299 0.18Rossi Residencial SA 7,300 54,627 0.22Souza Cruz SA 39,200 468,775 1.91Sul America SA 4,500 48,450 0.20Suzano Papel e Celulose SA 58,500 332,449 1.36Telecomunicacoes de Sao Paulo SA ADR 1,860 58,227 0.24Vale SA 7,700 193,580 0.79
3,634,831 14.83
CAYMAN ISLANDS Agile Property Holdings Ltd 30,000 40,487 0.17Greentown China Holdings Ltd 47,500 35,586 0.15
76,073 0.32
CHILE AES Gener SA 112,334 66,972 0.27Enersis SA 666,849 266,517 1.09ENTEL Chile SA 2,298 47,336 0.19Sociedad Quimica y Minera de Chile SA 425 26,624 0.11
407,449 1.66
CHINA Anhui Conch Cement Co Ltd 16,000 66,965 0.27Bank of China Ltd 1,196,000 494,808 2.02BBMG Corp 33,500 37,711 0.15China Construction Bank Corp 786,000 581,800 2.37China Petroleum & Chemical Corp 584,000 576,122 2.35Dongfeng Motor Group Co Ltd 38,000 60,497 0.25Great Wall Motor Co Ltd 24,500 35,233 0.14Guangzhou R&F Properties Co Ltd 22,000 26,445 0.11Industrial & Commercial Bank of China 1,051,000 690,317 2.82Jiangxi Copper Co Ltd 16,000 45,669 0.19PetroChina Co Ltd 32,000 41,072 0.17
2,656,639 10.84
COLOMBIA Cementos Argos SA 8,610 53,867 0.22
HONG KONG China Mobile Ltd 74,000 750,666 3.06CNOOC Ltd 348,000 710,719 2.90
1,461,385 5.96
INDONESIA Bank Mandiri Tbk PT 84,500 67,586 0.28Bank Negara Indonesia Persero Tbk PT 130,500 62,512 0.25Indo Tambangraya Megah PT 87,500 443,242 1.81

Invesco Emerging Market Quantitative Equity Fund
8 Invesco Funds
Statement of Investments as at 31 August 2011
Investment Nominal/Shares Market Value Net Assets USD %
INDONESIA (CONTINUED) Semen Gresik Persero Tbk PT 24,000 25,524 0.10
598,864 2.44
MALAYSIA Alliance Financial Group Bhd 38,000 43,248 0.18DiGi.Com Bhd 4,700 47,630 0.19Kuala Lumpur Kepong Bhd 14,300 102,108 0.42Malayan Banking Bhd 18,800 54,893 0.22Petronas Chemicals Group Bhd 21,000 43,753 0.18Public Bank Bhd 14,600 63,823 0.26RHB Capital Bhd 11,100 30,792 0.13Sime Darby Bhd 28,300 83,438 0.34UMW Holdings Bhd 16,800 40,775 0.17
510,460 2.09
MEXICO Alfa SAB de CV 34,800 429,960 1.75America Movil SAB de CV ADR 28,100 681,285 2.78Industrias Penoles SAB de CV 2,045 96,787 0.39Kimberly-Clark de Mexico SAB de CV 5,300 32,357 0.13
1,240,389 5.05
PHILIPPINES Metropolitan Bank & Trust 28,000 48,253 0.20
POLAND Powszechna Kasa Oszczednosci Bank Polski SA 38,656 482,462 1.97Powszechny Zaklad Ubezpieczen SA 309 37,857 0.15
520,319 2.12
RUSSIA Lukoil OAO ADR 746 44,741 0.18Mechel ADR 1,500 26,828 0.11MMC Norilsk Nickel ADR 4,503 109,378 0.45Rosneft Oil Co GDR 69,682 535,158 2.18Sberbank of Russia 38,120 92,476 0.38Severstal OAO GDR 1,679 25,739 0.10Tatneft ADR 13,276 428,616 1.75
1,262,936 5.15
SOUTH AFRICA African Rainbow Minerals Ltd 2,216 58,163 0.24ArcelorMittal South Africa Ltd 6,838 58,645 0.24Exxaro Resources Ltd 16,155 420,247 1.71Imperial Holdings Ltd 12,199 200,952 0.82Kumba Iron Ore Ltd 5,504 371,276 1.51Liberty Holdings Ltd 42,639 464,870 1.90Woolworths Holdings Ltd 103,383 535,958 2.19
2,110,111 8.61
SOUTH KOREA BS Financial Group Inc 2,700 33,597 0.14Daewoo Shipbuilding & Marine Engineering Co Ltd 1,430 38,838 0.16Dongbu Insurance Co Ltd 1,610 77,795 0.32Dongkuk Steel Mill Co Ltd 1,680 47,990 0.20GS Holdings 813 54,982 0.22Hana Financial Group Inc 2,120 71,488 0.29Hankook Tire Co Ltd 1,450 54,128 0.22Hyundai Motor Co 3,292 627,173 2.56Industrial Bank of Korea 1,650 24,707 0.10Kia Motors Corp 8,495 562,564 2.30Korea Kumho Petrochemical 2,347 400,938 1.64KT Corp 2,220 76,525 0.31LG Corp 892 52,382 0.21POSCO 144 54,564 0.22

Invesco Emerging Market Quantitative Equity Fund
9 Invesco Funds
Statement of Investments as at 31 August 2011
Investment Nominal/Shares Market Value Net Assets USD %SOUTH KOREA (CONTINUED) Samsung Electronics Co Ltd 1,155 804,933 3.28Samsung Engineering Co Ltd 2,303 520,784 2.12SK Innovation Co Ltd 272 43,024 0.18
3,546,412 14.47
TAIWAN Advanced Semiconductor Engineering Inc 229,439 205,439 0.84Asustek Computer Inc 26,840 226,909 0.93Catcher Technology Co Ltd 8,000 62,669 0.26Chinatrust Financial Holding Co Ltd 40,000 32,610 0.13E.Sun Financial Holding Co Ltd 42,276 24,665 0.10Farglory Land Development Co Ltd 164,000 301,039 1.23Formosa Plastics Corp 28,000 86,916 0.35HTC Corp 3,360 87,505 0.36Mega Financial Holding Co Ltd 51,000 45,050 0.18Nan Ya Plastics Corp 17,000 40,464 0.16Powertech Technology Inc 135,300 325,313 1.33Taishin Financial Holding Co Ltd 114,019 51,390 0.21Taiwan Semiconductor Manufacturing Co Ltd ADR 66,600 796,869 3.25Tripod Technology Corp 660 2,222 0.01TSRC Corp 20,900 52,701 0.21United Microelectronics Corp 262,000 101,830 0.42
2,443,591 9.97
THAILAND Bangkok Bank PCL 11,200 60,914 0.25Banpu PCL 7,750 164,206 0.67Krung Thai Bank PCL 80,300 51,042 0.21
276,162 1.13
TURKEY KOC Holding AS 23,695 83,755 0.34Turk Telekomunikasyon AS 17,876 81,240 0.33Turkiye Halk Bankasi AS 5,257 32,953 0.13Turkiye Is Bankasi 13,448 34,461 0.14
232,409 0.94
TOTAL EQUITIES 21,080,150 86.00
TOTAL TRANSFERABLE SECURITIES ADMITTED TO AN OFFICIAL STOCK EXCHANGE LISTING OR DEALT IN ON ANOTHER REGULATED MARKET 21,080,150 86.00
OPEN-ENDED FUNDS FRANCE Lyxor ETF MSCI India 112,600 1,619,039 6.61
TOTAL OPEN-ENDED FUNDS 1,619,039 6.61
Total Investments 22,699,189 92.61
The accompanying notes form an integral part of these financial statements.

Invesco US Structured Equity Fund
10 Invesco Funds
Statement of Investments as at 31 August 2011
Investment Nominal/Shares Market Value Net Assets USD %TRANSFERABLE SECURITIES ADMITTED TO AN OFFICIAL STOCK EXCHANGE LISTING OR DEALT IN ON ANOTHER REGULATED MARKET
EQUITIES BASIC MATERIALS Freeport-McMoRan Copper & Gold Inc 29,000 1,350,675 1.87International Paper Co 42,700 1,148,416 1.59LyondellBasell Industries NV 16,300 555,097 0.77
3,054,188 4.23
COMMUNICATIONS AT&T Inc 29,400 870,828 1.21CBS Corp 45,200 1,132,034 1.57Cisco Systems Inc 82,000 1,282,070 1.78DISH Network Corp 11,000 256,685 0.36Gannett Co Inc 9,600 111,408 0.15InterActiveCorp 19,100 749,961 1.04Interpublic Group of Cos Inc 17,100 148,000 0.20News Corp 46,000 787,750 1.09QUALCOMM Inc 8,600 440,621 0.61Sprint Nextel Corp 249,800 890,537 1.23Symantec Corp 28,000 474,740 0.66Time Warner Cable Inc 1,900 124,431 0.17Verizon Communications Inc 47,600 1,727,642 2.40
8,996,707 12.47
CONSUMER, CYCLICAL CROCS Inc 10,900 308,088 0.43Harman International Industries Inc 6,100 220,484 0.31Las Vegas Sands Corp 11,600 545,026 0.76Ltd Brands Inc 38,300 1,467,847 2.04Macy's Inc 42,800 1,122,858 1.56Walgreen Co 32,600 1,156,811 1.60Wynn Resorts Ltd 7,450 1,143,165 1.59
5,964,279 8.29
CONSUMER, NON-CYCLICAL Amgen Inc 26,800 1,480,432 2.05Apollo Group Inc 18,800 884,258 1.23Baxter International Inc 700 38,812 0.05Biogen Idec Inc 4,200 393,246 0.54Cardinal Health Inc 11,800 497,842 0.69Coca-Cola Co 12,900 900,872 1.25Coca-Cola Enterprises Inc 4,500 122,648 0.17Forest Laboratories Inc 31,000 1,058,495 1.47Green Mountain Coffee Roasters Inc 5,400 555,579 0.77Hologic Inc 14,100 235,118 0.33Humana Inc 13,000 998,205 1.38Johnson & Johnson 14,600 959,585 1.33Kroger Co 20,400 470,730 0.65Lorillard Inc 900 100,013 0.14Moody's Corp 19,300 592,606 0.82Pfizer Inc 105,000 1,981,875 2.75Philip Morris International Inc 25,600 1,795,328 2.49Procter & Gamble Co 6,600 419,166 0.58Safeway Inc 30,800 556,402 0.77Tyson Foods Inc 26,100 453,748 0.63UnitedHealth Group Inc 28,700 1,356,793 1.88
15,851,753 21.97
ENERGY Chevron Corp 24,700 2,430,727 3.37ConocoPhillips 26,600 1,804,411 2.50Exxon Mobil Corp 43,800 3,235,725 4.49National Oilwell Varco Inc 6,100 408,791 0.57Occidental Petroleum Corp 12,500 1,076,000 1.49

Invesco US Structured Equity Fund
11 Invesco Funds
Statement of Investments as at 31 August 2011
Investment Nominal/Shares Market Value Net Assets USD %ENERGY (CONTINUED) Valero Energy Corp 47,100 1,036,436 1.44
9,992,090 13.86
FINANCIAL Berkshire Hathaway Inc 10,600 766,009 1.06Boston Properties Inc 2,300 237,958 0.33Capital One Financial Corp 24,100 1,093,296 1.52Citigroup Inc 54,000 1,669,950 2.32Discover Financial Services 49,300 1,229,049 1.70General Growth Properties Inc 8,400 113,946 0.16JPMorgan Chase & Co 45,400 1,682,751 2.33NASDAQ OMX Group Inc 8,000 187,320 0.26Prudential Financial Inc 13,900 685,965 0.95Public Storage 3,000 370,035 0.51Simon Property Group Inc 1,800 209,367 0.29State Street Corp 3,300 115,813 0.16Wells Fargo & Co 41,200 1,045,862 1.45
9,407,321 13.04
INDUSTRIAL Agilent Technologies Inc 16,500 604,312 0.84Caterpillar Inc 3,700 332,260 0.46Flextronics International Ltd 8,200 47,273 0.07General Electric Co 91,300 1,470,386 2.04Huntington Ingalls Industries Inc 2,800 85,708 0.12KBR Inc 16,800 512,820 0.71United Technologies Corp 7,100 523,696 0.73
3,576,455 4.97
TECHNOLOGY Accenture Plc 19,300 1,042,490 1.45Activision Blizzard Inc 48,800 575,596 0.80Apple Inc 3,020 1,177,604 1.63BMC Software Inc 5,300 214,412 0.30CA Inc 13,500 280,598 0.39Dell Inc 84,300 1,252,277 1.74International Business Machines Corp 8,300 1,431,418 1.98KLA-Tencor Corp 14,000 512,750 0.71Lexmark International Inc 13,300 419,149 0.58LSI Corp 18,200 124,215 0.17Microsoft Corp 90,600 2,375,985 3.30SanDisk Corp 14,200 526,465 0.73Seagate Technology Plc 21,100 244,655 0.34
10,177,614 14.12
UTILITIES Edison International 1,100 40,590 0.06Exelon Corp 25,200 1,078,938 1.50
1,119,528 1.56
TOTAL EQUITIES 68,139,935 94.51
TOTAL TRANSFERABLE SECURITIES ADMITTED TO AN OFFICIAL STOCK EXCHANGE LISTING OR DEALT IN ON ANOTHER REGULATED MARKET 68,139,935 94.51
Total Investments 68,139,935 94.51
The accompanying notes form an integral part of these financial statements

Invesco Latin American Equity Fund
12 Invesco Funds
Statement of Investments as at 31 August 2011
Investment Nominal/Shares Market Value Net Assets USD %TRANSFERABLE SECURITIES ADMITTED TO AN OFFICIAL STOCK EXCHANGE LISTING OR DEALT IN ON ANOTHER REGULATED MARKET
EQUITIES ARGENTINA Telecom Argentina SA ADR 3,550 82,200 1.19
BERMUDA Credicorp Ltd 1,165 114,502 1.65
BRAZIL Aliansce Shopping Centers SA 10,000 78,030 1.13Alpargatas SA 8,100 53,500 0.77Banco do Estado do Rio Grande do Sul 6,600 68,390 0.99BM&FBovespa SA 21,400 121,681 1.76BR Properties SA 7,400 79,349 1.15BRF - Brasil Foods SA 8,600 163,449 2.36Cia de Bebidas das Americas 4,700 159,417 2.30Cia de Transmissao de Energia Electrica Paulista 2,900 83,548 1.21Cia Energetica de Minas Gerais 5,000 90,042 1.30Cia Hering 7,600 163,202 2.36EcoRodovias Infraestrutura e Logistica SA 14,200 118,195 1.71EDP - Energias do Brasil SA 4,500 104,409 1.50Estacio Participacoes SA 6,400 69,590 1.00Even Construtora e Incorporadora SA 18,200 77,343 1.12Fibria Celulose SA 9,950 95,334 1.38Iguatemi Empresa de Shopping Centers SA 3,800 80,373 1.16Itau Unibanco Holding SA ADR 23,825 424,443 6.13JSL SA 18,000 108,107 1.56Localiza Rent a Car SA 4,300 71,408 1.03Multiplus SA 5,100 85,237 1.23Odontoprev SA 8,400 143,472 2.07OGX Petroleo e Gas Participacoes SA 20,000 142,072 2.05Parana Banco SA 10,400 70,388 1.02PDG Realty SA Empreendimentos e Participacoes 20,800 98,569 1.42Petroleo Brasileiro SA ADR 7,150 188,010 2.71Petroleo Brasileiro SA ADR 3,250 93,551 1.35QGEP Participacoes SA 9,100 88,331 1.28Souza Cruz SA 13,700 163,832 2.37Telecomunicacoes de Sao Paulo SA ADR 5,238 163,976 2.37Totvs SA 5,550 94,011 1.36TPI - Triunfo Participacoes e Investimentos SA 16,800 97,949 1.41Ultrapar Participacoes SA 8,100 139,060 2.01Vale SA ADR 17,500 487,112 7.03
4,265,380 61.60
CANADA C&C Energia Ltd 4,500 37,284 0.54Guyana Goldfields Inc 5,000 48,901 0.71Yamana Gold Inc 7,000 111,567 1.61
197,752 2.86
CHILE Cia Cervecerias Unidas SA 7,550 84,669 1.22
COLOMBIA Ecopetrol SA ADR 2,850 123,818 1.79
MEXICO America Movil SAB de CV ADR 8,250 200,021 2.89Arca Continental SAB de CV 22,849 111,813 1.61Bolsa Mexicana de Valores SAB de CV 36,300 58,844 0.85El Puerto de Liverpool SAB de CV 9,300 72,769 1.05Genomma Lab Internacional SAB de CV 45,000 91,522 1.32Industrias CH SAB de CV 24,400 75,939 1.10

Invesco Latin American Equity Fund
13 Invesco Funds
Statement of Investments as at 31 August 2011
Investment Nominal/Shares Market Value Net Assets USD %MEXICO (CONTINUED) Kimberly-Clark de Mexico SAB de CV 18,800 114,775 1.66Mexichem SAB de CV 26,500 101,134 1.46OHL Mexico SAB de CV 42,200 82,495 1.19Sare Holding SAB de CV 210,614 30,639 0.44
939,951 13.57
PANAMA Copa Holdings SA 1,550 102,796 1.48
UNITED KINGDOM Antofagasta Plc 8,250 176,134 2.54
UNITED STATES Gran Tierra Energy Inc 14,775 94,450 1.36
TOTAL EQUITIES 6,181,652 89.26
TOTAL TRANSFERABLE SECURITIES ADMITTED TO AN OFFICIAL STOCK EXCHANGE LISTING OR DEALT IN ON ANOTHER REGULATED MARKET 6,181,652 89.26
OPEN-ENDED FUNDS UNITED KINGDOM Invesco Perpetual American Investment Series - Latin American Fund 229,885 608,984 8.80
TOTAL OPEN-ENDED FUNDS 608,984 8.80
Total Investments 6,790,636 98.06
The accompanying notes form an integral part of these financial statements.

Invesco Pan European Structured Equity Fund
14 Invesco Funds
Statement of Investments as at 31 August 2011
Investment Nominal/Shares Market Value Net Assets EUR %TRANSFERABLE SECURITIES ADMITTED TO AN OFFICIAL STOCK EXCHANGE LISTING OR DEALT IN ON ANOTHER REGULATED MARKET
EQUITIES AUSTRIA Andritz AG 35,661 2,265,543 0.35Telekom Austria AG 244,604 1,869,875 0.29
4,135,418 0.64
BELGIUM Belgacom SA 191,492 4,377,028 0.68Colruyt SA 67,487 2,432,400 0.38Delhaize Group SA 111,767 5,131,782 0.80Mobistar SA 67,449 3,055,777 0.47Solvay SA 95,077 8,111,970 1.26
23,108,957 3.59
BERMUDA Lancashire Holdings Ltd 311,470 2,347,921 0.36
DENMARK AP Moller - Maersk A/S 952 4,497,464 0.70Christian Hansen Holding A/S 170,302 2,677,627 0.42Coloplast A/S 36,992 3,858,838 0.60Novo Nordisk A/S 145,896 10,725,408 1.66TDC A/S 727,421 4,409,364 0.68
26,168,701 4.06
FINLAND Fortum OYJ 458,629 8,541,965 1.33Kesko OYJ 92,156 2,473,928 0.38Nokian Renkaat OYJ 178,213 4,463,345 0.69Orion OYJ 113,008 1,770,270 0.27Sampo OYJ 418,039 8,289,713 1.29
25,539,221 3.96
FRANCE Arkema SA 188,144 9,889,789 1.54Cie Generale d'Optique Essilor International SA 90,622 4,771,248 0.74France Telecom SA 253,776 3,358,091 0.52Metropole Television SA 88,873 1,308,877 0.20Sanofi-Aventis SA 231,016 11,546,180 1.79Societe BIC SA 35,910 2,386,399 0.37
33,260,584 5.16
GERMANY Axel Springer AG 58,449 1,752,886 0.27Bayer AG 210,217 9,308,934 1.45Fresenius Medical Care AG & Co KGaA 199,774 9,257,527 1.44Fresenius SE & Co KGaA 184,636 13,089,769 2.03Fuchs Petrolub AG 59,146 1,872,415 0.29Hannover Rueckversicherung AG 103,367 3,364,338 0.52Kabel Deutschland Holding AG 159,628 6,312,489 0.98Merck KGaA 132,114 8,138,222 1.26Metro AG 197,081 5,969,584 0.93SAP AG 292,129 10,927,085 1.70Software AG 82,156 2,468,377 0.38Suedzucker AG 241,649 5,815,283 0.90United Internet AG 120,737 1,510,118 0.23
79,787,027 12.38
GREECE OPAP SA 285,031 2,427,039 0.38Public Power Corp SA 194,181 1,140,813 0.18
3,567,852 0.56
IRELAND Paddy Power Plc 59,601 2,093,485 0.32

Invesco Pan European Structured Equity Fund
15 Invesco Funds
Statement of Investments as at 31 August 2011
Investment Nominal/Shares Market Value Net Assets EUR %ITALY Enel SpA 1,260,703 4,244,787 0.66Snam Rete Gas SpA 1,418,374 4,765,737 0.74Terna Rete Elettrica Nazionale SpA 3,173,189 7,983,744 1.24
16,994,268 2.64
NETHERLANDS Delta Lloyd NV 79,552 1,003,151 0.16Koninklijke Ahold NV 1,168,976 9,393,891 1.46Koninklijke KPN NV 1,245,519 12,208,577 1.90Nutreco NV 48,192 2,244,663 0.35
24,850,282 3.87
NORWAY DnB NOR ASA 784,429 6,481,599 1.01TGS Nopec Geophysical Co ASA 495,309 8,342,219 1.29
14,823,818 2.30
PORTUGAL EDP - Energias de Portugal SA 1,971,445 4,468,280 0.69Jeronimo Martins SGPS SA 338,838 4,371,010 0.68
8,839,290 1.37
SPAIN Amadeus IT Holding SA 466,166 6,459,895 1.00Ebro Foods SA 178,650 2,406,862 0.37Endesa SA 77,354 1,394,113 0.22Inditex SA 221,617 13,116,402 2.04Red Electrica Corp SA 175,391 6,030,381 0.94Viscofan SA 77,026 1,993,818 0.31
31,401,471 4.88
SWEDEN Boliden AB 473,172 4,444,683 0.69Getinge AB 195,902 3,442,266 0.53NCC AB 115,092 1,525,524 0.24Nordea Bank AB 1,383,065 8,732,711 1.36Svenska Handelsbanken AB 511,246 9,649,235 1.50Swedish Match AB 297,163 7,373,995 1.14Tele2 AB 778,930 11,262,794 1.75
46,431,208 7.21
SWITZERLAND Galenica AG 7,036 2,856,559 0.44GAM Holding AG 101,440 1,022,001 0.16Roche Holding AG (Gebusscheine) 21,723 2,604,918 0.40Schindler Holding AG 20,356 1,662,454 0.26Swisscom AG 39,299 12,116,779 1.88
20,262,711 3.14
UNITED KINGDOM Admiral Group Plc 180,045 2,752,002 0.43Aggreko Plc 201,196 4,343,998 0.67Associated British Foods Plc 360,121 4,314,210 0.67AstraZeneca Plc (SE Line) 403,330 13,132,161 2.04Babcock International Group Plc 246,050 1,731,260 0.27BG Group Plc 779,118 11,436,479 1.78BP Plc 273,538 1,224,847 0.19British American Tobacco Plc 407,846 12,440,311 1.93BT Group Plc 5,844,909 11,057,047 1.72Burberry Group Plc 252,074 3,796,100 0.59Cairn Energy Plc 1,739,538 6,382,335 0.99Centrica Plc 3,389,910 11,374,452 1.77Croda International Plc 172,200 3,461,539 0.54Experian Plc 1,129,093 8,893,424 1.38Fresnillo Plc 276,753 6,287,531 0.98GlaxoSmithKline Plc 814,149 11,920,842 1.85

Invesco Pan European Structured Equity Fund
16 Invesco Funds
Statement of Investments as at 31 August 2011
Investment Nominal/Shares Market Value Net Assets EUR %UNITED KINGDOM (CONTINUED) Imperial Tobacco Group Plc 510,182 11,605,175 1.80ITV Plc 1,079,289 743,279 0.12J Sainsbury Plc 1,593,262 5,342,412 0.83Kingfisher Plc 1,051,874 2,792,584 0.43Mondi Plc 140,518 868,246 0.13National Grid Plc 1,631,576 11,231,647 1.74Next Plc 449,962 11,798,689 1.83Persimmon Plc 192,270 966,354 0.15Petrofac Ltd 313,491 4,719,239 0.73Premier Oil Plc 223,508 818,660 0.13Prudential Plc 1,505,299 10,268,973 1.59Reckitt Benckiser Group Plc 323,001 11,776,157 1.83Royal Dutch Shell Plc 503,665 11,508,067 1.79Sage Group Plc 794,873 2,242,090 0.35Scottish & Southern Energy Plc 481,311 6,963,242 1.08Severn Trent Plc 264,457 4,346,533 0.67Shire Plc 578,431 12,684,582 1.97Stagecoach Group Plc 478,729 1,392,198 0.22Tate & Lyle Plc 672,748 4,393,993 0.68United Utilities Group Plc 457,097 3,061,543 0.48Whitbread Plc 216,638 3,670,565 0.57William Hill Plc 832,097 2,106,324 0.33
239,849,090 37.25
TOTAL EQUITIES 603,461,304 93.69
TOTAL TRANSFERABLE SECURITIES ADMITTED TO AN OFFICIAL STOCK EXCHANGE LISTING OR DEALT IN ON ANOTHER REGULATED MARKET 603,461,304 93.69
Total Investments 603,461,304 93.69
The accompanying notes form an integral part of these financial statements.

Invesco Pan European Equity Fund
17 Invesco Funds
Statement of Investments as at 31 August 2011
Investment Nominal/Shares Market Value Net Assets EUR %TRANSFERABLE SECURITIES ADMITTED TO AN OFFICIAL STOCK EXCHANGE LISTING OR DEALT IN ON ANOTHER REGULATED MARKET
EQUITIES BELGIUM Solvay SA 34,900 2,977,668 0.47
FINLAND Stora Enso OYJ 1,934,523 9,899,921 1.58UPM-Kymmene OYJ 1,329,524 12,264,859 1.95
22,164,780 3.53
FRANCE BNP Paribas SA 328,599 11,593,794 1.85Cie Generale des Etablissements Michelin 253,418 12,665,832 2.02Safran SA 640,077 16,976,442 2.70Societe Generale SA 311,017 7,038,315 1.12
48,274,383 7.69
GERMANY Bilfinger Berger SE 200,147 11,527,466 1.83Commerzbank AG 2,071,400 4,238,084 0.67Daimler AG 351,061 12,803,195 2.04Deutsche Boerse AG 320,564 12,835,383 2.04Deutsche Post AG 774,684 8,149,676 1.30Henkel AG & Co KGaA 183,897 7,489,665 1.19ThyssenKrupp AG 373,948 8,618,567 1.37
65,662,036 10.44
IRELAND C&C Group Plc 2,063,400 6,247,975 0.99Kingspan Group Plc 768,893 4,681,021 0.75
10,928,996 1.74
ITALY Autogrill SpA 623,000 5,350,013 0.85
NETHERLANDS ASM International NV 346,711 6,387,283 1.02ASML Holding NV 482,086 11,787,003 1.88European Aeronautic Defence and Space Co NV 680,891 14,680,010 2.34ING Groep NV 2,729,704 16,114,808 2.56Koninklijke Ahold NV 1,441,117 11,580,816 1.84Reed Elsevier NV 1,521,723 12,327,478 1.96SBM Offshore NV 931,887 13,349,281 2.12Unilever NV 544,982 12,651,757 2.01
98,878,436 15.73
NORWAY Orkla ASA 1,352,050 7,747,670 1.23Storebrand ASA 2,450,307 11,151,392 1.77
18,899,062 3.00
PORTUGAL Galp Energia SGPS SA 947,927 12,927,354 2.06
SPAIN Banco Bilbao Vizcaya Argentaria SA 1,547,811 9,515,168 1.51Banco Santander SA 1,383,570 8,627,943 1.37International Consolidated Airlines Group SA 4,157,246 8,083,765 1.29Mediaset Espana Comunicacion SA 865,391 4,391,859 0.70Obrascon Huarte Lain SA 817,012 15,633,525 2.49Telefonica SA 755,743 10,846,801 1.73
57,099,061 9.09
SWEDEN Telefonaktiebolaget LM Ericsson 1,303,564 10,049,530 1.60

Invesco Pan European Equity Fund
18 Invesco Funds
Statement of Investments as at 31 August 2011
Investment Nominal/Shares Market Value Net Assets EUR %SWITZERLAND Novartis AG 719,777 28,815,899 4.59Roche Holding AG (Gebusscheine) 244,963 29,374,789 4.68UBS AG 1,550,668 15,443,757 2.46
73,634,445 11.73
UNITED KINGDOM AstraZeneca Plc 317,223 10,328,255 1.64Aviva Plc 1,292,594 4,882,484 0.78BAE Systems Plc 3,656,682 11,236,282 1.79Balfour Beatty Plc 1,381,453 3,860,028 0.61BG Group Plc 605,412 8,886,692 1.41BP Plc 3,030,734 13,571,004 2.16British American Tobacco Plc 411,816 12,561,406 2.00BT Group Plc 7,391,957 13,983,660 2.23Centrica Plc 1,433,261 4,809,142 0.77Cobham Plc 1,648,790 3,510,594 0.56G4S Plc 4,685,697 13,781,730 2.19GKN Plc 2,708,563 6,193,285 0.99GlaxoSmithKline Plc 861,147 12,608,991 2.01Imperial Tobacco Group Plc 586,758 13,347,060 2.12Legal & General Group Plc 5,360,007 6,339,604 1.01N Brown Group Plc 1,660,466 4,903,746 0.78Provident Financial Plc 308,174 3,857,018 0.61Rentokil Initial Plc 9,958,941 8,970,495 1.43Resolution Ltd 2,944,296 8,625,450 1.37Rolls-Royce Holdings Plc 587,875 4,167,913 0.66RSA Insurance Group Plc 4,047,250 5,227,498 0.83Smith & Nephew Plc 846,990 5,926,160 0.94TalkTalk Telecom Group Plc 2,858,449 4,120,877 0.66Vodafone Group Plc 5,384,399 9,819,931 1.56Yell Group Plc 4,512,653 250,962 0.04
195,770,267 31.15
TOTAL EQUITIES 622,616,031 99.08
TOTAL TRANSFERABLE SECURITIES ADMITTED TO AN OFFICIAL STOCK EXCHANGE LISTING OR DEALT IN ON ANOTHER REGULATED MARKET 622,616,031 99.08
OTHER TRANSFERABLE SECURITIES
BONDS UNITED KINGDOM Barclays Bank Plc NTS 28/02/2019 (LAKE ACQ-CVR) 1,102,320 404,128 0.07
TOTAL BONDS 404,128 0.07
TOTAL OTHER TRANSFERABLE SECURITIES 404,128 0.07
Total Investments 623,020,159 99.15
The accompanying notes form an integral part of these financial statements.

Invesco Pan European Small Cap Equity Fund
19 Invesco Funds
Statement of Investments as at 31 August 2011
Investment Nominal/Shares Market Value Net Assets EUR %TRANSFERABLE SECURITIES ADMITTED TO AN OFFICIAL STOCK EXCHANGE LISTING OR DEALT IN ON ANOTHER REGULATED MARKET
EQUITIES AUSTRIA Andritz AG 8,868 563,384 0.73Lenzing AG 1,613 134,927 0.17
698,311 0.90
BELGIUM D'ieteren SA 25,748 978,167 1.27
BERMUDA Archer Ltd 182,663 717,337 0.93Asia Offshore Drilling Ltd 184,515 620,344 0.80Dockwise Ltd 111,151 1,494,769 1.93Hiscox Ltd 45,285 178,461 0.23Omega Insurance Holdings Ltd 240,630 180,849 0.24Petra Diamonds Ltd 43,831 66,069 0.09
3,257,829 4.22
CANADA Questerre Energy Corp 470,148 292,542 0.38Wentworth Resources Ltd 1,623,676 645,613 0.84
938,155 1.22
CAYMAN ISLANDS Polarcus Ltd 1,503,492 736,831 0.95
CYPRUS ProSafe SE 148,120 740,750 0.96
DENMARK Trigon Agri A/S 496,634 498,041 0.65
FINLAND Kone OYJ 16,519 674,718 0.87Outotec OYJ 13,337 376,704 0.49
1,051,422 1.36
FRANCE 1855 8,960,223 1,030,426 1.34Bourbon SA 9,761 223,429 0.29Cie Generale de Geophysique - Veritas 26,731 458,036 0.59Etablissements Maurel et Prom 41,160 593,629 0.76Eurofins Scientific 13,585 783,787 1.02Ingenico 38,425 1,078,398 1.40
4,167,705 5.40
GERMANY Aareal Bank AG 17,123 255,090 0.33Asian Bamboo AG 67,550 1,006,833 1.30Bertrandt AG 11,276 418,086 0.54Bilfinger Berger SE 9,202 529,989 0.69Biotest AG 10,924 417,188 0.54Brenntag AG 7,779 549,781 0.71CompuGroup Medical AG 60,584 527,323 0.68Continental AG 6,591 331,099 0.43CTS Eventim AG 43,404 1,003,934 1.30Gerresheimer AG 23,153 759,592 0.98Hansa Group AG 140,791 621,100 0.80Kabel Deutschland Holding AG 34,522 1,365,172 1.77Kinghero AG 43,123 629,919 0.82KUKA AG 83,541 1,231,394 1.60Lanxess AG 8,238 352,998 0.46MTU Aero Engines Holding AG 21,463 1,003,020 1.30Nabaltec AG 107,924 1,002,344 1.30Nexus AG 40,000 287,000 0.37NORMA Group 43,028 539,141 0.70

Invesco Pan European Small Cap Equity Fund
20 Invesco Funds
Statement of Investments as at 31 August 2011
Investment Nominal/Shares Market Value Net Assets EUR %GERMANY (CONTINUED) Powerland AG 19,363 224,369 0.29Rheinmetall AG 30,960 1,401,327 1.82RIB Software AG 93,270 346,032 0.45Schuler AG 25,661 255,686 0.33STRATEC Biomedical AG 42,254 1,184,802 1.54Tom Tailor Holding AG 35,686 411,014 0.53Wirecard AG 162,064 1,934,233 2.50
18,588,466 24.08
GREECE Folli Follie Group 83,483 755,104 0.98
IRELAND DCC Plc 35,703 672,555 0.87TVC Holdings Plc 276,863 200,726 0.26
873,281 1.13
ITALY MARR SpA 1,041 8,700 0.01Salvatore Ferragamo Italia SpA 25,664 308,610 0.40
317,310 0.41
LUXEMBOURG AZ Electronic Materials SA 45,343 117,490 0.15GlobeOp Financial Services SA 59,757 233,319 0.30Northland Resources SA 199,277 261,547 0.34Pacific Drilling SA 44,758 266,229 0.34Prospector Offshore Drilling SA 542,825 575,574 0.75SAF-Holland SA 189,761 846,334 1.10Subsea 7 SA 91,600 1,445,051 1.87
3,745,544 4.85
NETHERLANDS Gemalto NV 20,982 684,433 0.89Koninklijke DSM NV 31,742 1,094,385 1.42LBi International NV 432,739 590,256 0.76Nutreco NV 20,225 942,030 1.22
3,311,104 4.29
NORWAY AGR Group ASA 700,000 837,274 1.08Badger Explorer ASA 358,787 895,410 1.16Copeinca ASA 60,707 345,790 0.45Det Norske Oljeselskap ASA 104,160 594,647 0.77Pronova BioPharma AS 715,702 647,362 0.84
3,320,483 4.30
PAPUA NEW GUINEA New Britain Palm Oil Ltd 16,785 161,888 0.21
PORTUGAL Zon Multimedia Servicos de Telecomunicacoes e Multimedia SGPS SA 151,852 389,652 0.50
SPAIN Amadeus IT Holding SA 63,668 882,279 1.14Grifols SA 114,494 1,630,967 2.12Grifols SA ADR ADR 91,728 431,432 0.56
2,944,678 3.82
SWEDEN Nordic Mines AB 2,329 15,391 0.02Svenska Cellulosa AB 60,836 568,471 0.74
583,862 0.76
SWITZERLAND Acino Holding AG 8,425 531,454 0.69Kuoni Reisen Holding AG 2,015 480,586 0.62Micronas Semiconductor Holding AG 91,189 520,805 0.67

Invesco Pan European Small Cap Equity Fund
21 Invesco Funds
Statement of Investments as at 31 August 2011
Investment Nominal/Shares Market Value Net Assets EUR %SWITZERLAND (CONTINUED) Partners Group Holding AG 6,567 768,941 1.00Schindler Holding AG 5,953 493,816 0.64Sika AG 363 567,137 0.74
3,362,739 4.36
UNITED KINGDOM Abbey Protection Plc 128,325 116,168 0.15Accsys Technologies Plc 6,718,462 624,817 0.81Advanced Computer Software Group Plc 149,108 64,757 0.08Advanced Medical Solutions Group Plc 233,821 200,459 0.26Afren Plc 65,379 76,406 0.10Alternative Networks Plc 82,395 262,571 0.34Amerisur Resources Plc 378,352 68,822 0.09Aveva Group Plc 10,475 181,912 0.24Avocet Mining Plc 49,461 147,925 0.19Axis-Shield Plc 39,084 208,980 0.27Babcock International Group Plc 145,045 1,020,567 1.32Beazley Plc 88,217 115,236 0.15Berendsen Plc 23,215 127,744 0.17Brewin Dolphin Holdings Plc 89,718 135,060 0.17Britvic Plc 52,302 185,317 0.24Brooks Macdonald Group Plc 5,741 67,190 0.09BTG Plc 133,682 384,389 0.50Carillion Plc 41,650 159,861 0.21Chemring Group Plc 97,137 617,457 0.80Clean Energy Brazil Plc 45,687 40 –Cranswick Plc 29,468 207,177 0.27Croda International Plc 33,074 664,848 0.86CSR Plc 42,684 107,735 0.14Dechra Pharmaceuticals Plc 84,995 427,619 0.55Devro Plc 54,376 149,881 0.19Dignity Plc 22,941 198,812 0.26Diploma Plc 96,633 342,553 0.45Domino Printing Sciences Plc 61,081 382,065 0.49Dunelm Group Plc 49,849 241,742 0.31E2V Technologies Plc 59,560 69,874 0.09Elementis Plc 140,883 242,914 0.31EMIS Group Plc 33,375 200,479 0.26Euromoney Institutional Investor Plc 30,567 197,922 0.26Faroe Petroleum Plc 39,598 70,688 0.09Fenner Plc 192,905 783,926 1.02Fidessa Group Plc 13,426 237,477 0.31Filtrona Plc 76,748 315,655 0.41FLEX LNG Ltd 1,975,093 1,444,268 1.88Go-Ahead Group Plc 7,520 129,747 0.17Gulfsands Petroleum Plc 36,615 63,401 0.08H&T Group Plc 63,211 257,412 0.33Hansard Global Plc 89,608 172,851 0.22Hansteen Holdings Plc 158,695 142,720 0.18Hargreaves Services Plc 20,304 207,624 0.27Hill & Smith Holdings Plc 38,476 118,110 0.15Homeserve Plc 115,984 591,116 0.77Howden Joinery Group Plc 225,290 247,531 0.32Hunting Plc 13,639 103,813 0.13Immunodiagnostic Systems Holdings Plc 11,739 139,705 0.18Impax Asset Management Group Plc 92,941 57,139 0.07IQE Plc 574,867 205,892 0.27James Halstead Plc 46,068 233,852 0.30JD Wetherspoon Plc 24,519 113,553 0.15Jupiter Fund Management Plc 83,440 174,883 0.23Latchways Plc 10,320 128,638 0.17LSL Property Services Plc 92,174 224,200 0.29Mam Funds Plc 212,746 53,997 0.07Marston's Plc 219,649 233,590 0.30

Invesco Pan European Small Cap Equity Fund
22 Invesco Funds
Statement of Investments as at 31 August 2011
Investment Nominal/Shares Market Value Net Assets EUR %UNITED KINGDOM (CONTINUED) May Gurney Integrated Services Plc 67,149 192,114 0.25Mears Group Plc 102,350 317,504 0.41Melrose Plc 106,280 371,117 0.48Micro Focus International Plc 61,154 207,989 0.27Microgen Plc 160,017 281,592 0.36Mitie Group Plc 83,037 208,462 0.27Morson Group Plc 89,898 85,184 0.11Mulberry Group Plc 1,478 25,868 0.03N Brown Group Plc 101,156 298,737 0.39NCC Group Plc 21,236 163,135 0.21Northgate Plc 57,579 178,391 0.23PayPoint Plc 58,869 325,894 0.43Phoenix IT Group Ltd 78,545 189,277 0.25Playtech Ltd 31,976 111,278 0.14Premier Oil Plc 93,208 341,399 0.45PZ Cussons Plc 24,107 96,212 0.12Renishaw Plc 8,628 130,225 0.17RM Plc 140,251 146,344 0.19Rotork Plc 13,658 262,611 0.34RPC Group Plc 99,305 353,986 0.46RPS Group Plc 54,158 121,239 0.16RSM Tenon Group Plc 238,098 73,861 0.10RWS Holdings Plc 76,807 372,453 0.48Salamander Energy Plc 80,784 208,684 0.27SDL Plc 28,164 204,204 0.26Senior Plc 165,276 289,261 0.37Serco Group Plc 87,603 504,479 0.65Spectris Plc 17,037 267,427 0.35Spirax-Sarco Engineering Plc 12,059 248,802 0.32Spirent Communications Plc 178,081 246,083 0.32Staffline Group Plc 46,474 119,791 0.16Sthree Plc 45,142 125,753 0.16Synergy Health Plc 113,559 1,145,217 1.49Ultra Electronics Holdings Plc 10,955 180,980 0.23United Business Media Ltd 34,000 176,523 0.23Valiant Petroleum Plc 32,181 177,017 0.23Victrex Plc 15,970 229,421 0.30YouGov Plc 145,220 77,403 0.10
23,707,004 30.72
TOTAL EQUITIES 75,128,326 97.34
TOTAL TRANSFERABLE SECURITIES ADMITTED TO AN OFFICIAL STOCK EXCHANGE LISTING OR DEALT IN ON ANOTHER REGULATED MARKET 75,128,326 97.34
OTHER TRANSFERABLE SECURITIES
EQUITIES UNITED KINGDOM Invesco Continental Smaller Companies Trust (in liquidation) 4,250,000 – –
TOTAL EQUITIES – –
TOTAL OTHER TRANSFERABLE SECURITIES – –
Total Investments 75,128,326 97.34
The accompanying notes form an integral part of these financial statements.

Invesco European Growth Equity Fund
23 Invesco Funds
Statement of Investments as at 31 August 2011
Investment Nominal/Shares Market Value Net Assets EUR %TRANSFERABLE SECURITIES ADMITTED TO AN OFFICIAL STOCK EXCHANGE LISTING OR DEALT IN ON ANOTHER REGULATED MARKET
EQUITIES AUSTRIA Andritz AG 7,052 448,014 0.87
BELGIUM Anheuser-Busch InBev NV 24,401 930,776 1.81D'ieteren SA 10,123 384,573 0.75
1,315,349 2.56
BERMUDA Lancashire Holdings Ltd 99,681 751,415 1.46VimpelCom Ltd ADR 39,869 306,410 0.60
1,057,825 2.06
CYPRUS ProSafe SE 206,682 1,033,619 2.01
DENMARK Novo Nordisk A/S 9,602 705,882 1.37
FRANCE BNP Paribas SA 15,458 545,397 1.06Cap Gemini SA 17,613 491,843 0.96Cie Generale des Etablissements Michelin 7,155 357,607 0.70Danone 17,036 803,418 1.56Faurecia 21,109 416,375 0.81Lafarge SA 6,913 195,707 0.38Publicis Groupe SA 8,598 280,445 0.55Sa des Ciments Vicat 9,666 479,699 0.93Schneider Electric SA 3,494 320,470 0.62Total SA 10,529 353,932 0.69
4,244,893 8.26
GERMANY Bayer AG 8,749 387,428 0.75Bayerische Motoren Werke AG 8,352 458,358 0.89Deutsche Boerse AG 10,699 428,388 0.83Fresenius Medical Care AG & Co KGaA 12,712 589,074 1.15SAP AG 17,189 642,954 1.25Volkswagen AG 3,279 371,101 0.72Wirecard AG 74,924 894,218 1.74
3,771,521 7.33
GREECE Intralot SA-Integrated Lottery Systems & Services 87,299 75,514 0.15JUMBO SA 64,261 252,546 0.49
328,060 0.64
IRELAND DCC Plc 36,577 689,019 1.34Paddy Power Plc 37,409 1,313,991 2.56
2,003,010 3.90
ITALY Ansaldo STS SpA 28,627 179,277 0.35
NETHERLANDS Aalberts Industries NV 71,594 933,228 1.82Koninklijke Ahold NV 69,101 555,296 1.08Unilever NV 25,687 596,324 1.16
2,084,848 4.06
NORWAY TGS Nopec Geophysical Co ASA 58,263 981,292 1.91
RUSSIA Gazprom OAO ADR 71,171 603,181 1.17

Invesco European Growth Equity Fund
24 Invesco Funds
Statement of Investments as at 31 August 2011
Investment Nominal/Shares Market Value Net Assets EUR %SPAIN Prosegur Cia de Seguridad SA 9,447 301,359 0.59
SWEDEN Intrum Justitia AB 72,639 727,457 1.41Kinnevik Investment AB 36,210 531,466 1.03Swedbank AB 51,720 483,852 0.94Telefonaktiebolaget LM Ericsson 80,699 622,131 1.21Volvo AB 58,727 489,231 0.95
2,854,137 5.54
SWITZERLAND ABB Ltd 37,572 552,453 1.07Aryzta AG 40,347 1,314,303 2.56Dufry AG 11,864 868,679 1.69Julius Baer Group Ltd 21,583 610,884 1.19Nestle SA 20,929 885,694 1.72Novartis AG 23,460 939,209 1.83Roche Holding AG (Gebusscheine) 7,105 851,997 1.66Syngenta AG 2,120 464,090 0.90
6,487,309 12.62
TURKEY Haci Omer Sabanci Holding AS 343,130 834,629 1.62Tupras Turkiye Petrol Rafinerileri AS 45,824 597,843 1.16
1,432,472 2.78
UNITED KINGDOM Amlin Plc 202,726 708,009 1.38Balfour Beatty Plc 213,711 597,147 1.16BG Group Plc 48,388 710,275 1.38British American Tobacco Plc 28,871 880,637 1.71Bunzl Plc 76,747 681,124 1.32Centrica Plc 166,559 558,869 1.09Chemring Group Plc 129,816 825,183 1.61Compass Group Plc 178,305 1,101,728 2.14Homeserve Plc 237,611 1,210,992 2.36IG Group Holdings Plc 179,516 897,392 1.75Imperial Tobacco Group Plc 40,871 929,698 1.81Informa Plc 232,370 909,836 1.77International Power Plc 69,146 261,066 0.51Kingfisher Plc 188,601 500,710 0.97Micro Focus International Plc 131,307 446,584 0.87Mitie Group Plc 294,572 739,516 1.44Next Plc 24,062 630,942 1.23Reed Elsevier Plc 137,856 777,931 1.51Royal Dutch Shell Plc 32,295 741,813 1.44Shire Plc 36,605 802,722 1.56Smiths Group Plc 44,010 485,533 0.94Tesco Plc 160,712 675,446 1.31Ultra Electronics Holdings Plc 44,410 733,666 1.43United Business Media Ltd 69,149 359,011 0.70Vodafone Group Plc 325,095 592,900 1.15William Hill Plc 129,105 326,809 0.64WPP Plc 78,124 567,323 1.10
18,652,862 36.28
TOTAL EQUITIES 48,484,910 94.30
TOTAL TRANSFERABLE SECURITIES ADMITTED TO AN OFFICIAL STOCK EXCHANGE LISTING OR DEALT IN ON ANOTHER REGULATED MARKET 48,484,910 94.30
Total Investments 48,484,910 94.30
The accompanying notes form an integral part of these financial statements.

Invesco Pan European Equity Income Fund
25 Invesco Funds
Statement of Investments as at 31 August 2011
Investment Nominal/Shares Market Value Net Assets EUR %TRANSFERABLE SECURITIES ADMITTED TO AN OFFICIAL STOCK EXCHANGE LISTING OR DEALT IN ON ANOTHER REGULATED MARKET
EQUITIES BASIC MATERIALS UPM-Kymmene OYJ 5,785 53,367 1.08
COMMUNICATIONS BT Group Plc 29,095 55,040 1.12Elisa OYJ 4,721 69,564 1.41Koninklijke KPN NV 3,947 38,689 0.79Lagardere SCA 1,723 40,615 0.82ProSiebenSat.1 Media AG 3,399 46,966 0.95Reed Elsevier NV 7,917 64,136 1.30Telefonaktiebolaget LM Ericsson 6,371 49,116 1.00Telefonica SA 5,324 76,413 1.55Vivendi SA 6,550 109,434 2.22Vodafone Group Plc 65,181 118,875 2.41Yell Group Plc 110,591 6,150 0.12
674,998 13.69
CONSUMER, CYCLICAL Carnival Plc 958 21,376 0.43Compass Group Plc 8,922 55,128 1.12DCC Plc 2,752 51,841 1.05Dixons Retail Plc 129,651 17,638 0.36Howden Joinery Group Plc 14,434 15,859 0.32Inditex SA 835 49,419 1.00Ryanair Holdings Plc 15,335 47,746 0.97Thomas Cook Group Plc 52,638 25,966 0.53
284,973 5.78
CONSUMER, NON-CYCLICAL AstraZeneca Plc 2,530 82,373 1.67Atlantia SpA 7,667 85,449 1.73British American Tobacco Plc 3,072 93,704 1.90BTG Plc 8,083 23,242 0.47C&C Group Plc 12,275 37,169 0.75Capita Group Plc 3,986 31,879 0.65Carrefour SA 1,632 29,364 0.60Distribuidora Internacional de Alimentacion SA 1,341 3,999 0.08G4S Plc 21,744 63,954 1.30GlaxoSmithKline Plc 7,137 104,500 2.12Imperial Tobacco Group Plc 3,557 80,911 1.64Koninklijke Ahold NV 8,645 69,471 1.41Novartis AG 6,349 254,179 5.16Reckitt Benckiser Group Plc 540 19,688 0.40Rentokil Initial Plc 81,447 73,363 1.49Reynolds American Inc 2,130 55,041 1.12Roche Holding AG (Gebusscheine) 2,237 268,250 5.44Sanofi-Aventis SA 666 33,287 0.68Smith & Nephew Plc 2,341 16,379 0.33Tesco Plc 5,870 24,671 0.50Unilever NV 2,702 62,727 1.27WM Morrison Supermarkets Plc 4,403 14,270 0.29
1,527,870 31.00
DIVERSIFIED Drax Group Plc 4,230 24,347 0.49
ENERGY Altona Energy Plc 141,523 10,975 0.22BG Group Plc 4,410 64,733 1.31

Invesco Pan European Equity Income Fund
26 Invesco Funds
Statement of Investments as at 31 August 2011
Investment Nominal/Shares Market Value Net Assets EUR %ENERGY (CONTINUED) Galp Energia SGPS SA 5,929 80,857 1.64Repsol YPF SA 3,460 68,465 1.39Royal Dutch Shell Plc 2,872 65,647 1.33Sterling Energy Plc 13,185 6,228 0.13
296,905 6.02
FINANCIAL Ageas 36,048 50,053 1.02Allianz SE 1,011 71,907 1.46Amlin Plc 3,656 12,768 0.26Banco Bilbao Vizcaya Argentaria SA 6,110 37,561 0.76Banque Cantonale Vaudoise 89 35,477 0.72BNP Paribas SA 943 33,271 0.67Bolsas y Mercados Espanoles SA 2,190 42,349 0.86Burford Capital Ltd 15,846 21,718 0.44Catlin Group Ltd 8,089 33,447 0.68Commerzbank AG 24,582 50,295 1.02Delta Lloyd NV 5,168 65,168 1.32FBD Holdings Plc 7,710 51,079 1.04Gjensidige Forsikring ASA 4,209 34,887 0.71ING Groep NV 12,067 71,238 1.44Provident Financial Plc 4,855 60,764 1.23Regus Plc 1,449 1,143 0.02Societe Generale SA 1,090 24,667 0.50Tryg A/S 1,346 52,243 1.06UBS AG 4,933 49,130 1.00Unibail-Rodamco SE 420 62,465 1.27UniCredit SpA 40,613 37,597 0.76Zurich Financial Services AG 308 47,357 0.96
946,584 19.20
GOVERNMENT National Grid Plc 6,123 42,150 0.86
INDUSTRIAL AP Moller - Maersk A/S 8 37,794 0.77BAE Systems Plc 20,161 61,951 1.26Bilfinger Berger SE 670 38,589 0.78Chemring Group Plc 9,308 59,167 1.20Cobham Plc 18,551 39,499 0.80European Aeronautic Defence and Space Co NV 2,507 54,051 1.10Irish Continental Group Plc 2,626 38,484 0.78Obrascon Huarte Lain SA 1,904 36,433 0.74Oesterreichische Post AG 2,997 66,466 1.35PostNL NV 14,773 59,328 1.20Rolls-Royce Holdings Plc 4,492 31,847 0.65Safran SA 2,463 65,325 1.32
588,934 11.95
TECHNOLOGY Sage Group Plc 11,893 33,546 0.68
UTILITIES Centrica Plc 13,980 46,908 0.95EDF SA 3,201 67,573 1.37GDF Suez 1,797 38,694 0.79

Invesco Pan European Equity Income Fund
27 Invesco Funds
Statement of Investments as at 31 August 2011
Investment Nominal/Shares Market Value Net Assets EUR %UTILITIES (CONTINUED) United Utilities Group Plc 2,334 15,633 0.32
168,808 3.43
TOTAL EQUITIES 4,642,482 94.18
TOTAL TRANSFERABLE SECURITIES ADMITTED TO AN OFFICIAL STOCK EXCHANGE LISTING OR DEALT IN ON ANOTHER REGULATED MARKET 4,642,482 94.18
OTHER TRANSFERABLE SECURITIES
BONDS FINANCIAL Barclays Bank Plc NTS 28/02/2019 (LAKE ACQ-CVR) 17,697 6,488 0.13
TOTAL BONDS 6,488 0.13
TOTAL OTHER TRANSFERABLE SECURITIES 6,488 0.13
OPEN-ENDED FUNDS Invesco Perpetual Fixed Interest Investment Series - European High Yield Fund 94,812 35,904 0.73
TOTAL OPEN-ENDED FUNDS 35,904 0.73
Total Investments 4,684,874 95.04
The accompanying notes form an integral part of these financial statements

Invesco Emerging Europe Equity Fund
28 Invesco Funds
Statement of Investments as at 31 August 2011
Investment Nominal/Shares Market Value Net Assets USD %TRANSFERABLE SECURITIES ADMITTED TO AN OFFICIAL STOCK EXCHANGE LISTING OR DEALT IN ON ANOTHER REGULATED MARKET
EQUITIES CYPRUS Globaltrans Investment Plc GDR 60,300 947,614 2.34
CZECH REPUBLIC Telefonica Czech Republic AS 22,700 580,616 1.44
GEORGIA Bank of Georgia JSC GDR 56,700 815,629 2.02
HUNGARY Richter Gedeon Nyrt 4,300 783,280 1.94
LUXEMBOURG MHP SA GDR 41,100 550,740 1.36O'Key Group SA GDR 62,500 476,875 1.18
1,027,615 2.54
NETHERLANDS AmRest Holdings SE 19,100 433,624 1.07Cinema City International NV 36,500 361,865 0.89X5 Retail Group NV GDR 32,100 1,151,587 2.85
1,947,076 4.81
POLAND Eurocash SA 119,100 999,131 2.47KGHM Polska Miedz SA 30,900 1,868,922 4.62Mondi Swiecie SA 25,300 666,116 1.65Powszechny Zaklad Ubezpieczen SA 11,700 1,433,409 3.54Warsaw Stock Exchange 48,200 773,244 1.91
5,740,822 14.19
RUSSIA Alrosa Co Ltd 13 434,200 1.07Cherkizovo Group OJSC GDR 59,300 889,500 2.20Gazprom OAO ADR 244,800 2,995,128 7.40Lukoil OAO ADR 63,700 3,820,407 9.44MMC Norilsk Nickel ADR 61,000 1,481,690 3.66NovaTek OAO GDR 20,100 2,657,220 6.57Pharmstandard GDR 40,800 823,344 2.03Polymetal JSC GDR 59,800 1,296,763 3.20Rosneft Oil Co GDR 308,000 2,365,440 5.85Sberbank of Russia 228,300 655,699 1.62Sberbank of Russian Federation ADR 95,800 1,107,448 2.74Tatneft ADR 51,000 1,646,535 4.07TNK-BP Holding 437,100 1,193,781 2.95Uralkali GDR 50,100 2,449,639 6.05Vsmpo-Avisma Corp 5,200 872,505 2.16
24,689,299 61.01
TURKEY Akfen Holding AS 48,534 234,092 0.58Bizim Toptan Satis Magazalari AS 28,000 354,692 0.88Tofas Turk Otomobil Fabrikasi AS 139,000 454,216 1.12Tupras Turkiye Petrol Rafinerileri AS 22,000 414,358 1.02Turkiye Sinai Kalkinma Bankasi AS 465,000 489,856 1.21
1,947,214 4.81

Invesco Emerging Europe Equity Fund
29 Invesco Funds
Statement of Investments as at 31 August 2011
Investment Nominal/Shares Market Value Net Assets USD %UNITED KINGDOM Eurasian Natural Resources Corp Plc 38,800 423,661 1.05Hikma Pharmaceuticals Plc 52,400 515,414 1.27
939,075 2.32
TOTAL EQUITIES 39,418,240 97.42
TOTAL TRANSFERABLE SECURITIES ADMITTED TO AN OFFICIAL STOCK EXCHANGE LISTING OR DEALT IN ON ANOTHER REGULATED MARKET 39,418,240 97.42
Total Investments 39,418,240 97.42
The accompanying notes form an integral part of these financial statements.

Invesco Pan European Focus Equity Fund
30 Invesco Funds
Statement of Investments as at 31 August 2011
Investment Nominal/Shares Market Value Net Assets EUR %TRANSFERABLE SECURITIES ADMITTED TO AN OFFICIAL STOCK EXCHANGE LISTING OR DEALT IN ON ANOTHER REGULATED MARKET
EQUITIES BELGIUM D'ieteren SA 635 24,124 2.05
BERMUDA HAL Trust 372 32,161 2.73
FRANCE Cie Generale des Etablissements Michelin 625 31,238 2.65Euro Disney SCA 3,460 19,618 1.67Lagardere SCA 965 22,747 1.93Safran SA 1,550 41,110 3.50
114,713 9.75
GABON Total Gabon 72 23,705 2.02
GERMANY Daimler AG 785 28,629 2.43
IRELAND Origin Enterprises Plc 7,270 22,901 1.95
LUXEMBOURG SAF-Holland SA 3,160 14,094 1.20
NETHERLANDS Fugro NV 576 23,940 2.04ING Groep NV 5,780 34,122 2.90Reed Elsevier NV 4,460 36,131 3.07
94,193 8.01
SPAIN Banco Bilbao Vizcaya Argentaria SA 5,290 32,520 2.77Obrascon Huarte Lain SA 1,890 36,165 3.07
68,685 5.84
SWITZERLAND Kuoni Reisen Holding AG 97 23,135 1.97Novartis AG 1,610 64,455 5.47Roche Holding AG (Gebusscheine) 485 58,159 4.95UBS AG 3,330 33,165 2.82
178,914 15.21
UNITED KINGDOM Babcock International Group Plc 3,580 25,190 2.14BAE Systems Plc 12,736 39,135 3.33BP Plc 10,930 48,942 4.16BT Group Plc 18,430 34,865 2.97Croda International Plc 900 18,092 1.54Dechra Pharmaceuticals Plc 7,440 37,431 3.18G4S Plc 15,500 45,588 3.88GKN Plc 15,200 34,756 2.96GlaxoSmithKline Plc 2,745 40,193 3.42Imperial Tobacco Group Plc 1,735 39,466 3.36Legal & General Group Plc 30,250 35,779 3.04LSL Property Services Plc 8,500 20,675 1.76Melrose Plc 5,162 18,025 1.53Northgate Plc 7,530 23,329 1.98Rentokil Initial Plc 39,800 35,850 3.05

Invesco Pan European Focus Equity Fund
31 Invesco Funds
Statement of Investments as at 31 August 2011
Investment Nominal/Shares Market Value Net Assets EUR %UNITED KINGDOM (CONTINUED) Resolution Ltd 12,750 37,352 3.18TalkTalk Telecom Group Plc 15,590 22,475 1.91
557,143 47.39
TOTAL EQUITIES 1,159,262 98.58
TOTAL TRANSFERABLE SECURITIES ADMITTED TO AN OFFICIAL STOCK EXCHANGE LISTING OR DEALT IN ON ANOTHER REGULATED MARKET 1,159,262 98.58
Total Investments 1,159,262 98.58
The accompanying notes form an integral part of these financial statements.

Invesco Nippon Small/Mid Cap Equity Fund
32 Invesco Funds
Statement of Investments as at 31 August 2011
Investment Nominal/Shares Market Value Net Assets JPY %TRANSFERABLE SECURITIES ADMITTED TO AN OFFICIAL STOCK EXCHANGE LISTING OR DEALT IN ON ANOTHER REGULATED MARKET
EQUITIES BASIC MATERIALS Aichi Steel Corp 185,000 83,990,000 2.30Nippon Kodoshi Corp 15,800 35,068,100 0.96Polatechno Co Ltd 480 65,256,000 1.79Rasa Industries Ltd 277,000 39,749,500 1.09Toda Kogyo Corp 181,000 122,446,500 3.36
346,510,100 9.50
COMMUNICATIONS Bit-isle Inc 412 61,676,400 1.69CyberAgent Inc 324 81,550,800 2.24Dena Co Ltd 22,700 89,835,250 2.46Dwango Co Ltd 390 63,238,500 1.73GungHo Online Entertainment Inc 289 70,949,500 1.95Internet Initiative Japan Inc 294 104,590,500 2.87Kadokawa Group Holdings Inc 15,500 42,563,000 1.17M3 Inc 109 75,537,000 2.07Mixi Inc 196 64,729,000 1.78Rakuten Inc 2,291 197,255,100 5.41
851,925,050 23.37
CONSUMER, CYCLICAL Aeon Fantasy Co Ltd 30,600 36,383,400 1.00Amiyaki Tei Co Ltd 199 41,332,300 1.13Calsonic Kansei Corp 91,000 41,268,500 1.13Cosmos Pharmaceutical Corp 10,000 37,775,000 1.04Eagle Industry Co Ltd 111,000 99,567,000 2.73Ship Healthcare Holdings Inc 42,400 76,129,200 2.09WATAMI Co Ltd 44,000 77,814,000 2.13
410,269,400 11.25
CONSUMER, NON-CYCLICAL Asahi Intecc Co Ltd 34,600 73,006,000 2.00Daiseki Co Ltd 2,500 3,767,500 0.10Eiken Chemical Co Ltd 96,900 98,305,050 2.70Message Co Ltd 168 45,830,400 1.26Nihon M&A Center Inc 61 24,674,500 0.68OncoTherapy Science Inc 672 88,569,600 2.43Tsumura & Co 1,500 3,540,750 0.10
337,693,800 9.27
FINANCIAL Tosei Corp 1,554 36,456,840 1.00
INDUSTRIAL Anritsu Corp 239,000 223,106,500 6.12AOI Electronic Co Ltd 22,600 30,001,500 0.82Central Glass Co Ltd 195,000 67,860,000 1.86Dai-ichi Seiko Co Ltd 25,600 79,552,000 2.18Harmonic Drive Systems Inc 17,300 28,899,650 0.79Iriso Electronics Co Ltd 37,200 48,955,200 1.34JSP Corp 51,600 67,699,200 1.86Maruwa Co Ltd/Aichi 26,100 85,673,250 2.35Nidec-Tosok Corp 27,400 24,797,000 0.68Nippon Ceramic Co Ltd 94,700 147,116,450 4.03Taikisha Ltd 75,300 120,103,500 3.29Tamron Co Ltd 39,100 81,973,150 2.25Teikoku Electric Manufacturing Co Ltd 26,800 45,184,800 1.24Tocalo Co Ltd 36,700 59,160,400 1.62

Invesco Nippon Small/Mid Cap Equity Fund
33 Invesco Funds
Statement of Investments as at 31 August 2011
Investment Nominal/Shares Market Value Net Assets JPY %INDUSTRIAL (CONTINUED) Tomoe Engineering Co Ltd 22,200 31,779,300 0.87
1,141,861,900 31.30
TECHNOLOGY OBIC Business Consultants Ltd 32,750 154,661,875 4.24Sanken Electric Co Ltd 122,000 45,018,000 1.23Systena Corp 1,070 72,385,500 1.98UT Holdings Co Ltd 911 58,212,900 1.60V Technology Co Ltd 114 47,196,000 1.29
377,474,275 10.34
TOTAL EQUITIES 3,502,191,365 96.03
TOTAL TRANSFERABLE SECURITIES ADMITTED TO AN OFFICIAL STOCK EXCHANGE LISTING OR DEALT IN ON ANOTHER REGULATED MARKET 3,502,191,365 96.03
Total Investments 3,502,191,365 96.03
The accompanying notes form an integral part of these financial statements

Invesco Nippon Select Equity Fund
34 Invesco Funds
Statement of Investments as at 31 August 2011
Investment Nominal/Shares Market Value Net Assets JPY %TRANSFERABLE SECURITIES ADMITTED TO AN OFFICIAL STOCK EXCHANGE LISTING OR DEALT IN ON ANOTHER REGULATED MARKET
EQUITIES BASIC MATERIALS Nippon Steel Corp 532,000 121,562,000 1.81Shin-Etsu Chemical Co Ltd 57,000 219,307,500 3.27Taiyo Nippon Sanso Corp 156,000 88,452,000 1.32
429,321,500 6.40
COMMUNICATIONS Dentsu Inc 74,800 178,996,400 2.67M3 Inc 369 255,717,000 3.81Rakuten Inc 3,958 340,783,800 5.07
775,497,200 11.55
CONSUMER, CYCLICAL ASKUL Corp 51,000 52,606,500 0.78Descente Ltd 271,000 111,652,000 1.66Ichibanya Co Ltd 53,400 126,985,200 1.89Marubeni Corp 445,000 213,822,500 3.18Nishimatsuya Chain Co Ltd 70,200 47,139,300 0.70Oriental Land Co Ltd 27,300 206,661,000 3.08Toyota Tsusho Corp 245,000 310,660,000 4.63
1,069,526,500 15.92
CONSUMER, NON-CYCLICAL Hisamitsu Pharmaceutical Co Inc 49,000 159,495,000 2.38Ito En Ltd 161,300 225,336,100 3.36Tsumura & Co 137,600 324,804,800 4.84
709,635,900 10.58
FINANCIAL Fukuoka Financial Group Inc 587,000 179,915,500 2.68Mizuho Financial Group Inc 1,563,900 180,630,450 2.69Sumitomo Mitsui Financial Group Inc 97,000 218,541,000 3.25Tokyu Livable Inc 170,300 112,653,450 1.68
691,740,400 10.30
INDUSTRIAL East Japan Railway Co 37,900 173,487,250 2.58Fuji Kyuko Co Ltd 85,000 38,505,000 0.57Hamamatsu Photonics KK 76,500 237,341,250 3.53Hitachi Construction Machinery Co Ltd 48,600 69,230,700 1.03Hoya Corp 100,400 168,220,200 2.51Keyence Corp 13,300 271,453,000 4.04Nidec Corp 2,600 17,303,000 0.26Optex Co Ltd 95,800 93,740,300 1.40SMC Corp 19,500 235,170,000 3.50Taikisha Ltd 127,400 203,203,000 3.03Toshiba Plant Systems & Services Corp 82,000 63,837,000 0.95Wacom Co Ltd 2,169 184,798,800 2.75
1,756,289,500 26.15
TECHNOLOGY Axell Corp 32,500 52,422,500 0.78Canon Inc 85,800 308,451,000 4.59Fujitsu Ltd 47,000 18,118,500 0.27Ricoh Co Ltd 334,000 230,460,000 3.43Roland DG Corp 116,900 108,892,350 1.62Square Enix Holdings Co Ltd 144,100 264,351,450 3.94Tecmo Koei Holdings Co Ltd 291,600 207,765,000 3.09

Invesco Nippon Select Equity Fund
35 Invesco Funds
Statement of Investments as at 31 August 2011
Investment Nominal/Shares Market Value Net Assets JPY %TECHNOLOGY (CONTINUED) Zuken Inc 113,800 60,086,400 0.89
1,250,547,200 18.61
TOTAL EQUITIES 6,682,558,200 99.51
TOTAL TRANSFERABLE SECURITIES ADMITTED TO AN OFFICIAL STOCK EXCHANGE LISTING OR DEALT IN ON ANOTHER REGULATED MARKET 6,682,558,200 99.51
Total Investments 6,682,558,200 99.51
The accompanying notes form an integral part of these financial statements

Invesco Asia Opportunities Equity Fund
36 Invesco Funds
Statement of Investments as at 31 August 2011
Investment Nominal/Shares Market Value Net Assets USD %TRANSFERABLE SECURITIES ADMITTED TO AN OFFICIAL STOCK EXCHANGE LISTING OR DEALT IN ON ANOTHER REGULATED MARKET
EQUITIES BERMUDA GOME Electrical Appliances Holding Ltd 6,350,000 2,737,087 1.81Nine Dragons Paper Holdings Ltd 1,688,000 1,211,569 0.80
3,948,656 2.61
CAYMAN ISLANDS Kingboard Chemical Holdings Ltd 414,000 1,601,265 1.06Sands China Ltd 1,300,800 4,059,186 2.69Tencent Holdings Ltd 159,400 3,781,971 2.51
9,442,422 6.26
CHINA Bank of China Ltd 9,426,300 3,899,838 2.59China Construction Bank Corp 6,948,890 5,143,596 3.41China Merchants Bank Co Ltd 450,000 836,404 0.55China National Materials Co Ltd 2,257,000 1,368,072 0.91China Petroleum & Chemical Corp 2,258,000 2,227,542 1.48China Shenhua Energy Co Ltd 940,500 4,349,503 2.88Chongqing Department Store 272,086 1,990,243 1.32GD Midea Holding Co Ltd 1,016,600 2,587,642 1.72Jiangxi Copper Co Ltd 1,345,000 3,839,086 2.55Qinghai Salt Lake Industry Co Ltd 164,000 1,346,696 0.89Weichai Power Co Ltd 330,000 1,636,210 1.08
29,224,832 19.38
HONG KONG AIA Group Ltd 713,400 2,514,470 1.67BOC Hong Kong Holdings Ltd 598,000 1,639,770 1.09Citic Pacific Ltd 744,000 1,502,288 1.00CNOOC Ltd 1,846,000 3,770,078 2.50
9,426,606 6.26
INDIA Bank of Baroda 174,533 2,795,940 1.85Bharti Airtel Ltd 165,289 1,448,926 0.96Dr Reddy's Laboratories Ltd 91,684 2,987,446 1.98ICICI Bank Ltd 196,510 3,732,838 2.48ITC Ltd 812,804 3,538,037 2.35Tata Consultancy Services Ltd 150,678 3,419,623 2.27Tata Motors Ltd 118,301 1,916,323 1.27
19,839,133 13.16
INDONESIA Astra International Tbk PT 568,500 4,405,492 2.92Bank Mandiri Tbk PT 4,996,626 3,996,481 2.65Indosat Tbk PT 1,602,000 1,009,112 0.67Telekomunikasi Indonesia Tbk PT 1,579,500 1,332,755 0.88
10,743,840 7.12
MALAYSIA IJM Corp Bhd 1,232,700 2,347,196 1.56
SINGAPORE Keppel Corp Ltd 275,100 2,122,661 1.41
SOUTH KOREA CJ CheilJedang Corp 10,762 3,296,137 2.19Hyundai Department Store Co Ltd 17,319 2,918,020 1.93Hyundai Mobis 10,599 3,345,562 2.22Hyundai Motor Co 16,769 3,194,731 2.12LG Chem Ltd 9,978 3,537,684 2.35LG Fashion Corp 54,636 2,500,448 1.66Mando Corp 19,632 3,418,141 2.27

Invesco Asia Opportunities Equity Fund
37 Invesco Funds
Statement of Investments as at 31 August 2011
Investment Nominal/Shares Market Value Net Assets USD %SOUTH KOREA (CONTINUED) Samsung Electronics Co Ltd 2,475 1,724,856 1.14
23,935,579 15.88
TAIWAN Cheng Shin Rubber Industry Co Ltd 1,105,000 2,557,810 1.70Chipbond Technology Corp 1,834,000 1,673,768 1.11Chroma ATE Inc 871,520 2,193,109 1.45Foxconn Technology Co Ltd 45,450 160,590 0.11Fubon Financial Holding Co Ltd 2,715,477 3,868,289 2.56Gigabyte Technology Co Ltd 2,859,000 2,811,252 1.86Mega Financial Holding Co Ltd 2,465,000 2,177,413 1.44Taiwan Fertilizer Co Ltd 985,000 3,059,292 2.03Taiwan Semiconductor Manufacturing Co Ltd 1,976,000 4,730,632 3.14Teco Electric and Machinery Co Ltd 4,158,000 2,691,066 1.78
25,923,221 17.18
THAILAND Bangchak Petroleum PCL 6,313,100 4,602,643 3.05Kasikornbank PCL 667,800 2,835,420 1.88Major Cineplex Group PCL 4,654,800 2,492,810 1.65
9,930,873 6.58
UNITED KINGDOM Genting Singapore Plc 1,599,000 2,216,952 1.47
TOTAL EQUITIES 149,101,971 98.87
TOTAL TRANSFERABLE SECURITIES ADMITTED TO AN OFFICIAL STOCK EXCHANGE LISTING OR DEALT IN ON ANOTHER REGULATED MARKET 149,101,971 98.87
Total Investments 149,101,971 98.87
The accompanying notes form an integral part of these financial statements.

Invesco Greater China Equity Fund
38 Invesco Funds
Statement of Investments as at 31 August 2011
Investment Nominal/Shares Market Value Net Assets USD %TRANSFERABLE SECURITIES ADMITTED TO AN OFFICIAL STOCK EXCHANGE LISTING OR DEALT IN ON ANOTHER REGULATED MARKET
EQUITIES BERMUDA Pou Sheng International Holdings Ltd 39,996,000 6,234,023 1.09Yue Yuen Industrial Holdings Ltd 683,700 1,876,960 0.33
8,110,983 1.42
CAYMAN ISLANDS AAC Technologies Holdings Inc 8,694,000 18,034,547 3.15Alibaba.com Ltd 1,818,500 1,923,444 0.34Asia Cement China Holdings Corp 26,289,500 18,835,671 3.29China Dongxiang Group Co 25,550,000 5,719,551 1.00China High Speed Transmission Equipment Group Co Ltd 11,462,000 6,712,384 1.17Haitian International Holdings Ltd 16,010,000 14,921,158 2.61Li Ning Co Ltd 9,041,000 12,375,321 2.16Minth Group Ltd 18,906,000 20,773,162 3.63Shenzhou International Group Holdings Ltd 11,370,000 15,446,568 2.70Stella International Holdings Ltd 2,740,000 7,706,652 1.35Tencent Holdings Ltd 330,000 7,829,677 1.37Uni-President China Holdings Ltd 28,438,000 16,106,654 2.82Vinda International Holdings Ltd 17,895,000 20,970,841 3.67WuXi PharmaTech Cayman Inc ADR 1,022,078 13,266,572 2.32Xingda International Holdings Ltd 8,499,000 5,058,962 0.89
185,681,164 32.47
CHINA Bank of China Ltd 26,256,000 10,862,602 1.90China Construction Bank Corp 28,085,000 20,788,628 3.64China International Marine Containers Group Co Ltd 5,776,300 7,976,996 1.40China National Materials Co Ltd 10,756,000 6,519,709 1.14China Oilfield Services Ltd 4,498,000 7,033,941 1.23China Shenhua Energy Co Ltd 2,584,000 11,950,150 2.09Huadian Energy Co Ltd 2 1 –Industrial & Commercial Bank of China 30,013,965 19,713,735 3.45Jiangling Motors Corp Ltd 3,092,295 6,190,422 1.08Maanshan Iron & Steel 14,348,000 5,034,128 0.88PetroChina Co Ltd 4,578,000 5,875,820 1.03Shanghai Jinjiang International Hotels Development Co Ltd 7,136,243 9,890,833 1.73Weifu High-Technology Group Co Ltd 1 3 –Wuxi Little Swan Co Ltd 1,511,403 1,953,444 0.34
113,790,412 19.91
HONG KONG BOC Hong Kong Holdings Ltd 1,458,000 3,997,967 0.70Cheung Kong Holdings Ltd 208,000 2,909,810 0.51CNOOC Ltd 5,042,000 10,297,255 1.80Hang Seng Bank Ltd 1,132,300 16,639,190 2.91Sun Hung Kai Properties Ltd 1,527,000 21,518,633 3.76Swire Pacific Ltd 298,000 3,973,895 0.70
59,336,750 10.38
TAIWAN Asustek Computer Inc 988,200 8,354,372 1.46Cheng Uei Precision Industry Co Ltd 27,411 77,056 0.01Giant Manufacturing Co Ltd 471,000 1,757,554 0.31Hon Hai Precision Industry Co Ltd 8,744,285 22,079,635 3.86Hotai Motor Co Ltd 5,566,000 26,142,051 4.57Largan Precision Co Ltd 392,000 11,188,616 1.96MediaTek Inc 1,259,273 12,642,873 2.21President Chain Store Corp 6,136,264 39,026,567 6.82Richtek Technology Corp 1,770,000 9,091,164 1.59Sanyang Industry Co Ltd 24,500,000 16,827,685 2.94

Invesco Greater China Equity Fund
39 Invesco Funds
Statement of Investments as at 31 August 2011
Investment Nominal/Shares Market Value Net Assets USD %TAIWAN (CONTINUED) Silitech Technology Corp 3,449,150 9,268,045 1.62Simplo Technology Co Ltd 1,548,800 10,958,181 1.92Taiwan Semiconductor Manufacturing Co Ltd 7,650,872 18,316,527 3.20Wistron NeWeb Corp 3,811,986 9,743,666 1.70
195,473,992 34.17
UNITED STATES Yahoo! Inc 396,500 5,489,542 0.96
TOTAL EQUITIES 567,882,843 99.31
WARRANTS UNITED STATES Ping An Insurance Group WTS 17/01/12 459,500 2,931,538 0.51
TOTAL WARRANTS 2,931,538 0.51
TOTAL TRANSFERABLE SECURITIES ADMITTED TO AN OFFICIAL STOCK EXCHANGE LISTING OR DEALT IN ON ANOTHER REGULATED MARKET 570,814,381 99.82
Total Investments 570,814,381 99.82
The accompanying notes form an integral part of these financial statements.

Invesco Asia Infrastructure Fund
40 Invesco Funds
Statement of Investments as at 31 August 2011
Investment Nominal/Shares Market Value Net Assets USD %TRANSFERABLE SECURITIES ADMITTED TO AN OFFICIAL STOCK EXCHANGE LISTING OR DEALT IN ON ANOTHER REGULATED MARKET
EQUITIES AUSTRALIA Adelaide Brighton Ltd 4,000,000 11,904,536 0.48BHP Billiton Ltd 2,284,200 96,781,343 3.86Leighton Holdings Ltd 1,106,428 23,947,131 0.96Macquarie Group Ltd 990,073 27,285,000 1.09MAp Group 8,552,727 28,692,840 1.15Rio Tinto Ltd 1,116,875 86,393,427 3.45Telstra Corp Ltd 5,100,000 16,511,144 0.66Woodside Petroleum Ltd 816,910 30,664,915 1.23WorleyParsons Ltd 1,207,445 35,014,262 1.39
357,194,598 14.27
BERMUDA Cheung Kong Infrastructure Holdings Ltd 3,305,000 19,990,734 0.80COSCO Pacific Ltd 11,600,000 15,833,437 0.63Kunlun Energy Co Ltd 15,916,000 24,542,228 0.98Orient Overseas International Ltd 3,270,000 16,066,531 0.64
76,432,930 3.05
CAYMAN ISLANDS ENN Energy Holdings Ltd 3,380,000 11,555,520 0.46Sany Heavy Equipment International Holdings Co Ltd 36,438,000 35,923,115 1.44
47,478,635 1.90
CHINA Anhui Conch Cement Co Ltd 3,200,000 13,392,945 0.54Beijing Capital International Airport Co Ltd 22,222,000 10,619,034 0.42Changsha Zoomlion Heavy Industry Science and Technology Development Co Ltd 11,399,988 19,115,559 0.76China Coal Energy Co Ltd 22,000,000 29,520,924 1.18China Communications Construction Co Ltd 30,200,000 21,831,142 0.88China Gezhouba Group Co Ltd 12,639,329 19,330,946 0.77China National Building Material Co Ltd 10,800,000 18,135,895 0.72China National Chemical Engineering Co Ltd 20,999,955 27,409,708 1.11China Oilfield Services Ltd 11,800,000 18,452,758 0.74China Petroleum & Chemical Corp 18,100,000 17,855,849 0.71China Railway Tielong Container Logistics Co Ltd 12,054,444 18,927,792 0.76China Shenhua Energy Co Ltd 8,136,500 37,628,637 1.50China Shipping Container Lines Co Ltd 85,000,000 19,791,155 0.79China State Construction Engineering Corp Ltd 26,999,988 14,837,250 0.59Dongfang Electric Corp Ltd 5,280,000 17,848,023 0.71Jiangsu Expressway Co Ltd 24,782,000 20,743,998 0.84Shenzhen Expressway Co Ltd 24,238,000 10,867,247 0.43Sinoma International Engineering Co 4,439,866 19,121,869 0.76Weichai Power Co Ltd 4,400,000 21,816,132 0.87Zhejiang Expressway Co Ltd 17,854,000 11,119,886 0.44
388,366,749 15.52
HONG KONG China Mobile Ltd 8,261,000 83,800,654 3.35Citic Pacific Ltd 10,850,000 21,908,369 0.88CNOOC Ltd 41,580,000 84,918,660 3.39Guangdong Investment Ltd 33,212,000 20,046,116 0.80Hutchison Whampoa Ltd 8,214,000 78,661,115 3.14MTR Corp 10,222,469 34,292,810 1.37Power Assets Holdings Ltd 11,708,500 90,609,592 3.62Swire Pacific Ltd 1,050,000 14,001,978 0.56
428,239,294 17.11
INDIA Bharat Heavy Electricals Ltd 250,600 9,602,255 0.38Coal India Ltd 5,781,214 47,006,119 1.88Larsen & Toubro Ltd 433,000 15,180,628 0.61Reliance Industries Ltd 1,391,000 23,727,055 0.95

Invesco Asia Infrastructure Fund
41 Invesco Funds
Statement of Investments as at 31 August 2011
Investment Nominal/Shares Market Value Net Assets USD %INDIA (CONTINUED) Tata Motors Ltd 570,000 9,233,260 0.37
104,749,317 4.19
INDONESIA Astra International Tbk PT 5,000,000 38,746,628 1.55Bank Mandiri Tbk PT 37,784,085 30,221,067 1.21Indocement Tunggal Prakarsa Tbk PT 16,828,500 29,878,326 1.19Semen Gresik Persero Tbk PT 9,979,500 10,613,378 0.42Telekomunikasi Indonesia Tbk PT 17,000,000 14,344,309 0.57United Tractors Tbk PT 34,770,655 95,962,600 3.84
219,766,308 8.78
MALAYSIA Gamuda Bhd 36,920,000 36,944,492 1.48Genting Bhd 3,500,000 11,099,485 0.44Lafarge Malayan Cement Bhd 7,590,000 16,754,876 0.67Petronas Chemicals Group Bhd 18,499,800 38,543,560 1.54Puncak Niaga Holding BHD 945,000 359,560 0.01YTL Power International Bhd 9,800,000 6,192,715 0.25
109,894,688 4.39
NEW ZEALAND Telecom Corp of New Zealand Ltd 7,100,000 15,348,921 0.61
PAKISTAN Oil & Gas Development Co Ltd 7,500,000 10,799,332 0.43
PHILIPPINES Energy Development Corp 60,000,000 8,846,585 0.35Metro Pacific Investments Corp 126,601,000 9,834,685 0.40
18,681,270 0.75
SINGAPORE CapitaLand Ltd 5,600,000 12,175,919 0.49Hyflux Ltd 4,500,000 6,463,572 0.26Keppel Corp Ltd 3,358,800 25,916,368 1.04SembCorp Industries Ltd 6,007,000 21,501,699 0.85Singapore Telecommunications Ltd 7,600,000 19,684,014 0.79SMRT Corp Ltd 11,400,000 17,108,978 0.68
102,850,550 4.11
SOUTH KOREA Cheil Industries Inc 280,000 25,392,510 1.01Hyundai Heavy Industries Co Ltd 37,000 12,025,823 0.48Hyundai Mipo Dockyard 151,712 19,446,609 0.78Hyundai Mobis 100,500 31,722,711 1.27KCC Corp 126,400 35,277,310 1.41LG Chem Ltd 257,000 91,118,944 3.65POSCO 80,150 30,370,376 1.21Samsung C&T Corp 200,000 14,313,164 0.57Samsung Electronics Co Ltd 41,000 28,573,369 1.14Samsung Engineering Co Ltd 143,000 32,337,019 1.29
320,577,835 12.81
TAIWAN Asia Cement Corp 12,610,634 16,616,684 0.67BES Engineering Corp 47,600,000 14,037,408 0.56Chunghwa Telecom Co Ltd 14,371,096 49,514,526 1.98CTCI Corp 3,100,000 4,100,814 0.16Far Eastern New Century Corp 20,368,888 26,611,324 1.06Hon Hai Precision Industry Co Ltd 438,424 1,107,036 0.04Nan Ya Plastics Corp 7,500,000 17,851,919 0.72Taiwan Fertilizer Co Ltd 3,586,000 11,137,687 0.44Taiwan Mobile Co Ltd 6,700,000 18,084,084 0.72Taiwan Semiconductor Manufacturing Co Ltd 11,702,073 28,015,282 1.12
187,076,764 7.47

Invesco Asia Infrastructure Fund
42 Invesco Funds
Statement of Investments as at 31 August 2011
Investment Nominal/Shares Market Value Net Assets USD %THAILAND Bangchak Petroleum PCL 13,000,000 9,477,810 0.38Kasikornbank PCL 3,600,000 15,285,284 0.61PTT Chemical PCL 2,530,300 11,503,281 0.46Siam Cement PCL 2,000,000 22,255,587 0.89Thai Oil PCL 8,200,000 18,297,462 0.73
76,819,424 3.07
UNITED ARAB EMIRATES DP World Ltd 883,333 9,871,246 0.39
TOTAL EQUITIES 2,474,147,861 98.85
TOTAL TRANSFERABLE SECURITIES ADMITTED TO AN OFFICIAL STOCK EXCHANGE LISTING OR DEALT IN ON ANOTHER REGULATED MARKET 2,474,147,861 98.85
Total Investments 2,474,147,861 98.85
The accompanying notes form an integral part of these financial statements.

Invesco India Equity Fund
43 Invesco Funds
Statement of Investments as at 31 August 2011
Investment Nominal/Shares Market Value Net Assets USD %TRANSFERABLE SECURITIES ADMITTED TO AN OFFICIAL STOCK EXCHANGE LISTING OR DEALT IN ON ANOTHER REGULATED MARKET
EQUITIES BASIC MATERIALS Asian Paints Ltd 57,000 4,077,265 2.22Coromandel International Ltd 350,000 2,349,675 1.28Jindal Steel & Power Ltd 250,000 2,818,948 1.54Sterlite Industries India Ltd 500,000 1,408,524 0.77
10,654,412 5.81
COMMUNICATIONS Bharti Airtel Ltd 700,000 6,136,213 3.34Idea Cellular Ltd 2,300,000 4,993,324 2.72
11,129,537 6.06
CONSUMER, CYCLICAL Bajaj Auto Ltd 145,000 4,984,396 2.71Hero Motocorp Ltd 95,000 4,256,435 2.32Mahindra & Mahindra Ltd 100,000 1,600,815 0.87Maruti Suzuki India Ltd 73,000 1,730,996 0.94Tata Motors Ltd 225,000 3,644,708 1.98Titan Industries Ltd 350,000 1,562,270 0.85
17,779,620 9.67
CONSUMER, NON-CYCLICAL Bajaj Corp Ltd 600,000 1,557,004 0.85Cadila Healthcare Ltd 121,625 2,227,746 1.21Dr Reddy's Laboratories Ltd 160,000 5,213,465 2.84ITC Ltd 2,400,000 10,446,909 5.69Lupin Ltd 480,000 4,692,640 2.56
24,137,764 13.15
DIVERSIFIED Sintex Industries Ltd 1,050,000 3,290,229 1.79
ENERGY Bharat Petroleum Corp Ltd 200,000 2,926,168 1.59Coal India Ltd 450,000 3,658,877 1.99Oil & Natural Gas Corp Ltd 400,000 2,290,120 1.25Reliance Industries Ltd 115,000 1,961,618 1.07
10,836,783 5.90
FINANCIAL Axis Bank Ltd 195,000 4,554,977 2.48Bank of Baroda 400,000 6,407,820 3.49HDFC Bank Ltd 1,100,000 11,315,910 6.16Housing Development Finance Corp 305,000 4,389,716 2.39ICICI Bank Ltd 585,000 11,112,463 6.05Infrastructure Development Finance Co Ltd 650,000 1,605,945 0.87ING Vysya Bank Ltd 370,000 2,344,339 1.28Jammu & Kashmir Bank Ltd 335,000 5,717,917 3.11Kotak Mahindra Bank Ltd 150,000 1,444,789 0.79Mahindra & Mahindra Financial Services Ltd 232,000 3,101,647 1.69Punjab National Bank 120,000 2,419,545 1.32State Bank of India 55,000 2,355,924 1.28
56,770,992 30.91
INDUSTRIAL Bharat Heavy Electricals Ltd 50,000 1,915,853 1.04Cummins India Ltd 255,000 3,248,275 1.77Grasim Industries Ltd 73,593 3,496,308 1.90Larsen & Toubro Ltd 150,000 5,258,878 2.86

Invesco India Equity Fund
44 Invesco Funds
Statement of Investments as at 31 August 2011
Investment Nominal/Shares Market Value Net Assets USD %INDUSTRIAL (CONTINUED) Pidilite Industries Ltd 1,100,000 3,897,776 2.12
17,817,090 9.69
TECHNOLOGY HCL Technologies Ltd 150,000 1,349,349 0.73Infosys Ltd 160,000 8,188,754 4.46Tata Consultancy Services Ltd 490,000 11,120,503 6.06Wipro Ltd 150,000 1,089,251 0.59
21,747,857 11.84
UTILITIES GAIL India Ltd 410,000 3,692,227 2.01
TOTAL EQUITIES 177,856,511 96.83
BONDS CONSUMER, NON-CYCLICAL Dr Reddy's Laboratories Ltd 9.25% INR 24/03/2014 4,800,000 103,373 0.06
TOTAL BONDS 103,373 0.06
TOTAL TRANSFERABLE SECURITIES ADMITTED TO AN OFFICIAL STOCK EXCHANGE LISTING OR DEALT IN ON ANOTHER REGULATED MARKET 177,959,884 96.89
Total Investments 177,959,884 96.89
The accompanying notes form an integral part of these financial statements

Invesco Asia Consumer Demand Fund
45 Invesco Funds
Statement of Investments as at 31 August 2011
Investment Nominal/Shares Market Value Net Assets USD %TRANSFERABLE SECURITIES ADMITTED TO AN OFFICIAL STOCK EXCHANGE LISTING OR DEALT IN ON ANOTHER REGULATED MARKET
EQUITIES AUSTRALIA Qantas Airways Ltd 7,700,000 12,874,980 1.28
BERMUDA Brilliance China Automotive Holdings Ltd 10,000,000 12,122,924 1.21GOME Electrical Appliances Holding Ltd 34,000,000 14,655,268 1.46Haier Electronics Group Co Ltd 7,600,000 8,574,820 0.85Shangri-La Asia Ltd 6,000,000 13,793,194 1.37Yue Yuen Industrial Holdings Ltd 3,700,000 10,157,599 1.01
59,303,805 5.90
CAYMAN ISLANDS Ajisen China Holdings Ltd 5,500,000 8,255,134 0.82China Resources Land Ltd 6,700,000 10,932,953 1.09Ctrip.com International Ltd ADR 370,000 15,504,850 1.54Hengan International Group Co Ltd 2,200,000 18,768,083 1.87Lifestyle International Holdings Ltd 5,000,000 15,410,225 1.53Longfor Properties Co Ltd 6,900,000 9,975,820 0.99Minth Group Ltd 6,100,000 6,702,438 0.67New World Department Store China Ltd 10,500,000 7,091,911 0.71SA SA International Holdings Ltd 15,000,000 11,901,633 1.19Tencent Holdings Ltd 940,000 22,302,717 2.22Uni-President China Holdings Ltd 27,000,000 15,292,203 1.52Zhongsheng Group Holdings Ltd 7,400,000 12,530,870 1.25
154,668,837 15.40
CHINA Bank of China Ltd 50,000,000 20,685,942 2.06China Life Insurance Co Ltd 3,900,000 9,781,083 0.97Dongfeng Motor Group Co Ltd 5,900,000 9,392,893 0.94Industrial & Commercial Bank of China 26,000,500 17,077,616 1.70Ping An Insurance Group Co of China Ltd 1,150,000 9,194,661 0.92Shanghai Pharmaceuticals Holding Co Ltd 7,300,000 15,152,244 1.51
81,284,439 8.10
HONG KONG AIA Group Ltd 4,300,000 15,155,900 1.51China Overseas Land & Investment Ltd 5,200,000 11,053,541 1.10China Resources Enterprise Ltd 4,500,000 18,242,115 1.82Emperor Watch & Jewellery Ltd 50,000,000 10,808,004 1.08Television Broadcasts Ltd 1,660,000 10,605,057 1.06
65,864,617 6.57
INDIA Bharti Airtel Ltd 1,200,000 10,519,222 1.05Dr Reddy's Laboratories Ltd 350,000 11,404,456 1.14ICICI Bank Ltd 710,000 13,486,921 1.34ITC Ltd 4,600,000 20,023,242 1.99Lupin Ltd 1,200,000 11,731,600 1.17State Bank of India 260,000 11,137,094 1.11Tata Motors Ltd 500,000 8,099,351 0.81Titan Industries Ltd 1,800,000 8,034,530 0.80
94,436,416 9.41
INDONESIA Astra International Tbk PT 2,080,000 16,118,597 1.60Bank Negara Indonesia Persero Tbk PT 25,600,003 12,262,980 1.22Gudang Garam Tbk PT 2,300,000 14,743,934 1.47Indofood CBP Sukses Makmur TBK PT 21,800,000 13,604,241 1.35

Invesco Asia Consumer Demand Fund
46 Invesco Funds
Statement of Investments as at 31 August 2011
Investment Nominal/Shares Market Value Net Assets USD %INDONESIA (CONTINUED) Indofood Sukses Makmur Tbk PT 13,000,000 9,331,419 0.93
66,061,171 6.57
MALAYSIA Genting Bhd 3,500,000 11,099,485 1.11RHB Capital Bhd 3,764,841 10,443,794 1.04Top Glove Corp Bhd 7,000,000 11,381,079 1.13UEM Land Holdings Bhd 13,500,000 9,390,647 0.93UOA Development Bhd 13,000,000 6,515,207 0.65
48,830,212 4.86
PHILIPPINES Cebu Air Inc 5,500,000 10,622,819 1.06
SINGAPORE CapitaLand Ltd 6,300,000 13,697,908 1.36Overseas Union Enterprise Ltd 5,600,000 11,011,873 1.10Raffles Medical Group Ltd 5,600,000 10,173,760 1.01Wilmar International Ltd 2,500,000 11,006,468 1.10Yanlord Land Group Ltd 8,600,000 6,453,387 0.64
52,343,396 5.21
SOUTH KOREA Amorepacific Corp 7,200 7,848,901 0.78Hyundai Mobis 93,000 29,355,344 2.92Hyundai Motor Co 175,000 33,339,971 3.32KB Financial Group Inc 231,000 9,554,178 0.95LG Chem Ltd 40,000 14,181,937 1.41LG Electronics Inc 100,000 6,237,990 0.62Mando Corp 100,756 17,542,697 1.75Samsung Electronics Co Ltd 37,000 25,785,723 2.57Samsung Fire & Marine Insurance Co Ltd 59,000 12,705,863 1.27Shinhan Financial Group Co Ltd 260,000 10,930,308 1.09
167,482,912 16.68
TAIWAN Asustek Computer Inc 1,800,000 15,217,436 1.52Chinatrust Financial Holding Co Ltd 15,307,949 12,479,814 1.24Hon Hai Precision Industry Co Ltd 5,451,168 13,764,396 1.37President Chain Store Corp 3,500,000 22,259,959 2.22Sanyang Industry Co Ltd 18,500,000 12,706,619 1.27Uni-President Enterprises Corp 10,864,079 16,000,551 1.59
92,428,775 9.21
THAILAND Kasikornbank PCL 3,041,000 12,911,819 1.29Minor International PCL 29,800,000 12,777,109 1.27Pruksa Real Estate PCL 13,100,000 8,283,116 0.82
33,972,044 3.38
UNITED KINGDOM Genting Singapore Plc 11,000,000 15,251,078 1.52
TOTAL EQUITIES 955,425,501 95.15
WARRANTS HONG KONG Wharf Holdings Ltd 2,900,000 18,480,404 1.84
UNITED STATES Wuliangye Yibin Co Ltd WTS 20/01/2015 1,420,467 8,996,654 0.90

Invesco Asia Consumer Demand Fund
47 Invesco Funds
Statement of Investments as at 31 August 2011
Investment Nominal/Shares Market Value Net Assets USD %
TOTAL WARRANTS 27,477,058 2.74
TOTAL TRANSFERABLE SECURITIES ADMITTED TO AN OFFICIAL STOCK EXCHANGE LISTING OR DEALT IN ON ANOTHER REGULATED MARKET 982,902,559 97.89
OPEN-ENDED FUNDS HONG KONG iShares FTSE A50 China Index ETF 10,000,000 15,176,105 1.51
TOTAL OPEN-ENDED FUNDS 15,176,105 1.51
Total Investments 998,078,664 99.40
The accompanying notes form an integral part of these financial statements.
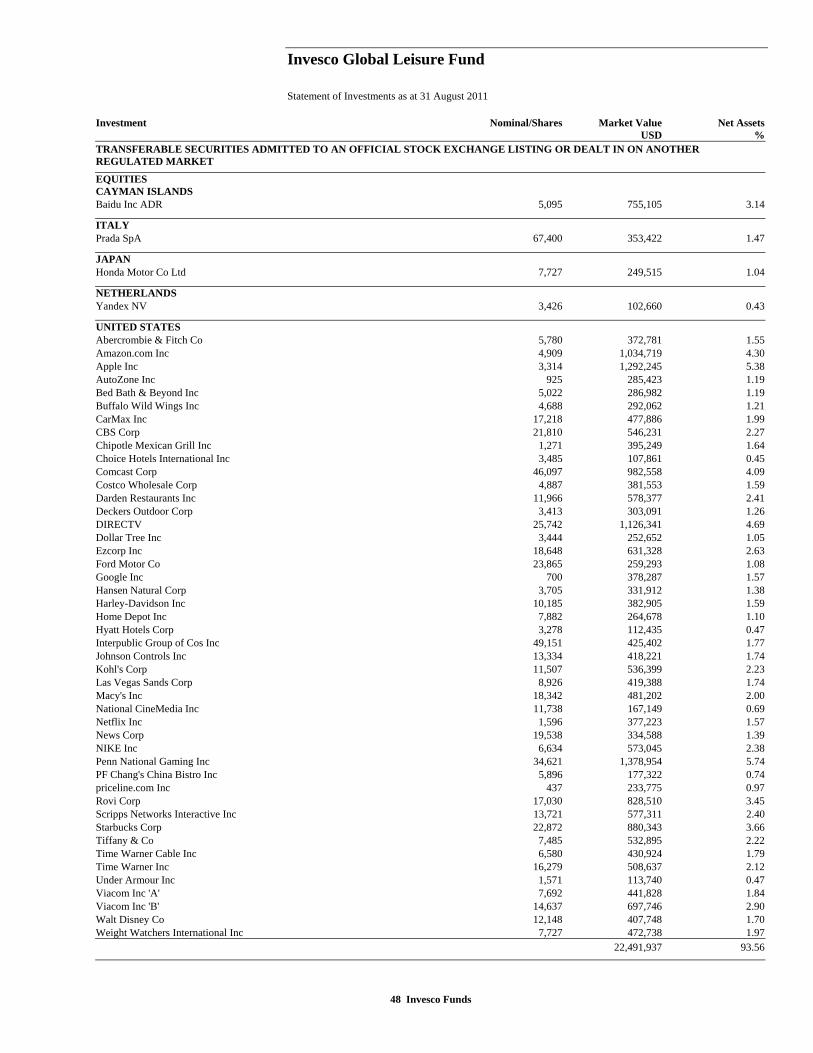
Invesco Global Leisure Fund
48 Invesco Funds
Statement of Investments as at 31 August 2011
Investment Nominal/Shares Market Value Net Assets USD %TRANSFERABLE SECURITIES ADMITTED TO AN OFFICIAL STOCK EXCHANGE LISTING OR DEALT IN ON ANOTHER REGULATED MARKET
EQUITIES CAYMAN ISLANDS Baidu Inc ADR 5,095 755,105 3.14
ITALY Prada SpA 67,400 353,422 1.47
JAPAN Honda Motor Co Ltd 7,727 249,515 1.04
NETHERLANDS Yandex NV 3,426 102,660 0.43
UNITED STATES Abercrombie & Fitch Co 5,780 372,781 1.55Amazon.com Inc 4,909 1,034,719 4.30Apple Inc 3,314 1,292,245 5.38AutoZone Inc 925 285,423 1.19Bed Bath & Beyond Inc 5,022 286,982 1.19Buffalo Wild Wings Inc 4,688 292,062 1.21CarMax Inc 17,218 477,886 1.99CBS Corp 21,810 546,231 2.27Chipotle Mexican Grill Inc 1,271 395,249 1.64Choice Hotels International Inc 3,485 107,861 0.45Comcast Corp 46,097 982,558 4.09Costco Wholesale Corp 4,887 381,553 1.59Darden Restaurants Inc 11,966 578,377 2.41Deckers Outdoor Corp 3,413 303,091 1.26DIRECTV 25,742 1,126,341 4.69Dollar Tree Inc 3,444 252,652 1.05Ezcorp Inc 18,648 631,328 2.63Ford Motor Co 23,865 259,293 1.08Google Inc 700 378,287 1.57Hansen Natural Corp 3,705 331,912 1.38Harley-Davidson Inc 10,185 382,905 1.59Home Depot Inc 7,882 264,678 1.10Hyatt Hotels Corp 3,278 112,435 0.47Interpublic Group of Cos Inc 49,151 425,402 1.77Johnson Controls Inc 13,334 418,221 1.74Kohl's Corp 11,507 536,399 2.23Las Vegas Sands Corp 8,926 419,388 1.74Macy's Inc 18,342 481,202 2.00National CineMedia Inc 11,738 167,149 0.69Netflix Inc 1,596 377,223 1.57News Corp 19,538 334,588 1.39NIKE Inc 6,634 573,045 2.38Penn National Gaming Inc 34,621 1,378,954 5.74PF Chang's China Bistro Inc 5,896 177,322 0.74priceline.com Inc 437 233,775 0.97Rovi Corp 17,030 828,510 3.45Scripps Networks Interactive Inc 13,721 577,311 2.40Starbucks Corp 22,872 880,343 3.66Tiffany & Co 7,485 532,895 2.22Time Warner Cable Inc 6,580 430,924 1.79Time Warner Inc 16,279 508,637 2.12Under Armour Inc 1,571 113,740 0.47Viacom Inc 'A' 7,692 441,828 1.84Viacom Inc 'B' 14,637 697,746 2.90Walt Disney Co 12,148 407,748 1.70Weight Watchers International Inc 7,727 472,738 1.97
22,491,937 93.56

Invesco Global Leisure Fund
49 Invesco Funds
Statement of Investments as at 31 August 2011
Investment Nominal/Shares Market Value Net Assets USD %
TOTAL EQUITIES 23,952,639 99.64
TOTAL TRANSFERABLE SECURITIES ADMITTED TO AN OFFICIAL STOCK EXCHANGE LISTING OR DEALT IN ON ANOTHER REGULATED MARKET 23,952,639 99.64
Total Investments 23,952,639 99.64
The accompanying notes form an integral part of these financial statements.

Invesco Energy Fund
50 Invesco Funds
Statement of Investments as at 31 August 2011
Investment Nominal/Shares Market Value Net Assets USD %TRANSFERABLE SECURITIES ADMITTED TO AN OFFICIAL STOCK EXCHANGE LISTING OR DEALT IN ON ANOTHER REGULATED MARKET
EQUITIES BERMUDA Kosmos Energy Ltd 151,177 2,108,919 0.55Seadrill Ltd 117,572 3,771,122 0.99
5,880,041 1.54
CANADA Canadian Natural Resources Ltd 87,966 3,261,780 0.86Suncor Energy Inc 133,350 4,229,195 1.11
7,490,975 1.97
FRANCE Total SA ADR 66,839 3,211,280 0.84
HONG KONG CNOOC Ltd 812,000 1,658,344 0.44
SWITZERLAND Weatherford International Ltd 486,488 8,243,539 2.17
UNITED KINGDOM BG Group Plc 96,817 2,051,635 0.54BP Plc ADR 22,996 905,238 0.24Ensco Plc ADR 246,790 11,898,980 3.13Royal Dutch Shell Plc ADR 102,535 6,737,062 1.77
21,592,915 5.68
UNITED STATES Anadarko Petroleum Corp 266,744 19,380,285 5.09Apache Corp 179,983 18,476,155 4.86Atwood Oceanics Inc 87,961 3,653,020 0.96Baker Hughes Inc 351,299 20,904,047 5.49Cabot Oil & Gas Corp 30,318 2,324,178 0.61Cameron International Corp 334,054 17,332,392 4.56Chevron Corp 169,096 16,640,737 4.37Complete Production Services Inc 148,932 4,359,984 1.15ConocoPhillips 128,468 8,714,627 2.29Dresser-Rand Group Inc 69,563 2,953,297 0.78EOG Resources Inc 80,042 7,373,869 1.94Exxon Mobil Corp 384,348 28,393,709 7.46FMC Technologies Inc 69,808 3,085,165 0.81Halliburton Co 477,971 20,743,941 5.45Helmerich & Payne Inc 185,930 10,520,849 2.77Hess Corp 113,532 6,604,724 1.74Key Energy Services Inc 195,172 2,784,129 0.73Lufkin Industries Inc 34,909 2,183,907 0.57Marathon Oil Corp 162,986 4,316,684 1.13Marathon Petroleum Corp 81,493 2,933,341 0.77National Oilwell Varco Inc 274,424 18,390,524 4.83Newfield Exploration Co 126,244 6,360,804 1.67Noble Energy Inc 44,400 3,857,028 1.01Occidental Petroleum Corp 214,582 18,471,219 4.86Oceaneering International Inc 116,318 4,930,720 1.30Patterson-UTI Energy Inc 192,228 4,672,102 1.23Peabody Energy Corp 125,193 6,087,510 1.60Range Resources Corp 38,008 2,482,302 0.65Rowan Cos Inc 137,100 4,917,092 1.29Schlumberger Ltd 376,601 29,116,906 7.65Southwestern Energy Co 104,734 3,936,427 1.03Superior Energy Services Inc 111,914 3,897,405 1.02Valero Energy Corp 175,450 3,860,777 1.02Whiting Petroleum Corp 62,358 2,912,742 0.77

Invesco Energy Fund
51 Invesco Funds
Statement of Investments as at 31 August 2011
Investment Nominal/Shares Market Value Net Assets USD %UNITED STATES (CONTINUED) Whiting Petroleum Corp 62,358 2,912,742 0.77
317,572,598 83.46
TOTAL EQUITIES 365,649,692 96.10
TOTAL TRANSFERABLE SECURITIES ADMITTED TO AN OFFICIAL STOCK EXCHANGE LISTING OR DEALT IN ON ANOTHER REGULATED MARKET 365,649,692 96.10
Total Investments 365,649,692 96.10
The accompanying notes form an integral part of these financial statements.

Invesco Asia Pacific Real Estate Securities Fund
52 Invesco Funds
Statement of Investments as at 31 August 2011
Investment Nominal/Shares Market Value Net Assets USD %TRANSFERABLE SECURITIES ADMITTED TO AN OFFICIAL STOCK EXCHANGE LISTING OR DEALT IN ON ANOTHER REGULATED MARKET
EQUITIES AUSTRALIA CFS Retail Property Trust 43,970 84,074 2.64Dexus Property Group 53,280 48,736 1.53Goodman Group 115,608 79,850 2.51GPT Group 16,659 55,355 1.74Investa Office Fund 74,827 49,288 1.55Stockland 44,863 142,850 4.49Westfield Group 22,280 193,577 6.08Westfield Retail Trust 35,276 98,777 3.11
752,507 23.65
CAYMAN ISLANDS Agile Property Holdings Ltd 28,000 37,788 1.19China Resources Land Ltd 20,000 32,636 1.03Country Garden Holdings Co 41,000 18,120 0.57Evergrande Real Estate Group Ltd 50,000 30,821 0.97Longfor Properties Co Ltd 5,500 7,952 0.25Shimao Property Holdings Ltd 14,500 15,216 0.48
142,533 4.49
HONG KONG China Overseas Land & Investment Ltd 58,400 124,140 3.90Hang Lung Properties Ltd 31,000 114,931 3.61Henderson Land Development Co Ltd 4,000 23,207 0.73Hongkong Land Holdings Ltd 20,000 115,500 3.63Hysan Development Co Ltd 7,000 28,377 0.89Kerry Properties Ltd 12,500 54,000 1.70Link REIT 22,000 76,695 2.41New World Development Ltd 9,000 11,476 0.36Sino Land Co Ltd 22,000 33,613 1.06Sun Hung Kai Properties Ltd 20,000 281,842 8.86
863,781 27.15
JAPAN Advance Residence Investment Corp 4 8,317 0.26Aeon Mall Co Ltd 1,200 26,995 0.85Frontier Real Estate Investment Corp 3 27,625 0.87Japan Prime Realty Investment Corp 11 30,524 0.96Japan Real Estate Investment Corp 7 70,580 2.22Japan Retail Fund Investment Corp 6 8,994 0.28Kenedix Realty Investment Corp 1 3,539 0.11Mitsubishi Estate Co Ltd 12,000 196,097 6.16Mitsui Fudosan Co Ltd 10,000 167,200 5.26Nippon Building Fund Inc 7 75,011 2.36Orix JREIT Inc 3 14,468 0.45Sumitomo Realty & Development Co Ltd 6,000 125,889 3.96Tokyu Land Corp 5,000 20,329 0.64United Urban Investment Corp 31 37,225 1.17
812,793 25.55
SINGAPORE Ascendas Real Estate Investment Trust 16,000 28,070 0.88CapitaCommercial Trust 28,000 27,879 0.88CapitaLand Ltd 34,000 73,925 2.32

Invesco Asia Pacific Real Estate Securities Fund
53 Invesco Funds
Statement of Investments as at 31 August 2011
Investment Nominal/Shares Market Value Net Assets USD %SINGAPORE (CONTINUED) CapitaMall Trust 43,530 67,591 2.12CapitaMalls Asia Ltd 16,000 18,059 0.57City Developments Ltd 4,000 33,508 1.05Global Logistic Properties Ltd 33,000 45,890 1.44Keppel Land Ltd 11,000 28,216 0.89Suntec Real Estate Investment Trust 33,000 36,973 1.16
360,111 11.31
TOTAL EQUITIES 2,931,725 92.15
TOTAL TRANSFERABLE SECURITIES ADMITTED TO AN OFFICIAL STOCK EXCHANGE LISTING OR DEALT IN ON ANOTHER REGULATED MARKET 3,052,166 95.94
OTHER TRANSFERABLE SECURITIES
EQUITIES AUSTRALIA BGP Holdings 214,552 – –
TOTAL EQUITIES – –
TOTAL OTHER TRANSFERABLE SECURITIES – –
Total Investments 3,052,166 95.94
The accompanying notes form an integral part of these financial statements.

Invesco Global Income Real Estate Securities Fund
54 Invesco Funds
Statement of Investments as at 31 August 2011
Investment Nominal/Shares Market Value Net Assets USD %TRANSFERABLE SECURITIES ADMITTED TO AN OFFICIAL STOCK EXCHANGE LISTING OR DEALT IN ON ANOTHER REGULATED MARKET
EQUITIES AUSTRALIA BWP Trust 26,680 49,520 0.53CFS Retail Property Trust 63,803 121,997 1.32Challenger Diversified Property Group 102,124 55,286 0.60Charter Hall Group 8,156 17,009 0.18Charter Hall Retail REIT 28,498 100,165 1.08Commonwealth Property Office Fund 21,040 21,602 0.23Dexus Property Group 83,865 76,712 0.83Goodman Group 107,171 74,023 0.80Investa Office Fund 112,055 73,810 0.80Mirvac Group 15,150 19,433 0.21Stockland 31,566 100,511 1.08Westfield Group 8,095 70,333 0.76Westfield Retail Trust 12,508 35,024 0.38
815,425 8.80
BELGIUM Befimmo SCA Sicafi 323 26,782 0.29Intervest Offices 948 28,843 0.31
55,625 0.60
CANADA Artis REIT 5,400 75,294 0.81Canadian Apartment Properties REIT 5,700 119,666 1.29Chartwell Seniors Housing REIT 18,800 137,637 1.49Cominar REIT 5,400 120,999 1.31Dundee REIT 3,100 101,236 1.09Morguard REIT 1,300 19,877 0.21Primaris Retail REIT 4,700 98,192 1.06RioCan REIT 2,400 62,201 0.67
735,102 7.93
CAYMAN ISLANDS Soho China Ltd 152,000 133,765 1.44
FINLAND Sponda OYJ 5,469 25,225 0.27
FRANCE Fonciere Des Regions 2,065 171,623 1.85Gecina SA 537 59,949 0.65Mercialys SA 1,572 65,115 0.70Societe de la Tour Eiffel 796 60,336 0.65Societe Immobiliere de Location pour l'Industrie et le Commerce 159 18,614 0.20Unibail-Rodamco SE 2,230 478,794 5.17
854,431 9.22
GERMANY Alstria Office REIT-AG 6,748 89,887 0.97Deutsche Euroshop AG 1,879 73,790 0.80
163,677 1.77
HONG KONG Link REIT 30,000 104,584 1.13
JAPAN Advance Residence Investment Corp 29 60,298 0.65Japan Prime Realty Investment Corp 28 77,698 0.84Japan Real Estate Investment Corp 4 40,332 0.44Japan Retail Fund Investment Corp 6 8,994 0.10Nippon Building Fund Inc 2 21,432 0.23Orix JREIT Inc 12 57,874 0.62

Invesco Global Income Real Estate Securities Fund
55 Invesco Funds
Statement of Investments as at 31 August 2011
Investment Nominal/Shares Market Value Net Assets USD %JAPAN (CONTINUED) United Urban Investment Corp 65 78,053 0.84
344,681 3.72
NETHERLANDS Eurocommercial Properties NV 791 35,662 0.38Wereldhave NV 381 32,377 0.35
68,039 0.73
NEW ZEALAND AMP NZ Office Ltd 85,142 62,019 0.67Kiwi Income Property Trust 70,240 61,187 0.66
123,206 1.33
SINGAPORE Ascendas Real Estate Investment Trust 57,000 100,000 1.08CapitaCommercial Trust 38,000 37,836 0.41CapitaMall Trust 27,000 41,924 0.45Fortune Real Estate Investment Trust 163,000 78,414 0.85Frasers Centrepoint Trust 17,000 20,283 0.22Starhill Global REIT 73,000 37,784 0.41
316,241 3.42
SOUTH AFRICA Fountainhead Property Trust 102,662 97,902 1.06
SWEDEN Castellum AB 2,933 42,508 0.46
UNITED KINGDOM British Land Co Plc 10,868 94,289 1.02Land Securities Group Plc 10,970 128,715 1.39Segro Plc 20,169 83,952 0.91
306,956 3.32
UNITED STATES Acadia Realty Trust 765 16,283 0.18Digital Realty Trust Inc 800 47,908 0.52Government Properties Income Trust 3,400 78,591 0.85Healthcare Realty Trust Inc 2,300 40,307 0.43National Retail Properties Inc 1,800 48,132 0.52Piedmont Office Realty Trust Inc 2,500 46,762 0.50Senior Housing Properties Trust 2,100 49,171 0.53Urstadt Biddle Properties Inc 3,700 61,364 0.66
388,518 4.19
TOTAL EQUITIES 4,575,885 49.39
BONDS BRAZIL BR Properties SA 9% USD Perpetual 150,000 152,250 1.64
UNITED KINGDOM Hammerson Plc 4.875% EUR 19/06/2015 100,000 150,095 1.62
UNITED STATES Corporate Office Properties Trust 7.625% USD Perpetual 2,600 65,422 0.71Entertainment Properties Trust 9% USD Perpetual 3,900 108,591 1.17Kilroy Realty Corp 7.5% USD Perpetual 4,100 102,110 1.10Kilroy Realty Corp 7.8% USD Perpetual 8,300 209,243 2.26LaSalle Hotel Properties 7.25% USD Perpetual 6,700 160,532 1.73LaSalle Hotel Properties 7.5% USD Perpetual 3,400 82,637 0.89LaSalle Hotel Properties 7.5% USD Perpetual 1,200 29,022 0.31National Retail Properties Inc 7.375% USD Perpetual 4,000 101,650 1.10Omega Healthcare Investors Inc 6.75% USD 15/10/2022 50,000 48,062 0.52PS Business Parks Inc 6.7% USD Perpetual 4,400 111,144 1.20PS Business Parks Inc 6.875% USD Perpetual 4,600 117,668 1.27

Invesco Global Income Real Estate Securities Fund
56 Invesco Funds
Statement of Investments as at 31 August 2011
Investment Nominal/Shares Market Value Net Assets USD %UNITED STATES (CONTINUED) PS Business Parks Inc 7.2% USD Perpetual 1,600 40,448 0.44PS Business Parks Inc 7.375% USD Perpetual 8,600 218,397 2.36Public Storage 6.625% USD Perpetual 6,700 170,733 1.84Public Storage 6.75% USD Perpetual 6,900 174,950 1.89Public Storage 6.875% USD Perpetual 2,100 57,782 0.62Realty Income Corp 6.75% USD Perpetual 4,400 111,639 1.20SL Green Realty Corp 7.875% USD Perpetual 14,900 379,205 4.09Sunstone Hotel Investors Inc 8% USD Perpetual 4,000 90,446 0.98Sunstone Hotel Investors Inc 8% USD Perpetual 4,200 99,099 1.07Vornado Realty Trust 6.625% USD Perpetual 3,800 94,715 1.02Vornado Realty Trust 7% USD Perpetual 6,100 155,733 1.68
2,729,228 29.45
TOTAL BONDS 3,031,573 32.71
TOTAL TRANSFERABLE SECURITIES ADMITTED TO AN OFFICIAL STOCK EXCHANGE LISTING OR DEALT IN ON ANOTHER REGULATED MARKET 7,607,458 82.10
OTHER TRANSFERABLE SECURITIES
EQUITIES AUSTRALIA BGP Holdings 187,667 – –
TOTAL EQUITIES – –
BONDS AUSTRALIA Stockland Trust Management Ltd 7.5% AUD 01/07/2016 150,000 166,218 1.79Westfield Retail Trust 7% AUD 18/10/2016 100,000 109,154 1.18
275,372 2.97
UNITED STATES Bank of America Lar Loan 0.516% USD 15/10/2019 100,000 95,529 1.03Bear Stearns Commercial Mortgage Securities 5.511% USD 12/04/2038 100,000 90,446 0.98DLJ Commercial Mortgage Corp 7.459% USD 10/06/2031 45,000 47,730 0.51GS Mortgage Securities 5.309% USD 10/01/2040 100,000 93,369 1.01JPMorgan Chase 8.369% USD 12/10/2037 65,696 68,014 0.73LB-UBS Commercial Mortgage Trust 4.31% USD 15/02/2030 7,494 7,505 0.08LB-UBS Commercial Mortgage Trust 5.081% USD 15/01/2036 90,000 91,570 0.99Merrill Lynch Collaterised Mortgage Obligations 0.446% USD 15/06/2022 50,000 47,886 0.52Merrill Lynch Trust 0.476% USD 15/06/2022 75,000 70,253 0.76Senior Housing Property Trust 4.3% USD 15/01/2016 100,000 100,169 1.08Wachovia Bank Commercial Mortgage Trust 0.396% USD 15/09/2021 50,000 47,165 0.51Wachovia Bank Commercial Mortgage Trust 4.107% USD 15/06/2035 20,000 19,964 0.22Wachovia Bank Commercial Mortgage Trust 6.043% USD 15/10/2041 44,000 42,737 0.46
822,337 8.88
TOTAL BONDS 1,097,709 11.85
TOTAL OTHER TRANSFERABLE SECURITIES 1,534,670 16.56
Total Investments 9,142,128 98.66
The accompanying notes form an integral part of these financial statements.

Invesco Gold & Precious Metals Fund
57 Invesco Funds
Statement of Investments as at 31 August 2011
Investment Nominal/Shares Market Value Net Assets USD %TRANSFERABLE SECURITIES ADMITTED TO AN OFFICIAL STOCK EXCHANGE LISTING OR DEALT IN ON ANOTHER REGULATED MARKET
EQUITIES AUSTRALIA BHP Billiton Ltd ADR 3,216 270,224 1.01Newcrest Mining Ltd 25,012 1,072,830 4.03
1,343,054 5.04
CANADA Agnico-Eagle Mines Ltd 12,925 899,386 3.37Alamos Gold Inc 14,392 279,310 1.05Aurizon Mines Ltd 126,274 804,365 3.02Barrick Gold Corp 23,363 1,188,709 4.46Cameco Corp 16,392 377,590 1.42Centerra Gold Inc 20,501 435,941 1.63Detour Gold Corp 33,130 1,236,574 4.64Eldorado Gold Corp 50,910 1,002,831 3.76Franco-Nevada Corp 15,535 673,603 2.53Goldcorp Inc 28,286 1,480,207 5.54Harry Winston Diamond Corp 15,372 235,668 0.88IAMGOLD Corp 58,873 1,221,561 4.58International Tower Hill Mines Ltd 32,319 267,117 1.00Kinross Gold Corp 22,245 388,022 1.45Minefinders Corp 65,183 1,061,505 3.98New Gold Inc 45,932 628,491 2.36Osisko Mining Corp 65,485 960,516 3.60Pan American Silver Corp 22,177 727,516 2.73Queenston Mining Inc 33,489 203,317 0.76Silver Wheaton Corp 35,115 1,393,890 5.22Tahoe Resources Inc 28,068 532,696 2.00Yamana Gold Inc 91,599 1,464,210 5.48
17,463,025 65.46
PERU Cia de Minas Buenaventura SA ADR 3,258 153,436 0.58
SOUTH AFRICA Gold Fields Ltd ADR 38,269 633,161 2.37Harmony Gold Mining Co Ltd ADR 15,595 206,556 0.77Impala Platinum Holdings Ltd 16,218 415,185 1.56
1,254,902 4.70
UNITED KINGDOM Randgold Resources Ltd ADR 10,078 1,059,802 3.97
UNITED STATES Coeur d'Alene Mines Corp 5,447 157,282 0.59Freeport-McMoRan Copper & Gold Inc 19,314 899,550 3.37Newmont Mining Corp 21,925 1,384,453 5.19Stillwater Mining Co 48,879 772,533 2.90
3,213,818 12.05
TOTAL EQUITIES 24,488,037 91.80
STRUCTURED PRODUCTS IRELAND Source Physical Markets Gold P-ETC 7,426 1,351,606 5.07
TOTAL STRUCTURED PRODUCTS 1,351,606 5.07
TOTAL TRANSFERABLE SECURITIES ADMITTED TO AN OFFICIAL STOCK EXCHANGE LISTING OR DEALT IN ON ANOTHER REGULATED MARKET 25,839,643 96.87
Total Investments 25,839,643 96.87
The accompanying notes form an integral part of these financial statements

Invesco USD Reserve Fund
58 Invesco Funds
Statement of Investments as at 31 August 2011
Investment Nominal/Shares Market Value Net Assets USD %OTHER TRANSFERABLE SECURITIES BONDS Svenska Handelsbanken FRN USD 08/06/2017 3,000,000 3,000,000 2.87Westpac Banking Corp FRN USD 15/06/2012 3,000,000 3,020,758 2.90
TOTAL BONDS 6,020,758 5.77
TOTAL OTHER TRANSFERABLE SECURITIES 6,020,758 5.77
MONEY MARKET INSTRUMENTS ELIGIBLE UNDER ARTICLE 41.1H OF THE LAW OF 20 DECEMBER 2002 Anz National C/P USD 31/01/2012 3,500,000 3,494,838 3.35Asb Finance C/P USD 12/10/2011 4,000,000 3,998,973 3.83Bank Of Western Australia C/P USD 26/09/2011 3,500,000 3,499,369 3.35Banque Et Caisse C/P USD 02/09/2011 4,000,000 3,999,916 3.83BCEE C/P USD 25/11/2011 4,000,000 3,996,657 3.83BNP Paribas C/P USD 18/10/2011 3,000,000 2,998,403 2.87Caisse Des Depots C/P USD 21/12/2011 4,000,000 3,995,901 3.83Credit Suisse C/P USD 08/11/2011 3,500,000 3,498,325 3.35National Australia Bank C/D USD 08/09/2011 3,000,000 2,999,741 2.88Nederlandse Waterschapsbank C/P USD 30/11/2011 4,000,000 3,996,902 3.83Rabobank Nederland Australia C/P USD 01/09/2011 3,500,000 3,499,961 3.36
TOTAL MONEY MARKET INSTRUMENTS ELIGIBLE UNDER ARTICLE 41.1H OF THE LAW OF 20 DECEMBER 2002 39,978,986 38.31
OPEN-ENDED FUNDS Short-Term Investments Co Global Series - US Dollar Liquidity Portfolio 10,000,000 10,000,000 9.58
TOTAL OPEN-ENDED FUNDS 10,000,000 9.58
Total Investments 55,999,744 53.66
The accompanying notes form an integral part of these financial statements.

Invesco Euro Reserve Fund
59 Invesco Funds
Statement of Investments as at 31 August 2011
Investment Nominal/Shares Market Value Net Assets EUR %MONEY MARKET INSTRUMENTS ELIGIBLE UNDER ARTICLE 41.1H OF THE LAW OF 20 DECEMBER 2002 Argento C/P EUR 09/09/2011 15,000,000 14,994,609 2.90Banco Bilbao Vizcaya Argent C/P EUR 07/09/2011 20,000,000 19,995,917 3.86Cancara Asset Securitisation C/P EUR 22/09/2011 20,000,000 19,983,635 3.86Fms Wert C/P EUR 20/09/2011 20,000,000 19,989,782 3.86Grampian Funding C/P EUR 17/10/2011 5,000,000 4,990,690 0.96HSBC Bank C/D EUR 07/09/2011 15,000,000 15,000,014 2.90Lexington Parker Capital C/P EUR 09/09/2011 15,000,000 14,994,944 2.90LMA C/P EUR 12/09/2011 20,000,000 19,990,343 3.86Matchpoint Fin C/P EUR 26/09/2011 20,000,000 19,979,379 3.86Mont Blanc Capital C/P EUR 08/09/2011 9,583,000 9,579,851 1.85Mont Blanc Capital C/P EUR 14/09/2011 10,000,000 9,994,367 1.93Nordea Bank C/P EUR 30/09/2011 15,000,000 14,983,056 2.89Rabobank Nederlands C/P EUR 25/11/2011 20,000,000 19,952,812 3.86Sheffield Receivables C/P EUR 09/09/2011 11,000,000 10,996,704 2.12Sheffield Receivables C/P EUR 09/11/2011 5,000,000 4,984,992 0.96Societe Generale C/P EUR 05/09/2011 10,000,000 9,998,224 1.93Solitaire Funding C/P EUR 19/09/2011 10,000,000 9,993,041 1.93Solitaire Funding C/P EUR 22/09/2011 15,000,000 14,988,003 2.90Svenska Handelsbanken C/P EUR 12/09/2011 8,000,000 7,997,017 1.55Svenska Handelsbanken C/P EUR 16/11/2011 10,000,000 9,973,352 1.93Svenska Handelsbanken C/P EUR 21/11/2011 5,000,000 4,982,543 0.96Thames Asset Gbl C/P EUR 19/09/2011 15,000,000 14,989,325 2.90
TOTAL MONEY MARKET INSTRUMENTS ELIGIBLE UNDER ARTICLE 41.1H OF THE LAW OF 20 DECEMBER 2002 293,332,600 56.67
OPEN-ENDED FUNDS Short-Term Investments Co Global Series - Euro Liquidity Portfolio 50,000,000 50,000,000 9.66
TOTAL OPEN-ENDED FUNDS 50,000,000 9.66
Total Investments 343,332,600 66.33
The accompanying notes form an integral part of these financial statements.

Invesco Global Bond Fund
60 Invesco Funds
Statement of Investments as at 31 August 2011
Investment Nominal/Shares Market Value Net Assets USD %TRANSFERABLE SECURITIES ADMITTED TO AN OFFICIAL STOCK EXCHANGE LISTING OR DEALT IN ON ANOTHER REGULATED MARKET
BONDS Abbey National Treasury Services Plc 5.75% GBP 02/03/2026 250,000 439,051 1.20Bank of America Corp FRN EUR 23/05/2017 200,000 233,841 0.64Barclays Bank Plc 5.75% GBP 17/08/2021 500,000 819,232 2.25Belgium Government Bond 3.25% EUR 28/09/2016 600,000 867,701 2.38BNP Paribas SA FRN EUR Perpetual 200,000 278,712 0.76Bundesobligation 2.5% EUR 10/10/2014 1,000,000 1,515,138 4.16Bundesrepublik Deutschland 2.5% EUR 04/01/2021 2,000,000 2,990,663 8.21Bundesrepublik Deutschland 3.25% EUR 04/07/2042 500,000 754,144 2.07European Financial Stability Facility 2.75% EUR 18/07/2016 500,000 740,956 2.03European Financial Stability Facility 2.75% EUR 05/12/2016 1,000,000 1,479,011 4.06European Union 2.5% EUR 04/12/2015 1,000,000 1,478,939 4.06FCE Bank Plc 7.125% EUR 15/01/2013 100,000 145,270 0.40FMS Wertmanagement 3.375% EUR 17/06/2021 1,000,000 1,492,307 4.10Goldman Sachs Group Inc 4.5% EUR 23/05/2016 300,000 424,390 1.16HBOS Plc FRN AUD 01/05/2017 1,000,000 852,202 2.34Instituto de Credito Oficial 6% EUR 08/03/2021 250,000 366,306 1.01JPMorgan Chase & Co 4.95% USD 25/03/2020 750,000 792,767 2.18JPMorgan Chase & Co FRN GBP 30/05/2017 250,000 388,589 1.07LBG Capital No.1 Plc 7.588% GBP 12/05/2020 250,000 315,408 0.87Lloyds TSB Bank Plc 3.375% EUR 17/03/2015 500,000 737,607 2.02Lloyds TSB Bank Plc 5.8% USD 13/01/2020 250,000 245,096 0.67Merrill Lynch & Co Inc 5.75% GBP 12/12/2014 300,000 491,041 1.35Morgan Stanley 5.5% USD 26/01/2020 500,000 498,257 1.37Northern Rock Asset Management Plc 5.625% USD 22/06/2017 1,000,000 1,084,825 2.98Portugal Telecom International Finance BV 6% EUR 30/04/2013 200,000 281,175 0.77Royal Bank of Scotland FRN USD 11/04/2016 250,000 198,958 0.55Royal Bank of Scotland Plc 3.625% EUR 17/05/2013 500,000 716,880 1.97Spain Government Bond 5.5% EUR 30/04/2021 500,000 747,135 2.05United States Treasury Note/Bond 2.625% USD 15/08/2020 1,000,000 1,052,559 2.89United States Treasury Note/Bond 3.5% USD 15/05/2020 1,000,000 1,129,629 3.10United States Treasury Note/Bond 4.625% USD 15/02/2017 800,000 951,625 2.61UPCB Finance II Ltd 6.375% EUR 01/07/2020 200,000 256,487 0.70Yorkshire Building Society 4.75% GBP 12/04/2018 400,000 688,418 1.89
TOTAL BONDS 25,454,319 69.87
TOTAL TRANSFERABLE SECURITIES ADMITTED TO AN OFFICIAL STOCK EXCHANGE LISTING OR DEALT IN ON ANOTHER REGULATED MARKET 25,454,319 69.87
OTHER TRANSFERABLE SECURITIES BONDS United States Treasury Note/Bond 3.125% USD 15/05/2021 1,000,000 1,087,227 2.99United States Treasury Note/Bond 3.75% USD 15/08/2041 500,000 520,312 1.43United States Treasury Note/Bond 3.875% USD 15/08/2040 1,000,000 1,063,867 2.92United States Treasury Note/Bond 4.375% USD 15/05/2041 1,000,000 1,159,141 3.18United States Treasury Note/Bond 4.5% USD 15/08/2039 1,000,000 1,181,289 3.24
TOTAL BONDS 5,011,836 13.76
OPTIONS Euro Put USD Option 1.35 EUR 08/12/2011 2,500,000 33,178 0.09
TOTAL OPTIONS 33,178 0.09
TOTAL OTHER TRANSFERABLE SECURITIES 5,045,014 13.85
Total Investments 30,499,333 83.72
The accompanying notes form an integral part of these financial statements.

Invesco European Bond Fund
61 Invesco Funds
Statement of Investments as at 31 August 2011
Investment Nominal/Shares Market Value Net Assets EUR %TRANSFERABLE SECURITIES ADMITTED TO AN OFFICIAL STOCK EXCHANGE LISTING OR DEALT IN ON ANOTHER REGULATED MARKET
BONDS Abbey National Treasury Services Plc 3.375% EUR 08/06/2015 650,000 657,894 1.22Abbey National Treasury Services Plc 3.375% EUR 20/10/2015 270,000 261,124 0.48Allianz Finance II BV FRN EUR 08/07/2041 200,000 170,440 0.32Anheuser-Busch InBev NV 7.375% EUR 30/01/2013 300,000 321,983 0.60ArcelorMittal 8.25% EUR 03/06/2013 350,000 373,923 0.69ArcelorMittal 9.375% EUR 03/06/2016 185,000 211,763 0.39ASML Holding NV 5.75% EUR 13/06/2017 300,000 318,084 0.59BAA Funding Ltd 6.25% GBP 10/09/2018 380,000 456,074 0.85Banca Monte dei Paschi di Siena SpA 4.125% EUR 11/11/2013 350,000 343,030 0.64Banco Santander Totta SA 3.75% EUR 12/06/2012 400,000 393,970 0.73Bank of America Corp 7% EUR 15/06/2016 400,000 422,380 0.78Bankia SAU 4.875% EUR 31/03/2014 200,000 199,734 0.37BBVA Senior Finance SAU 4% EUR 22/03/2013 400,000 398,612 0.74BBVA Subordinated Capital SAU FRN GBP 11/03/2018 200,000 211,176 0.39British Telecommunications Plc 6.5% EUR 07/07/2015 200,000 225,346 0.42Bundesrepublik Deutschland 3.25% EUR 04/07/2021 8,570,000 9,411,360 17.49Bundesrepublik Deutschland 3.25% EUR 04/07/2042 4,070,000 4,252,255 7.90Bundesrepublik Deutschland 4% EUR 04/01/2037 250,000 291,235 0.54CaixaBank 3.125% EUR 16/09/2013 200,000 196,648 0.37Casino Guichard Perrachon SA 4.481% EUR 12/11/2018 200,000 202,018 0.38Cloverie Plc for Zurich Insurance Co Ltd FRN EUR 24/07/2039 150,000 158,977 0.30Coca-Cola Enterprises Inc 3.125% EUR 29/09/2017 700,000 704,287 1.31Co-Operative Group Ltd 5.625% GBP 08/07/2020 400,000 464,845 0.86Crh Finance UK Plc 8.25% GBP 24/04/2015 300,000 392,794 0.73EDP Finance BV 4.25% EUR 12/06/2012 260,000 257,963 0.48Enel Finance International NV 5% EUR 12/07/2021 270,000 268,635 0.50European Investment Bank 2.5% CHF 08/02/2019 1,200,000 1,110,830 2.06European Investment Bank 3% EUR 28/09/2022 1,550,000 1,548,249 2.88F Van Lanschot Bankiers NV 3.5% EUR 02/04/2013 500,000 501,850 0.93F Van Lanschot Bankiers NV 4.625% EUR 22/04/2014 150,000 155,014 0.29FCE Bank Plc 5.125% GBP 16/11/2015 50,000 51,357 0.10Glencore Finance Europe SA 5.25% EUR 11/10/2013 400,000 414,216 0.77HIT Finance BV 5.75% EUR 09/03/2018 200,000 203,758 0.38Hungary Government Bond 6.75% HUF 24/11/2017 758,530,000 2,753,621 5.12Infinis Plc 9.125% GBP 15/12/2014 110,000 128,350 0.24ING Bank NV 3% EUR 30/09/2014 550,000 566,274 1.05International Power Finance 2010 Plc 7.25% EUR 11/05/2017 200,000 229,002 0.43Intesa Sanpaolo SpA 3.25% EUR 01/02/2013 500,000 491,303 0.91Intesa Sanpaolo SpA 6.625% EUR 08/05/2018 150,000 139,623 0.26IPIC GMTN Ltd 5.875% EUR 14/03/2021 250,000 257,666 0.48ISS Financing Plc 11% EUR 15/06/2014 250,000 261,476 0.49Italy Buoni Poliennali Del Tesoro 4.75% EUR 01/02/2013 800,000 815,164 1.51Italy Buoni Poliennali Del Tesoro 4.75% EUR 01/09/2021 60,000 58,567 0.11Italy Buoni Poliennali Del Tesoro 5% EUR 01/09/2040 1,730,000 1,477,740 2.75Jaguar Land Rover Plc 8.125% GBP 15/05/2018 100,000 100,427 0.19Jyske Bank A/S FRN EUR 25/11/2013 400,000 398,514 0.74Lloyds TSB Bank Plc 4.5% EUR 15/09/2014 600,000 605,202 1.12Merrill Lynch & Co Inc 5.5% GBP 22/11/2021 300,000 272,381 0.51Morgan Stanley 5.375% EUR 10/08/2020 250,000 243,296 0.45Nalco Co 6.875% EUR 15/01/2019 200,000 218,286 0.41Nokia OYJ 6.75% EUR 04/02/2019 175,000 181,850 0.34Permanent Master Issuer Plc FRN EUR 15/07/2042 350,000 351,668 0.65Poland Government Bond 5% PLN 25/04/2016 10,590,000 2,552,751 4.74Royal Bank of Scotland Plc 6.934% EUR 09/04/2018 700,000 612,024 1.14Santander Finance Preferred SA Unipersonal FRN GBP Perpetual 200,000 225,875 0.42Santander International Debt SA Unipersonal 3.75% EUR 28/02/2013 200,000 198,548 0.37Schiphol Nederland BV 4.43% EUR 28/04/2021 200,000 213,151 0.40Scottish & Southern Energy Plc FRN GBP Perpetual 200,000 220,927 0.41

Invesco European Bond Fund
62 Invesco Funds
Statement of Investments as at 31 August 2011
Investment Nominal/Shares Market Value Net Assets EUR %BONDS (CONTINUED) SNS Bank NV 6.25% EUR 26/10/2020 260,000 198,667 0.37Societa Iniziative Autostradali e Servizi SpA 4.5% EUR 26/10/2020 350,000 328,279 0.61Societe Generale SA FRN EUR Perpetual 250,000 200,390 0.37Suez Environnement Co FRN EUR Perpetual 250,000 237,731 0.44Sweden Government Bond 5.5% SEK 08/10/2012 7,120,000 810,013 1.50Telefonica Emisiones SAU 4.75% EUR 07/02/2017 300,000 299,241 0.56Telefonica Emisiones SAU 5.496% EUR 01/04/2016 200,000 207,373 0.38UniCredit Bank AG 6% EUR 05/02/2014 400,000 410,422 0.76United Kingdom Gilt 4.25% GBP 07/12/2055 1,870,000 2,295,107 4.26United Kingdom Gilt 4.5% GBP 07/12/2042 1,810,000 2,284,925 4.25United Kingdom Gilt Inflation Linked 2.5% GBP 16/08/2013 300,000 964,862 1.79
TOTAL BONDS 47,362,520 88.01
TOTAL TRANSFERABLE SECURITIES ADMITTED TO AN OFFICIAL STOCK EXCHANGE LISTING OR DEALT IN ON ANOTHER REGULATED MARKET 47,362,520 88.01
Total Investments 47,362,520 88.01
The accompanying notes form an integral part of these financial statements.

Invesco Absolute Return Bond Fund
63 Invesco Funds
Statement of Investments as at 31 August 2011
Investment Nominal/Shares Market Value Net Assets EUR %TRANSFERABLE SECURITIES ADMITTED TO AN OFFICIAL STOCK EXCHANGE LISTING OR DEALT IN ON ANOTHER REGULATED MARKET
BONDS Abbey National Treasury Services Plc 3.375% EUR 20/10/2015 150,000 145,069 0.77American Financial Group Inc 9.875% USD 15/06/2019 150,000 131,748 0.70ArcelorMittal 9.375% EUR 03/06/2016 100,000 114,466 0.61ASML Holding NV 5.75% EUR 13/06/2017 150,000 159,042 0.85Australia Government Bond 5.75% AUD 15/05/2021 2,000,000 1,637,332 8.71Banca Monte dei Paschi di Siena SpA 4.125% EUR 11/11/2013 150,000 147,013 0.78Banco Santander Chile 2.875% USD 13/11/2012 200,000 139,663 0.74Bank of America Corp 7% EUR 15/06/2016 100,000 105,595 0.56Bankia SAU 4.875% EUR 31/03/2014 200,000 199,734 1.06BBVA Senior Finance SAU 4% EUR 22/03/2013 200,000 199,306 1.06BBVA Subordinated Capital SAU FRN GBP 11/03/2018 100,000 105,588 0.56BNP Paribas Home Loan Covered Bonds SFH 2.25% EUR 01/10/2012 400,000 401,976 2.14Bundesobligation 2.25% EUR 11/04/2014 520,000 540,678 2.87Bundesobligation 4.25% EUR 12/10/2012 1,650,000 1,715,398 9.12Bundesrepublik Deutschland 2.5% EUR 04/01/2021 40,000 41,432 0.22Bundesrepublik Deutschland 4% EUR 04/01/2037 100,000 116,494 0.62Bundesschatzanweisungen 1.25% EUR 16/12/2011 3,320,000 3,328,300 17.69Bundesschatzanweisungen 1.5% EUR 15/03/2013 390,000 395,031 2.10Commerzbank AG 2.75% EUR 13/01/2012 400,000 402,110 2.14Crown European Holdings SA 7.125% EUR 15/08/2018 100,000 95,750 0.51EDP Finance BV 4.25% EUR 12/06/2012 180,000 178,590 0.95Empresa Nacional del Petroleo 5.25% USD 10/08/2020 150,000 109,885 0.58European Investment Bank 6.5% NZD 10/09/2014 60,000 37,671 0.20FCE Bank Plc 5.125% GBP 16/11/2015 50,000 51,357 0.27Gerresheimer AG 5% EUR 19/05/2018 100,000 96,480 0.51Gold Fields Orogen Holding BVI Ltd 4.875% USD 07/10/2020 250,000 164,712 0.88HIT Finance BV 5.75% EUR 09/03/2018 100,000 101,879 0.54Hutchison Ports UK Finance Plc 6.75% GBP 07/12/2015 150,000 193,219 1.03Infinis Plc 9.125% GBP 15/12/2014 75,000 87,512 0.47ING Bank NV 3% EUR 30/09/2014 350,000 360,356 1.92IPIC GMTN Ltd 5.875% EUR 14/03/2021 200,000 206,133 1.10ISS Financing Plc 11% EUR 15/06/2014 130,000 135,968 0.72Jaguar Land Rover Plc 8.125% GBP 15/05/2018 100,000 100,427 0.53Japan Government Ten Year Bond 1.4% JPY 20/09/2019 110,000,000 1,045,205 5.56Japan Government Twenty Year Bond 2% JPY 20/06/2025 50,700,000 489,606 2.60Jyske Bank A/S FRN EUR 25/11/2013 200,000 199,257 1.06Lloyds TSB Bank Plc 4.5% EUR 15/09/2014 100,000 100,867 0.54Noble Energy Inc 6% USD 01/03/2041 100,000 75,193 0.40Nokia OYJ 6.75% EUR 04/02/2019 100,000 103,914 0.55Poland Government Bond 5% PLN 25/04/2016 5,760,000 1,388,465 7.38Royal Bank of Scotland Plc 6.934% EUR 09/04/2018 100,000 87,432 0.47Santander International Debt SA Unipersonal 3.75% EUR 28/02/2013 100,000 99,274 0.53Schiphol Nederland BV 4.43% EUR 28/04/2021 200,000 213,151 1.13Scottish & Southern Energy Plc FRN GBP Perpetual 100,000 110,463 0.59Societe Generale SA 5.2% USD 15/04/2021 200,000 126,709 0.67Societe Generale SA FRN GBP Perpetual 100,000 90,210 0.48Telefonica Emisiones SAU 4.75% EUR 07/02/2017 100,000 99,747 0.53UniCredit International Bank Luxembourg SA FRN GBP Perpetual 50,000 42,006 0.22United Kingdom Gilt 3.75% GBP 07/09/2019 140,000 174,696 0.93
TOTAL BONDS 16,392,109 87.15
TOTAL TRANSFERABLE SECURITIES ADMITTED TO AN OFFICIAL STOCK EXCHANGE LISTING OR DEALT IN ON ANOTHER REGULATED MARKET 16,392,109 87.15

Invesco Absolute Return Bond Fund
64 Invesco Funds
Statement of Investments as at 31 August 2011
Investment Nominal/Shares Market Value Net Assets EUR %OTHER TRANSFERABLE SECURITIES BONDS Canadian Government Bond 4% CAD 01/06/2041 400,000 337,708 1.80Fed Natl Mtg Assoc 0% USD 31/12/2049 750,000 573,826 3.05Japanese Government CPI Linked Bond 1.4% JPY 10/06/2018 109,200,000 1,001,384 5.32Rockwood Specialties Group Inc 7.625% EUR 15/11/2014 150,000 150,375 0.80
TOTAL BONDS 2,063,293 10.97
TOTAL OTHER TRANSFERABLE SECURITIES 2,063,293 10.97
Total Investments 18,455,402 98.12
The accompanying notes form an integral part of these financial statements.

Invesco Euro Inflation-Linked Bond Fund
65 Invesco Funds
Statement of Investments as at 31 August 2011
Investment Nominal/Shares Market Value Net Assets EUR %TRANSFERABLE SECURITIES ADMITTED TO AN OFFICIAL STOCK EXCHANGE LISTING OR DEALT IN ON ANOTHER REGULATED MARKET
BONDS Bundesrepublik Deutschland 2.5% EUR 04/01/2021 1,780,000 1,843,733 3.42Bundesrepublik Deutschland 3% EUR 04/07/2020 1,170,000 1,264,056 2.34Bundesrepublik Deutschland Bundesobligation Inflation Linked Bond 2.25% EUR 15/04/2013 3,820,000 4,350,955 8.07Caisse d'Amortissement de la Dette Sociale 1.85% EUR 25/07/2019 2,750,000 3,328,141 6.17Caisse d'Amortissement de la Dette Sociale 3.15% EUR 25/07/2013 2,730,000 3,538,198 6.56Deutsche Bundesrepublik Inflation Linked Bond 1.5% EUR 15/04/2016 6,340,000 7,572,567 14.04Deutsche Bundesrepublik Inflation Linked Bond 1.75% EUR 15/04/2020 1,720,000 2,025,276 3.75France Government Bond OAT 1.8% EUR 25/07/2040 3,270,000 3,951,256 7.33France Government Bond OAT 2.1% EUR 25/07/2023 960,000 1,158,251 2.15France Government Bond OAT 2.25% EUR 25/07/2020 3,330,000 4,368,766 8.10France Government Bond OAT 3.15% EUR 25/07/2032 1,370,000 2,142,103 3.97Italy Buoni Poliennali Del Tesoro 2.1% EUR 15/09/2017 1,300,000 1,346,674 2.50Italy Buoni Poliennali Del Tesoro 2.35% EUR 15/09/2019 2,480,000 2,403,706 4.46Italy Buoni Poliennali Del Tesoro 2.35% EUR 15/09/2035 3,810,000 3,287,086 6.09Italy Buoni Poliennali Del Tesoro 2.55% EUR 15/09/2041 350,000 268,683 0.50Italy Buoni Poliennali Del Tesoro 2.6% EUR 15/09/2023 4,460,000 4,241,510 7.86Reseau Ferre de France 2.45% EUR 28/02/2023 2,800,000 3,690,770 6.84Veolia Environnement SA 1.75% EUR 17/06/2015 1,000,000 1,121,842 2.08
TOTAL BONDS 51,903,573 96.23
TOTAL TRANSFERABLE SECURITIES ADMITTED TO AN OFFICIAL STOCK EXCHANGE LISTING OR DEALT IN ON ANOTHER REGULATED MARKET 51,903,573 96.23
Total Investments 51,903,573 96.23
The accompanying notes form an integral part of these financial statements.

Invesco Euro Corporate Bond Fund
66 Invesco Funds
Statement of Investments as at 31 August 2011
Investment Nominal/Shares Market Value Net Assets EUR %TRANSFERABLE SECURITIES ADMITTED TO AN OFFICIAL STOCK EXCHANGE LISTING OR DEALT IN ON ANOTHER REGULATED MARKET
BONDS A2A SpA 4.5% EUR 02/11/2016 3,500,000 3,446,380 0.14Abbey National Treasury Services Plc 3.125% EUR 30/06/2014 15,000,000 15,188,625 0.61ABN Amro Bank NV FRN EUR Perpetual 9,000,000 6,304,185 0.25ABN Amro Bank NV 6.375% EUR 27/04/2021 12,000,000 11,835,120 0.48Alliander NV FRN EUR Perpetual 10,000,000 9,962,500 0.40Allianz Finance II BV FRN EUR 08/07/2041 32,500,000 27,696,500 1.11America Movil SAB de CV 3.75% EUR 28/06/2017 10,000,000 10,177,500 0.41Anheuser-Busch InBev NV 4% EUR 26/04/2018 7,000,000 7,320,705 0.29Anheuser-Busch InBev NV 4% EUR 02/06/2021 15,000,000 15,371,700 0.62AP Moller - Maersk A/S 4.375% EUR 24/11/2017 8,500,000 8,725,208 0.35AP Moller - Maersk A/S 4.875% EUR 30/10/2014 4,000,000 4,174,180 0.17Areva SA 4.375% EUR 06/11/2019 5,000,000 4,998,625 0.20ASML Holding NV 5.75% EUR 13/06/2017 14,000,000 14,843,920 0.60Assicurazioni Generali SpA 5.125% EUR 16/09/2024 2,500,000 2,395,138 0.10Australia & New Zealand Banking Group Ltd 3.75% EUR 10/03/2017 8,000,000 8,151,480 0.33Autoroutes du Sud de la France 4.125% EUR 13/04/2020 4,000,000 4,063,240 0.16Aviva Plc FRN EUR Perpetual 5,500,000 4,385,095 0.18AXA SA FRN EUR 16/04/2040 5,000,000 4,057,475 0.16Banco Popolare SC 6.375% EUR 31/05/2021 8,000,000 6,074,680 0.24Banco Popular Espanol SA 3.5% EUR 13/09/2013 15,000,000 14,828,700 0.60Banco Santander SA 4.375% EUR 16/03/2015 20,000,000 20,161,000 0.81Bank of America Corp 4% EUR 23/03/2015 5,300,000 5,061,315 0.20Bank of America Corp 4.625% EUR 07/08/2017 10,000,000 9,327,700 0.38Bank of America Corp 4.75% EUR 03/04/2017 12,500,000 11,834,000 0.48Bank of America Corp FRN EUR 23/05/2017 7,000,000 5,669,300 0.23Bank of America Corp 6.25% EUR 11/09/2018 4,000,000 4,066,920 0.16Bank of Scotland Plc FRN EUR 07/02/2035 14,324,000 9,853,336 0.40Barclays Bank Plc FRN EUR 30/05/2017 23,520,000 21,859,958 0.88Barclays Bank Plc 4% EUR 20/01/2017 5,000,000 4,948,100 0.20Barclays Bank Plc FRN EUR Perpetual 53,730,000 30,299,959 1.22Barclays Bank Plc 4.875% EUR 13/08/2019 5,000,000 5,040,075 0.20Barclays Bank Plc 6.625% EUR 30/03/2022 12,000,000 10,447,080 0.42Bayer AG FRN EUR 29/07/2105 19,981,000 19,765,605 0.80BBVA Senior Finance SAU 3.25% EUR 23/04/2015 27,000,000 25,408,350 1.02BNP Paribas Capital Trust III FRN EUR Perpetual 5,000,000 4,862,550 0.20BNP Paribas SA FRN EUR Perpetual 19,850,000 18,206,122 0.73BPCE SA FRN EUR Perpetual 13,500,000 12,337,988 0.50Bradford & Bingley Plc FRN EUR 20/09/2011 3,550,000 3,545,385 0.14Brenntag Finance BV 5.5% EUR 19/07/2018 6,000,000 5,883,210 0.24British American Tobacco Holdings BV 4.875% EUR 24/02/2021 3,000,000 3,254,190 0.13Caisse Centrale du Credit Immobilier de France 3.75% EUR 22/01/2015 5,000,000 4,947,875 0.20Caisse Centrale du Credit Immobilier de France 4% EUR 12/01/2018 10,000,000 9,429,700 0.38Carrefour SA 4% EUR 09/04/2020 5,000,000 4,888,600 0.20Casino Guichard Perrachon SA 4.726% EUR 26/05/2021 4,000,000 4,000,420 0.16Cattles Plc 7.125% GBP 05/07/2017 400,000 12,409 –CDP Financial Inc 3.5% EUR 23/06/2020 41,950,000 42,780,610 1.72Celesio Finance BV 4.5% EUR 26/04/2017 8,000,000 7,477,000 0.30Christian Dior SA 4% EUR 12/05/2016 8,000,000 8,102,680 0.33CIBC World Markets Plc FRN EUR 22/06/2017 2,500,000 2,400,000 0.10Cie des Alpes 4.875% EUR 18/10/2017 8,000,000 7,851,120 0.32Citigroup Inc FRN EUR 25/02/2030 3,000,000 2,139,240 0.09CL Capital Trust I FRN EUR Perpetual 18,560,000 16,517,843 0.66CNP Assurances FRN EUR 14/09/2040 10,000,000 8,526,300 0.34Coca-Cola HBC Finance BV 4.25% EUR 16/11/2016 4,000,000 4,114,940 0.17Commerzbank AG 7.75% EUR 16/03/2021 28,000,000 24,878,980 1.00Commonwealth Bank of Australia FRN EUR 10/03/2016 10,000,000 9,183,000 0.37Commonwealth Bank of Australia FRN EUR 31/03/2016 8,000,000 7,322,800 0.29Cooperatieve Centrale Raiffeisen-Boerenleenbank BA 3.75% EUR 09/11/2020 10,000,000 9,193,500 0.37

Invesco Euro Corporate Bond Fund
67 Invesco Funds
Statement of Investments as at 31 August 2011
Investment Nominal/Shares Market Value Net Assets EUR %BONDS (CONTINUED) Credit Agricole SA 5.125% EUR 18/04/2023 12,000,000 12,020,460 0.48Credit Agricole SA FRN EUR Perpetual 5,700,000 5,229,750 0.21Crown European Holdings SA 7.125% EUR 15/08/2018 3,000,000 2,872,500 0.12Deutsche Bank AG FRN EUR 20/09/2016 500,000 457,748 0.02Deutsche Bank AG FRN EUR 22/09/2015 12,751,000 11,760,502 0.47Deutsche Bank Capital Funding Trust XI 9.5% EUR Perpetual 5,000,000 5,110,950 0.21Deutsche Telekom International Finance BV 4.25% EUR 16/03/2020 4,000,000 4,078,120 0.16Deutsche Telekom International Finance BV 4.375% EUR 02/06/2014 5,000,000 5,257,675 0.21Deutsche Telekom International Finance BV 4.5% EUR 28/10/2030 11,500,000 10,650,323 0.43Deutsche Telekom International Finance BV 4.875% EUR 22/04/2025 5,000,000 5,129,200 0.21DONG Energy A/S FRN EUR 01/06/3010 7,000,000 7,208,250 0.29EADS Finance BV 4.625% EUR 12/08/2016 4,000,000 4,256,540 0.17EDF SA 4.5% EUR 12/11/2040 41,250,000 38,590,200 1.55EDF SA 4.625% EUR 26/04/2030 33,100,000 31,965,167 1.29Elster Finance BV 6.25% EUR 15/04/2018 14,800,000 13,690,000 0.55Enagas 3.25% EUR 06/07/2012 2,500,000 2,520,675 0.10Enbw International Finance BV 4.875% EUR 16/01/2025 7,000,000 7,415,975 0.30Enbw International Finance BV 6.125% EUR 07/07/2039 3,000,000 3,338,760 0.13Enel Finance International NV 4.125% EUR 12/07/2017 8,000,000 7,903,680 0.32Enel Finance International NV 5% EUR 12/07/2021 12,000,000 11,939,340 0.48FCE Bank Plc 7.125% EUR 16/01/2012 38,000,000 38,321,670 1.54FCE Bank Plc 7.125% EUR 15/01/2013 13,950,000 14,037,536 0.56Fiat Finance & Trade SA 5.625% EUR 15/11/2011 5,836,000 5,852,428 0.24Fortis Bank SA/NV FRN EUR 14/02/2018 8,940,000 8,420,005 0.34Fortum OYJ 4% EUR 24/05/2021 5,000,000 5,163,300 0.21Galeries Lafayette SA 4.5% EUR 28/04/2017 20,000,000 19,770,000 0.80Gas Natural Capital Markets SA 4.5% EUR 27/01/2020 5,000,000 4,544,450 0.18Gas Natural Capital Markets SA 5.125% EUR 02/11/2021 18,900,000 17,584,087 0.71GDF Suez 5.95% EUR 16/03/2111 5,000,000 4,783,350 0.19GE Capital European Funding 4.25% EUR 01/03/2017 6,000,000 6,102,510 0.25General Electric Capital Corp 4.125% EUR 19/09/2035 6,520,000 4,997,156 0.20General Electric Capital Corp FRN EUR 15/09/2066 5,999,000 5,122,276 0.21General Electric Capital Corp FRN EUR 15/09/2067 28,500,000 25,168,777 1.01General Motors Co PFD 4.75% USD 01/12/2013 21,400 585,088 0.02GMAC International Finance BV 7.5% EUR 21/04/2015 10,000,000 9,579,200 0.39Greif Luxembourg Finance SCA 7.375% EUR 15/07/2021 5,000,000 4,839,650 0.19Groupe Auchan SA 3.625% EUR 19/10/2018 7,000,000 7,218,785 0.29Groupe des Assurances Mutuelles Agricoles FRN EUR Perpetual 6,000,000 3,006,240 0.12Groupe des Assurances Mutuelles Agricoles FRN EUR 27/10/2039 8,000,000 5,617,120 0.23Hannover Finance Luxembourg SA FRN EUR 14/09/2040 8,000,000 6,902,800 0.28HBOS Plc 4.875% EUR 20/03/2015 1,500,000 1,423,575 0.06HeidelbergCement Finance BV 7.625% EUR 25/01/2012 10,000,000 10,164,600 0.41Hertz Holdings Netherlands BV 8.5% EUR 31/07/2015 5,000,000 4,922,925 0.20HIT Finance BV 5.75% EUR 09/03/2018 7,000,000 7,131,530 0.29HSBC Capital Funding LP FRN EUR Perpetual 20,000,000 18,546,400 0.75HSE Netz AG 6.125% EUR 23/04/2041 14,900,000 15,647,235 0.63Hutchison Whampoa Finance 09 Ltd 4.75% EUR 14/11/2016 8,000,000 8,402,120 0.34Iberdrola Finanzas SAU 3.875% EUR 10/02/2014 4,500,000 4,506,030 0.18Iberdrola Finanzas SAU 4.125% EUR 23/03/2020 4,500,000 4,183,515 0.17Iberdrola Finanzas SAU 4.625% EUR 07/04/2017 6,000,000 6,005,490 0.24Imperial Tobacco Finance Plc 4.5% EUR 05/07/2018 6,000,000 6,178,710 0.25ING Groep NV FRN EUR Perpetual 2,000,000 1,505,000 0.06Intesa Sanpaolo SpA 4% EUR 08/11/2018 2,000,000 1,814,560 0.07Intesa Sanpaolo SpA 5% EUR 27/01/2021 15,000,000 15,151,350 0.61Intesa Sanpaolo SpA FRN EUR Perpetual 26,750,000 22,307,627 0.90Investor AB 4.5% EUR 12/05/2023 17,000,000 17,513,655 0.70IPIC GMTN Ltd 5.875% EUR 14/03/2021 12,500,000 12,883,312 0.52Iron Mountain Inc 6.75% EUR 15/10/2018 7,875,000 7,669,069 0.31Italy Buoni Poliennali Del Tesoro 2.25% EUR 01/11/2013 50,000,000 48,590,250 1.96John Deere Bank SA 3.25% EUR 22/06/2016 5,000,000 5,161,625 0.21JPMorgan Chase & Co 0% EUR 31/01/2014 2,800,000 2,603,608 0.10

Invesco Euro Corporate Bond Fund
68 Invesco Funds
Statement of Investments as at 31 August 2011
Investment Nominal/Shares Market Value Net Assets EUR %BONDS (CONTINUED) JPMorgan Chase & Co FRN EUR 12/10/2015 5,000,000 4,552,075 0.18JPMorgan Chase & Co 3.875% EUR 23/09/2020 17,000,000 16,182,895 0.65Kabel BW Erste Beteiligungs GmbH / Kabel Baden-Wurttemberg GmbH & Co KG 7.5% EUR 15/03/2019 10,000,000 9,850,000 0.40Koninklijke KPN NV 5.625% EUR 30/09/2024 7,000,000 7,584,465 0.31Lagardere SCA 4.875% EUR 06/10/2014 23,200,000 23,496,032 0.95LBG Capital No.1 Plc 6.439% EUR 23/05/2020 82,469,000 58,569,484 2.36Legrand France SA 8.5% USD 15/02/2025 3,000,000 2,747,308 0.11Linde Finance BV 3.875% EUR 01/06/2021 12,000,000 12,373,200 0.50Lloyds TSB Bank Plc 6.375% EUR 17/06/2016 3,000,000 3,131,520 0.13Lloyds TSB Bank Plc 6.5% EUR 24/03/2020 20,000,000 16,639,500 0.67Lottomatica SpA 5.375% EUR 05/12/2016 9,000,000 8,957,295 0.36McDonald's Corp 4% EUR 17/02/2021 22,000,000 23,362,680 0.94Merck Financial Services GmbH 4.5% EUR 24/03/2020 2,000,000 2,103,510 0.08Merrill Lynch & Co Inc FRN EUR 14/09/2018 5,000,000 3,546,875 0.14Morgan Stanley FRN EUR 23/09/2019 10,000,000 9,777,500 0.39Morgan Stanley 4.5% EUR 29/10/2014 3,500,000 3,494,418 0.14Motability Operations Group Plc 3.75% EUR 29/11/2017 7,500,000 7,652,325 0.31National Australia Bank Ltd 3.5% EUR 23/01/2015 7,000,000 7,126,385 0.29National Capital Instruments Euro LLC 2 FRN EUR Perpetual 16,300,000 12,445,050 0.50Nationwide Building Society FRN EUR 22/12/2016 5,000,000 4,805,350 0.19Nationwide Building Society 3.75% EUR 20/01/2015 8,000,000 7,984,960 0.32Nationwide Building Society 6.75% EUR 22/07/2020 5,450,000 4,838,074 0.19Natixis FRN EUR 26/01/2017 3,000,000 2,883,780 0.12Nederlandse Waterschapsbank NV FRN EUR 15/08/2035 9,703,000 8,183,995 0.33Neste Oil OYJ 4.875% EUR 06/07/2015 10,000,000 10,304,100 0.41Nomura Bank International Plc FRN EUR 16/02/2017 10,000,000 10,023,750 0.40Nomura Bank International Plc FRN EUR 30/09/2019 6,000,000 6,240,000 0.25Obrascon Huarte Lain SA 8.75% EUR 15/03/2018 6,000,000 5,640,000 0.23OI European Group BV 6.75% EUR 15/09/2020 5,000,000 4,577,075 0.18OMV AG FRN EUR Perpetual 8,750,000 8,802,894 0.35Origin Energy Finance Ltd FRN EUR 16/06/2071 15,000,000 14,394,225 0.58Parpublica - Participiacoes Publicas SGPS SA 3.25% EUR 18/12/2014 4,000,000 3,234,800 0.13Pernod-Ricard SA 4.875% EUR 18/03/2016 7,000,000 7,037,765 0.28Pernod-Ricard SA 5% EUR 15/03/2017 5,000,000 4,965,325 0.20Portugal Telecom International Finance BV 5% EUR 04/11/2019 6,000,000 4,763,820 0.19Prysmian SpA 5.25% EUR 09/04/2015 5,900,000 5,938,675 0.24Rexel SA 7% EUR 17/12/2018 15,000,000 14,059,650 0.57Rheinmetall AG 4% EUR 22/09/2017 3,000,000 2,948,670 0.12Royal Bank of Scotland Plc FRN EUR 28/01/2016 1,000,000 796,970 0.03Royal Bank of Scotland Plc 3% EUR 08/09/2016 20,000,000 20,058,000 0.81Royal Bank of Scotland Plc 3.625% EUR 17/05/2013 1,202,000 1,193,772 0.05Royal Bank of Scotland Plc 4.875% EUR 20/01/2017 10,000,000 9,509,450 0.38Royal Bank of Scotland Plc 5.375% EUR 30/09/2019 10,000,000 9,384,600 0.38Royal Bank of Scotland Plc 5.5% EUR 23/03/2020 10,000,000 9,416,100 0.38Royal Bank of Scotland Plc FRN EUR 23/04/2023 750,000 716,250 0.03RWE AG FRN EUR Perpetual 30,700,000 28,701,891 1.16Santos Finance Ltd FRN EUR 22/09/2070 13,000,000 12,262,705 0.49SAP AG 3.5% EUR 10/04/2017 5,000,000 5,113,325 0.21Sappi Papier Holding GmbH 6.625% EUR 15/04/2018 4,500,000 3,966,030 0.16Scottish & Southern Energy Plc FRN EUR Perpetual 30,900,000 29,675,433 1.19SG Capital Trust III FRN EUR Perpetual 8,000,000 6,302,480 0.25Siemens Financieringsmaatschappij NV FRN EUR 14/09/2066 6,400,000 6,522,432 0.26Skandinaviska Enskilda Banken AB FRN EUR 28/09/2017 3,000,000 2,940,000 0.12SKF AB 3.875% EUR 25/05/2018 20,000,000 20,658,300 0.83Smiths Group Plc 4.125% EUR 05/05/2017 18,000,000 18,288,360 0.74Societe Des Autoroutes Paris-Rhin-Rhone 5% EUR 12/01/2017 10,000,000 10,270,750 0.41Societe Generale SA FRN EUR Perpetual 29,550,000 24,811,510 1.00Societe Generale SA FRN EUR Perpetual 29,000,000 26,589,520 1.07Societe Nationale des Chemins de Fer Francais 4.125% EUR 19/02/2025 10,000,000 10,679,200 0.43Standard Chartered Bank FRN EUR 03/02/2017 1,000,000 996,910 0.04

Invesco Euro Corporate Bond Fund
69 Invesco Funds
Statement of Investments as at 31 August 2011
Investment Nominal/Shares Market Value Net Assets EUR %BONDS (CONTINUED) Standard Chartered Plc 3.625% EUR 15/12/2015 5,000,000 5,111,950 0.21Standard Life Plc FRN EUR 12/07/2022 600,000 609,009 0.02Suez Environnement Co 4.078% EUR 17/05/2021 10,000,000 10,302,100 0.41Suez Environnement Co FRN EUR Perpetual 24,200,000 23,012,385 0.93Svenska Cellulosa AB 3.625% EUR 26/08/2016 7,500,000 7,655,662 0.31TDC A/S 4.375% EUR 23/02/2018 7,000,000 7,276,955 0.29Telecom Italia Finance SA 7.75% EUR 24/01/2033 2,000,000 2,032,780 0.08Telecom Italia SpA 5.25% EUR 10/02/2022 10,000,000 9,114,050 0.37Telecom Italia SpA 5.25% EUR 17/03/2055 44,500,000 31,200,285 1.26Telefonica Emisiones SAU 3.661% EUR 18/09/2017 15,000,000 14,033,250 0.56Telefonica Emisiones SAU 4.375% EUR 02/02/2016 5,000,000 4,971,475 0.20Telefonica Emisiones SAU 4.693% EUR 11/11/2019 20,850,000 20,055,615 0.81Telenor ASA 4.125% EUR 26/03/2020 1,000,000 1,033,475 0.04TeliaSonera AB 3.875% EUR 01/10/2025 15,000,000 14,226,075 0.57TeliaSonera AB 4.75% EUR 16/11/2021 8,500,000 9,139,668 0.37Telstra Corp Ltd 4.25% EUR 23/03/2020 8,000,000 8,342,480 0.34TenneT Holding BV 4.625% EUR 21/02/2023 6,300,000 6,728,463 0.27TenneT Holding BV FRN EUR Perpetual 7,000,000 7,075,110 0.28Tesco Plc 5.125% EUR 10/04/2047 36,800,000 38,783,520 1.56Thames Water Utilities Cayman Finance Ltd 3.25% EUR 09/11/2016 20,000,000 20,262,800 0.82Total Infrastructures Gaz France SA 4.339% EUR 07/07/2021 8,000,000 8,324,880 0.33UBS AG 3.22% EUR 31/07/2012 42,900,000 16,436,062 0.66UBS AG FRN EUR Perpetual 1,000,000 773,750 0.03UBS AG FRN EUR Perpetual 6,200,000 5,758,281 0.23Unibail-Rodamco SE 3.875% EUR 05/11/2020 3,500,000 3,501,803 0.14UniCredit International Bank Luxembourg SA FRN EUR Perpetual 13,000,000 10,168,470 0.41Unicredit SpA 5.25% EUR 30/04/2023 10,000,000 10,213,850 0.41UniCredit SpA 6.125% EUR 19/04/2021 32,900,000 28,727,457 1.16Unitymedia Hessen GmbH & Co KG 8.125% EUR 01/12/2017 10,000,000 10,110,250 0.41Vale SA 4.375% EUR 24/03/2018 15,000,000 15,255,900 0.61Veolia Environnement 4.247% EUR 06/01/2021 7,000,000 7,031,290 0.28Vivendi SA 3.5% EUR 13/07/2015 6,000,000 6,066,750 0.24Vivendi SA 4% EUR 31/03/2017 7,000,000 7,131,915 0.29Vivendi SA 4.75% EUR 13/07/2021 6,000,000 6,150,660 0.25Wal-Mart Stores Inc 4.875% EUR 21/09/2029 65,000,000 72,366,450 2.91Wereldhave NV 2.875% EUR 18/11/2015 9,000,000 8,235,000 0.33Westpac Securities NZ Ltd 3.875% EUR 20/03/2017 4,000,000 4,024,800 0.16
TOTAL BONDS 2,286,242,633 92.02
TOTAL TRANSFERABLE SECURITIES ADMITTED TO AN OFFICIAL STOCK EXCHANGE LISTING OR DEALT IN ON ANOTHER REGULATED MARKET 2,286,242,633 92.02
OTHER TRANSFERABLE SECURITIES BONDS Millipore Corp 5.875% EUR 30/06/2016 4,000,000 4,482,120 0.18Telefonica SA 3.994% EUR 02/03/2015 3,000,000 2,855,670 0.12
TOTAL BONDS 7,337,790 0.30
TOTAL OTHER TRANSFERABLE SECURITIES 7,337,790 0.30
Total Investments 2,293,580,423 92.32
The accompanying notes form an integral part of these financial statements.

Invesco UK Investment Grade Bond Fund
70 Invesco Funds
Statement of Investments as at 31 August 2011
Investment Nominal/Shares Market Value Net Assets GBP %TRANSFERABLE SECURITIES ADMITTED TO AN OFFICIAL STOCK EXCHANGE LISTING OR DEALT IN ON ANOTHER REGULATED MARKET
BONDS Allianz Finance II BV FRN EUR 08/07/2041 800,000 604,370 0.89Ardagh Packaging Finance Plc 7.375% EUR 15/10/2017 150,000 123,665 0.18Aviva Plc FRN GBP 03/06/2041 400,000 376,356 0.55AXA SA FRN GBP Perpetual 275,000 203,786 0.30BAA Funding Ltd 6.25% GBP 10/09/2018 490,000 521,338 0.77Banca Monte dei Paschi di Siena SpA 4.125% EUR 11/11/2013 600,000 521,299 0.77Bank of Scotland Plc 9.375% GBP 15/05/2021 500,000 521,973 0.77Bankia SAU 4.875% EUR 31/03/2014 400,000 354,123 0.52Barclays Bank Plc 5.75% GBP 17/08/2021 500,000 503,059 0.74Barclays Bank Plc 10% GBP 21/05/2021 300,000 328,159 0.48BBVA International Preferred SAU FRN GBP Perpetual 200,000 179,505 0.27BBVA Senior Finance SAU 4% EUR 22/03/2013 600,000 530,046 0.78BBVA Subordinated Capital SAU FRN GBP 11/03/2018 400,000 374,409 0.55BPCE SA FRN EUR Perpetual 500,000 309,716 0.46Brambles Finance Plc 4.625% EUR 20/04/2018 500,000 467,466 0.69Brenntag Finance BV 5.5% EUR 19/07/2018 700,000 608,461 0.90BSKYB Finance UK Plc 5.75% GBP 20/10/2017 400,000 447,460 0.66CaixaBank 3.125% EUR 16/09/2013 400,000 348,651 0.51Cloverie Plc for Zurich Insurance Co Ltd FRN EUR 24/07/2039 200,000 187,908 0.28Cooperatieve Centrale Raiffeisen-Boerenleenbank BA FRN USD Perpetual 350,000 268,652 0.40Co-Operative Group Ltd 5.625% GBP 08/07/2020 600,000 618,117 0.91Crown European Holdings SA 7.125% EUR 15/08/2018 150,000 127,321 0.19Dexia Credit Local SA 5.375% EUR 21/07/2014 500,000 436,661 0.64EDF SA 6.25% GBP 30/05/2028 400,000 457,102 0.67EDP Finance BV 4.25% EUR 12/06/2012 270,000 237,476 0.35Elster Finance BV 6.25% EUR 15/04/2018 250,000 205,000 0.30Enel Finance International NV 5% EUR 12/07/2021 500,000 441,002 0.65European Bank for Reconstruction & Development 5.625% GBP 07/12/2028 500,000 613,083 0.90European Investment Bank 6% GBP 07/12/2028 1,350,000 1,700,137 2.50Experian Finance Plc 4.75% GBP 23/11/2018 170,000 180,104 0.27F Van Lanschot Bankiers NV 3.5% EUR 02/04/2013 600,000 533,859 0.79F Van Lanschot Bankiers NV 4.625% EUR 22/04/2014 300,000 274,835 0.41Glencore Finance Europe SA 5.25% EUR 11/10/2013 400,000 367,196 0.54Glencore Finance Europe SA 6.5% GBP 27/02/2019 500,000 513,992 0.76Gold Fields Orogen Holding BVI Ltd 4.875% USD 07/10/2020 600,000 350,435 0.52Goodyear Dunlop Tires Europe BV 6.75% EUR 15/04/2019 200,000 163,852 0.24Greif Luxembourg Finance SCA 7.375% EUR 15/07/2021 300,000 257,417 0.38HIT Finance BV 5.75% EUR 09/03/2018 400,000 361,257 0.53HSBC Capital Funding LP FRN EUR Perpetual 250,000 198,311 0.29HSBC Capital Funding LP FRN GBP Perpetual 300,000 312,107 0.46Hutchison Ports UK Finance Plc 6.75% GBP 07/12/2015 500,000 570,952 0.84Infinis Plc 9.125% GBP 15/12/2014 75,000 77,578 0.11ING Bank NV FRN GBP 30/05/2023 100,000 101,202 0.15IPIC GMTN Ltd 6.875% GBP 14/03/2026 470,000 496,218 0.73ISS Financing Plc 11% EUR 15/06/2014 440,000 407,959 0.60Jaguar Land Rover Plc 8.125% GBP 15/05/2018 200,000 178,055 0.26Kreditanstalt fuer Wiederaufbau 5.5% GBP 07/12/2015 800,000 922,740 1.36Kreditanstalt fuer Wiederaufbau 5.55% GBP 07/06/2021 1,600,000 1,941,573 2.86Lloyds TSB Bank Plc 4.5% EUR 15/09/2014 700,000 625,920 0.92Man Group Plc 5% USD 09/08/2017 400,000 218,360 0.32Merrill Lynch & Co Inc 7.75% GBP 30/04/2018 500,000 527,874 0.78OI European Group BV 6.75% EUR 15/09/2020 200,000 162,300 0.24Optus Finance Pty Ltd 4.625% USD 15/10/2019 400,000 257,551 0.38QBE Insurance Group Ltd 6.125% GBP 28/09/2015 500,000 535,249 0.79Rabobank Capital Funding Trust IV FRN GBP Perpetual 450,000 381,022 0.56Royal Bank of Scotland Plc 4.875% USD 16/03/2015 380,000 233,631 0.34Royal Bank of Scotland Plc 6.934% EUR 09/04/2018 775,000 600,681 0.89Santander Finance Preferred SA Unipersonal FRN GBP Perpetual 400,000 400,470 0.59

Invesco UK Investment Grade Bond Fund
71 Invesco Funds
Statement of Investments as at 31 August 2011
Investment Nominal/Shares Market Value Net Assets GBP %BONDS (CONTINUED) Scottish & Southern Energy Plc FRN GBP Perpetual 300,000 293,772 0.43SNS Bank NV 6.25% EUR 26/10/2020 450,000 304,816 0.45Societe Generale SA 5.2% USD 15/04/2021 470,000 263,965 0.39Societe Generale SA 5.4% GBP 30/01/2018 850,000 775,968 1.14Societe Generale SA FRN GBP Perpetual 350,000 279,893 0.41Southern Water Greensands Financing Plc 8.5% GBP 15/04/2019 200,000 185,956 0.27Standard Chartered Bank FRN GBP Perpetual 750,000 782,501 1.15Suncorp-Metway Ltd 5.125% GBP 27/10/2014 500,000 523,590 0.77Telecom Italia SpA 7.375% GBP 15/12/2017 500,000 526,252 0.78Telefonica Emisiones SAU 4.75% EUR 07/02/2017 200,000 176,849 0.26Telefonica Emisiones SAU 5.496% EUR 01/04/2016 500,000 459,583 0.68Temasek Financial I Ltd 4.625% GBP 26/07/2022 300,000 324,066 0.48UniCredit International Bank Luxembourg SA FRN GBP Perpetual 350,000 260,666 0.38United Kingdom Gilt 3.75% GBP 07/09/2019 1,750,000 1,935,815 2.85United Kingdom Gilt 3.75% GBP 07/09/2020 1,000,000 1,099,200 1.62United Kingdom Gilt 4% GBP 07/09/2016 840,000 941,909 1.39United Kingdom Gilt 4% GBP 07/03/2022 1,500,000 1,660,755 2.45United Kingdom Gilt 4.25% GBP 07/06/2032 2,500,000 2,718,625 4.00United Kingdom Gilt 4.25% GBP 07/03/2036 2,350,000 2,528,647 3.72United Kingdom Gilt 4.25% GBP 07/12/2040 4,500,000 4,815,360 7.09United Kingdom Gilt 4.25% GBP 07/12/2055 1,600,000 1,740,816 2.56United Kingdom Gilt 4.75% GBP 07/03/2020 1,200,000 1,417,212 2.09United Kingdom Gilt 4.75% GBP 07/12/2030 3,600,000 4,181,292 6.16United Kingdom Gilt 4.75% GBP 07/12/2038 3,300,000 3,834,732 5.65United Kingdom Gilt 5% GBP 07/03/2025 1,900,000 2,283,667 3.36United Kingdom Gilt 8.75% GBP 25/08/2017 1,900,000 2,658,499 3.92Virgin Media Secured Finance Plc 5.5% GBP 15/01/2021 490,000 483,145 0.71
TOTAL BONDS 62,226,552 91.65
TOTAL TRANSFERABLE SECURITIES ADMITTED TO AN OFFICIAL STOCK EXCHANGE LISTING OR DEALT IN ON ANOTHER REGULATED MARKET 62,226,552 91.65
OTHER TRANSFERABLE SECURITIES BONDS Rockwood Specialties Group Inc 7.625% EUR 15/11/2014 550,000 488,786 0.72Time Warner Cable Inc 5.75% GBP 02/06/2031 800,000 811,767 1.20United Kingdom Gilt 4.5% GBP 07/12/2042 2,800,000 3,133,452 4.61
TOTAL BONDS 4,434,005 6.53
TOTAL OTHER TRANSFERABLE SECURITIES 4,434,005 6.53
Total Investments 66,660,557 98.18
The accompanying notes form an integral part of these financial statements.

Invesco Emerging Local Currencies Debt Fund
72 Invesco Funds
Statement of Investments as at 31 August 2011
Investment Nominal/Shares Market Value Net Assets USD %TRANSFERABLE SECURITIES ADMITTED TO AN OFFICIAL STOCK EXCHANGE LISTING OR DEALT IN ON ANOTHER REGULATED MARKET
BONDS African Development Bank 12.5% ZMK 22/12/2011 9,220,000,000 1,930,877 0.26Barclays (Indonesia) 10% IDR 17/02/2028 80,000,000,000 11,344,192 1.52Barclays Bank (Indonesia) 10.25% IDR 19/07/2027 65,000,000,000 9,426,637 1.26Brazil Notas do Tesouro Nacional Serie F 10% BRL 01/01/2017 52,500,000 31,500,067 4.23Brazilian Government International Bond 10.25% BRL 10/01/2028 8,400,000 5,940,693 0.80Brazilian Government International Bond 12.5% BRL 05/01/2016 24,800,000 18,564,317 2.49Brazilian Government International Bond 12.5% BRL 05/01/2022 19,400,000 15,697,580 2.11Centercredit 8.25% KZT 30/09/2011 294,000,000 2,003,544 0.27Colombia Government International Bond 7.75% COP 14/04/2021 28,733,000,000 18,820,355 2.53Colombia Government International Bond 12% COP 22/10/2015 14,290,000,000 10,218,109 1.37Egypt Government International Bond 8.75% EGP 18/07/2012 15,000,000 2,388,993 0.32Export-Import Bank of Korea 4% PHP 26/11/2015 299,100,000 7,012,891 0.94Export-Import Bank of Korea 6.6% IDR 04/11/2013 51,000,000,000 6,050,310 0.81Export-Import Bank of Korea 8.3% IDR 15/03/2014 44,300,000,000 5,399,273 0.72Export-Import Bank of Korea 8.4% IDR 06/07/2016 32,300,000,000 3,902,459 0.52Hungary Government Bond 5.5% HUF 12/02/2014 2,275,000,000 11,904,096 1.60Hungary Government Bond 6.75% HUF 24/02/2017 1,300,000,000 6,839,948 0.92Hungary Government Bond 8% HUF 12/02/2015 3,314,800,000 18,392,698 2.47Malaysia Government Bond 3.741% MYR 27/02/2015 8,900,000 3,019,439 0.40Malaysia Government Bond 3.835% MYR 12/08/2015 82,480,000 28,155,397 3.78Malaysia Government Bond 4.012% MYR 15/09/2017 33,500,000 11,515,361 1.55Malaysia Government Bond 4.378% MYR 29/11/2019 12,630,000 4,439,691 0.60Mexican Bonos 7.75% MXN 14/12/2017 97,750,000 8,876,483 1.19Mexican Bonos 8% MXN 17/12/2015 360,460,000 32,438,255 4.35Mexican Bonos 8.5% MXN 13/12/2018 207,000,000 19,545,659 2.62Mexican Bonos 10% MXN 05/12/2024 172,100,000 18,370,765 2.46Morgan Stanley 10.09% BRL 03/05/2017 8,500,000 5,078,380 0.68Morgan Stanley 11.5% BRL 22/10/2020 10,000,000 6,225,465 0.84Peru Government Bond 7.84% PEN 12/08/2020 12,400,000 5,234,123 0.70Peru Government Bond 8.2% PEN 12/08/2026 24,968,000 11,115,583 1.49Philippine Government International Bond 4.95% PHP 15/01/2021 95,000,000 2,297,073 0.31Poland Government Bond 5% PLN 24/10/2013 76,120,000 26,745,459 3.59Poland Government Bond 5.5% PLN 25/04/2015 33,400,000 11,874,040 1.59Poland Government Bond 5.5% PLN 25/10/2019 21,400,000 7,445,586 1.00Poland Government Bond 6.25% PLN 24/10/2015 61,710,000 22,536,598 3.02Republic of Colombia 9.85% COP 28/06/2027 10,529,000,000 8,013,116 1.08RusHydro Finance Ltd 7.875% RUB 28/10/2015 748,100,000 26,006,377 3.49Russian Agricultural Bank OJSC Via RSHB Capital SA 8.7% RUB 17/03/2016 398,500,000 14,114,725 1.89Russian Federal Bond - OFZ 7.35% RUB 20/01/2016 137,243,000 4,760,343 0.64Russian Federal Bond - OFZ 7.4% RUB 14/06/2017 138,757,000 4,751,234 0.64Russian Foreign Bond - Eurobond 7.85% RUB 10/03/2018 150,000,000 5,425,656 0.73South Africa Government Bond 6.75% ZAR 31/03/2021 231,400,000 30,606,434 4.11South Africa Government Bond 10.5% ZAR 21/12/2026 233,270,000 40,377,891 5.42Thailand Government Bond 2.8% THB 10/10/2017 300,000,000 9,651,365 1.29Thailand Government Bond 3.625% THB 22/05/2015 175,000,000 5,883,666 0.79Thailand Government Bond 3.65% THB 17/12/2021 160,000,000 5,402,308 0.72Thailand Government Bond 4.125% THB 18/11/2016 90,000,000 3,102,672 0.42Thailand Government Bond 5.25% THB 12/05/2014 240,000,000 8,395,691 1.13Turkey Government Bond 0% TRY 07/11/2012 17,905,000 9,479,524 1.27Turkey Government Bond 4% TRY 01/04/2020 14,500,000 9,515,576 1.28Turkey Government Bond 10.5% TRY 15/01/2020 18,116,000 11,595,198 1.56Turkey Government Bond 11% TRY 06/08/2014 12,000,000 7,488,993 1.00Turkey Government Bond 16% TRY 28/08/2013 5,250,000 3,495,115 0.47Ukreximbank Via Biz Finance Plc 11% UAH 03/02/2014 13,850,000 1,712,334 0.23Uruguay Government International Bond 5% UYU 14/09/2018 92,390,000 7,896,138 1.06
TOTAL BONDS 629,924,752 84.53
TOTAL TRANSFERABLE SECURITIES ADMITTED TO AN OFFICIAL STOCK EXCHANGE LISTING OR DEALT IN ON ANOTHER REGULATED MARKET 629,924,752 84.53

Invesco Emerging Local Currencies Debt Fund
73 Invesco Funds
Statement of Investments as at 31 August 2011
Investment Nominal/Shares Market Value Net Assets USD %OTHER TRANSFERABLE SECURITIES BONDS Barclays Bank Plc 9.5% IDR 17/07/2031 90,000,000,000 12,281,260 1.65Citigroup Funding Inc 0% RSD 30/04/2012 770,382,775 10,217,601 1.37Citigroup Funding Inc 1.15% KZT 02/04/2012 1,018,570,000 6,922,652 0.93JPMorgan Chase Indonesian Government Linked Notes 8.375% IDR 17/09/2026 70,000,000,000 8,949,958 1.20Malaysia Government Bond 4.16% MYR 15/07/2021 62,560,000 21,875,082 2.93Malaysia Government Bond 4.392% MYR 15/04/2026 19,212,000 6,779,379 0.91Republic of Argentina 0% ARS 12/06/2012 9,525,000 2,121,336 0.28Sinochem Offshore Capital Co Ltd 1.8% CNY 18/01/2014 39,000,000 6,005,047 0.81Standard Chartered Bank 19% USD 14/01/2013 2,249,538 1,997,365 0.27Standard Chartered Bank 19% GHC 16/01/2013 3,800,000 2,700,007 0.36
TOTAL BONDS 79,849,687 10.71
TOTAL OTHER TRANSFERABLE SECURITIES 79,849,687 10.71
Total Investments 709,774,439 95.24
The accompanying notes form an integral part of these financial statements.

Invesco Global Investment Grade Corporate Bond Fund
74 Invesco Funds
Statement of Investments as at 31 August 2011
Investment Nominal/Shares Market Value Net Assets USD %TRANSFERABLE SECURITIES ADMITTED TO AN OFFICIAL STOCK EXCHANGE LISTING OR DEALT IN ON ANOTHER REGULATED MARKET
BONDS Abbey National Treasury Services Plc 2.875% USD 25/04/2014 150,000 143,247 0.89Advance Auto Parts Inc 5.75% USD 01/05/2020 250,000 276,897 1.73Alliander NV FRN EUR Perpetual 50,000 71,911 0.45Allianz Finance II BV FRN EUR 08/07/2041 100,000 123,027 0.77America Movil SAB de CV 4.75% EUR 28/06/2022 100,000 151,005 0.94American Tower Corp 4.625% USD 01/04/2015 300,000 324,309 2.02Amgen Inc 2.3% USD 15/06/2016 75,000 76,864 0.48Amgen Inc 4.1% USD 15/06/2021 75,000 79,391 0.49ArcelorMittal 9.375% EUR 03/06/2016 100,000 165,249 1.03ASML Holding NV 5.75% EUR 13/06/2017 100,000 153,066 0.95Aviva Plc FRN GBP 03/06/2041 120,000 183,869 1.15Avnet Inc 5.875% USD 15/06/2020 100,000 109,488 0.68AXA SA FRN GBP Perpetual 50,000 60,339 0.38BAA Funding Ltd 6.25% GBP 10/09/2018 90,000 155,939 0.97Banca Monte dei Paschi di Siena SpA 4.125% EUR 11/11/2013 100,000 141,489 0.88Banco Santander Chile 2.875% USD 13/11/2012 100,000 100,812 0.63Bank of America Corp 3.75% USD 12/07/2016 150,000 146,628 0.91Bank of America Corp 5.875% USD 05/01/2021 150,000 153,596 0.96Bank of America Corp 7% EUR 15/06/2016 50,000 76,221 0.48Bank of China Hong Kong Ltd 5.55% USD 11/02/2020 100,000 101,731 0.63Bank of Scotland Plc 9.375% GBP 15/05/2021 50,000 85,003 0.53Bankia SAU 4.875% EUR 31/03/2014 100,000 144,172 0.90Barclays Bank Plc 5% USD 22/09/2016 100,000 102,937 0.64Barclays Bank Plc 5.125% USD 08/01/2020 100,000 99,547 0.62Barclays Bank Plc 10% GBP 21/05/2021 50,000 89,068 0.56BBVA Senior Finance SAU 4% EUR 22/03/2013 100,000 143,863 0.90BBVA Subordinated Capital SAU FRN GBP 11/03/2018 50,000 76,216 0.48BPCE SA FRN EUR Perpetual 100,000 100,874 0.63Brambles Finance Plc 4.625% EUR 20/04/2018 150,000 228,380 1.42Brenntag Finance BV 5.5% EUR 19/07/2018 150,000 212,331 1.32Bunge Ltd Finance Corp 4.1% USD 15/03/2016 50,000 52,087 0.32CaixaBank 3.125% EUR 16/09/2013 50,000 70,972 0.44Casino Guichard Perrachon SA 4.481% EUR 12/11/2018 100,000 145,821 0.91Caterpillar Financial Services Corp 2.05% USD 01/08/2016 200,000 201,530 1.26Continental Airlines 2009-2 Class A Pass Through Trust 7.25% USD 10/11/2019 47,596 49,976 0.31Continental Airlines 2010-1 Class A Pass Through Trust 4.75% USD 12/01/2021 100,000 93,500 0.58Co-Operative Group Ltd 5.625% GBP 08/07/2020 100,000 167,767 1.05Daimler International Finance BV 2.125% GBP 10/12/2013 50,000 81,448 0.51Dexia Credit Local SA 5.375% EUR 21/07/2014 150,000 213,331 1.33EDP Finance BV 4.25% EUR 12/06/2012 200,000 286,466 1.79Empresa Nacional del Petroleo 5.25% USD 10/08/2020 150,000 158,634 0.99Enel Finance International NV 5% EUR 12/07/2021 100,000 143,634 0.90Express Scripts Inc 3.125% USD 15/05/2016 200,000 205,006 1.28F Van Lanschot Bankiers NV 3.5% EUR 02/04/2013 150,000 217,347 1.36General Electric Capital Corp 2.8% USD 08/01/2013 150,000 152,975 0.95General Electric Capital Corp 4.8% USD 01/05/2013 150,000 158,299 0.99General Electric Capital Corp 6% USD 07/08/2019 50,000 55,938 0.35General Electric Co 5.25% USD 06/12/2017 80,000 89,301 0.56Glencore Finance Europe SA 7.125% EUR 23/04/2015 100,000 156,017 0.97Gold Fields Orogen Holding BVI Ltd 4.875% USD 07/10/2020 200,000 190,228 1.19Goldman Sachs Group Inc/The 5.375% USD 15/03/2020 100,000 100,360 0.63Highmark Inc 6.125% USD 15/05/2041 250,000 262,286 1.64HSBC Capital Funding LP FRN EUR Perpetual 100,000 129,180 0.81HSBC USA Inc 5% USD 27/09/2020 100,000 97,146 0.61Hutchison Whampoa International 09/16 Ltd 4.625% USD 11/09/2015 100,000 107,620 0.67ING Bank NV 2% USD 18/10/2013 300,000 295,791 1.84ING Bank NV FRN GBP 30/05/2023 50,000 82,404 0.51International Power Finance 2010 Plc 7.25% EUR 11/05/2017 100,000 165,298 1.03

Invesco Global Investment Grade Corporate Bond Fund
75 Invesco Funds
Statement of Investments as at 31 August 2011
Investment Nominal/Shares Market Value Net Assets USD %BONDS (CONTINUED) Intesa Sanpaolo SpA FRN EUR Perpetual 50,000 60,195 0.38IPIC GMTN Ltd 5.875% EUR 14/03/2021 100,000 148,791 0.93JPMorgan Chase & Co 4.65% USD 01/06/2014 150,000 160,145 1.00JPMorgan Chase & Co FRN USD Perpetual 50,000 52,400 0.33Jyske Bank A/S FRN EUR 25/11/2013 100,000 143,828 0.90Life Technologies Corp 6% USD 01/03/2020 100,000 110,484 0.69Lloyds TSB Bank Plc 6.5% EUR 24/03/2020 100,000 120,107 0.75Macquarie Group Ltd 4.875% USD 10/08/2017 150,000 149,758 0.93Man Group Plc 5% USD 09/08/2017 100,000 88,900 0.55McKesson Corp 3.25% USD 01/03/2016 35,000 37,408 0.23Moody's Corp 5.5% USD 01/09/2020 200,000 215,714 1.34Morgan Stanley 2.875% USD 24/01/2014 100,000 99,295 0.62Morgan Stanley 4.5% EUR 29/10/2014 100,000 144,134 0.90Morgan Stanley 5.375% EUR 10/08/2020 50,000 70,246 0.44Morgan Stanley 6.625% USD 01/04/2018 150,000 160,470 1.00National Rural Utilities Cooperative Finance Corp 10.375% USD 01/11/2018 100,000 142,816 0.89Nokia OYJ 6.75% EUR 04/02/2019 50,000 75,008 0.47OMV AG FRN EUR Perpetual 50,000 72,618 0.45Optus Finance Pty Ltd 4.625% USD 15/10/2019 100,000 104,855 0.65O'Reilly Automotive Inc 4.875% USD 14/01/2021 200,000 216,090 1.35Pentair Inc 5% USD 15/05/2021 200,000 208,872 1.30Petrobras International Finance Co - Pifco 6.75% USD 27/01/2041 100,000 111,960 0.70Petroleos Mexicanos 4.875% USD 15/03/2015 50,000 54,125 0.34Qatari Diar Finance QSC 3.5% USD 21/07/2015 100,000 104,485 0.65QBE Insurance Group Ltd 6.125% GBP 28/09/2015 100,000 174,331 1.09Qtel International Finance Ltd 5% USD 19/10/2025 200,000 198,978 1.24Royal Bank of Scotland Plc 6.934% EUR 09/04/2018 150,000 189,331 1.18Russian Foreign Bond - Eurobond 3.625% USD 29/04/2015 100,000 102,984 0.64Sanofi 4% USD 29/03/2021 200,000 212,397 1.32Santander Issuances S.A Unipersonal FRN GBP 27/07/2019 50,000 78,701 0.49Schiphol Nederland BV 4.43% EUR 28/04/2021 100,000 153,857 0.96Schwab Capital Trust I FRN USD 15/11/2037 100,000 98,321 0.61SNS Bank NV 6.25% EUR 26/10/2020 80,000 88,247 0.55Societe Des Autoroutes Paris-Rhin-Rhone 4.875% EUR 21/01/2019 100,000 144,474 0.90Societe Generale SA 5.2% USD 15/04/2021 200,000 182,922 1.14Societe Generale SA 5.4% GBP 30/01/2018 30,000 44,600 0.28Societe Generale SA FRN EUR Perpetual 50,000 60,607 0.38Societe Generale SA FRN GBP Perpetual 50,000 65,115 0.41Spectra Energy Capital LLC 5.668% USD 15/08/2014 150,000 166,829 1.04State Street Capital Trust III FRN USD Perpetual 60,000 60,064 0.37Suez Environnement Co FRN EUR Perpetual 50,000 68,640 0.43Suncorp-Metway Ltd 5.125% GBP 27/10/2014 50,000 85,267 0.53Svenska Cellulosa AB 3.625% EUR 26/08/2016 100,000 147,360 0.92Telecom Italia SpA 6.375% GBP 24/06/2019 50,000 79,609 0.50Telefonica Emisiones SAU 4.75% EUR 07/02/2017 200,000 287,998 1.80UniCredit Bank AG 6% EUR 05/02/2014 100,000 148,126 0.92UniCredit International Bank Luxembourg SA FRN GBP Perpetual 50,000 60,642 0.38United Kingdom Gilt 4.25% GBP 07/12/2040 150,000 261,394 1.63UnitedHealth Group Inc 3.875% USD 15/10/2020 100,000 104,481 0.65UnitedHealth Group Inc 5.95% USD 15/02/2041 100,000 112,449 0.70Virgin Media Secured Finance Plc 5.5% GBP 15/01/2021 100,000 160,572 1.00Wal-Mart Stores Inc 5.625% USD 01/04/2040 100,000 114,182 0.71Wells Fargo & Co 3.625% USD 15/04/2015 100,000 104,695 0.65Westpac Banking Corp 2.1% USD 02/08/2013 150,000 152,888 0.95
TOTAL BONDS 14,970,596 93.36
TOTAL TRANSFERABLE SECURITIES ADMITTED TO AN OFFICIAL STOCK EXCHANGE LISTING OR DEALT IN ON ANOTHER REGULATED MARKET 14,970,596 93.36

Invesco Global Investment Grade Corporate Bond Fund
76 Invesco Funds
Statement of Investments as at 31 August 2011
Investment Nominal/Shares Market Value Net Assets USD %OTHER TRANSFERABLE SECURITIES BONDS Life Technologies Corp 3.375% USD 01/03/2013 100,000 102,842 0.64Municipal Elec Auth Ga 6.637% USD 01/04/2057 100,000 101,432 0.63Senior Housing Property Trust 4.3% USD 15/01/2016 200,000 200,338 1.25
TOTAL BONDS 404,612 2.52
TOTAL OTHER TRANSFERABLE SECURITIES 404,612 2.52
Total Investments 15,375,208 95.88
The accompanying notes form an integral part of these financial statements.

Invesco Global Unconstrained Bond Fund
77 Invesco Funds
Statement of Investments as at 31 August 2011
Investment Nominal/Shares Market Value Net Assets GBP %TRANSFERABLE SECURITIES ADMITTED TO AN OFFICIAL STOCK EXCHANGE LISTING OR DEALT IN ON ANOTHER REGULATED MARKET
BONDS ASIF III Jersey Ltd FRN ITL 09/04/2018 100,000,000 58,010 2.01Bakkavor Finance 2 Plc 8.25% GBP 15/02/2018 100,000 70,944 2.46Bormioli Rocco Holdings SA 10% EUR 01/08/2018 100,000 87,657 3.04Chrysler Group LLC/CG Co-Issuer Inc 8% USD 15/06/2019 200,000 103,162 3.58Commerzbank AG 7.75% EUR 16/03/2021 200,000 157,535 5.47EBS Mortgage Finance 3.875% EUR 23/11/2012 50,000 40,443 1.40Enterprise Inns Plc 6.375% GBP 26/09/2031 100,000 64,902 2.25FCE Bank Plc 7.125% EUR 15/01/2013 50,000 44,602 1.55Gala Electric Casinos Ltd 11.5% GBP 01/06/2019 100,000 72,152 2.51General Motors Co PFD 4.75% USD 01/12/2013 1,450 35,144 1.22ING Groep NV 8% EUR Perpetual 50,000 42,481 1.48Italy Buoni Poliennali Del Tesoro 3.75% EUR 01/03/2021 200,000 162,249 5.63Jaguar Land Rover Plc 8.125% GBP 15/05/2018 100,000 89,028 3.09Kabel BW Erste Beteiligungs GmbH / Kabel Baden-Wurttemberg GmbH & Co KG 7.5% EUR 15/03/2019 100,000 87,319 3.03LBG Capital No.1 Plc 11.04% GBP 19/03/2020 150,000 141,593 4.92Lottomatica SpA FRN EUR 31/03/2066 50,000 39,227 1.36National Westminster Bank Plc 11.5% GBP Perpetual 100,000 109,999 3.82Ono Finance II Plc 11.125% EUR 15/07/2019 100,000 76,570 2.66Priory Group No 3 Plc 7% GBP 15/02/2018 100,000 92,126 3.20Rexel SA 7% EUR 17/12/2018 100,000 83,091 2.88Santander Central Hispano Financial Services Ltd FRN GBP Perpetual 100,000 94,905 3.29Santander Finance Preferred SA Unipersonal FRN GBP Perpetual 50,000 50,059 1.74Scottish Mutual Assurance Ltd FRN GBP Perpetual 42,500 25,952 0.90Societe Generale SA FRN EUR Perpetual 50,000 37,217 1.29Societe Generale SA FRN GBP Perpetual 85,000 67,974 2.36Thomas Cook Group Plc 7.75% GBP 22/06/2017 50,000 38,040 1.32UBI Banca International SA 8.75% EUR 29/10/2012 30,000 18,417 0.64UBS Capital Securities Jersey Ltd FRN EUR Perpetual 50,000 44,269 1.54Wereldhave NV 2.875% EUR 18/11/2015 50,000 40,557 1.41Wind Acquisition Finance SA 7.375% EUR 15/02/2018 100,000 80,893 2.81Xefin Lux SCA 8% EUR 01/06/2018 200,000 160,897 5.59Xenon Capital Plc FRN CHF 20/12/2011 100,000 69,821 2.42
TOTAL BONDS 2,387,235 82.87
TOTAL TRANSFERABLE SECURITIES ADMITTED TO AN OFFICIAL STOCK EXCHANGE LISTING OR DEALT IN ON ANOTHER REGULATED MARKET 2,387,235 82.87
OTHER TRANSFERABLE SECURITIES BONDS United States Treasury Note/Bond 2.125% USD 15/08/2021 200,000 122,304 4.24
TOTAL BONDS 122,304 4.24
TOTAL OTHER TRANSFERABLE SECURITIES 122,304 4.24
Total Investments 2,509,539 87.11
The accompanying notes form an integral part of these financial statements.

Invesco Global Total Return (EUR) Bond Fund
78 Invesco Funds
Statement of Investments as at 31 August 2011
Investment Nominal/Shares Market Value Net Assets EUR %TRANSFERABLE SECURITIES ADMITTED TO AN OFFICIAL STOCK EXCHANGE LISTING OR DEALT IN ON ANOTHER REGULATED MARKET
BONDS Abbey National Treasury Services Plc 4.375% EUR 24/01/2018 100,000 103,952 0.40Bank of America Corp FRN EUR 23/05/2017 500,000 404,950 1.55Barclays Bank Plc FRN EUR Perpetual 1,100,000 620,323 2.37BBVA Senior Finance SAU 3.25% EUR 23/04/2015 500,000 470,525 1.80BNP Paribas Capital Trust III FRN EUR Perpetual 100,000 97,251 0.37BNP Paribas SA FRN EUR Perpetual 500,000 458,592 1.76BPCE SA FRN EUR Perpetual 500,000 456,962 1.75Brenntag Finance BV 5.5% EUR 19/07/2018 500,000 490,268 1.88Campofrio Food Group SA 8.25% EUR 31/10/2016 250,000 233,436 0.89Chrysler Group LLC/CG Co-Issuer Inc 8% USD 15/06/2019 700,000 407,303 1.56CL Capital Trust I FRN EUR Perpetual 100,000 88,997 0.34Codere Finance Luxembourg SA 8.25% EUR 15/06/2015 250,000 234,219 0.90Commerzbank AG 7.75% EUR 16/03/2021 600,000 533,121 2.04ConvaTec Healthcare E SA 7.375% EUR 15/12/2017 500,000 449,682 1.72Credit Agricole SA FRN EUR Perpetual 500,000 458,750 1.76EDF SA 4.5% EUR 12/11/2040 500,000 467,760 1.79Elster Finance BV 6.25% EUR 15/04/2018 500,000 462,500 1.77FCE Bank Plc 7.125% EUR 16/01/2012 500,000 504,233 1.93Fiat Finance & Trade SA 6.375% EUR 01/04/2016 500,000 443,125 1.70Gas Natural Capital Markets SA 5.125% EUR 02/11/2021 500,000 465,188 1.78General Motors Co PFD 4.75% USD 01/12/2013 7,450 203,687 0.78Greif Luxembourg Finance SCA 7.375% EUR 15/07/2021 500,000 483,965 1.85Hannover Finance Luxembourg SA FRN EUR 14/09/2040 100,000 86,285 0.33Hertz Holdings Netherlands BV 8.5% EUR 31/07/2015 500,000 492,292 1.88HSE Netz AG 6.125% EUR 23/04/2041 100,000 105,015 0.40Intesa Sanpaolo SpA FRN EUR Perpetual 500,000 416,965 1.60Iron Mountain Inc 6.75% EUR 15/10/2018 250,000 243,463 0.93Italy Buoni Poliennali Del Tesoro 2% EUR 01/06/2013 500,000 488,565 1.87Italy Buoni Poliennali Del Tesoro 3% EUR 01/04/2014 1,000,000 981,160 3.76Italy Buoni Poliennali Del Tesoro 3.75% EUR 01/03/2021 300,000 274,538 1.05Italy Buoni Poliennali Del Tesoro 4.75% EUR 01/09/2021 500,000 488,060 1.87LBG Capital No.1 Plc 6.439% EUR 23/05/2020 500,000 355,100 1.36LBG Capital No.1 Plc 7.867% GBP 17/12/2019 100,000 88,486 0.34LBG Capital No.1 Plc 11.04% GBP 19/03/2020 50,000 53,241 0.20LBG Capital No.2 Plc 8.5% GBP 07/06/2032 200,000 172,592 0.66Lloyds TSB Bank Plc 6.5% EUR 24/03/2020 500,000 415,988 1.59Musketeer GmbH 9.5% EUR 15/03/2021 100,000 99,500 0.38OMV AG FRN EUR Perpetual 500,000 503,022 1.93Ono Finance II Plc 11.125% EUR 15/07/2019 100,000 86,375 0.33Origin Energy Finance Ltd FRN EUR 16/06/2071 700,000 671,730 2.57Priory Group No 3 Plc 7% GBP 15/02/2018 100,000 103,922 0.40Rexel SA 7% EUR 17/12/2018 350,000 328,058 1.26Royal Bank of Scotland Group Plc 5.25% EUR Perpetual 100,000 46,068 0.18Santander Central Hispano Financial Services Ltd FRN GBP Perpetual 50,000 53,529 0.20Santander Finance Preferred SA Unipersonal FRN GBP Perpetual 200,000 225,875 0.86Sappi Papier Holding GmbH 6.625% EUR 15/04/2018 100,000 88,134 0.34Societe Generale SA FRN EUR Perpetual 950,000 871,036 3.33Spain Government Bond 5.5% EUR 30/04/2021 500,000 517,535 1.98SPCM SA 8.25% EUR 15/06/2017 250,000 251,322 0.96Suez Environnement Co FRN EUR Perpetual 100,000 95,093 0.36Telecom Italia SpA 5.25% EUR 17/03/2055 800,000 560,904 2.15UBI Banca International SA 8.75% EUR 29/10/2012 30,000 20,775 0.08UBS AG 3.22% EUR 31/07/2012 1,000,000 383,125 1.47UniCredit SpA 6.125% EUR 19/04/2021 100,000 87,318 0.33Vedanta Resources Jersey II Ltd 4% USD 30/03/2017 1,200,000 759,953 2.91Wind Acquisition Finance SA 7.375% EUR 15/02/2018 600,000 547,509 2.10Xefin Lux SCA 8% EUR 01/06/2018 200,000 181,500 0.69Ziggo Finance BV 6.125% EUR 15/11/2017 250,000 244,458 0.94
TOTAL BONDS 19,927,280 76.28

Invesco Global Total Return (EUR) Bond Fund
79 Invesco Funds
Statement of Investments as at 31 August 2011
Investment Nominal/Shares Market Value Net Assets EUR %
TOTAL TRANSFERABLE SECURITIES ADMITTED TO AN OFFICIAL STOCK EXCHANGE LISTING OR DEALT IN ON ANOTHER REGULATED MARKET 19,927,280 76.28
Total Investments 19,927,280 76.28
The accompanying notes form an integral part of these financial statements.

Invesco Emerging Market Corporate Bond Fund
80 Invesco Funds
Statement of Investments as at 31 August 2011
Investment Nominal/Shares Market Value Net Assets USD %TRANSFERABLE SECURITIES ADMITTED TO AN OFFICIAL STOCK EXCHANGE LISTING OR DEALT IN ON ANOTHER REGULATED MARKET
BONDS Adaro Indonesia PT 7.625% USD 22/10/2019 200,000 218,000 2.12AES Gener SA 5.25% USD 15/08/2021 400,000 399,600 3.90African Export-Import Bank 5.75% USD 27/07/2016 300,000 299,550 2.92Akbank TAS 6.5% USD 09/03/2018 200,000 200,300 1.95Argentina Bonos 7% USD 17/04/2017 100,000 90,450 0.88Axtel SAB de CV 9% USD 22/09/2019 400,000 383,999 3.75Banco de Credito del Peru 5.375% USD 16/09/2020 100,000 96,750 0.94Banco Internacional del Peru SA 5.75% USD 07/10/2020 200,000 191,254 1.87BanColombia SA 5.95% USD 03/06/2021 400,000 410,000 3.99BBVA Bancomer SA 6.5% USD 10/03/2021 200,000 199,829 1.95Cencosud SA 5.5% USD 20/01/2021 200,000 208,739 2.03City of Kyiv Via Kyiv Finance Plc 9.375% USD 11/07/2016 200,000 192,418 1.87Emirate of Dubai Government International Bonds 7.75% USD 05/10/2020 200,000 213,275 2.08Fibria Overseas Finance Ltd 6.75% USD 03/03/2021 150,000 150,000 1.46Gazprom OAO Via Gaz Capital SA 6.51% USD 07/03/2022 300,000 326,250 3.18Gold Fields Orogen Holding BVI Ltd 4.875% USD 07/10/2020 400,000 380,456 3.71Grupo Elektra SA de CV 7.25% USD 06/08/2018 400,000 377,048 3.67GTB Finance B.V. 7.5% USD 19/05/2016 200,000 206,651 2.01Hutchison Whampoa International Ltd FRN USD Perpetual 200,000 202,368 1.97ICICI Bank Ltd 4.75% USD 25/11/2016 200,000 197,978 1.93Indosat Palapa Co BV 7.375% USD 29/07/2020 400,000 442,000 4.31Itau Unibanco Holding SA 6.2% USD 21/12/2021 300,000 310,960 3.03KazMunayGas National Co 7% USD 05/05/2020 300,000 323,625 3.15Metalloinvest Finance Ltd 6.5% USD 21/07/2016 300,000 293,057 2.86OGX Petroleo e Gas Participacoes SA 8.5% USD 01/06/2018 400,000 402,500 3.92Oschadbank Via SSB #1 Plc 8.25% USD 10/03/2016 200,000 192,625 1.88Petrobras International Finance Co - Pifco 5.375% USD 27/01/2021 250,000 266,325 2.60Petroleos de Venezuela SA 8.5% USD 02/11/2017 200,000 141,000 1.37Provincia de Buenos Aires 10.875% USD 26/01/2021 200,000 174,750 1.70Provincia de Buenos Aires 11.75% USD 05/10/2015 200,000 197,944 1.93Republic of Belarus 8.95% USD 26/01/2018 100,000 83,734 0.82Russian Agricultural Bank SA FRN USD 03/06/2021 200,000 197,431 1.92Sberbank of Russia Via SB Capital SA 5.717% USD 16/06/2021 200,000 199,468 1.94Sigma Alimentos SA de CV 5.625% USD 14/04/2018 300,000 307,500 3.00Telemar Norte Leste SA 5.5% USD 23/10/2020 200,000 197,875 1.93TV Azteca SAB de CV 7.5% USD 25/05/2018 200,000 200,000 1.95Vedanta Resources Plc 8.25% USD 07/06/2021 300,000 285,000 2.77VimpelCom Holdings BV 7.504% USD 01/03/2022 400,000 381,072 3.71
TOTAL BONDS 9,541,781 92.97
TOTAL TRANSFERABLE SECURITIES ADMITTED TO AN OFFICIAL STOCK EXCHANGE LISTING OR DEALT IN ON ANOTHER REGULATED MARKET 9,541,781 92.97
OTHER TRANSFERABLE SECURITIES BONDS Banco Safra SA 10.25% BRL 08/08/2016 300,000 187,226 1.82Banque Safra-Luxembourg SA 10% BRL 05/01/2015 350,000 219,248 2.14
TOTAL BONDS 406,474 3.96
TOTAL OTHER TRANSFERABLE SECURITIES 406,474 3.96
Total Investments 9,948,255 96.93
The accompanying notes form an integral part of these financial statements.

Invesco Euro Short Term Bond Fund
81 Invesco Funds
Statement of Investments as at 31 August 2011
Investment Nominal/Shares Market Value Net Assets EUR %TRANSFERABLE SECURITIES ADMITTED TO AN OFFICIAL STOCK EXCHANGE LISTING OR DEALT IN ON ANOTHER REGULATED MARKET
BONDS ABN Amro Bank NV 4.25% EUR 11/04/2016 100,000 101,945 1.07American International Group Inc 4.375% EUR 26/04/2016 100,000 92,691 0.97ArcelorMittal 9.375% EUR 03/06/2016 100,000 114,466 1.19Atlantia SpA 5% EUR 09/06/2014 100,000 103,656 1.08Aviva Plc FRN GBP 03/06/2041 100,000 106,137 1.11AXA SA 4.5% EUR 23/01/2015 100,000 102,494 1.07BAA Funding Ltd FRN EUR 30/09/2014 150,000 157,362 1.64Banca Monte dei Paschi di Siena SpA 4.125% EUR 11/11/2013 200,000 196,017 2.05Bank of America Corp 7% EUR 15/06/2016 150,000 158,393 1.66Bankia SAU 4.875% EUR 31/03/2014 100,000 99,867 1.04Barclays Bank Plc 3.5% EUR 18/03/2015 100,000 99,199 1.04BAT International Finance Plc 5.875% EUR 12/03/2015 150,000 166,734 1.74BNP Paribas SA 2.875% EUR 13/07/2015 150,000 150,289 1.57BP Capital Markets Plc 3.472% EUR 01/06/2016 150,000 153,773 1.61BPCE SA FRN EUR Perpetual 50,000 45,696 0.48Brenntag Finance BV 5.5% EUR 19/07/2018 130,000 127,470 1.33British Telecommunications Plc 6.125% EUR 11/07/2014 100,000 109,444 1.14CaixaBank 3.125% EUR 16/09/2013 150,000 147,486 1.54Carrefour SA 6.625% EUR 02/12/2013 100,000 109,402 1.14Citigroup Inc 7.375% EUR 16/06/2014 150,000 162,305 1.69Co-Operative Group Ltd 5.625% GBP 08/07/2020 100,000 116,211 1.21Credit Suisse AG 6.125% EUR 16/05/2014 150,000 163,263 1.71Daimler International Finance BV 2.125% GBP 10/12/2013 50,000 56,419 0.59Deutsche Telekom International Finance BV 5.875% EUR 10/09/2014 100,000 109,652 1.15Dexia Credit Local SA 5.375% EUR 21/07/2014 150,000 147,773 1.54Dubai Electricity & Water Authority 7.375% USD 21/10/2020 100,000 71,321 0.75EDP Finance BV 4.25% EUR 12/06/2012 50,000 49,608 0.52Enel Finance International NV 5% EUR 12/07/2021 100,000 99,495 1.04Europcar Groupe SA FRN EUR 15/05/2013 50,000 47,250 0.49F Van Lanschot Bankiers NV 3.5% EUR 02/04/2013 150,000 150,555 1.57Fibria Overseas Finance Ltd 7.5% USD 04/05/2020 100,000 71,347 0.75Finmeccanica Finance SA 8.125% EUR 03/12/2013 100,000 107,169 1.12Gazprom OAO Via Gaz Capital SA 6.51% USD 07/03/2022 100,000 75,330 0.79GDF Suez 6.25% EUR 24/01/2014 150,000 164,861 1.72GE Capital European Funding 4.25% EUR 06/02/2014 150,000 154,487 1.61Gerresheimer AG 5% EUR 19/05/2018 100,000 96,481 1.01Goldman Sachs Group Inc 4.75% EUR 28/01/2014 150,000 151,238 1.58HBOS Plc 4.875% EUR 20/03/2015 150,000 142,358 1.49HSBC Capital Funding LP FRN GBP Perpetual 50,000 58,679 0.61HSBC Finance Corp 4.5% EUR 14/06/2016 100,000 102,020 1.07HSBC Holdings Plc 5.375% EUR 20/12/2012 150,000 154,533 1.62Hutchison Whampoa Finance 05 Ltd 4.125% EUR 28/06/2015 100,000 103,578 1.08Imperial Tobacco Finance Plc 4.375% EUR 22/11/2013 100,000 104,065 1.09Infinis Plc 9.125% GBP 15/12/2014 50,000 58,341 0.61ING Bank NV FRN GBP 30/05/2023 50,000 57,080 0.60ING Verzekeringen NV 4% EUR 18/09/2013 150,000 153,417 1.60Intesa Sanpaolo SpA FRN EUR Perpetual 50,000 41,295 0.43ISS Financing Plc 11% EUR 15/06/2014 50,000 52,295 0.55JPMorgan Chase & Co 4.375% EUR 30/01/2014 100,000 103,265 1.08Lloyds Banking Group Plc 5.875% EUR 08/07/2014 150,000 149,150 1.56MetLife of Connecticut Institutional Funding Ltd 5.65% EUR 21/06/2012 100,000 101,628 1.07MHP SA 10.25% USD 29/04/2015 100,000 69,789 0.73Morgan Stanley 4.5% EUR 29/10/2014 250,000 249,600 2.60Nalco Co 6.875% EUR 15/01/2019 100,000 109,143 1.14National Australia Bank Ltd 5.5% EUR 20/05/2015 150,000 163,202 1.71Nationwide Building Society 3.75% EUR 20/01/2015 150,000 149,717 1.56Nokia OYJ 6.75% EUR 04/02/2019 50,000 51,957 0.54

Invesco Euro Short Term Bond Fund
82 Invesco Funds
Statement of Investments as at 31 August 2011
Investment Nominal/Shares Market Value Net Assets EUR %BONDS (CONTINUED) OMV AG FRN EUR Perpetual 50,000 50,302 0.53Royal Bank of Scotland Plc FRN EUR 22/09/2021 50,000 39,905 0.42Royal Bank of Scotland Plc 6% EUR 10/05/2013 225,000 225,823 2.35Royal Bank of Scotland Plc 6.934% EUR 09/04/2018 50,000 43,716 0.46Santander International Debt SA Unipersonal 3.75% EUR 28/02/2013 100,000 99,274 1.04Santander Issuances S.A. Unipersonal FRN EUR 24/10/2017 100,000 90,280 0.94Skandinaviska Enskilda Banken AB 3.75% EUR 19/05/2016 200,000 200,670 2.09Societe Des Autoroutes Paris-Rhin-Rhone 4.875% EUR 21/01/2019 200,000 200,152 2.10Societe Generale SA 5.4% GBP 30/01/2018 50,000 51,490 0.54Societe Generale SA FRN EUR Perpetual 50,000 40,078 0.42Societe Generale SA FRN EUR Perpetual 100,000 83,965 0.88Standard Chartered Plc 5.75% EUR 30/04/2014 100,000 108,083 1.13Svenska Cellulosa AB 3.625% EUR 26/08/2016 100,000 102,076 1.07Swedbank AB 3.125% EUR 04/03/2013 150,000 151,973 1.59Swiss Re Treasury US Corp 7% EUR 19/05/2014 100,000 110,737 1.16Telefonica Emisiones SAU 4.75% EUR 07/02/2017 100,000 99,747 1.04Telefonica Emisiones SAU 5.431% EUR 03/02/2014 150,000 154,787 1.62Tupperware Brands Corp 4.75% USD 01/06/2021 150,000 103,085 1.08UBS AG 5.625% EUR 19/05/2014 150,000 160,770 1.68UniCredit Bank AG 6% EUR 05/02/2014 150,000 153,908 1.61UniCredit International Bank Luxembourg SA FRN GBP Perpetual 50,000 42,006 0.44United Kingdom Gilt 4.25% GBP 07/12/2040 20,000 24,142 0.25Virgin Media Finance Plc 9.5% EUR 15/08/2016 50,000 53,458 0.56Volkswagen Financial Services AG 6.875% EUR 15/01/2014 150,000 165,559 1.73Zurich Finance USA Inc 4.5% EUR 17/09/2014 100,000 104,830 1.10
TOTAL BONDS 9,173,214 95.88
TOTAL TRANSFERABLE SECURITIES ADMITTED TO AN OFFICIAL STOCK EXCHANGE LISTING OR DEALT IN ON ANOTHER REGULATED MARKET 9,173,214 95.88
OTHER TRANSFERABLE SECURITIES BONDS United States Treasury Note/Bond 4.375% USD 15/05/2041 130,000 104,381 1.09
TOTAL BONDS 104,381 1.09
TOTAL OTHER TRANSFERABLE SECURITIES 104,381 1.09
Total Investments 9,277,595 96.97
The accompanying notes form an integral part of these financial statements.

Invesco Capital Shield 90 (EUR) Fund
83 Invesco Funds
Statement of Investments as at 31 August 2011
Investment Nominal/Shares Market Value Net Assets EUR %TRANSFERABLE SECURITIES ADMITTED TO AN OFFICIAL STOCK EXCHANGE LISTING OR DEALT IN ON ANOTHER REGULATED MARKET
STRUCTURED PRODUCTS ETFS Agriculture DJ-UBSCI 220,542 1,456,832 1.33Gold Bullion Securities Ltd 0% Secured Undated NTS 28,483 3,508,876 3.20iPath Dow Jones-UBS Copper Subindex Total Return ETN 61,300 2,301,231 2.09
TOTAL STRUCTURED PRODUCTS 7,266,939 6.62
TOTAL TRANSFERABLE SECURITIES ADMITTED TO AN OFFICIAL STOCK EXCHANGE LISTING OR DEALT IN ON ANOTHER REGULATED MARKET 7,266,939 6.62
MONEY MARKET INSTRUMENTS ELIGIBLE UNDER ARTICLE 41.1H OF THE LAW OF 20 DECEMBER 2002 Argento C/P EUR 09/09/2011 5,000,000 4,998,203 4.55Banco Bilbao Vizcaya Argent C/P EUR 07/09/2011 5,000,000 4,998,979 4.55Cancara Asset Securitisation C/P EUR 22/09/2011 5,000,000 4,995,909 4.55Fms Wert C/P EUR 20/09/2011 5,000,000 4,997,445 4.55HSBC Bank C/D EUR 07/09/2011 5,000,000 5,000,005 4.56Lexington Parker Capital C/P EUR 09/09/2011 5,000,000 4,998,314 4.56LMA C/P EUR 12/09/2011 5,000,000 4,997,586 4.55Mont Blanc Capital C/P EUR 14/09/2011 5,000,000 4,997,184 4.55Nordea Bank C/P EUR 30/09/2011 4,000,000 3,995,482 3.64Rabobank Nederlands C/P EUR 25/11/2011 5,000,000 4,988,203 4.55Solitaire Funding C/P EUR 22/09/2011 5,000,000 4,996,001 4.55Svenska Handelsbanken C/P EUR 12/09/2011 5,000,000 4,998,136 4.55Thames Asset Gbl C/P EUR 19/09/2011 5,000,000 4,996,442 4.55
TOTAL MONEY MARKET INSTRUMENTS ELIGIBLE UNDER ARTICLE 41.1H OF THE LAW OF 20 DECEMBER 2002 63,957,889 58.26
OPEN-ENDED FUNDS Short-Term Investments Co Global Series - Euro Liquidity Portfolio 10,500,000 10,500,000 9.57
TOTAL OPEN-ENDED FUNDS 10,500,000 9.57
Total Investments 81,724,828 74.45
The accompanying notes form an integral part of these financial statements.

Invesco Asia Balanced Fund
84 Invesco Funds
Statement of Investments as at 31 August 2011
Investment Nominal/Shares Market Value Net Assets USD %TRANSFERABLE SECURITIES ADMITTED TO AN OFFICIAL STOCK EXCHANGE LISTING OR DEALT IN ON ANOTHER REGULATED MARKET
EQUITIES AUSTRALIA Adelaide Brighton Ltd 2,330,818 6,936,827 1.08AMP Ltd 1,371,937 6,636,815 1.03ASX Ltd 211,479 6,544,301 1.01Australia & New Zealand Banking Group Ltd 301,763 6,526,422 1.01David Jones Ltd 2,104,525 6,746,008 1.05GUD Holdings Ltd 751,790 5,946,425 0.92Harvey Norman Holdings Ltd 2,815,144 6,186,088 0.96Iress Market Technology Ltd 730,672 6,317,187 0.98Leighton Holdings Ltd 297,619 6,441,559 1.00Metcash Ltd 1,566,984 6,778,033 1.05QBE Insurance Group Ltd 375,678 5,660,470 0.88Sonic Healthcare Ltd 517,342 6,481,552 1.00Telstra Corp Ltd 2,141,199 6,932,087 1.07Toll Holdings Ltd 1,404,532 7,258,948 1.13Westpac Banking Corp 304,447 6,688,393 1.04
98,081,115 15.21
BERMUDA Esprit Holdings Ltd 2,361,500 6,642,065 1.03NWS Holdings Ltd 4,971,000 7,059,387 1.09Yuexiu Transport Infrastructure Ltd 15,298,000 6,554,759 1.02
20,256,211 3.14
CHINA Jiangsu Expressway Co Ltd 7,912,000 6,622,811 1.03Zhejiang Expressway Co Ltd 10,410,000 6,483,590 1.01
13,106,401 2.04
MALAYSIA DiGi.Com Bhd 698,500 7,078,614 1.10Maxis Bhd 3,829,700 6,874,924 1.07Petronas Dagangan Bhd 1,159,000 6,853,709 1.06
20,807,247 3.23
PAKISTAN MCB Bank Ltd 1,594,505 3,081,364 0.48National Bank Of Pakistan 5,663,761 2,398,392 0.37Pakistan Oilfields Ltd 805,054 3,295,375 0.51Pakistan Petroleum Ltd 1,432,331 3,292,088 0.51
12,067,219 1.87
PHILIPPINES Globe Telecom Inc 309,680 6,583,560 1.02Philippine Long Distance Telephone Co 125,270 7,091,844 1.10
13,675,404 2.12
SINGAPORE M1 Ltd 3,206,000 6,664,162 1.03Singapore Post Ltd 7,782,000 6,826,305 1.06Singapore Telecommunications Ltd 2,570,000 6,656,305 1.03StarHub Ltd 2,972,000 7,079,710 1.10
27,226,482 4.22

Invesco Asia Balanced Fund
85 Invesco Funds
Statement of Investments as at 31 August 2011
Investment Nominal/Shares Market Value Net Assets USD %SOUTH KOREA SK Telecom Co Ltd 50,674 7,350,425 1.14
TAIWAN Ability Enterprise Co Ltd 5,391,000 5,598,302 0.87Chicony Electronics Co Ltd 3,875,000 6,672,171 1.03China Steel Corp 6,900,000 7,474,537 1.16Chunghwa Telecom Co Ltd 2,049,541 7,061,539 1.09Delta Electronics Inc 1,996,000 5,838,111 0.90Feng Hsin Iron & Steel Co 3,882,000 7,513,897 1.16Formosa Plastics Corp 1,843,000 5,720,961 0.89Inventec Appliances Corp 212,750 129,992 0.02LCY Chemical Corp 2,931,495 6,376,443 0.99Lite-On Technology Corp 5,519,460 6,002,828 0.93Macronix International 11,180,000 4,711,407 0.73Makalot Industrial Co Ltd 2,857,000 6,721,603 1.04MediaTek Inc 728,415 7,313,155 1.13Richtek Technology Corp 1,156,000 5,937,506 0.92Silitech Technology Corp 2,870,096 7,712,097 1.20Taiwan Mobile Co Ltd 2,660,000 7,179,651 1.11U-Ming Marine Transport Corp 3,973,000 6,608,088 1.02Unimicron Technology Corp 3,803,000 5,479,773 0.85Zinwell Corp 5,033,000 5,694,972 0.88
115,747,033 17.92
THAILAND Advanced Info Service PCL 1,796,000 6,786,686 1.05Bangkok Expressway PCL 11,469,200 6,792,735 1.05Delta Electronics Thai PCL 6,252,800 4,527,386 0.70Dynasty Ceramic PCL 3,304,400 5,554,192 0.86Dynasty Ceramic PCL NVDR 470,500 790,839 0.12Electricity Generating PCL 2,209,800 6,765,069 1.05Hana Microelectronics PCL 8,543,800 6,342,994 0.98Kiatnakin Bank PCL 6,161,500 7,067,118 1.10Ratchaburi Electricity Generating Holding PCL 4,936,400 7,267,889 1.13Siam City Cement PCL 913,600 7,026,519 1.09Total Access Communication PCL 4,638,100 10,813,721 1.68
69,735,148 10.81
TOTAL EQUITIES 398,052,685 61.70
BONDS AUSTRALIA Macquarie Group Ltd 7.3% USD 01/08/2014 2,000,000 2,217,368 0.34Macquarie Group Ltd 7.625% USD 13/08/2019 4,000,000 4,418,788 0.69National Australia Bank FRN USD Perpetual 2,000,000 2,084,750 0.32PTTEP Australia International Finance Proprietary Ltd 4.152% USD 19/07/2015 500,000 519,373 0.08
9,240,279 1.43
BERMUDA China Oriental Group Co Ltd 8% USD 18/08/2015 3,000,000 2,850,000 0.44Noble Group Ltd 6.75% USD 29/01/2020 3,000,000 2,989,734 0.46
5,839,734 0.90
CAYMAN ISLANDS Agile Property Holdings Ltd 10% USD 14/11/2016 3,000,000 3,007,500 0.47China Overseas Finance Cayman II Ltd 5.5% USD 10/11/2020 1,000,000 987,175 0.15

Invesco Asia Balanced Fund
86 Invesco Funds
Statement of Investments as at 31 August 2011
Investment Nominal/Shares Market Value Net Assets USD %CAYMAN ISLANDS (CONTINUED) Country Garden Holdings Co 11.25% USD 22/04/2017 2,500,000 2,487,500 0.39Evergrande Real Estate Group Ltd 9.25% CNY 19/01/2016 30,000,000 4,256,686 0.66Hongkong Land Finance Cayman Island Co Ltd 4.5% USD 07/10/2025 3,000,000 2,843,835 0.44Hutchison Whampoa Finance CI Ltd 7.45% USD 01/08/2017 1,000,000 1,189,773 0.18Hutchison Whampoa International Ltd FRN USD Perpetual 4,000,000 4,047,368 0.63Hutchison Whampoa International Ltd 7.45% USD 24/11/2033 1,000,000 1,308,524 0.20Hutchison Whampoa International Ltd 7.625% USD 09/04/2019 3,500,000 4,303,890 0.67Parkson Retail Group Ltd 7.875% USD 14/11/2011 1,000,000 1,005,000 0.16PHBS Ltd 6.625% USD Perpetual 4,000,000 3,686,660 0.57Swire Pacific MTN Financing Ltd 6.25% USD 18/04/2018 2,000,000 2,306,590 0.36
31,430,501 4.88
HONG KONG Bank of China Hong Kong Ltd 5.55% USD 11/02/2020 3,500,000 3,560,575 0.55Bank of East Asia Ltd FRN USD 22/06/2017 2,000,000 1,970,110 0.31Bank of East Asia Ltd 6.125% USD 16/07/2020 3,500,000 3,653,020 0.57Bank of East Asia Ltd FRN USD Perpetual 2,000,000 2,098,441 0.33Citic Pacific Ltd 6.625% USD 15/04/2021 2,000,000 1,895,000 0.29Dah Sing Bank Ltd FRN USD 18/08/2017 1,000,000 1,021,065 0.16Standard Chartered Bank Hong Kong Ltd 5.875% USD 24/06/2020 3,500,000 3,676,330 0.57
17,874,541 2.78
INDIA Bank of Baroda 5% USD 24/08/2016 2,000,000 2,049,500 0.32ICICI Bank Ltd FRN USD Perpetual 4,000,000 3,747,724 0.58State Bank of India 4.5% USD 23/10/2014 1,000,000 1,031,590 0.16
6,828,814 1.06
INDONESIA Indonesia Government International Bond 8.5% USD 12/10/2035 8,000,000 11,500,000 1.78Indonesia Government International Bond 10.375% USD 04/05/2014 3,000,000 3,628,140 0.56Indonesia Government International Bond 11.625% USD 04/03/2019 6,000,000 9,000,000 1.40
24,128,140 3.74
MALAYSIA Axiata SPV1 Labuan Ltd 5.375% USD 28/04/2020 2,000,000 2,155,220 0.33Petronas Capital Ltd 7.875% USD 22/05/2022 4,000,000 5,377,848 0.83Public Bank Bhd FRN USD 20/06/2017 1,000,000 1,020,345 0.16
8,553,413 1.32
NETHERLANDS Indosat Palapa Co BV 7.375% USD 29/07/2020 500,000 552,500 0.09Majapahit Holding BV 7.25% USD 28/06/2017 1,000,000 1,150,913 0.18Majapahit Holding BV 7.75% USD 17/10/2016 2,000,000 2,327,500 0.36Majapahit Holding BV 7.75% USD 20/01/2020 1,000,000 1,191,250 0.18Majapahit Holding BV 8% USD 07/08/2019 2,250,000 2,722,500 0.42
7,944,663 1.23
PHILIPPINES Philippine Government International Bond 9.5% USD 02/02/2030 2,000,000 3,080,000 0.48Philippine Government International Bond 9.875% USD 15/01/2019 2,000,000 2,756,229 0.43Philippine Government International Bond 10.625% USD 16/03/2025 6,000,000 9,562,500 1.48Philippine Long Distance Telephone Co 11.375% USD 15/05/2012 1,000,000 1,065,000 0.17
16,463,729 2.56
SINGAPORE Bumi Capital Pte Ltd 12% USD 10/11/2016 1,000,000 1,100,837 0.17

Invesco Asia Balanced Fund
87 Invesco Funds
Statement of Investments as at 31 August 2011
Investment Nominal/Shares Market Value Net Assets USD %SINGAPORE (CONTINUED) DBS Bank Ltd FRN USD 16/05/2017 2,000,000 2,051,348 0.32Yanlord Land Group Ltd 10.625% USD 29/03/2018 750,000 667,500 0.10
3,819,685 0.59
SOUTH KOREA Export-Import Bank of Korea 4.125% USD 09/09/2015 3,000,000 3,138,306 0.49Export-Import Bank of Korea 5.875% USD 14/01/2015 1,000,000 1,095,333 0.17Kookmin Bank 7.25% USD 14/05/2014 1,000,000 1,128,423 0.18Korea Development Bank 4.375% USD 10/08/2015 4,000,000 4,176,808 0.65Korea Finance Corp 3.25% USD 20/09/2016 2,000,000 1,993,320 0.31Korea Gas Corp 4.25% USD 02/11/2020 1,000,000 976,633 0.15Korea Hydro & Nuclear Power Co Ltd 4.75% USD 13/07/2021 2,000,000 2,013,328 0.31Korea Hydro & Nuclear Power Co Ltd 6.25% USD 17/06/2014 2,000,000 2,204,854 0.34Korea National Oil Corp 5.375% USD 30/07/2014 3,000,000 3,218,516 0.50Korea South-East Power Co Ltd 6% USD 25/05/2016 1,000,000 1,127,045 0.17Korea Southern Power Co Ltd 5.375% USD 18/04/2013 500,000 526,062 0.08KT Corp 4.875% USD 15/07/2015 2,000,000 2,151,182 0.33KT Corp 5.125% USD 11/04/2012 2,000,000 2,041,020 0.32National Agricultural Cooperative Federation 5% USD 30/09/2014 500,000 533,086 0.08POSCO 4.25% USD 28/10/2020 3,000,000 2,850,687 0.44POSCO 8.75% USD 26/03/2014 3,000,000 3,488,373 0.54Republic of Korea 7.125% USD 16/04/2019 3,500,000 4,381,475 0.68Shinhan Bank 4.375% USD 15/09/2015 2,000,000 2,078,858 0.32Shinhan Bank FRN USD 02/03/2035 3,000,000 2,913,810 0.45Shinhan Bank 6% USD 29/06/2012 2,500,000 2,589,241 0.40Shinhan Bank FRN USD 20/09/2036 1,000,000 999,219 0.15Woori Bank 4.75% USD 20/01/2016 1,000,000 1,044,800 0.16Woori Bank 7% USD 02/02/2015 2,200,000 2,483,881 0.39Woori Bank 7.63% USD 14/04/2015 1,000,000 1,113,232 0.17
50,267,492 7.78
THAILAND PTT PCL 5.875% USD 03/08/2035 500,000 540,212 0.08Siam Commercial Bank Ltd 3.9% USD 14/11/2016 2,000,000 2,026,750 0.31
2,566,962 0.39
UNITED KINGDOM CLP Power Hong Kong Financing Ltd 4.75% USD 12/07/2021 500,000 524,047 0.08CNOOC Finance 2003 Ltd 5.5% USD 21/05/2033 1,950,000 2,165,011 0.34CNOOC Finance 2011 Ltd 4.25% USD 26/01/2021 2,000,000 2,067,069 0.32CNPC HK Overseas Capital Ltd 4.5% USD 28/04/2021 2,000,000 2,037,082 0.32CNPC HK Overseas Capital Ltd 5.95% USD 28/04/2041 3,000,000 3,245,871 0.50Mega Advance Investments Ltd 6.375% USD 12/05/2041 1,500,000 1,488,229 0.23Sinochem Overseas Capital Co Ltd 6.3% USD 12/11/2040 500,000 500,984 0.08Standard Chartered Bank FRN USD Perpetual 7,000,000 7,568,470 1.17
19,596,763 3.04
UNITED STATES CBA Capital Trust II FRN USD Perpetual 2,000,000 1,930,549 0.30Reliance Holdings USA Inc 6.25% USD 19/10/2040 2,000,000 1,956,250 0.30Westpac Capital Trust III FRN USD Perpetual 6,000,000 5,670,000 0.88
9,556,799 1.48
TOTAL BONDS 214,111,515 33.18

Invesco Asia Balanced Fund
88 Invesco Funds
Statement of Investments as at 31 August 2011
Investment Nominal/Shares Market Value Net Assets USD %
TOTAL TRANSFERABLE SECURITIES ADMITTED TO AN OFFICIAL STOCK EXCHANGE LISTING OR DEALT IN ON ANOTHER REGULATED MARKET 612,164,200 94.88
OTHER TRANSFERABLE SECURITIES
BONDS INDIA State Bank of India 4.5% USD 27/07/2015 2,000,000 2,040,400 0.32
MALAYSIA Tenaga Nasional Bhd 7.5% USD 01/11/2025 3,500,000 4,497,945 0.70
TOTAL BONDS 6,538,345 1.02
TOTAL OTHER TRANSFERABLE SECURITIES 6,538,345 1.02
Total Investments 618,702,545 95.90
The accompanying notes form an integral part of these financial statements.

Invesco Pan European High Income Fund
89 Invesco Funds
Statement of Investments as at 31 August 2011
Investment Nominal/Shares Market Value Net Assets EUR %TRANSFERABLE SECURITIES ADMITTED TO AN OFFICIAL STOCK EXCHANGE LISTING OR DEALT IN ON ANOTHER REGULATED MARKET
EQUITIES FINLAND UPM-Kymmene OYJ 27,000 249,075 0.30
FRANCE Cie Generale des Etablissements Michelin 2,846 142,243 0.17Safran SA 6,836 181,308 0.22
323,551 0.39
GERMANY Bilfinger Berger SE 2,125 122,389 0.15Deutsche Boerse AG 6,000 240,240 0.29
362,629 0.44
IRELAND FBD Holdings Plc 13,750 91,094 0.11
NETHERLANDS ASML Holding NV 5,000 122,250 0.15European Aeronautic Defence and Space Co NV 6,988 150,661 0.18ING Groep NV 22,142 130,715 0.16SBM Offshore NV 11,566 165,683 0.20Unilever NV 9,100 211,257 0.25
780,566 0.94
NORWAY Storebrand ASA 28,000 127,429 0.15
PORTUGAL Galp Energia SGPS SA 10,900 148,649 0.18Portucel Empresa Produtora de Pasta e Papel SA 61,600 116,948 0.14
265,597 0.32
SPAIN Banco Bilbao Vizcaya Argentaria SA 27,694 170,249 0.20International Consolidated Airlines Group SA 40,820 79,374 0.09Obrascon Huarte Lain SA 9,816 187,829 0.22Telefonica SA 9,709 139,348 0.17
576,800 0.68
SWITZERLAND Novartis AG 6,674 267,190 0.32Roche Holding AG (Gebusscheine) 2,492 298,829 0.36
566,019 0.68
UNITED KINGDOM G4S Plc 70,260 206,651 0.25
UNITED STATES General Motors Co 5,886 96,120 0.11
TOTAL EQUITIES 3,645,531 4.37
BONDS AUSTRALIA Origin Energy Finance Ltd FRN EUR 16/06/2071 1,000,000 959,615 1.15

Invesco Pan European High Income Fund
90 Invesco Funds
Statement of Investments as at 31 August 2011
Investment Nominal/Shares Market Value Net Assets EUR %AUSTRIA OMV AG FRN EUR Perpetual 250,000 251,511 0.30Sappi Papier Holding GmbH 6.625% EUR 15/04/2018 700,000 616,938 0.74
868,449 1.04
CAYMAN ISLANDS IPIC GMTN Ltd 5.875% EUR 14/03/2021 500,000 515,333 0.62UPCB Finance Ltd 7.625% EUR 15/01/2020 400,000 383,226 0.46
898,559 1.08
FRANCE AXA SA FRN GBP Perpetual 100,000 89,207 0.11BNP Paribas SA FRN GBP Perpetual 100,000 86,746 0.10BNP Paribas SA FRN EUR Perpetual 100,000 91,718 0.11BNP Paribas SA FRN EUR Perpetual 2,000,000 1,930,620 2.31BPCE SA FRN EUR Perpetual 100,000 71,785 0.09BPCE SA FRN EUR Perpetual 1,000,000 913,925 1.09BPCE SA 13% USD Perpetual 154,500 114,201 0.14Cie Generale de Geophysique - Veritas 7.75% USD 15/05/2017 50,000 34,894 0.04Cie Generale de Geophysique - Veritas 9.5% USD 15/05/2016 100,000 72,733 0.09Credit Agricole SA FRN EUR Perpetual 1,200,000 1,101,000 1.32Credit Agricole SA 9.75% USD Perpetual 100,000 69,269 0.08Groupe des Assurances Mutuelles Agricoles FRN EUR Perpetual 1,000,000 501,040 0.60Korreden SA FRN EUR 01/08/2014 26,667 8,665 0.01Rexel SA 7% EUR 17/12/2018 1,000,000 937,310 1.12Societe Generale SA FRN EUR Perpetual 1,300,000 1,091,539 1.30Societe Generale SA FRN GBP Perpetual 100,000 90,210 0.11Societe Generale SA FRN EUR Perpetual 1,000,000 916,880 1.10SPCM SA 8.25% EUR 15/06/2017 250,000 251,322 0.30Suez Environnement Co FRN EUR Perpetual 1,000,000 950,925 1.14
9,323,989 11.16
GERMANY ALBA Group Plc & Co KG 8% EUR 15/05/2018 400,000 384,002 0.46Commerzbank AG 7.75% EUR 16/03/2021 1,000,000 888,535 1.06Kabel BW Erste Beteiligungs GmbH / Kabel Baden-Wurttemberg GmbH & Co KG 7.5% EUR 15/03/2019 300,000 295,500 0.35Musketeer GmbH 9.5% EUR 15/03/2021 200,000 199,000 0.24RWE AG FRN EUR Perpetual 1,000,000 934,915 1.12Unitymedia GmbH 9.625% EUR 01/12/2019 300,000 301,842 0.36Unitymedia Hessen GmbH & Co KG 8.125% EUR 01/12/2017 300,000 303,307 0.36
3,307,101 3.95
IRELAND Ono Finance II Plc 11.125% EUR 15/07/2019 100,000 86,375 0.10Smurfit Kappa Acquisitions 7.75% EUR 15/11/2019 300,000 285,717 0.34Smurfit Kappa Funding Plc 7.75% EUR 01/04/2015 250,000 244,687 0.29
616,779 0.73
ITALY Intesa Sanpaolo SpA FRN EUR Perpetual 2,250,000 1,876,342 2.24Italy Buoni Poliennali Del Tesoro 3% EUR 01/04/2014 2,000,000 1,962,320 2.35Italy Buoni Poliennali Del Tesoro 3.75% EUR 01/03/2021 2,000,000 1,830,250 2.19Lottomatica SpA FRN EUR 31/03/2066 200,000 177,000 0.21UniCredit SpA 6.125% EUR 19/04/2021 1,000,000 873,175 1.04
6,719,087 8.03
LUXEMBOURG Aguila 3 SA 7.875% CHF 31/01/2018 150,000 123,134 0.15Beverage Packaging Holdings Luxembourg II SA 9.5% EUR 15/06/2017 1,150,000 918,919 1.10Bormioli Rocco Holdings SA 10% EUR 01/08/2018 1,000,000 988,810 1.18Codere Finance Luxembourg SA 8.25% EUR 15/06/2015 400,000 374,750 0.45

Invesco Pan European High Income Fund
91 Invesco Funds
Statement of Investments as at 31 August 2011
Investment Nominal/Shares Market Value Net Assets EUR %LUXEMBOURG (CONTINUED) ConvaTec Healthcare E SA 7.375% EUR 15/12/2017 100,000 89,937 0.11Expro Finance Luxembourg SCA 8.5% USD 15/12/2016 500,000 320,370 0.38Mark IV Europe Lux SCA / Mark IV USA SCA 8.875% EUR 15/12/2017 100,000 101,000 0.12UBI Banca International SA 8.75% EUR 29/10/2012 60,000 41,550 0.05UniCredit International Bank Luxembourg SA FRN EUR Perpetual 1,000,000 782,190 0.94Wind Acquisition Finance SA 7.375% EUR 15/02/2018 900,000 821,263 0.98Wind Acquisition Finance SA 11.75% EUR 15/07/2017 300,000 300,000 0.36Xefin Lux SCA 8% EUR 01/06/2018 500,000 453,750 0.54Zinc Capital SA 8.875% EUR 15/05/2018 200,000 187,000 0.22
5,502,673 6.58
NETHERLANDS Allianz Finance II BV FRN EUR 08/07/2041 500,000 426,100 0.51Brenntag Finance BV 5.5% EUR 19/07/2018 500,000 490,268 0.59EDP Finance BV 8.625% GBP 04/01/2024 400,000 408,693 0.49ING Groep NV 8% EUR Perpetual 400,000 383,366 0.46Intergen NV 8.5% EUR 30/06/2017 200,000 207,000 0.25OI European Group BV 6.75% EUR 15/09/2020 100,000 91,541 0.11Pfleiderer Finance BV 7.125% EUR Perpetual 200,000 8,000 0.01UPC Holding BV 9.75% EUR 15/04/2018 150,000 150,531 0.18Wereldhave NV 2.875% EUR 18/11/2015 550,000 503,250 0.60
2,668,749 3.20
PORTUGAL Parpublica - Participiacoes Publicas SGPS SA 3.25% EUR 18/12/2014 500,000 404,350 0.48
SPAIN Abengoa SA 4.5% EUR 03/02/2017 600,000 522,300 0.62Abengoa SA 8.5% EUR 31/03/2016 100,000 93,445 0.11BBVA International Preferred SAU FRN GBP Perpetual 100,000 101,245 0.12Cemex Espana Luxembourg 9.25% USD 12/05/2020 158,000 88,651 0.11Obrascon Huarte Lain SA 8.75% EUR 15/03/2018 1,000,000 940,000 1.12Santander Finance Preferred SA Unipersonal FRN GBP Perpetual 1,000,000 1,129,375 1.35Spain Government Bond 4.85% EUR 31/10/2020 2,000,000 1,992,610 2.38
4,867,626 5.81
SWITZERLAND UBS AG 3.22% EUR 31/07/2012 3,500,000 1,340,938 1.60UBS AG FRN EUR Perpetual 100,000 77,375 0.09
1,418,313 1.69
UNITED KINGDOM Anglian Water Osprey Financing Plc 7% GBP 31/01/2018 1,000,000 1,082,054 1.29Avis Finance Co Plc FRN EUR 31/07/2013 200,000 197,170 0.24Aviva Plc FRN EUR Perpetual 50,000 39,864 0.05Aviva Plc FRN GBP Perpetual 50,000 43,357 0.05Bakkavor Finance 2 Plc 8.25% GBP 15/02/2018 500,000 400,145 0.48Barclays Bank Plc FRN EUR Perpetual 1,000,000 563,930 0.67Barclays Bank Plc 6.625% EUR 30/03/2022 1,000,000 870,590 1.04Barclays Bank Plc 10% GBP 21/05/2021 80,000 98,715 0.12Care UK Health & Social Care Plc 9.75% GBP 01/08/2017 250,000 257,232 0.31Cattles Plc 7.125% GBP 05/07/2017 100,000 3,102 –Clerical Medical Finance Plc FRN GBP Perpetual 100,000 96,097 0.11Co-Operative Bank Plc FRN GBP Perpetual 100,000 80,079 0.10DFS Furniture Holdings Plc 9.75% GBP 15/07/2017 1,000,000 968,719 1.16Eco-Bat Finance Plc 10.125% EUR 31/01/2013 73,000 73,595 0.09Enterprise Inns Plc 6.5% GBP 06/12/2018 1,000,000 865,784 1.04FCE Bank Plc 7.125% EUR 16/01/2012 2,000,000 2,016,930 2.41First Hydro Finance Plc 9% GBP 31/07/2021 100,000 134,132 0.16HSBC Capital Funding LP FRN EUR Perpetual 1,050,000 973,686 1.16Ineos Finance Plc 9.25% EUR 15/05/2015 200,000 197,665 0.24Ineos Group Holdings Ltd 7.875% EUR 15/02/2016 400,000 332,000 0.40Investec Tier I UK LP Plc FRN EUR Perpetual 50,000 39,857 0.05

Invesco Pan European High Income Fund
92 Invesco Funds
Statement of Investments as at 31 August 2011
Investment Nominal/Shares Market Value Net Assets EUR %UNITED KINGDOM (CONTINUED) ISS Financing Plc 11% EUR 15/06/2014 200,000 209,181 0.25LBG Capital No.1 Plc 6.439% EUR 23/05/2020 2,000,000 1,420,400 1.70LBG Capital No.1 Plc 11.04% GBP 19/03/2020 250,000 266,207 0.32LBG Capital No.2 Plc 6.385% EUR 12/05/2020 400,000 284,316 0.34LBG Capital No.2 Plc 11.25% GBP 14/09/2023 200,000 212,637 0.25LBG Capital No.2 Plc 11.875% GBP 01/09/2024 200,000 219,406 0.26LBG Capital No.2 Plc 16.125% GBP 10/12/2024 200,000 270,356 0.32Legal & General Group Plc FRN GBP Perpetual 50,000 46,210 0.06Legal & General Group Plc FRN GBP 23/07/2041 200,000 281,961 0.34Matalan Finance Plc 8.875% GBP 29/04/2016 400,000 386,921 0.46Nationwide Building Society FRN GBP Perpetual 100,000 110,107 0.13Northern Rock Asset Management Plc 9.375% GBP 17/10/2021 350,000 338,556 0.40Northern Rock Asset Management Plc 10.375% GBP 25/03/2018 600,000 609,147 0.73Odeon & UCI Finco Plc 9% GBP 01/08/2018 1,000,000 1,029,199 1.23Peel Land & Property Investments Plc 8.375% GBP 30/04/2040 100,000 117,803 0.14Prudential Plc 6.5% USD Perpetual 75,000 47,046 0.06Rexam Plc FRN EUR 29/06/2067 100,000 92,198 0.11Royal Bank of Scotland Plc/The FRN EUR 23/02/2045 300,000 196,500 0.23RSA Insurance Group Plc FRN GBP Perpetual 50,000 57,555 0.07Scottish & Southern Energy Plc FRN EUR Perpetual 1,000,000 960,370 1.15Scottish Mutual Assurance Ltd FRN GBP Perpetual 85,000 58,549 0.07Southern Water Greensands Financing Plc 8.5% GBP 15/04/2019 1,000,000 1,048,838 1.25Standard Chartered Bank FRN USD Perpetual 200,000 149,789 0.18Standard Life Plc FRN EUR 12/07/2022 50,000 50,751 0.06Thames Water Kemble Finance Plc 7.75% GBP 01/04/2019 1,000,000 1,077,542 1.29UBS Capital Securities Jersey Ltd FRN EUR Perpetual 400,000 399,500 0.48Vedanta Resources Plc 8.25% USD 07/06/2021 1,000,000 658,058 0.79Virgin Media Finance Plc 8.875% GBP 15/10/2019 200,000 241,678 0.29Virgin Media Finance Plc 9.5% EUR 15/08/2016 200,000 213,833 0.26Virgin Media Secured Finance Plc 7% GBP 15/01/2018 250,000 294,400 0.35Yorkshire Building Society FRN GBP Perpetual 50,000 38,239 0.05
20,721,956 24.79
UNITED STATES American International Group Inc FRN EUR 15/03/2067 300,000 214,376 0.26American International Group Inc FRN EUR 22/05/2038 150,000 137,390 0.16American International Group Inc FRN USD 15/05/2058 250,000 170,705 0.20Bank of America Corp FRN EUR 23/05/2017 500,000 404,950 0.48Chesapeake Corp 7% EUR 15/12/2014 100,000 10,000 0.01Chrysler Group LLC/CG Co-Issuer Inc 8% USD 15/06/2019 500,000 290,931 0.35Deutsche Bank Capital Funding Trust XI 9.5% EUR Perpetual 500,000 511,095 0.61Ford Motor Co 7.45% USD 16/07/2031 100,000 75,734 0.09General Electric Capital Corp FRN EUR 15/09/2067 107,000 94,493 0.11General Motors Co PFD 4.75% USD 01/12/2013 25,750 704,020 0.84Hertz Corp 7.875% EUR 01/01/2014 50,000 49,781 0.06Iron Mountain Inc 6.75% EUR 15/10/2018 1,790,000 1,743,192 2.08Levi Strauss & Co 7.75% EUR 15/05/2018 2,000,000 1,755,000 2.10Nalco Co 6.875% EUR 15/01/2019 100,000 109,143 0.13RBS Capital Trust D 5.646% GBP Perpetual 100,000 78,591 0.09
6,349,401 7.57
TOTAL BONDS 64,626,647 77.26
TOTAL TRANSFERABLE SECURITIES ADMITTED TO AN OFFICIAL STOCK EXCHANGE LISTING OR DEALT IN ON ANOTHER REGULATED MARKET 68,272,178 81.63
OTHER TRANSFERABLE SECURITIES
BONDS LUXEMBOURG M&G Finance Luxembourg SA 7.5% EUR Perpetual 100,000 47,250 0.06

Invesco Pan European High Income Fund
93 Invesco Funds
Statement of Investments as at 31 August 2011
Investment Nominal/Shares Market Value Net Assets EUR %NETHERLANDS Boats Investments BV/Netherlands 11% EUR 31/03/2017 154,226 116,440 0.14Hollandwide Parent BV 0% EUR 01/08/2014 73,000 2,190 –
118,630 0.14
UNITED KINGDOM Boparan Finance Plc 9.875% GBP 30/04/2018 500,000 450,577 0.54
UNITED STATES Bank of America Corp FRN USD Perpetual 100,000 65,144 0.08Jarden Corp 7.5% EUR 15/01/2020 500,000 503,750 0.60
568,894 0.68
TOTAL BONDS 1,185,351 1.42
WARRANTS UNITED KINGDOM Taylor Wimpey WTS 15/05/2014 4,495 371 –
UNITED STATES General Motors Co WTS 10/07/2016 5,351 54,858 0.07General Motors Co WTS 10/07/2019 5,351 37,770 0.04
92,628 0.11
TOTAL WARRANTS 92,999 0.11
TOTAL OTHER TRANSFERABLE SECURITIES 1,278,350 1.53
Total Investments 69,550,528 83.16
The accompanying notes form an integral part of these financial statements.

Invesco Global Absolute Return Fund
94 Invesco Funds
Statement of Investments as at 31 August 2011
Investment Nominal/Shares Market Value Net Assets EUR %OPEN-ENDED FUNDS IRELAND Short-Term Investments Co Global Series - Euro Liquidity Portfolio 1,000,000 1,000,000 7.31
TOTAL OPEN-ENDED FUNDS 1,000,000 7.31
Total Investments 1,000,000 7.31
The accompanying notes form an integral part of these financial statements.

Invesco Balanced-Risk Allocation Fund
95 Invesco Funds
Statement of Investments as at 31 August 2011
Investment Nominal/Shares Market Value Net Assets EUR %TRANSFERABLE SECURITIES ADMITTED TO AN OFFICIAL STOCK EXCHANGE LISTING OR DEALT IN ON ANOTHER REGULATED MARKET
BONDS GERMANY German Treasury Bill 0% EUR 12/10/2011 30,000,000 29,985,750 13.32German Treasury Bill 0% EUR 09/11/2011 30,000,000 29,962,500 13.32German Treasury Bill 0% EUR 11/01/2012 30,000,000 29,947,500 13.31German Treasury Bill 0% EUR 15/02/2012 25,000,000 24,953,125 11.09
114,848,875 51.04
TOTAL BONDS 114,848,875 51.04
STRUCTURED PRODUCTS IRELAND Source Physical Markets Gold P-ETC 58,500 7,375,504 3.28
LUXEMBOURG RBS Market Access RICI Agriculture Index ETF 139,500 15,029,730 6.68
UNITED KINGDOM DB WTI Crude Oil Booster ETC 161,000 11,968,146 5.32ETFS Copper ETP USD 500,000 15,774,344 7.01Gold Bullion Securities Ltd 0% Secured Undated NTS 168,200 20,720,882 9.21
48,463,372 21.54
TOTAL STRUCTURED PRODUCTS 70,868,606 31.50
TOTAL TRANSFERABLE SECURITIES ADMITTED TO AN OFFICIAL STOCK EXCHANGE LISTING OR DEALT IN ON ANOTHER REGULATED MARKET 185,717,481 82.54
Total Investments 185,717,481 82.54
The accompanying notes form an integral part of these financial statements.

Invesco Funds Statement of Net Assets as at 31 August 2011
96 Invesco Funds
Invesco Global
Structured Equity Fund
Invesco Emerging
Market Quantitative Equity Fund
Invesco US Structured
Equity Fund
Invesco Latin American
Equity Fund
Invesco Pan European
Structured Equity Fund
Notes USD USD USD USD EUR
ASSETS
Investments at market value 2(b) 35,751,967 22,699,189 68,139,935 6,790,636 603,461,304
CURRENT ASSETS
Due from brokers – 11,037 – 631 –
Receivable for Shares issued 91,399 182,372 3,068,802 485 4,039,648
Other debtors 171,264 122,878 139,455 85,142 1,819,280
Bank balances 1,481,454 1,540,042 2,726,352 149,631 35,152,435Net unrealised gain on forward foreign exchange contracts/futures contracts 7,8,2(i)&2(j) 136,779 134,302 178,839 11,008 492,579
Net unrealised gain on equity swaps 11&2(m) – – – – –
Net unrealised gain on credit default swaps 9&2(k) – – – – –
Total Assets 37,632,863 24,689,820 74,253,383 7,037,533 644,965,246
CURRENT LIABILITIES
Bank overdraft 218,197 16,869 – – –
Due to brokers – 55,859 – 97,710 –
Payable for Shares redeemed 65,226 21,797 2,025,817 4,707 584,776
Other creditors 30,833 9,470 46,689 7,440 284,665Net unrealised loss on forward foreign exchange contracts/future contracts 7,8,2(i)&2(j) 469,333 75,533 82,408 2,398 –
Net unrealised loss on equity swaps 11&2(m) – – – – –
Net unrealised loss on credit default swaps 9&2(k) – – – – –
Net unrealised loss on interest rate swaps 10&2(l) – – – – –
Total Liabilities 783,589 179,528 2,154,914 112,255 869,441
Net Assets 36,849,274 24,510,292 72,098,469 6,925,278 644,095,805

Invesco Funds Statement of Net Assets as at 31 August 2011
97 Invesco Funds
Invesco Pan European
Equity Fund
*Invesco Pan European
Small Cap Equity Fund
Invesco European
Growth Equity Fund
Invesco Pan European Equity Income
Fund
Invesco Emerging
Europe Equity Fund
Invesco Pan European Focus Equity
Fund¹
Notes EUR EUR EUR EUR USD EUR
ASSETS
Investments at market value 2(b) 623,020,159 75,128,326 48,484,910 4,684,874 39,418,240 1,159,262
CURRENT ASSETS
Due from brokers 1,301,376 272,089 226,415 4,833 359,270 –
Receivable for Shares issued 1,479,816 – 4,384 – 359,231 –
Other debtors 2,084,535 146,121 126,890 56,902 77,594 52,851
Bank balances 1,307,062 1,880,532 2,628,382 195,761 1,003,495 14,721Net unrealised gain on forward foreign exchange contracts/futures contracts 7,8,2(i)&2(j) – – – – – –
Net unrealised gain on equity swaps 11&2(m) – – – – – –
Net unrealised gain on credit default swaps 9&2(k) – – – – – –
Total Assets 629,192,948 77,427,068 51,470,981 4,942,370 41,217,830 1,226,834
CURRENT LIABILITIES
Bank overdraft 214,916 – – 1,621 21,509 –
Due to brokers 29,627 139,244 – 8,066 647,612 –
Payable for Shares redeemed 216,220 41,810 14,783 – 22,908 –
Other creditors 355,032 63,563 41,982 3,172 64,543 50,824Net unrealised loss on forward foreign exchange contracts/future contracts 7,8,2(i)&2(j) 67 – – – 327 –
Net unrealised loss on equity swaps 11&2(m) – – – – – –
Net unrealised loss on credit default swaps 9&2(k) – – – – – –
Net unrealised loss on interest rate swaps 10&2(l) – – – – – –
Total Liabilities 815,862 244,617 56,765 12,859 756,899 50,824
Net Assets 628,377,086 77,182,451 51,414,216 4,929,511 40,460,931 1,176,010
¹ Invesco Pan European Focus Equity Fund launched 7 July 2011 * Funds which swung the price on 31 August 2011

Invesco Funds Statement of Net Assets as at 31 August 2011
98 Invesco Funds
Invesco Nippon
Small/Mid Cap Equity Fund
Invesco Nippon Select Equity Fund
Invesco Asia
Opportunities Equity Fund
Invesco Greater China
Equity Fund
Invesco Asia
Infrastructure Fund
Notes JPY JPY USD USD USD
ASSETS
Investments at market value 2(b) 3,502,191,365 6,682,558,200 149,101,971 570,814,381 2,474,147,861
CURRENT ASSETS
Due from brokers 7,581,259 – 1,107,316 2,293,627 –
Receivable for Shares issued 3,245,858 – 657 160,819 125,667
Other debtors 3,045,347 3,547,671 357,016 1,699,233 6,528,385
Bank balances 135,898,096 44,981,730 587,679 1,197,830 41,872,898Net unrealised gain on forward foreign exchange contracts/futures contracts 7,8,2(i)&2(j) – – 3 262,859 1,020,967
Net unrealised gain on equity swaps 11&2(m) – – – – –
Net unrealised gain on credit default swaps 9&2(k) – – – – –
Total Assets 3,651,961,925 6,731,087,601 151,154,642 576,428,749 2,523,695,778
CURRENT LIABILITIES
Bank overdraft 350,665 1,640,447 30,308 420,623 65,420
Due to brokers 115,969 – – 3,452,990 –
Payable for Shares redeemed 891,017 7,928,761 97,799 89,535 14,220,586
Other creditors 3,666,495 5,868,342 214,415 421,122 6,293,321Net unrealised loss on forward foreign exchange contracts/future contracts 7,8,2(i)&2(j) 3,220 4,712 – 193,893 210,138
Net unrealised loss on equity swaps 11&2(m) – – – – –
Net unrealised loss on credit default swaps 9&2(k) – – – – –
Net unrealised loss on interest rate swaps 10&2(l) – – – – –
Total Liabilities 5,027,366 15,442,262 342,522 4,578,163 20,789,465
Net Assets 3,646,934,559 6,715,645,339 150,812,120 571,850,586 2,502,906,313

Invesco Funds Statement of Net Assets as at 31 August 2011
99 Invesco Funds
Invesco India Equity
Fund
Invesco Asia ConsumerDemand Fund
Invesco Global Leisure
Fund Invesco
Energy Fund
Invesco Asia Pacific Real Estate
Securities Fund
Invesco Global Income
Real Estate Securities Fund
Notes USD USD USD USD USD USD
ASSETS
Investments at market value 2(b) 177,959,884 998,078,664 23,952,639 365,649,692 3,052,166 9,142,128
CURRENT ASSETS
Due from brokers 237,756 14,186,511 54,301 – 14,920 –
Receivable for Shares issued 1,431,385 1,531,988 105,495 16,067,453 700 946
Other debtors 229,629 1,432,151 9,746 404,722 77,364 34,453
Bank balances 4,442,674 519,766 1,303 18,417,454 42,675 111,512Net unrealised gain on forward foreign exchange contracts/futures contracts 7,8,2(i)&2(j) 27 1,149,096 – 426,234 2 1
Net unrealised gain on equity swaps 11&2(m) – – – – – –
Net unrealised gain on credit default swaps 9&2(k) – – – – – –
Total Assets 184,301,355 1,016,898,176 24,123,484 400,965,555 3,187,827 9,289,040
CURRENT LIABILITIES
Bank overdraft – – 52,185 297,311 – –
Due to brokers 406,991 11,783,751 – 3,246,050 1,743 –
Payable for Shares redeemed – 124,737 1,307 16,551,592 2,801 –
Other creditors 285,784 669,881 30,100 228,497 1,991 22,615Net unrealised loss on forward foreign exchange contracts/future contracts 7,8,2(i)&2(j) – 204,693 6 152,762 – –
Net unrealised loss on equity swaps 11&2(m) – – – – – –
Net unrealised loss on credit default swaps 9&2(k) – – – – – –
Net unrealised loss on interest rate swaps 10&2(l) – – – – –
Total Liabilities 692,775 12,783,062 83,598 20,476,212 6,535 22,615
Net Assets 183,608,580 1,004,115,114 24,039,886 380,489,343 3,181,292 9,266,425

Invesco Funds Statement of Net Assets as at 31 August 2011
100 Invesco Funds
Invesco Gold & Precious
Metals Fund
Invesco USD Reserve
Fund
Invesco Euro Reserve
Fund
Invesco Global Bond
Fund
Invesco European Bond
Fund
Notes USD USD EUR USD EUR
ASSETS
Investments at market value 2(b) 25,839,643 55,999,744 343,332,600 30,499,333 47,362,520
CURRENT ASSETS
Due from brokers – – – – –
Receivable for Shares issued 2,521 1,972,500 4,189,513 98,608 53,286
Other debtors 63,769 72,906 202,996 407,894 890,583
Bank balances 866,556 58,603,298 176,268,551 7,324,108 5,648,041Net unrealised gain on forward foreign exchange contracts/futures contracts 7,8,2(i)&2(j) 125,757 7 – 61,715 1,741
Net unrealised gain on equity swaps 11&2(m) – – – – –
Net unrealised gain on credit default swaps 9&2(k) – – – – –
Total Assets 26,898,246 116,648,455 523,993,660 38,391,658 53,956,171
CURRENT LIABILITIES
Bank overdraft 23,707 50,808 – – –
Due to brokers – 3,996,903 – 1,307,513 –
Payable for Shares redeemed 163,201 8,164,636 6,159,512 345,582 572
Other creditors 24,198 77,686 224,499 35,587 33,976Net unrealised loss on forward foreign exchange contracts/future contracts 7,8,2(i)&2(j) 12,949 105 – 274,977 108,201
Net unrealised loss on equity swaps 11&2(m) – – – – –
Net unrealised loss on credit default swaps 9&2(k) – – – – –
Net unrealised loss on interest rate swaps 10&2(l) – – – – –
Total Liabilities 224,055 12,290,138 6,384,011 1,963,659 142,749
Net Assets 26,674,191 104,358,317 517,609,649 36,427,999 53,813,422
* Funds which swung the price on 31 August 2011

Invesco Funds Statement of Net Assets as at 31 August 2011
101 Invesco Funds
*Invesco Absolute Return
Bond Fund
*Invesco Euro Inflation-
Linked Bond Fund
*Invesco Euro Corporate
Bond Fund
*Invesco UK Investment
Grade Bond Fund
*Invesco Emerging Local Currencies Debt
Fund
Invesco Global
Investment Grade
Corporate Bond Fund
Notes EUR EUR EUR GBP USD USD
ASSETS
Investments at market value 2(b) 18,455,402 51,903,573 2,293,580,423 66,660,557 709,774,439 15,375,208
CURRENT ASSETS
Due from brokers 508,407 323,814 – 13,009,091 – 7,662,483
Receivable for Shares issued – 1,545,304 699,746 184,802 8,853,808 46,322
Other debtors 302,616 365,248 62,358,633 1,205,254 13,364,322 394,163
Bank balances 1,610,170 541,090 170,454,223 377,305 14,509,446 651,970Net unrealised gain on forward foreign exchange contracts/futures contracts 7,8,2(i)&2(j) 168,961 9,646 – 37,786 2,404,558 129,886
Net unrealised gain on equity swaps 11&2(m) – – – – – –
Net unrealised gain on credit default swaps 9&2(k) – – – – – –
Total Assets 21,045,556 54,688,675 2,527,093,025 81,474,795 748,906,573 24,260,032
CURRENT LIABILITIES
Bank overdraft 1,048,830 – – 24,964 767,147 2,611
Due to brokers 570,660 – – 12,946,048 – 7,649,915
Payable for Shares redeemed 55,997 532,382 6,297,786 7,164 297,964 15,767
Other creditors 23,653 34,561 1,118,987 39,939 476,043 53,384Net unrealised loss on forward foreign exchange contracts/future contracts 7,8,2(i)&2(j) 472,096 183,940 26,728,250 557,227 2,124,383 502,206
Net unrealised loss on equity swaps 11&2(m) – – – – – –
Net unrealised loss on credit default swaps 9&2(k) 64,570 – 8,477,114 – – –
Net unrealised loss on interest rate swaps 10&2(l) – – – – – –
Total Liabilities 2,235,806 750,883 42,622,137 13,575,342 3,665,537 8,223,883
Net Assets 18,809,750 53,937,792 2,484,470,888 67,899,453 745,241,036 16,036,149
* Funds which swung the price on 31 August 2011

Invesco Funds Statement of Net Assets as at 31 August 2011
102 Invesco Funds
Invesco Global
Unconstrained Bond Fund
Invesco Global Total
Return (EUR) Bond Fund
Invesco Emerging
Market Corporate Bond
Fund²
Invesco Euro Short Term Bond
Fund³
*Invesco Capital Shield
90 (EUR) Fund
Notes GBP EUR USD EUR EUR
ASSETS
Investments at market value 2(b) 2,509,539 19,927,280 9,948,255 9,277,595 81,724,828
CURRENT ASSETS
Due from brokers – 2,011,600 – – –
Receivable for Shares issued 157 – – – 480
Other debtors 120,214 643,058 252,603 248,817 35,336
Bank balances 540,689 3,637,222 102,984 158,254 29,663,681Net unrealised gain on forward foreign exchange contracts/futures contracts 7,8,2(i)&2(j) 42,111 25,603 41,205 79,879 417,124
Net unrealised gain on equity swaps 11&2(m) – – – – –
Net unrealised gain on credit default swaps 9&2(k) – – – – –
Total Assets 3,212,710 26,244,763 10,345,047 9,764,545 111,841,449
CURRENT LIABILITIES
Bank overdraft 114,561 – – 2,377 –
Due to brokers 40,645 – – – –
Payable for Shares redeemed – 30,016 – – 841,210
Other creditors 31,369 48,486 81,319 55,065 82,848Net unrealised loss on forward foreign exchange contracts/future contracts 7,8,2(i)&2(j) 33,524 1,817 837 139,262 1,149,955
Net unrealised loss on equity swaps 11&2(m) – – – – –
Net unrealised loss on credit default swaps 9&2(k) 111,849 40,174 – – –
Net unrealised loss on interest rate swaps 10&2(l) – – – – –
Total Liabilities 331,948 120,493 82,156 196,704 2,074,013
Net Assets 2,880,762 26,124,270 10,262,891 9,567,841 109,767,436
²Invesco Emerging Market Corporate Bond Fund launched on 4 May 2011 ³ Invesco Euro Short Term Bond Fund launched on 4 May 2011 * Funds which swung the price on 31 August 2011

Invesco Funds Statement of Net Assets as at 31 August 2011
103 Invesco Funds
Invesco
Asia Balanced Fund
Invesco Pan European
High Income Fund
*Invesco Global Absolute
Return Fund
*Invesco Balanced-Risk
Allocation Fund
31.08.2011Consolidated Net
Assets USD Equiv
Notes USD EUR EUR EUR USD
ASSETS
Investments at market value 2(b) 618,702,545 69,550,528 1,000,000 185,717,481 13,122,908,999
CURRENT ASSETS
Due from brokers 23,212,080 – – 173,173 77,430,232
Receivable for Shares issued 1,586,481 111,368 33,168 4,682,801 60,351,277
Other debtors 8,257,487 2,141,706 21,898 37,473 139,741,549
Bank balances 6,377,786 12,841,454 12,577,981 34,507,345 872,719,642Net unrealised gain on forward foreign exchange contracts/futures contracts 7,8,2(i)&2(j) 344,029 150,436 98,528 5,840,554 17,078,721
Net unrealised gain on equity swaps 11&2(m) – – 1,157,008 – 1,670,951
Net unrealised gain on credit default swaps 9&2(k) – 23,353 – – 33,726
Total Assets 658,480,408 84,818,845 14,888,583 230,958,827 14,291,935,097
CURRENT LIABILITIES
Bank overdraft 11,146,765 – 102 1,887,159 17,923,480
Due to brokers 751,458 – – 173,210 55,921,518
Payable for Shares redeemed 908,320 178,497 9,881 4,566 64,867,426
Other creditors 442,096 59,505 17,387 141,648 13,569,803Net unrealised loss on forward foreign exchange contracts/future contracts 7,8,2(i)&2(j) 46,969 745,452 122,816 3,739,041 53,541,141
Net unrealised loss on equity swaps 11&2(m) – – 1,054,623 – 1,523,087
Net unrealised loss on credit default swaps 9&2(k) – 200,869 – – 12,866,530
Net unrealised loss on interest rate swaps 10&2(l) – – – – –
Total Liabilities 13,295,608 1,184,323 1,204,809 5,945,624 220,212,985
Net Assets 645,184,800 83,634,522 13,683,774 225,013,203 14,071,722,112
* Funds which swung the price on 31 August 2011

Notes to the Financial Statements (continued)
104 Invesco Funds
1. General Invesco Funds (the “Fund”) is an investment company organised under part I of the Luxembourg Law on collective investment of December 20, 2002 as a Société Anonyme qualifying as a Société d’Investissement à Capital Variable (“SICAV”). Invesco Funds is an umbrella fund, comprising 42 active sub-funds with each sub-fund being treated as a separate entity. (a) Invesco India (Mauritius) Limited Investments in Indian securities are made through a wholly-owned Mauritian subsidiary, Invesco India (Mauritius) Limited (the "Subsidiary"), whose sole object is to carry out investment activities on behalf of the Fund. The Subsidiary is wholly owned by Invesco India Equity Fund. The Subsidiary holds a Category 1 Global Business Licence issued by the Mauritius Offshore Business Activities Authority. As a result it is subject to a reduced rate of Mauritian income tax on its income. In addition, no capital gains tax will be payable in respect of the Subsidiary's investments in India and any dividends and redemption proceeds paid by the Subsidiary to the Invesco India Equity Fund will be exempt from Mauritian withholding tax. (b) Classes of Shares The Shares of some of the sub-funds are available in up to seven classes (Class A, Class B, Class B1, Class C, Class E, Class I and Class R). Class A Shares are available without any restraints. Class B Shares are available to customers of distributors or intermediaries appointed specifically for the purpose of distributing the B Shares and only in respect of those Funds in respect of which distribution arrangements have been made with such distributors. Class C Shares are available to all investors, which have a higher minimum initial subscription amount and benefit from reduced management charges, are intended primarily for larger or institutional investors. Class E Shares denominated in Euro have a lower initial subscription amount and higher annual management fee than either the A or the C Class. Class B1 Shares are only available to customers of Merrill Lynch. Class I Shares are denominated in Euro and are only available to Institutional clients who have an Institutional Management Agreement in place with Invesco. Class R shares are available without any restraints. There are distributing A ,C & R Share Classes, hedged share classes and fixed distribution share classes within some of the sub-funds. Hedged Share Classes are available to investors on several sub-funds. For such classes of Shares, the SICAV may hedge the currency exposure of classes of Shares denominated in a currency other than the base currency of the relevant Fund, in order to attempt to mitigate the effect of fluctuations in the exchange rate between the Share class currency and the base currency. (c) Activity of the Fund Activity on the Fund since 28 February 2011 Share Class Launch Effective 6 April 2011 'R' Share Class was launched for the following funds: Invesco Euro Corporate Bond Fund R Accumulation (EUR)
Invesco Euro Corporate Bond Fund R Monthly Distribution (EUR) Invesco Emerging Local Currencies Debt Fund R Fixed Monthly Distribution (USD) Invesco Global Total Return (EUR) Bond Fund R Monthly Distribution (EUR) Invesco Euro Inflation Linked Bond Fund R Accumulation (EUR) Invesco Balanced Risk Allocation Fund R Accumulation (EUR) Invesco Pan European Equity Fund R Accumulation (EUR) Invesco Pan European Structured Equity Fund R Accumulation (EUR) Invesco Asia Balanced Fund R Accumulation (USD) Invesco Asia Consumer Demand Fund R Accumulation (USD) Invesco Asia Infrastructure Fund R Accumulation (USD)
Invesco Greater China Equity Fund R Accumulation (USD) Invesco Energy Fund R Accumulation (USD) Invesco Gold & Precious Metals Fund R Accumulation (USD) Invesco Euro Short Term Bond Fund The Invesco Euro Short Term Bond Fund was launched on 4 May 2011. Invesco Emerging Market Corporate Bond Fund The Invesco Emerging Market Corporate Bond Fund was launched on 4 May 2011. Share Class Launch - Effective 7 July 2011, ‘A’ Share Class was launched on the following Funds: Invesco Nippon Small Mid Cap Equity Fund A Annual Distributing (USD) Invesco Asia Infrastructure Fund A Accumulation (HKD) Invesco Indian Equity Fund A Accumulation (HKD) Invesco Asia Consumer Demand Fund A Accumulation (HKD) Invesco Energy Fund A Accumulation (HKD) Invesco Gold & Precious Metals Fund A Accumulation (HKD) Invesco Emerging Local Currencies Debt Fund A HKD MD Invesco Nippon Small Mid Cap Equity Fund A & C Annual Distribution (USD) Invesco Pan European Focus Equity Fund The Invesco Pan European Focus Equity Fund was launched on 7 July 2011. Valuation Time Change, Settlement Change and Client Trade Change Valuation Time Changed and Settlement Changed from 10am to 12pm on the 25 July 2011. Client trade settlement period changed from T+4 to T+3.

Notes to the Financial Statements (continued)
105 Invesco Funds
1. General (continued) Merger of Invesco Funds II into Invesco Funds On 30 September 2011 the following funds of Invesco Funds II merged into newly created sub-funds of the Invesco Funds umbrella, with same names except for the two funds mentioned below: Invesco Global Value Equity Fund Invesco Global Small Cap Value Fund Invesco Japanese Equity Advantage Fund Invesco Japanese Value Equity Fund Invesco US Value Equity Fund At the same time objectives and names changed for the following funds: Invesco Global Value Equity Fund was renamed Invesco Global Equity Income Fund. Invesco Global Small Cap Value Fund was renamed Invesco Global Smaller Companies Equities. Upcoming Fund Changes Invesco Nippon Select Equity Fund Effective 4 November 2011 Invesco Nippon Select Equity Fund will merge into Invesco Japanese Equity Advantage Fund. Effective 4 November 2011 “I” shares class on Invesco Nippon Select Equity Fund will be liquidated. Invesco China Focus Equity Fund The Invesco China Focus Equity Fund should be launched on 15 December 2011. Invesco Asian Bond Fund The Invesco Asian Bond Fund should be launched on 15 December 2011. Share class launches due on the 15 December 2011: Invesco Global Small Cap Value Fund E accumulation Invesco Global Value Equity Fund A Semi-Annual Distribution Invesco Global Value Equity Fund E accumulation Invesco US Value Equity Fund E accumulation Invesco Pan European Focus Equity Fund C, E, R accumulation Invesco Pan European Focus Equity Fund EUR A Annual Distribution Invesco Japanese Equity Advantage Fund A Annual Distribution Invesco Japanese Value Equity Fund E accumulation Invesco Global Investment Grade Corporate Bond Fund A HKD Monthly Distribution 2. Summary of Significant Accounting Policies (a) The accompanying financial statements have been prepared in accordance with the format prescribed by Luxembourg regulations. Consolidation figures appearing in the Statement of Net Assets are for statistical purposes only and should not be used by investors with holdings in one or more sub-funds. (b) Valuation of investments Investments, including financial derivative instruments, are valued on the basis of the latest dealing price or the latest available midmarket quotation (the midpoint between the latest quoted bid and offer prices) of the securities on the relevant securities market on which the investments of the Fund are traded, quoted or dealt as at the Valuation Point on that day. Where investments of a sub-fund are both listed on a stock exchange and dealt by market makers outside the stock exchange on which the investments are listed, then the SICAV will determine the principal market for the investments in question and they are valued at the latest available price in that market. Securities which are not quoted or dealt in any stock exchange but which are dealt in on any other regulated market are valued in a manner as near as possible to that described above. If no price quotation is available for any of the securities held by a sub-fund or if the value as determined pursuant to the points above is not representative of the fair market value of the relevant securities, the value of such securities is based on the reasonably foreseeable sales price determined prudently and in good faith. Short-term Money-Market Instruments are valued based on amortised cost method. The financial statements have been prepared on the basis of the last net asset values determined in the accounting period. In accordance with the Prospectus, net asset values were calculated by reference to the latest available prices at 12.00 p.m. (Dublin time) on 31 August 2011. (c) Impact on Values By way of information, if the Fund had calculated the net asset values solely with a view to publication, the market prices used to value the investment portfolio would have been the closing prices on 31 August 2011 for the entire investment portfolio, including the American and European equities. However, these net asset values would not have been significantly different from those shown in these Interim Accounts, except for the following sub-funds: - Invesco Emerging Europe Equity Fund: an increase in the Net Asset Value of about 1.37% would have been observed. - Invesco Latin American Equity Fund: an increase in the Net Asset Value of about 1.28% would have been observed. - Invesco Pan European Structured Equity Fund: an increase in the Net Asset Value of about 1.04% would have been observed. - Invesco Pan European Equity Fund: an increase in the Net Asset Value of about 1.12% would have been observed. - Invesco European Growth Equity Fund: an increase in the Net Asset Value of about 1.05% would have been observed. - Invesco Pan European Focus Equity Fund: an increase in the Net Asset Value of about 1.10% would have been observed. (d) Cost of sales of investments Any surplus or deficit on sales of investments is determined on the basis of average cost. (e) Income from investments Dividend income is accounted for on an ex-dividend basis. Income arising on fixed interest securities and deposit interest is accrued on a day-to-day basis.

Notes to the Financial Statements (continued)
106 Invesco Funds
2. Summary of Significant Accounting Policies (continued) (f) Foreign exchange Transactions in currencies other than the designated currency for each sub-fund are translated at the rates of exchange ruling at the time of the transactions. The market value of the investments and other assets and liabilities in currencies other than the designated currency for each sub-fund are translated at the rates of exchange ruling at the period end. The principle exchange rates used at 31 August 2011: Currency USD 1.00 Currency USD 1.00ARS 4.1982 KRW 1,111.1111AUD 0.9342 KZT 147.0588BRL 1.5878 MXN 12.3916CAD 0.9731 MYR 2.9833CHF 0.8058 NOK 5.3533CLP 454.5455 NZD 1.1695CNY 6.3776 PEN 2.7278COP 1,666.6667 PHP 42.3729CZK 16.6945 PKR 86.9565DKK 5.1600 PLN 2.8711EGP 5.9524 RUB 28.8184EUR 0.6924 SEK 6.3331GBP 0.6128 SGD 1.2026HKD 7.7942 SKK 20.8768HUF 188.6792 THB 29.9401IDR 10,000.0000 TRY 1.7182ILS 3.5575 TWD 28.9855INR 46.0829 UAH 8.0064ISK 113.6364 ZAR 7.0175JPY 76.9231 (g) Expenses allocation Where the Fund incurs an expense which relates to a particular sub-fund, such expense is allocated to the relevant sub-fund. In cases where an expense cannot be considered as being attributable to a particular sub-fund, such expense is allocated between sub-funds on the basis of their respective Net Asset Values. (h) Preliminary expenses The preliminary expenses will be amortised over the first 5 years. Sub-funds launched from 2006 onwards are subject to a maximum amortisation in any accounting year of 0.05% of the average net asset value. Any unamortised expenses at the end of the 5 years or liquidation date, will be borne by the Management Company. (i) Forward foreign exchange contracts The unrealised gain or loss on open forward foreign exchange contracts is calculated as the difference between the contracted rate and the rate to close out the contract and is disclosed in the Statement of Net Assets (see note 7 for details). Realised gains or losses include net results on contracts which have been settled or offset on other contracts and are recorded in the Statement of Operations and Changes in Net Assets (disclosed at year end only). (j) Futures contracts Derivative financial instruments are initially recognised at cost and subsequently are re-measured at market value. Market values are obtained from quoted market prices and exchange rates. All derivatives are carried in assets when amounts are receivable by the Fund and in liabilities when amounts are payable by the Fund. Changes in market values of future contracts are included in the Statement of Net Assets (see note 8 for details). (k) Credit default swaps A credit default swap is a credit derivative transaction in which two parties enter into an agreement, whereby one party pays the other a fixed periodic coupon for the specified life of the agreement. The other party makes no payments unless a credit event, relating to a predetermined reference asset occurs. If such an event occurs, the party will then make a payment to the first party and the swap will terminate.The credit default swaps are marked to market daily based upon quotations from market makers and recorded in the Statement of Net Assets (see note 9 for details). (l) Interest rate swaps An interest rate swap is a bilateral agreement in which each of the parties agrees to exchange a series of interest payments for another series of payments (usually fixed/floating) based on a notional amount that serves as a computation basis and that is usually not exchanged.The interest rate swaps are marked to market daily based upon quotations from market makers and recorded in the Statement of Net Assets (see note 10 for details). (m) Equity swaps An Equity Swap is a derivative transaction in which the Fund and the counterparty enter into an agreement whereby one party pays the returns generated by an equity or a basket of equities. The other party pays interest based on the agreed notional amount of the transaction. Interest received/paid on Equity swaps are recorded as net interest received on swaps/net interest paid on Swaps in the Statement of Operations and Changes in Net Assets (disclosed at year end only). The value of equity swap transactions is the net present value of all cash flows, both inflows and outflows. Equity swaps are recorded in the Statement of Net Assets (see note 11 for details).

Notes to the Financial Statements (continued)
107 Invesco Funds
3. Management and Investment Advisor Fees The Directors of the Fund (the “Directors”) are responsible for the investment policy, management and administration of the Fund. The Directors delegate the day-to-day investment management of the securities portfolio of the Fund to Invesco Management S.A., (the “Management Company”).
In following the investment policy of the Directors, the Management Company seeks investment advice from, as appropriate, Invesco Asset Management Limited in the United Kingdom, Invesco Hong Kong Limited, Invesco Asset Management (Japan) Limited, Invesco Advisers in the United States, Invesco Institutional in Canada and Invesco Asset Management Deutschland GmbH in Germany.
For its services the Management Company is paid by the Fund a percentage of the Net Asset Value of each sub-fund as set out in the table below:
Sub-fund Management Management Management Management Management Management Fee Fee Fee Fee Fee Fee Class A Class B
(includes a 1% Distribution
fee)
Class B1 Class C Class E Class R (includes a 0.7%
Distribution fee)
EQUITY FUNDS Global Invesco Global Structured Equity Fund 1.00% - - 0.60% 1.50% -Invesco Emerging Market Quantitative Equity Fund
1.25% - - 0.75% 1.75% -
America Invesco US Structured Equity Fund 1.00% 2.00% - 0.60% 1.50% -Invesco Latin American Equity Fund 1.50% - - 1.00% 2.25% -Europe Invesco Pan European Structured Equity Fund 1.30% 2.30% - 0.80% 2.25% 2.00%Invesco Pan European Equity Fund 1.50% 2.50% - 1.00% 2.00% 2.20%Invesco Pan European Small Cap Equity Fund 1.50% 2.50% - 1.00% 2.25% -Invesco European Growth Equity Fund 1.50% - - 1.00% 2.25% -Invesco Pan European Equity Income Fund 1.50% - - 1.00% 2.00% -Invesco Emerging Europe Equity Fund 1.50% 2.50% - 1.00% 2.25% -Invesco Pan European Focus Equity Fund 1.50% - - - - -Japan Invesco Nippon Small/Mid Cap Equity Fund 1.50% 2.50% - 1.00% 2.25% -Invesco Nippon Select Equity Fund 1.50% 2.50% - 1.00% 2.00% -Asia Invesco Asia Opportunities Equity Fund 1.50% 2.50% - 1.00% 2.25% -Invesco Greater China Equity Fund 1.50% 2.50% - 1.00% 2.25% 2.20%Invesco Asia Infrastructure Fund 1.50% - - 1.00% 2.25% 2.20%Invesco India Equity Fund 1.50% - - 1.00% 2.25% -Invesco Asia Consumer Demand Fund 1.50% - - 1.00% 2.25% 2.20%THEME FUNDS Invesco Global Leisure Fund 1.50% 2.50% - 1.00% 2.25% -Invesco Energy Fund 1.50% 2.50% - 1.00% 2.25% 2.20%Invesco Asia Pacific Real Estate Securities Fund 1.50% - - 1.00% 2.00% -Invesco Global Income Real Estate Securities Fund
1.25% - - 0.80% 1.75% -
Invesco Gold & Precious Metals Fund 1.50% - - 1.00% 2.00% 2.20%RESERVE FUNDS Invesco USD Reserve Fund 0.45% 1.45% 0.50% 0.25% 0.50% -Invesco Euro Reserve Fund 0.35% 1.50% - 0.15% 0.50% -BOND FUNDS Invesco Global Bond Fund 0.75% - - 0.50% 0.90% -Invesco European Bond Fund 0.75% 1.75% - 0.50% 0.90% -Invesco Absolute Return Bond Fund 0.75% - - 0.50% 1.00% -Invesco Euro Corporate Bond Fund 1.00% - - 0.65% 1.25% 1.70%Invesco Euro Inflation-Linked Bond Fund 0.75% 1.75% - 0.50% 0.90% 1.45%Invesco UK Investment Grade Bond Fund 0.625% - - - - -Invesco Emerging Local Currencies Debt Fund 1.50% - - 1.00% 2.00% 2.20%Invesco Global Investment Grade Corporate Bond Fund
1.00% - - 0.65% 1.25% -
Invesco Global Unconstrained Bond Fund 1.50% 1.00% 2.00% -Invesco Global Total Return (EUR) Bond Fund 1.00% - - 0.65% 1.25% 1.70%Invesco Emerging Market Corporate Bond Fund 1.50% - - 1.00% 2.00% 2.20%Invesco Euro Short Term Bond Fund 0.70% - - 0.40% 0.90% 1.40%MIXED FUNDS Invesco Capital Shield 90 (EUR) Fund 1.00% - - 0.60% 1.50% -Invesco Asia Balanced Fund 1.25% - - 0.80% 1.75% 1.95%Invesco Pan European High Income Fund 1.25% - - 0.80% 1.75% -Invesco Global Absolute Return Fund 1.75% - - 1.00% 2.30% -Invesco Balanced-Risk Allocation Fund 1.25% - - 0.75% 1.75% 1.95%

Notes to the Financial Statements (continued)
108 Invesco Funds
3. Management and Investment Advisor Fees (continued) The management fees are calculated daily based on the Net Asset Value of each sub-fund on each business day and paid monthly. The fees of the Investment Adviser are paid out of the Manager's remuneration. For the period under review, the Management Company partially waived the management fee for the Invesco USD Reserve Fund and Invesco Euro Reserve Fund. This waiver applies equally across all Share Classes, up to a maximum fee of any share class.
There is no annual management fee for “I” Shares.
4. Other Fees The Manager is paid an additional fee by each Fund (the "Service Agent Fee"). The Service Agent Fee for A and R Shares shall not exceed 0.40% for Equity Funds or Theme Funds, 0.27% for Bond Funds, 0.20% for the Structured Funds, 0.13% for Reserve Funds 0.35% for Invesco Asia Balanced Fund and Invesco Balanced-Risk Allocation Fund and 0.40% for Invesco Pan European High Income Fund and Invesco Global Absolute Return Fund of the Net Asset Value of each Fund. The Service Agent Fee for B, B1 and C Shares shall not exceed 0.30% for Equity Funds and Theme Funds, 0.10% for Reserve Funds, 0.20% for Bond Funds (except for Invesco Euro Inflation-Linked Bond Fund which shall not exceed 0.10%), 0.15% for Structured Funds and 0.30% for the Mixed Funds of the Net Asset Value of each Fund. Out of this Service Agent Fee, the Manager discharges the fees of the Administration Agent, the Domiciliary & Corporate Agent and the Registrar & Transfer Agent as well as fees of service providers and fees incurred in places where the Fund is registered. Each of these fees shall be calculated on each Business Day on the Net Asset Value of the sub-funds (at a rate which shall be agreed from time to time with the Manager) and paid monthly. Additionally, the Manager reimburses the expenses of the Fund's Hong Kong Sub-Distributor and Representative. The Custodian will be paid a fee calculated on a monthly basis at a rate of up to a maximum of 0.0075% per annum of the net asset value of each Fund on the last Business Day of each calendar month (or at such higher rate as the Custodian and the SICAV may at any time agree), plus VAT (if any) and will be paid monthly. In addition, the Custodian will charge each Fund safekeeping and servicing fees at varying rates, depending on the country in which the assets of a Fund are held and currently ranging from 0.001% to 0.45% of the net asset value of the assets invested in such country, plus VAT (if any), together with charges at normal commercial rates in respect of investment transactions, as agreed with the SICAV from time to time. Sub-custodian fees are paid out of these safekeeping and servicing fees. The Management Company has agreed to cap operational expenses charged to the following sub-funds at its discretion, at the following annual rates: Fund Date since capping is in place Annual RateInvesco Asia Pacific Real Estate Securities Fund 01/09/2010 0.10%Invesco Global Absolute Return Fund 01/09/2010 0.10%Invesco Global Total Return (EUR) Bond Fund 15/09/2010 0.05%Invesco Global Unconstrained Bond Fund 21/06/2010 0.05%Invesco Gold & Precious Metals Fund 21/06/2010 0.15%Invesco Latin American Equity Fund 11/08/2010 0.15%Invesco Pan European Equity Income Fund 01/09/2010 0.10%Invesco Global Investment Grade Corporate Bond Fund 09/10/2009 0.05%Invesco Emerging Market Quantitative Equity Fund 21/06/2010 0.05%Invesco Euro Short Term Bond Fund 04/05/2011 0.05%Invesco Emerging Market Corporate Bond Fund 04/05/2011 0.15%Invesco Pan European Focus Equity Fund 07/07/2011 0.15% 5. Tax Status The Fund is registered under Luxembourg law as a collective investment undertaking. Accordingly, no Luxembourg income or capital gains tax is at present payable by the Fund. It is, however, subject to an annual “taxe d’abonnement” calculated at an annual rate of 0.05% of the Net Asset Value. The two Reserve sub-funds and “I” share classes are subject to a reduced annual rate of 0.01% of the Net Asset Value, such tax being payable quarterly on the basis of the Net Asset Value of the sub-funds at the end of the relevant quarter.

Notes to the Financial Statements (continued)
109 Invesco Funds
6. Dividends In accordance with the distribution policy of the Fund, income is distributed by way of a dividend payment, only to holders of Class A and Class C Shares (Distribution Shares).
Invesco Emerging Local Currencies Debt Fund, Class A monthly distribution share class pays a distribution based on yield fixed annually by the Board of Directors. For the period from 1 March 2011 to 29 February 2012, the yield was fixed at 4.8 % and 5.50% respectively for the R Share Class and A share class as approved by the Board of Directors. Invesco Emerging Markets Corporate Bond Fund, Class R and Class A monthly distribution share class pays a distribution based on yield fixed annually by the Board of Directors. For the period from 4 May 2011 to 29 February 2012, the yield was fixed at 4.05 % and 4.75% respectively for the R Share Class and A share class as approved by the Board of Directors.
The income due to shareholders of Class A, Class C, Class E and Class I Shares (Accumulation Shares) is reinvested to enhance the value of Class A, Class C, Class E and Class I Shares. Type of Share Distribution Rate Frequency
Distribution Ex Date Distribution Pay Date
Invesco Pan European Equity Income Fund EUR per Share A Dist 0.1089 Semi Annual 31 August 2011* 21 September 2011 Invesco Asia Infrastructure Fund USD per Share A Dist 0.1111 Semi Annual 31 August 2011* 21 September 2011 Invesco Asia Consumer Demand Fund USD per Share A Dist 0.0382 Semi Annual 31 August 2011* 21 September 2011 Invesco Global Income Real Estate Securities Fund USD per Share
A Dist 0.1258 Quarterly 31 May 2011 21 June 2011 A Dist 0.0658 Quarterly 31 August 2011* 21 September 2011
Invesco Global Bond Fund USD per Share A Dist 0.0601 Semi Annual 31 August 2011* 21 September 2011
Invesco European Bond Fund EUR per Share A Dist 0.0585 Semi Annual 31 August 2011* 21 September 2011
Invesco Euro Corporate Bond Fund EUR per Share A Dist 0.0291 Monthly 31 March 2011 21 April 2011 A Dist 0.0290 Monthly 29 April 2011 23 May 2011 R Dist 0.0159 Monthly 29 April 2011 23 May 2011 A Dist 0.0329 Monthly 31 May 2011 21 June 2011 R Dist 0.0230 Monthly 31 May 2011 21 June 2011 A Dist 0.0311 Monthly 30 June 2011 21 July 2011 R Dist 0.0221 Monthly 30 June 2011 21 July 2011 A Dist 0.0298 Monthly 29 July 2011 22 August 2011 R Dist 0.0211 Monthly 29 July 2011 22 August 2011 A Dist 0.0375 Monthly 31 August 2011* 21 September 2011 R Dist 0.0272 Monthly 31 August 2011* 21 September 2011
Invesco UK Investment Grade Bond Fund GBP per Share A Dist 0.0082 Quarterly 31 May 2011 21 June 2011 A Dist 0.0085 Quarterly 31 August 2011* 21 September 2011
Invesco Emerging Local Currencies Debt Fund USD, EUR and HKD per Share A Dist (USD) 0.0511 Monthly 31 March 2011 21 April 2011 A Dist (EUR) 0.0322 Monthly 31 March 2011 21 April 2011 A Dist (USD) 0.0532 Monthly 29 April 2011 23 May 2011 A Dist (EUR) 0.0314 Monthly 29 April 2011 23 May 2011 R Dist (USD) 0.0412 Monthly 29 April 2011 23 May 2011 A Dist (USD) 0.0525 Monthly 31 May 2011 21 June 2011 A Dist (EUR) 0.0293 Monthly 31 May 2011 21 June 2011 R Dist (USD) 0.0407 Monthly 31 May 2011 21 June 2011 A Dist (USD) 0.0524 Monthly 30 June 2011 21 July 2011 A Dist (EUR) 0.0356 Monthly 30 June 2011 21 July 2011 R Dist (USD) 0.0406 Monthly 30 June 2011 21 July 2011 A Dist (USD) 0.0527 Monthly 29 July 2011 22 August 2011 A Dist (EUR) 0.0490 Monthly 29 July 2011 22 August 2011 R Dist (USD) 0.0409 Monthly 29 July 2011 22 August 2011 A Dist (HKD) 0.4770 Monthly# 29 July 2011 22 August 2011 A Dist (USD) 0.0523 Monthly 31 August 2011* 21 September 2011 A Dist (EUR) 0.0335 Monthly 31 August 2011* 21 September 2011 R Dist (USD) 0.0405 Monthly 31 August 2011* 21 September 2011 A Dist (HKD) 0.3866 Monthly 31 August 2011* 21 September 2011
Invesco Global Investment Grade Corporate Bond Fund USD per Share A Dist 0.0310 Monthly 31 March 2011 21 April 2011 A Dist 0.0266 Monthly 29 April 2011 23 May 2011 A Dist 0.0325 Monthly 31 May 2011 21 June 2011 A Dist 0.0291 Monthly 30 June 2011 21 July 2011 A Dist. 0.0285 Monthly 29 July 2011 22 August 2011 A Dist 0.0295 Monthly 31 August 2011* 21 September 2011
Invesco Global Total Return (EUR) Bond Fund R Dist 0.0102 Monthly 29 April 2011 23 May 2011 E Dist 0.0733 Quarterly 31 May 2011 21 June 2011 R Dist 0.0142 Monthly 31 May 2011 21 June 2011 R Dist 0.0144 Monthly 30 June 2011 21 July 2011 R Dist 0.0189 Monthly 29 July 2011 22 August 2011 E Dist 0.0804 Quarterly 31 August 2011* 21 September 2011 R Dist 0.0329 Monthly 31 August 2011* 21 September 2011

Notes to the Financial Statements (continued)
110 Invesco Funds
6. Dividends (continued) Type of Share Distribution Rate Frequency
Distribution Ex Date Distribution Pay Date
Invesco Emerging Market Corporate Bond Fund USD Per Share A Dist 0.0399 Monthly 30 June 2011 21 July 2011 R Dist 0.0340 Monthly 30 June 2011 21 July 2011 A Dist 0.0407 Monthly 29 July 2011 22 August 2011 R Dist 0.0346 Monthly 29 July 2011 22 August 2011 A Dist 0.0398 Monthly 31 August 2011* 21 September 2011 R Dist 0.0339 Monthly 31 August 2011* 21 September 2011
Invesco Asia Balanced Fund USD and HKD per Share A Dist (USD) 0.2045 Quarterly 31 May 2011 21 June 2011 A Dist (HKD) 1.5977 Quarterly 31 May 2011 21 June 2011 A Dist (USD) 0.2786 Quarterly 31 August 2011* 21 September 2011 A Dist (HKD) 2.1811 Quarterly 31 August 2011* 21 September 2011
Invesco Pan European High Income Fund EUR per Share A Dist 0.0925 Quarterly 31 May 2011 21 June 2011 A Dist 0.1081 Quarterly 31 August 2011* 21 September 2011
* Distributions with an ex date 31 August 2011 and pay date 21 September 2011 have not been reflected in the Financial Statements. # The first distribution was 24 July 2011. 7. Forward Foreign Exchange Contracts Forward foreign exchange contracts open at 31 August 2011 were as follows; Invesco Global Structured Equity Fund
Unrealised Gain/(Loss)
Details of Forward Foreign Exchange Contracts Counterparty USD Maturity Date
Buy 2,934 GBP to Sell 4,747 USD BNY Mellon 31 07/09/2011Buy 19,955 USD to Sell 13,757 EUR BNY Mellon 94 01/09/2011Buy 14,827 USD to Sell 9,043 GBP BNY Mellon 103 07/09/2011Buy 165,000 GBP to Sell 268,531 USD BNY Mellon 127 14/09/2011Buy 234,616 USD to Sell 143,000 GBP BNY Mellon 1,779 14/09/2011Buy 1,256,055 USD to Sell 7,970,996 SEK BNY Mellon 2,715 14/09/2011Buy 42,296,000 JPY to Sell 548,786 USD BNY Mellon 3,329 14/09/2011Buy 5,427,477 USD to Sell 5,317,565 CAD BNY Mellon 3,521 14/09/2011Buy 137,000 CHF to Sell 162,403 USD BNY Mellon 6,884 14/09/2011Buy 426,000 CAD to Sell 426,461 USD BNY Mellon 8,063 14/09/2011Buy 401,000 EUR to Sell 570,607 USD BNY Mellon 8,191 14/09/2011Buy 4,397,000 SEK to Sell 673,291 USD BNY Mellon 18,083 14/09/2011Buy 624,000 AUD to Sell 641,754 USD BNY Mellon 22,608 14/09/2011Buy 2,665,107 EUR to Sell 3,785,868 USD BNY Mellon 61,251 07/09/2011Total unrealised gain on open forward foreign exchange contracts 136,779
Buy 6,669,553 USD to Sell 531,918,155 JPY BNY Mellon (273,883) 14/09/2011Buy 3,532,441 USD to Sell 3,383,000 AUD BNY Mellon (69,380) 14/09/2011Buy 3,209,249 USD to Sell 2,249,537 EUR BNY Mellon (37,990) 07/09/2011Buy 722,133 USD to Sell 608,000 CHF BNY Mellon (29,158) 14/09/2011Buy 3,039,216 USD to Sell 2,123,585 EUR BNY Mellon (25,937) 14/09/2011Buy 170,000 CHF to Sell 226,562 USD BNY Mellon (16,497) 14/09/2011Buy 3,395,982 USD to Sell 2,094,240 GBP BNY Mellon (13,926) 14/09/2011Buy 163,000 GBP to Sell 266,564 USD BNY Mellon (1,162) 14/09/2011Buy 587,000 SEK to Sell 93,145 USD BNY Mellon (847) 14/09/2011Buy 148,000 EUR to Sell 213,863 USD BNY Mellon (242) 14/09/2011Buy 146,995 EUR to Sell 212,389 USD BNY Mellon (201) 07/09/2011Buy 102,132 GBP to Sell 166,368 USD BNY Mellon (60) 07/09/2011Buy 9,494 USD to Sell 5,857 GBP BNY Mellon (42) 07/09/2011Buy 47,478 USD to Sell 302,000 SEK BNY Mellon (8) 14/09/2011Total unrealised loss on open forward foreign exchange contracts (469,333)
Total net unrealised loss on open forward foreign exchange contracts (332,554)

Notes to the Financial Statements (continued)
111 Invesco Funds
7. Forward Foreign Exchange Contracts (continued) Invesco Emerging Market Quantitative Equity Fund
Unrealised Gain/(Loss)
Details of Forward Foreign Exchange Contracts Counterparty USD Maturity Date
Buy 1,827 USD to Sell 1,260 EUR BNY Mellon 8 01/09/2011Buy 1,404 GBP to Sell 2,271 USD BNY Mellon 15 07/09/2011Buy 15,126 EUR to Sell 21,796 USD BNY Mellon 42 02/09/2011Buy 12,635 USD to Sell 7,706 GBP BNY Mellon 87 07/09/2011Buy 187,336 USD to Sell 129,613 EUR BNY Mellon 238 07/09/2011Buy 5,924,148 EUR to Sell 8,417,677 USD BNY Mellon 133,912 07/09/2011Total unrealised gain on open forward foreign exchange contracts 134,302
Buy 2,211,870 USD to Sell 1,551,724 EUR BNY Mellon (28,065) 07/09/2011Buy 269,356 EUR to Sell 389,753 USD BNY Mellon (934) 07/09/2011Buy 58,318 GBP to Sell 95,029 USD BNY Mellon (67) 07/09/2011Buy 5,881 USD to Sell 3,628 GBP BNY Mellon (26) 07/09/2011Buy 3,149 USD to Sell 2,182 EUR BNY Mellon (1) 02/09/2011Total unrealised loss on open forward foreign exchange contracts (29,093)
Total net unrealised gain on open forward foreign exchange contracts 105,209
Invesco US Structured Equity Fund
Unrealised Gain/(Loss)
Details of Forward Foreign Exchange Contracts Counterparty USD Maturity Date
Buy 506,850 USD to Sell 350,802 EUR BNY Mellon 463 07/09/2011Buy 285,476 EUR to Sell 411,343 USD BNY Mellon 783 02/09/2011Buy 964,204 USD to Sell 664,877 EUR BNY Mellon 4,361 01/09/2011Buy 5,753,528 EUR to Sell 8,181,333 USD BNY Mellon 123,963 07/09/2011Total unrealised gain on open forward foreign exchange contracts 129,570
Buy 6,573,650 USD to Sell 4,607,357 EUR BNY Mellon (77,133) 07/09/2011Buy 936,389 EUR to Sell 1,356,962 USD BNY Mellon (5,273) 07/09/2011Buy 6,774 USD to Sell 4,694 EUR BNY Mellon (2) 02/09/2011Total unrealised loss on open forward foreign exchange contracts (82,408)
Total net unrealised gain on open forward foreign exchange contracts 47,162
Invesco Latin American Equity Fund
Unrealised Gain/(Loss)
Details of Forward Foreign Exchange Contracts Counterparty USD Maturity Date
Buy 485 USD to Sell 335 EUR BNY Mellon 2 01/09/2011Buy 494,377 EUR to Sell 702,635 USD BNY Mellon 11,006 07/09/2011Total unrealised gain on open forward foreign exchange contracts 11,008
Buy 203,021 USD to Sell 142,284 EUR BNY Mellon (2,369) 07/09/2011Buy 16,580 EUR to Sell 23,962 USD BNY Mellon (29) 07/09/2011Total unrealised loss on open forward foreign exchange contracts (2,398)
Total net unrealised gain on open forward foreign exchange contracts 8,610

Notes to the Financial Statements (continued)
112 Invesco Funds
7. Forward Foreign Exchange Contracts (continued) Invesco Pan European Equity Fund
Unrealised Loss
Details of Forward Foreign Exchange Contracts Counterparty EUR Maturity Date
Buy 13,102 GBP to Sell 14,847 EUR BNY Mellon (67) 01/09/2011Total unrealised loss on open forward foreign exchange contracts (67)
Total unrealised loss on open forward foreign exchange contracts (67)
Invesco Emerging Europe Equity Fund
Unrealised Loss
Details of Forward Foreign Exchange Contracts Counterparty USD Maturity Date
Buy 36,371 USD to Sell 63,296 TRY BNY Mellon (327) 06/09/2011Total unrealised loss on open forward foreign exchange contracts (327)
Total unrealised loss on open forward foreign exchange contracts (327)
Invesco Nippon Small/Mid Cap Equity Fund
Unrealised Loss
Details of Forward Foreign Exchange Contracts Counterparty JPY Maturity Date
Buy 3,171 EUR to Sell 353,954 JPY BNY Mellon (3,220) 01/09/2011Total unrealised loss on open forward foreign exchange contracts (3,220)
Total unrealised loss on open forward foreign exchange contracts (3,220)
Invesco Nippon Select Equity Fund
Unrealised Loss
Details of Forward Foreign Exchange Contracts Counterparty JPY Maturity Date
Buy 2,659 EUR to Sell 296,735 JPY (2,699) 01/09/2011Buy 12,173 EUR to Sell 1,348,424 JPY BNY Mellon (2,013) 02/09/2011Total unrealised loss on open forward foreign exchange contracts (4,712)
Total unrealised loss on open forward foreign exchange contracts (4,712)
Invesco Asia Opportunities Equity Fund
Unrealised Gain
Details of Forward Foreign Exchange Contracts Counterparty USD Maturity Date
Buy 554 USD to Sell 382 EUR BNY Mellon 3 01/09/2011Total unrealised gain on open forward foreign exchange contracts 3
Total unrealised gain on open forward foreign exchange contracts 3
Invesco Greater China Equity Fund
Unrealised Gain/(Loss)
Details of Forward Foreign Exchange Contracts Counterparty USD Maturity Date
Buy 139 USD to Sell 96 EUR BNY Mellon 1 01/09/2011Buy 4,738 EUR to Sell 6,838 USD BNY Mellon 2 02/09/2011Buy 11,456,103 EUR to Sell 16,274,185 USD BNY Mellon 262,856 07/09/2011Total unrealised gain on open forward foreign exchange contracts 262,859
Buy 12,236,448 USD to Sell 8,610,595 EUR BNY Mellon (193,064) 07/09/2011Buy 183,176 EUR to Sell 264,974 USD BNY Mellon (556) 07/09/2011Buy 39,848 EUR to Sell 57,800 USD BNY Mellon (273) 01/09/2011Total unrealised loss on open forward foreign exchange contracts (193,893)
Total net unrealised gain on open forward foreign exchange contracts 68,966

Notes to the Financial Statements (continued)
113 Invesco Funds
7. Forward Foreign Exchange Contracts (continued) Invesco Asia Infrastructure Fund
Unrealised Gain/(Loss)
Details of Forward Foreign Exchange Contracts Counterparty USD Maturity Date
Buy 74,697 EUR to Sell 107,811 USD BNY Mellon 26 02/09/2011Buy 8,763 USD to Sell 6,042 EUR BNY Mellon 40 01/09/2011Buy 45,508,516 EUR to Sell 64,671,263 USD BNY Mellon 1,020,901 07/09/2011Total unrealised gain on open forward foreign exchange contracts 1,020,967
Buy 15,679,907 USD to Sell 11,004,503 EUR BNY Mellon (205,242) 07/09/2011Buy 1,424,964 EUR to Sell 2,061,587 USD BNY Mellon (4,628) 07/09/2011Buy 21,218 EUR to Sell 30,777 USD BNY Mellon (146) 01/09/2011Buy 64,203 USD to Sell 44,557 EUR BNY Mellon (122) 02/09/2011Total unrealised loss on open forward foreign exchange contracts (210,138)
Total net unrealised gain on open forward foreign exchange contracts 810,829
Invesco India Equity Fund
Unrealised Gain
Details of Forward Foreign Exchange Contracts Counterparty USD Maturity Date
Buy 5,703 USD to Sell 3,932 EUR BNY Mellon 27 01/09/2011Total unrealised gain on open forward foreign exchange contracts 27
Total unrealised gain on open forward foreign exchange contracts 27
Invesco Asia Consumer Demand Fund
Unrealised Gain/(Loss)
Details of Forward Foreign Exchange Contracts Counterparty USD Maturity Date
Buy 10,157 EUR to Sell 14,660 USD BNY Mellon 3 02/09/2011Buy 32,943 USD to Sell 22,799 EUR BNY Mellon 32 07/09/2011Buy 354,751 USD to Sell 244,575 EUR BNY Mellon 1,672 01/09/2011Buy 50,759,622 EUR to Sell 72,124,824 USD BNY Mellon 1,147,389 07/09/2011Total unrealised gain on open forward foreign exchange contracts 1,149,096
Buy 16,832,764 USD to Sell 11,797,228 EUR BNY Mellon (196,696) 07/09/2011Buy 2,431,448 EUR to Sell 3,517,676 USD BNY Mellon (7,847) 07/09/2011Buy 78,959 USD to Sell 54,798 EUR BNY Mellon (150) 02/09/2011Total unrealised loss on open forward foreign exchange contracts (204,693)
Total net unrealised gain on open forward foreign exchange contracts 944,403
Invesco Global Leisure Fund
Unrealised Loss
Details of Forward Foreign Exchange Contracts Counterparty USD Maturity Date
Buy 901 EUR to Sell 1,307 USD BNY Mellon (6) 01/09/2011Total unrealised loss on open forward foreign exchange contracts (6)
Total unrealised loss on open forward foreign exchange contracts (6)

Notes to the Financial Statements (continued)
114 Invesco Funds
7. Forward Foreign Exchange Contracts (continued) Invesco Energy Fund
Unrealised Gain/(Loss)
Details of Forward Foreign Exchange Contracts Counterparty USD Maturity Date
Buy 572,103 EUR to Sell 824,727 USD BNY Mellon 1,184 02/09/2011Buy 1,769,477 USD to Sell 1,224,338 EUR BNY Mellon 2,129 07/09/2011Buy 578,216 USD to Sell 398,715 EUR BNY Mellon 2,615 01/09/2011Buy 20,743,297 EUR to Sell 29,522,929 USD BNY Mellon 420,306 07/09/2011Total unrealised gain on open forward foreign exchange contracts 426,234
Buy 11,709,385 USD to Sell 8,212,165 EUR BNY Mellon (144,989) 07/09/2011Buy 1,861,879 EUR to Sell 2,695,197 USD BNY Mellon (7,550) 07/09/2011Buy 32,557 EUR to Sell 47,224 USD BNY Mellon (223) 01/09/2011Total unrealised loss on open forward foreign exchange contracts (152,762)
Total net unrealised gain on open forward foreign exchange contracts 273,472
Invesco Asia Pacific Real Estate Securities Fund
Unrealised Gain
Details of Forward Foreign Exchange Contracts Counterparty USD Maturity Date
Buy 490 USD to Sell 338 EUR BNY Mellon 2 01/09/2011Total unrealised gain on open forward foreign exchange contracts 2
Total unrealised gain on open forward foreign exchange contracts 2
Invesco Global Income Real Estate Securities Fund
Unrealised Gain
Details of Forward Foreign Exchange Contracts Counterparty USD Maturity Date
Buy 212 USD to Sell 146 EUR BNY Mellon 1 01/09/2011Total unrealised gain on open forward foreign exchange contracts 1
Total unrealised gain on open forward foreign exchange contracts 1
Invesco Gold & Precious Metals Fund
Unrealised Gain/(Loss)
Details of Forward Foreign Exchange Contracts Counterparty USD Maturity Date
Buy 2,521 USD to Sell 1,738 EUR BNY Mellon 11 01/09/2011Buy 9,758 USD to Sell 6,744 EUR BNY Mellon 23 07/09/2011Buy 15,840 EUR to Sell 22,824 USD BNY Mellon 43 02/09/2011Buy 5,721,022 EUR to Sell 8,132,694 USD BNY Mellon 125,680 07/09/2011Total unrealised gain on open forward foreign exchange contracts 125,757
Buy 1,216,630 USD to Sell 850,539 EUR BNY Mellon (11,135) 07/09/2011Buy 575,773 EUR to Sell 832,936 USD BNY Mellon (1,799) 07/09/2011Buy 2,320 EUR to Sell 3,365 USD BNY Mellon (15) 01/09/2011Total unrealised loss on open forward foreign exchange contracts (12,949)
Total net unrealised gain on open forward foreign exchange contracts 112,808

Notes to the Financial Statements (continued)
115 Invesco Funds
7. Forward Foreign Exchange Contracts (continued) Invesco USD Reserve Fund
Unrealised Gain/(Loss)
Details of Forward Foreign Exchange Contracts Counterparty USD Maturity Date
Buy 19,975 EUR to Sell 28,831 USD BNY Mellon 7 02/09/2011Total unrealised gain on open forward foreign exchange contracts 7
Buy 15,219 EUR to Sell 22,074 USD BNY Mellon (105) 01/09/2011Total unrealised loss on open forward foreign exchange contracts (105)
Total net unrealised loss on open forward foreign exchange contracts (98)
Invesco Global Bond Fund
Unrealised Gain/(Loss)
Details of Forward Foreign Exchange Contracts Counterparty USD Maturity Date
Buy 822,037 USD to Sell 500,000 GBP Citibank 8,291 24/10/2011Buy 1,724,505 EUR to Sell 1,500,000 GBP Citibank 46,713 24/10/2011Total unrealised gain on open forward foreign exchange contracts 55,004
Buy 932 USD to Sell 646 EUR BNY Mellon – 02/09/2011Buy 4,236,000 USD to Sell 3,000,000 EUR JP Morgan (93,774) 21/09/2011Buy 2,126,550 USD to Sell 1,500,000 EUR Citibank (37,678) 17/10/2011Buy 867,000 USD to Sell 850,000 AUD JP Morgan (34,190) 17/10/2011Buy 193,812 EUR to Sell 281,124 USD BNY Mellon (1,329) 01/09/2011Total unrealised loss on open forward foreign exchange contracts (166,971)
Total net unrealised loss on open forward foreign exchange contracts (111,967)
Invesco European Bond Fund
Unrealised Gain/(Loss)
Details of Forward Foreign Exchange Contracts Counterparty EUR Maturity Date
Buy 125,530,000 HUF to Sell 460,491 EUR BNY Mellon 796 06/09/2011Buy 1,550,000 NOK to Sell 199,438 EUR BNY Mellon 945 05/09/2011Total unrealised gain on open forward foreign exchange contracts 1,741
Buy 720,000 GBP to Sell 815,165 EUR Royal Bank of Scotland (2,969) 02/09/2011Total unrealised loss on open forward foreign exchange contracts (2,969)
Total net unrealised loss on open forward foreign exchange contracts (1,228)

Notes to the Financial Statements (continued)
116 Invesco Funds
7. Forward Foreign Exchange Contracts (continued) Invesco Absolute Return Bond Fund
Unrealised Gain/(Loss)
Details of Forward Foreign Exchange Contracts Counterparty EUR Maturity Date
Buy 1,084 EUR to Sell 954 GBP BNY Mellon 8 07/09/2011Buy 40,000 GBP to Sell 64,941 USD BNY Mellon 134 08/09/2011Buy 90,000 GBP to Sell 100,922 EUR Goldman Sachs 603 08/09/2011Buy 300,184 EUR to Sell 350,000 CHF Goldman Sachs 622 08/09/2011Buy 460,455 USD to Sell 450,000 CAD BNY Mellon 958 08/09/2011Buy 330,000 SGD to Sell 272,727 USD Goldman Sachs 1,151 08/09/2011Buy 471,937 USD to Sell 1,400,000 MYR BNY Mellon 1,460 08/09/2011Buy 3,010,000,000 IDR to Sell 350,408 USD BNY Mellon 1,530 08/09/2011Buy 240,000 AUD to Sell 252,805 USD Goldman Sachs 2,028 08/09/2011Buy 237,912 USD to Sell 220,000 AUD BNY Mellon 2,418 08/09/2011Buy 640,000 EUR to Sell 919,550 USD Royal Bank of Scotland 2,970 08/09/2011Buy 19,000,000 RSD to Sell 183,575 EUR BNY Mellon 3,107 11/10/2011Buy 398,165 EUR to Sell 350,000 GBP Goldman Sachs 3,345 08/09/2011Buy 950,000 TRY to Sell 545,162 USD BNY Mellon 3,766 08/09/2011Buy 423,818 USD to Sell 12,100,000 RUB BNY Mellon 4,353 08/09/2011Buy 1,790,000 MYR to Sell 593,206 USD BNY Mellon 5,199 08/09/2011Buy 260,000 AUD to Sell 267,961 USD Royal Bank of Scotland 6,292 08/09/2011Buy 7,000,000 CNY to Sell 1,097,007 USD BNY Mellon 6,555 08/02/2012Buy 757,000,000 KRW to Sell 699,792 USD BNY Mellon 6,630 08/09/2011Buy 19,250,000 PHP to Sell 445,447 USD BNY Mellon 7,033 08/09/2011Buy 561,798 USD to Sell 950,000 TRY BNY Mellon 7,758 08/09/2011Buy 450,000 EUR to Sell 636,009 USD Goldman Sachs 9,397 08/09/2011Buy 540,000 SGD to Sell 299,977 EUR BNY Mellon 11,074 08/09/2011Buy 6,500,000 NOK to Sell 828,498 EUR Goldman Sachs 11,705 08/09/2011Buy 10,320,000 CNY to Sell 1,606,554 USD BNY Mellon 12,600 10/11/2011Buy 40,000,000 RSD to Sell 380,952 EUR Goldman Sachs 15,739 08/09/2011Buy 530,000 AUD to Sell 535,978 USD BNY Mellon 19,927 08/09/2011Buy 1,129,111 EUR to Sell 1,600,131 USD BNY Mellon 20,599 08/09/2011Total unrealised gain on open forward foreign exchange contracts 168,961
Buy 2,474,103 EUR to Sell 289,000,000 JPY BNY Mellon (139,222) 08/09/2011Buy 3,084,815 EUR to Sell 4,510,000 USD BNY Mellon (39,545) 08/09/2011Buy 1,993,918 EUR to Sell 2,750,000 AUD BNY Mellon (36,065) 08/09/2011Buy 1,910,000 PLN to Sell 477,500 EUR BNY Mellon (17,716) 08/09/2011Buy 350,000 CHF to Sell 315,822 EUR Goldman Sachs (16,260) 08/09/2011Buy 1,835,376 EUR to Sell 1,640,000 GBP BNY Mellon (14,639) 08/09/2011Buy 1,417,214 EUR to Sell 5,930,000 PLN BNY Mellon (10,283) 08/09/2011Buy 429,700 EUR to Sell 3,400,000 NOK BNY Mellon (9,791) 08/09/2011Buy 12,100,000 RUB to Sell 430,077 USD BNY Mellon (8,689) 08/09/2011Buy 6,700,000 MXN to Sell 544,844 USD BNY Mellon (5,673) 08/09/2011Buy 344,867 USD to Sell 3,010,000,000 IDR BNY Mellon (5,368) 08/09/2011Buy 18,800,000 INR to Sell 415,837 USD BNY Mellon (5,107) 08/09/2011Buy 4,199,528 USD to Sell 2,914,069 EUR BNY Mellon (4,793) 08/09/2011Buy 2,720,000 ARS to Sell 653,218 USD BNY Mellon (4,521) 08/09/2011Buy 444,061 USD to Sell 540,000 SGD Goldman Sachs (3,422) 08/09/2011Buy 58,000,000 KZT to Sell 399,587 USD BNY Mellon (2,994) 08/09/2011Buy 817,412 USD to Sell 1,476,000,000 COP BNY Mellon (2,235) 07/12/2011Buy 398,532 EUR to Sell 3,100,000 NOK Goldman Sachs (2,180) 08/09/2011Buy 53,130,000 HUF to Sell 197,098 EUR Goldman Sachs (1,898) 08/09/2011Buy 89,941 GBP to Sell 103,228 EUR BNY Mellon (1,769) 07/09/2011Buy 258,095 USD to Sell 180,000 EUR Goldman Sachs (1,201) 08/09/2011Buy 319,262 USD to Sell 13,500,000 PHP BNY Mellon (172) 08/09/2011Total unrealised loss on open forward foreign exchange contracts (333,543)
Total net unrealised loss on open forward foreign exchange contracts (164,582)

Notes to the Financial Statements (continued)
117 Invesco Funds
7. Forward Foreign Exchange Contracts (continued) Invesco Euro Inflation-Linked Bond Fund
Unrealised Gain/(Loss)
Details of Forward Foreign Exchange Contracts Counterparty EUR Maturity Date
Buy 1,476,132 EUR to Sell 1,300,000 GBP BNY Mellon 9,646 16/09/2011Total unrealised gain on open forward foreign exchange contracts 9,646
Buy 1,300,000 GBP to Sell 1,493,096 EUR BNY Mellon (26,610) 16/09/2011Total unrealised loss on open forward foreign exchange contracts (26,610)
Total net unrealised loss on open forward foreign exchange contracts (16,964)
Invesco UK Investment Grade Bond Fund
Unrealised Gain/(Loss)
Details of Forward Foreign Exchange Contracts Counterparty GBP Maturity Date
Buy 44,381 GBP to Sell 50,000 EUR BNY Mellon 57 01/09/2011Buy 1,630,000 EUR to Sell 1,439,559 GBP BNY Mellon 5,413 01/09/2011Buy 5,400,000 USD to Sell 3,295,838 GBP BNY Mellon 20,097 01/09/2011Total unrealised gain on open forward foreign exchange contracts 25,567
Buy 12,650,516 GBP to Sell 14,502,975 EUR BNY Mellon (206,161) 01/09/2011Buy 11,074,278 GBP to Sell 12,560,000 EUR BNY Mellon (59,634) 01/12/2011Buy 4,955,272 GBP to Sell 8,150,000 USD BNY Mellon (49,334) 01/09/2011Buy 1,613,497 GBP to Sell 2,630,000 USD BNY Mellon (3,193) 01/12/2011Buy 150,000 EUR to Sell 133,739 GBP BNY Mellon (766) 01/09/2011Total unrealised loss on open forward foreign exchange contracts (319,088)
Total net unrealised loss on open forward foreign exchange contracts (293,521)
Invesco Emerging Local Currencies Debt Fund
Unrealised Gain/(Loss)
Details of Forward Foreign Exchange Contracts Counterparty USD Maturity Date
Buy 29,486 USD to Sell 20,414 EUR BNY Mellon 18 07/09/2011Buy 11,599 EUR to Sell 16,713 USD BNY Mellon 32 02/09/2011Buy 239,136 USD to Sell 164,899 EUR BNY Mellon 1,081 01/09/2011Buy 91,462,000 CNY to Sell 14,394,397 USD JP Morgan 16,260 25/11/2011Buy 73,338,000,058 IDR to Sell 8,568,024 USD HSBC 23,387 08/09/2011Buy 11,075,160 MYR to Sell 3,675,670 USD HSBC 50,293 13/10/2011Buy 18,258,000 MYR to Sell 6,036,700 USD JP Morgan 88,895 06/09/2011Buy 4,869,532 USD to Sell 8,248,500 TRY Citibank 116,480 11/10/2011Buy 14,386,900 SGD to Sell 11,758,422 USD JP Morgan 205,778 13/10/2011Buy 402,610,000 THB to Sell 13,000,000 USD JP Morgan 390,591 05/10/2011Buy 69,746,823 EUR to Sell 99,168,755 USD BNY Mellon 1,511,743 07/09/2011Total unrealised gain on open forward foreign exchange contracts 2,404,558
Buy 30,391,060 TRY to Sell 18,147,313 USD Citibank (652,305) 17/10/2011Buy 282,555,000 RUB to Sell 10,000,000 USD Citibank (287,237) 07/10/2011Buy 10,971,851 USD to Sell 19,504,660 TRY Citibank (256,259) 17/10/2011Buy 8,248,500 TRY to Sell 5,000,000 USD Citibank (246,948) 11/10/2011Buy 11,833,279 USD to Sell 14,386,900 SGD JP Morgan (130,921) 13/10/2011Buy 6,008,886 USD to Sell 18,258,000 MYR JP Morgan (116,709) 06/09/2011Buy 7,420,220 USD to Sell 5,220,352 EUR BNY Mellon (115,430) 07/09/2011Buy 16,700,000 USD to Sell 30,026,600,000 COP Citibank (84,022) 16/09/2011Buy 8,527,674 USD to Sell 73,338,000,058 IDR HSBC (63,736) 08/09/2011Buy 5,420,077 USD to Sell 3,800,000 EUR Citibank (63,249) 07/10/2011Buy 8,876,227 USD to Sell 6,198,266 EUR Citibank (53,143) 22/02/2012Buy 3,688,032 USD to Sell 11,075,160 MYR HSBC (37,931) 13/10/2011Buy 150,300,000 THB to Sell 5,000,000 USD HSBC (8,361) 21/10/2011Buy 2,077,568 EUR to Sell 3,002,652 USD BNY Mellon (3,655) 07/09/2011Buy 2,454,900 MYR to Sell 826,287 USD JP Morgan (2,664) 06/09/2011Buy 300,270,000 THB to Sell 10,000,000 USD Citibank (1,273) 22/09/2011Buy 48,228 EUR to Sell 69,955 USD BNY Mellon (331) 01/09/2011Buy 117,015 USD to Sell 81,201 EUR BNY Mellon (209) 02/09/2011Total unrealised loss on open forward foreign exchange contracts (2,124,383)
Total net unrealised gain on open forward foreign exchange contracts 280,175

Notes to the Financial Statements (continued)
118 Invesco Funds
7. Forward Foreign Exchange Contracts (continued) Invesco Global Investment Grade Corporate Bond Fund
Unrealised Gain/(Loss)
Details of Forward Foreign Exchange Contracts Counterparty USD Maturity Date
Buy 3,861 USD to Sell 2,364 GBP BNY Mellon 12 07/09/2011Buy 194,013 USD to Sell 134,000 EUR BNY Mellon 565 01/09/2011Buy 120,000 GBP to Sell 192,939 USD BNY Mellon 2,481 01/09/2011Buy 2,053,800 USD to Sell 1,260,000 GBP BNY Mellon 4,056 01/12/2011Buy 250,000 EUR to Sell 354,692 USD BNY Mellon 6,219 01/09/2011Buy 2,363,328 USD to Sell 1,440,000 GBP BNY Mellon 18,288 01/09/2011Buy 2,927,712 EUR to Sell 4,159,132 USD BNY Mellon 67,061 07/09/2011Total unrealised gain on open forward foreign exchange contracts 98,682
Buy 5,781,735 USD to Sell 4,076,000 EUR BNY Mellon (102,548) 01/09/2011Buy 5,448,694 USD to Sell 3,790,000 EUR BNY Mellon (16,762) 01/12/2011Buy 165,000 GBP to Sell 271,511 USD BNY Mellon (2,809) 01/09/2011Buy 150,000 EUR to Sell 218,878 USD BNY Mellon (2,332) 01/09/2011Buy 226,874 USD to Sell 140,000 GBP BNY Mellon (1,116) 01/09/2011Buy 71,087 USD to Sell 50,000 EUR Unicredit (1,096) 01/09/2011Buy 103,468 USD to Sell 72,385 EUR BNY Mellon (1,021) 07/09/2011Buy 54,000 EUR to Sell 78,152 USD BNY Mellon (202) 07/09/2011Buy 32,526 USD to Sell 20,000 GBP Unicredit (44) 01/09/2011Buy 94,019 GBP to Sell 153,141 USD BNY Mellon (44) 07/09/2011Buy 7,204 USD to Sell 5,000 EUR BNY Mellon (14) 02/09/2011Total unrealised loss on open forward foreign exchange contracts (127,988)
Total net unrealised loss on open forward foreign exchange contracts (29,306)
Invesco Global Unconstrained Bond Fund
Unrealised Gain/(Loss)
Details of Forward Foreign Exchange Contracts Counterparty GBP Maturity Date
Buy 53,272 GBP to Sell 70,000 CHF Citibank 137 20/09/2011Buy 50,000 USD to Sell 30,404 GBP Citibank 306 20/09/2011Buy 23,109 GBP to Sell 30,000 CHF JP Morgan 324 03/10/2011Buy 50,000 USD to Sell 30,358 GBP JP Morgan 349 12/09/2011Buy 123,267 GBP to Sell 200,000 USD Royal Bank of Scotland 417 26/09/2011Buy 31,133 GBP to Sell 50,000 USD Citibank 423 20/09/2011Buy 95,000 EUR to Sell 83,472 GBP JP Morgan 742 03/10/2011Buy 93,926 GBP to Sell 150,000 USD JP Morgan 1,804 12/09/2011Buy 450,000 EUR to Sell 395,537 GBP JP Morgan 3,374 21/09/2011Buy 470,000 EUR to Sell 408,860 GBP Citibank 7,781 20/09/2011Buy 1,646,829 EUR to Sell 1,435,221 GBP BNY Mellon 24,660 07/09/2011Total unrealised gain on open forward foreign exchange contracts 40,317
Buy 1,155,540 GBP to Sell 1,320,000 EUR Citibank (14,600) 20/09/2011Buy 871,919 GBP to Sell 993,702 EUR BNY Mellon (8,978) 07/09/2011Buy 1,409,456 GBP to Sell 1,600,000 EUR JP Morgan (8,895) 21/09/2011Buy 200,000 USD to Sell 123,900 GBP Royal bank of Scotland (1,050) 26/09/2011Buy 157 GBP to Sell 178 EUR BNY Mellon (1) 02/09/2011Total unrealised loss on open forward foreign exchange contracts (33,524)
Total net unrealised gain on open forward foreign exchange contracts 6,793

Notes to the Financial Statements (continued)
119 Invesco Funds
7. Forward Foreign Exchange Contracts (continued) Invesco Global Total Return (EUR) Bond Fund
Unrealised Gain/(Loss)
Details of Forward Foreign Exchange Contracts Counterparty EUR Maturity Date
Buy 283,897 EUR to Sell 250,000 GBP JP Morgan 1,877 03/10/2011Buy 1,215,013 EUR to Sell 1,750,000 USD JP Morgan 2,299 03/10/2011Buy 172,816 EUR to Sell 150,000 GBP Citibank 3,604 11/10/2011Buy 350,140 EUR to Sell 500,000 USD Royal Bank of Scotland 3,680 26/09/2011Buy 229,934 EUR to Sell 200,000 GBP Citibank 4,317 24/10/2011Buy 138,389 EUR to Sell 150,000 CHF Citibank 9,826 11/10/2011Total unrealised gain on open forward foreign exchange contracts 25,603
Buy 150,000 USD to Sell 105,764 EUR JP Morgan (1,817) 03/10/2011Total unrealised loss on open forward foreign exchange contracts (1,817)
Total net unrealised gain on open forward foreign exchange contracts 23,786
Invesco Emerging Market Corporate Bond Fund
Unrealised Gain/(Loss)
Details of Forward Foreign Exchange Contracts Counterparty USD Maturity Date
Buy 1,785,276 EUR to Sell 2,535,865 USD BNY Mellon 41,205 07/09/2011Total unrealised gain on open forward foreign exchange contracts 41,205
Buy 52,797 USD to Sell 37,156 EUR BNY Mellon (837) 07/09/2011Total unrealised loss on open forward foreign exchange contracts (837)
Total net unrealised gain on open forward foreign exchange contracts 40,368
Invesco Euro Short Term Bond Fund
Unrealised Gain/(Loss)
Details of Forward Foreign Exchange Contracts Counterparty EUR Maturity Date
Buy 27,943 EUR to Sell 40,000 USD Unicredit 214 04/11/2011Buy 584,879 EUR to Sell 840,000 USD BNY Mellon 2,567 04/11/2011Buy 706,481 EUR to Sell 620,000 GBP BNY Mellon 7,069 04/11/2011Total unrealised gain on open forward foreign exchange contracts 9,850
Buy 80,000 USD to Sell 56,413 EUR Unicredit (955) 04/11/2011Buy 85,000 GBP to Sell 96,299 EUR BNY Mellon (412) 04/11/2011Total unrealised loss on open forward foreign exchange contracts (1,367)
Total net unrealised gain on open forward foreign exchange contracts 8,483
Invesco Capital Shield 90 (EUR) Fund
Unrealised Gain/(Loss)
Details of Forward Foreign Exchange Contracts Counterparty EUR Maturity Date
Buy 300,000 GBP to Sell 336,241 EUR BNY Mellon 2,178 14/09/2011Buy 1,213,000 USD to Sell 835,457 EUR BNY Mellon 4,928 14/09/2011Buy 1,020,070 EUR to Sell 897,000 GBP BNY Mellon 8,197 14/09/2011Buy 14,407,706 EUR to Sell 20,692,000 USD BNY Mellon 71,969 14/09/2011Total unrealised gain on open forward foreign exchange contracts 87,272
Buy 10,699,000 USD to Sell 7,507,579 EUR BNY Mellon (95,146) 14/09/2011Buy 671,000 GBP to Sell 765,838 EUR BNY Mellon (8,907) 14/09/2011Buy 313,737 EUR to Sell 279,000 GBP BNY Mellon (993) 14/09/2011Buy 918,466 EUR to Sell 1,327,000 USD BNY Mellon (900) 14/09/2011Total unrealised loss on open forward foreign exchange contracts (105,946)
Total net unrealised loss on open forward foreign exchange contracts (18,674)

Notes to the Financial Statements (continued)
120 Invesco Funds
7. Forward Foreign Exchange Contracts (continued) Invesco Asia Balanced Fund
Unrealised Gain/(Loss)
Details of Forward Foreign Exchange Contracts Counterparty USD Maturity Date
Buy 1,485 USD to Sell 1,024 EUR BNY Mellon 7 01/09/2011Buy 11,028 USD to Sell 7,631 EUR BNY Mellon 12 07/09/2011Buy 15,270,131 EUR to Sell 21,698,635 USD BNY Mellon 344,010 07/09/2011Total unrealised gain on open forward foreign exchange contracts 344,029
Buy 3,710,174 USD to Sell 2,600,801 EUR BNY Mellon (44,118) 07/09/2011Buy 556,826 EUR to Sell 805,940 USD BNY Mellon (2,154) 07/09/2011Buy 302,018 USD to Sell 209,604 EUR BNY Mellon (575) 02/09/2011Buy 227,860 USD to Sell 1,776,715 HKD BNY Mellon (66) 02/09/2011Buy 119,701 USD to Sell 933,523 HKD BNY Mellon (56) 01/09/2011Total unrealised loss on open forward foreign exchange contracts (46,969)
Total net unrealised gain on open forward foreign exchange contracts 297,060
Invesco Pan European High Income Fund
Unrealised Gain/(Loss)
Details of Forward Foreign Exchange Contracts Counterparty EUR Maturity Date
Buy 93,975 EUR to Sell 700,000 DKK Citibank 27 06/09/2011Buy 693,963 EUR to Sell 1,000,000 USD JP Morgan 983 03/10/2011Buy 121,359 EUR to Sell 140,000 CHF JP Morgan 1,413 03/10/2011Buy 283,797 EUR to Sell 250,000 GBP JP Morgan 1,780 21/09/2011Buy 260,216 EUR to Sell 300,000 CHF Royal Bank of Scotland 3,336 19/09/2011Buy 420,168 EUR to Sell 600,000 USD Royal Bank of Scotland 4,416 26/09/2011Buy 681,818 EUR to Sell 600,000 GBP Royal Bank of Scotland 4,973 26/09/2011Buy 2,725,414 EUR to Sell 2,400,000 GBP JP Morgan 18,021 03/10/2011Buy 1,149,670 EUR to Sell 1,000,000 GBP Citibank 21,586 24/10/2011Buy 3,418,959 EUR to Sell 3,000,000 GBP Royal Bank of Scotland 34,752 19/09/2011Buy 4,571,429 EUR to Sell 4,000,000 GBP Citibank 59,149 20/09/2011Total unrealised gain on open forward foreign exchange contracts 150,436
Buy 1,661,130 EUR to Sell 1,500,000 GBP Royal Bank of Scotland (30,956) 07/09/2011Buy 800,000 GBP to Sell 910,146 EUR JP Morgan (7,682) 03/10/2011Buy 1,727,712 EUR to Sell 2,500,000 USD Royal Bank of Scotland (4,173) 07/09/2011Buy 32,062 EUR to Sell 250,000 NOK Royal Bank of Scotland (255) 07/09/2011Buy 150,000 USD to Sell 104,122 EUR JP Morgan (176) 03/10/2011Total unrealised loss on open forward foreign exchange contracts (43,242)
Total net unrealised gain on open forward foreign exchange contracts 107,194
Invesco Global Absolute Return Fund
Unrealised Gain/(Loss)
Details of Forward Foreign Exchange Contracts Counterparty EUR Maturity Date
Buy 1,183 USD to Sell 816 EUR BNY Mellon 4 07/09/2011Buy 650 EUR to Sell 71,296 JPY BNY Mellon 5 07/09/2011Buy 94,486 JPY to Sell 847 EUR BNY Mellon 7 07/09/2011Buy 1,422 EUR to Sell 2,020 USD BNY Mellon 24 07/09/2011Buy 800,000 CAD to Sell 562,216 EUR BNY Mellon 3,014 30/09/2011Buy 2,636,271 EUR to Sell 3,800,000 USD BNY Mellon 3,039 30/09/2011Buy 2,795,175 EUR to Sell 3,200,000 CHF BNY Mellon 53,935 30/09/2011Total unrealised gain on open forward foreign exchange contracts 60,028
Buy 700,000 GBP to Sell 794,191 EUR BNY Mellon (4,535) 30/09/2011Buy 74,665 USD to Sell 52,638 EUR BNY Mellon (913) 07/09/2011Buy 6,035,997 JPY to Sell 55,280 EUR BNY Mellon (700) 07/09/2011Buy 824 EUR to Sell 92,167 JPY BNY Mellon (10) 07/09/2011Total unrealised loss on open forward foreign exchange contracts (6,158)
Total net unrealised gain on open forward foreign exchange contracts 53,870

Notes to the Financial Statements (continued)
121 Invesco Funds
7. Forward Foreign Exchange Contracts (continued) Invesco Balanced-Risk Allocation Fund
Unrealised Gain/(Loss)
Details of Forward Foreign Exchange Contracts Counterparty EUR Maturity Date
Buy 12,474 USD to Sell 8,606 EUR BNY Mellon 36 07/09/2011Buy 20,507 EUR to Sell 29,550 USD BNY Mellon 38 02/09/2011Buy 16,353 EUR to Sell 14,360 GBP BNY Mellon 154 07/09/2011Buy 38,743 EUR to Sell 55,337 USD BNY Mellon 407 07/09/2011Buy 220,000 GBP to Sell 246,189 EUR BNY Mellon 1,986 14/09/2011Buy 6,027,000 HKD to Sell 533,211 EUR BNY Mellon 2,529 14/09/2011Buy 1,030,450 EUR to Sell 113,300,000 JPY BNY Mellon 5,796 14/09/2011Buy 1,654,457 EUR to Sell 18,456,000 HKD BNY Mellon 13,900 14/09/2011Buy 5,411,767 EUR to Sell 4,777,000 GBP BNY Mellon 23,008 14/09/2011Buy 139,599,999 JPY to Sell 1,235,949 EUR BNY Mellon 26,555 14/09/2011Buy 47,575,881 EUR to Sell 68,116,000 USD BNY Mellon 384,063 14/09/2011Total unrealised gain on open forward foreign exchange contracts 458,472
Buy 1,975,136 EUR to Sell 223,799,998 JPY BNY Mellon (48,848) 14/09/2011Buy 7,823,942 EUR to Sell 11,350,000 USD BNY Mellon (39,514) 14/09/2011Buy 3,684,000 GBP to Sell 4,177,914 EUR BNY Mellon (22,127) 14/09/2011Buy 19,906,000 HKD to Sell 1,790,937 EUR BNY Mellon (21,488) 14/09/2011Buy 7,208,537 EUR to Sell 10,428,000 USD Royal Bank of Scotland (16,142) 14/09/2011Buy 1,095,465 USD to Sell 771,865 EUR BNY Mellon (12,979) 07/09/2011Buy 440,567 GBP to Sell 505,581 EUR BNY Mellon (8,597) 07/09/2011Buy 47,900,000 JPY to Sell 437,081 EUR BNY Mellon (3,886) 14/09/2011Buy 519,213 EUR to Sell 463,000 GBP BNY Mellon (3,079) 14/09/2011Buy 1,211,559 EUR to Sell 13,639,000 HKD BNY Mellon (815) 14/09/2011Total unrealised loss on open forward foreign exchange contracts (177,475)
Total net unrealised gain on open forward foreign exchange contracts 280,997
8. Futures Contracts Description Number of Contracts Commitment in sub-fund Base
Ccy Long/ShortUnrealised Gain/Loss in sub-
fund Base Ccy
Invesco Emerging Market Quantitative Equity Fund USD USDMini MSCI Emerging Market 16/09/2011 23 1,184,040 Long (46,440)Total unrealised loss on futures contracts (46,440)
Total unrealised loss on futures contracts (46,440)
Invesco US Structured Equity Fund USD USDS&P500 EMINI 16/09/2011 59 3,583,881 Long 49,269Total unrealised gain on futures contracts 49,269
Total unrealised gain on futures contracts 49,269
Invesco Pan European Structured Equity Fund EUR EURFTSE 100 Index Future 16/09/2011 193 11,552,975 Long 256,979Euro Stoxx 50 Future 16/09/2011 936 21,233,160 Long 235,600Total unrealised gain on futures contracts 492,579
Total unrealised gain on futures contracts 492,579
Invesco Global Bond Fund USD USDLong Gilt Future 28/12/2011 (10) (2,073,488) Short 6,711Total unrealised gain on futures contracts 6,711
Euro Bund Future 08/09/2011 (20) (3,902,019) Short (76,131)US Long Bond (CBT) Future 20/12/2011 (20) (2,743,437) Short (31,875)Total unrealised loss on futures contracts (108,006)
Total net unrealised loss on futures contracts (101,295)

Notes to the Financial Statements (continued)
122 Invesco Funds
8. Futures Contracts (continued) Description Number of Contracts Commitment in sub-fund Base
Ccy Long/ShortUnrealised Gain/Loss in sub-
fund Base Ccy
Invesco European Bond Fund EUR EUREuro Bund Future 08/09/2011 (22) (2,973,190) Short (87,380)Euro-Bobl Future 08/09/2011 (2) (244,330) Short (7,910)Long Gilt Future 28/12/2011 (28) (4,021,611) Short (9,942)Total unrealised loss on futures contracts (105,232)
Total unrealised loss on futures contracts (105,232)
Invesco Absolute Return Bond Fund EUR EUREuro-Bobl Future 08/09/2011 (21) (2,565,465) Short (84,315)10 Year Mini JGB Future 07/09/2011 (24) (3,089,708) Short (39,494)Euro Bund Future 08/09/2011 (9) (1,216,305) Short (6,275)US 5 Year Note (CBT) Future 30/12/2011 (23) (1,955,209) Short (2,560)US 10 Year Note Future 20/12/2011 (18) (1,614,569) Short (2,448)Canada 10 Year Bond Future 19/12/2011 (9) (829,308) Short (2,396)Long Gilt Future 28/12/2011 (3) (430,887) Short (1,065)Total unrealised loss on futures contracts (138,553)
Total unrealised loss on futures contracts (138,553)
Invesco Euro Inflation-Linked Bond Fund EUR EUREuro Bund Future 08/09/2011 (34) (4,594,930) Short (157,330)Total unrealised loss on futures contracts (157,330)
Total unrealised loss on futures contracts (157,330)
Invesco Euro Corporate Bond Fund EUR EUREuro Bund Future 08/09/2011 (3,900) (527,065,500) Short (26,728,250)Total unrealised loss on futures contracts (26,728,250)
Total unrealised loss on futures contracts (26,728,250)
Invesco UK Investment Grade Bond Fund GBP GBPEuro-Schatz Future 08/09/2011 (75) (7,275,442) Short 4,785US Ultra Bond (CBT) Future 20/12/2011 18 1,599,421 Long 7,434Total unrealised gain on futures contracts 12,219
Euro Bund Future 08/09/2011 (20) (2,396,082) Short (157,285)Euro-Bobl Future 08/09/2011 (15) (1,624,463) Short (75,501)US 10 Year Note Future 20/12/2011 (12) (954,195) Short (1,451)US 5 Year Note (CBT) Future 30/12/2011 (30) (2,260,780) Short (2,963)US 2 Year Note (CBT) Future 30/12/2011 (65) (8,801,979) Short (939)Total unrealised loss on futures contracts (238,139)
Total net unrealised loss on futures contracts (225,920)
Invesco Global Investment Grade Corporate Bond Fund USD USDEuro-Schatz Future 08/09/2011 (1) (157,974) Short 105US Ultra Bond (CBT) Future 20/12/2011 2 289,406 Long 156Canada 10 Year Bond Future 19/12/2011 3 399,074 Long 1,12110 Year Mini JGB Future 07/09/2011 2 371,702 Long 4,667US Long Bond (CBT) Future 20/12/2011 8 1,097,375 Long 8,632US 5 Year Note (CBT) Future 30/12/2011 50 6,136,133 Long 16,523Total unrealised gain on futures contracts 31,204
US 10 Year Note Future 21/09/2011 (44) (5,740,281) Short (347,077)Euro Bund Future 08/09/2011 (2) (390,202) Short (25,538)Long Gilt Future 28/12/2011 (3) (622,046) Short (1,532)US 2 Year Note (CBT) Future 30/12/2011 (9) (1,984,711) Short (71)Total unrealised loss on futures contracts (374,218)
Total net unrealised loss on futures contracts (343,014)

Notes to the Financial Statements (continued)
123 Invesco Funds
8. Futures Contracts (continued) Description Number of Contracts Commitment in sub-fund Base
Ccy Long/ShortUnrealised Gain/Loss in sub-
fund Base Ccy
Invesco Global Unconstrained Bond Fund GBP GBPEuro Bund Future 08/09/2011 (2) (239,608) Short 94Long Gilt Future 28/12/2011 (4) (509,300) Short 1,700Total unrealised gain on futures contracts 1,794
Total unrealised gain on futures contracts 1,794
Invesco Euro Short Term Bond Fund EUR EURUS Ultra Bond (CBT) Future 20/12/2011 2 200,470 Long 931Euro-Schatz Future 08/09/2011 35 3,829,963 Long 69,098Total unrealised gain on futures contracts 70,029
Euro-Bobl Future 08/09/2011 (22) (2,687,630) Short (126,497)Euro Bund Future 08/09/2011 (1) (135,145) Short (8,975)Long Gilt Future 28/12/2011 (3) (430,887) Short (1,065)US 5 Year Note (CBT) Future 30/12/2011 (6) (510,055) Short (668)US 10 Year Note Future 20/12/2011 (4) (358,793) Short (544)US 2 Year Note (CBT) Future 30/12/2011 (9) (1,374,795) Short (146)Total unrealised loss on futures contracts (137,895)
Total net unrealised loss on futures contracts (67,866)
Invesco Capital Shield 90 (EUR) Fund EUR EURUS 10 Year Note Future 20/12/2011 163 14,620,821 Long 55,865Euro Bund Future 08/09/2011 77 10,406,165 Long 273,987Total unrealised gain on futures contracts 329,852
Euro Stoxx 50 Future 16/09/2011 163 3,697,655 Long (545,225)FTSE 100 Index Future 16/09/2011 62 3,711,318 Long (292,071)S&P 500 Future 15/09/2011 35 7,362,977 Long (206,713)Total unrealised loss on futures contracts (1,044,009)
Total net unrealised loss on futures contracts (714,157)
Invesco Pan European High Income Fund EUR EUREuro Stoxx 50 Future 16/09/2011 450 10,208,250 Long (702,210)Total unrealised loss on futures contracts (702,210)
Total unrealised loss on futures contracts (702,210)
Invesco Global Absolute Return Fund EUR EUREuro Bund Future 08/09/2011 10 1,351,450 Long 8,850US 10 Year Note Future 20/12/2011 49 4,395,216 Long 29,650Total unrealised gain on futures contracts 38,500
Euro Stoxx 50 Future 16/09/2011 55 1,247,675 Long (73,085)FTSE 100 Index Future 16/09/2011 13 778,180 Long (36,224)S&P500 EMINI 16/09/2011 20 841,535 Long (7,349)Total unrealised loss on futures contracts (116,658)
Total net unrealised loss on futures contracts (78,158)

Notes to the Financial Statements (continued)
124 Invesco Funds
8. Futures Contracts (continued) Description Number of Contracts Commitment in sub-fund Base
Ccy Long/ShortUnrealised Gain/Loss in sub-
fund Base Ccy
Invesco Balanced-Risk Allocation Fund EUR EURUS Long Bond (CBT) Future 20/12/2011 267 25,369,793 Long 52,358Canada 10 Year Bond Future 19/12/2011 616 56,761,497 Long 149,850Hang Seng Index Future 29/09/2011 49 4,453,080 Long 172,836Japan 10 Year Bond (TSE) Future 08/09/2011 49 63,074,892 Long 317,799Euro Bund Future 08/09/2011 267 36,083,715 Long 2,066,285Aust 10 Year Bond Future 15/09/2011 666 55,621,711 Long 2,622,954Total unrealised gain on futures contracts 5,382,082
Euro Stoxx 50 Future 16/09/2011 333 7,554,105 Long (1,156,620)Topix Index Future 08/09/2011 163 11,399,207 Long (670,851)FTSE 100 Index Future 16/09/2011 162 9,697,316 Long (650,333)Russell 2000 Mini Future 16/09/2011 183 9,244,174 Long (544,252)S&P500 EMINI 16/09/2011 284 11,949,797 Long (368,583)Long Gilt Future 28/12/2011 374 53,717,233 Long (170,927)Total unrealised loss on futures contracts (3,561,566)
Total net unrealised gain on futures contracts 1,820,516
9. Credit Default Swaps
Purchase/Sale Deal Expiry Nominal Currency Unrealisedof protection Denomination Counterparty Spread Date Value Loss
in sub-fund
Base CcyInvesco Absolute Return Bond Fund EURSale Markit Itraxx Europe Senior Morgan Stanley 5.00% 20/06/2016 1,100,000 EUR (64,570)Total unrealised loss on credit default swaps (64,570)
Total unrealised loss on credit default swaps (64,570)
Purchase/Sale Deal Expiry Nominal Currency Unrealisedof protection Denomination Counterparty Spread Date Value Loss
in sub-fund
Base CcyInvesco Euro Corporate Bond Fund EURSale Markit Itraxx EU SNR 06/19 Credit Suisse 5.00% 20/06/2016 50,000,000 EUR (2,934,983)Sale French Republic Credit Suisse 0.25% 20/06/2016 50,000,000 USD (2,008,692)Sale Markit Itraxx EU SNR 06/21 Deutsche Bank 5.00% 20/06/2016 25,000,000 EUR (1,467,492)Sale Telefonica SA JP Morgan 1.00% 20/09/2016 15,000,000 EUR (1,239,568)Sale Telefonica SA Deutsche Bank 1.00% 20/09/2016 10,000,000 EUR (826,379)Total unrealised loss on credit default swaps (8,477,114)
Total unrealised loss on credit default swaps (8,477,114)
Purchase/Sale Deal Expiry Nominal Currency Unrealisedof protection Denomination Counterparty Spread Date Value Loss
in sub-fund
Base CcyInvesco Global Unconstrained Bond Fund GBPSale French Republic Credit Suisse 0.25% 20/09/2016 1,000,000 USD (38,024)Sale French Republic JP Morgan 0.25% 20/06/2016 1,000,000 USD (35,614)Sale Markit Itraxx Europe Hi Vol Credit Suisse 1.00% 20/12/2015 500,000 EUR (25,202)Sale Markit Itraxx Europe Crossover Deutsche Bank 5.00% 20/06/2016 250,000 EUR (13,009)Total unrealised loss on credit default swaps (111,849)
Total unrealised loss on credit default swaps (111,849)

Notes to the Financial Statements (continued)
125 Invesco Funds
9. Credit Default Swaps
Purchase/Sale Deal Expiry Nominal Currency Unrealisedof protection Denomination Counterparty Spread Date Value Loss
in sub-fund
Base CcyInvesco Global Total Return (EUR) Bond Fund EURSale French Republic JP Morgan 0.25% 20/06/2016 1,000,000 USD (40,174)Total unrealised loss on credit default swaps (40,174)
Total unrealised loss on credit default swaps (40,174)
Purchase/Sale Deal Expiry Nominal Currency Unrealisedof protection Denomination Counterparty Spread Date Value Gain/(Loss)
in sub-fund
Base CcyInvesco Pan European High Income Fund EURSale British Energy Deutsche Bank 4.55% 20/03/2013 300,000 EUR 19,335Sale Alliance & Leicester Credit Suisse 3.70% 20/06/2013 100,000 EUR 4,018Total unrealised gain on credit default swaps 23,353
Sale French Republic JP Morgan 0.25% 20/06/2016 5,000,000 USD (200,869)Total unrealised loss on credit default swaps (200,869)
Total net unrealised loss on credit default swaps (177,516)
10. Interest Rate Swaps There are no interest rate swaps in the current period. 11. Equity Swaps The counterparty for the below Equity Swaps is Morgan Stanley.
Underlying equities
Quantity of underlying
shares
Currency Commitment in Local Ccy
Commitment as % of NAV of the
sub-fund
Unrealised Gain/(Loss) in sub-fund Base
CcyInvesco Global Absolute Return Fund EURAdvantest Corp (13,000) JPY (115,949) (0.00%) 18,669African Minerals Ltd (7,690) GBP (42,745) (0.09%) 10,937Alere Inc (996) USD (17,110) (0.04%) 8,362Alpiq Holding AG (637) CHF (123,286) (0.17%) 26,655Alstom SA (1,808) EUR (57,833) (0.11%) 14,505Amazon.com Inc (1,000) USD (146,006) (0.01%) 1,421Amgen Inc 5,500 USD 210,454 0.11% 22,312Ansell Ltd 2,483 AUD 25,466 0.00% 84Assurant Inc 1,100 USD 26,745 0.00% 567Avnet Inc (600) USD (10,814) (0.01%) 1,547Bally Technologies Inc (900) USD (19,872) (0.03%) 5,381Banco Popolare SC (24,269) EUR (27,873) (0.05%) 7,050BioMarin Pharmaceutical Inc (1,700) USD (34,680) (0.00%) 280Bombardier Inc 10,300 CAD 37,456 0.00% 722BTG Plc (41,722) GBP (119,967) (0.09%) 11,158Bunge Ltd (300) USD (13,303) (0.01%) 1,259CA Inc 4,100 USD 59,030 0.02% 3,857Canadian Pacific Railway Ltd (3,700) CAD (148,423) (0.01%) 2,306CarMax Inc (8,100) USD (155,728) (0.13%) 26,368Carnival Corp (2,300) USD (52,026) (0.02%) 4,021CenturyLink Inc (500) USD (12,245) (0.01%) 1,058Charter International Plc (7,844) GBP (67,447) (0.04%) 5,113Chiyoda Corp (11,000) JPY (81,751) (0.00%) 8,221Chugai Pharmaceutical Co Ltd (11,500) JPY (138,649) (0.00%) 5,342

Notes to the Financial Statements (continued)
126 Invesco Funds
11. Equity Swaps (continued) Underlying equities
Quantity of underlying
shares
Currency Commitment in Local Ccy
Commitment as % of NAV of the
sub-fund
Unrealised Gain/(Loss) in sub-fund Base
CcyInvesco Global Absolute Return Fund (continued) EURChugoku Bank Ltd (7,000) JPY (64,269) (0.00%) 31Coal & Allied Industries Ltd 272 AUD 24,725 0.02% 4,053Concho Resources Inc/Midland TX (1,000) USD (59,700) (0.03%) 6,361Concur Technologies Inc (1,500) USD (41,733) (0.04%) 8,648Consol Energy Inc (800) USD (25,195) (0.02%) 3,797Cosmo Oil Co Ltd (65,000) JPY (118,417) (0.00%) 2,843Dell Inc 14,800 USD 152,291 0.01% 1,642Dendreon Corp (24,100) USD (202,080) (0.00%) 663Discovery Communications Inc (500) USD (14,403) (0.00%) 3Edwards Lifesciences Corp (1,000) USD (51,633) (0.05%) 9,953EOG Resources Inc (200) USD (12,763) (0.01%) 1,252Equinix Inc (1,735) USD (114,047) (0.03%) 4,994FamilyMart Co Ltd (2,800) JPY (71,225) (0.00%) 4,101FLIR Systems Inc (5,200) USD (91,185) (0.07%) 12,950Foot Locker Inc 8,500 USD 123,734 0.09% 18,410Fresnillo Plc 1,241 GBP 28,194 0.05% 5,497Frontier Communications Corp (6,400) USD (33,138) (0.01%) 1,034Galp Energia SGPS SA (9,497) EUR (129,515) (0.06%) 8,712Garmin Ltd 1,700 USD 39,449 0.01% 1,492GrafTech International Ltd (20,300) USD (220,135) (0.17%) 33,939Gulf Keystone Petroleum Ltd (15,788) GBP (24,355) (0.01%) 687Haseko Corp (52,500) JPY (25,869) (0.00%) 4,035Hershey Co 1,300 USD 52,369 0.01% 1,218Hexagon AB (7,572) SEK (86,375) (0.01%) 10,033HollyFrontier Corp 2,700 USD 135,192 0.04% 8,657Hospira Inc (6,200) USD (197,470) (0.09%) 18,380Hudson City Bancorp Inc (9,800) USD (41,986) (0.07%) 13,980Human Genome Sciences Inc (1,600) USD (14,868) (0.05%) 10,823IAC/InterActiveCorp 7,400 USD 201,269 0.06% 12,822IMMOFINANZ AG (6,167) EUR (15,100) (0.01%) 1,674Isetan Mitsukoshi Holdings Ltd (2,000) JPY (14,023) (0.00%) 965Jean Coutu Group PJC Inc 3,300 CAD 28,083 0.00% 372Johnson Controls Inc (900) USD (19,554) (0.03%) 5,898Kansai Paint Co Ltd (3,000) JPY (19,095) (0.00%) 463Keyence Corp (900) JPY (166,078) (0.00%) 10,051Kinder Morgan Management LLC (723) USD (30,009) (0.01%) 1,898Lafarge SA (554) EUR (15,684) (0.04%) 5,676Lennox International Inc (8,900) USD (191,730) (0.01%) 2,687Lexmark International Inc 800 USD 17,464 0.01% 1,365LSI Corp 23,600 USD 111,572 0.01% 1,328Mazda Motor Corp (110,000) JPY (161,114) (0.00%) 40,978MEMC Electronic Materials Inc (6,500) USD (32,035) (0.01%) 2,264Methanex Corp (1,300) CAD (23,026) (0.02%) 3,950Mitsubishi Chemical Holdings Corp (9,000) JPY (43,411) (0.00%) 5,576Mitsubishi Estate Co Ltd (1,000) JPY (11,320) (0.00%) 1,817Mitsubishi Tanabe Pharma Corp (1,700) JPY (19,766) (0.00%) 1,623MSCI Inc (6,400) USD (152,636) (0.06%) 12,104National Instruments Corp (3,800) USD (66,503) (0.05%) 10,351NEC Corp (82,000) JPY (115,285) (0.00%) 19,637NKT Holding A/S (3,944) DKK (104,860) (0.07%) 69,826Noble Corp (1,000) USD (23,174) (0.01%) 2,718Noble Group Ltd (39,000) SGD (36,444) (0.02%) 3,642OKUMA Corp (17,000) JPY (89,992) (0.00%) 38,932Old Republic International Corp (28,500) USD (196,529) (0.05%) 10,312Orkla ASA (18,440) NOK (105,667) (0.01%) 11,454Owens-Illinois Inc (2,600) USD (33,922) (0.06%) 12,238Pan American Silver Corp 1,400 CAD 31,709 0.00% 190PartnerRe Ltd (3,500) USD (138,059) (0.14%) 27,666Pernod-Ricard SA (312) EUR (19,266) (0.01%) 1,594Petrominerales Ltd 1,700 CAD 36,786 0.03% 5,549Quadra FNX Mining Ltd (3,000) CAD (26,600) (0.02%) 3,212ResMed Inc (506) USD (10,657) (0.00%) 914ResMed Inc (50,823) AUD (106,464) (0.05%) 9,008RONA Inc (1,400) CAD (9,658) (0.01%) 1,421Royal Caribbean Cruises Ltd (3,000) USD (53,708) (0.10%) 18,910Salesforce.com Inc (1,000) USD (85,468) (0.11%) 21,428SandRidge Energy Inc (7,300) USD (37,900) (0.09%) 18,688

Notes to the Financial Statements (continued)
127 Invesco Funds
11. Equity Swaps (continued) Underlying equities
Quantity of underlying
shares
Currency Commitment in Local Ccy
Commitment as % of NAV of the
sub-fund
Unrealised Gain/(Loss) in sub-fund Base
CcyInvesco Global Absolute Return Fund (continued) EURSankyu Inc 47,000 JPY 151,490 0.00% 4,502Sapient Corp (9,600) USD (70,322) (0.13%) 25,509Sawai Pharmaceutical Co Ltd (1,700) JPY (119,963) (0.00%) 6,672SBA Communications Corp (900) USD (22,624) (0.01%) 1,206Seek Ltd (10,407) AUD (43,178) (0.03%) 6,038SembCorp Industries Ltd 32,000 SGD 79,342 0.00% 99ShawCor Ltd (2,700) CAD (49,236) (0.04%) 8,561Sky Deutschland AG (36,467) EUR (81,923) (0.29%) 40,278Spirit Aerosystems Holdings Inc (5,200) USD (59,631) (0.07%) 13,343Suedzucker AG 2,676 EUR 64,398 0.02% 3,375Sumitomo Chemical Co Ltd (17,000) JPY (49,031) (0.00%) 4,439Superior Plus Corp (20,700) CAD (148,209) (0.08%) 16,394Taisei Corp 84,000 JPY 154,171 0.00% 10,584Tecnicas Reunidas SA (927) EUR (25,201) (0.02%) 2,132Telecom Corp of New Zealand Ltd 11,738 NZD 17,577 0.00% 317Tellabs Inc 17,000 USD 48,928 0.00% 421Terex Corp (1,400) USD (15,633) (0.05%) 10,396Tesoro Corp 12,800 USD 208,495 0.10% 19,076Thomson Reuters Corp (2,500) CAD (52,674) (0.04%) 7,676Tidewater Inc (3,300) USD (122,718) (0.01%) 2,737Tim Hortons Inc 800 CAD 26,508 0.00% 343Torchmark Corp 7,400 USD 193,734 0.10% 18,896United Natural Foods Inc (3,200) USD (90,360) (0.04%) 8,505United States Steel Corp (5,700) USD (118,747) (0.15%) 30,338Urban Outfitters Inc (700) USD (12,469) (0.01%) 2,757USS Co Ltd 360 JPY 21,514 0.00% 780Valassis Communications Inc (6,000) USD (105,753) (0.10%) 19,704Vallourec SA (1,099) EUR (67,929) (0.18%) 24,870Verbund AG (1,315) EUR (34,305) (0.01%) 1,963Vertex Pharmaceuticals Inc (847) USD (26,563) (0.02%) 3,166Vestas Wind Systems A/S (2,444) DKK (35,802) (0.01%) 6,577Viasat Inc (7,900) USD (197,549) (0.11%) 21,436WH Smith Plc 26,631 GBP 150,581 0.00% 503Wilmar International Ltd (54,000) SGD (164,681) (0.03%) 8,208WMS Industries Inc (12,800) USD (197,767) (0.09%) 18,721World Fuel Services Corp (6,900) USD (178,111) (0.01%) 2,817Yaskawa Electric Corp (9,000) JPY (56,471) (0.00%) 17,085Total unrealised gain on equity swaps 1,157,008
Activision Blizzard Inc 22,000 USD 179,747 0.01% (1,727)Akamai Technologies Inc (2,900) USD (44,144) (0.00%) (946)Allied World Assurance Co Holdings AG 264 USD 9,775 0.00% (427)Alpha Natural Resources Inc (5,200) USD (122,504) (0.08%) (16,298)American Capital Ltd 8,300 USD 49,991 0.03% (6,387)Amphenol Corp (2,100) USD (67,503) (0.03%) (4,984)Anadarko Petroleum Corp 1,100 USD 55,360 0.03% (5,722)Andritz AG 1,804 EUR 114,608 0.14% (18,978)Apollo Group Inc 5,100 USD 166,162 0.05% (9,099)Archer-Daniels-Midland Co (3,400) USD (67,628) (0.02%) (4,917)Arkema SA 329 EUR 17,294 0.04% (5,177)Asahi Glass Co Ltd 8,000 JPY 54,066 0.00% (13,476)Atco Ltd 3,500 CAD 152,843 0.01% (1,185)Autonomy Corp Plc (1,297) GBP (36,789) (0.10%) (11,708)Biogen Idec Inc 2,400 USD 155,656 0.09% (17,198)Boliden AB 3,694 SEK 34,699 0.01% (9,800)Brinker International Inc 1,800 USD 28,646 0.02% (3,182)Brother Industries Ltd 5,400 JPY 48,945 0.00% (9,296)Bucher Industries AG 1,069 CHF 132,305 0.20% (31,592)Caltex Australia Ltd 2,502 AUD 20,013 0.00% (873)Canon Inc 5,900 JPY 191,769 0.00% (2,407)Cardinal Health Inc 4,300 USD 125,666 0.06% (12,150)CGI Group Inc 2,000 CAD 27,530 0.02% (3,679)Coca-Cola Enterprises Inc 800 USD 15,103 0.00% (506)Coloplast A/S 161 DKK 16,795 0.00% (286)Constellation Brands Inc 3,800 USD 51,894 0.01% (2,716)Cree Inc (4,700) USD (103,107) (0.01%) (1,832)Dainippon Screen Manufacturing Co Ltd 10,000 JPY 45,296 0.00% (14,004)

Notes to the Financial Statements (continued)
128 Invesco Funds
11. Equity Swaps (continued) Underlying equities
Quantity of underlying
shares
Currency Commitment in Local Ccy
Commitment as % of NAV of the
sub-fund
Unrealised Gain/(Loss) in sub-fund Base
CcyInvesco Global Absolute Return Fund (continued) EURDillard's Inc 1,500 USD 48,944 0.06% (12,791)Discover Financial Services 9,100 USD 157,146 0.02% (3,137)Domtar Corp 2,600 USD 144,611 0.12% (23,543)DR Horton Inc 2,200 USD 16,146 0.01% (1,340)DreamWorks Animation SKG Inc (2,600) USD (38,280) (0.00%) (772)Eli Lilly & Co 1,245 USD 32,051 0.01% (998)Elpida Memory Inc 16,300 JPY 77,886 0.00% (33,092)Ferrexpo Plc 15,559 GBP 64,764 0.16% (19,027)Finning International Inc 1,000 CAD 17,285 0.02% (3,992)Forest Laboratories Inc 8,000 USD 189,216 0.09% (18,195)Gamesa Corp Tecnologica SA 8,550 EUR 35,581 0.06% (7,810)George Weston Ltd 700 CAD 33,245 0.00% (280)Gree Inc (3,100) JPY (69,130) (0.00%) (16,952)H Lundbeck A/S 1,574 DKK 24,051 0.00% (4,595)HMS Holdings Corp (2,100) USD (38,352) (0.01%) (1,065)Hokkaido Electric Power Co Inc 3,200 JPY 35,876 0.00% (1,499)Hokuriku Electric Power Co 2,200 JPY 27,399 0.00% (2,747)Hugo Boss AG 324 EUR 21,761 0.02% (3,187)Humana Inc 400 USD 21,275 0.01% (1,040)Ibiden Co Ltd 7,900 JPY 132,852 0.00% (39,331)Iluka Resources Ltd 4,087 AUD 49,436 0.02% (4,498)Inchcape Plc 5,077 GBP 18,132 0.04% (5,256)Infineon Technologies AG 2,487 EUR 14,565 0.03% (3,503)Ingenico 938 EUR 26,325 0.03% (4,094)Ingram Micro Inc (2,700) USD (33,478) (0.01%) (1,235)Interpublic Group of Cos Inc 18,400 USD 110,313 0.22% (44,043)ITC Holdings Corp (665) USD (35,232) (0.01%) (1,767)ITT Educational Services Inc 1,800 USD 90,596 0.12% (23,310)ITV Plc 25,780 GBP 17,754 0.01% (1,678)Jeronimo Martins SGPS SA 1,583 EUR 20,421 0.01% (1,187)Kabel Deutschland Holding AG 4,313 EUR 170,558 0.05% (6,556)Kakaku.com Inc (2,800) JPY (71,402) (0.00%) (2,164)Kao Corp 10,100 JPY 184,915 0.00% (448)KBR Inc 6,200 USD 131,096 0.14% (28,299)Keikyu Corp (8,000) JPY (47,412) (0.00%) (3,577)KeyCorp 23,500 USD 106,867 0.11% (22,156)Kloeckner & Co SE (6,129) EUR (69,825) (0.05%) (7,283)Konami Corp (8,200) JPY (208,068) (0.00%) (15,885)Koninklijke Boskalis Westminster NV 381 EUR 8,872 0.02% (2,318)K's Holdings Corp 1,200 JPY 36,346 0.00% (6,778)Lear Corp 400 USD 12,958 0.01% (1,544)Ltd Brands Inc 2,000 USD 53,095 0.01% (2,085)Macy's Inc 600 USD 10,904 0.01% (1,551)Magellan Health Services Inc 900 USD 30,694 0.02% (3,786)Markel Corp (100) USD (27,239) (0.00%) (77)Mediaset SpA 9,839 EUR 26,546 0.03% (3,699)Medicis Pharmaceutical Corp 2,200 USD 58,938 0.00% (566)MetroPCS Communications Inc 12,000 USD 93,472 0.24% (47,638)Mitsui & Co Ltd 1,400 JPY 16,487 0.00% (1,877)Motorola Solutions Inc 6,800 USD 197,150 0.02% (4,662)Myriad Genetics Inc 3,100 USD 42,818 0.04% (7,750)Navistar International Corp 500 USD 14,379 0.02% (4,204)Nippon Meat Packers Inc 2,000 JPY 17,133 0.00% (3,277)Nippon Paper Group Inc (6,200) JPY (108,523) (0.00%) (1,957)Noble Energy Inc 500 USD 30,087 0.01% (2,110)Nokian Renkaat OYJ 989 EUR 24,770 0.08% (10,844)Nomura Research Institute Ltd 6,500 JPY 101,492 0.00 (4,324)Novagold Resources Inc (2,100) CAD (15,058) (0.00%) (902)Novo Nordisk A/S 386 DKK 28,376 0.01% (5,842)NSK Ltd 19,000 JPY 104,444 0.00% (4,882)OC Oerlikon Corp AG 16,690 CHF 85,182 0.11% (17,989)OPAP SA 2,733 EUR 23,271 0.05% (7,037)Oracle Corp Japan 6,000 JPY 137,842 0.00% (13,013)Persimmon Plc 2,706 GBP 13,600 0.01% (1,072)Pioneer Natural Resources Co 200 USD 10,598 0.01% (2,562)PPG Industries Inc 500 USD 26,501 0.02% (4,542)QIAGEN NV (13,005) EUR (140,421) (0.05%) (7,110)

Notes to the Financial Statements (continued)
129 Invesco Funds
11. Equity Swaps (continued) Underlying equities
Quantity of underlying
shares
Currency Commitment in Local Ccy
Commitment as % of NAV of the
sub-fund
Unrealised Gain/(Loss) in sub-fund Base
CcyInvesco Global Absolute Return Fund (continued) EURQuanta Services Inc (2,000) USD (26,551) (0.00%) (51)Rakuten Inc (250) JPY (194,612) (0.00%) (10,401)Randgold Resources Ltd (848) GBP (62,130) (0.08%) (9,978)Reckitt Benckiser Group Plc 446 GBP 16,261 0.01% (1,154)Reliance Steel & Aluminum Co 500 USD 14,195 0.01% (2,827)Rowan Cos Inc (8,300) USD (206,200) (0.03%) (6,622)Royal Dutch Shell Plc 1,748 GBP 40,151 0.03% (3,985)Russel Metals Inc 3,500 CAD 55,710 0.02% (4,658)Saab AB 12,149 SEK 173,282 0.01% (8,230)Sapporo Hokuyo Holdings Inc 7,600 JPY 19,892 0.00% (4,150)SEACOR Holdings Inc 2,400 USD 147,909 0.05% (9,528)Shionogi & Co Ltd 8,700 JPY 96,632 0.00% (400)SJM Holdings Ltd 14,000 HKD 22,244 0.00% (1,091)SM Energy Co 200 USD 10,505 0.00% (268)Smithfield Foods Inc 900 USD 13,669 0.00% (106)Societe Television Francaise 1 1,983 EUR 21,778 0.02% (2,315)Solutia Inc (6,200) USD (74,534) (0.02%) (3,406)Solvay SA 654 EUR 55,799 0.01% (1,950)Sony Financial Holdings Inc 2,200 JPY 23,889 0.00% (4,287)Sprint Nextel Corp 35,000 USD 86,431 0.22% (43,164)Stanley Electric Co Ltd 6,600 JPY 65,281 0.00% (16,222)STMicroelectronics NV 4,733 EUR 21,658 0.06% (8,112)Symantec Corp 849 USD 9,971 0.01% (1,182)Takeda Pharmaceutical Co Ltd 5,500 JPY 183,616 0.00% (862)TDK Corp 1,800 JPY 54,274 0.00% (16,427)Telephone & Data Systems Inc 3,500 USD 61,083 0.06% (12,509)TeliaSonera AB (21,801) SEK (107,151) (0.00%) (485)TGS Nopec Geophysical Co ASA 12,974 NOK 218,514 0.02% (24,750)Tokio Marine Holdings Inc 4,200 JPY 78,661 0.00% (8,089)Toro Co 500 USD 18,620 0.01% (1,365)Tosoh Corp 70,000 JPY 184,486 0.00% (1,104)Unicharm Corp (5,500) JPY (179,886) (0.00%) (4,856)UOL Group Ltd 12,000 SGD 31,619 0.01% (2,653)URS Corp 1,400 USD 33,947 0.04% (8,642)Valero Energy Corp 13,800 USD 210,349 0.07% (14,557)ValueClick Inc 3,100 USD 33,144 0.03% (5,277)Verizon Communications Inc 800 USD 20,113 0.00% (289)Viscofan SA 650 EUR 16,825 0.00% (374)Vishay Intertechnology Inc 7,500 USD 59,927 0.09% (17,487)Visteon Corp 2,200 USD 77,728 0.01% (2,240)Vodafone Group Plc (46,762) GBP (85,283) (0.01%) (1,452)Voestalpine AG 958 EUR 24,630 0.08% (11,132)Volvo AB 11,374 SEK 94,752 0.00% (1,297)Washington Post Co 500 USD 122,276 0.05% (9,124)Yamada Denki Co Ltd 350 JPY 17,689 0.00% (4,078)Yamato Holdings Co Ltd 7,400 JPY 88,783 0.00% (594)Yangzijiang Shipbuilding Holdings Ltd 23,000 SGD 15,333 0.01% (2,011)Total unrealised loss on equity swaps (1,054,623)
Total net unrealised gain on equity swaps 102,385
12. Swing Pricing Policy Securities are valued as outlined in note 2(b). However, in order to mitigate the effects of dilution, the Fund has implemented a policy of "Swing Pricing" since December 18, 2007. In the best interest of Shareholders, the Directors may allow for the net asset value to be adjusted, using bid or ask market quotation rather than mid, depending on the net share activity arising from subscriptions, redemptions or switching in a sub-fund for a given business day. The sub-funds operate partial swing only. That is the sub-funds will not swing to either a bid or ask price basis daily, but only when a pre determined level of shareholder activity is exceeded. High redemption level triggers a swing to a bid price basis, whereas high subscription level triggers a swing to ask price basis. The Directors have the ability to place a sub-fund on constant swing depending on the recent trends in a sub-fund.

Notes to the Financial Statements (continued)
130 Invesco Funds
12. Swing Pricing Policy (continued) The reconciliation on 31 August 2011 of MID to BID/ASK pricing is as follows: A Dist A Acc Dist A
(EUR)Acc A Hedg
Dist AMD
(HKD)
Acc C Hedg
(JPY)
B Acc C Acc C Hedg (USD
C Hedg (EUR)
AccC Hedg
(GBP)
E Acc I Acc R Acc R Dist MD
R Dist MD
(Fxed)BID Pricing Invesco Pan European Small Cap Equity Fund Mid Valuation 15.83 10.98 - - - - 9.66 11.68 - - - 10.09 - - - -Bid Valuation 15.74 10.91 - - - - 9.61 11.60 - - - 10.03 - - - -
Invesco Absolute Return Bond Fund Mid Valuation - 2.7750 - - - - - 2.8894 - - 2.3866 2.7287 2.8854 - - -Bid Valuation - 2.7714 - - - - - 2.8856 - - 2.3835 2.7251 2.8816 - - -
Invesco Euro Inflation Linked Bond Fund Mid Valuation - 14.5386 - - - - - 15.0149 - - - 14.3091 14.7825 10.0387 - -Bid Valuation - 14.4926 - - - - - 14.9674 - - - 14.2638 14.7357 10.0069 - -
Invesco Euro Corporate Bond Fund Mid Valuation 10.7821 13.0351 - - - - - 13.2625 - - - 12.8765 - 9.7500 9.6706 -Bid Valuation 10.7232 12.9639 - - - - - 13.1902 - - - 12.8062 - 9.6968 9.6179 -
Invesco UK Investment Grade Bond Fund Mid Valuation 0.8717 - - - - - - - - - - - - - - -Bid Valuation 0.8697 - - - - - - - - - - - - - - -
Invesco Emerging Local Currencies Debt Fund Mid Valuation 11.4250 15.4244 8.7794 8.5447 100.1766 - - 15.7702 - 9.5992 - 10.5078 - - -7.0291Bid Valuation 11.4002 15.3910 8.7604 8.5262 99.9595 - - 15.7360 - 9.5784 - 10.4851 - - -7.0139
Invesco Capital Shield 90 (EUR) Fund Mid Valuation - 11.26 - - - - - 11.66 - - - 10.79 11.69 - - -Bid Valuation - 11.25 - - - - - 11.64 - - - 10.79 11.68 - - - ASK Pricing Invesco Global Absolute Return Fund Mid Valuation - 10.42 - - - 1176.55 - 10.69 14.14 - - 10.23 - - - -Ask Valuation - 10.43 - - - 1177.47 - 10.70 14.15 - - 10.24 - - - - Invesco Balanced Risk Allocation Fund Mid Valuation 13.13 13.13 - 17.33 - - - 13.29 17.55 - 11.66 12.99 - 15.69 - -Ask Valuation 13.15 13.14 - 17.34 - - - 13.30 17.57 - 11.68 13.01 - 15.70 - -

Notes to the Financial Statements (continued)
131 Invesco Funds
13. Changes in Investments A list, specifying for each investment the total purchases and sales which occurred during the period under review, may be obtained, upon request and free of charge, at the Registered Office and the Hong Kong Representative Office of the Fund. 14. Stock Lending The Fund entered into a stock lending agreement with State Street in December 2007. Below are the Funds which had securities on loan at 31 August 2011. Subs- funds Ccy Total Market Value of Securities
on loan at 31/08/2011 Cash and Letters of Credit held
as collateral in respect of these Securities
Invesco Nippon Select Equity Fund USD 6,223,364 6,552,019
Invesco Nippon Small- Mid Cap Fund USD 6,340,752 6,571,180
Invesco European Growth Equity Fund USD 1,062,152 1,097,017
Invesco Pan European Structured Equity Fund USD 22,708,861 23,450,140
Security lending income is recorded under “Other Income” in the Statement of Operations and Changes in Net Assets at year end.
15. Soft Commissions & Related Party Transactions Certain subsidiaries of Invesco Ltd. (“the Group”) consistent with obtaining the best net result, including best execution, may enter into agreements with counterparties whereby those counterparties may make payments for investment services provided to the Group. Investment services are used by the Group to improve or add to the services provided to its clients. Although each and every service may not be used to service each and every account managed by the Group, the Group considers that those investment services received are, in the aggregate, of significant assistance in fulfilling its investment responsibilities and are of demonstrable benefit to all clients. Only services that assist in the provision of investment services to the Group’s clients will be paid for by counterparties. Allowable investment services include services that provide assistance to the Group in its investment performance. Those services include, but are not necessarily limited to, furnishing analysis, research and advisory services including economic factors and trends, portfolio valuation and analysis, performance measurement, market prices services and the use of specialised computer software and hardware or other information facilities. The Group will ensure adherence to its investment decision making responsibilities to its clients in accordance with the laws of the countries that have jurisdiction over its clients or business. This may vary in application with respect to the appropriateness of those investment services provided. The Group selects counterparties to execute transactions on the basis that transactions will only be executed provided the placing of orders will not operate against the best interest of the Group’s clients and that the multiple is at a level which is generally accepted market practice. The Group will endeavour to obtain best execution on all transactions for all clients. The Group will endeavour to maintain the highest possible regulatory standards worldwide.
16. Statistical Information

Notes to the Financial Statements (continued)
132 Invesco Funds
31 August 2011Total NAV
in sub-fund currencyTotal
Number of Shares in issue Nav per Share Ccy
Invesco Global Structured Equity Fund Distribution A 13,882,198 473,595 29.31 USDAccumulation A Hedg (EUR) 202,418 6,299 22.26 EURDistribution C 21,279,862 692,463 30.73 USDAccumulation C Hedg (EUR) 616,321 18,240 23.41 EURAccumulation C Hedg (GBP) 148,043 4,459 20.39 GBPAccumulation E 720,432 23,687 21.07 EURInvesco Emerging Market Quantitative Equity Fund Accumulation A 726,155 64,895 11.19 USDAccumulation A Hedg (EUR) 3,168,043 245,773 8.93 EURAccumulation C 16,271,965 1,444,121 11.27 USDAccumulation C Hedg (EUR) 3,430,109 264,695 8.98 EURAccumulation C Hedg (GBP) 79,829 6,505 7.54 GBPAccumulation E 833,050 74,898 7.70 EURAccumulation I 1,141 100 7.89 EURInvesco US Structured Equity Fund Accumulation A 44,135,662 3,335,632 13.23 USDAccumulation A Hedg (EUR) 2,153,701 203,670 7.32 EURAccumulation B 757 62 12.17 USDAccumulation C 17,997,971 1,305,557 13.79 USDAccumulation C Hedg (EUR) 357,080 32,342 7.65 EURAccumulation E 7,451,800 601,629 8.58 EURAccumulation I 1,498 111 9.34 EURInvesco Latin American Equity Fund Accumulation A 4,363,381 422,625 10.32 USDAccumulation A Hedg (EUR) 505,148 44,653 7.84 EURAccumulation C 707,295 68,075 10.39 USDAccumulation C Hedg (EUR) 33,759 2,964 7.89 EURAccumulation E 1,315,695 128,385 7.10 EURInvesco Pan European Structured Equity Fund Distribution A 259,190 29,825 8.69 EURAccumulation A 383,990,532 43,963,532 8.73 EURAccumulation B 830 102 8.11 EURAccumulation C 235,525,278 25,574,801 9.21 EURAccumulation E 24,315,541 3,073,754 7.91 EURAccumulation R 4,434 489 9.06 EURInvesco Pan European Equity Fund Distribution A 18,692,465 1,960,862 9.53 EURAccumulation A 261,317,366 25,421,538 10.28 EURAccumulation B 1,977,545 221,230 8.94 EURDistribution C 14,517,506 1,438,181 10.09 EURAccumulation C 252,109,448 23,045,344 10.94 EURAccumulation E 79,324,073 8,159,307 9.72 EURAccumulation I 1,051 99 10.61 EURAccumulation R 89,990 10,590 8.50 EURDistribution A AD (USD) 347,642 35,890 13.98 USDInvesco Pan European Small Cap Equity Fund Accumulation A 71,171,051 6,484,090 10.98 EURDistribution A (USD) 36,772 3,353 15.83 USDAccumulation B 886,389 91,723 9.66 EURAccumulation C 1,028,669 88,103 11.68 EURAccumulation E 4,059,570 402,265 10.09 EURInvesco European Growth Equity Fund Accumulation A 21,697,497 1,612,810 13.45 EURAccumulation C 27,125,329 1,945,408 13.94 EURAccumulation E 2,590,302 202,715 12.78 EURAccumulation I 1,088 78 13.86 EURInvesco Pan European Equity Income Fund Distribution A 3,806,327 539,410 7.06 EURAccumulation A 294,843 39,865 7.40 EURAccumulation C 678 90 7.54 EURAccumulation E 827,663 115,076 7.19 EURInvesco Emerging Europe Equity Fund Accumulation A 20,834,106 1,885,977 11.05 USDAccumulation B 1,304,584 131,267 9.94 USDAccumulation C 7,996,931 684,198 11.69 USDAccumulation E 10,325,310 975,305 7.33 EURInvesco Pan European Focus Equity Fund Accumulation Class-A 1,176,010 139,774 8.41 EUR

Notes to the Financial Statements (continued)
133 Invesco Funds
16. Statistical Information (continued)
31 August 2011Total NAV
in sub-fund currencyTotal
Number of Shares in issue Nav per Share Ccy
Invesco Nippon Small/Mid Cap Equity Fund Accumulation A 3,291,197,637 5,929,689 555.04 JPYAccumulation B 54,209,522 110,691 489.74 JPYAccumulation C 29,253,035 49,499 590.98 JPYAccumulation E 271,213,371 531,226 4.62 EURAccumulation I 117,318 205 5.18 EURDistribution A AD (USD) 471,624 600 10.26 USDDistribution C AD (USD) 472,052 600 10.27 USDInvesco Nippon Select Equity Fund Accumulation A 4,580,797,541 25,113,239 182.41 JPYAccumulation B 43,639,235 272,950 159.88 JPYAccumulation C 1,016,607,930 5,233,735 194.24 JPYAccumulation E 1,074,487,228 6,218,767 1.56 EURAccumulation I 113,405 602 1.70 EURInvesco Asia Opportunities Equity Fund Accumulation A 46,729,706 503,141 92.88 USDAccumulation B 1,356,668 16,428 82.58 USDAccumulation C 91,684,998 926,860 98.92 USDAccumulation E 11,040,748 129,215 59.19 EURInvesco Greater China Equity Fund Accumulation A 279,087,744 7,934,890 35.17 USDAccumulation A Hedg (EUR) 2,826,741 75,660 25.88 EURAccumulation B 7,427,910 241,116 30.81 USDAccumulation C 163,983,372 4,381,954 37.42 USDAccumulation C Hedg (EUR) 1,628,134 40,961 27.53 EURAccumulation E 116,700,161 3,596,222 22.48 EURAccumulation R 196,524 21,616 9.09 USDInvesco Asia Infrastructure Fund Distribution A 341,748,280 24,523,954 13.94 USDAccumulation A 1,292,972,225 90,642,350 14.26 USDAccumulation A Hedg (EUR) 48,476,901 3,273,761 10.26 EURAccumulation C 369,587,767 25,094,542 14.73 USDAccumulation C Hedg (EUR) 4,395,122 282,010 10.80 EURAccumulation E 445,676,356 32,449,083 9.51 EURAccumulation A (HKD) 5,319 467 88.79 HKDAccumulation R 44,343 5,070 8.75 USDInvesco India Equity Fund Distribution A 116,257,080 2,980,218 39.01 USDDistribution C 38,087,841 896,407 42.49 USDAccumulation E 29,258,462 775,176 26.15 EURAccumulation A (HKD) 5,197 467 11.14 HKDInvesco Asia Consumer Demand Fund Distribution A 34,761,991 2,923,388 11.89 USDAccumulation A 388,111,984 32,118,823 12.08 USDAccumulation A Hedg (EUR) 34,197,923 2,704,655 8.76 EURAccumulation C 307,996,313 24,954,218 12.34 USDAccumulation C Hedg (EUR) 27,242,064 2,085,180 9.05 EURAccumulation E 211,505,035 17,937,050 8.17 EURAccumulation A (HKD) 5,408 467 90.29 HKDAccumulation R 294,396 31,698 9.29 USDInvesco Global Leisure Fund Accumulation A 21,877,356 1,206,965 18.13 USDAccumulation B 223,704 14,181 15.77 USDAccumulation C 938,258 48,854 19.21 USDAccumulation E 1,000,568 59,994 11.55 EURInvesco Energy Fund Distribution A 33,556 1,294 25.93 USDAccumulation A 291,590,948 11,251,114 25.92 USDAccumulation A Hedg (EUR) 16,364,813 828,189 13.69 EURAccumulation B 2,276,675 98,059 23.22 USDAccumulation C 33,402,459 1,223,712 27.30 USDAccumulation C Hedg (EUR) 2,781,550 133,206 14.46 EURAccumulation E 34,028,461 1,424,305 16.55 EURAccumulation A (HKD) 5,195 467 86.73 HKDAccumulation R 5,686 700 8.12 USDInvesco Asia Pacific Real Estate Securities Fund Distribution A 1,338,556 151,886 8.81 USDAccumulation A 250,599 28,096 8.92 USDAccumulation C 1,362,030 150,000 9.08 USDAccumulation E 230,107 26,153 6.09 EURInvesco Global Income Real Estate Securities Fund Distribution A 4,927,052 578,458 8.52 USDAccumulation A 3,666,563 370,686 9.89 USDAccumulation C 6,601 647 10.20 USDAccumulation E 666,209 74,761 6.17 EUR

Notes to the Financial Statements (continued)
134 Invesco Funds
16. Statistical Information (continued)
31 August 2011Total NAV
in sub-fund currencyTotal
Number of Shares in issue Nav per Share Ccy
Invesco Gold & Precious Metals Fund Accumulation A 15,895,613 1,259,104 12.62 USDAccumulation A Hedg (EUR) 7,798,910 534,499 10.11 EURAccumulation C 419,110 32,970 12.71 USDAccumulation C Hedg (EUR) 189,251 12,868 10.19 EURAccumulation E 2,350,416 187,334 8.69 EURAccumulation A (HKD) 6,417 466 107.35 HKDAccumulation R 14,474 1,465 9.88 USDInvesco USD Reserve Fund Accumulation A 69,304,101 796,644 87.00 USDAccumulation B 250,318 3,206 78.09 USDAccumulation B1 2,167,852 24,961 86.85 USDAccumulation C 19,273,214 215,326 89.51 USDAccumulation E 13,362,832 153,847 60.17 EURInvesco Euro Reserve Fund Distribution A 5,025 16 321.49 EURAccumulation A 198,134,328 616,104 321.59 EURAccumulation B 76,017 264 288.03 EURAccumulation C 273,063,220 819,680 333.13 EURAccumulation E 46,331,059 145,331 318.80 EURInvesco Global Bond Fund Distribution A 5,222,113 945,094 5.5255 USDAccumulation A 9,171,855 1,147,955 7.9897 USDAccumulation C 13,683,361 1,596,745 8.5695 USDAccumulation E 8,350,670 1,082,458 5.3438 EURInvesco European Bond Fund Distribution A 4,268,344 880,159 4.8495 EURAccumulation A 28,104,229 5,486,186 5.1227 EURAccumulation B 105,977 23,539 4.5023 EURAccumulation C 15,073,176 2,852,366 5.2845 EURAccumulation E 6,261,696 1,242,414 5.0399 EURInvesco Absolute Return Bond Fund Accumulation A 10,252,389 3,694,555 2.7750 EURAccumulation C 127,426 44,101 2.8894 EURAccumulation C Hedg (GBP) 100,751 37,423 2.3894 GBPAccumulation E 8,328,183 3,052,064 2.7287 EURAccumulation I 1,001 347 2.8854 EURInvesco Euro Inflation-Linked Bond Fund Accumulation A 29,190,315 2,007,776 14.5386 EURAccumulation C 5,752,472 383,118 15.0149 EURAccumulation E 18,674,745 1,305,098 14.3091 EURAccumulation I 1,026 69 14.7825 EURAccumulation R 319,234 31,800 10.0387 EURInvesco Euro Corporate Bond Fund Distribution A 428,357,587 39,728,731 10.7821 EURAccumulation A 785,734,783 60,278,545 13.0351 EURAccumulation C 651,916,861 49,154,738 13.2625 EURAccumulation E 598,307,498 46,465,018 12.8765 EURAccumulation R 3,241,454 332,457 9.7500 EURDistribution R MD 16,912,705 1,748,871 9.6706 EURInvesco UK Investment Grade Bond Fund Distribution A 67,899,453 77,897,342 0.8717 GBPInvesco Emerging Local Currencies Debt Fund Distribution A 369,178,579 32,313,353 11.4250 USDAccumulation A 58,394,951 3,785,886 15.4244 USDAccumulation A Hedg (EUR) 43,258,487 3,506,815 8.5447 EURDistribution A Hedg (EUR) 25,181,067 1,986,763 8.7794 EURAccumulation C 122,737,677 7,782,913 15.7702 USDAccumulation C Hedg (EUR) 27,767,767 2,003,756 9.5992 EURAccumulation E 89,147,615 5,876,730 10.578 EURDistribution A MD (HKD) 6,029 469 100.1766 HKDDistribution R MD Fixed 9,568,864 942,973 7.0291 EURInvesco Global Investment Grade Corporate Bond Fund Distribution A 4,961,554 467,094 10.6222 USDAccumulation A Hedg (EUR) 3,030,118 268,600 7.8143 EURDistribution A (USD) 1,994,230 190,096 10.4907 USDDistribution C 3,031,893 284,259 10.6660 USDAccumulation C Hedg (EUR) 1,174,825 103,250 7.8818 EURAccumulation C Hedg (GBP) 149,424 12,589 7.2883 GBPAccumulation E 1,694,105 152,546 7.6927 EUR

Notes to the Financial Statements (continued)
135 Invesco Funds
16. Statistical Information (continued)
31 August 2011Total NAV
in sub-fund currencyTotal
Number of Shares in issue Nav per Share Ccy
Invesco Global Unconstrained Bond Fund Accumulation A 467,491 44,453 10.5166 GBPAccumulation A Hedg (EUR) 24,432 2,190 12.5819 EURAccumulation C 1,826,048 172,384 10.5929 GBPAccumulation C Hedg (EUR) 538,503 47,973 12.6627 EURAccumulation E Hedg (EUR) 24,288 2,190 12.5098 EURInvesco Global Total Return (EUR) Bond Fund Accumulation A 5,740,433 557,273 10.3009 EURAccumulation C 16,735,788 1,617,725 10.3453 EURAccumulation E 19,757 1,923 10.2764 EURAccumulation R 4,764 492 9.6826 EURDistribution E 3,623,528 358,857 10.0974 EURInvesco Emerging Market Corporate Bond Fund Accumulation A 724,792 71,600 10.1228 USDAccumulation A Hedg (EUR) 1,135,822 77,522 10.1490 EURAccumulation C 724,182 71,400 10.1426 USDAccumulation C Hedg (EUR) 701,954 47,817 10.1687 EURAccumulation E Hedg (EUR) 699,455 47,817 10.1326 EURDistribution A MD Fixed 5,555,539 553,178 10.0429 USDDistribution R MD Fixed 721,145 71,886 10.0318 USDInvesco Euro Short Term Bond Fund Accumulation A 1,653,677 167,426 9.8771 EURAccumulation C 4,611,657 466,373 9.8883 EURAccumulation E 1,652,599 167,426 9.8707 EURAccumulation R 1,649,907 167,426 9.8546 EURInvesco Capital Shield 90 (EUR) Fund Accumulation A 63,603,873 5,649,572 11.25 EURAccumulation C 16,475,899 1,410,055 11.64 EURAccumulation E 29,686,491 2,750,400 10.79 EURAccumulation I 1,073 92 11.68 EURInvesco Asia Balanced Fund Distribution A 392,662,548 25,663,705 15.30 USDAccumulation A 140,761,364 6,856,623 20.53 USDAccumulation A Hedg (EUR) 19,195,734 1,116,700 11.91 EURAccumulation C 30,220,622 1,435,425 21.05 USDAccumulation C Hedg (EUR) 81,360 3,618 15.58 EURAccumulation E 17,543,732 1,055,773 11.51 EURAccumulation R 36,300 3,772 9.62 USDDistribution A (HKD) 44,683,140 2,908,074 119.77 HKDInvesco Pan European High Income Fund Distribution A 26,609,622 2,606,966 10.21 EURAccumulation A 18,150,421 1,437,339 12.63 EURAccumulation C 2,657,330 207,520 12.81 EURAccumulation E 36,217,149 2,950,948 12.27 EURInvesco Global Absolute Return Fund Accumulation A 4,544,702 436,189 10.42 EURAccumulation C 2,479,662 231,973 10.69 EURAccumulation C Hedg (USD) 51,237 5,231 14.14 USDAccumulation E 6,554,121 640,754 10.23 EURAccumulation C Hedg (JPY) 54,052 5,082 1,177 JPYInvesco Balanced-Risk Allocation Fund Distribution A 15,634,190 1,190,316 13.13 EURAccumulation A 57,415,982 4,374,160 13.13 EURAccumulation A Hedg (USD) 631,382 52,604 17.33 USDAccumulation C 103,041,955 7,755,645 13.29 EURAccumulation C Hedg (GBP) 487,855 37,076 11.66 GBPAccumulation C Hedg (USD) 108,267 8,907 17.55 USDAccumulation E 42,016,922 3,233,559 12.99 EURAccumulation R 5,676,650 522,414 15.69 USD

Other Information
136 Invesco Funds
UK Distributor Status Certification as a "distributing fund" under the United Kingdom Income and Corporation Taxes Act 1988 for the purposes of UK taxation was sought for the year ended 28 February 2011. Funds Classes Invesco Global Structured Equity Fund A-Dist, C-Dist Invesco Pan European Structured Equity Fund A-Dist QD Invesco Pan European Equity Fund A-Dist, A (USD), C-Dist Invesco Pan European Small Cap Equity Fund A-USD Dist- Invesco Asia Infrastructure Fund A Dist Invesco Asia Consumer Demand Fund A-Dist Invesco Energy Fund A-Dist Invesco Euro Reserve Fund A-Dist Invesco Global Bond Fund A-Dist Invesco Euro Corporate Bond Fund A-Dist MD Invesco Emerging Local Currencies Debt Fund A-Dist MD Invesco Balanced Risk Allocation Fund A-Dist Invesco Global Investment Grade Corporate Bond Fund A-Dist, C-Dist Invesco India Equity Fund A-Dist, C-Dist Invesco UK Investment Grade Bond Fund A-Dist QD Invesco Pan European Equity Income Fund A-Dist Invesco Asia Pacific Real Estate Fund A-Dist UK Reporting Regime The following sub-funds will apply for Reporting Status for the purposes of UK taxation, for the period ended 28 February 2012 and subsequent years. Funds Classes Invesco Global Structured Equity Fund A-Dist & C-Dist Invesco US Structured Equity Fund A & C Invesco Pan European Structured Equity Fund A-Dist QD & C Invesco Pan European Equity Fund A-Dist, A (USD) & C-Dist Invesco Pan European Small Cap Equity Fund A-USD, Dist-AD & C Invesco European Growth Equity Fund A & C Invesco Emerging Europe Equity Fund A & C Invesco Nippon Small/Mid Cap Equity Fund A & C Invesco Greater China Equity Fund A & C Invesco Asia Infrastructure Fund A Dist & C (Acc-USD) Invesco Asia Opportunities Equity Fund A & C Invesco Asia Consumer Demand Fund A-Dist & C (USD) Invesco Energy Fund A-Dist AD & C Invesco Emerging Markets Quantitative Equity Fund A & C Invesco Gold and Precious Metals Fund A & C Invesco USD Reserve Fund A & C Invesco Euro Reserve Fund A-Dist AD & C Invesco Global Bond Fund A-Dist SD Invesco Absolute Return Bond Fund A & C (GBP Hdg) Invesco Euro Corporate Bond Fund A-Dist MD,A & C Invesco Euro Inflation-Linked Bond Fund A & C Invesco Emerging Local Currencies Debt A-Dist MD & C Invesco Global Total Return (EUR) Bond Fund A & C Invesco Global Unconstrained Bond C (GBP) Invesco Capital Shield 90 (EUR) Fund A &C Invesco Asia Balanced Fund A Dist-QD & C Invesco Balanced Risk Allocation Fund A-Dist & C (GBP Hdg) Invesco Global Investment Grade Corporate Bond Fund A-Dist & C-Dist Invesco Asia Balanced Fund A-Dist & C-Dist Invesco Balanced Risk Allocation Fund A-Dist

BOARD OF DIRECTORS
137 Invesco Funds
Leslie Schmldt (Chairman) 11 Greenway Plaza Suite 2500 Houston, TX 77046 United States Head of Global Fund Accounting
Oliver Carroll George’s Quay House 43 Townsend Street Dublin 2, Ireland Head of Finance (Dublin)
Carsten Majer An der Welle 5 D-60322 Frankfurt am Main Germany Chief Marketing Officer Continental Europe
John Rowland Perpetual Park Perpetual Park Drive Henley-on-Thames Oxforshire RG9 1HH United Kingdom Global Head of Investment Operations
Jan Hochtritt An der Welle 5 D-60322 Frankfurt am Main Germany Head of Global Products (Resigned 26 Sept 2011)
Cormac O’Sullivan George’s Quay House 43 Townsend Street Dublin 2, Ireland Head of Dublin Office (Appointed 20 July 2011)
ORGANISATIONS Management Company Invesco Management S.A. 19, rue de Bitbourg L-2173 Luxembourg Grand Duchy of Luxembourg Investment Advisers Invesco Asset Management Limited Registered Office 30 Finsbury Square London EC2A 1AG United Kingdom Invesco Asset Management Asia Limited Registered Office 41/F Citibank Tower 3 Garden Road Central, Hong Kong Invesco Asset Management (Japan) Limited Registered Office Shiroyama Trust Tower 25F 3-1, Toranomon 4-chome, Minato-Ku Tokyo, 105-6025 Japan Invesco Advisers Inc. 1166 Avenue of the Americas, New York, N.Y. 10036 United States of America Invesco Asset Management Deutschland GmbH An der Welle 5 D-60322 Frankfurt am Main Germany Custodian & Paying Agent in Luxembourg The Bank of New York Mellon (International) Limited, Luxembourg Branch Vertigo Building - Polaris 2-4 rue Eugène Ruppert, L-2453 Luxembourg Grand Duchy of Luxembourg Administration Agent, Registrar & Transfer Agent The Bank of New York Mellon (International) Limited, Luxembourg Branch Vertigo Building - Polaris 2-4 rue Eugène Ruppert, L-2453 Luxembourg Grand Duchy of Luxembourg Domiciliary and Corporate Agent Bank of New York Mellon Limited, Luxembourg Branch Vertigo Building - Polaris 2-4 rue Eugène Ruppert, L-2453 Luxembourg Grand Duchy of Luxembourg
Primary Dealing Desk Hong Kong - Dublin Hong Kong Sub-Distributor & Representative. Invesco Asset Management Asia Limited 41/F Citibank Tower 3 Garden Road Central Hong Kong Tel: +852 3128 6000 Fax: +852 3128 6001 German Sub-Distributor and Information Agent Invesco Asset Management Deutschland GmbH An der Welle 5 D-60322 Frankfurt am Main Germany Tel: +49 69 29807 0 Fax: +49 69 29807 159 Global Distributor Invesco Global Asset Management Limited George’s Quay House 43 Townsend Street, Dublin 2, Ireland Tel: +353 1 439 8000 Fax: +353 1 439 8400 Auditor PricewaterhouseCoopers S.à r.l. 400 route d’Esch B.P. 1443, L-1014 Luxembourg Grand Duchy of Luxembourg Legal Advisers to the SICAV Elvinger, Hoss & Prussen 2, Place Winston Churchill B.P. 425 L-2014 Luxembourg Grand Duchy of Luxembourg German Paying Agent BNP Paribas Securities Services S.A.P Branch Office Frankfurt am Main Grüneburgweg 14 D-60322 Frankfurt Germany Austrian Distributor Invesco Asset Management Österreich GesmbH Rotenturmstraße 16 -18 A-1010 Vienna Austria Tel: +43 1 316 2000 Fax: +43 1 316 2020
Austrian Paying Agent ALIZEE Bank AG Renngasse 6-8 A-1010 Vienna Austria Tel: +43 1 2059 5160 Fax: +43 1 2059 5146 Swiss Paying Agent Banque MeesPierson BGL S.A. Rennwieg 57 Postfach CH-8023 Zurich Switzerland Invesco Limited Representative Offices Austria Invesco Asset Management Österreich GesmbH Rotenturmstraße 16 -18 A-1010 Vienna, Austria Tel: +43 1 316 200 Fax: +43 1 316 2020 Belgium Invesco Asset Management S.A. Belgian Branch The Blue Tower Avenue Louise 326 B-1050 Brussels Belgium Tel: +32 2641 0127 Fax: +32 2641 0160 France Invesco Asset Management S.A. 16-18, rue de Londres, F-75009 Paris France Tel: +33 1 56 62 43 02 Fax: +33 1 56 62 43 83 Germany Invesco Asset Management Deutschland GmbH An der Welle 5 D-60322 Frankfurt am Main Germany Tel: +49 69 29807 0 Fax: +49 69 29807 159 Hong Kong Invesco Asset Management Asia Limited 41/F Citibank Tower 3 Garden Road Central Hong Kong Tel: +852 3128 6000 Fax: +852 3128 6001
Italy Invesco Asset Management S.A. Sede Secondaria I-20123 Milan Italy Tel: +39 02 88 074 1 Fax: +39 02 88 074 391 Jersey Invesco International Limited P.O. Box 1588 Orviss House 17A Queens Street St Helier, Jersey, JE4 2PH Tel.: +44 1534 607 600 Fax.: +44 1534 510 510 The Netherlands Invesco Asset Management S.A. Dutch Branch J.C. Geesinkweg 999 NL-1096 AZ Amsterdam The Netherlands Tel: +31 20 561 6261 Fax: +31 20 561 6888 Spain Invesco Asset Management S.A. Sucursal en Espana Calle Recoletos 15, Piso 1 E-28001 Madrid Spain Tel: +34 90 251 09 07 Fax: +34 90 251 08 76 Sweden Invesco Asset Management S.A. Swedish Filial (France) Stureplan 4c 4th Floor, Stockholm 11435 Sweden Tel:+46 8 463 1106 Fax: +46 8 463 1149 Switzerland Invesco Asset Management (Switzerland) Limited Stockerstrasse 14 CH-8002 Zurich Switzerland Tel: +41 1 287 9000 Fax: +41 1 287 9010 United Kingdom Invesco Asset Management Limited 30 Finsbury Square London EC2A 1AG United Kingdom Tel: +44 207 065 4000 Fax: +44 207 638 0752


