88
Further explore opportunities in rental apartments Annual Report 2013 Year ended March 31, 2013
Further explore opportunities in rental apartments
Annual Repor t 2013Y e a r e n d e d M a r c h 3 1 , 2 0 1 3

1 Daito Trust Construction’s Business Fields
5 Top Message
9 Consolidated Financial Highlights
17 Mid-Term Business Plan
22 Daito Group CSR Activities
33 Corporate Governance
36 Board of Directors, Corporate Auditors and Executive Officers
37 Organization
38 Summary of Consolidated Financial Statements
39 Key Performance Indicators
44 Investor Information
45 Corporate Data
Note Regarding Forward-Looking StatementsThis annual report contains information about forward-looking statements related to such matters as the Company’s plans, strategies and business results. These forward-looking statements represent judgments made by the Company based on information available at the time and are inherently subject to a variety of risks and uncertainties. Readers are advised that actual activities and business results may differ from the Company’s forecasts. The reproduction or reprinting of this annual report, in part or in whole, is strictly forbidden without the expressed consent of Daito Trust Construction Co., Ltd.
Contents

Daito Trust Construction's core business
comprises two business fields: its
Lease Property Construction Business
builds high-quality apartments and
condominiums for landowners,
and its Lease Property
Management Business
offers lease business
support services.
Daito Trust Construction is committed to
its corporate philosophy of “contributing to
society by ensuring the most efficient use of
all available land and resources.” In the field of
residential leasing, the Company demonstrates this
commitment by fully satisfying the needs of landowners
and tenants alike. In doing so, we work to supply high-quality
leased housing and will expand our involvement in peripheral
businesses. We are also developing such businesses as LP gas supply,
nursing/day services and lease brokerage as Group businesses that steadily raise
our core business value added.
Daito Trust Construction is committed to
its corporate philosophy of “contributing to
society by ensuring the most efficient use of
all available land and resources.” In the field of
residential leasing, the Company demonstrates this
commitment by fully satisfying the needs of landowners
and tenants alike. In doing so, we work to supply high-quality
leased housing and will expand our involvement in peripheral
businesses. We are also developing such businesses as LP gas supply,
builds high-quality apartments and
condominiums for landowners,
and its Lease Property
Management Business
offers lease business
support services.
Lease Property
Management Business
Core Business
Lease Property
Construction Business
Lease Brokerage Business
Elderly Care
Business
LP Gas Supply
Business
Daito Trust Construction’s Business Fields
1

We provide comprehensive building
lease management support services
for landowners through our unique
business model.
Building lease management does not only involve
the construction of a building. A wide range of
expertise is required, including the securing of
tenants, building management and operations. In
addition, we consider it our duty to support the
leasing business of landowners and, as a company,
believe that the success or failure of a business rests
on its management capabilities and the range of
services provided.
Under its unique Lease Management Trust
System, the Daito Group assumes responsibility
for all aspects of lease property management on
behalf of landowners. We provide comprehensive
lease support services—from initial proposals to
building design and construction, tenant recruiting,
and property management—while taking on all
the risks involved in the process. In addition, Daito
Trust Construction’s business stance is to supply
landowners with valuable land utilization options
and provide tenants with safe and comfortable
lifestyles by placing dedicated staff in all these fields.
That stance earns high praise from tenants and
landowners alike.
Daito Trust Construction Is More Than Just a Construction Firm.
Landowners
· Consult/Propose land development
· Propose building design and construction
· Whole-building lease
· Assume responsibility for lease property management
· Restore property to its original state/ Maintain the building
Tenants
· Tenant recruiting
· Rental contract
· Collection of rental payments
· Various services for tenants
We supply landowners with valuable land utilization options and
provide tenants with safe and comfortable lifestyles.
Daito Group
No. of landowners
69,000
Leased housing buildings
constructed by Daito Trust Construction
since its establishment
139,000
No. of housing units under
management
747,000No. of
buildings
128,000
No. of tenants in Daito Trust Construction properties
1.46 millionApproximately 1% of Japan’s total population of 130 millionOne in 88 people lives in a Daito Trust
Construction property
Note: Calculated on 19.6 people/building (national population census result)
Daito Trust Construction’s Business Fields
2

Amid the new-found reality of increased taxes, such as inheritance and income tax, on the better off following the large package of tax
revisions decided by the Cabinet in January 2013, lease trust management is becoming instrumental in very effective land utilization
and from the asset planning and asset succession perspectives for the landowners who are the Company’s customers.
Since its commencement of operations in 1974, Daito Trust Construction has been reinforcing and evolving its
proprietary comprehensive lease business support service, the Lease Management Trust System business model.
Thanks to all our stakeholders, we have established a solid position in the industry that
has made us the leading Japanese property manager in terms of, for example,
numbers of leased dwellings supplied and leased units under management in Japan.
In the years to come, Daito Trust Construction will leverage its know-how
as a specialist company, protect landowners’ important assets,
and propose optimal solutions for the passing of assets with
confidence to the generations that follow.
Our unique Lease Management Trust System realizes the long-term,
stable management of building lease businesses for landowners.
Thirty-Year
Whole-Building Lease
Design and
Constructio
n
Leasing Business
Planning
Market research/Sales strategies Direct sales system/Consulting Total proposals for landowner
Provide wide-ranging lineup of buildings Provide high-quality properties Elaborate design and
strict quality control
Whole-Building Lease
Tenant recruiting Keep high occupancy rate Building maintenance, etc.
What Is a Thirty Year Whole-Building Lease?
Landowners’ important properties are leased
en bloc by the Daito Trust Construction Group’s
specialist management company, Daito Building
Management Co., Ltd. This system naturally
provides a hedge against the risk of reduced
rental income due to vacancies, evening out
fluctuations in income and expenditure, such
as expenses for restoration and repairs (content
varies depending on the plan), and delivering a
safe and stable building lease business in which
landowners can have confidence over a long
thirty-year period.
Lease Management Trust System
3
(Billions of Yen) (Thousands / %)
2009 2010 201320122011 2009 2010 201320122011
Orders received Occupancy ratio/No. of units under management
552
121
230
434
506
598
135
256
454
551
645
147
281
472
571
694
158
306
489
556
747
170
346
506546
404.5
153.8
249.4
311.6269.1
400.0
101.8
244.3251.1
167.7
466.8
67.6
294.1267.2
44.2
568.7
96.8
322.5300.3
50.0
615.1
119.9
352.9327.1
55.4
Daito Trust Construction BA C D Daito Trust Construction BA C D
97.8%97.6%96.7%96.0%
84.8%
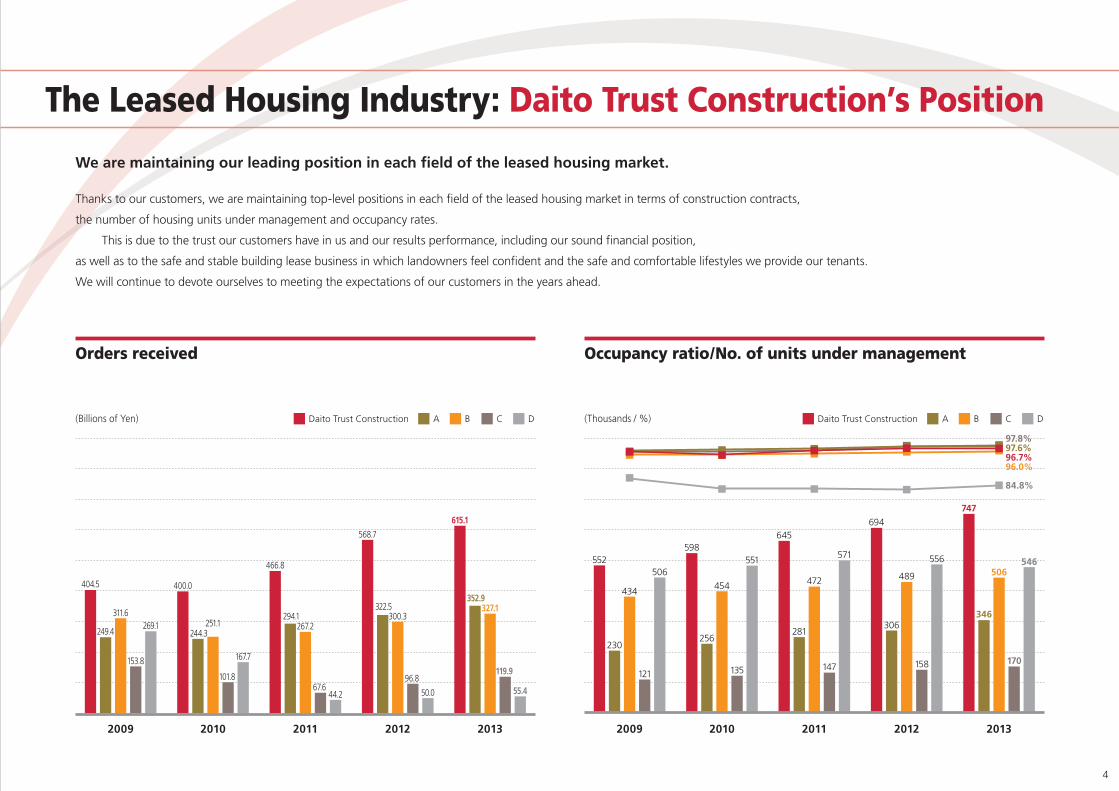
Thanks to our customers, we are maintaining top-level positions in each field of the leased housing market in terms of construction contracts,
the number of housing units under management and occupancy rates.
This is due to the trust our customers have in us and our results performance, including our sound financial position,
as well as to the safe and stable building lease business in which landowners feel confident and the safe and comfortable lifestyles we provide our tenants.
We will continue to devote ourselves to meeting the expectations of our customers in the years ahead.
We are maintaining our leading position in each field of the leased housing market.
The Leased Housing Industry: Daito Trust Construction’s Position
4

Top Message
5

In April 2013, Daito Trust Construction began executing business under a new
management structure consisting of dual representative directors, an increase of
one representative director for the purpose of taking a more flexible approach
to management in accordance with the Company’s business operations and
the special nature of its operating environment. Naomi Kumakiri and Hitoshi
Kadouchi were appointed as the Representative Director and President and the
Representative Director and Executive Vice President, respectively.
Under this new management structure, no changes will be made to our
corporate philosophy of “contributing to society by ensuring the most efficient
use of all available land and resources,” our current business model, nor our
management stance of placing the customer first. By putting in place a dual
representative system, Daito Trust Construction aims to accelerate decision-
making by improving mobility within each representative director’s area of
responsibility. We believe this will ultimately lead to greater shareholder value
as the new management structure stimulates growth in core businesses, which
have expanded in scale to become the largest in the industry, and peripheral
businesses at subsidiaries, which have grown into mid-tier or larger positions
within their respective industries. We respectfully ask for the continued
understanding and support of our shareholders and investors.
New Management Structure
Naomi KumakiriRepresentative Director and President
Hitoshi KadouchiRepresentative Director and Executive Vice President
We would like to express our gratitude to our shareholders and investors for their continued support.
To Our Shareholders
6

While we “do things that only the Daito Group can do,” we strive to fulfill our role and meet expectations in rental housing operations.
As Daito Trust Construction celebrates its 40th anniversary this year, we wish to express our gratitude to our
stakeholders for their unwavering support.
Our core business is providing optimal housing to prospective tenants and undertaking the construction and
management of rental housing on behalf of land owners. Even though the population of Japan has begun to decline,
we do not expect the number of households to fall significantly. We thus anticipate gradually strengthening demand
for services that allow for comfortable lifestyles with peace of mind.
In this environment, we will continue to “do things that only the Daito Group can do.” Take, for example, our
solar power business*1 that installs solar panels on the rooftops of leased buildings, or our Live-UP Lifestyle Services*2
that deepens the connections of tenants to local communities.
Starting in the current fiscal year, Daito Trust Construction transitioned to a dual representative director structure
to oversee the construction business and the real estate business. We will make every effort to create new value
through the property leasing business, by responding precisely and quickly to the needs of land owners and tenants
while enhancing dialog with all of our stakeholders.
*1 Please refer to page 28.
*2 Please refer to page 26Naomi Kumakiri
Representative Director and PresidentNaomi Kumakiri
The New President’s Ambitions
7

While fulfilling its central duty as Japan’s foremost rental housing management company, Daito Trust Construction is looking to the future needs of the next generation.
The Daito Group manages more than 750,000 housing units, making it the largest private-sector housing
management company in Japan. With three quarters of a million households as customers, we field at least as many
requests. While addressing each and every request, Daito Trust Construction strives to maximize the social value of
rental housing as a vital part of social infrastructure. This is our calling.
In order to fulfill our duty, we naturally work to improve the safety and comfort level of our properties, offer
an extensive array of lifestyle-related services and management services, and respond promptly and with a smile to
the requests of our tenants. Nowadays, the majority of people search for information about available rental housing
using the Internet. Daito Trust Construction is always updating its information systems in order to provide prospective
tenants with an abundance of easy-to-understand and accurate information about rental properties that can be
accessed anytime and anywhere.
There are approximately 18 million rental housing units in Japan. In this context, I think there are limitless
possibilities for Daito Trust Construction. We will continue to engage with our customers, employees, partners and
local communities with the aim of enhancing social value.
Hitoshi KadouchiRepresentative Director and Executive Vice President
Aspirations of the New Executive Vice President
8

Consolidated Financial Highlights
9
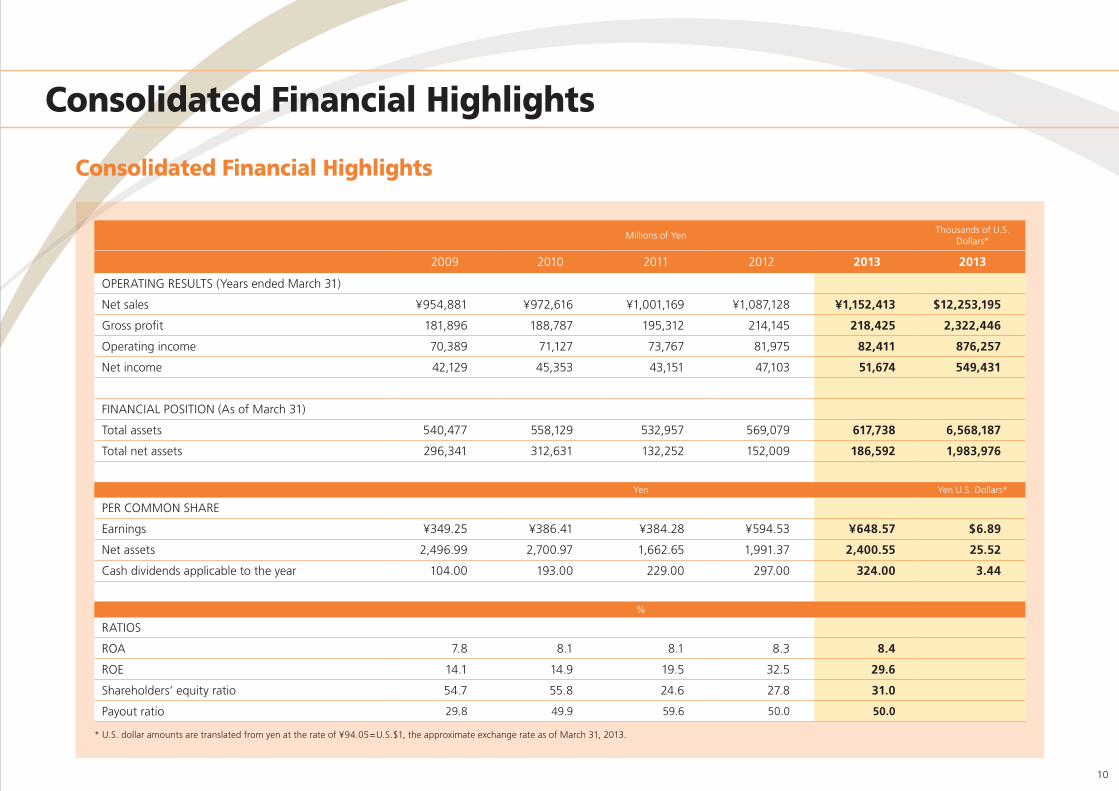
Consolidated Financial Highlights
Millions of YenThousands of U.S.
Dollars*
2009 2010 2011 2012 2013 2013
OPERATING RESULTS (Years ended March 31)
Net sales ¥954,881 ¥972,616 ¥1,001,169 ¥1,087,128 ¥1,152,413 $12,253,195
Gross profit 181,896 188,787 195,312 214,145 218,425 2,322,446
Operating income 70,389 71,127 73,767 81,975 82,411 876,257
Net income 42,129 45,353 43,151 47,103 51,674 549,431
FINANCIAL POSITION (As of March 31)
Total assets 540,477 558,129 532,957 569,079 617,738 6,568,187
Total net assets 296,341 312,631 132,252 152,009 186,592 1,983,976
Yen Yen U.S. Dollars*
PER COMMON SHARE
Earnings ¥349.25 ¥386.41 ¥384.28 ¥594.53 ¥648.57 $6.89
Net assets 2,496.99 2,700.97 1,662.65 1,991.37 2,400.55 25.52
Cash dividends applicable to the year 104.00 193.00 229.00 297.00 324.00 3.44
%
RATIOS
ROA 7.8 8.1 8.1 8.3 8.4
ROE 14.1 14.9 19.5 32.5 29.6
Shareholders’ equity ratio 54.7 55.8 24.6 27.8 31.0
Payout ratio 29.8 49.9 59.6 50.0 50.0
* U.S. dollar amounts are translated from yen at the rate of ¥94.05=U.S.$1, the approximate exchange rate as of March 31, 2013.
Consolidated Financial Highlights
10

In the fiscal year under review, ended March 31, 2013, the Daito Group posted
consolidated net sales of ¥1,152,413 million. This represented an increase of 6.0%
compared with the previous fiscal year.
From a profit perspective, operating income edged up 0.5% year on year to ¥82,411
million. Ordinary income climbed 1.5% to ¥85,539 million and net income grew 9.7%
to ¥51,674 million. In addition to achieving a fifth consecutive fiscal year of revenue and
earnings (operating income) growth, the Group’s results for net sales and income were
both historic highs.
Earnings per share was ¥648.57. Cash dividends per share was ¥324.00 for a payout
ratio of 50.0%.
Net sales and gross profit margin Operating income and operating income margin
Earnings per share Cash dividends per share and payout ratio
Net income and net income margin
Millions of Yen %
2009 2010 2011 2012 2013
954,881
19.0
972,616
19.4
1,001,169
19.5
1,087,128
19.7
1,152,413
19.0
Net sales Gross profit margin (Right)
2009 2010 2011 2012 2013
70,389
7.4
71,127
7.3
73,767
7.4
81,975
7.5
82,411
7.2
Millions of Yen %
Operating income Operating income margin (Right)
2009 2010 2011 2012 2013
42,129
4.4
45,353
4.7
43,151
4.3
47,103
4.3
51,674
4.5
Millions of Yen %
Net income Net income margin (Right)
Yen %
2009 2010 2011 2012 2013
104
29.8 193
49.9
229
59.6 297
50.0 50.0
Cash dividends per share Payout ratio (Right)
324
2009 2010 2011 2012 2013
349.25 386.41 384.28
594.53648.57
Yen
Profit and Loss Accounting Line Items / Per Share Indices
Consolidated Financial Highlights
11

Please provide us with details of the Group’s operating results in the fiscal year under review.
In the fiscal year ended March 31, 2013, the Japanese economy recovered at a moderate pace on the back of demand
fueled by reconstruction activities following the Great East Japan Earthquake. During the second half of the fiscal year,
expectations arising from the monetary easing policies and emergency economic stimulus measures announced by the
new administration led to signs of a partial positive turnaround. This was particularly evident in corrections to the yen’s
appreciation and the upswing in stock prices.
In the housing industry, housing starts for the period from April 2012 to March 2013 increased 6.2% year on
year to 890,000. In the Daito Group’s mainstay leased housing field, housing starts of leased residential properties
for this period climbed 10.7% to 320,000. Driven by inheritance tax reform in Japan, the market for leased residential
properties is showing signs of increased activity. This is largely attributable to the pickup in demand for leased
residential properties that can be used effectively for tax-saving purposes. At the same time, and with the continued
graying of Japan’s society, aging landowners are showing a burgeoning interest in the succession of assets to the next
generation beyond tax-saving concerns. As a result, there are growing calls for companies that put forward leased
residential property construction proposals to provide comprehensive asset management initiatives that facilitate asset
succession and inheritance over and above simple tax-saving proposals.
Moreover, in light of the ongoing reconstruction of old leased residential properties triggering an increase in new
high-quality leased residential properties, demand is steadily shifting from old owner-occupied residential properties
to the reconstruction of leased residential properties combined with an owner-occupied house in major cities. Taking
the aforementioned into consideration, we anticipate construction demand for leased housing will remain robust going
forward.
Against the backdrop of this operating environment, the Daito Group posted net sales of ¥1,152,413 million in the
fiscal year under review on a consolidated basis. This represented a 6.0% increase compared with the previous fiscal
year. On the earnings front, operating income edged up 0.5% year on year to ¥82,411 million. Ordinary income came
to ¥85,539 million, up 1.5%, and net income was ¥51,674 million, a year-on-year improvement of 9.7%. Based on
these results, the Daito Group reported a fifth consecutive fiscal year of revenue and earnings (operating income and
ordinary income) growth. At the same time, the Group achieved historic highs in net sales and at each level of profit.
Accounting for this improved performance, earnings per share was ¥648.57. For the fiscal year under review,
Daito Trust Construction paid a cash dividend per share of ¥324.00
In addition to achieving a fifth consecutive fiscal year of revenue and earnings (operating income and ordinary income) growth, the Daito Group reported historic highs in net sales and at each level of profit.
Historic highs in net sales and at each level of profit
Five consecutive fiscal years of revenue and earnings growth
Historic highs in net sales and at each
level of profit
Annual cash dividend of ¥324 (up ¥6 compared with previously announced payment)
Year-on-year up ¥27
1,001.1 1,087.1
11/3 12/3 13/3
¥1,152.4 billion (Up 6.0% YoY)
(Billions of Yen)
73.781.9
11/3 12/3 13/3
¥82.4 billion (Up 0.5% YoY)
(Billions of Yen)
Net sales Operating income
384
595
11/3 12/3 13/3
¥648 (Up 9.0% YoY)
(Yen)
229297
11/3 12/3 13/3
¥324(Up 9.1% YoY)
(Yen)
Earnings per share Cash dividends per share(applicable to the year)
Consolidated Financial Highlights
12
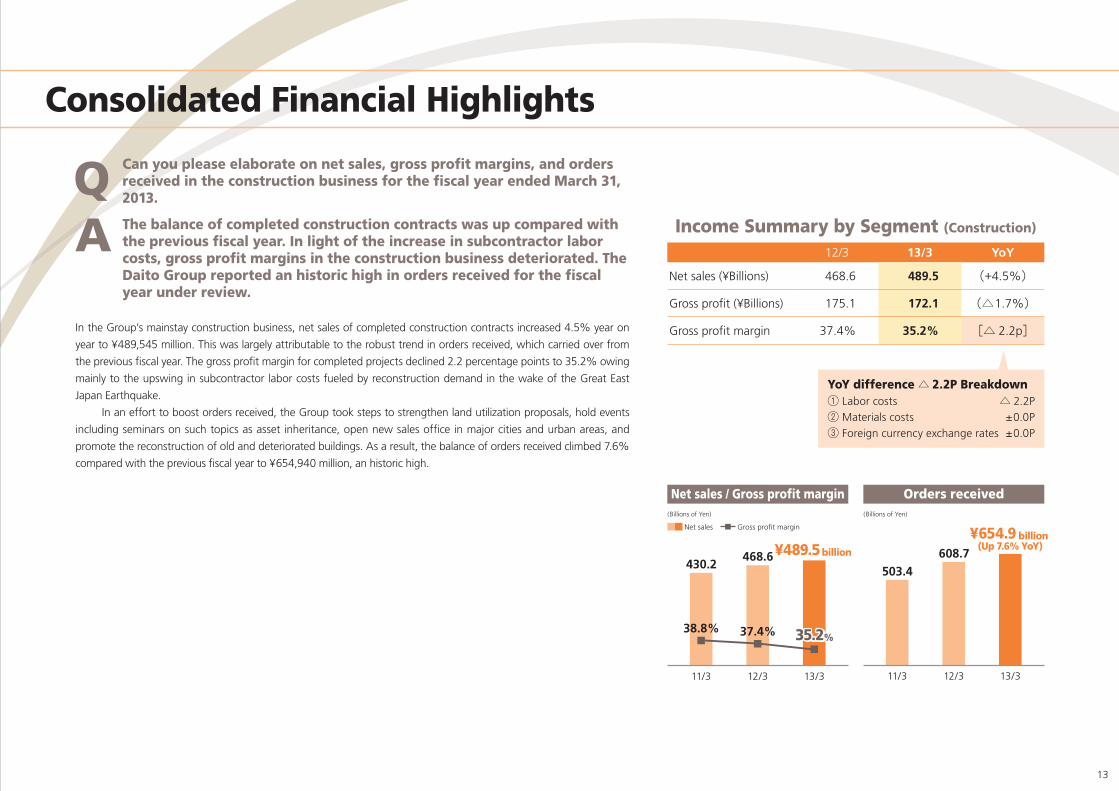
In the Group’s mainstay construction business, net sales of completed construction contracts increased 4.5% year on
year to ¥489,545 million. This was largely attributable to the robust trend in orders received, which carried over from
the previous fiscal year. The gross profit margin for completed projects declined 2.2 percentage points to 35.2% owing
mainly to the upswing in subcontractor labor costs fueled by reconstruction demand in the wake of the Great East
Japan Earthquake.
In an effort to boost orders received, the Group took steps to strengthen land utilization proposals, hold events
including seminars on such topics as asset inheritance, open new sales office in major cities and urban areas, and
promote the reconstruction of old and deteriorated buildings. As a result, the balance of orders received climbed 7.6%
compared with the previous fiscal year to ¥654,940 million, an historic high.
Can you please elaborate on net sales, gross profit margins, and orders received in the construction business for the fiscal year ended March 31, 2013.
The balance of completed construction contracts was up compared with the previous fiscal year. In light of the increase in subcontractor labor costs, gross profit margins in the construction business deteriorated. The Daito Group reported an historic high in orders received for the fiscal year under review.
Income Summary by Segment (Construction)
YoY difference △ 2.2P Breakdown① Labor costs △ 2.2P
② Materials costs ±0.0P
③ Foreign currency exchange rates ±0.0P
12/3 13/3 YoY
Net sales (¥Billions) 468.6 489.5 (+4.5%)
Gross profit (¥Billions) 175.1 172.1 (△1.7%)
Gross profit margin 37.4% 35.2% [△ 2.2p]
430.2
38.8%
468.6
37.4%
11/3 12/3 13/3
Net sales Gross profit margin
¥489.5 billion
35.2%35.2%
(Billions of Yen)
503.4
608.7
11/3 12/3 13/3
¥654.9 billion (Up 7.6% YoY)
(Billions of Yen)
Net sales / Gross profit margin Orders received
Consolidated Financial Highlights
13

Please tell us about the Group’s performance and occupancy rates in the real estate business.
Net sales in the real estate business rose 6.9% compared with the previous fiscal year to ¥630,428 million. This was
largely because of the increase in rental income at Daito Building Management Co., Ltd., the Group’s leasing company,
which saw an upswing in whole-building lease agreements under its Lease Management Trust System. Gross profit for
the fiscal year under review grew 20.8% year on year to ¥35,356 million.
The number of tenancy agreements concluded in connection with leased properties on a non-consolidated basis
increased 2.7% year on year to 220,059. This was mainly due to successful measures aimed at increasing inquiries
from prospective tenants including efforts to revamp our residential unit search website, operations at our 24-hour
call center, the opening of unattended sales offices where visitors can search freely for residential units, and endeavors
directed toward reinforcing mutual cooperation with local real estate agencies. As of March 31, 2013, the occupancy
rate of leased residential properties under whole-building lease arrangements stood at 96.7%, a slight deterioration of
0.1 of a percentage point compared with the end of the previous corresponding period. The occupancy rate of leased
commercial properties under whole-building lease arrangements rose 1.4 percentage points year on year to 95.5%.
The Daito Group reported an increase in both net sales and occupancy rates. This largely reflected the upswing in rental income and sustained high occupancy rates on the back of growth in whole-building lease agreements.
Income Summary by Segment (Real Estate)
12/3 13/3 YoY
Net sales (¥Billions) 589.9 630.4 (+6.9%)
Gross profit (¥Billions) 29.2 35.3 (+20.8%)
Gross profit margin 5.0% 5.6% [+0.6p]
545.2589.9
11/3 12/3 13/3
Net sales Gross profit margin
(Billions of Yen)
¥630.4 billion
3.5%5.0% 5.6%5.6%
19.2
29.2
11/3 12/3 13/3
(Billions of Yen)
¥35.3 billion
Net sales / Gross profit margin Gross profit
92.1
94.1
11/3 12/3 13/3
95.5%
(%)
Occupancy rate of leased commercial properties
96.0 96.8
11/3 12/3 13/3
96.7%
(%)
Occupancy rate of leased residential properties
Consolidated Financial Highlights
14

Daito Trust Construction recognizes that the return of profits to shareholders is a key management issue. Our basic
stance is to undertake the stable payment of cash dividends by consistently strengthening our operating platform. In
specific terms, we have set a target payout ratio of 50%, which we aim to achieve by issuing a standard dividend of
¥100 combined with a profit return component that reflects our business performance. In accordance with this basic
stance, we plan to issue an annual cash dividend payment of ¥324.00 per share for the fiscal year ended March 31,
2013 (¥159 of which was paid as an interim cash dividend) and ¥341.00 per share in the fiscal year ending March 31,
2014.
Daito Trust Construction conducts the continuous purchase and retirement of treasury stock when certain
conditions are met. These conditions include consolidated net income exceeding ¥10.0 billion and the absence of
large-scale funding requirements. The upper limit for the purchase of treasury stock is set at a target figure of 30% of
consolidated net income. However, following a tender offer for treasury stock conducted in March 2011, the purchase
and retirement of treasury stock was suspended for an undetermined period of time with particular emphasis placed
on pooling internal reserves. Moving forward, we plan to consider the resumption of treasury stock purchase and
retirement when our equity ratio exceeds 35%. Looking at internal reserves, Daito Trust Construction will apply the
necessary funds as a source for the reduction of interest-bearing liabilities as a part of efforts to bolster the Company’s
financial position. At the same time, internal reserves will be employed to promote the development of new business in
order to help expand corporate and shareholder value.
What is your basic policy toward the return of profits to shareholders?
Our basic stance is to maintain stable dividend payments while targeting a dividend payout ratio of 50%. Currently, we have suspended the purchase and retirement of our treasury stock. We will, however, consider resumption when our equity ratio exceeds 35%.
19.5
24.6
32.5
27.8
11/3 12/3 13/3
ROE
Equity ratio
(%)
31.0 %
29.6 %
Equity ratioReturn on equity (ROE)
384
229297
594
11/3 12/3 13/3
Earnings per share
Cash dividends per share
(Yen / %)
¥648
¥324
Payout ratio
59.6 50.0 50.0 %50.0 %
Earnings per share (ESP)Cash dividends per share Payout ratio
Consolidated Financial Highlights
15

(Consolidated) (Billions of Yen)
2013/3 Results
2014/3 Forecasts YoY
Net sales 1,152.4 1,251.0 108.6%
Construction business 489.5 542.5 110.8%
Real estate business, other
662.8 708.5 106.9%
Gross profit 218.4 232.7 106.5%
Construction business 172.1 181.9 105.7%
Real estate business, other
46.3 50.8 109.7%
Selling, general and administrative expenses
136.0 144.7 106.4%
Operating income 82.4 88.0 106.8%
Ordinary income 85.5 91.0 106.4%
Net income 51.6 55.0 106.4%
Earnings per share (¥) 648 682 +34
Cash dividends per share (¥) 324 341 +17
What are your thoughts on performance in the fiscal year ending March 31, 2014?
In the fiscal year ending March 31, 2014, we anticipate net sales will reach ¥1,251.0 billion, a year-on-year increase of
8.6%. From a profit perspective, we are forecasting operating income to total ¥88.0 billion, up 6.8%. Ordinary income
is expected to amount to ¥91.0 billion, up 6.4%, and net income to come to ¥55.0 billion, up 6.4%.
Reflecting the abundance of orders in the construction business, net sales of completed construction contracts
is forecast to rise 10.8% year on year to ¥542.5 billion. The gross profit margin for completed projects is expected to
drop 1.7 percentage points to 33.5%. This is largely attributable to the anticipated increase in subcontractor labor costs
associated with post-earthquake reconstruction demand and other factors including the upswing in imported building
and other material prices as a result of the decline in the value of the yen from the previous year. Despite this downturn
in the gross profit margin, gross profit on completed projects is projected to hit ¥181.9 billion, an increase of 5.7% year
on year.
Focusing on efforts to increase the number of orders received, Daito Trust Construction will continue to put
forward land utilization proposals that look to address asset inheritance and asset succession needs. At the same
time, we will strategically allocate resources commensurate with market size and reinforce relationships with financial
institutions. In addition, we will expand our network of sales branches in major metropolitan cities and urban areas
where growth potential is high. Complementing the strategic allocation of resources, sales branches will promote
initiatives in connection with the effective use of land held by corporations. Building on each of the aforementioned
measures, the balance of orders received in the fiscal year ending March 31, 2014 is expected to reach ¥670.0 billion,
a year-on-year increase of 2.3%. In the real estate business, net sales are forecast to total ¥672.5 billion, up 6.7% year
on year. Gross profit in this segment is projected to reach ¥38.6 billion, an increase of 9.2%.
Looking ahead, we will continue to bolster our search channels by reinforcing our sales staff and networks
(including unmanned stations), upgrading our 24-hour call center and TV commercials, further developing our rental
unit search website, and improving relationships with local real estate brokers. In this manner, we will work to enhance
the tenant recruitment capabilities of our e-Heya Net brand services. Thanks to these endeavors, we expect to achieve
an occupancy rate for leased residential properties of 96.8%, up 0.1 of a percentage point, and 95.5%, up 0.0 of a
percentage point, for leased commercial properties.
We plan to achieve a sixth consecutive fiscal year of increased revenue and earnings.
Consolidated Financial Highlights
16

Mid-Term Business Plan
17

Further Explore Opportunities in Rental Apartments
Billions of Yen
2010FY 2011 2012 20172016201520142013
1,251.01,152.41,087.1
1,001.1
1,356.71,450.3
1,545.8
73.781.9 82.4
88.098.0
106.0111.0
¥1,646.0 billion
¥118.0 billion¥118.0 billion
Net sales (actual) Net sales (plan) Operating income (actual) Operating income (plan)
Net sales / Operating income
The Company put in place a mid-term business
plan, which covers the five-year period to the fiscal
year ending March 31, 2018, in 2013. Moving
forward, every effort will be made to achieve the
overarching slogan of the plan to further explore
opportunities in rental apartments.
Incorporated in this slogan is the premise that
the Company’s activities extend beyond the simple
construction of rental apartments. This slogan
encapsulates the aspiration to further explore
opportunities in rental apartments as well as the
potential not only of the Company, but also each
and every employee to help revitalize people’s
lives, the cities in which they live as well as local
communities and the economy as a whole.
Compared with the fiscal year ended March
31, 2013, the mid-term business plan targets
growth of 43% in net sales to ¥1,646.0 billion by
the fiscal year ending March 31, 2018 (average
annual growth of 7.4%), and growth of 43% in
operating income to ¥118.0 billion (average annual
growth of 7.4%).
FY 2010 2011 2012 2013 2014 2015 2016 2017
Net sales 1,001.1 1,087.1 1,152.4 1,251.0 1,356.7 1,450.3 1,545.8 1,646.0
Construction business 430.2 468.6 489.5 542.5 596.0 638.4 676.3 710.7
Real estate business 545.2 589.9 630.4 672.5 719.8 770.1 822.9 884.8
Other business 25.6 28.5 32.4 36.0 40.2 43.3 46.6 50.6
Gross profit 195.3 214.1 218.4 232.7 253.9 272.1 288.4 303.5
Construction business 167.0 175.1 172.1 181.9 199.8 214.1 226.8 238.3
Real estate business 19.2 29.2 35.3 38.6 40.9 43.9 46.4 48.9
Other business 9.0 9.7 10.9 12.2 13.2 14.1 15.2 16.3
Selling, general and administrative expenses 121.5 132.1 136.0 144.7 155.9 166.1 177.4 185.5
Operating income 73.7 81.9 82.4 88.0 98.0 106.0 111.0 118.0
Ordinary income 78.0 84.2 85.5 91.0 101.0 109.0 114.0 121.0
Net income 43.1 47.1 51.6 55.0 61.0 69.0 72.0 77.0
(actual) (plan) (Billions of Yen)
Mid-Term Business Plan
18

1. Orders received We aim to further increase orders received by promoting comprehensive services for landowners that
address their concerns ranging from asset utilization to asset inheritance.
2. Completed construction contracts Over the medium term, we aim to develop the capacity to work on construction contracts worth ¥700.0
billion while securing an appropriate profit margin.
3. Maintain a sound occupancy rate We aim to maintain a sound occupancy rate by offering services that enhance tenant convenience and
product value, while strengthening our ability to place tenants in leased properties.
Major Points of the Mid-Term Business Plan
Mid-Term Business Plan
19

Principal Indices
Turning to each principal index target in our core business, we plan to augment our sales
and marketing personnel in the construction business by an annual rate of approximately
3%. Compared with the fiscal year ended March 31, 2013, we are targeting an increase
of around 15% in orders received to ¥754.0 billion by the fiscal year ending March 31,
2018 (average annual growth of 2.9%), and growth of 45% in completed construction
contracts to ¥710.7 billion (average annual growth of 7.7%).
In the real estate business, we are planning an annual average growth rate in
the number of tenancy agreements of 8.2% and are expecting to maintain a sound
occupancy rate for residential properties of 96.8%.
Orders received / Construction sales and marketing personnel
Completed construction contracts / Completed construction contract gross profit margin
Construction business Real estate business
Billions of Yen
FY FY 2010 2011 2012 20172016201520142013
732.0711.0690.0670.0654.9608.7503.4
Billions of Yen
3,8003,6903,5803,4803,8003,6903,5803,4803,2043,2222,981
2010 2011 2012 20172016201520142013
Orders received (actual)Orders received (plan)
Construction sales and marketing personnel (actual)Construction sales and marketing personnel (plan)
Completed construction contracts (actual)Completed construction contracts (plan)
Completed construction contract gross profit margin (actual)Completed construction contract gross profit margin (plan)
¥754.0 billion
3,9203,920 33.5%33.5%38.8 33.533.533.533.5 33.533.533.533.5
35.237.4
676.3638.4596.0542.5489.5468.6430.2
¥710.7 billion
thousands
2010FY FY2011 2012 20172016201520142013
327303280257236220214204
1,026949876808747694645
thousands
96.0 96.896.896.896.896.796.8
Number of residential use properties supplied (actual)Number of residential use properties supplied (plan)
Number of tenancy agreements (actual)Number of tenancy agreements (plan)
Occupancy rate (actual)Occupancy rate (plan)
2010 2011 2012 20172016201520142013
33.5%96.8%
1,106
Number of tenancy agreements
Number of residential use properties supplied / Occupancy rate
FY 2010 2011 2012 2013 2014 2015 2016 2017Number of construction sales and marketing personnel
2,981 3,222 3,204 3,480 3,580 3,690 3,800 3,920
Construction orders received (¥ Billions)
503.4 608.7 654.9 670.0 690.0 711.0 732.0 754.0
Completed construction contracts (¥ Billion)
430.2 468.6 489.5 542.5 596.0 638.4 676.3 710.7
Completed construction contract gross profit margin (%)
38.8 37.4 35.2 33.5 33.5 33.5 33.5 33.5
(actual) (plan)
FY 2010 2011 2012 2013 2014 2015 2016 2017Number of tenancy agreements (Thousands)
204 214 220 236 257 280 303 327
Number of residential use properties supplied (Thousands)
645 694 747 808 876 949 1,026 1,106
Occupancy rate (%) 96.0 96.8 96.7 96.8 96.8 96.8 96.8 96.8
(actual) (plan)
Mid-Term Business Plan
20

Financial Indicators / Return of Profits to Shareholders
Targeted financial indicators are presented in the graph/table at bottom left.
Turning to the return of profits to shareholders, the Company plans to maintain a payout ratio of 50%. Daito Trust Construction is targeting cash dividends per share of ¥477 in the fiscal
year ending March 31, 2018. To achieve this target, the Company will work diligently to expand its business operations and increase profits.
Currently, Daito Trust Construction has suspended the purchase and retirement of treasury stock. Plans are in place to reconsider resumption when the Company’s equity ratio exceeds 35%.
Total assets / Equity ratio ROE / ROA
2010 2011 2012 20172016201520142013 2010 2011 2012 20172016201520142013
853.8781.1
721.5673.5
617.7569.0532.9
Billions of Yen %
38.036.934.932.638.036.934.932.631.0
27.824.6
8.1
19.5 23.525.625.9
8.2 8.5 8.5
26.8
8.4
29.6
8.3 8.1
32.5
Total assets (actual)Total assets (plan)
Equity ratio ROA (actual)ROA (plan)
ROE (actual)ROE (plan)
40.7%40.7% 22.3%
8.2%
¥896.2 billion
FY FY
Yen
FY FY2010 2011 2012 20172016201520142013 2010 2011 2012 20172016201520142013
Yen, %
Cash dividends per share (actual)Cash dividends per share (plan)
EPS (actual)EPS (plan)
Payout ratio (actual)Payout ratio (plan)
893855756
682648594
384
229
446
50.050.050.050.050.050.0
59.6
427378341324297
50.0%¥955
¥477
EPS Cash dividends per share / Payout ratio
FY 2010 2011 2012 2013 2014 2015 2016 2017Total assets (¥ Billions) 532.9 569.0 617.7 673.5 721.5 781.1 853.8 896.2
(Debt) (¥ Billions) (127.0) (124.5) (110.8) (95.8) (80.9) (66.0) (51.7) (0.7)
Net assets (¥ Billions) 132.2 152.0 186.5 216.4 249.9 282.7 321.3 362.6
Equity ratio 24.6% 27.8% 31.0% 32.6% 34.9% 36.9% 38.0% 40.7%
ROE 19.5% 32.5% 29.6% 26.8% 25.9% 25.6% 23.5% 22.3%
ROA 8.1% 8.3% 8.4% 8.2% 8.5% 8.5% 8.1% 8.2%
(actual) (plan)
FY 2010 2011 2012 2013 2014 2015 2016 2017Net income (¥ Billions) 43.1 47.1 51.6 55.0 61.0 69.0 72.0 77.0
EPS (¥) 384 594 648 682 756 855 893 955
Cash dividends per share (¥) 229 297 324 341 378 427 446 477
Payout ratio 59.6% 50.0% 50.0% 50.0% 50.0% 50.0% 50.0% 50.0%
(actual) (plan)
Mid-Term Business Plan
21

Daito Group
Supplying the Future of Lease
Management and
Leased Housing
Growing with Local People
and Companies
Facing the Challenges
of Environmental and
Resource Problems
Establishing the Foundation for Corporate Activities
Further Explore Opportunities in Rental Apartments
The Daito Group does not merely build leased housing. Pursuing much more than what it can do to supply leased housing and
to grow Daito Trust Construction, the Group will further encourage business activities that make it more comfortable for people to live in
its housing and that invigorate towns and local economies.
We would like to showcase the CSR activities that the Group conducts under the above slogan from the following four perspectives:
Daito Group CSR Activities
22

Three-floor construction that evolved from the flat type
Development of an industry-first dwelling type that combines flat and maisonette types
3F
2F
1F
Two-floor, flat-type construction
2F
1F
3F
2F
1F
Proposing Next-Generation Leased Housing to SocietyStarting from “Flat Type,” Diversification in Dwelling Types
Constantly pursuing the style of leased housing demanded by the next generation, the
Daito Group makes proposals to society.
In the case of the Japanese apartment dwelling type, the majority were of the side
corridor type that were built with a shared hallway on all floors on one side. Currently in
fashion are the flat and maisonette types in which all dwelling units have an entrance hall
located on the ground floor. Attaching great importance to the need to ensure privacy
and for security, Daito Trust Construction launched flat-type leased housing under the
name NEW CRESTALL 24 in 1995. This served as a trigger for the popularization of a
diverse dwelling type of leased housing.
Opening Up the Possibilities of Leased Housing with Original TechnologiesHigh-Performance Sound Insulation Flooring Solves Noise Problems
The Daito Group has promoted the evolution of leased housing through technological
developments that take into account the needs of both its customers and Japanese
society at large.
For example, sound insulation is cited as the point that is emphasized most when
a customer selects leased housing. Daito Trust Construction developed its unique, high-
performance sound insulation flooring to solve under-floor and upstairs noise problems.
Comparable to the sound insulation properties of concrete structures yet made of wood,
the Company’s high-performance sound insulation flooring offers a comfortable life with
no uneasy feelings between people living above and below one another.
Original wooden material that softens vibrations, such as those caused by walking around a room, and blocks sound propagation
Sound Insulation
Original floor underlay that disperses and absorbs impacts from a variety of flooring
Absorption
Made from a special type of rubber, an original anti-vibration suspended beam that absorbs vibrations and reduces the sound of impacts
Anti-vibration
Anti-vibration flooring
(Sound-insulating underlay)
Structural surface material
Autoclaved lightweight concrete
(ALC) panel
Acoustic material
Gypsum board (double tension)
Anti-vibration suspended beam
Supplying the Future of Lease Management and Leased Housing
Evolving Leased HousingIn Japan, where the numbers of people in households continue to decline and there is a focus on upcoming changes in lifestyles and social change, the Daito Group continues to address the challenges in new leased housing.
23

Living room (before installation) Living room (after installation)
Kitchen (before installation) Kitchen (after installation)
Introduction of Papercraft Furniture Dispels Image Gap after Moving In
As part of its property search support, Daito Trust Construction introduced full-scale
papercraft furniture in February 2013. Seven original pieces were made, including a table,
sofa, TV, and a refrigerator, and are arranged in properties for which an occupant is
being sought. The size of the new property can be seen there and then when viewed by
a prospective occupant, who can verify such aspects as convenience.
Supply of Information That Maximizes Value of Leased Housing
The Daito Group supplies property information through a number of channels. These
include specialist broker stores throughout Japan, Internet sites, the E-heya station that has
been installed in commercial facilities across the country, and the E-heya Support Center,
a call center that provides property search consultations round the clock. The Company
does its utmost to supply fast, accurate information that avoids misunderstandings and is
available at any time from the perspective of the person looking for a place to live.
E-heya Net
E-heya stationNeo
Supplying the Future of Lease Management and Leased Housing
Supplying Information That Delivers Peace of Mind on HousingTo deliver peace of mind to all people who are looking for or making use of leased housing, the Daito Group goes to great lengths to rapidly supply accurate information at any time.
24

Having adopted original interior materials with excellent durability, Daito Trust
Construction covered most of the restoration costs by its response to cleaning under the
new plan. It is assumed that the plan will convince both owners and tenants alike of the
fairness in the cost burden.
The Company hopes that the introduction of this plan will deliver more comfort and
peace of mind to many owners and tenants.
Supporting Stable Management of Leased Housing OwnersIt has been said that tenants, when selecting leased housing, place as one of
their agendas the presence or absence of a lump sum payment when moving in
and restoration expenses when moving out. In response to these issues, Daito
Trust Construction realized a reduction in moving-in expenses by not imposing the
payment of a deposit and clarification of restoration costs by a flat-rate system as
a result of having adopted original interior materials with excellent durability and
keeping a low rate (0.12%) for rent arrears.
Interior Materials with Excellent Durability Turn Plans into Reality
Adopted special scuff- and scratch-resistant surface material that allows replacement of single sections
Hard to get dirty thanks to a special surface process, prevents deterioration. Keeps its appearance for a long time
Flooring Materials Wallpaper
All kitchen surface panels durable against heat and scuffs, allowance made for replacement of countertops only
Having been coated with a specialty resin, resists scratches and dirt, not prone to discoloration if exposed to sunlight
Kitchen Interior Furniture
Supplying the Future of Lease Management and Leased Housing Topic (1)
Introduction of Zero Deposit and Fixed Cleaning Cost Plan
Supplying More Comfort and Peace of Mind to Leased Housing
With regard to the restoration costs incurred when vacating leased housing, in April 2013 the Daito Group launched a zero deposit and fixed cleaning cost plan that both lightens the financial burden on the owners of leased buildings and reduces tenants’ initial occupancy costs.
25

“9 + 1 Continuous Roof” by Yuta Horie and Sho Kobayashi(Tokyo University of Science Graduate School)
Diversification of values with respect to Japanese real estate and the increasing number of
people who focus on use rather than ownership are requiring new approaches to leased
housing. In recognition of that situation, in 2012 Daito Trust Construction launched its
Leased Housing Competition in pursuit of new possibilities in leased housing.
First Topic: Views on Leased Housing That Creates the Landscape
Leased housing accounts for a major proportion, more than one third, of the housing stock
in Japan and shapes the streets and by extension the landscape in suburban residential
areas. In the case of leased housing of the future, should we not be taking the view that
not only will quality and performance in terms of individual buildings be demanded, but
also how leased housing can form the landscape of communities?
For the First Leased Housing Competition, we called for suggestions to be submitted
on the subject of “Leased Housing That Creates the Landscape” and from the 483
submissions selected 24 to receive prizes, of which six were given a top ranking.
We plan to continue holding leased housing competitions to provide a source of
ideas for innovative leased housing and new ways of living.
First screening General view of the second screening, which was open to the public
Supplying the Future of Lease Management and Leased Housing Topic (2)
First Daito Trust Construction Leased Housing Competition Held
Looking at What Lies Ahead for Leased Housing
While engaging in dialogue with people in a variety of positions outside the Company, Daito Trust Construction pursues new possibilities in leased housing.
26

Ease NavigatorHome delivery dry cleaning service
Cleaning services
Surrogate package sending and receiving services
Surrogate garbage handling services
Food NavigatorLocal restaurant information
Coupons for local businesses
Delivery and takeout restaurant information
Recipe listings
Community NavigatorCommunity events
Hobby and activity clubs
Interaction forums
Culture classes
Security NavigatorCall center open 24 hours a day
Hospital information
Evacuation site information service
The provision of child-rearing support information
Bringing New Value to Tenants and CommunitiesLive-UP Service Concept
Maintaining Lifestyle Environments, Keeping Them Comfortable at All TimesHospitality in a Variety of Forms
It is precisely because houses are located in communal
societies that possess vitality that the people who
live there can enjoy comfortable lifestyles. Based on
this way of thinking, the Daito Group is offering its
locally integrated Live-UP service concept.
Through tie-ups with local stores and service
providers and its E-kurashi Navigator service book and
Live-UP Communication pamphlet, the Company
delivers information to tenants, which helps the local
area, while introducing special benefit services that
can be used at local stores.
Designed to help maintain comfortable lifestyles, leased housing
management is also linked to the community environment. The person
who cleans inside and outside the building is primarily taking on the role
for local housewives. This is shared throughout the country through having
adopted the stance of hospitality that shows detailed consideration at all
times, through ingenuity, and through a newsletter entitled Omotenashi
(Hospitality).
E-kurashi Navigator service bookfor each community
Sharing a variety of ingenious nationwide “Hospitality” ideas
Local People and Companies Growing Together
Providing Services That Enrich Lifestyles and CommunitiesOn the basis of its cooperation with local service capabilities, the Daito Group enriches the lives of people in leased housing through convenience, while offering services that are linked to community revitalization.
27

Daito Trust Construction
Daito Building Management Co., Ltd.
Business Plan
Administrative Operations
Building Construction
Tenant Mediation
Financial Institutions
Consulting Tax Advisers
Consulting Legal Advisers
Building Management Companies
Cleaning Staff
Emergency Response Partner
Companies Collaborating on Design
Companies Collaborating on Construction
Real Estate Companies
No. of financial institutions handling apartment loans
494 (as of March 31, 2013)
No. of stores handling real estate companies
12,343 (as of March 31, 2013)
Cleaning staff 2,985people
(as of March 31, 2013)
No. of consulting tax advisers
256firms
(as of March 31, 2013)
No. of companies collaborating on design and construction
10,070 (as of March 31, 2013)
No. of companies collaborating on building construction and repair work
2,617 (as of March 31, 2013)
No. of emergency response partners
1,162companies
(as of March 31, 2013)
No. of consulting legal advisers
14firms
(as of March 31, 2013)
Growing with Communities Through Extensive Collaboration
To grow together with the people in a community, the
Daito Group collaborates with a wide range of local
partners, from creating the leased building business
plan to management operations.
Collaboration on Creating a Business PlanClose exchanges of information with local financial institutions lead to the drawing up of a suitable business plan. In addition, the Company receives assistance from the specialist perspective of tax accountants and lawyers.
Collaboration on Construction WorkIn all parts of Japan, construction work is organized into Daito Trust Construction committees, which cooperate with local design and construction companies.
Collaboration on Tenant MediationHaving established a partnership store system for local real estate companies that assess Daito Trust Construction leased housing, we supply dwelling information, signs and bulletin boards as well as publish the store names in advertising media.
Collaboration on Building ManagementWe use local providers such as building construction work subcontractors to carry out repairs and improvements to buildings, cleaning staff to perform regular cleaning, and emergency response partners to respond to emergency calls.
Local People and Companies Growing Together
Growing Together with Local Service CapabilitiesThe Daito Group’s corporate activities are founded on cooperation with partners in each community.
28

Basic Policy
The Daito Group undertakes environmental management to raise its corporate social existence value and at the same time to improve management efficiency.
Promotion Through a Project System That Involves the Daito Group
Daito Trust Construction works to reduce, reuse and recycle in all of its business activities
and works vigorously to protect the global environment. In addition, as a leading
company in land utilization, we attach great importance to maintaining harmony with
local communities and nature, and will continue to propose favorable living environments.
Specifically, we set up environmental management projects as a promotion system
and advocate these throughout the Company, including Group companies. We promote
the main initiatives under three groupings: construction sites, R&D and the workplace
environment.
Committee Chairman (Representative Director and President)
Stores
CSR Promotion Division
Group companies
Construction Site Group
Main activities Main activities Main activities
Workplace Environment Group
R&D Group
Reduction in amount of waste generated
Resource/energy savings
Environment-friendly product design
Green purchasing
Strengthening of environment management system
Resource/energy savings
Facing the Challenges of Environmental and Resource Problems
Toward Solving Environmental and Resource Problems (1)Promoting environmental management to improve and solve environmental and resource problems from leased housing construction and management aspects
29

Fiscal 2012 Business Activities and Material Balance
INPUT
OUTPUT
Material Balance (Resource Use Associated with Business Activities and Overall Picture of Environmental Impact)
During the course of a year, Daito Trust Construction ascertains the energy and resources expended (input) and the amount of emissions (output) in its business activities and uses these
to provide basic environmental management numerical values. Known as material balance, this overall picture is set out in the accompanying chart.
Daito Trust Construction Business Activities
Shipments and distribution of building and other materials
6,221 tons CO2e
Fossil Fuels
Petroleum
2,307 kl
Within Business Premises Off Business Premises
Fossil Fuels
Petroleum
11,368 kl (See Note)
Gas151 kl
Business sites steam, cold water
30,910 GJ (See Note)
Business premises
28.82 million kWhNewly built sites
9.22 million kWh
Business sites
1.015 tons of paperNewly built site materials
1.45 million kWh
Business sites
130,000 m3
Newly built sites
410,000 m3
Electricity Energy WaterConstruction Materials/Materials
Greenhouse gases (CO2, etc.)
91,826 tons CO2eTotal emissions540,000 m3
Amount of general waste
1,349 tonsAmount of industrial waste
630,000 tonsFinal disposal amount (general + industrial)
100,000 tons
Total emissions Asbestos when demolishing buildings
(18 tons)*Freon when disposing of air conditioners
0 tons
Greenhouse gases (CO2, etc.)
Waste Discharged Water
Chemical Substances
Daito Trust Construction Business ActivitiesR&D Building construction planning /
Design occupancy brokerage
INPUT
OUTPUT
Buildings completed
8,088/55,375 dwellingsNo. of mediations
220,059 cases
Facing the Challenges of Environmental and Resource Problems
Toward Solving Environmental and Resource Problems (2)Promoting environmental management to improve and solve environmental and resource problems from leased housing construction and management aspects
30

Enjoy and Pass On Nature’s Blessings1. Utilization of regenerative resources
2. Decrease impact on biological environments
3. Reduce water usagea
Sustainable SocietyDecrease
Greenhouse Gas Emissions1. Business activity measures
to counter global warming
2. Counter global warming by reducing waste
3. Counter global warming by leased housing performance improvements
Low-Carbon Society
Recycle Resources Through 3R Practices1. Reduce amount of waste
generated by improvements in product construction
2. Reuse materials
3. Recycle
Recycling-Oriented Society
Natural Symbiosis
Society
Efforts Toward a Recycling-Oriented Society
Efforts Toward a Low-Carbon Society
The Daito Group is pursuing a variety of possibilities toward
a low-carbon society.
Firstly, with a view to saving energy in the course of its
business activities, power saving is encouraged throughout
the Daito Group. In addition, we are reducing CO2 emitted
indirectly into society by reducing final waste disposal amounts.
Meanwhile, we are deploying activities that encourage tenant participation in
energy-saving activities. These activities center on the installation of photovoltaic panels on
leased housing throughout Japan.
Efforts Toward a Natural Symbiosis Society
Leveraging its business characteristics, the Daito Group is
encouraging efforts toward a natural symbiosis society.
Firstly, with regard to timber materials—a regenerative resource—
besides primarily using imported wood more than ever before
primarily with the 2×4 and Neo-Frame methods, Daito Trust
Construction is continuing its efforts to utilize domestic cedar in its
low-rise, wood-based products.
In addition, to reduce the impact of night-time lighting on the biological environment
(insects, plants), we are encouraging the adoption of or changeover to LED outdoor lighting.
As a company that uses vast
quantities of lumber in the building
of its leased housing, the Daito
Group particularly encourages
efforts that promote resource
recycling (3R practices) involving
lumber use and reuse technologies.
The recycling of waste materials
is rigorously adhered to at all the
Company’s business sites.
Renewable resource (timber) use fee
130,673tons
(as of March 31, 2013)
No. of exterior LED lighting units installed
16,204 (as of March 31, 2013)
0.2m3
1.4m3
Note: In the case of a two-story, six-dwelling apartment building. (Actual Company numerical values in the completion of a building)Note: In the case of construction using the Neo-Frame method.
On-site structure material waste
reduced by approx. 85% through pre-
processing at plants
Facing the Challenges of Environmental and Resource Problems
Efforts Toward a Sustainable SocietyPromoting integrated efforts toward a sustainable society using a three-pronged approach targeting a low carbon society, a recycling-oriented society and a natural symbiosis society.
31

Growing with Our WorkforceCreating Rewarding Workplaces Where Everyone Finds It Easy to WorkFor graduate employees, Daito Trust
Construction has introduced a Graduate
Training Program, which provides
follow-up training up until the eighth
year after joining the Company, and a
mentor system to provide dedicated
support. Also placing an emphasis
on the gaining of qualifications, the
Company gives wholehearted support to
the acquisition in particular of first-class
architect, primary building construction
management engineer, and real estate
transaction specialist qualifications.
In building sales positions the
Company also conducts training
according to an individual’s circumstances
involving on-the-job training (OJT) and
role-play. In addition to the gaining of
expertise, the Company works to improve
communications skills.
In conducting training and
development courses matched to
employees’ positions, the Company
improves their practical skills and supports
capacity building.
To enable employees to work in a way that suits their individual lifestyles, the
Company has unreservedly upgraded its childbirth, child-rearing and nursing care
leave systems as well as such initiatives as no-overtime days. Also conducting training
sessions specially targeted at women, women are making their mark as directors* and
divisional heads.
(* At Group companies)
Turning Employee Feedback into a Sales Driver
In the fiscal year under review, the president
and directors of the division in charge
traveled to venues throughout Japan to hold
management plan presentation briefings, at
which they explained management policies
directly to employees. Of 719 teams from
six Group companies, 14 were selected
and participated in the 14th Total Quality
Control (TQC) Best Practice Presentations. Footage from presentations made at the
all-Japan meeting were placed on a DVD and distributed throughout the Company.
“Hands-on” training in house framing for graduates
Daito Building Management operations staff being provided with customer service training
Training for building sales personnel
Courtesy competition
Creating a Foundation for Corporate Activities
Creating Vibrant WorkplacesWith regard to its workforce, the Company focuses on health and safety and works to provide its employees with higher quality services. In addition, a wide range of training and educational programs helps to maintain motivation and improve skills.
32

Corporate Governance
33

auditors. One of the corporate auditors is employed full-time as a standing corporate auditor.
The corporate auditors attend meetings of the Board of Directors and other important meetings,
collaborate with the Internal Audit Division to check and place restraints on business execution as
needed, monitor the performance of directors in their duties, and observe the implementation of
resolutions made by the Board of Directors and the Executive Management Meeting. The Board
of Corporate Auditors is attended by all corporate auditors, where they receive reports from the
independent auditor on the status of the Company’s auditing system, auditing plans and audits.
Daito Trust Construction has set up the Compliance Promotion Department and the J-SOX
Promotion Division to engage in the prevention and management of risk. The Compliance
Promotion Department manages risk related to the legal compliance of business activities in
collaboration with the Internal Audit Division, which is responsible for checking compatibility with
in-house standards. The Compliance Promotion Department is also responsible for formulating
the Daito Group Code of Behavior and ensuring that all employees are familiar with it. The
J-SOX Promotion Division works to ensure the reliability of the Company’s financial reports. It
makes sure there are systems in place to prevent misrepresentations of important information in
financial reports, and monitors these systems to verify that they are operating effectively.
Additionally, a whistle blowing system has been established within the Compliance
Promotion Department as a part of endeavors to quickly discover improper behavior and take
corrective measures.
Basic Corporate Governance PolicyDaito Trust Construction's corporate governance policy focuses on maximizing corporate value and
enhancing management efficiency and transparency for all its stakeholders. To this end, our major
tasks are to assure strict adherence to corporate ethics and legal regulations, establish and strengthen
internal control systems and ensure objectivity and timely decision-making by management.
Internal Control Framework, Internal Audits and Corporate AuditorsThe 12 members of the Internal Audit Division conduct audits of operations at all Daito Group
bases based on a yearly plan to gain a clear view of business execution in order to monitor the
effectiveness and efficiency of internal controls. The results of these audits are reported to top
management. Divisions targeted for an audit are given instructions and guidance on matters to
improve. Employees in these divisions are also interviewed in order for the auditors to ascertain
in detail the state of business execution and identify any problems. These and other measures
are taken to ensure highly effective audits.
The Board of Corporate Auditors consists of four corporate auditors, all of whom are outside
Matters Related to Corporate GovernanceDaito Trust Construction has adopted a corporate auditor system. The Board of Corporate
Auditors consists of four corporate auditors, all of whom are outside auditors.
Daito Trust Construction classifies its operations into four business areas: the construction
business headquarters, real estate business headquarters, corporate management headquarters,
and subsidiary business headquarters. A director is placed in charge of each segment as its
chief executive officer with the final authority to make decisions. The Company has established
the Executive Management Meeting, which is able to entrust the authority regarding business
execution to other bodies as necessary. This helps add flexibility to decision-making processes
and allows the Board of Directors to focus on important management issues.
The Board of Directors consists of nine directors, including three outside directors. Every
month, the Board meets to make decisions on matters stipulated in laws and the Company’s
Articles of Incorporation, as well as important matters affecting the Company and its affiliates.
The Executive Management Meeting is made up of executive officers appointed by the
Board of Directors who execute their authority independently of the directors and professional
staff. Meetings are held twice a month to discuss and decide on courses of action in response to
specific operational issues and problems.
Shareholders’ Meeting
Executive Management Meeting
Group Companies
Divisions, Departments, Branches
Future Committee
Independent Auditors
Board of Directors (Representative Director)
Nine Corporate Directors (Including three outside directors)
Four Corporate Auditors
(All of whom are outside auditors)
Construction Business Headquarters
Construction BusinessExecutive Planning Meeting
Construction BusinessGeneral Managers Meeting
Technological Development Department
Real Estate Business Headquarters
Real Estate BusinessExecutive Planning Meeting
Tenant RecruitingPromotion Meeting
Area ManagerMeeting
Corporate Management Headquarters
Subsidiary Business
Headquarters
Management Structure
Corporate Governance
34

*1 Appointed at the Shareholders’ Meeting held on June 27, 2012.*2 Sakumichi Yamada resigned from his position as outside auditor following the Shareholders’ Meeting held on June 26, 2013.
Name PositionAttendance at meetings of
the Board of Directors (Meetings attended / Meetings held)
Yujiro Sasamoto Outside director 17/18
Marcus Merner Outside director 15/18
Masayasu Uno Outside auditor 18/18
Hideo Hachiya Outside auditor 15/18
Kazumitsu Futami*1 Outside auditor 14/15
Sakumichi Yamada*2 Outside auditor 15/18
Position Number of people Amount (Millions of Yen)
Director 12 951
Corporate auditor 6 90
Total 18 1042(of which, outside directors and outside corporate auditors) (6) (90)
Outside Directors and Outside Auditors Compensation of Directors and Corporate AuditorsDaito Trust Construction has appointed three outside directors. Yujiro Sasamoto possesses a great
deal of knowledge and experience pertaining to corporate legal affairs, compliance and internal
control. Meanwhile, Marcus Merner has accumulated a wealth of knowledge and experience
pertaining to advisory and asset management services related to real estate investment.
Toshiaki Yamaguchi has been newly appointed as an outside director as we expect his extensive
experience as an attorney and highly specialized knowledge will be of particular benefit to Daito
Trust Construction. These three outside directors have no personal or capital relationships with
the Company. Moreover, Toshiaki Yamaguchi has been designated an independent officer.
Daito Trust Construction has appointed four outside corporate auditors. All four outside
corporate auditors have no particular stake in the Company, whether personal or financial.
Standing Auditor Masayasu Uno possesses specialized knowledge on finances and accounting
as a Certified Public Accountant, as well as a wealth of experience and significant insight born
out of his involvement in administrative roles. Hideo Hachiya has an abundance of experience
as an attorney and specialized insight into corporate legal affairs. Kazumitsu Futami has
accumulated a great deal of knowledge through his years of experience in the leased housing
management and loan guarantee fields. Sakumichi Yamada brings unique knowledge as a
Certified Public Accountant in the United States and an abundance of experience and insight in
corporate activities. These outside corporate auditors leverage their unique specialties to offer
their opinions on the Company’s business activities. All four have been designated independent
officers.
In the fiscal year ended March 31, 2013, the attendance of the outside directors and the
outside corporate auditors at Board of Directors’ meetings was as follows.
In the fiscal year ended March 31, 2013, compensation paid to directors and corporate auditors
was as follows.
Information DisclosureTo ensure management transparency and objectivity, we are committed to appropriate and
timely disclosure of information through a full range of channels. These include news releases,
financial results briefing sessions and publication on the investor relations (IR) website of various
materials, such as monthly performance data, a range of financial results data from the quarterly
and annual accounts, and the annual securities report.
Further, as the proportion of Daito Trust Construction stock held by overseas investors is
high, we also engage in overseas IR activities and take other action to encourage the use of
voting rights; for instance, we offer invitations to the General Meeting of Shareholders and
information on voting resolutions in English. Daito Trust Construction regards the disclosure of
information as one of its most important corporate responsibilities, and will continue striving to
maintain the trust of its shareholders and other investors.
ComplianceAt Daito Trust Construction, the Compliance Promotion Department manages risk related to the
legal compliance of business activities in collaboration with the Internal Audit Division, which
is responsible for checking compatibility with laws, regulations and in-house standards. The
Compliance Promotion Department is also responsible for formulating the Daito Group Code of
Behavior and ensuring that all employees are familiar with it.
Strict Adherence to Corporate Governance and Compliance
35

Representative Director and President
Naomi Kumakiri
Senior Managing Director
Akio InadaSenior Managing Director
Katsuma KobayashiRepresentative Director and Executive Vice President
Hitoshi Kadouchi
Senior Managing Director
Shuji Nakada
Outside Director
Yujiro SasamotoOutside Director
Toshiaki YamaguchiOutside Director
Marcus MernerStanding Corporate Auditor (Outside)
Masayasu Uno
Director and Executive Officer
Shuji Kawai
Corporate Auditors (Outside)
Hideo Hachiya
Kazumitsu Futami
Kazuo Fujimaki
Executive Officers
Koichi Ebihara
Hirosuke Tanimichi
Takeshi Nakagawa
Takuya Ishii
Hideyuki Nakaita
Hiroshi Sugiyama
Masayoshi Tanaka
Yukio Daimon
Hideaki Ueki
Hideo Gorai
Katsuya Touge
Kanitsu Uchida
Kei Takeuchi
Shoji Yamada
Hitoshi Wada
Naoki Naito
Yoshihiro Hashimoto
Hiromichi Ono
Sachio Washi
Kazuhiko Saito
Takashi Suzuki
Eiji Okamoto
Yoshito Ikemoto
Kazunori Fukuda
Board of Directors, Corporate Auditors and Executive Officers
36

Board of Corporate Auditors
Vice President
Shareholders’ Meeting
Board of Directors
President and Representative
Director
Internal Audit Division
Corporate Planning Division
Management Strategy Division
Total Quality Control Division
CSR Promotion Department
Legal Service Department
Subsidiary Business Headquarters
Construction Business Headquarters
Real Estate Business Headquarters
Corporate Management Headquarters
Sales Management Department
Design Management Department
Technological Development Department
Construction Management Department
Tenant Recruiting Management Department
Management Service Department
East Japan Construction Business Headquarters 80 sales offices, Kita-nihon, Tohoku, Higashi Kanto, Kita Kanto, Hokuriku • Shinetsu, Tokai
Metropolitan Business Headquarters
36 sales offices, East Tokyo metropolitan area, West Tokyo metropolitan area, West Kanto, Corporate Sales Department, Custom-Built Planning Center
West Japan Construction Business Headquarters
104 sales offices, Chukyo, Chubu, Keihanshin area, South Kansai, Chugoku and Shikoku, Chugoku, Kita Kyushu • Okinawa, South Kyushu
Training Center
Technological Training Department
Technological Development Department
Sales Control Department
Loan Promotion Department
Sales Planning Department
Product Development Department
Construction Process Management Department
Design Management Department
Engineering Department
Design Department
Calculation Department
Purchasing Department
J-SOX Promotion Division
General Accounting Department
Information Technology Department
Compliance Promotion Department
Human Resources and General Affairs Department
Asset Service Division
After Service Division
Customer Service Division
Live-UP Service Department
Tenant Recruiting Training Department
Tenant Recruiting Planning and Management Department
Tenant Recruiting Promotion Department
Safety and Quality Audit Department
Construction Control Department
Quality Management DepartmentDaito Finance Co., Ltd.DTC Reinsurance LimitedDaito Construction Co., Ltd.Daito Steel Co., Ltd.
Daito Building Management Co., Ltd. -Daito Farm Co., Ltd.House Leave Co., Ltd.Housecom Co., Ltd. Ju-See Publishing Co., Ltd.Ju-See Information Center Co., Ltd.
The Management Information Network Association of Apartment Rental BusinessGaspal Co., Ltd.Care Partner Co., Ltd.Daito Corporate Service Co., Ltd.Daito Asia Development PTE. LTD. -Daito Asia Development (Malaysia) Sdn. Bhd.Daito Asia Investment PTE. LTD.
Daito Business Center Co., Ltd.National Federation of Health Insurance Societies
Organization As of June 26, 2013
37
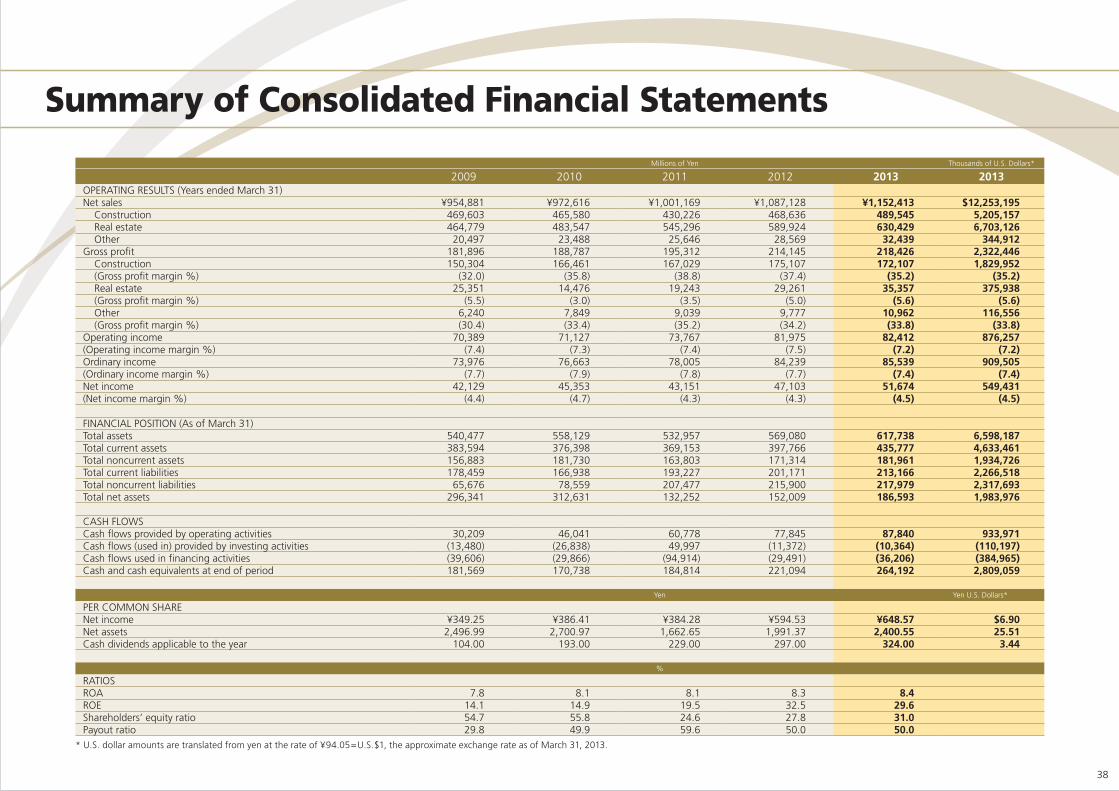
Millions of Yen Thousands of U.S. Dollars*
2009 2010 2011 2012 2013 2013OPERATING RESULTS (Years ended March 31)Net sales ¥954,881 ¥972,616 ¥1,001,169 ¥1,087,128 ¥1,152,413 $12,253,195
Construction 469,603 465,580 430,226 468,636 489,545 5,205,157Real estate 464,779 483,547 545,296 589,924 630,429 6,703,126Other 20,497 23,488 25,646 28,569 32,439 344,912
Gross profit 181,896 188,787 195,312 214,145 218,426 2,322,446Construction 150,304 166,461 167,029 175,107 172,107 1,829,952(Gross profit margin %) (32.0) (35.8) (38.8) (37.4) (35.2) (35.2)Real estate 25,351 14,476 19,243 29,261 35,357 375,938(Gross profit margin %) (5.5) (3.0) (3.5) (5.0) (5.6) (5.6)Other 6,240 7,849 9,039 9,777 10,962 116,556(Gross profit margin %) (30.4) (33.4) (35.2) (34.2) (33.8) (33.8)
Operating income 70,389 71,127 73,767 81,975 82,412 876,257(Operating income margin %) (7.4) (7.3) (7.4) (7.5) (7.2) (7.2)Ordinary income 73,976 76,663 78,005 84,239 85,539 909,505(Ordinary income margin %) (7.7) (7.9) (7.8) (7.7) (7.4) (7.4)Net income 42,129 45,353 43,151 47,103 51,674 549,431(Net income margin %) (4.4) (4.7) (4.3) (4.3) (4.5) (4.5)
FINANCIAL POSITION (As of March 31)Total assets 540,477 558,129 532,957 569,080 617,738 6,598,187Total current assets 383,594 376,398 369,153 397,766 435,777 4,633,461Total noncurrent assets 156,883 181,730 163,803 171,314 181,961 1,934,726Total current liabilities 178,459 166,938 193,227 201,171 213,166 2,266,518Total noncurrent liabilities 65,676 78,559 207,477 215,900 217,979 2,317,693Total net assets 296,341 312,631 132,252 152,009 186,593 1,983,976
CASH FLOWSCash flows provided by operating activities 30,209 46,041 60,778 77,845 87,840 933,971Cash flows (used in) provided by investing activities (13,480) (26,838) 49,997 (11,372) (10,364) (110,197)Cash flows used in financing activities (39,606) (29,866) (94,914) (29,491) (36,206) (384,965)Cash and cash equivalents at end of period 181,569 170,738 184,814 221,094 264,192 2,809,059
Yen Yen U.S. Dollars*
PER COMMON SHARENet income ¥349.25 ¥386.41 ¥384.28 ¥594.53 ¥648.57 $6.90Net assets 2,496.99 2,700.97 1,662.65 1,991.37 2,400.55 25.51Cash dividends applicable to the year 104.00 193.00 229.00 297.00 324.00 3.44
%
RATIOSROA 7.8 8.1 8.1 8.3 8.4ROE 14.1 14.9 19.5 32.5 29.6Shareholders’ equity ratio 54.7 55.8 24.6 27.8 31.0Payout ratio 29.8 49.9 59.6 50.0 50.0
* U.S. dollar amounts are translated from yen at the rate of ¥94.05=U.S.$1, the approximate exchange rate as of March 31, 2013.
Summary of Consolidated Financial Statements
38
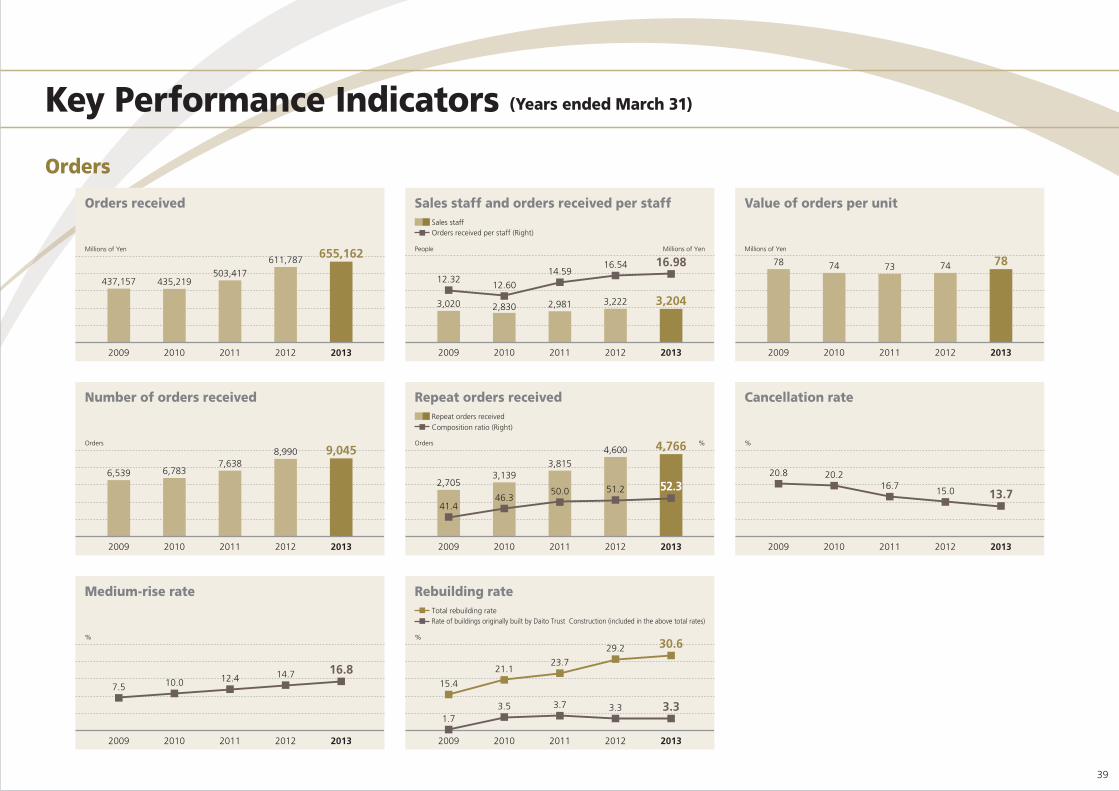
Orders
2009 2010 2011 2012 2013
437,157 435,219503,417
611,787Millions of Yen 655,162
2009 2010 2011 2012 2013
6,539 6,7837,638
Orders9,0458,990
2009 2010 2011 2012 2013
%
7.5 10.0 12.416.814.7
2009 2010 2011 2012 2013
3,020 2,830 2,981
People Millions of Yen
Sales staffOrders received per staff (Right)
3,204
16.9812.32
12.60
14.59
3,222
16.54
2009 2010 2011 2012 2013
41.446.3
50.0
Orders %
Repeat orders received
Composition ratio (Right)
4,766
52.32,7053,139
3,815
51.2
4,600
2009 2010 2011 2012 2013
1.73.5 3.7
%
Total rebuilding rateRate of buildings originally built by Daito Trust Construction (included in the above total rates)
30.6
3.3
15.4
21.123.7
3.3
29.2
Orders received
Number of orders received
Medium-rise rate
Sales staff and orders received per staff
Repeat orders received
Rebuilding rate
Cancellation rate
2009 2010 2011 2012 2013
78 74 73 74
Millions of Yen
78
2009 2010 2011 2012 2013
%
20.8 20.216.7
13.715.0
Value of orders per unit
Key Performance Indicators (Years ended March 31)
39

Orders
Shares of Financial Institutions —Customer’s Financing channel—
2009 2010 2011 2012 2013
%52.7
14.2
5.32.1
10.6
15.1
Japan Housing Finance Agency Securitization
Regional banks City banks Shinkin banks Agricultural cooperative %
52.7
2.15.3
10.6
15.1
14.2
Regional banks
City banks
Shinkin banks
Agricultural cooperative
Japan Housing Finance Agency
Other
Past five years Fiscal year ended march 31, 2012
Hokkaido Tohoku Kanto Koshinetsu Tokai Kinki Chugoku Shikoku Kyushu
3,742
15,932
Units %
Daito Trust Construction’s lease housing startsDaito Trust Construction’s share (Right)
3,647
7,5595,948 4,729
2,093
6,202
14.9
1,275
21.313.3
33.126.6
15.1
32.241.3
7.3
2009 2010 2011 2012 2013
331 292
Thousands of Units %
Number of construction started unitsDaito Trust Construction’s share (Right)
295290
17.3
11.6
16.2 16.519.2
445
Number of construction started units and Daito Trust Construction’s share
Number of construction started units by area and Daito Trust Construction’s share
Key Performance Indicators (Years ended March 31)
40
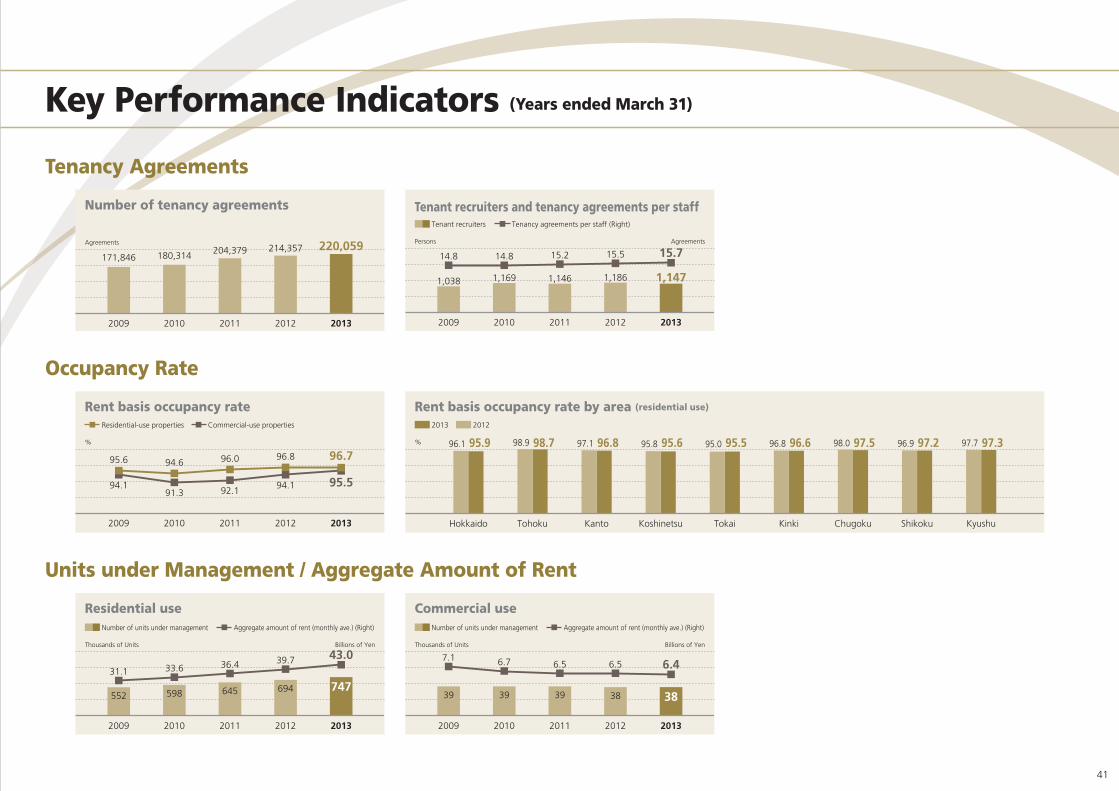
Tenancy Agreements
2009 2010 2011 2012 2013
180,314
Agreements 220,059214,357171,846
204,379
Number of tenancy agreements Tenant recruiters and tenancy agreements per staff
2009 2010 2011 2012 2013
1,169
Persons Agreements
Tenant recruiters Tenancy agreements per staff (Right)
1,1471,1861,038 1,146
14.8 15.514.8 15.2 15.7
Occupancy Rate
Rent basis occupancy rate
%
2013 2012
98.9 97.1 95.8 95.0 96.8 98.0 96.9 97.796.1 95.9 98.7 96.8 95.6 95.5 96.6 97.5 97.2 97.3
Hokkaido Tohoku Kanto Koshinetsu Tokai Kinki Chugoku Shikoku Kyushu
Rent basis occupancy rate by area (residential use)
2009 2010 2011 2012 2013
94.6
%
96.796.895.6 96.0
91.394.194.1
92.195.5
Residential-use properties Commercial-use properties
Units under Management / Aggregate Amount of Rent
Residential use Commercial use
2009 2010 2011 2012 2013
598
Thousands of Units Billions of Yen
Number of units under management Aggregate amount of rent (monthly ave.) (Right)
694552 645
33.639.7
31.136.4
43.0
747
2009 2010 2011 2012 2013
39
Thousands of Units Billions of Yen
Number of units under management Aggregate amount of rent (monthly ave.) (Right)
3839 39
6.7 6.57.1
6.5 6.4
38
Key Performance Indicators (Years ended March 31)
41

Number of Branches and Units Under Management by Sales Department As of June 30, 2013
Employees
Number of employees
People
Non-consolidated Consolidated
2009 2010 2011 2012 2013
9,109
13,009
8,653
12,903
8,822
13,221
9,317
13,875
9,428
14,154
1
1
3
7
9
45
8
610
1112
13
1415
14
17
16
16
2
1. Kita-Nihon Sales Dept 13 branches
30,665 units under management
2. Tohoku Sales Dept. 14 branches
48,656 units under management
3. Higashi-Kanto Sales Dept. 16 branches
88,113 units under management
4. Kita-Kanto Sales Dept. 13 branches
59,206 units under management
5. Hokuriku/Shinetsu Sales Dept. 13 branches
52,088 units under management
6. Tokai Sales Dept. 11 branches
30,333 units under management
7. Higashi-Metropolitan Sales Dept. 12 branches
12,402 units under management
8. Nishi-Metropolitan Sales Dept. 12 branches
18,061 units under management
9. Minami-Kanto Sales Dept. 12 branches
35,584 units under management
10. Chukyo Sales Dept. 15 branches
68,233 units under management
11. Chubu Sales Dept. 10 branches
39,894 units under management
12. Keihanshin Sales Dept. 14 branches
54,748 units under management
13. Minami-Kansai Sales Dept. 14 branches
49,719 units under management
14. Chushikoku Sales Dept. 12 branches
48,362 units under management
15. Chugoku Sales Dept. 14 branches
57,152 units under management
16. Kita-Kyushu/Okinawa Sales Dept. 11 branches
55,898 units under management
17. Minami-Kyushu Sales Dept. 14 branches
49,464 units under management
Key Performance Indicators
42

Market Forecast (Figures from 2015 are forecasts)
Households living in leased housing
Trends of leased housing demand/supply
Thousands Thousands%
51,842 52,904 53,053 52,439 51,231 49,555
18,660 18,990 19,020 18,790 18,320
35.3% 35.8% 36.3 36.7% 37.0%
18,020
2010 2015 2020 2025 2030 2035
Households in leased housing 18,020 18,660 18,990 19,020 18,790 18,320
Total households 51,842 52,904 53,053 52,439 51,231 49,555
Percentage of households in leased housing (right)
34.8% 35.3% 35.8% 36.3% 36.7% 37.0%
34.8%
18,660
4,010
18,990 19,020 18,790 18,320
14,65017,770
17,770
13,420
5,570
11,350
7,680
9,900
8,890
8,640
9,680
2008 2015 2020 2025 2030 2035
Leased housing 17,770 14,650 13,420 11,350 9,900 8,640
Required supply of new leased housing units
0 4,010 5,570 7,680 8,890 9,680
Households in leased housing 17,770 18,660 18,990 19,020 18,790 18,320
Population and totalhouseholds
Loss of leased housingby year of construction
Thousands Thousands of People Thousands
2,040
2,770
4,220
3,480
5,260
1,970
2,590
3,940
3,170
2,980
3,120
1,840
3,790
2,500
3,020
2,270
4,350
1,7802,410
2,870
3,650
650
6,420
1,7102,310
3,5002,370
7,870
1,6102,170
3,2401,620
9,120
2008 2015 2020 2025 2030 2035
Less than 5 years 2,040 1,970 1,840 1,780 1,710 1,610
5–10 years 2,770 2,590 2,500 2,410 2,310 2,170
11–20 years 4,220 3,940 3,790 3,650 3,500 3,240
21–30 years 3,480 3,170 3,020 2,870 2,370 1,620
Over 30 years 5,260 2,980 2,270 650 0 0
Loss of leased housing (index 2008=0 ) 0 3,120 4,350 6,420 7,870 9,120
52,90451,842
126,597128,057
53,053
124,100
52,439
120,659
51,231
116,618
49,555
112,124
2010 2015 2020 2025 2030 2035
Total households 51,842 52,904 53,053 52,439 51,231 49,555
Population (Right) 128,057 126,597 124,100 120,659 116,618 112,124
17,770 14,650 13,420 11,350 9,900 8,640
Key Performance Indicators
43

Principal shareholdersName Number of Shares Owned % of Shares
Japan Trustee Services Bank, Ltd. (held in trust) 3,315,400 4.11The Master Trust Bank of Japan, Ltd.(held in trust) 3,247,000 4.02JPMorgan Chase Bank 2,969,035 3.68State Street Bank and Trust Company 505225 2,239,649 2.77Mellon Bank NA as Agent for Its Client Mellon Omnibus US Pension 1,938,251 2.40Co-op Suppliers' Stock Holding 1,663,205 2.06Sumitomo Realty & Development Co., Ltd. 1,606,700 1.99Japan Trustee Services Bank, Ltd. (Sumitomo Mitsui Trust Bank re-trust account , SMBC employee retirement benefit trust account) 1,474,800 1.82Daito Trust Employee Shareholders Association 1,258,111 1.56Mellon Bank Treaty Clients Omnibus 1,097,579 1.36
Share data Composition of shareholders
Number of shares authorized 329,541,100 shares
Number of shares issued 80,610,279 shares
Number of shareholders 16,380 shareholders
Trading unit 100 shares
%
56.36
1.183.65.97
9.80
23.10
Foreign companies 45,431,384 shares
Financial institutions 18,618,344 shares
Individuals and others 7,901,102 shares
Domestic companies 4,809,102 shares
Securities companies 2,898,073 shares
Daito Trust Construction Co., Ltd. 951,925 shares
Share price trends and trading volumeDaito Trust Construction’s share price (Yen)
2010/4 2011/4 2012/4 2013/3
10,000
9,000
8,000 40,000
45,000
50,000
7,000 35,000
6,000 30,000
5,000 25,000
4,000 20,000
3,000 15,000
2,000 10,000
1,000 5,000
Trading Volume (Thousands of Shares)
Investor Information As of March 31, 2013
44

Corporate Name
Daito Trust Construction Co., Ltd.
Head Office
2-16-1, Konan, Minato-ku, Tokyo 108-8211, Japan
Tel: +81-3-6718-9111
Established
June 20, 1974
Capital
¥29,060 million (Common Stock)
Number of Employees
9,317 (Non-consolidated)
Fiscal Year-end
March 31
Annual Meeting of Shareholders
June
Ex-rights Date
March 31
For Interim Dividend: September 30
Independent Auditors
Deloitte Touche Tohmatsu
Transfer Agent
Mitsubishi UFJ Trust Bank Limited
Corporate Agency Department, 7-10-11, Higashisuna, Koto-ku,
Tokyo 137-8081, Japan
Stock Exchange Listing
Tokyo Stock Exchange (1st Section)
Nagoya Stock Exchange (1st Section)
Code
1878
Corporate Directory
Construction Business
Daito Construction Co., Ltd.Design and construction of rental property
Daito Steel Co., Ltd.Supply of construction parts and materials, etc.
Real Estate Business
Daito Building Management Co., Ltd.Management of rental property
Housecom Co., Ltd.Rental housing agency
Ju-See Publishing Co., Ltd.Operation of e-Heya Net website,production of listing magazines
Ju-See Information Center Co., Ltd.Real estate operations
House Leave Co., Ltd.Operation of tenant guarantor servicesfor rental housing
Other Business
Daito Finance Co., Ltd.Financing operations (construction financing loans)
Care Partner Co., Ltd.Operation of day service centers
Gaspal Co., Ltd.Sales of fuel (LP gas)
Daito Farm Co., Ltd.Production, processing and sales of agricultural products
Daito Corporate Service Co., Ltd.Printing of documents, administrative support, etc.
Daito Asia Development PTE. LTD.Financing to overseas subsidiaries
Daito Asia Investment PTE. LTD.Loans to overseas subsidiaries
Daito Asia Development (Malaysia) Sdn. Bhd.Overseas hotel operations
DTC REINSURANCE LIMITEDReinsurance company for fire insurance
Daito Business Center Co,. Ltd.Business support for Daito Trust Construction Group companies
Corporate Data As of March 31, 2013
45
2-16-1 Konan, Minato-ku, Tokyo 108-8211, Japan
TEL: +81-3-6718-9111
http://www.kentaku.co.jp
E-mail: [email protected]
Printed in Japan

Consolidated Financial Section 2013
Contents
Consolidated Balance Sheet P. 1 Consolidated Statement of Income P. 3 Consolidated Statement of Comprehensive Income P. 4 Consolidated Statement of Changes in Equity P. 5 Consolidated Statement of Cash flows P. 6 Notes to Consolidated Financial Statements P. 7 Note: Consolidated Financial Section contains audited English-language financial statements in which certain items have been changed for the convenience of overseas readers.

Thousands of
Millions of Yen (Note 1)ASSETS 2013 2012 2013
CURRENT ASSETS:Cash and cash equivalents (Note 18) ¥ 264,192 ¥ 221,094 $ 2,809,059Marketable securities (Notes 3 and 18) 10,325 5,069 109,782Notes and accounts receivable (Note 18):
Construction contracts 23,825 31,336 253,323Other 9,279 7,196 98,660
Total receivables 33,104 38,532 351,983
Short-term loans (Note 18) 42,591 49,688 452,855Inventories (Note 6) 11,890 13,997 126,422Prepaid expenses-whole-building lease and other 50,387 47,108 535,747Deferred tax assets (Note 13) 15,138 14,639 160,957Other current assets 8,464 7,936 89,995Allowance for doubtful accounts (314) (297) (3,339)
Total current assets 435,777 397,766 4,633,461
PROPERTY, PLANT AND EQUIPMENT (Notes 7, 8 and 17):Land 42,110 41,875 447,741Buildings and structures 57,608 54,918 612,525Furniture and equipment 6,101 4,696 64,870Lease assets (Note 17) 1,972 1,552 20,968
Total 107,791 103,041 1,146,104Accumulated depreciation (26,269) (23,189) (279,310)
Net property, plant and equipment 81,522 79,852 866,794
INVESTMENTS AND OTHER ASSETS:Investment securities (Notes 3, 5 and 18) 17,972 17,420 191,090Subordinated bonds and subordinated trust beneficiary right
(Notes 4 and 18) 12,881 10,903 136,959Guarantee deposit (Note 5) 25,024 21,604 266,071Investment in an associated company 113 113 1,201Deferred tax assets (Note 13) 19,404 16,493 206,316Deferred tax assets on revaluation of land 2,703 2,771 28,740Other assets 25,199 25,069 267,932Allowance for doubtful accounts (Note 4) (2,857) (2,911) (30,377)
Total investment and other assets 100,439 91,462 1,067,932
TOTAL ¥ 617,738 ¥ 569,080 $ 6,568,187
U.S. Dollars
Daito Trust Construction Co., Ltd.and
Consolidated Subsidiaries
Consolidated Balance Sheet
March 31, 2013
1

Thousands of
Millions of Yen (Note 1)2013 2012 2013
CURRENT LIABILITIES:Short-term bank loan (Note 9) ¥ 300 ¥ 300 $ 3,190Current portion of long-term lease obligations (Note 17) 298 274 3,169Current portion of long-term bank loan (Notes 9 and 18) 14,975 14,759 159,224Accounts payable (Note 18) 44,230 42,206 470,282Advances received-construction contracts 40,973 31,069 435,651Income taxes payable (Notes 13 and 18) 25,975 27,752 276,183Advances received-whole-building lease and other 29,263 28,628 311,143Accrued employees' bonuses 16,224 15,393 172,504Deposits received (Note 18) 6,920 6,622 73,578Other current liabilities 34,008 34,168 361,594
Total current liabilities-(Forward) 213,166 201,171 2,266,518
LONG-TERM LIABILITIES:Long-term bank loan (Notes 9 and 18) 95,524 109,499 1,015,673Long-term lease obligations (Note 17) 1,030 941 10,952Liability for retirement benefit (Note 10) 9,296 9,382 98,841Provision for repair of whole-building lease system 36,995 25,947 393,355Deposits received for guarantee (Note 18) 69,199 65,741 735,768Other long-term liabilities 5,935 4,390 63,104
Total long-term liabilities 217,979 215,900 2,317,693
COMMITMENTS AND CONTINGENT LIABILITIES (Note 19)
EQUITY (Note 11):Common stock-authorized: 329,541 thousand shares; issued, 80,610 thousand shares in 2013 and 2012 29,061 29,061 308,995Capital surplus 34,541 34,541 367,262Stock acquisition rights (Note 12) 73 70 776Retained earnings 140,703 113,762 1,496,045Treasury stock-at cost, 952 thousand shares in 2013 and 1,117 thousand shares in 2012 (11,560) (13,873) (122,913)Accumulated other comprehensive income: Unrealized gain on available-for-sale securities 3,420 713 36,364 Land revaluation surplus (4,881) (5,004) (51,898) Foreign currency translation adjustments (6,315) (8,762) (67,146)
Total 185,042 150,508 1,967,485Minority interest 1,551 1,501 16,491
Total equity 186,593 152,009 1,983,976
TOTAL ¥ 617,738 ¥ 569,080 $ 6,568,187
See notes to consolidated financial statements.
LIABILITIES AND EQUITY
U.S. Dollars
2

Thousands of
Millions of Yen (Note 1)2013 2012 2013
NET SALES:Construction contracts (Notes 14 and 22) ¥ 489,545 ¥ 468,636 $ 5,205,157Real estate 630,429 589,924 6,703,126Other 32,439 28,569 344,912Total net sales 1,152,413 1,087,129 12,253,195
COST OF SALES:Construction contracts 317,438 293,529 3,375,205Real estate 595,072 560,663 6,327,188Other 21,477 18,792 228,356Total cost of sales 933,987 872,984 9,930,749
Gross profit 218,426 214,145 2,322,446
SELLING, GENERAL AND ADMINISTRATIVE EXPENSES (Note 15) 136,014 132,170 1,446,189
Operating income 82,412 81,975 876,257
OTHER INCOME (EXPENSES):Interest and dividend income 908 662 9,654Interest expense (Note 9) (1,176) (1,318) (12,504)Other-net (Notes 7 and 16) 3,214 5,293 34,174
Other income-net 2,946 4,637 31,324
INCOME BEFORE INCOME TAXES AND MINORITYINTERESTS 85,358 86,612 907,581
INCOME TAXES (Note 13):Current 38,396 40,353 408,251Deferred (4,839) (999) (51,451)
Total income taxes 33,557 39,354 356,800
NET INCOME BEFORE MINORITY INTERESTS 51,801 47,258 550,781
MINORITY INTERESTS IN NET INCOME 127 155 1,350
NET INCOME ¥ 51,674 ¥ 47,103 $ 549,431
Yen U.S. dollars2013 2012 2013
PER SHARE OF COMMON STOCK (Note 21):Basic net income ¥ 648.57 ¥ 594.53 $ 6.90Diluted net income 648.28 593.27 6.89Cash dividends applicable to the year 324.00 297.00 3.44
See notes to consolidated financial statements.
Daito Trust Construction Co., Ltd.
Consolidated Subsidiaries
Consolidated Statement of Income
Year ended March 31, 2013
and
U.S. Dollars
3
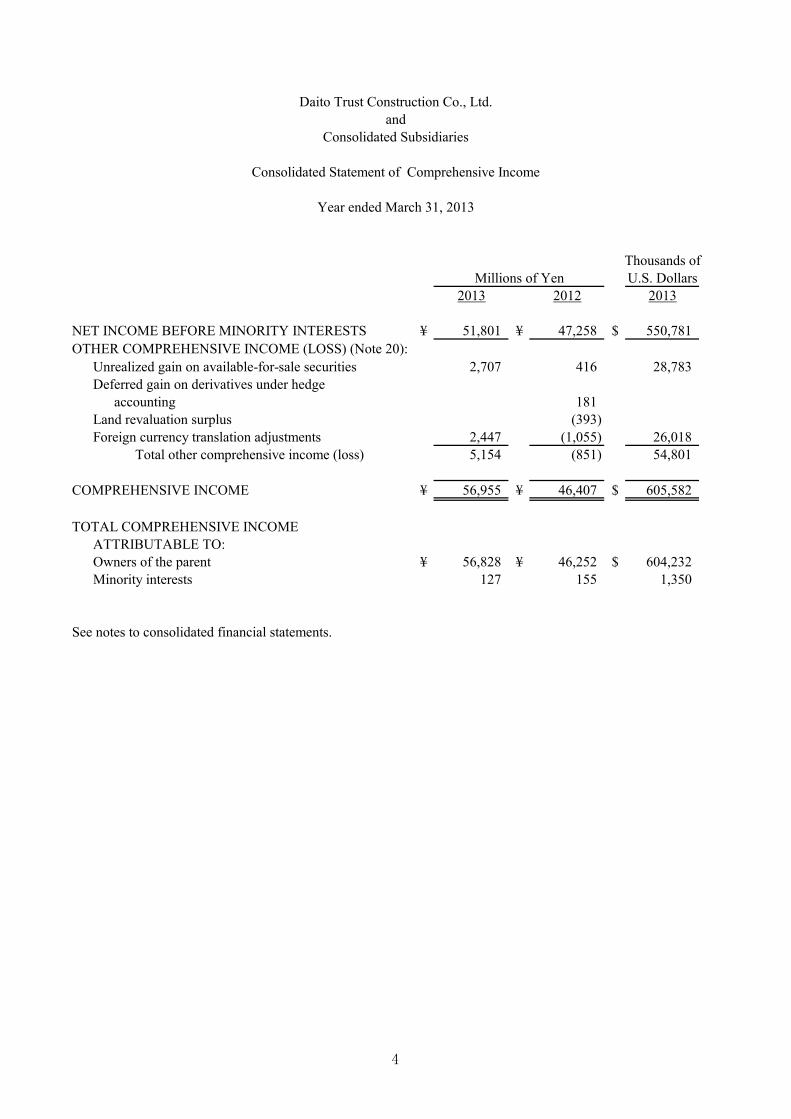
Thousands ofMillions of Yen U.S. Dollars
2013 2012 2013
NET INCOME BEFORE MINORITY INTERESTS ¥ 51,801 ¥ 47,258 $ 550,781OTHER COMPREHENSIVE INCOME (LOSS) (Note 20):
Unrealized gain on available-for-sale securities 2,707 416 28,783Deferred gain on derivatives under hedge
accounting 181Land revaluation surplus (393)Foreign currency translation adjustments 2,447 (1,055) 26,018
Total other comprehensive income (loss) 5,154 (851) 54,801
COMPREHENSIVE INCOME ¥ 56,955 ¥ 46,407 $ 605,582
TOTAL COMPREHENSIVE INCOMEATTRIBUTABLE TO:Owners of the parent ¥ 56,828 ¥ 46,252 $ 604,232Minority interests 127 155 1,350
See notes to consolidated financial statements.
Daito Trust Construction Co., Ltd.and
Consolidated Subsidiaries
Consolidated Statement of Comprehensive Income
Year ended March 31, 2013
4

Number ofShares ofCommon
StockOutstanding
CommonStock
CapitalSurplus
StockAcquisition
Rights
RetainedEarnings
TreasuryStock
UnrealizedGain on
Available-for-Sale
Securities
DeferredGain (Loss)
onDerivatives
underHedge
Accounting
LandRevaluation
Surplus
ForeignCurrency
TranslationAdjustments
Total MinorityInterests Total Equity
BALANCE, APRIL 1, 2011 80,610,279 ¥ 29,061 ¥ 34,541 ¥ 253 ¥ 88,988 ¥ (9,208) ¥ 297 ¥ (181) ¥ (4,610) ¥ (7,708) ¥ 131,433 ¥ 819 ¥ 132,252
Net income 47,103 47,103 47,103Cash dividends, ¥279 per share (22,073) (22,073) (22,073)Purchase of treasury stock (9,024) (9,024) (9,024)Disposal of treasury stock (256) 4,359 4,103 4,103Net change in the year (183) 416 181 (394) (1,054) (1,034) 682 (352)
BALANCE, MARCH 31, 2012 80,610,279 29,061 34,541 70 113,762 (13,873) 713 - (5,004) (8,762) 150,508 1,501 152,009
Net income 51,674 51,674 51,674Cash dividends, ¥308 per share (24,519) (24,519) (24,519)Purchase of treasury stock (516) (516) (516)Disposal of treasury stock (92) 2,829 2,737 2,737Reversal of land revaluation surplus (122) (122) (122)Net change in the year 3 2,707 123 2,447 5,280 50 5,330
BALANCE, MARCH 31, 2013 80,610,279 ¥ 29,061 ¥ 34,541 ¥ 73 ¥ 140,703 ¥ (11,560) ¥ 3,420 - ¥ (4,881) ¥ (6,315) ¥ 185,042 ¥ 1,551 ¥ 186,593
CommonStock
CapitalSurplus
StockAcquisition
Rights
RetainedEarnings
TreasuryStock
UnrealizedGain on
Available-for-Sale
Securities
DeferredGain (Loss)
onDerivatives
underHedge
Accounting
LandRevaluation
Surplus
ForeignCurrency
TranslationAdjustments
Total MinorityInterests Total Equity
BALANCE, MARCH 31, 2012 $ 308,995 $ 367,262 $ 744 $ 1,209,591 $ (147,517) $ 7,581 - $ (53,206) $ (93,163) $ 1,600,287 $ 15,970 $ 1,616,257
Net income 549,431 549,431 549,431Cash dividends, $3.27 per share (260,702) (260,702) (260,702)Purchase of treasury stock (5,486) (5,486) (5,486)Disposal of treasury stock (978) 30,090 29,112 29,112Reversal of land revaluation surplus (1,297) (1,297) (1,297)Net change in the year 32 28,783 1,308 26,017 56,140 521 56,661
BALANCE, MARCH 31, 2013 $ 308,995 $ 367,262 $ 776 $ 1,496,045 $ (122,913) $ 36,364 - $ (51,898) $ (67,146) $ 1,967,485 $ 16,491 $ 1,983,976
See notes to consolidated financial statements.
Daito Trust Construction Co., Ltd.
Accumulated other comprehensive incomeMillions of Yen
Thousands of U.S. Dollars (Note 1)Accumulated other comprehensive income
Year ended March 31, 2013
Consolidated Statement of Changes in Equity
Consolidated Subsidiariesand
5

Thousands of
Millions of Yen (note 1)2013 2012 2013
OPERATING ACTIVITIES:Income before income taxes and minority interests ¥ 85,358 ¥ 86,612 $ 907,581Adjustments for:
Income taxes-paid (39,603) (36,984) (421,085)Depreciation and amortization 3,161 3,112 33,610Impairment loss 231 79 2,456Gain on devaluation of investment securities (197) (17) (2,095)Changes in operating assets and liabilities:
Decrease in notes and accounts receivable 5,445 5,631 57,895Decrease (increase) in inventories 2,110 (4,215) 22,435
(3,296) (6,354) (35,045)Decrease in short-term loans 7,097 13,944 75,460Increase in accounts payables 2,008 6,820 21,350
635 (13,339) 6,752
9,904 8,430 105,3063,458 4,882 36,768
Increase (decrease) in deposits received 297 (163) 3,158Decrease in allowance for doubtful accounts (37) (28) (393)Increase in accrued employees' bonuses 830 2,488 8,825(Decrease) increase in retirement and severance allowance (86) 657 (914)
11,048 8,996 117,469Other-net (523) (2,706) (5,562)
Total adjustments 2,482 (8,767) 26,390
Net cash provided by operating activities 87,840 77,845 933,971INVESTING ACTIVITIES:
Decrease in time deposits -net - 200 -Purchases of marketable and investment securities (11,993) (7,432) (127,517)
9,915 780 105,423Payments for purchase of property, plant and equipment (3,671) (3,146) (39,032)Other-net (4,615) (1,774) (49,071)
Net cash used in investing activities (10,364) (11,372) (110,197)FINANCING ACTIVITIES:
Increase in short-term bank loan -net - 300 -Proceeds from long-term bank loan 1,000 11,000 10,633Repayment of long-term bank loan (14,759) (13,742) (156,927)Dividends paid (24,519) (22,073) (260,702)Repurchase of treasury stock (309) (9,024) (3,285)Proceeds from disposal of treasury stock 2,754 3,868 29,282Proceeds from stock issuance from minority shareholders - 437 -Cash dividends paid to minority shareholders (78) - (829)Other-net (295) (257) (3,137)
Net cash used in financing activities (36,206) (29,491) (384,965)
FOREIGN CURRENCY TRANSLATION ADJUSTMENTS ON CASH AND CASH EQUIVALENTS 1,828 (702) 19,437NET INCREASE IN CASH AND CASH EQUIVALENTS 43,098 36,280 458,246CASH AND CASH EQUIVALENTS, BEGINNING OF YEAR 221,094 184,814 2,350,813CASH AND CASH EQUIVALENTS, END OF YEAR ¥ 264,192 ¥ 221,094 $ 2,809,059
See notes to consolidated financial statements.
Daito Trust Construction Co., Ltd.
Consolidated Subsidiaries
Consolidated Statement of Cash flows
Year ended March 31, 2013
and
U.S. Dollars
Increase in prepaid expenses- whole-building lease and other
Increase (decrease) in advances received- whole-building lease and other
Increase in deposits received for guarantee
Increase in advances received- construction contracts
Increase in provision for repair of whole-building lease system
Proceeds from sales and redemption of marketable and investment securities
6

7
Daito Trust Construction Co., Ltd.
and Consolidated Subsidiaries
Notes to Consolidated Financial Statements
Year Ended March 31, 2013
1. BASIS OF PRESENTING CONSOLIDATED FINANCIAL STATEMENTS
The accompanying consolidated financial statements have been prepared in accordance with the provisions set forth in the Japanese Financial Instruments and Exchange Act and its related accounting regulations and in accordance with accounting principles generally accepted in Japan , which are different in certain respects as to application and disclosure requirements of International Financial Reporting Standards. In preparing these consolidated financial statements, certain reclassifications and rearrangements have been made to the consolidated financial statements issued domestically in order to present them in a form which is more familiar to readers outside Japan. In addition, certain reclassifications have been made in the 2012 consolidated financial statements to conform them to the classifications used in 2013. The consolidated financial statements are stated in Japanese yen, the currency of the country in which Daito Trust Construction Co., Ltd. (the "Company") is incorporated and operates. The translations of Japanese yen amounts into U.S. dollar amounts are included solely for the convenience of readers outside Japan and have been made at the rate of ¥94.05 to $1, the approximate rate of exchange at March 31, 2013. Such translations should not be construed as representations that the Japanese yen amounts could be converted into U.S. dollars at that or any other rate.
2. SUMMARY OF SIGNIFICANT ACCOUNTING POLICIES
a. Consolidation—The consolidated financial statements as of March 31, 2013, include the accounts of the Company and its 17 significant (16 in 2012) subsidiaries (together, the "Group"). Under the control concept, those companies in which the Company, directly or indirectly, is able to exercise control over operations are fully consolidated.
Investment in an associated company is stated at cost. If the equity method of accounting had been applied to the investment in this company, the effect on the accompanying consolidated financial statements would not be material.
All significant intercompany balances and transactions have been eliminated in consolidation. All material unrealized profit included in assets resulting from transactions within the Group is also eliminated.
b. Cash Equivalents—Cash equivalents are short-term investments that are readily
convertible into cash and that are exposed to insignificant risk of changes in value. Cash equivalents include time deposits and certificate of deposits, both of which mature within three months of the date of acquisition.

8
c. Inventories—Construction projects in progress are stated at cost determined on the specific project basis. Materials and other inventories are mainly stated at the lower of cost determined by the moving-average method, or net selling value.
d. Marketable and Investment Securities—Marketable and investment securities are classified and accounted for, depending on management's intent, as follows: (1) held-to-maturity debt securities, for which there is the positive intent and ability to hold to maturity are reported at amortized cost; and (2) available-for-sale securities, which are not classified as the aforementioned securities, are reported at fair value, with unrealized gains and losses, net of applicable taxes, reported in a separate component of equity.
Nonmarketable available-for-sale securities are stated at cost determined by the moving-average method. For other-than-temporary declines in fair value, investment securities are reduced to net realizable value by a charge to income.
e. Property, Plant and Equipment—Property, plant and equipment are stated at cost. Depreciation of property, plant and equipment of the Company and its consolidated domestic subsidiaries is computed substantially by the declining-balance method based on the estimated useful lives of the assets, while the straight-line method is applied to buildings acquired after April 1, 1998, and all property and equipment of consolidated foreign subsidiaries. The range of useful lives is principally from 10 to 60 years for buildings and structures, and from 2 to 20 years for furniture and equipment. Lease assets are depreciated using the straight-line method over the estimated useful lives of assets which are the term of the respective leases.
f. Long-Lived Assets—The Group reviews its long-lived assets for impairment whenever events or changes in circumstance indicate the carrying amount of an asset or asset group may not be recoverable. An impairment loss is recognized if the carrying amount of an asset or asset group exceeds the sum of the undiscounted future cash flows expected to result from the continued use and eventual disposition of the asset or asset group. The impairment loss would be measured as the amount by which the carrying amount of the asset exceeds its recoverable amount, which is the higher of the discounted cash flows from the continued use and eventual disposition of the asset or the net selling price at disposition.
g. Land Revaluation—Under the "Law of Land Revaluation," the Company elected a one-time revaluation of its own-use land to a value based on real estate appraisal information as of March 31, 2002. The resulting land revaluation difference represents the unrealized decline in value of land and is stated, net of income taxes, as a component of equity. There was no effect on the consolidated statement of income. Continuous readjustment is not permitted unless the land value subsequently declines significantly. The amount of the decline in value would be added to the land revaluation difference account and related deferred tax assets.
h. Allowance for Doubtful Accounts—The allowance for doubtful accounts is stated at amounts considered to be appropriate based on the Group's past credit loss experience and an evaluation of potential losses in the receivables outstanding. The allowance for doubtful accounts related to the subordinated bonds and subordinated trust beneficiary right issued by special-purpose entities (SPEs) is stated based on an evaluation of potential losses due to the worsening fiscal condition of the SPEs.

9
i. Accrued Employees' Bonuses—The Company and certain consolidated subsidiaries have provided for employees' bonuses to state the liability at the estimated amount payable to employees.
j. Retirement and Pension Plans—The Company and certain consolidated subsidiaries have contributory funded defined benefit pension plans and unfunded retirement benefit plans for employees. Other consolidated domestic subsidiaries have unfunded retirement benefit plans for their employees.
Unrecognized prior service liabilities are amortized over a certain period (mainly 8 years) using the straight-line method within the average remaining service period, commencing from the date on which they are incurred. Unrecognized actuarial net gains or losses are amortized over a certain period (mainly 6 years and 8 years) using the declining-balance method within the average remaining service period, commencing from the date on which they are incurred. Certain consolidated subsidiaries amortized from the following year in which they arise.
k. Provision for Repair of Whole-Building Lease System— Certain consolidated subsidiaries have provided for a provision for repair of whole-building lease systems to cover probable costs of restore and repair being borne in the future based on the whole-building lease contracts.
l. Stock Options—In December 2005, the Accounting Standards Board of Japan (the “ASBJ”) issued ASBJ Statement No. 8, "Accounting Standard for Stock Options" and related guidance. The new standard and guidance are applicable to stock options newly granted on and after May 1, 2006. This standard requires companies to measure the cost of employee stock options based on the fair value at the date of grant and recognize compensation expense over the vesting period as consideration for receiving goods or services. The standard also requires companies to account for stock options granted to non-employees based on the fair value of either the stock option or the goods or services received. In the balance sheet, the stock option is presented as a stock acquisition right as a separate component of equity until exercised. The standard covers equity-settled, share-based payment transactions, but does not cover cash-settled, share-based payment transactions. In addition, the standard allows unlisted companies to measure options at their intrinsic value if they cannot reliably estimate fair value.
m. Research and Development Costs—Research and development costs are charged to income as incurred.
n. Leases—In March 2007, the ASBJ issued ASBJ Statement No.13, "Accounting Standard for Lease Transactions," which revised the previous accounting standard for lease transactions. The revised accounting standard for lease transactions was effective for fiscal years beginning on or after April 1, 2008.
Under the previous accounting standard, finance leases that were deemed to transfer ownership of the leased property to the lessee were capitalized. However, other finance leases were permitted to be accounted for as operating lease transactions if certain "as if capitalized" information was disclosed in the notes to the lessee's financial statements. The revised accounting standard requires that all finance lease transactions be capitalized by recognizing lease assets and lease obligations in the balance sheet.

10
In addition, the revised accounting standard permits leases which existed at the transition date and do not transfer ownership of the leased property to the lessee to continue to be accounted for as operating lease transactions.
The Company applied the revised accounting standard effective April 1, 2008. In addition, the Company continues to account for leases which existed at the transition date and does not transfer ownership of the leased property to the lessee as operating lease transactions.
All other leases are accounted for as operating leases.
o. Construction Contracts— In December 2007, the ASBJ issued ASBJ Statement No. 15, "Accounting Standard for Construction Contracts" and ASBJ Guidance No. 18, "Guidance on Accounting Standard for Construction Contracts." Under these accounting standards, construction revenue and construction costs should be recognized by the percentage-of-completion method, if the outcome of a construction contract can be estimated reliably. When total construction revenue, total construction costs and the stage of completion of the contract at the balance sheet date can be reliably measured, the outcome of a construction contract is deemed to be estimated reliably. If the outcome of a construction contract cannot be reliably estimated, the completed-contract method should be applied. When it is probable that the total construction costs will exceed total construction revenue, an estimated loss on the contract should be immediately recognized by providing for a loss on construction contracts.
p. Income Taxes—The provision for income taxes is computed based on the pretax income included in the consolidated statement of income. The asset and liability approach is used to recognize deferred tax assets and liabilities for the expected future tax consequences of temporary differences between the carrying amounts and the tax bases of assets and liabilities. Deferred taxes are measured by applying currently enacted tax laws to the temporary differences.
q. Foreign Currency Transactions—All short-term and long-term monetary receivables and payables denominated in foreign currencies are translated into Japanese yen at the exchange rates at the balance sheet date. The foreign exchange gains and losses from translation are recognized in the consolidated statement of income to the extent that they are not hedged by forward exchange contracts.
r. Foreign Currency Financial Statements—The balance sheet accounts, and revenue and expense accounts of the consolidated foreign subsidiaries are translated into Japanese yen at the current exchange rate as of the balance sheet date except for equity, which is translated at the historical rate. Differences arising from such translation are shown as "Foreign currency translation adjustments" under accumulated other comprehensive income in a separate component of equity.
s. Derivatives and Hedging Activities—The Group uses derivative financial instruments to manage its exposure to fluctuations in foreign exchange. Foreign exchange forward contracts, currency options, and currency swaps are utilized by the Group to reduce foreign currency exchange risk. The Group does not enter into derivatives for trading or speculative purposes.
Derivative financial instruments and foreign currency transactions are classified and accounted for as follows: (1) all derivatives are recognized as either assets or liabilities and measured at fair value, and gains or losses on derivative transactions are recognized in the consolidated statement of income and (2) for derivatives used for hedging purposes, if such

11
derivatives qualify for hedge accounting because of high correlation and effectiveness between the hedging instruments and the hedged items, gains or losses on derivatives are deferred until maturity of the hedged transactions.
The foreign currency forward contracts, currency options, and currency swaps employed to hedge foreign exchange exposure for imports are measured at fair value and the unrealized gains/losses are recognized in income. Forward contracts applied for forecasted (or committed) transactions are also measured at fair value but the unrealized gains/losses are deferred until the underlying transactions are completed.
Accounts payable denominated in foreign currencies for which foreign exchange forward contracts are used to hedge the foreign currency fluctuations are translated at the contracted rate if the forward contracts, currency option, and currency swaps qualify for hedge accounting.
t. Consumption Tax—Consumption tax is accounted for by the tax exclusion method.
u. Per Share Information—Basic net income per share is computed by dividing net income available to common shareholders by the weighted-average number of common shares outstanding for the period, retroactively adjusted for stock splits.
Diluted net income per share reflects the potential dilution that could occur if securities were exercised or converted into common stock. Diluted net income per share of common stock assumes full conversion of the outstanding warrants at the beginning of the year (or at the time of issuance). Cash dividends per share presented in the accompanying consolidated statement of income are dividends applicable to the respective years, including dividends to be paid after the end of the year.
v. Accounting Changes and Error Corrections—In December 2009, the ASBJ issued ASBJ Statement No. 24, "Accounting Standard for Accounting Changes and Error Corrections" and ASBJ Guidance No. 24, "Guidance on Accounting Standard for Accounting Changes and Error Corrections." Accounting treatments under this standard and guidance are as follows: (1) Changes in Accounting Policies—When a new accounting policy is applied following revision of an accounting standard, the new policy is applied retrospectively unless the revised accounting standard includes specific transitional provisions, in which case the entity shall comply with the specific transitional provisions. (2) Changes in Presentation—When the presentation of financial statements is changed, prior-period financial statements are reclassified in accordance with the new presentation. (3) Changes in Accounting Estimates—A change in an accounting estimate is accounted for in the period of the change if the change affects that period only and is accounted for prospectively if the change affects both the period of the change and future periods. (4) Corrections of Prior-Period Errors—When an error in prior-period financial statements is discovered, those statements are restated.

12
w. New Accounting Pronouncements
Accounting Standard for Retirement Benefits— On May 17, 2012, the ASBJ issued ASBJ Statement No. 26, "Accounting Standard for Retirement Benefits" and ASBJ Guidance No. 25, "Guidance on Accounting Standard for Retirement Benefits," which replaced the Accounting Standard for Retirement Benefits that had been issued by the Business Accounting Council in 1998 with an effective date of April 1, 2000, and the other related practical guidance, and followed by partial amendments from time to time through 2009.
Major changes are as follows: (a) Treatment in the balance sheet
Under the current requirements, actuarial gains and losses and past service costs that are yet to be recognized in profit or loss are not recognized in the balance sheet, and the difference between retirement benefit obligations and plan assets (hereinafter, "deficit or surplus"), adjusted by such unrecognized amounts, is recognized as a liability or asset. Under the revised accounting standard, actuarial gains and losses and past service costs that are yet to be recognized in profit or loss shall be recognized within equity (accumulated other comprehensive income), after adjusting for tax effects, and any resulting deficit or surplus shall be recognized as a liability (liability for retirement benefits) or asset (asset for retirement benefits).
(b) Treatment in the statement of income and the statement of comprehensive income
The revised accounting standard does not change how to recognize actuarial gains and losses and past service costs in profit or loss. Those amounts would be recognized in profit or loss over a certain period no longer than the expected average remaining working lives of the employees. However, actuarial gains and losses and past service costs that arose in the current period and have not yet been recognized in profit or loss shall be included in other comprehensive income and actuarial gains and losses and past service costs that were recognized in other comprehensive income in prior periods and then recognized in profit or loss in the current period shall be treated as reclassification adjustments.
(c) Amendments relating to the method of attributing expected benefit to periods and relating to the discount rate and expected future salary increases
The revised accounting standard also made certain amendments relating to the method of attributing expected benefit to periods and relating to the discount rate and expected future salary increases.
This accounting standard and the guidance for (a) and (b) above are effective for the end of annual periods beginning on or after April 1, 2013, and for (c) above are effective for the beginning of annual periods beginning on or after April 1, 2014, or for the beginning of annual periods beginning on or after April 1, 2015, subject to certain disclosure in March 2015, both with earlier application being permitted from the beginning of annual periods beginning on or after April 1, 2013. However, no retrospective application of this accounting standard to consolidated financial statements in prior periods is required.
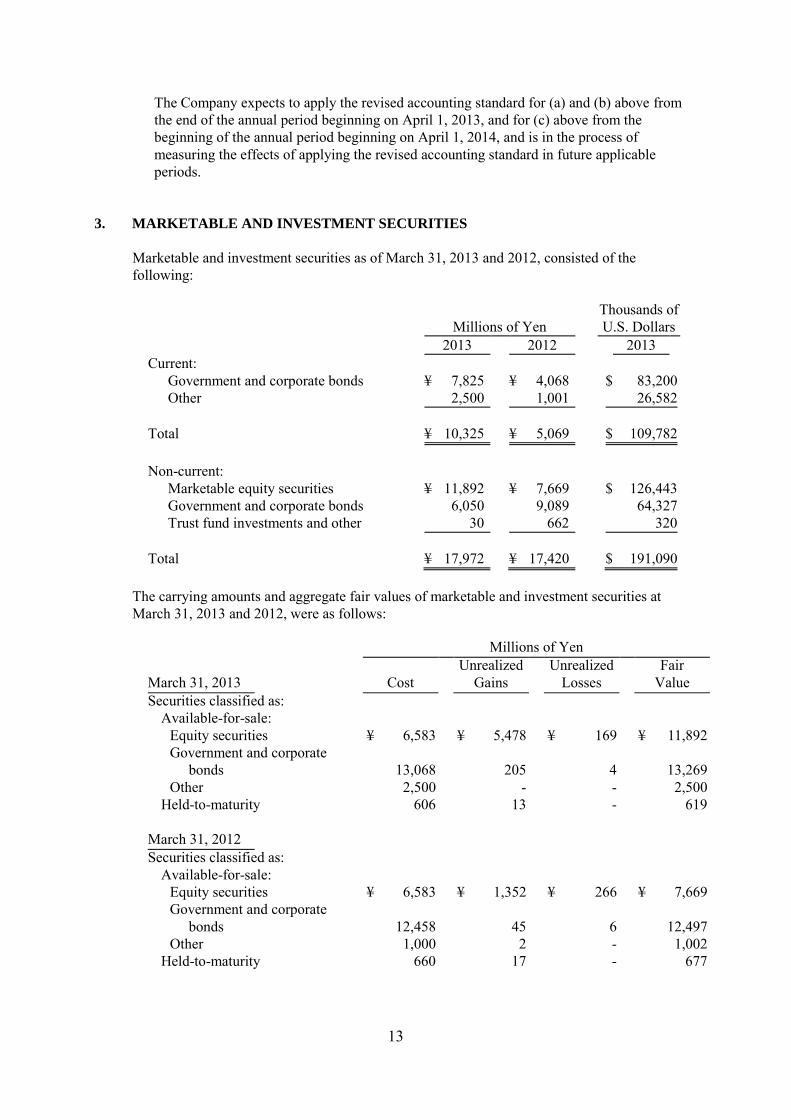
13
The Company expects to apply the revised accounting standard for (a) and (b) above from the end of the annual period beginning on April 1, 2013, and for (c) above from the beginning of the annual period beginning on April 1, 2014, and is in the process of measuring the effects of applying the revised accounting standard in future applicable periods.
3. MARKETABLE AND INVESTMENT SECURITIES
Marketable and investment securities as of March 31, 2013 and 2012, consisted of the following:
Millions of Yen
Thousands of U.S. Dollars
2013 2012 2013 Current: Government and corporate bonds ¥ 7,825 ¥ 4,068 $ 83,200 Other 2,500 1,001 26,582 Total ¥ 10,325 ¥ 5,069 $ 109,782 Non-current: Marketable equity securities ¥ 11,892 ¥ 7,669 $ 126,443 Government and corporate bonds 6,050 9,089 64,327 Trust fund investments and other 30 662 320 Total ¥ 17,972 ¥ 17,420 $ 191,090
The carrying amounts and aggregate fair values of marketable and investment securities at March 31, 2013 and 2012, were as follows:
Millions of Yen
March 31, 2013
Cost
Unrealized
Gains
Unrealized
Losses
Fair
Value
Securities classified as:
Available-for-sale:
Equity securities ¥ 6,583 ¥ 5,478 ¥ 169 ¥ 11,892
Government and corporate
bonds
13,068 205 4 13,269
Other 2,500 - - 2,500
Held-to-maturity 606 13 - 619
March 31, 2012
Securities classified as:
Available-for-sale:
Equity securities ¥ 6,583 ¥ 1,352 ¥ 266 ¥ 7,669
Government and corporate
bonds
12,458 45 6 12,497
Other 1,000 2 - 1,002
Held-to-maturity 660 17 - 677

14
Thousands of U.S. Dollars
March 31, 2013
Cost
Unrealized
Gains
Unrealized
Losses
Fair
Value
Securities classified as:
Available-for-sale:
Equity securities $ 69,995 $ 58,246 $ 1,798 $ 126,443
Government and corporate
bonds
138,947 2,180 42 141,085
Other 26,582 - - 26,582
Held-to-maturity 6,443 139 - 6,582
4. SUBORDINATED BONDS AND SUBORDINATED TRUST BENEFICIARY RIGHT
The Company mediates the extension of apartment loans to customers who order construction of rental housing. As for this loan, financial institutions establish SPEs and the loans are securitized by SPEs. When the customer uses this loan, the Company needs to buy the subordinated bonds or subordinated trust beneficiary right issued by the SPEs according to the agreement with certain financial institutions. Details of the subordinated bonds and subordinated trust beneficiary right were as follows:
Millions of Yen
Thousands of U.S. Dollars
2013 2012 2013
Subordinated bonds and subordinated trust beneficiary right
¥ 12,881
¥ 10,903
$ 136,959
Allowance for doubtful accounts ¥ 1,168 ¥ 1,475 $ 12,419 Possession ratio of subordinated bonds and
subordinated trust beneficiary right 6.17%
6.30%
6.17%
Date of maturity November 2034 –
February 2043
November 2034 – March
2040
November 2034 –
February 2043
Loan balance of SPEs ¥ 114,958 ¥ 103,220 $ 1,222,307 Outstanding bonds of SPEs ¥ 119,030 ¥ 109,828 $ 1,265,603 Number of SPEs 10 8 10
The possession ratio of the subordinated bonds and subordinated trust beneficiary right is the ratio of the subordinated bonds and subordinated trust beneficiary right balance of the Company to the total amount of bonds when issued.

15
5. PLEDGED ASSETS
The carrying amounts of assets pledged as security as required by the Building Lots and Buildings Transaction Business Law, the Act for Secure Execution of Defect Warranty Liability and for the purpose of extending payment due dates for customs and consumption tax at March 31, 2013 and 2012, were as follows:
Millions of Yen
Thousands of U.S. Dollars
2013 2012 2013 Investment securities ¥ 4,204 ¥ 5,271 $ 44,700 Other 2,245 10 23,870 Total ¥ 6,449 ¥ 5,281 $ 68,570
6. INVENTORIES
Inventories at March 31, 2013 and 2012, consisted of the following:
Millions of Yen
Thousands of U.S. Dollars
2013 2012 2013 Construction projects in progress ¥ 7,315 ¥ 7,026 $ 77,778 Materials 3,668 6,662 39,001 Real estate held for sale 727 169 7,730 Merchandise 180 140 1,913 Total ¥ 11,890 ¥ 13,997 $ 126,422
7. LONG-LIVED ASSETS
The Group reviewed its long-lived assets for impairment as of March 31, 2013. As a result, the Group recognized an impairment loss of ¥177 million ($1,882 thousand) as other expense for the asset group for the recreation facility and recognized an impairment loss of ¥38 million ($404 thousand) as other expense for the asset group for store operation due to a continuous operating loss of those units, and the carrying amounts of the relevant assets were written down to the recoverable amount. The recoverable amount of the asset group was measured at net selling price which was evaluated as appraisal values for land and reasonable disposal values for assets other than land.

16
8. INVESTMENT PROPERTY
In November 2008, the ASBJ issued ASBJ Statement No. 20,"Accounting Standard for Investment Property and Related Disclosures" and issued ASBJ Guidance No.23,"Guidance on Accounting Standard for Investment Property and Related Disclosures." The Group owns certain rental properties, such as office buildings, apartments, and car parking spaces. The net of rental income and operating expenses for those rental properties was ¥3,413 million ($36,289 thousand) and ¥3,325 million for the fiscal years ended March 31, 2013 and 2012, respectively. In addition, the carrying amounts, changes in such balances and market prices of such properties are as follows:
Millions of Yen
Carrying Amount Fair Value
April 1, 2012 Decrease March 31, 2013 March 31, 2013
¥59,386 ¥894 ¥58,492 ¥117,835
Millions of Yen
Carrying Amount Fair Value
April 1, 2011 Decrease March 31, 2012 March 31, 2012
¥60,324 ¥938 ¥59,386 ¥117,887
Thousands of U.S. Dollars
Carrying Amount Fair Value
April 1, 2012 Decrease March 31, 2013 March 31, 2013
$ 631,430 $ 9,505 $ 621,925 $ 1,252,897
Notes:
1. Carrying amount recognized in the consolidated balance sheet is net of accumulated
depreciation and accumulated impairment losses, if any.
2. Increase during the fiscal year ended March 31, 2013, primarily represents the acquisition of
certain properties of ¥5 million ($53 thousand), and decrease primarily represents the
recognition of depreciation of ¥890 million ($9,463 thousand).
3. Increase during the fiscal year ended March 31, 2012, primarily represents the acquisition of
certain properties of ¥39 million, and decrease primarily represents the recognition of
depreciation of ¥987 million.
4. Fair value of properties is measured by the Group in accordance with its Real-Estate
Appraisal Standard.

17
9. SHORT-TERM BANK LOANS AND LONG-TERM BANK LOAN
Short-term bank loans at March 31, 2013 and 2012, consisted of bank overdrafts. The annual interest rate applicable to the short-term bank loan is 0.65% and 0.74% at March 31, 2013 and 2012, respectively. Long-term bank loans at March 31, 2013 and 2012 consisted of the following:
Millions of Yen
Thousands of U.S. Dollars
2013 2012 2013 Loans from banks due on various dates
through 2020 with interest rates ranging
from 0.51% to 1.05% (2013) and from
0.54% to 1.14% (2012)
¥ 110,499 ¥ 124,258 $ 1,174,897
Total 110,499 124,258 1,174,897
Less current portion (14,975 ) (14,759 ) (159,224 )
Long-term bank loan, less current portion ¥ 95,524 ¥ 109,499 $ 1,015,673
Annual maturities of long-term bank loan, excluding finance leases (see Note 17), at March 31, 2013, were as follows:
Year Ending March 31
Millions of Yen
Thousands of U.S. Dollars
2014 ¥ 14,975 $ 159,224 2015 14,903 158,458 2016 14,903 158,458 2017 14,288 151,919 2018 51,107 543,402 2019 and thereafter 323 3,436 Total ¥ 110,499 $ 1,174,897
As is customary in Japan, the Company maintains substantial deposit balances with banks with which it has borrowings. Such deposit balances are not legally or contractually restricted as to withdrawal.
General agreements with respective banks provide, as is customary in Japan, that additional collateral must be provided under certain circumstances if requested by such banks and that certain banks have the right to offset cash deposited with them against any long-term or short-term debt or obligation that becomes due and, in case of default and certain other specified events, against all other debt payable to the banks. The Company has never been requested to provide any additional collateral. In addition, the Company entered into committed loan facility agreements aggregating ¥38,988 million ($414,545 thousand) with seven Japanese banks. There was ¥300 million ($3,190 thousand) balance under the committed loan facility agreements as of March 31, 2013.

18
10. RETIREMENT AND PENSION PLANS
The Company and certain consolidated subsidiaries have severance payment plans for employees. Under most circumstances, employees terminating their employment are entitled to retirement benefits determined based on the rate of pay at the time of termination, years of service, and certain other factors. Such retirement benefits are made in the form of a lump-sum severance payment from the Company or from certain consolidated subsidiaries and annuity payments from a trustee. Employees are entitled to larger payments if the termination is involuntary, by retirement at the mandatory retirement age, by death, or by voluntary retirement at certain specific ages prior to the mandatory retirement age. The liability for employees' retirement benefits at March 31, 2013 and 2012, consisted of the following:
Millions of Yen
Thousands of
U.S. Dollars
2013 2012 2013
Projected benefit obligation ¥ 24,667 ¥ 23,024 $ 262,275
Fair value of plan assets (14,502) (12,220) (154,195)
Unrecognized prior service cost (196) (287) (2,084)
Unrecognized actuarial loss (673) (1,135) (7,155)
Net liability ¥ 9,296 ¥ 9,382 $ 98,841
The components of net periodic benefit costs for the years ended March 31, 2013 and 2012, are as follows:
Millions of Yen
Thousands of
U.S. Dollars
2013 2012 2013
Service cost ¥ 2,147 ¥ 2,153 $ 22,828
Interest cost 313 293 3,328
Expected return on plan assets (183) (171) (1,946)
Amortization of prior service cost 90 84 957
Recognized actuarial loss 282 378 2,999
Net periodic benefit costs ¥ 2,649 ¥ 2,737 $ 28,166
Assumptions used for the years ended March 31, 2013 and 2012, are set forth as follows:
2013 2012
Discount rate 1.4% 1.4%
Expected rate of return on plan assets 1.5% 1.5%
Amortization period of prior service cost Mainly
8 years
8 years
Recognition period of actuarial gain/loss Mainly
6 years and
8 years
Mainly
6 years and
8 years

19
11. EQUITY
Japanese companies are subject to the Companies Act of Japan (the "Companies Act"). The significant provisions in the Companies Act that affect financial and accounting matters are summarized below: a. Dividends
Under the Companies Act, companies can pay dividends at any time during the fiscal year in addition to the year-end dividend upon resolution at the shareholders’ meeting. For companies that meet certain criteria such as (1) having a Board of Directors, (2) having independent auditors,(3) having an Audit & Supervisory Board, and (4) the term of service of the directors is prescribed as one year rather than two years of normal term by its articles of incorporation, the Board of Directors may declare dividends (except for dividends-in-kind) at any time during the fiscal year if the company has prescribed so in its articles of incorporation. However, the Company cannot do so because it does not meet all the above criteria. The Companies Act permits companies to distribute dividends-in-kind (noncash assets) to shareholders subject to a certain limitation and additional requirements. Semiannual interim dividends may also be paid once a year upon resolution by the Board of Directors if the articles of incorporation of the company so stipulate. The Companies Act provides certain limitations on the amounts available for dividends or the purchase of treasury stock. The limitation is defined as the amount available for distribution to the shareholders, but the amount of net assets after dividends must be maintained at no less than ¥3 million.
b. Increases/Decreases and Transfer of Common Stock, Reserve and Surplus
The Companies Act requires that an amount equal to 10% of dividends must be appropriated as a legal reserve (a component of retained earnings) or as additional paid-in capital (a component of capital surplus) depending on the equity account charged upon the payment of such dividends, until the aggregate amount of legal reserve and additional paid-in capital equals 25% of the common stock. Under the Companies Act, the total amount of additional paid-in capital and legal reserve may be reversed without limitation. The Companies Act also provides that common stock, legal reserve, additional paid-in capital, other capital surplus, and retained earnings can be transferred among the accounts under certain conditions upon resolution of the shareholders.

20
c. Treasury Stock and Treasury Stock Acquisition Rights
The Companies Act also provides for companies to purchase treasury stock and dispose of such treasury stock by resolution of the Board of Directors. The amount of treasury stock purchased cannot exceed the amount available for distribution to the shareholders which is determined by specific formula. Under the Companies Act, stock acquisition rights are presented as a separate component of equity. The Companies Act also provides that companies can purchase both treasury stock acquisition rights and treasury stock. Such treasury stock acquisition rights are presented as a separate component of equity or deducted directly from stock acquisition rights.
The Company has set up “Trust under Employee Stock Ownership Plan ” and “Trust for
employees being received in-kind benefit by stock” to improve employees’ benefit program,
increase the corporate value by enhancing awareness of the Company’s results and stock price,
and enhance employees’ motivation and morale.
The Company identified these trusts as a part of the Company by emphasizing economic
substance from the accounting point of view.
The Company’s stock held by the trusts is therefore presented as “Treasury Stock” as a
deduction to shareholders’ equity in the consolidated balance sheet and consolidated
shareholders’ equity (or statement of changes in equity).
The Company’s stock held by the above trusts also has the same rights as normal stock, e.g.,
voting and dividend claim rights, because the stock does not meet the definition of treasury
stock under the Companies Act. For a calculation of available amounts for dividends as
stipulated under Clause 2 of Article 461 of the Companies Act, the Company’s stock held by
the trusts is not deducted because of the same reason. The Company’s stock held by the above
trusts is as follows:
Millions of Yen
Thousands of
U.S. Dollars
2013 2012 2013
Trust under Employee Stock Ownership Plan ¥ 3,281 ¥ 4,863 $ 34,886
Trust for employees received as in kind
benefit by stock
2,974
3,000
31,621
Total ¥ 6,255 ¥ 7,863 $ 66,507
Thousands of Shares
2013 2012
Trust under Employee Stock Ownership Plan 459 680
Trust for employees received as in kind
benefit by stock
414 418
Total 873 1,098

21
12. STOCK OPTIONS
Stock options outstanding as of March 31, 2013, are as follows:
Stock Option
Persons
Granted
Number of
Options
Granted
Date of
Grant
Exercise
Price
Exercise Period
2012 Stock
Option (A)
10 directors 7,600 shares 2012.6.14 ¥ 1
($0.01)
From June 15, 2012
to June 14, 2042
2012 Stock
Option (B)
10 directors 17,500 shares 2012.6.14 ¥ 1
($0.01)
From June 15, 2012
to June 14, 2017
Stock option activity is as follows:
2004 Stock
Option
Year Ended March 31, 2012
Non-vested
April 1, 2011—Outstanding -
Granted -
Canceled -
Vested -
March 31, 2012—Outstanding -
Vested
April 1, 2011—Outstanding 828,200
Vested -
Exercised (598,800)
Canceled -
March 31, 2012—Outstanding 229,400
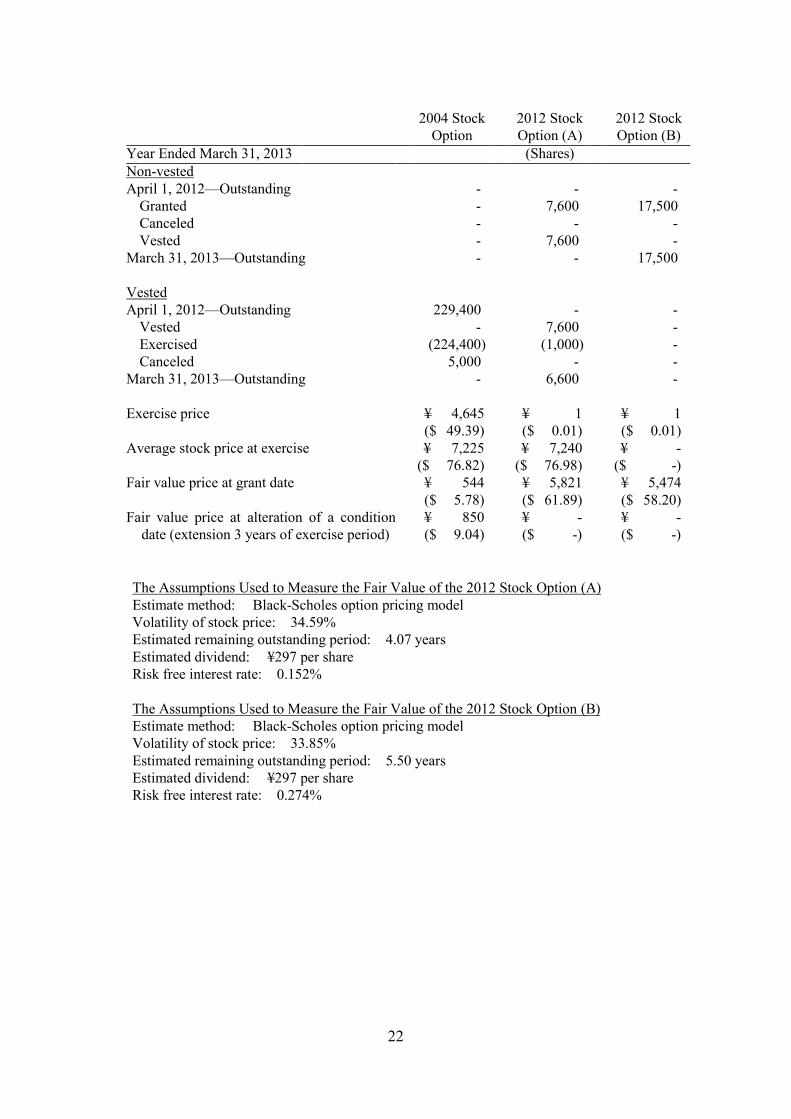
22
2004 Stock
Option
2012 Stock
Option (A)
2012 Stock
Option (B)
Year Ended March 31, 2013 (Shares)
Non-vested
April 1, 2012—Outstanding - - -
Granted - 7,600 17,500
Canceled - - -
Vested - 7,600 -
March 31, 2013—Outstanding - - 17,500
Vested
April 1, 2012—Outstanding 229,400 - -
Vested - 7,600 -
Exercised (224,400) (1,000) -
Canceled 5,000 - -
March 31, 2013—Outstanding - 6,600 -
Exercise price ¥ 4,645
($ 49.39)
¥ 1
($ 0.01)
¥ 1
($ 0.01)
Average stock price at exercise ¥ 7,225
($ 76.82)
¥ 7,240
($ 76.98)
¥ -
($ -)
Fair value price at grant date ¥ 544
($ 5.78)
¥ 5,821
($ 61.89)
¥ 5,474
($ 58.20)
Fair value price at alteration of a condition
date (extension 3 years of exercise period)
¥ 850
($ 9.04)
¥ -
($ -)
¥ -
($ -)
The Assumptions Used to Measure the Fair Value of the 2012 Stock Option (A) Estimate method: Black-Scholes option pricing model Volatility of stock price: 34.59% Estimated remaining outstanding period: 4.07 years Estimated dividend: ¥297 per share Risk free interest rate: 0.152%
The Assumptions Used to Measure the Fair Value of the 2012 Stock Option (B) Estimate method: Black-Scholes option pricing model Volatility of stock price: 33.85% Estimated remaining outstanding period: 5.50 years Estimated dividend: ¥297 per share Risk free interest rate: 0.274%
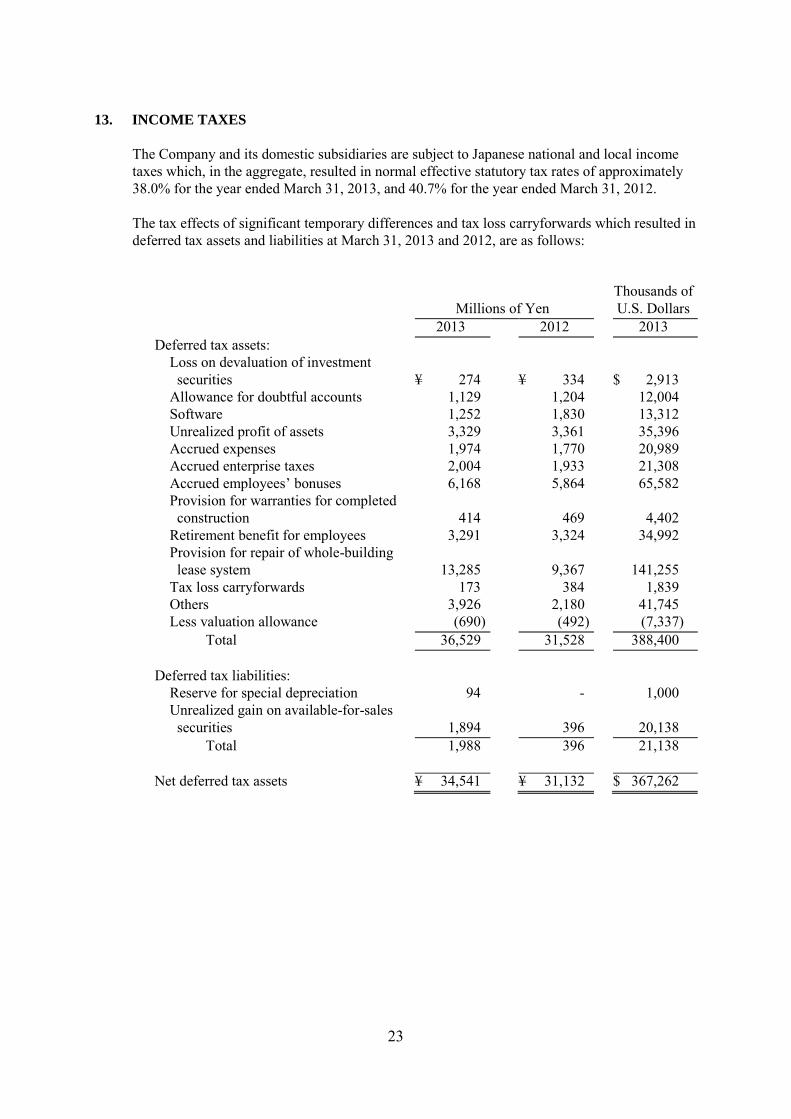
23
13. INCOME TAXES
The Company and its domestic subsidiaries are subject to Japanese national and local income taxes which, in the aggregate, resulted in normal effective statutory tax rates of approximately 38.0% for the year ended March 31, 2013, and 40.7% for the year ended March 31, 2012. The tax effects of significant temporary differences and tax loss carryforwards which resulted in deferred tax assets and liabilities at March 31, 2013 and 2012, are as follows:
Millions of Yen
Thousands of
U.S. Dollars
2013 2012 2013
Deferred tax assets:
Loss on devaluation of investment
securities
¥ 274
¥ 334
$ 2,913
Allowance for doubtful accounts 1,129 1,204 12,004
Software 1,252 1,830 13,312
Unrealized profit of assets 3,329 3,361 35,396
Accrued expenses 1,974 1,770 20,989
Accrued enterprise taxes 2,004 1,933 21,308
Accrued employees’ bonuses 6,168 5,864 65,582
Provision for warranties for completed
construction
414
469
4,402
Retirement benefit for employees 3,291 3,324 34,992
Provision for repair of whole-building
lease system
13,285
9,367
141,255
Tax loss carryforwards 173 384 1,839
Others 3,926 2,180 41,745
Less valuation allowance (690) (492) (7,337)
Total 36,529 31,528 388,400
Deferred tax liabilities:
Reserve for special depreciation 94 - 1,000
Unrealized gain on available-for-sales
securities
1,894
396
20,138
Total 1,988 396 21,138
Net deferred tax assets ¥ 34,541 ¥ 31,132 $ 367,262
24
A reconciliation between the normal effective statutory tax rates and the actual effective tax rates reflected in the accompanying consolidated statement of income for the years ended March 31, 2013, with the corresponding figures for 2012 is as follows:
2013 2012
Normal effective statutory tax rate 38.0% 40.7%
Expenses not deductible for income tax purposes 1.4 1.1
Inhabitant tax on per capita basis 0.1 0.1
Valuation allowance 0.1 (0.2)
Decrease in deferred tax assets by change of tax rate 0.5 3.6
Others—net (0.8) 0.1
Actual effective tax rate 39.3% 45.4%
On December 2, 2011, new tax reform laws were enacted in Japan, which changed the normal effective statutory tax rate from approximately 40.7% to 38.0% effective for the fiscal years beginning on or after April 1, 2012 through March 31, 2015, and to 35.6% afterwards. At March 31, 2013, certain subsidiaries have tax loss carryforwards aggregating to approximately ¥466 million ($4,955 thousand), which are available to be offset against taxable income of such subsidiaries in future years. These tax loss carryforwards, if not utilized, will expire as follows:
Year Ending March 31
Millions of
Yen
Thousands of
U.S. Dollars
2014 ¥ - $ -
2015 - -
2016 - -
2017 - -
2018 - -
2019 25 266
2020 204 2,169
2021 128 1,361
2022 109 1,159
Total ¥ 466 $ 4,955
14. CONSTRUCTION CONTRACTS
Revenue recognized with respect to construction contracts, which is accounted for by the percentage-of-completion method at March 31, 2013 and 2012, is as follows:
Millions of Yen
Thousands of
U.S. Dollars
2013 2012 2013
Revenue ¥ 481,948 ¥ 458,222 $ 5,124,381

25
15. RESEARCH AND DEVELOPMENT COSTS
Research and development costs charged to income were ¥1,063 million ($11,302 thousand) and ¥993 million for the years ended March 31, 2013 and 2012, respectively.
16. OTHER INCOME—NET
Other income—net for the years ended March 31, 2013 and 2012, consisted of the following:
Millions of Yen
Thousands of
U.S. Dollars
2013 2012 2013
Commission fee ¥ 2,792 ¥ 2,672 $ 29,686
Gain on reversal of provision for loss on
disaster
340
2,095
3,615
Other 82 526 873
Other income—net ¥ 3,214 ¥ 5,293 $ 34,174
17. LEASES
Lessee
The Group leases certain tools, equipment, and other assets. ASBJ Statement No. 13, "Accounting Standard for Lease Transactions" requires that all finance lease transactions be capitalized to recognize lease assets and lease obligations in the balance sheet. However, ASBJ Statement No. 13 permits leases without ownership transfer of the leased property to the lessee and whose lease inception was before March 31, 2008, to continue to be accounted for as operating lease transactions if certain "as if capitalized" information is disclosed in the note to the financial statements. The Company applied ASBJ Statement No. 13 effective April 1, 2008, and accounted for such leases as operating lease transactions. Pro forma information of leased property whose lease inception was before March 31, 2008, was as follows:
Millions of Yen
Thousands of
U.S. Dollars
Furniture and Equipment 2013 2012 2013
Acquisition cost ¥ - ¥ 824 $ -
Accumulated depreciation - 708 -
Net leased property ¥ - ¥ 116 $ -

26
Obligations under finance leases:
Millions of Yen
Thousands of
U.S. Dollars
2013 2012 2013
Due within one year ¥ - ¥ 123 $ -
Due after one year - - -
Total ¥ - ¥ 123 $ -
Depreciation expense, interest expense, and other information under finance leases:
Millions of Yen
Thousands of
U.S. Dollars
2013 2012 2013
Depreciation expense ¥ 118 ¥ 189 $ 1,254
Interest expense 1 5 11
Total ¥ 119 ¥ 194 $ 1,265
Lease payments ¥ 127 ¥ 202 $ 1,350
Depreciation expense and interest expense, which are not reflected in the accompanying consolidated statement of income, are computed by the straight-line method and the interest method, respectively. The minimum rental commitments under noncancelable operating leases at March 31, 2013 and 2012, were as follows:
Millions of Yen
Thousands of
U.S. Dollars
2013 2012 2013
Due within one year ¥ 282,517 ¥ 248,060 $ 3,003,902
Due after one year 1,401,319 1,307,673 14,899,724
Total ¥ 1,683,836 ¥ 1,555,733 $ 17,903,626
Lease payments fixed by contract with regard to the whole-building lease system are included in the above-mentioned minimum rental commitments as follows:
Millions of Yen
Thousands of
U.S. Dollars
2013 2012 2013
Due within one year ¥ 275,251 ¥ 241,746 $ 2,926,646
Due after one year 1,375,879 1,281,534 14,629,229
Total ¥ 1,651,130 ¥ 1,523,280 $ 17,555,875
27
Lessor
The minimum rental commitments under noncancelable operating leases at March 31, 2013 and
2012, were as follows:
Millions of Yen
Thousands of
U.S. Dollars
2013 2012 2013
Due within one year ¥ 621 ¥ 621 $ 6,603
Due after one year 5,591 6,212 59,447
Total ¥ 6,212 ¥ 6,833 $ 66,050
18. FINANCIAL INSTRUMENTS AND RELATED DISCLOSURES
(1) Group Policy for Financial Instruments
The Group uses financial instruments, mainly loan from bank, based on its capital financing plan for construction business. As a matter of policy, the Group only uses derivatives for actual operating requirements, not for speculative purposes.
(2) Nature and Extent of Risks Arising from Financial Instruments and the Risk
Management for Financial Instruments
Receivables such as trade notes and accounts receivable are exposed to customer credit risk. The Group decreases the risk by starting construction after customer financing is fixed. Marketable and investment securities, mainly held-to-maturity securities and equity instruments, are exposed to credit risk and variable risks associated with market prices or market rates. The Group performs periodic monitoring of the financial condition of the issuers for marketable investment securities. A continuing review of the holding of securities, other than held-to-maturity securities, is performed by taking into consideration the market as well as the relationship with the trading counterparties. Short-term loans, mainly loans for customers’ construction finance (bridge loan until financial institution executes long-term loan) are exposed to customer credit risk. The
Group thoroughly enforces credit risk management, which includes periodic monitoring of the financial condition of customers to mitigate the risk of uncollectible loans. Subordinated bonds and subordinated trust beneficiary right are financial instruments issued by an SPE established by a financial institution in a way apartment loans financed by a customer, who orders the Company to construct an apartment building for rent, are securitized. They are exposed to credit risk of the debtor of the apartment loan. The Group grasps the credit situation by monitoring repayments of the loan. Payment terms of payables, such as accounts payable, income taxes payable, and deposits received, are generally less than one year.

28
Loans from banks are exposed to market risk from changes in interest rates. The Group performs continuous monitoring of market fluctuations. Long-term deposits received for guarantee are received from tenants in the real estate rental business by the whole-building lease system. Derivatives are forward foreign currency contracts, which are used to manage exposure to market risks from changes in foreign currency exchange rate payables.
(3) Fair Values of Financial Instruments
Fair values of financial instruments are based on quoted prices in active markets. If a quoted price is not available, another rational valuation technique is used instead.
(a) Fair value of financial instruments
Millions of Yen
March 31, 2013 Carrying Amount Fair Value
Unrealized Gain/Loss
Cash and cash equivalents ¥ 264,192 ¥ 264,192 ¥ - Notes and accounts receivable 33,104 Allowance for doubtful accounts (41) 33,063 33,063 - Marketable and investment securities:
Held-to-maturity securities 606 619 13 Available-for-sale securities 27,661 27,661 - Short-term loans: 42,591 Allowance for doubtful accounts (85) 42,506 42,905 399 Total ¥ 368,028 ¥ 368,440 ¥ 412 Accounts payable ¥ 44,230 ¥ 44,230 ¥ - Income taxes payable 25,975 25,975 - Deposits received 6,920 6,920 - Current portion of long-term bank
loans and long-term bank loans 110,499
110,499
-
Deposits received for guarantee 69,199 68,679 (520) Total ¥ 256,823 ¥ 256,303 ¥ (520)

29
March 31, 2012 Cash and cash equivalents ¥ 221,094 ¥ 221,094 ¥ - Notes and accounts receivable 38,532 Allowance for doubtful accounts (41) 38,491 38,491 - Marketable and investment securities:
Held-to-maturity securities 660 677 17 Available-for-sale securities 21,168 21,168 - Short-term loans: 49,688 Allowance for doubtful accounts (98) 49,590 50,008 418 Total ¥ 331,003 ¥ 331,438 ¥ 435 Accounts payable ¥ 42,206 ¥ 42,206 ¥ - Income taxes payable 27,752 27,752 - Deposit received 6,622 6,622 - Current portion of long-term bank
loans and long-term bank loans 124,258
124,258
-
Deposits received for guarantee 65,741 65,093 (648) Total ¥ 266,579 ¥ 265,931 ¥ (648)
Thousands of U.S. Dollars
March 31, 2013 Carrying Amount Fair Value
Unrealized Gain/Loss
Cash and cash equivalents $ 2,809,059 $ 2,809,059 $ - Notes and accounts receivable 351,983 Allowance for doubtful accounts (436) 351,547 351,547 - Marketable and investment securities:
Held-to-maturity securities 6,443 6,581 138 Available-for-sale securities 294,110 294,110 - Short-term loans: 452,855 Allowance for doubtful accounts (904) 451,951 456,194 4,243 Total $ 3,913,110 $ 3,917,491 $ 4,381 Accounts payable $ 470,282 $ 470,282 $ - Income taxes payable 276,183 276,183 - Deposits received 73,578 73,578 - Current portion of long-term bank
loans and long-term bank loans 1,174,896
1,174,896
-
Deposits received for guarantee 735,768 730,239 (5,529) Total $ 2,730,707 $ 2,725,178 $ (5,529)

30
Cash and Cash Equivalents, Notes, and Accounts Receivable The carrying values of accounts mentioned above approximate fair value because of their short maturities. Marketable and Investment Securities The fair values of marketable and investment securities are measured at the quoted market price of the stock exchange for the equity instruments, and at the quoted price obtained from the financial institution for certain debt instruments. Fair value information for marketable and investment securities by classification is included in Note 3. Short-Term Loans The fair value of short-term loan with floating-rate approximates carrying values because the rate reflects market interest rates within a short time except for significant changes of credit conditions of debtors. Loans with fixed rates consist of short-term bridge loans and long-term loans. The fair value of short-term loans approximates carrying values because the rate reflects market interest rates. The fair value of long-term loans is determined based on present values calculated by using discount rates corresponding to the remaining period of the loan and credit risk. Accounts Payable, Income Taxes Payable, and Deposits Received The carrying values of accounts mentioned above approximate fair value because of their short maturities. Current Portion of Long-Term Bank Loan and Long-Term Bank Loan For the current portion of long-term bank loans and for long-term bank loans that have floating interest rates, the fair values approximate carrying value because the rates reflect market interest rates within a short time. Deposits Received for Guarantee The fair value of deposits received for guarantee is determined based on present values calculated by using discount rates corresponding to credit risk and the remaining period of deposits received for guarantee.
(b) Carrying amount of financial instruments whose fair value cannot be reliably
determined
Millions of Yen
Thousands of
U.S. Dollars
2013 2012 2013
Subordinated bonds and
subordinated trust beneficiary right
¥ 12,881
¥ 10,903
$ 136,959

31
(4) Maturity Analysis for Financial Assets and Securities with Contractual Maturities
Millions of Yen
March 31, 2013
Due in
1 Year or
Less
Due after
1 Year
through
2Years
Due after
2 Years
through
3 Years
Due after
3 Years
through
4 Years
Due after
4 Years
through
5 Years
Due after
5 Years
Cash and cash equivalents ¥ 264,192 ¥ - ¥ - ¥ - ¥ - ¥ -
Notes and accounts receivable 33,104 - - - - -
Investment securities:
Held-to-maturity securities 345 30 100 40 45 45
Available-for-sale securities with contractual maturities
9,950
3,500
2,300
-
-
-
Short-term loans 17,212 4,838 3,967 3,300 2,699 10,575
Subordinated bonds and subordinated trust beneficiary right
-
-
-
-
-
13,131
Total ¥ 324,803 ¥ 8,368 ¥ 6,367 ¥ 3,340 ¥ 2,744 ¥ 23,751
Thousands of U.S. Dollars
March 31, 2013
Due in
1 Year or
Less
Due after
1 Year
through
2 Years
Due after
2 Years
through
3 Years
Due after
3 Years
through
4 Years
Due after
4 Years
through
5 Years
Due after
5 Years
Cash and cash equivalents $ 2,809,059 $ - $ - $ - $ - $ -
Notes and accounts receivable 351,983 - - - - -
Investment securities:
Held-to-maturity securities 3,668 319 1,063 425 478 478
Available-for-sale securities with contractual maturities
105,795
37,214
24,455
-
-
-
Short-term loans 183,009 51,441 42,180 35,088 28,698 112,440
Subordinated bonds and subordinated trust beneficiary right
-
-
-
-
-
139,618
Total $ 3,453,514 $ 88,974 $ 67,698 $ 35,513 $ 29,176 $ 252,536
Please see Note 9 for annual maturities of long-term bank loan and Note 17 for obligations under finance leases.
32
19. CONTINGENT LIABILITIES
The Company was contingently liable as guarantor to finance companies for housing loans totaling ¥74 million ($787 thousand) and ¥77 million as of March 31, 2013 and 2012, respectively. JU-SEE Information Center K.K., a consolidated subsidiary, guarantees house rent up to contractual amounts equivalent to 48 months based on contracts for a guarantee of rent with the tenant and the lessor at the same time. Under the contract, in case the tenant is more than 3 months behind in rent, the lessor shall terminate the rental contract with the tenant; therefore, the Company represented a liability for guaranty for amounts equivalent to 3 months’ rent from the point of delay of payment to the point of termination of the contract (¥263 million ($2,796 thousand) and ¥324 million as of March 31, 2013 and 2012, respectively).

33
20. COMPREHENSIVE INCOME
The components of other comprehensive income for the years ended March 31, 2013 and 2012, were as follows:
Millions of Yen Thousands of U.S. Dollars
2013 2012 2013 Unrealized gain (loss) on available-for-sale securities: Gains arising during the year ¥ 4,205 ¥ 608 $ 44,710 Reclassification adjustments to profit or loss - - - Amount before income tax effect 4,205 608 44,710 Income tax effect (1,498) (192) (15,927) Total ¥ 2,707 ¥ 416 $ 28,783 Deferred gain (loss) on derivatives under hedge accounting:
Gains arising during the year ¥ (4) ¥ - $ (43) Reclassification adjustments to profit or loss 4 305 43 Amount before income tax effect - 305 - Income tax effect - (124) - Total ¥ - ¥ 181 $ - Land revaluation surplus: Reclassification adjustments to profit or loss ¥ - ¥ - $ - Amount before income tax effect - - - Income tax effect - (393) - Total ¥ - ¥ (393) $ - Foreign currency translation adjustments: Adjustments arising during the year ¥ 2,447 ¥ (1,055) $ 26,018 Reclassification adjustments to profit or loss - - - Amount before income tax effect 2,447 (1,055) 26,018 Income tax effect - - - Total ¥ 2,447 ¥ (1,055) $ 26,018 Total other comprehensive income ¥ 5,154 ¥ (851) $ 54,801

34
21. NET INCOME PER SHARE
A reconciliation of the differences between basic and diluted net income per share ("EPS") for the years ended March 31, 2013 and 2012, is as follows:
Millions of Yen
Thousands of Shares Yen
U.S. Dollars
Year Ended March 31, 2013
Net Income
Weighted-
Average
Shares
EPS
Basic EPS—Net income available to common shareholders
¥ 51,674 79,674 ¥ 648.57 $ 6.90
Effect of dilutive securities―Warrants 36 Diluted EPS—Net income for computation ¥ 51,674 79,710 ¥ 648.28 $ 6.89
Year Ended March 31, 2012
Basic EPS—Net income available to common shareholders
¥ 47,103 79,228 ¥ 594.53 $ 6.32
Effect of dilutive securities―Warrants 167 Diluted EPS—Net income for computation ¥ 47,103 79,395 ¥ 593.27 $ 6.31
22. RELATED PARTY DISCLOSURES
Transactions of the Company with an Audit and Supervisory Board Member for the years ended March 31, 2013 and 2012, is as follows:
Millions of Yen
Name Title Content of the
Transaction 2012 Hideo Hachiya Audit &
Supervisory Board member
Construction contract ¥ 23
The above contract is entered into and accounted for on an arm’s-length basis and in the normal course of business. There are no items to be disclosed for the year ended March 31, 2013.
35
23. SUBSEQUENT EVENT
The appropriation of retained earnings at March 31, 2013, as approved at the Company's shareholders’ meeting held on June 26, 2013, is as follows:
Millions of Yen Thousands of U.S. Dollars
Year-end cash dividends, ¥165 ($1.75) per share ¥ 13,144 $ 139,755
24. SEGMENT INFORMATION
Under ASBJ Statement No. 17,"Accounting Standard for Segment Information Disclosures" and ASBJ Guidance No.20,"Guidance on Accounting Standard for Segment Information Disclosures,” an entity is required to report financial and descriptive information about its reportable segments. Reportable segments are operating segments or aggregations of operating segments that meet specified criteria. Operating segments are components of an entity about which separate financial information is available and such information is evaluated regularly by the chief operating decision maker in deciding how to allocate resources and in assessing performance. Generally, segment information is required to be reported on the same basis as is used internally for evaluating operating segment performance and deciding how to allocate resources to operating segments. (1) Description of Reportable Segments
The Group's reportable segments are those for which separate financial information is available and regular evaluation by the Company's management is being performed in order to decide how resources are allocated among the Group. The Company is engaged in the construction of apartments with the proposal of effective utilization of land. Daito Building Management Co., Ltd., a consolidated subsidiary, is engaged in whole-building leases as a “Lease management trust system” so that the subsidiary rents all apartments and subleases them to tenants. The Company plans strategies mainly for the business and develops business activities. Therefore, the Group consists of three reportable segments as follows: Construction: civil engineering, construction, and other related business Real estate: whole-building lease, rent, agency, guarantee of tenant, and management
business Finance: construction finance business for owner until financial institution
executes long-term loan (2) Methods of Measurement for the Amounts of Sales, Profit (Loss), Assets, Liabilities and
Other Items for Each Reportable Segment
The accounting policies of each reportable segment are consistent with those disclosed in Note 2, "Summary of Significant Accounting Policies."
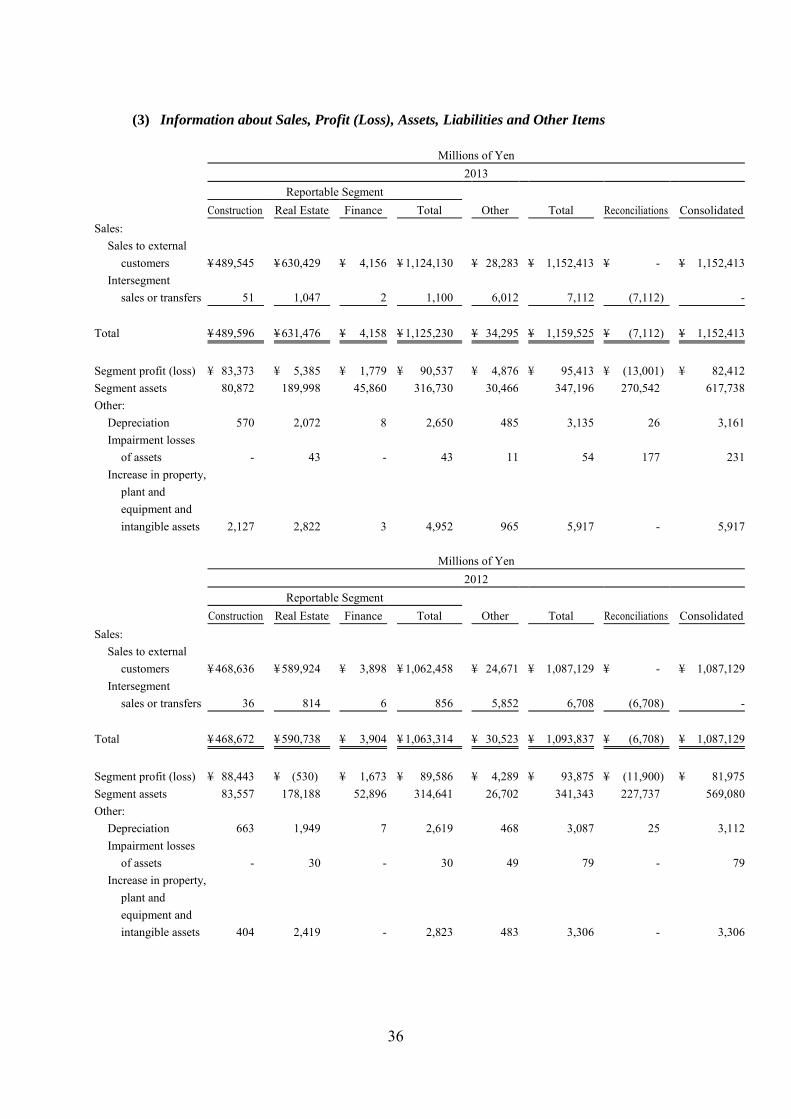
36
(3) Information about Sales, Profit (Loss), Assets, Liabilities and Other Items
Millions of Yen
2013
Reportable Segment
Other Total Reconciliations Consolidated Construction Real Estate Finance Total
Sales:
Sales to external
customers ¥ 489,545 ¥ 630,429 ¥ 4,156 ¥ 1,124,130 ¥ 28,283 ¥ 1,152,413 ¥ - ¥ 1,152,413
Intersegment
sales or transfers 51 1,047 2 1,100 6,012 7,112 (7,112) -
Total ¥ 489,596 ¥ 631,476 ¥ 4,158 ¥ 1,125,230 ¥ 34,295 ¥ 1,159,525 ¥ (7,112) ¥ 1,152,413
Segment profit (loss) ¥ 83,373 ¥ 5,385 ¥ 1,779 ¥ 90,537 ¥ 4,876 ¥ 95,413 ¥ (13,001) ¥ 82,412
Segment assets 80,872 189,998 45,860 316,730 30,466 347,196 270,542 617,738
Other:
Depreciation 570 2,072 8 2,650 485 3,135 26 3,161
Impairment losses
of assets -
43 - 43 11 54 177 231
Increase in property,
plant and
equipment and
intangible assets 2,127 2,822 3 4,952 965 5,917 - 5,917
Millions of Yen
2012
Reportable Segment
Other Total Reconciliations Consolidated Construction Real Estate Finance Total
Sales:
Sales to external
customers ¥ 468,636 ¥ 589,924 ¥ 3,898 ¥ 1,062,458 ¥ 24,671 ¥ 1,087,129 ¥ - ¥ 1,087,129
Intersegment
sales or transfers 36 814 6 856 5,852 6,708 (6,708) -
Total ¥ 468,672 ¥ 590,738 ¥ 3,904 ¥ 1,063,314 ¥ 30,523 ¥ 1,093,837 ¥ (6,708) ¥ 1,087,129
Segment profit (loss) ¥ 88,443 ¥ (530) ¥ 1,673 ¥ 89,586 ¥ 4,289 ¥ 93,875 ¥ (11,900) ¥ 81,975
Segment assets 83,557 178,188 52,896 314,641 26,702 341,343 227,737 569,080
Other:
Depreciation 663 1,949 7 2,619 468 3,087 25 3,112
Impairment losses
of assets - 30 - 30 49 79 - 79
Increase in property,
plant and
equipment and
intangible assets 404 2,419 - 2,823 483 3,306 - 3,306

37
Thousands of U.S. Dollars
2013
Reportable Segment
Other Total Reconciliations Consolidated Construction Real Estate Finance Total
Sales:
Sales to external
customers $5,205,157 $6,703,126 $ 44,189 $ 11,952,472 $ 300,723 $ 12,253,195 $ - $ 12,253,195
Intersegment
sales or transfers 542 11,132 22 11,696 63,923 75,619 (75,619) -
Total $ 5,205,699 $ 6,714,258 $ 44,211 $ 11,964,168 $ 364,646 $ 12,328,814 $ (75,619) $ 12,253,195
Segment profit (loss) $ 886,475 $ 57,257 $ 18,916 $ 962,648 $ 51,844 $ 1,014,492 $ (138,235) $ 876,257
Segment assets 859,883 2,020,181 487,613 3,367,677 323,934 3,691,611 2,876,576 6,568,187
Other:
Depreciation 6,061 22,031 85 28,177 5,156 33,333 277 33,610
Impairment losses
of assets - 457 - 457 117 574 1,882 2,456
Increase in property,
plant and
equipment and
intangible assets 22,616 30,005 32 52,653 10,260 62,913 - 62,913
Notes for the year ended March 31, 2013 (1) The reconciliations in segment profit include elimination of intersegment trades of ¥471
million ($5,008 thousand) and corporate expenses not allocated to a reportable segment of ¥13,472 million ($143,243 thousand). Corporate expenses are mainly the Company’s general administration expenses.
(2) The reconciliations in segment assets include elimination of intersegment trades of ¥1,601 million ($17,023 thousand) and corporate assets not allocated to a reportable segment of ¥272,143 million ($2,893,599 thousand). Corporate assets are mainly short-term investments and investment securities held by the Company and other assets of administrative departments.
(3) Consolidated segment profit is equal to operating income in the consolidated statement of income.
Notes for the year ended March 31, 2012 (4) The reconciliations in segment profit include elimination of intersegment trades of ¥561
million and corporate expenses not allocated to a reportable segment of ¥12,461 million. Corporate expenses are mainly the Company’s general administration expenses.
(5) The reconciliations in segment assets include elimination of intersegment trades of ¥2,534 million and corporate assets not allocated to a reportable segment of ¥230,271 million. Corporate assets are mainly short-term investments and investment securities held by the Company and other assets of administrative departments.
(6) Consolidated segment profit is equal to operating income in the consolidated statement of income.
* * * * * *


