2
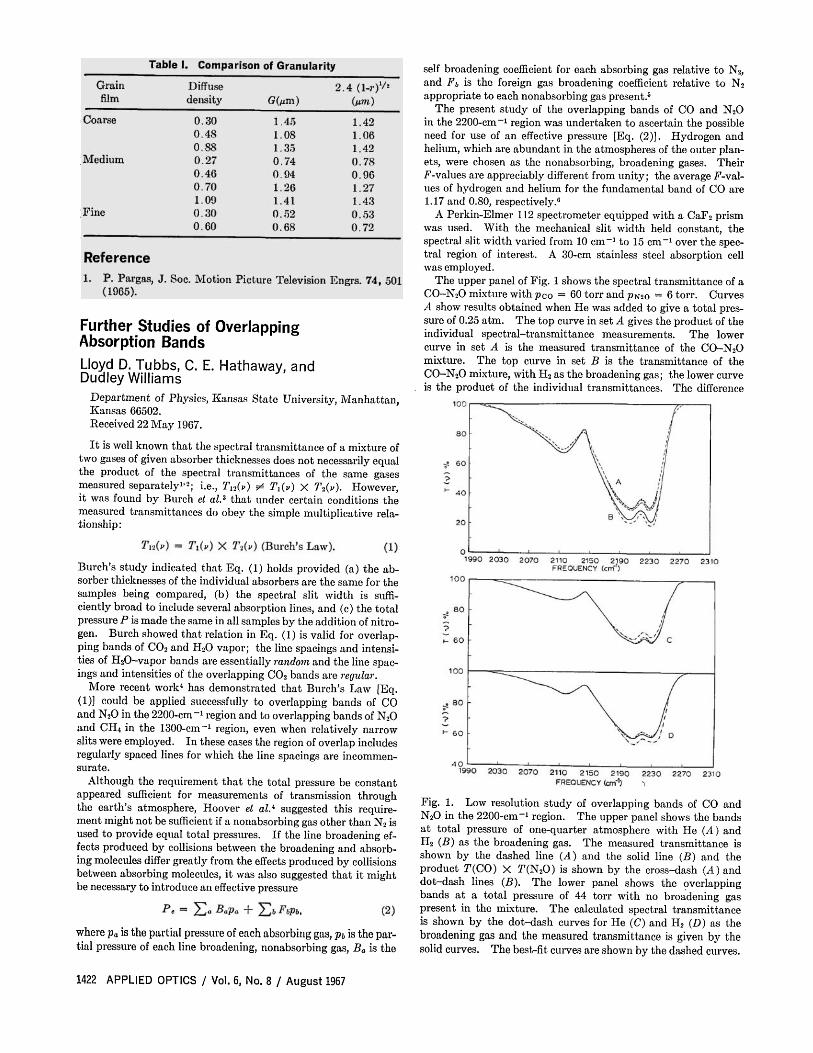
Further Studies of Overlapping Absorption Bands Lloyd D. Tubbs, C. E. Hathaway, and Dudley Williams Department of Physics, Kansas State University, Manhattan, Kansas 66502. Received 22 May 1967. It is well known that the spectral transmittance of a mixture of two gases of given absorber thicknesses does not necessarily equal the product of the spectral transmittances of the same gases measured separately 1 ' 2 ; i.e.,T 12 (p) ≠ T 1 ( v ) × T 2 (v). However, it was found by Burch el al. 3 that under certain conditions the measured transmittances do obey the simple multiplicative rela- tionship : Burch's study indicated that Eq. (1) holds provided (a) the ab- sorber thicknesses of the individual absorbers are the same for the samples being compared, (b) the spectral slit width is suffi- ciently broad to include several absorption lines, and (c) the total pressure P is made the same in all samples by the addition of nitro- gen. Burch showed that relation in Eq. (1) is valid for overlap- ping bands of CO 2 and H 2 O vapor; the line spacings and intensi- ties of H 2 O–vapor bands are essentially random and the line spac- ings and intensities of the overlapping CO 2 bands are regular. More recent work 4 has demonstrated that Burch's Law [Eq. (1)] could be applied successfully to overlapping bands of CO and N 2 O in the 2200-cm –1 region and to overlapping bands of N 2 O and CH 4 in the 1300-cm –1 region, even when relatively narrow slits were employed. In these cases the region of overlap includes regularly spaced lines for which the line spacings are incommen- surate. Although the requirement that the total pressure be constant appeared sufficient for measurements of transmission through the earth's atmosphere, Hoover et al. 4 suggested this require- ment might not be sufficient if a nonabsorbing gas other than N 2 is used to provide equal total pressures. If the line broadening ef- fects produced by collisions between the broadening and absorb- ing molecules differ greatly from the effects produced by collisions between absorbing molecules, it was also suggested that it might be necessary to introduce an effective pressure where p a is the partial pressure of each absorbing gas, p b is the par- tial pressure of each line broadening, nonabsorbing gas, B a is the 1422 APPLIED OPTICS / Vol. 6, No. 8 / August 1967 self broadening coefficient for each absorbing gas relative to N 2, and F b is the foreign gas broadening coefficient relative to N 2 appropriate to each nonabsorbing gas present. 5 The present study of the overlapping bands of CO and N 2 O in the 2200-cm –1 region was undertaken to ascertain the possible need for use of an effective pressure [Eq. (2)]. Hydrogen and helium, which are abundant in the atmospheres of the outer plan- ets, were chosen as the nonabsorbing, broadening gases. Their .F-values are appreciably different from unity; the average F-val- ues of hydrogen and helium for the fundamental band of CO are 1.17 and 0.80, respectively. 6 A Perkin-Elmer 112 spectrometer equipped with a CaF 2 prism was used. With the mechanical slit width held constant, the spectral slit width varied from 10 cm –1 to 15 cm –1 over the spec- tral region of interest. A 30-cm stainless steel absorption cell was employed. The upper panel of Fig. 1 shows the spectral transmittance of a CO–N 2 O mixture with p Co = 60 torr and p N2o = 6 torr. Curves A show results obtained when He was added to give a total pres- sure of 0.25 atm. The top curve in set A gives the product of the individual spectral-transmittance measurements. The lower curve in set A is the measured transmittance of the CO–N 2 O mixture. The top curve in set B is the transmittance of the CO–N 2 O mixture, with H 2 as the broadening gas; the lower curve is the product of the individual transmittances. The difference Fig. 1. Low resolution study of overlapping bands of CO and N 2 O in the 2200-cm -1 region. The upper panel shows the bands at total pressure of one-quarter atmosphere with He (A) and H 2 (B) as the broadening gas. The measured transmittance is shown by the dashed line (A) and the solid line (B) and the product T(CO) × T(N 2 O) is shown by the cross–dash (A) and dot–dash lines (B). The lower panel shows the overlapping bands at a total pressure of 44 torr with no broadening gas present in the mixture. The calculated spectral transmittance is shown by the dot–dash curves for He (C) and H 2 (D) as the broadening gas and the measured transmittance is given by the solid curves. The best-fit curves are shown by the dashed curves.