Page 1
EJERS, European Journal of Engineering Research and Science Vol. 4, No. 9, September 2019
DOI: http://dx.doi.org/10.24018/ejers.2019.4.9.1549 224
Abstract—According to NEC 240.101 regulations each and
every component of a power system distribution network has
to have an over-current protective device (OCPD) for its
protection. The OCPDs must coordinate with other devices
both upstream and downstream for a reliable operation and
protection of the power systems distribution network. There
are four equipment/components for the IEEE 13 node radial
test feeder each modelled in this paper to be protected by fuses.
These components are namely the nodes, the underground
cables, the overhead distribution lines and the transformers.
Equipment protection is an important and necessary exercise
of performing power systems protection coordination
processes. The equipment and their over-current protective
device’s time-current characteristic (TCC) curves are
important tools used to show and to indicate the protection
requirements, landmark points and damage curves for all
power systems equipment. Individual equipment protection
requirements and limitations are described and identified by
use of their various landmarks and damage curves. These
damage curves and the landmark points are all superimposed
with the Time-Current Characteristic curves of the Over-
Current Protective Devices used in protecting the equipment
on one composite TCC graph. Equipment damage curves
which fall to the right and above the Over-Current Protective
Device’s TCC curves with sufficient margins are considered to
be protected by the OCPDs. Equipment damage curves which
fall to the left and below the OCPD’s TCC curves are
considered not to be protected by the OCPDs. IEEE Standard
241 states that on all power systems, the OCPDs should be
selected and set to open before the Ampacity mark, the short
circuit damage curves, and both the thermal and the
mechanical damage curves limits of the protected components
are exceeded. This paper presents a detailed Fuse-Fuse
protection scheme for the IEEE 13 node radial test feeder as
modeled on the Electrical Transients Analysis Program
(ETAP).
Index Terms—Transformer Magnetizing In-rush Points,
Transformer Thermal Damage Curves, Transformer
Mechanical Damage Curves, Transformer Full Load Ampere
Mark, Conductor Intermediate Thermal Overload Limit
Curves, Conductor Short Circuit Damage Curves, Fuse TCC
Curves, Equipment TCC Curves.
I. DISTRIBUTION EQUIPMENT PROTECTION REQUIREMENTS
In order to effectively protect a power systems
distribution network and implement the fuse-fuse protection
scheme, .NEC article 240-101 states that “Feeders Rated
Over 1000𝑉 must have Over Current Protection Provided
Published on September 29, 2019
Kemei P. Kirui is with the Department of Electrical and Electronic
Engineering, JKUAT, Kenya. (e-mail: [email protected] ) David K. Murage is with the Department of Electrical and Electronic
Engineering, JKUAT, Kenya. (e-mail: [email protected] )
Peter K Kihato is with the Department of Electrical and Electronic
Engineering, JKUAT, Kenya. (e-mail: [email protected] )
either by a Fuse rated not more than 300 Percent of the
Feeder Ampacity or by a Circuit Breaker with a Long Time
Trip Element Set not more than 600% of the Feeder
Ampacity” [1].These OCPDs must clear the faults prior to
reaching the withstand capability of the equipment to be
protected. Therefore, the OCPDs must be set to provide
over-current protection as per the NEC 240.101
requirements and also to provide overload withstand
protection as per ANSI/IEEE regulations [2]. The NEC
240.101 requirements states that:
The ratings of a fuse used to protect an underground
cable electrical conductor should not be more than
100% of the cables’ ampacity. [2].
The ratings of a fuse used to protect an overhead
electrical conductor should not be more than 300% of
the electrical conductor’s ampacity. [2].
Transformer protective devices must be set within the
𝑁𝐸𝐶 450.3 requirements for transformer overload
protection to allow the normal magnetizing inrush currents
to flow [3]. The transformer primary side protective devices
must not operate for the normal magnetizing inrush currents
that occur when energizing the transformer [3]. The
magnetizing inrush points are established at 8 times the
transformer full load current (FLA) for a period of 0.1
seconds for transformers under 2500𝑘𝑉𝐴 and for
transformers above 2500𝑘𝑉𝐴 the inrush point is at 10 or 12
times the transformer FLA for a period of 0.1 seconds
[4][5]. The transformer protection coordination constraints
are [5]:
Transformers having percentage impedance less than
10% the primary/source side protection must have an
upstream fuse rated at 300% of the transformer full
load currents.
Transformers rated over 1000𝑉 on the
secondary/load side and having percentage
impedance less than 6% the load side protection
must have a downstream fuse rated at 250% of the
transformer full load currents.
Transformers rated over 1000𝑉 on the
secondary/load side and having percentage
impedance between 6% − 10% the load side
protection must have a downstream fuse rated
at 225% of the transformer full load currents.
Transformers rated less than 1000𝑉 on the
secondary/load side and having percentage
impedance less than 10% the load side protection
must have a downstream fuse rated at 125% of the
transformer full load currents.
Fuse-Fuse Protection Scheme ETAP Model for IEEE 13
Node Radial Test Distribution Feeder
Kemei Peter Kirui, David K. Murage, and Peter K Kihato
Page 2
EJERS, European Journal of Engineering Research and Science Vol. 4, No. 9, September 2019
DOI: http://dx.doi.org/10.24018/ejers.2019.4.9.1549 225
II. EQUIPMENT PROTECTION REQUIREMENTS, LANDMARKS
AND DAMAGE CURVES
A. Transformer Protection Requirements.
Even though transformers are the simplest and most
reliable devices in an electrical power system, transformer
failures can occur due to internal or external conditions that
make the transformer incapable of performing its proper
functions. Appropriate transformer protection should be
used with the objectives of protecting the electrical power
system in case of a transformer failure and also to protect
the transformer itself from the power system disturbances
like the faults.
1) The Transformer Full Load Ampere (FLA)
The full load ampere (FLA) is the rated continuous
current carrying capacity of a transformer at a referenced
ambient temperature and allowable temperature rise. The
FLA mark is located on the transformer TCC log-log graph
at the top decade at the 1000 seconds mark as seen from Fig
1. [6].
2) The Transformer Through-Fault Damage Curves
Transformer through-fault damage curves are plotted at
the top three decades of the transformer TCC log-log graph
from the 2 seconds mark to the 1000 seconds mark. The
transformer through fault damage curves are both the
thermal and mechanical damage curves as seen from Fig 1.
[6].
3) The Transformer Magnetizing Inrush Current
Point(s)
One or more transformer magnetizing inrush current
points may be plotted on a TCC for a power transformer.
These magnetizing inrush currents points are expressed in
peak amperes with the most common point being at 8 or 12
times the rated FLA at 0.1 seconds mark and at 25 times of
the rated FLA at 0.01 seconds mark. [6].
4) Transformer Protection Settings (From Fig 2)
Step 1: Identify the Transformer TCC Curve Landmarks
• The Full Load Ampere point which is located at the
upper decade at the 1000seconds mark.
• The Thermal Damage Curve which is located in the
upper 3 decades starting at the 2 seconds mark to the
1000seconds mark
• The Mechanical Damage Curve which is located in the
middle decade between the 2 seconds mark and the 4
seconds mark.
•The magnetizing inrush point defined at 8 or 12 times the
FLA located at the 0.1 seconds mark and at the 25
times of the FLA mark located at the 0.01 seconds
mark.
Step 2: Identify from the TCC Curves the Transformer
Operating Area
• The transformer operating area is located to the left and
below the full load ampere mark and also to the left
and below the transformer magnetizing inrush points
• The transformer damage area is located to the right and
above the through-fault damage curves both the
thermal damage curve and the mechanical damage
curve.
Step 3: Size and Set the Over-Current Protective Devices
Set the protective device’s TCC Curves above the
transformer full load ampere mark and also above the
transformer magnetizing inrush points. [7]..
Set the protective device’s TCC Curves below both
the transformer thermal and mechanical through-fault
damage curves
Fig. 1. Transformer Full Load Ampere Mark, Magnetizing Inrush Points,
Mechanical and Thermal Damage Curves
Fig 2: Transformer Over-Current Protective Devices TCC Setting Curves
B. Overhead Lines/Underground Cables Conductor
Protection Requirements.
1) The Overhead Transmission Lines/Underground
Cables Conductor Ampacity
The ampacity is the rated continuous current carrying
capacity of a conductor at a referenced ambient temperature
and allowable temperature rise. If a conductor is loaded
continuously above its rated ampacity the insulation
temperature design limits will be exceeded. This will lead to
loss of conductor life and not instantaneous failure. The
electrical conductor ampacity landmark is located at the top
decade of the TCC curve of the conductor material at the
1000 seconds mark as seen from Fig 3. [6].
2) Overhead Lines/Underground Cables Conductor
Intermediate Thermal Overload Limit Curve.
The intermediate thermal overload limit curves of an
electrical conductor are the over-current operating limits that
Page 3
EJERS, European Journal of Engineering Research and Science Vol. 4, No. 9, September 2019
DOI: http://dx.doi.org/10.24018/ejers.2019.4.9.1549 226
if exceeded will damage the insulation of an insulated power
conductor. Intermediate thermal overload limit curves are
based on the thermal inertia of the conductor, the insulation
and the surrounding material. The electrical conductor
intermediate overload limit curve is located at the upper 2
decades of its TCC Curves starting from the 10 seconds
mark to the 1000seconds mark as seen from Fig 3. [6].
3) Overhead Lines/Underground Cables Conductor
Short Circuit Damage Curve.
This is the ampere limit that if exceeded will damage the
bare aerial conductor or the insulation of an insulated power
conductor. Short circuit damage curve is plotted in the lower
three decades of the conductor TCC curve starting at the
0.01 seconds mark to the 10 seconds mark as seen from Fig
3. [6].
4) Overhead Lines/Underground Cables Conductor
Protection Settings.(From Fig 4)
Step 1: Identify the Conductor Protection Landmarks
• The conductor ampacity mark which is located in the
upper decade at the 1000 seconds mark
• The conductor intermediate thermal overload limit curve
which is located in the upper two decades (typically
not shown) starting at the 10seconds mark to the
1000seconds mark
• The conductor short circuit damage curve which is
located at the bottom three decades between the 0.01
seconds mark and 10 seconds mark.
Step 2: Identify from the Protection Landmarks the
Conductor Operating Area
• The conductor operating area is located to the left and
below the ampacity mark
• The conductor damage area is located to the right and
above the intermediate thermal overload limit curve
and also the short circuit damage curve.
Step 3: Size and Set the Over-Current Protective Devices
• Set the protective device’s TCC curves to pick-up at or
below the ampacity mark, conductor intermediate
thermal overload limit curve and the conductor short
circuit damage curve. [8].
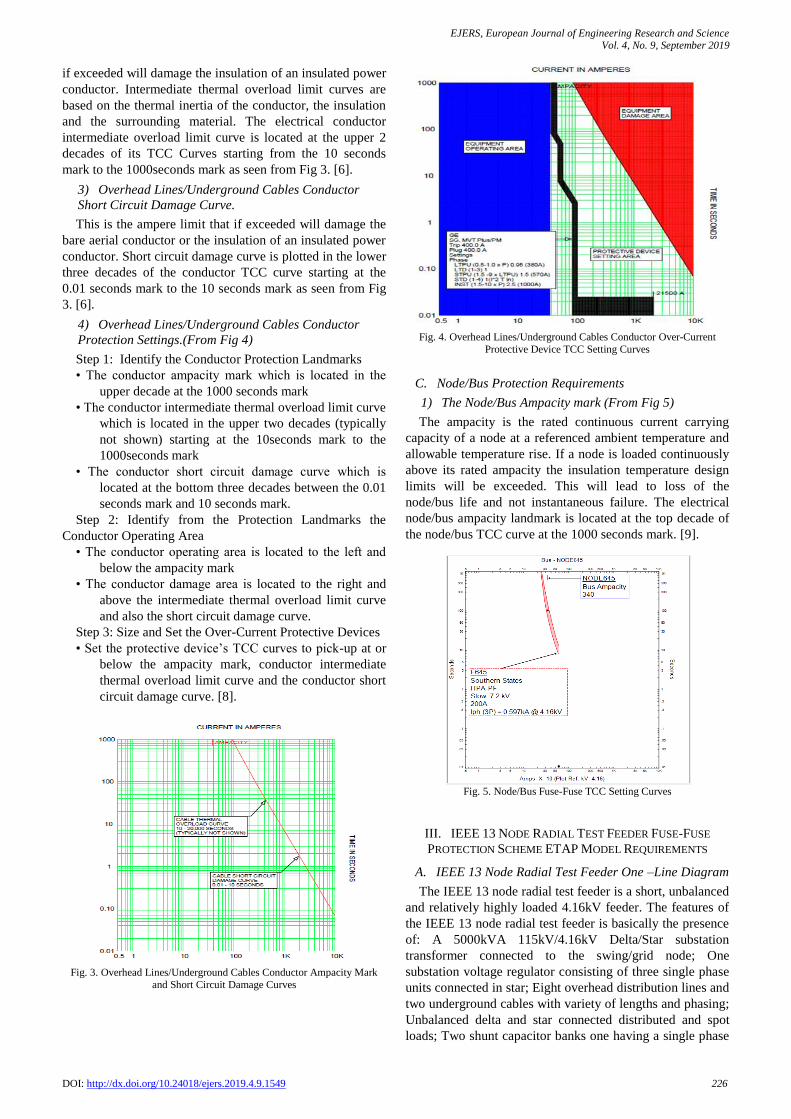
Fig. 3. Overhead Lines/Underground Cables Conductor Ampacity Mark
and Short Circuit Damage Curves
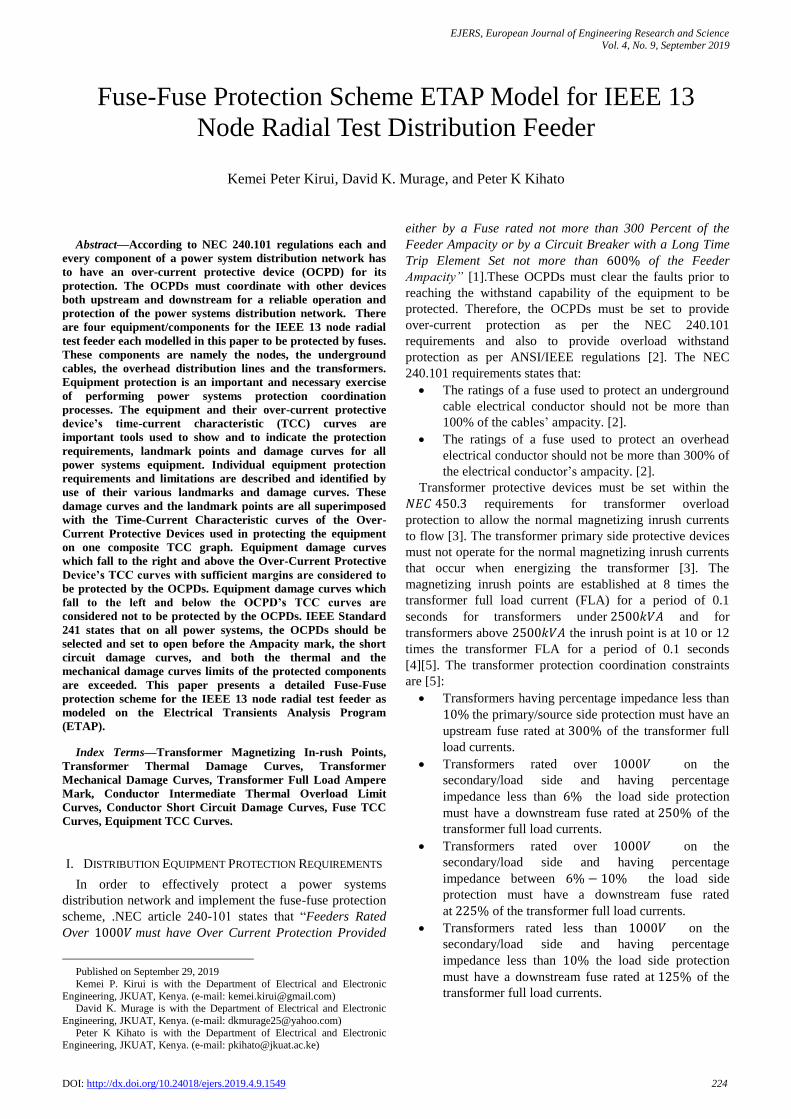
Fig. 4. Overhead Lines/Underground Cables Conductor Over-Current
Protective Device TCC Setting Curves
C. Node/Bus Protection Requirements
1) The Node/Bus Ampacity mark (From Fig 5)
The ampacity is the rated continuous current carrying
capacity of a node at a referenced ambient temperature and
allowable temperature rise. If a node is loaded continuously
above its rated ampacity the insulation temperature design
limits will be exceeded. This will lead to loss of the
node/bus life and not instantaneous failure. The electrical
node/bus ampacity landmark is located at the top decade of
the node/bus TCC curve at the 1000 seconds mark. [9].
Fig. 5. Node/Bus Fuse-Fuse TCC Setting Curves
III. IEEE 13 NODE RADIAL TEST FEEDER FUSE-FUSE
PROTECTION SCHEME ETAP MODEL REQUIREMENTS
A. IEEE 13 Node Radial Test Feeder One –Line Diagram
The IEEE 13 node radial test feeder is a short, unbalanced
and relatively highly loaded 4.16kV feeder. The features of
the IEEE 13 node radial test feeder is basically the presence
of: A 5000kVA 115kV/4.16kV Delta/Star substation
transformer connected to the swing/grid node; One
substation voltage regulator consisting of three single phase
units connected in star; Eight overhead distribution lines and
two underground cables with variety of lengths and phasing;
Unbalanced delta and star connected distributed and spot
loads; Two shunt capacitor banks one having a single phase
Page 4
EJERS, European Journal of Engineering Research and Science Vol. 4, No. 9, September 2019
DOI: http://dx.doi.org/10.24018/ejers.2019.4.9.1549 227
connection at node 611 and the other a three phase
connection at node 675; and a 500kVA 4.16kV/0.48kV
star/star solidly grounded in-line transformer connected
between node 633 and node 634. Fig 6 shows the schematic
layout of the IEEE 13 node radial test feeder used as the
model which was simulated without showing the nature and
configuration of the distribution components of the network
[10].
Fig. 6. The IEEE 13 Node Radial Test Feeder Schematic Diagram
IEEE 13 node radial test feeder was modeled using ETAP
electrical simulation software. A one-line diagram was
drawn for the feeder and fuses modeled as both the upstream
and downstream OCPDs for protecting the radial test feeder
as shown in Fig 7. A protection scheme utilizing a total of
23 fuses was modeled for the feeder protection. Each
component on the feeder had a fuse as its downstream
OCPD with the fuse generally referred to as the load fuse.
An upstream fuse was also modeled and set to coordinate
with the downstream fuse for the feeder protection. The
fuse’s current ratings, voltage limits and TCC curves were
carefully selected so that we achieve a selectively
coordinated Fuse-Fuse protection scheme for the feeder.
Fig. 7. IEEE 13 Node Radial Test Feeder Fuse Protection Scheme One-
Line Diagram
B. Overhead Lines Primary Protection Requirements,
Ampacity Mark, Damage Curves and Protective Devices
Curves
All the overhead distribution lines segments were given
specific identification names with the codes chosen with
reference to the node points the lines have been connected in
between. Each fuse was given a unique identification code
based on the line segment reference it is protecting. The
upstream fuse was given a code describing the two node
points between which the distribution line has been
connected on to and the downstream fuse was given a code
based on the node the line has been terminated at. Table 1
gives the identification codes for all the fuses used to protect
the eight overhead distribution lines. Every overhead line
was protected by two fuses one connected at the source node
referred to as the upstream fuse and the other connected at
the load node and referred to as the downstream fuse.
TABLE I: OVERHEAD LINES PRIMARY PROTECTIVE FUSES
Line Segment Source Node
Load Node
Upstream Fuse
Downstream Fuse
LINE632-645 632 645 F632-645 F645
LINE632-633 632 633 F632-633 F633
LINE645-646 645 646 F645-646 F646
LINE650-632 650 632 F650-632 F632
LINE632-671 632 671 F632-671 F671
LINE671-684 671 684 F671-684 F684
LINE671-680 671 680 F671-680 F680
LINE684-611 684 611 F684-611 F611
1) LINE632-633 Protection Requirements, Ampacity
Mark and Damage Curves
It is an overhead three phase distribution line connecting
the branch segment between node 632 and node 633. The
line phase conductors have ampacities of 340𝐴𝑚𝑝𝑒𝑟𝑒𝑠 and
are each protected by two fuses. The upstream fuse is F632-
633 and the downstream fuse is F633. The TCC Curve for
the overhead phase conductors and its protective fuses is
shown in Fig 8. The TCC curve shows the conductor
ampacity of 340𝐴 located at the upper decade at the 1000
seconds mark of the TCC curve and the conductor short
circuit damage curve located at the bottom three decades
starting from the 0.01 seconds mark to the 10seconds mark.
From the TCC curve, the fuse’s TCC trip curves are both
below and to the left of the line’s ampacity mark, its
intermediate thermal overload limit curve and its short
circuit damage curve hence the overhead line is well
protected by the fuses. Fuse F632-633 has a continuous
current rating of 250A and is within the NEC 240.101
maximum limit of the line conductor’s 300% ampacity of
1020A. Fuse F633 also has a continuous current rating of
150A which is within the NEC 240.101 maximum limit of
the overhead line conductor’s 300% ampacity of 1020A.
Fig. 8: LINE632-633 Ampacity Mark, Short Circuit Damage Curve and
Fuses F632-633 and F633 Trip Curves.
2) LINE632-645 Protection Requirements, Ampacity
Mark and Damage Curves
This is an overhead three phase distribution line
Page 5
EJERS, European Journal of Engineering Research and Science Vol. 4, No. 9, September 2019
DOI: http://dx.doi.org/10.24018/ejers.2019.4.9.1549 228
connecting the branch segment between node 632 and node
645. The line phase conductors have ampacities
of 340𝐴𝑚𝑝𝑒𝑟𝑒𝑠 and are each protected by two fuses. The
upstream protective device is fuse F632-645 and the
downstream protective device is fuse F645. The TCC Curve
for the overhead distribution line phase conductor and its
protective fuses is shown in Fig 9. The TCC curve shows
the overhead conductor ampacity of 340𝐴 located at the
upper decade at the 1000 seconds mark of the TCC curve
and the its short circuit damage curve is located at the
bottom three decades starting at the 0.01seconds mark to the
10seconds mark. From the TCC curve, the fuse’s TCC trip
curves are both below and to the left of the line’s ampacity
mark, its intermediate thermal overload limit curve and its
short circuit damage curve hence the overhead line is well
protected by the fuses. Fuse F632-645 has a continuous
current rating of 250A which is within the NEC 240.101
maximum limit of the line conductor’s 300% ampacity of
1020A. Fuse F645 also has a continuous current rating of
200A which is within the NEC 240.101 maximum limit of
the overhead line conductor’s 300% ampacity of 1020A.
Fig. 9: LINE632-645 Ampacity Mark, Short Circuit Damage Curve and
Fuses F632-645 and F645 Trip Curves.
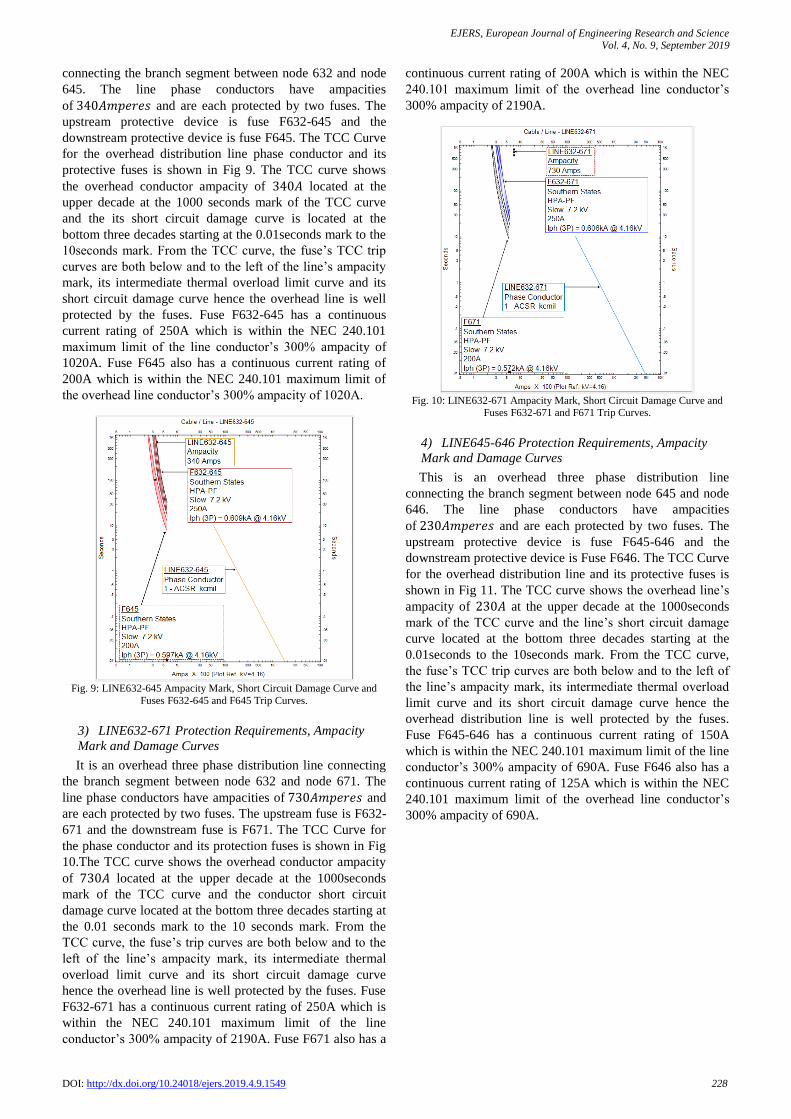
3) LINE632-671 Protection Requirements, Ampacity
Mark and Damage Curves
It is an overhead three phase distribution line connecting
the branch segment between node 632 and node 671. The
line phase conductors have ampacities of 730𝐴𝑚𝑝𝑒𝑟𝑒𝑠 and
are each protected by two fuses. The upstream fuse is F632-
671 and the downstream fuse is F671. The TCC Curve for
the phase conductor and its protection fuses is shown in Fig
10.The TCC curve shows the overhead conductor ampacity
of 730𝐴 located at the upper decade at the 1000seconds
mark of the TCC curve and the conductor short circuit
damage curve located at the bottom three decades starting at
the 0.01 seconds mark to the 10 seconds mark. From the
TCC curve, the fuse’s trip curves are both below and to the
left of the line’s ampacity mark, its intermediate thermal
overload limit curve and its short circuit damage curve
hence the overhead line is well protected by the fuses. Fuse
F632-671 has a continuous current rating of 250A which is
within the NEC 240.101 maximum limit of the line
conductor’s 300% ampacity of 2190A. Fuse F671 also has a
continuous current rating of 200A which is within the NEC
240.101 maximum limit of the overhead line conductor’s
300% ampacity of 2190A.
Fig. 10: LINE632-671 Ampacity Mark, Short Circuit Damage Curve and
Fuses F632-671 and F671 Trip Curves.
4) LINE645-646 Protection Requirements, Ampacity
Mark and Damage Curves
This is an overhead three phase distribution line
connecting the branch segment between node 645 and node
646. The line phase conductors have ampacities
of 230𝐴𝑚𝑝𝑒𝑟𝑒𝑠 and are each protected by two fuses. The
upstream protective device is fuse F645-646 and the
downstream protective device is Fuse F646. The TCC Curve
for the overhead distribution line and its protective fuses is
shown in Fig 11. The TCC curve shows the overhead line’s
ampacity of 230𝐴 at the upper decade at the 1000seconds
mark of the TCC curve and the line’s short circuit damage
curve located at the bottom three decades starting at the
0.01seconds to the 10seconds mark. From the TCC curve,
the fuse’s TCC trip curves are both below and to the left of
the line’s ampacity mark, its intermediate thermal overload
limit curve and its short circuit damage curve hence the
overhead distribution line is well protected by the fuses.
Fuse F645-646 has a continuous current rating of 150A
which is within the NEC 240.101 maximum limit of the line
conductor’s 300% ampacity of 690A. Fuse F646 also has a
continuous current rating of 125A which is within the NEC
240.101 maximum limit of the overhead line conductor’s
300% ampacity of 690A.
Page 6
EJERS, European Journal of Engineering Research and Science Vol. 4, No. 9, September 2019
DOI: http://dx.doi.org/10.24018/ejers.2019.4.9.1549 229
Fig. 11: LINE645-646 Ampacity Mark, Short Circuit Damage Curve and
Fuses F645-646 and F646 Trip Curves.
5) LINE650-632 Protection Requirements, Ampacity
Mark and Damage Curves
This is an overhead three phase distribution line
connecting the branch segment between node 650 and node
632. The line phase conductors have ampacities
of 730𝐴𝑚𝑝𝑒𝑟𝑒𝑠 and are each protected by two fuses. The
upstream protective device is fuse F650-632 and the
downstream protective device is Fuse F632. The TCC Curve
for the overhead distribution line and its protective fuses is
shown in Fig 12.The TCC curve shows the overhead phase
conductors ampacity of 730𝐴 at the upper decade at the
1000seconds mark of the TCC curve and the line’s short
circuit damage curve located at the bottom three decades
starting at the 0.01seconds mark up to the 10seconds mark.
From the TCC curve, the fuse’s TCC trip curves are both
below and to the left of the line’s ampacity mark, its
intermediate thermal overload limit curve and its short
circuit damage curve hence the overhead line is well
protected by the fuses. Fuse F650-632 has a continuous
current rating of 350A which is within the NEC 240.101
maximum limit of the line conductor’s 300% ampacity of
2190A. Fuse F632 also has a continuous current rating of
300A which is within the NEC 240.101 maximum limit of
the overhead line conductor’s 300% ampacity of 2190A.
Fig. 12: LINE650-632 Ampacity Mark, Short Circuit Damage Curve and
Fuses F650-632 and F632 Trip Curves.
6) LINE671-680 Protection Requirements, Ampacity
Mark and Damage Curves
This is an overhead three phase distribution line
connecting the branch segment between node 671 and node
680. The line phase conductors have ampacities
of 730𝐴𝑚𝑝𝑒𝑟𝑒𝑠 and are each protected by two fuses. The
upstream protective device is fuse F671-680 and the
downstream protective device is fuse F680. The TCC Curve
for the overhead distribution line phase conductor and its
protective fuses is shown in Fig 13.The TCC curve shows
the overhead line’s ampacity of 730𝐴 at the upper decade at
1000seconds mark of the TCC curve and the line’s short
circuit damage curve located at the bottom three decades
starting at the 0.01seconds mark to the 10seconds mark.
From the TCC curve, the fuse’s TCC trip curves are both
below and to the left of the line’s ampacity mark, its
intermediate thermal overload limit curve and its short
circuit damage curve hence the overhead line is well
protected by the fuses. Fuse F671-680 has a continuous
current rating of 150A which is within the NEC 240.101
maximum limit of the line conductor’s 300% ampacity of
2190A. Fuse F680 also has a continuous current rating of
125A which is within the NEC 240.101 maximum limit of
the overhead line conductor’s 300% ampacity of 2190A.
Fig. 13: LINE671-680 Ampacity Mark, Short Circuit Damage Curve and
Fuses F671-680 and F680 Trip Curves.
7) LINE671-684 Protection Requirements, Ampacity
Mark and Damage Curves
This is an overhead three phase distribution line
connecting the branch segment between node 671 and node
684. The line phase conductors have ampacities
of 230𝐴𝑚𝑝𝑒𝑟𝑒𝑠 and are each protected by two fuses. The
upstream protective device is fuse F671-684 and the
downstream protective device is Fuse F684. The TCC Curve
for the overhead distribution line phase conductor and its
protective fuses is shown in Fig 14.The TCC curve shows
the overhead line’s ampacity of 230𝐴 at the upper decade at
the 1000seconds mark of the TCC curve and the line’s short
circuit damage curve located at the bottom three decades
starting at the 0.01seconds to the 10 seconds mark. From the
TCC curve, the fuse’s TCC trip curves are both below and
to the left of the line’s ampacity mark, its intermediate
thermal overload limit curve and its short circuit damage
Page 7
EJERS, European Journal of Engineering Research and Science Vol. 4, No. 9, September 2019
DOI: http://dx.doi.org/10.24018/ejers.2019.4.9.1549 230
curve hence the overhead line is well protected by the fuses.
Fuse F671-684 has a continuous current rating of 150A
which is within the NEC 240.101 maximum limit of the line
conductor’s 300% ampacity of 690A. Fuse F684 also has a
continuous current rating of 125A which is within the NEC
240.101 maximum limit of the overhead line conductor’s
300% ampacity of 690A.
Fig. 14: LINE671-684 Ampacity Mark, Short Circuit Damage Curve and
Fuses F671-684 and F684 Trip Curves.
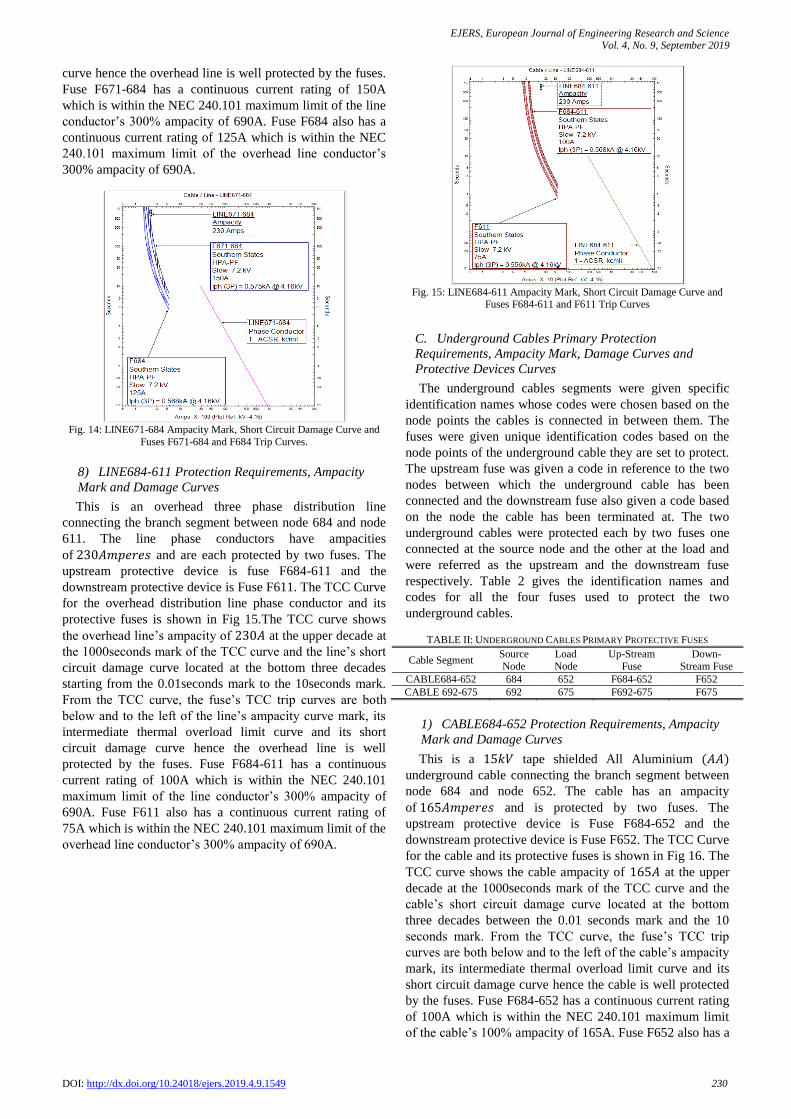
8) LINE684-611 Protection Requirements, Ampacity
Mark and Damage Curves
This is an overhead three phase distribution line
connecting the branch segment between node 684 and node
611. The line phase conductors have ampacities
of 230𝐴𝑚𝑝𝑒𝑟𝑒𝑠 and are each protected by two fuses. The
upstream protective device is fuse F684-611 and the
downstream protective device is Fuse F611. The TCC Curve
for the overhead distribution line phase conductor and its
protective fuses is shown in Fig 15.The TCC curve shows
the overhead line’s ampacity of 230𝐴 at the upper decade at
the 1000seconds mark of the TCC curve and the line’s short
circuit damage curve located at the bottom three decades
starting from the 0.01seconds mark to the 10seconds mark.
From the TCC curve, the fuse’s TCC trip curves are both
below and to the left of the line’s ampacity curve mark, its
intermediate thermal overload limit curve and its short
circuit damage curve hence the overhead line is well
protected by the fuses. Fuse F684-611 has a continuous
current rating of 100A which is within the NEC 240.101
maximum limit of the line conductor’s 300% ampacity of
690A. Fuse F611 also has a continuous current rating of
75A which is within the NEC 240.101 maximum limit of the
overhead line conductor’s 300% ampacity of 690A.
Fig. 15: LINE684-611 Ampacity Mark, Short Circuit Damage Curve and
Fuses F684-611 and F611 Trip Curves
C. Underground Cables Primary Protection
Requirements, Ampacity Mark, Damage Curves and
Protective Devices Curves
The underground cables segments were given specific
identification names whose codes were chosen based on the
node points the cables is connected in between them. The
fuses were given unique identification codes based on the
node points of the underground cable they are set to protect.
The upstream fuse was given a code in reference to the two
nodes between which the underground cable has been
connected and the downstream fuse also given a code based
on the node the cable has been terminated at. The two
underground cables were protected each by two fuses one
connected at the source node and the other at the load and
were referred as the upstream and the downstream fuse
respectively. Table 2 gives the identification names and
codes for all the four fuses used to protect the two
underground cables.
TABLE II: UNDERGROUND CABLES PRIMARY PROTECTIVE FUSES
Cable Segment Source
Node
Load
Node
Up-Stream
Fuse
Down-
Stream Fuse
CABLE684-652 684 652 F684-652 F652
CABLE 692-675 692 675 F692-675 F675
1) CABLE684-652 Protection Requirements, Ampacity
Mark and Damage Curves
This is a 15𝑘𝑉 tape shielded All Aluminium (𝐴𝐴)
underground cable connecting the branch segment between
node 684 and node 652. The cable has an ampacity
of 165𝐴𝑚𝑝𝑒𝑟𝑒𝑠 and is protected by two fuses. The
upstream protective device is Fuse F684-652 and the
downstream protective device is Fuse F652. The TCC Curve
for the cable and its protective fuses is shown in Fig 16. The
TCC curve shows the cable ampacity of 165𝐴 at the upper
decade at the 1000seconds mark of the TCC curve and the
cable’s short circuit damage curve located at the bottom
three decades between the 0.01 seconds mark and the 10
seconds mark. From the TCC curve, the fuse’s TCC trip
curves are both below and to the left of the cable’s ampacity
mark, its intermediate thermal overload limit curve and its
short circuit damage curve hence the cable is well protected
by the fuses. Fuse F684-652 has a continuous current rating
of 100A which is within the NEC 240.101 maximum limit
of the cable’s 100% ampacity of 165A. Fuse F652 also has a
Page 8
EJERS, European Journal of Engineering Research and Science Vol. 4, No. 9, September 2019
DOI: http://dx.doi.org/10.24018/ejers.2019.4.9.1549 231
continuous current rating of 75A which is within the NEC
240.101 maximum limit of the cable’s 100% ampacity of
165A.
Fig 16: CABLE684-652 Ampacity Mark, Short Circuit Damage Curve and
Fuses F684-652 and F652 Trip Curves.
2) CABLE 692-675 Protection Requirements, Ampacity
Mark and Damage Curves
This is a 15𝑘𝑉 concentric All Aluminium (𝐴𝐴)
underground cable connecting the branch segment between
node 692 and node 675. The cable has an ampacity
of 260𝐴𝑚𝑝𝑒𝑟𝑒𝑠 and is protected by two fuses. The
upstream protective device is fuse F692-675 and the
downstream protective device is Fuse F675. The TCC Curve
for the cable and its protective fuses is shown in Fig 17.The
TCC curve shows the cable ampacity of 260𝐴 at the upper
decade at the 1000seconds mark of the TCC curve and the
cable’s short circuit damage curve located at the bottom
three decades starting from the 0.01seconds mark to the 10
seconds mark. From the TCC curve, the fuse’s TCC trip
curves are both below and to the left of the cable’s ampacity
mark, its intermediate thermal overload limit curve and its
short circuit damage curve hence the cable is well protected
by the fuses. Fuse F692-675 has a continuous current rating
of 150A which is within the NEC 240.101 maximum limit
of the cable’s 100% ampacity of 260A. Fuse F675 also has a
continuous current rating of 125A which is within the NEC
240.101 maximum limit of the cable’s 100% ampacity of
260A.
Fig. 17: CABLE692-675 Ampacity Mark, Short Circuit Damage Curve and
Fuses F692-675 and F675 Trip Curves
D. Node Primary Protection Requirements, Ampacity
Mark and Protective Devices Curves
All the 13 nodes were protected by a fuse. Table 3 gives
the individual identification of all the 13 fuses used to
protect the 13 nodes of the radial test feeder. Every node
was given an identification code based on its reference
numbers from the IEEE 13 node radial test feeder schematic
diagram of Fig 6. The fuses also were given codes
synonymous to the codes used in identifying the nodes.
TABLE III: BUS/NODES PRIMARY PROTECTIVE FUSES
NODE ID Node Protective Device
NODE611 F611
NODE632 F632
NODE633 F633
NODE634 F634
NODE645 F645
NODE646 F646
NODE650 F650
NODE652 F652
NODE671 F671
NODE675 F675
NODE680 F680
NODE684 F684
NODE692 F692
1) NODE611 Protection Requirements, Ampacity Mark
and Protective Devices Curves
This is a 4.16𝑘𝑉 node with an ampacity of 230A and is
protected by Fuse F611 having a continuous current rating
of 75A.From the TCC protection coordination curve of Fig
18, the trip curve for Fuse F611 is located below and to the
left of the node 611 ampacity mark at 1000 seconds point at
the upper decade hence the node is protected by the fuse.
Fig. 18: NODE611 Ampacity Mark and Fuse F611 TCC Protection Curve
2) NODE632 Protection Requirements, Ampacity Mark
and Protective Devices Curves
This is a 4.16𝑘𝑉 node with an ampacity of 730A and is
protected by Fuse F632 having a continuous current
rating of 300A.From the TCC protection coordination
curve of Fig 19. for the node, the trip curve for Fuse F632
is located below and to the left of the node’s ampacity
mark at 1000seconds mark at the upper decade hence the
bus is well protected by the fuse.
Page 9
EJERS, European Journal of Engineering Research and Science Vol. 4, No. 9, September 2019
DOI: http://dx.doi.org/10.24018/ejers.2019.4.9.1549 232
Fig. 19: NODE632 Ampacity Mark and Fuse F632 TCC Protection Curve
NODE645 Protection Requirements, Ampacity Mark and
Protective Devices Curves
This is a 4.16𝑘𝑉 node with an ampacity of 340A and is
protected by Fuse F645 having a continuous current rating
of 200A.From the TCC protection coordination curve of Fig
20., the trip curve for Fuse F645 is located below and to the
left of the node’s ampacity mark at 1000seconds mark at the
upper decade hence the bus is well protected by the fuse.
Fig. 20: NODE645 Ampacity Mark and Fuse F645 TCC Protection Curve
3) NODE650 Protection Requirements, Ampacity Mark
and Protective Devices Curves
This is a 4.16𝑘𝑉 node with an ampacity of 750A and is
protected by Fuse F650-632 having a continuous current
rating of 350A.From the TCC protection coordination curve
of Fig 21, the trip curve for fuse F650-632 is located below
and to the left of the node’s ampacity mark at 1000seconds
mark at the upper decade hence the bus is well protected by
the fuse.
Fig. 21: NODE650 Ampacity Mark and Fuse F650-632 TCC Protection
Curve
4) NODE671 Protection Requirements, Ampacity Mark
and Protective Devices Curves
This is a 4.16𝑘𝑉 node with an ampacity of 730A and is
protected by Fuse F671 having a continuous current rating
of 200A.From the TCC protection coordination curve of Fig
22, the trip curve for fuse F671 is located below and to the
left of the node’s ampacity mark at 1000seconds mark at the
upper decade hence the bus is well protected by the fuse
Fig. 22: NODE671 Ampacity Mark and Fuse F671 TCC Protection Curve
5) NODE675 Protection Requirements, Ampacity Mark
and Protective Devices Curves
This is a 4.16𝑘𝑉 node with an ampacity of 300A and is
protected by Fuse F675 having a continuous current rating
of 125A.From the TCC protection coordination curve of Fig
23, the trip curve for fuse F675 is located below and to the
left of the node’s ampacity mark at 1000seconds mark at the
upper decade hence the bus is well protected by the fuse.
Page 10
EJERS, European Journal of Engineering Research and Science Vol. 4, No. 9, September 2019
DOI: http://dx.doi.org/10.24018/ejers.2019.4.9.1549 233
Fig. 23: NODE675 Ampacity Mark and Fuse F675 TCC Protection Curve
6) NODE684 Protection Requirements, Ampacity Mark
and Protective Devices Curves
This is a 4.16𝑘𝑉 node with an ampacity of 230A and is
protected by Fuse F684 having a continuous current rating
of 125A.From the TCC protection coordination curve of Fig
24, the trip curve for fuse F684 is located below and to the
left of the node’s ampacity curve at 1000seconds mark at the
upper decade hence the bus is well protected by the fuse.
Fig. 24: NODE684 Ampacity Mark and Fuse F684 TCC Protection Curve
E. Transformer Primary Protection Requirements, Full
Load Ampere Mark, Magnetizing Inrush Points and
Damage Curves
IEEE 13 node radial test feeder has two transformers one at
the power grid supply side referred to as the substation
transformer T1 connected between the grid node and node
650, and the other connected between nodes 633 and 634
referred to as the In-Line transformer T2. The two
transformers are each protected by two fuses one on the
primary side and the other on the secondary side as seen
from Table 4. Only the in-line transformer T2 has been
analyzed for protection coordination since it forms part of
the IEEE 13 node radial test feeder at a voltage profile of
4.16kV.
TABLE IV: TRANSFORMER PROTECTIVE DEVICES
Location ID Primary
Side Secondary
Side Up-Stream
Fuse Down-
Stream Fuse
Substation
Transformer T1
GRID
NODE
NODE
650 FGRID F650
In-Line Transformer
T2 NODE
633 NODE
634 F633 F634
1) In-Line Transformer Protection Requirements, Full
Load Ampere Mark, Magnetizing Inrush Points and
Damage Curves
The In-line transformer is a three-phase 500𝑘𝑉𝐴 step
down transformer having a star grounded primary winding
supplied at 4.16𝑘𝑉 and a grounded wye secondary winding
feeding power at a voltage of 0.48𝑘𝑉. The In-line
transformer is connected on the primary side to node 633
and on the secondary side to node 634. The transformer is
protected by two fuses F633 at the high voltage side and
fuse F634 at the low voltage side. The TCC Curve for the
transformer and its protective fuses is shown in the Fig 25.
The TCC Curve shows that the transformer full-load ampere
(FLA) of 601.407A is located at the upper decade at the
1000seconds mark and its magnetizing inrush current of
4811.253A with a multiplier 8 of the FLA located at the
bottom decade at 0.1seconds mark of the TCC Curve. The
transformer mechanical damage curve is shown located at
the 3rd and 4th decade of the TCC Curve starting at the
2seconds mark to the 4 seconds mark for the In-Line
transformer in Fig 25. The thermal damage curve is shown
located at the 3rd and 4th decade of the TCC coordination
curve starting from the 2seconds mark to the 50 seconds
mark.
Fuse F633 has a continuous current rating of 150A which
is within the NEC 450.3 maximum limit of 300% of the
transformer full load amperes (FLA) of 208.2A. NEC 450.3
stipulates that an upstream fuse used in protecting the
transformer primary windings must have a rating not
exceeding 300% of the primary side full load current. Fuse
F633 trip curve is located above and to the right of the
transformer full load current (FLA) of 69.4A and its
magnetizing inrush current point of 8 × 𝐹𝐿𝐴 at 4811.253A.
This clearly shows that the trip curve for fuse F633 protects
the In-Line transformer’s FLA mark and its magnetizing
inrush current point.
Fuse F634 has a continuous current rating of 630A and is
within the NEC 450.3 maximum limit which stipulates that
a downstream fuse protecting the secondary windings of a
transformer should have a current limit not exceeding 125%
of the transformer full load currents. Fuse F634 continuous
current rating of 630A is within NEC 450.3 maximum limit
of 125% of the FLA of 751.8A. Fuse F634 trip curve is
located below and to the left of both the transformer thermal
damage curve and the transformer mechanical damage
curves hence fuse F634 protects the In-Line transformer.
Page 11
EJERS, European Journal of Engineering Research and Science Vol. 4, No. 9, September 2019
DOI: http://dx.doi.org/10.24018/ejers.2019.4.9.1549 234
Fig. 25. In-Line Transformer Full Load Ampere Mark, Magnetizing Inrush
Points, Mechanical and Thermal Damage Curves and Fuse F633 and F634
TCC Trip Curves.
IV. CONCLUSION
By application of the feeder protection rules NEC
240.101, the transformer protection rules NEC 450.3, the
IEEE Standard 241 and the ANSI/IEEE regulations for
distribution feeder protection, the IEEE 13 node radial test
feeder was correctly modeled in electrical transient analysis
program (ETAP) for fuse-fuse protection. Fuses were used
for both primary and back up protection for the four major
components of the feeder. The fuses and their settings were
adequately chosen so that they coordinate.
REFERENCES
[1] Thomas P. Smith, “The ABC’s of Over-current Coordination-
Analyzer” Published for electrical engineers by E POWER
ENGINEERING. January 2006. Technical report. [2] EDWIN PHO “Over-current Coordination Study” California
Polytechnic State University, 2009.
[3] “Methods for Coordinating System Protective Equipment ” facilities
instructions, standards and techniques volume 3-9 United states
department of the interior Bureau of reclamation December
1991.Technical report
[4] Tasha Harvey “Selective Coordination for Over-Current Protective
Devices: Application for Buildings in the United States” Kansas state university, master’s Thesis 2012.
[5] Jim Pauley ‘’ Application of Over-Current Protection Rules to
Transformers and Primary and Secondary Conductors’’ Codes and Standards Application Data. Square D Company. Bulletin Number
011DB0201. USA. Technical Report.
[6] Christopher McCarthy, Ray O’ Leary and Doug Staszesky ‘’A New Fuse-Saving Philosophy’’ DistribuTech January 22-24 2008 Tampa
Florida.
[7] Square D “Guide to Power System Selective Coordination 600V and below” Schnelder electric 2006. Technical report.
[8] Les Hewitson, Mark Brown and Ben Ramesh “Practical Power
Systems Protection” IDC Technologies 2004. [9] Leon M. Tolbert “Computer-Aided Coordination and Over-current
Protection for Distribution Systems” Industrial and commercial
power systems technical conference 7th-11th may 1995. [10] W.H.Kersting “Radial Distribution Test Feeders” IEEE Power
engineering society. Distribution systems analysis subcommittee
report. 2000.
Mr Kemei Peter Kirui is a Kenyan born at Kiptere
Location, Kericho County on 14th May 1983. He trained as an Electrical Engineer and graduated with
a Bachelor’s degree in Electrical and Communication
Engineering from Moi University, Eldoret Kenya on 10th December 2009. He also trained in Technology
Education and graduated with a PGDE in Technology
Education from Moi University on 16th December 2014. He trained as an Energy Auditor with Kenya
Association of Manufacturers (KAM) on 2016. He
has also trained as a Power Systems Engineering Examiner with the Kenya National Examination Council (KNEC) on 2014.
He has worked for KNEC since 2014 to date as an Electrical Power
Systems Engineering Examiner. He worked as a lecturer teaching Electrical Engineering at Zetech University Nairobi Kenya on the year 2015 before
proceeding to Moi University Eldoret, Kenya as an Assistant Lecturer in
the department of Electrical and Electronic Technology where he works up
to date.
Mr Kemei is a registered graduate engineer by the Kenya Engineers Registration Board (ERB). His areas of interest in research are: Power
Systems Protection; Power Systems Distribution Networks Planning;
Renewable Energy, especially Wind Energy.