The problem of fusing similarity measure-based classifiers is considered in the context of face verification. The performance offace verification systems using different similarity measures in two well-known appearance-based representation spaces, namelyPrinciple Component Analysis (PCA) and Linear Discriminant Analysis (LDA) is experimentally studied. The study is performedfor both manually and automatically registered face images. The experimental results confirm that our optimised GradientDirection (GD) metric within the LDA feature space outperforms the other adopted metrics. Different methods of selection andfusion of the similarity measure-based classifiers are then examined. The experimental results demonstrate that the combinedclassifiers outperform any individual verification algorithm. In our studies, the Support Vector Machines (SVMs) and WeightedAveraging of similarity measures appear to be the best fusion rules. Another interesting achievement of the work is that althoughfeatures derived from the LDA approach lead to better results than those of the PCA algorithm for all the adopted scoring functions,fusing the PCA- and LDA-based scores improves the performance of the system.
1. Introduction
In spite of the rapid advances in machine learning, in manypattern recognition problems, the decision making is basedon simple concepts such as distance from or similarity tosome reference patterns. This type of approach is particularlyrelevant when the number of training samples available tomodel a class of objects is very limited. Examples of suchsituations include content-based retrieval from image orvideo databases, where the query image is the only sampleat our disposal to define the object model, or biometricswhere only one or a few biometric traits can be acquiredduring subject enrolment to create a reference template.In biometric identity verification, a similarity functionmeasures the degree of similarity of an unknown patternto the claimed identity template. If the degree exceeds apre-specified threshold, the unknown pattern is acceptedto be the same as the claimed identity. Otherwise, it isrejected.
Different similarity measures have been adopted indifferent machine vision applications. In [1], a numberof commonly used similarity measures including the City-block, Euclidean, Normalised Correlation (NC), Chi-square(χ2), and Chebyshev distance have been considered in animage retrieval system. The reported experimental resultsdemonstrate that the City-block and Chi-square metricsare more efficient in terms of both retrieval accuracy andretrieval efficiency. In a similar comparative study, it has beenshown that the Chi-square statistics measure outperformsthe other similarity measures for remote sensing imageretrieval [2]. In another study, the effect of 14 scoringfunctions such as the City-block, Euclidean, NC, Canberra,Chebyshev, and Distance based Correlation Coefficientshas been studied in the context of the face recognitionproblem [3] in the PCA space. It has been shown that asimplified form of Mahalanobis distance outperforms theother metrics. In [4], four classical distance measures, City-block, Euclidean, Normalised Correlation, and Mahalanobis
2 EURASIP Journal on Advances in Signal Processing
distance have been compared in the PCA space. It hasbeen shown that when the number of eigenvectors isrelatively high, the Mahalanobis distance outperforms theother measures. Otherwise, a similar performance is achievedusing different measures. It has been also propounded thatno significant improvement is achieved by combining thedistance measures.
A similarity score is computed in a suitable feature space.Commonly, similarity would be quantised in terms of adistance function, on the grounds that similar patterns willlie physically close to each other. Thus, the smaller thedistance, the greater the similarity of two entities. The roleof the feature space in similarity measurement is multifold.First of all, the feature space is selected so as to maximisethe discriminatory information content of the data projectedinto the feature space and to remove any redundancy.However, additional benefits sought after from mapping theoriginal pattern data into a feature space is to simplify thesimilarity measure deployed for decision making.
PCA and LDA are two classical tools widely used in theappearance-based approaches for dimensionality reductionand feature extraction. Many face recognition methods, suchas eigenfaces [5] and fisherfaces [6], are built on thesetwo techniques or their variants. Different researches showthat in solving the pattern classification problems the LDA-based algorithms outperform the PCA-based ones, since theformer take the between classes variations into account.The LDA is a powerful feature extraction tool for patternrecognition in general and for face recognition in particular.It was introduced to this application area by Belhumeur etal. in 1997 [6]. An important contributing factor in theperformance of a face authentication system is the metricused for defining a matching score. Theoretically, Euclideandistance provides an optimal measure in the LDA space. In[7], it has been demonstrated that it is outperformed by theNormalised Correlation (NC) and Gradient Direction (GD).Also, in [8], the performance of the NC scoring functionhas been compared with the GD metric. The study has beenperformed on the BANCA database [9] using internationallyagreed experimental protocols by applying a geometric faceregistration method based on manually or automaticallyannotated eyes positions. It has been concluded that overallthe NC function is less sensitive to missregistration error butin certain conditions GD metric performs better. However, in[10], it has been further demonstrated that by optimising theGD metric, this metric almost always outperforms the NCmetric for both manually and automatically registered data.
In this study, a variety of other metrics have been inves-tigated, including Euclidean, City-block, Chebyshev, Can-berra, Chi-square (χ2), NC, GD, and Correlation coefficient-based distance. The experimental results in face verificationconfirm that, individually, other metrics on the whole donot perform as well as the NC and GD metrics in the LDAspace. However, in different conditions, certain classifiers candeliver a better performance.
It is well known that a combination of many differ-ent classifiers can improve classification accuracy. Variousschemes have been proposed for combining multiple clas-sifiers. We concentrate on classifier combination at the
decision-level, that is, combining similarity scores output byindividual classifiers. Thus, the scores are treated as features,and a second-level classifier is constructed to fuse thesescores.
Fusion rules can be divided into two main categories:fixed rules such as the sum, product, minimum, maximum,and median rule [11–13] and trained rules like the weightedaveraging of classifiers outputs [14, 15], Support VectorMachines (SVM) [10], bagging, and boosting [16]. Overall,the fixed rules are most often used because of their simplicityand the fact that they do not require any training. Accord-ingly, equal weights are used for all the classifiers [11, 17].
However, in many studies it has been demonstratedthat trained classifiers such as Support Vector Machines(SVMs) have the potential to outperform the simple fusionrules, especially when enough training data is available. In[18], AdaBoost has been adopted for combining unimodalfeatures extracted from face and speech signals of individualsin multimodal biometrics. In [8] the fusion problem wassolved by selecting the best classifier or a group of classifiersdynamically with the help of a gating function learnt for eachsimilarity measure.
In summary, it is clear that it is still pertinent toask which classifiers provide useful information and howthe expert scores should be fused to achieve the bestpossible performance of the face verification system. In[19], considering a set of similarity measure-based classifierswithin the LDA feature space, a sequential search algorithmwas applied in order to find an optimum subset of similaritymeasures to be fused as a basis for decision making. The SVMclassifier was used for fusing the selected classifiers.
In this paper, a variety of fixed and trained fusion rulesare compared in the context of face authentication. Fivefixed fusion rules (sum, min, max, median, and product)and two trained rules (the support vector machines andweighted averaging of scores) are considered. It is shown thata better performance is obtained by fusing the classifiers.Moreover, the adopted trained rules outperform the fixedrule. Although, the PCA-based classifiers perform nearly 3times worse than the LDA-based one, an interesting findingof this paper compared to our previous work [19] is thatthe performance of the verification system can be furtherimproved by fusing the LDA- and PCA-based classifiers. In[20], a similar study has been performed using Euclideandistance as the scoring function. In the training stage ofthe proposed algorithm, adopting a fixed reference as thecentral value of the decision making threshold, client specificweights are determined by calculating the average value ofthe Euclidean distance of all the patterns from each clienttemplate. The client specific weights are determined in bothLDA and PCA spaces. The weights are then used withinthe framework of three simple untrained fusion rules. Inthe adopted experimental protocol, each subject images aredivided into two parts as the training and test sets. Theexperimental study performed on the ORL and Yale data setsdemonstrate that the combined classifier outperforms theindividual PCA- and LDA-based classifiers [20]. Althoughthe training and test images are different, since the samesubjects are available within the training and test sets, the
EURASIP Journal on Advances in Signal Processing 3
weighting process is somehow biased so that the performanceof the system in the presence of new impostors (not thoseused for training) could be worse.
The rest of the paper is organised as follows. In thenext section, the adopted scoring functions are introduced.Fusion rules are reviewed in Section 3. A description ofthe experimental design including the face database used inthe study, the experimental protocols, and the experimentalsetup are given in Section 4. The experimental results usingthe adopted scoring functions and the fusion results arepresented and discussed in Section 5. Finally a summary ofthe main findings and conclusions can be found in Section 6.
2. Similarity Functions
In a similarity measure-based face verification system, amatching scheme measures the similarity or distance of thetest sample, x, to the template of the claimed identity, µi, bothprojected into an appropriate feature space. The general formof a group of similarity measures which is called MinkowskiDistance or power norm metrics (Lp) is defined as
sM =⎡⎣
m∑
j=1
∣∣∣µi j − x j
∣∣∣p⎤⎦
1/p
, (1)
where m is the dimensionality and j indexes the componentsof the two vectors.
The most commonly used similarity measures, Man-hattan or City-block metric, Euclidean Distance (ED), andChebyshev Distance are special cases of the Minkowski metricfor p = 1, p = 2, and p → ∞, respectively, that is, L1, L2, andL∞ metrics:
sCity =m∑
j=1
∣∣∣µi j − x j
∣∣∣, (2)
sED =√(
x − µi
)T(x − µi
), (3)
sCheby = maxj
∣∣∣µi j − x j
∣∣∣. (4)
The Canberra Distance is also given by
sCanb =m∑
j=1
∣∣∣µi j − x j
∣∣∣∣∣∣µi j
∣∣∣ +∣∣∣x j
∣∣∣. (5)
This can be considered as the normalised Manhattan Dis-tance. The Chi-squared (χ2) Distance is defined by
sχ2 =m∑
j=1
(µi j − x j
)2
∣∣∣µi j∣∣∣ +
∣∣∣x j
∣∣∣(6)
which is basically a relative Euclidean squared distance and isusually meant for nonnegative variables only.
In [7], it has been demonstrated that a matching scorebased on Normalised Correlation (NC) scoring function,defined by the following equation, is more efficient:
sN =∥∥∥xTµi
∥∥∥√
xTxµTi µi. (7)
Another similarity measure which is conceptually thesame as the NC function is the Correlation Coefficients-baseddistance. For more details, the reader is referred to [3].
The Gradient Direction (GD) metric proposed in [7, 21]measures the distance between a probe image and a modelin the gradient direction of the a posteriori probabilityfunction P(i | x) associated with the hypothesised clientidentity i. A mixture of Gaussian distributions with isotropiccovariance matrix has been assumed as the density functionrepresenting the anticlass (world population) estimated fromthe data provided by all the other users (for all j /= i). Thediagonal elements of the isotropic covariance matrix areassumed to have values related to the magnitude of variationof the image data in the feature space. It was demonstratedthat in a face verification system, applying GD metric is evenmore efficient than the NC function. This matching score isdefined as
sO =
∥∥∥∥(
x−µi)T∇OP(i | x)
∥∥∥∥‖∇OP(i | x)‖
, (8)
where ∇OP(i | x) refers to the gradient direction. For theisotropic structure of the covariance matrix, that is, Σ = σI,the optimal direction would be
∇IP(i | x) =m∑
j=1j /= i
p(
x | j)(µ j − µi
). (9)
Note that the magnitude of σ will affect the gradientdirection through the values of density p(x | j)(x j).
3. Similarity Scores Fusion
One of the very promising research directions in the fieldof pattern recognition and computer vision is classifierfusion. It has been recognised that the classical approachto designing a pattern recognition system which focuseson finding the best classifier has a serious drawback.Any complementary discriminatory information that otherclassifiers may capture is not tapped. Multiple expert fusionaims to make use of many different designs to improve theclassification performance. In the case considered here, asdifferent metrics span the feature space in different ways, itseems reasonable to expect that a better performance couldbe obtained by combining the resulting classifiers.
Since the scores for different classifiers lie in differentranges, a normalisation process is required to transformthese score to the same range before combining them[22]. The simplest normalisation technique is the min-maxnormalisation. The min-max normalisation is best suited for
4 EURASIP Journal on Advances in Signal Processing
the case where the bounds (maximum and minimum values)of the scores produced by a matcher are known. In this case,we can easily shift the minimum and maximum scores to 0and 1, respectively. Given a set of scores for each classifiersi, i = 1, 2, . . . ,M, where M is the number of samples, thenormalised scores are given by
Si = si −minimaxi −mini
, (10)
where si and Si are, respectively, the original and normalisedscores associated to the ith sample. mini and maxi are theminimum and maximum scores determined from a trainingset.
As mentioned earlier, two main groups of fusion rules,untrained (fixed) and trained rules can be applied forclassifiers fusion. The untrained methods such as Sum (orAverage), Product, Min, Max,and Median are very wellknown approaches. For example, the Sum rule is defined as
Snew =M∑
i=1
Si, (11)
where M is the number of classifiers. This is simplyequivalent to averaging the normalised scores over theclassifiers. A variety of trained fusion techniques such asneural network classifier, Bayesian classifier, and SVM havebeen suggested. It has been shown that the SVM classifieris among the best trained fusion rules. In [10], decisionlevel fusion strategy using the SVMs has been adopted forcombining the similarity measure-based classifiers. A verygood performance has been reported using the adoptedmethod.
Another promising trained rule involves a weightedaveraging of similarity scores. Obviously, the technique usedfor determining the weight is an important factor in such amethod.
3.1. Support Vector Machines. A Support Vector Machine isa two-class classifier showing superior performance to othermethods in terms of Structural Risk Minimisation [23]. For agiven training sample {xi, yi}, i = 1, . . . ,N , where xi ∈ RD isthe object marked with a label yi ∈ {−1, 1}, it is necessary tofind the direction w along which the margin between objectsof two classes is maximal. Once this direction is found thedecision function is determined by threshold b:
y(x) = sgn(w · x + b). (12)
The threshold is usually chosen to provide equal distance tothe closest objects of the two classes from the discriminanthyperplane w · x + b = 0, which is called the optimalhyperplane. When the classes are linearly nonseparable someobjects can be shifted by a value δi towards the right class.This converts the original problem into one which exhibitslinear separation. The parameters of the optimal hyperplane
and the optimal shifts can be found by solving the followingquadratic programming problem:
minimise w ·w + CN∑
i=1
δi
subject to: yi(w · xi + b) ≥ 1− δi,δi ≥ 0, i = 1, . . . ,N ,
(13)
where parameter C defines the penalty for shifting the objectsthat would otherwise be misclassified in the case of linearlynonseparable classes.
The QP problem is usually solved in a dual formulation:
minimiseN∑
i=1
αi − 12
N∑
i=1
N∑
j=1
αiαj yi y jxi · x j
subject to:N∑
i=1
αi yi = 0,
0 ≤ αi ≤ C i = 1, . . . ,N.
(14)
Those training objects xi with αi > 0 are called SupportVectors, because only they determine direction w:
w =N∑
i=1, αi>0
αi yixi (15)
The dual QP problem can be rapidly solved by the SequentialMinimal Optimisation method, proposed by Platt [24]. Thismethod exploits the presence of linear constraints in (14).The QP problem is iteratively decomposed into a series ofone variable optimisation problems which can be solvedanalytically.
For the face verification problem, the size of the trainingset for clients is usually less than the one for impostors.In such a case, the class of impostors is represented better.Therefore, it is necessary to shift the optimal hyperplanetowards the better represented class. In this paper, the sizeof the shift is determined in the evaluation step based on theEqual Error Rate criterion.
3.2. Weighted Averaging of Similarity Measures. Compare tothe simple averaging rule, in the case of weighted averaging,different weights are considered for the scores achieved fromdifferent classifiers, that is,
Snew =M∑
i=1
wiSi, (16)
where wi is the weight assigned to the ith classifier output.In this study, three methods of weighted averaging are
considered. In the first group, each classifier weight isdetermined based on the performance of the classifier in anevaluation step. The smaller the error rate, the greater theweight assigned to the classifier output, that is,
wi = 1TEREi
, i = 1, 2, . . . ,M, (17)
EURASIP Journal on Advances in Signal Processing 5
where TEREi is the Total Error Rate of the ith classifier in theEvaluation stage.
The main idea behind the second adopted method isto minimise the correlation between classifier outputs. Inpractise, outputs of multiple classifiers are not uncorre-lated, but some classifiers are more correlated than others.Therefore, it is reasonable to assign different weights todifferent classifiers according to their correlation. PrincipleComponent Analysis, PCA, is one of the statistical techniquesfrequently used to decorrelate the data [25]. Denote by S thevector of scores delivered by the M classifiers, that is,
S = [S1 S2 · · · . SN ] . (18)
Let λi and vi, i = 1, . . . ,M, be the eigenvalues andeigenvectors of the covariance matrix of the evaluation scorevectors S retaining a certain proportion of the score variance.The eigenvectors are used as the bases of a new feature space.Applying the simple averaging rule (equation (11)) to thescores transformed to this feature space is equivalent to theweighted averaging of the original scores in (16) where wi aredetermined using the following equation:
wi =M∑
j=1
vi j . (19)
As the third method of weighted averaging of the scores,the above mentioned idea can be extended by applying theLDA algorithm. In a face verification system, two groupsof score vectors are considered: client scores and impostorscores. In the evaluation step, these classes of data canbe used within the framework of the Linear DiscriminantAnalysis (LDA) for computing the feature space bases andthe classifier weights.
4. Experimental Design
In this section, the face verification experiments carriedout on images of the BANCA database are described.The BANCA database is briefly introduced first. The mainspecification of the experimental setup is then presented.
4.1. BANCA Database. The BANCA database has beendesigned in order to test multimodal identity verificationsystems deploying different cameras in different scenarios(Controlled, Degraded, and Adverse). The database has beenrecorded in several languages in different countries. Ourexperiments were performed on the English section of thedatabase. Each section contains 52 subjects (26 males and 26females).
Each subject participated to 12 recording sessions indifferent conditions and with different cameras. Sessions 1–4contain data under Controlled conditions whereas sessions 5–8 and 9–12 contain Degraded and Adverse scenarios, respec-tively. In order to create more independent experiments,images in each session have been divided into two groups of26 subjects (13 males and 13 females). Experiments can beperformed on each group separately.
In the BANCA protocol, 7 different distinct experimentalconfigurations have been specified, namely, Matched Con-trolled (Mc), Matched Degraded (Md), Matched Adverse(Ma), Unmatched Degraded (Ud), Unmatched Adverse (Ua),Pooled test (P), and Grand test (G). Table 1 describes theusage of the different sessions in each configuration. “T”refers to the client training while “C” and “I” depict clientand impostor test sessions, respectively.
4.2. Experimental Setup. The performance of different deci-sion making methods discussed in Section 2 is experimen-tally evaluated on the BANCA database using the config-urations discussed in the previous section. The evaluationis performed in the LDA and PCA spaces. The originalresolution of the image data is 720 × 576. The experimentswere performed with a relatively low resolution face images,namely, 64× 49. The results reported in this paper have beenobtained by applying a geometric face normalisation basedon the eyes positions. The eyes positions were localised eithermanually or automatically. A fast method of face detectionand eyes localisation was used for the automatic localisationof eyes centre [26]. The XM2VTS database [27] was used forcalculating the LDA and PCA projection matrices.
The thresholds in the decision making system have beendetermined based on the Equal Error Rate criterion, thatis, by the operating point where the false rejection rate(FRR) is equal to the false acceptance rate (FAR). Thethresholds are set either globally (GT) or using the clientspecific thresholding (CST) technique [21]. In the trainingsessions of the BANCA database 5 client images per personare available. In the case of global thresholding method, allthese images are used for training the clients template. Theother group data is then used to set the threshold. In thecase of the client specific thresholding strategy, only twoimages are used for the template training and the other threealong with the other group data are used to determine thethresholds. Moreover, in order to increase the number ofdata used for training and to take the errors of the geometricnormalisation into account, 24 additional face images pereach image were generated by perturbing the location of theeyes position around the annotated positions.
In the previous studies [21], it has been demonstratedthat the Client Specific Thresholding (CST) technique issuperior in the matched scenario (Mc, Md, Ma, and G)whereas the Global Thresholding (GT) method gives abetter performance on the unmatched protocols. The resultsreported in the next section using thresholding have beenacquired using this criterion.
5. Experimental Results and Discussion
As mentioned earlier, in the GD metric, the impostordistributions have been approximated by isotropic Gaussianfunctions with a standard deviation of σ , that is, Σ = σI . Theorder of σ is related to the order of the standard deviation ofthe input data (grey level values in the LDA feature space). Inthe previous work [8], a fixed value equal to 104 has beenused for σ . In this work, in order to optimise the metric
6 EURASIP Journal on Advances in Signal Processing
Table 1: The usage of the different sessions in the BANCA experimental protocols.
1 2 3 4 5 6 7 8 9 10 11 12
Mc TI CI CI CI
Md TI CI CI CI
Ma TI CI CI CI
Ud T I CI CI CI
Ua T I CI CI CI
P TI CI CI CI I CI CI CI I CI CI CI
G TI CI CI CI TI CI CI CI TI CI CI CI
0
5
10
15
20
25
30
35
TE
E
0 0.5 1 1.5 2 2.5 3×10⁵
σ
(a) Evaluation (Manual registration)
0
5
10
15
20
25
30
35
TE
T
0 0.5 1 1.5 2 2.5 3×10⁵
σ
(b) Test (Manual registration)
05
101520253035404550
TE
E
0 2 4 6 8 10×104
σMcMd
UdP
(c) Evaluation (Automatic registration)
15
20
25
30
35
40
45
50
TE
T
0 2 4 6 8 10×104
σMcMd
UdP
(d) Test (Automatic registration)
Figure 1: The performance of the GD metric versus the value of σ .
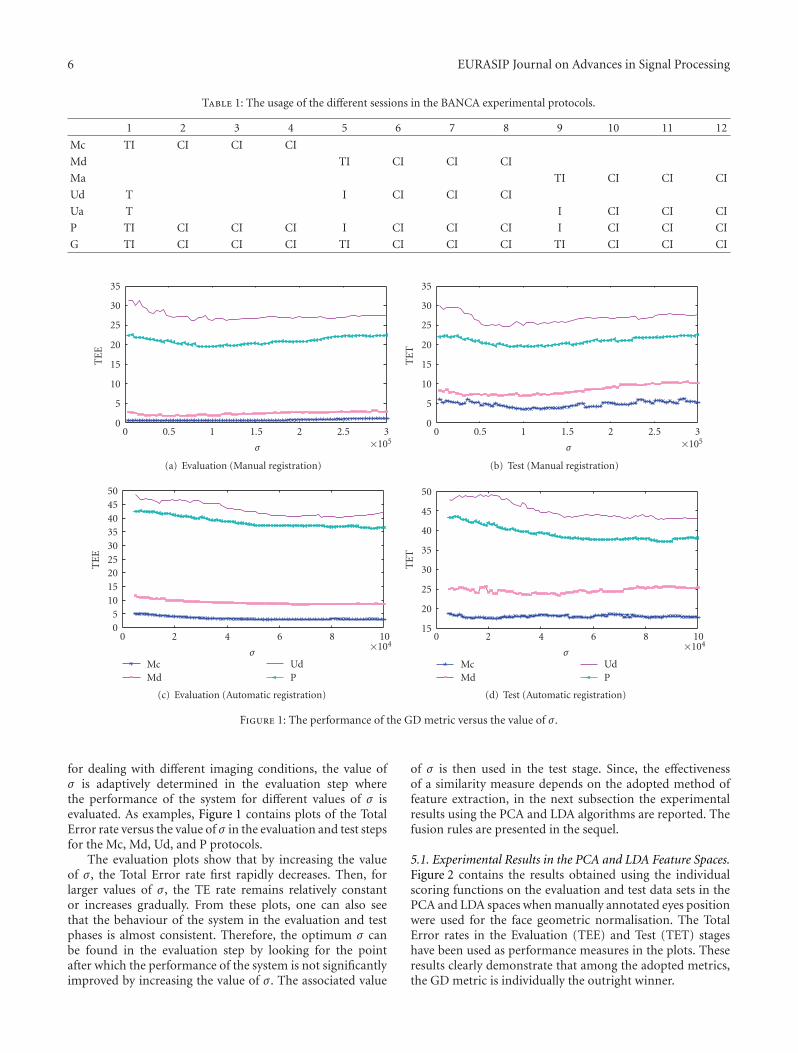
for dealing with different imaging conditions, the value ofσ is adaptively determined in the evaluation step wherethe performance of the system for different values of σ isevaluated. As examples, Figure 1 contains plots of the TotalError rate versus the value of σ in the evaluation and test stepsfor the Mc, Md, Ud, and P protocols.
The evaluation plots show that by increasing the valueof σ , the Total Error rate first rapidly decreases. Then, forlarger values of σ , the TE rate remains relatively constantor increases gradually. From these plots, one can also seethat the behaviour of the system in the evaluation and testphases is almost consistent. Therefore, the optimum σ canbe found in the evaluation step by looking for the pointafter which the performance of the system is not significantlyimproved by increasing the value of σ . The associated value
of σ is then used in the test stage. Since, the effectivenessof a similarity measure depends on the adopted method offeature extraction, in the next subsection the experimentalresults using the PCA and LDA algorithms are reported. Thefusion rules are presented in the sequel.
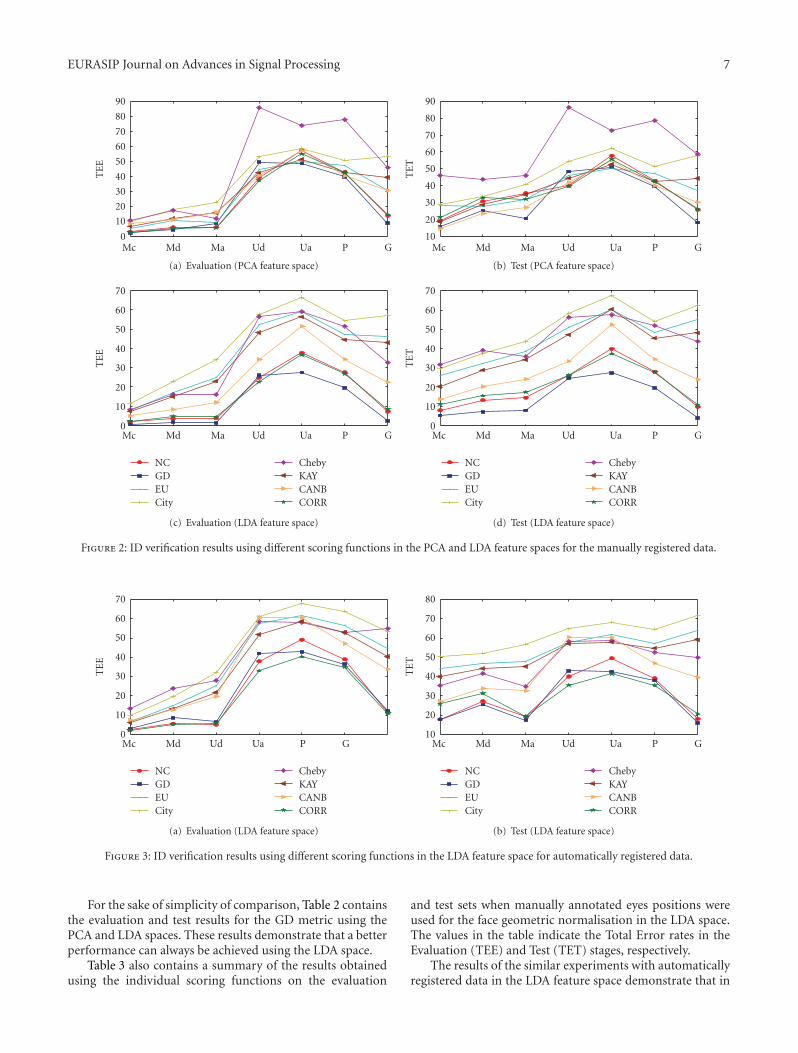
5.1. Experimental Results in the PCA and LDA Feature Spaces.Figure 2 contains the results obtained using the individualscoring functions on the evaluation and test data sets in thePCA and LDA spaces when manually annotated eyes positionwere used for the face geometric normalisation. The TotalError rates in the Evaluation (TEE) and Test (TET) stageshave been used as performance measures in the plots. Theseresults clearly demonstrate that among the adopted metrics,the GD metric is individually the outright winner.
EURASIP Journal on Advances in Signal Processing 7
0
10
20
30
40
50
60
70
80
90T
EE
Mc Md Ma Ud Ua P G
(a) Evaluation (PCA feature space)
10
20
30
40
50
60
70
80
90
TE
T
Mc Md Ma Ud Ua P G
(b) Test (PCA feature space)
0
10
20
30
40
50
60
70
TE
E
Mc Md Ma Ud Ua P G
NCGDEUCity
ChebyKAYCANBCORR
(c) Evaluation (LDA feature space)
0
10
20
30
40
50
60
70
TE
T
Mc Md Ma Ud Ua P G
NCGDEUCity
ChebyKAYCANBCORR
(d) Test (LDA feature space)
Figure 2: ID verification results using different scoring functions in the PCA and LDA feature spaces for the manually registered data.
0
10
20
30
40
50
60
70
TE
E
Mc Md Ud Ua P G
NCGDEUCity
ChebyKAYCANBCORR
(a) Evaluation (LDA feature space)
10
20
30
40
50
60
70
80
TE
T
Mc Md Ma Ud Ua P G
NCGDEUCity
ChebyKAYCANBCORR
(b) Test (LDA feature space)
Figure 3: ID verification results using different scoring functions in the LDA feature space for automatically registered data.
For the sake of simplicity of comparison, Table 2 containsthe evaluation and test results for the GD metric using thePCA and LDA spaces. These results demonstrate that a betterperformance can always be achieved using the LDA space.
Table 3 also contains a summary of the results obtainedusing the individual scoring functions on the evaluation
and test sets when manually annotated eyes positions wereused for the face geometric normalisation in the LDA space.The values in the table indicate the Total Error rates in theEvaluation (TEE) and Test (TET) stages, respectively.
The results of the similar experiments with automaticallyregistered data in the LDA feature space demonstrate that in
8 EURASIP Journal on Advances in Signal Processing
Table 2: ID verification results using GD metric, LDA (left) and PCA (right). TEE: Total Error rate Evaluation; TET: Total Error rate Test.
Manual Registration
LDA PCA
TEE TET TEE TET
Mc 0.597 4.87 2.2 15.77
Md 1.77 7.18 4.26 25.19
Ma 1.56 8.03 8.6 20.54
Ud 26.09 24.74 49.49 48.32
Ua 27.5 27.4 48.49 50.96
P 19.56 19.64 39.64 39.6
G 2.43 4.12 8.74 18.04
Table 3: ID verification results using different similarity measures for the manual registered data in the LDA feature space.
Mc Md Ma Ud Ua P G
TEE TET TEE TET TEE TET TEE TET TEE TET TEE TET TEE TET
Table 4: Fusion results for the different BANCA protocols using different fusion rules.
Sum WA1 WA2 WA3
TEE TET TEE TET TEE TET TEE TET
Mc 2.51 10.61 .82 6.31 1.9 8.56 1.38 6.5
Md 5.98 16.28 2.93 10.67 5.35 15.93 2.5 9.33
Ma 7.54 18.75 2.24 11.06 6.29 17.14 2.55 10.32
Ud 30.03 30.54 26.16 25.38 29.45 30.48 19.55 21.79
Ua 40.41 41.19 36.47 37.95 40.35 41.4 26.96 29.61
P 29.65 29.8 25.3 24.87 18.51 28.57 18.33 19.94
G 15.5 19.12 3.8 5.66 14.92 18.47 3.32 4.55
this case the optimised GD function again delivers a better orat least comparable performance. The performance of othermetrics, with the exception of NC, is much worse. Theseresults are shown in Figure 3.
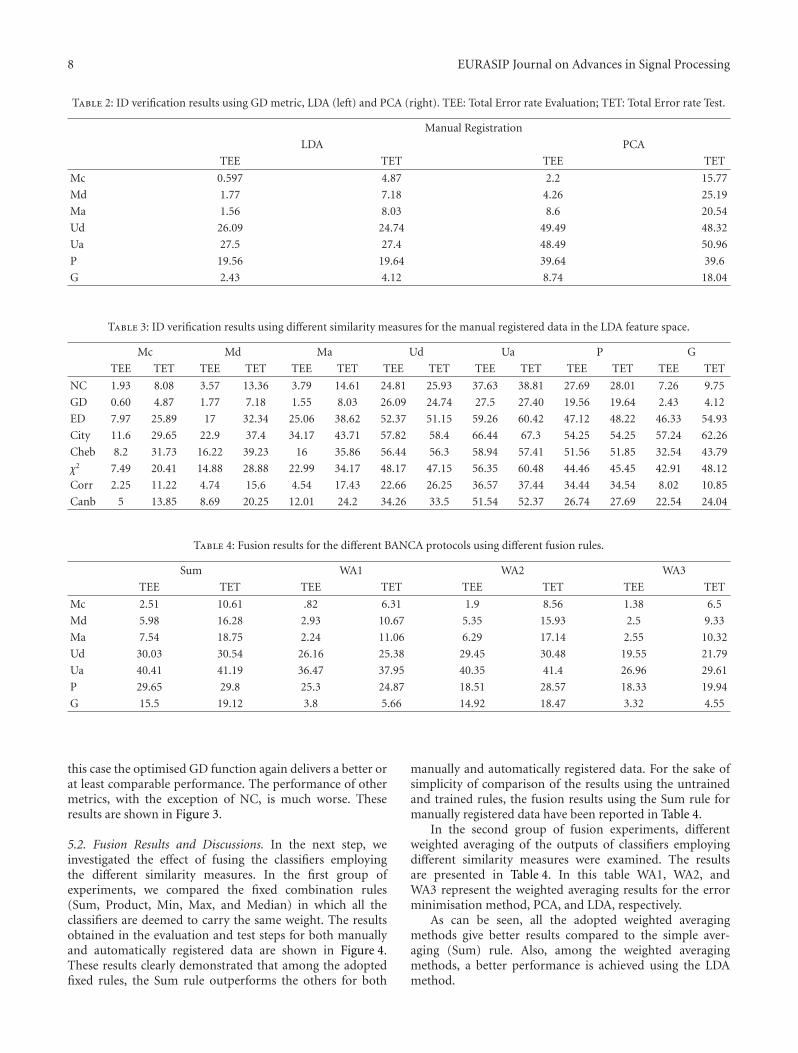
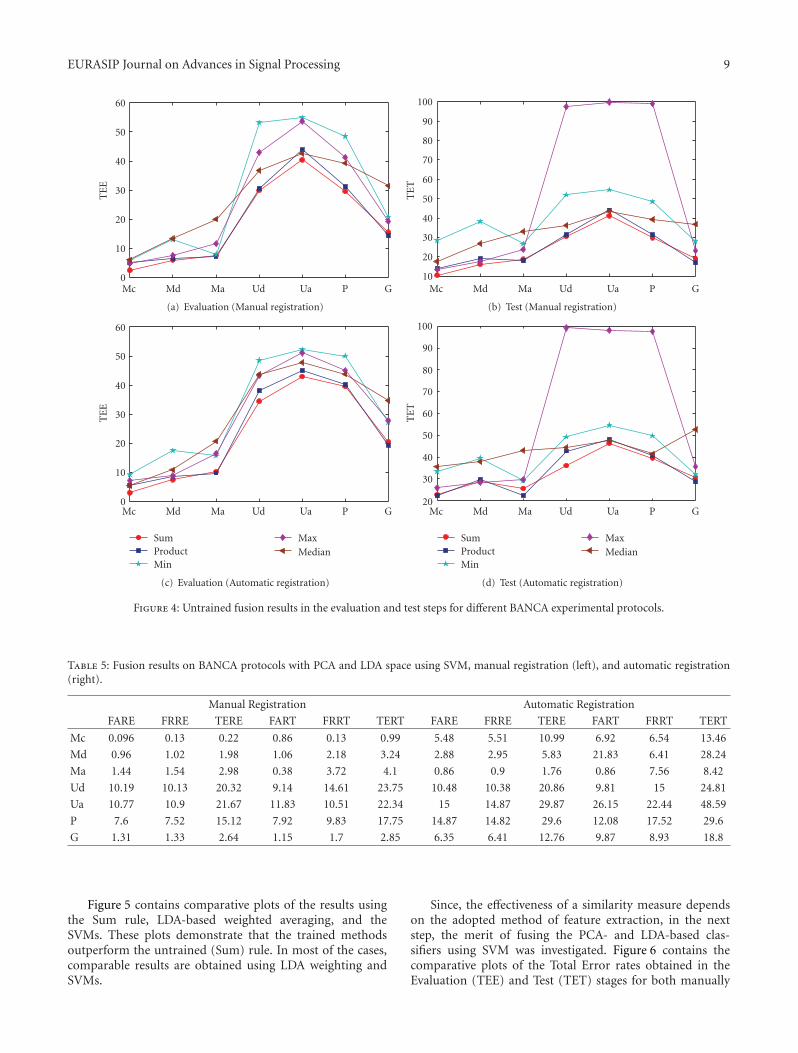
5.2. Fusion Results and Discussions. In the next step, weinvestigated the effect of fusing the classifiers employingthe different similarity measures. In the first group ofexperiments, we compared the fixed combination rules(Sum, Product, Min, Max, and Median) in which all theclassifiers are deemed to carry the same weight. The resultsobtained in the evaluation and test steps for both manuallyand automatically registered data are shown in Figure 4.These results clearly demonstrated that among the adoptedfixed rules, the Sum rule outperforms the others for both
manually and automatically registered data. For the sake ofsimplicity of comparison of the results using the untrainedand trained rules, the fusion results using the Sum rule formanually registered data have been reported in Table 4.
In the second group of fusion experiments, differentweighted averaging of the outputs of classifiers employingdifferent similarity measures were examined. The resultsare presented in Table 4. In this table WA1, WA2, andWA3 represent the weighted averaging results for the errorminimisation method, PCA, and LDA, respectively.
As can be seen, all the adopted weighted averagingmethods give better results compared to the simple aver-aging (Sum) rule. Also, among the weighted averagingmethods, a better performance is achieved using the LDAmethod.
EURASIP Journal on Advances in Signal Processing 9
0
10
20
30
40
50
60T
EE
Mc Md Ma Ud Ua P G
(a) Evaluation (Manual registration)
10
20
30
40
50
60
70
80
90
100
TE
T
Mc Md Ma Ud Ua P G
(b) Test (Manual registration)
0
10
20
30
40
50
60
TE
E
Mc Md Ma Ud Ua P G
SumProductMin
MaxMedian
(c) Evaluation (Automatic registration)
20
30
40
50
60
70
80
90
100
TE
T
Mc Md Ma Ud Ua P G
SumProductMin
MaxMedian
(d) Test (Automatic registration)
Figure 4: Untrained fusion results in the evaluation and test steps for different BANCA experimental protocols.
Table 5: Fusion results on BANCA protocols with PCA and LDA space using SVM, manual registration (left), and automatic registration(right).
Manual Registration Automatic Registration
FARE FRRE TERE FART FRRT TERT FARE FRRE TERE FART FRRT TERT
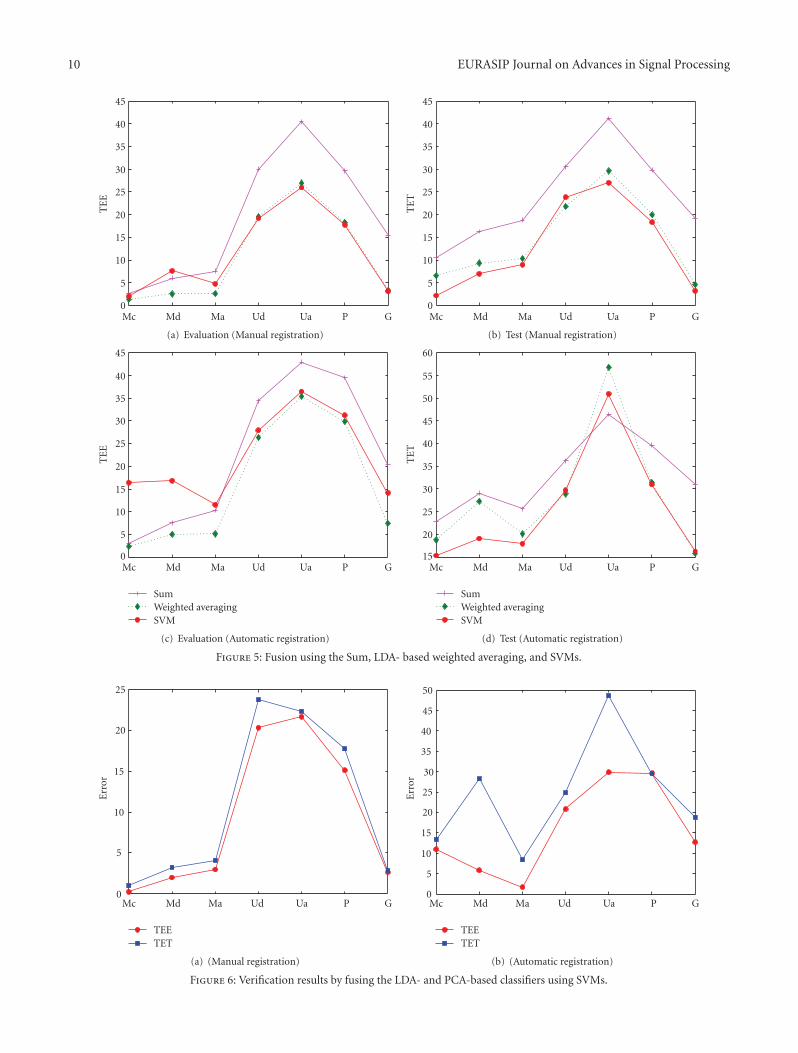
Figure 5 contains comparative plots of the results usingthe Sum rule, LDA-based weighted averaging, and theSVMs. These plots demonstrate that the trained methodsoutperform the untrained (Sum) rule. In most of the cases,comparable results are obtained using LDA weighting andSVMs.
Since, the effectiveness of a similarity measure dependson the adopted method of feature extraction, in the nextstep, the merit of fusing the PCA- and LDA-based clas-sifiers using SVM was investigated. Figure 6 contains thecomparative plots of the Total Error rates obtained in theEvaluation (TEE) and Test (TET) stages for both manually
10 EURASIP Journal on Advances in Signal Processing
0
5
10
15
20
25
30
35
40
45T
EE
Mc Md Ma Ud Ua P G
(a) Evaluation (Manual registration)
0
5
10
15
20
25
30
35
40
45
TE
T
Mc Md Ma Ud Ua P G
(b) Test (Manual registration)
0
5
10
15
20
25
30
35
40
45
TE
E
Mc Md Ma Ud Ua P G
SumWeighted averagingSVM
(c) Evaluation (Automatic registration)
15
20
25
30
35
40
45
50
55
60
TE
T
Mc Md Ma Ud Ua P G
SumWeighted averagingSVM
(d) Test (Automatic registration)
Figure 5: Fusion using the Sum, LDA- based weighted averaging, and SVMs.
0
5
10
15
20
25
Err
or
Mc Md Ma Ud Ua P G
TEETET
(a) (Manual registration)
0
5
10
15
20
25
30
35
40
45
50
Err
or
Mc Md Ma Ud Ua P G
TEETET
(b) (Automatic registration)
Figure 6: Verification results by fusing the LDA- and PCA-based classifiers using SVMs.
EURASIP Journal on Advances in Signal Processing 11
and automatically registered data (see Table 5). These plotsdemonstrate that these methods outperform the otherrules.
Overall, the results clearly demonstrate that the proposedsimilarity measure fusion considerably improves the perfor-mance of the face verification system.
6. Conclusions
The problem of fusing similarity measure-based classifiers inface verification was considered. First, the performance offace verification systems in PCA and LDA feature spaces withdifferent similarity measure classifiers was experimentallyevaluated. The study was performed for both manuallyand automatically registered face images. The experimentalresults confirm that our optimised Gradient Directionmetric in the LDA feature space outperforms the otherinvestigated metrics. Different methods for the selection andfusion of the various similarity measure-based classifierswere compared. The experimental results demonstrate thatthe combined classifiers outperform any individual verifi-cation algorithm. Moreover, the Support Vector Machinesand Weighted Averaging of similarity measures have beenshown to be the best fusion rules. It was also shown thatalthough the features derived from the LDA approach leadto better results, than those of the PCA algorithm, fusingthe PCA- and LDA-based scores improves the performancefurther. Based on our previous study within the LDA space[19], further improvement is also expected by adaptivelyselecting a subset of the LDA-based and PCA-based classi-fiers.
Acknowledgment
The financial support from the Iran Telecommunica-tion Research Centre and the EU funded Project Mobio(http://www.mobioproject.org/) Grant IST-214324 is grate-fully acknowledged.
References
[1] D. Zhang and G. Lu, “Evaluation on similarity measurementfor image retrieval,” Neural Network and Signal Processing, vol.2, pp. 228–231, 2003.
[2] Q. Bao and P. Guo, “Comparative studies on similaritymeasures for remote sensing image retrieval,” in Proceedingsof the IEEE International Conference on Systems, Man andCybernetics (SMC ’04), pp. 1112–1116, October 2004.
[3] V. Perlibakas, “Distance measures for PCA-based face recogni-tion,” Pattern Recognition Letters, vol. 25, no. 6, pp. 711–724,2004.
[4] W. S. Yambor, B. A. Draper, and J. R. Beveridge, “AnalyzingPCA-based face recognition algorithm: eigenvector selectionand distance measures,” in Empirical Evaluation Methods inComputer Vision, H. Christensen and J. Phillips, Eds., WorldScientific Press, Singapore, 2002.
[5] M. Turk and A. Pentland, “Eigenfaces for recognition,” Journalof Cognitive Neuroscience, vol. 3, no. 1, pp. 71–86, 1991.
[6] P. N. Belhumeur, J. P. Hespanha, and D. J. Kriegman,“Eigenfaces vs. fisherfaces: recognition using class specific
linear projection,” IEEE Transactions on Pattern Analysis andMachine Intelligence, vol. 19, no. 7, pp. 711–720, 1997.
[7] J. Kittler, Y. P. Li, and J. Matas, “On matching scores forLDA-based face verification,” in Proceedings of British MachineVision Conference, M. Mirmehdi and B. Thomas, Eds., pp. 42–51, 2000.
[8] M. T. Sadeghi and J. Kittler, “Confidence based gating of mul-tiple face authentication experts,” in Proceedings of Joint IAPRInternational Workshops on Syntactical and Structural PatternRecognition and Statistical Pattern Recognition (SSPR ’06), vol.4109 of Lecture Notes in Computer Science, pp. 667–676, HongKong, August 2006.
[9] E. Bailly-Bailliere, S. Bengio, F. Bimbot et al., “The BANCAdatabase and evaluation protocol,” in Proceedings of Interna-tional Conference on Audio and Video Based Person Anthenti-cation, vol. 2688, pp. 625–638, 2003.
[10] M. T. Sadeghi, M. Samiei, S. M. T. Almodarresi, and J.Kittler, “Similarity measures fusion using SVM classifier forface authentication,” in Proceedings of the 3rd InternationalConference on Computer Vision Theory and Applications (VIS-APP ’08), vol. 2, pp. 105–110, Funchal, Madeira, Portugal,January 2008.
[11] J. Kittler, M. Hatef, R. P. W. Duin, and J. Matas, “On combiningclassifiers,” IEEE Transactions on Pattern Analysis and MachineIntelligence, vol. 20, no. 3, pp. 226–239, 1998.
[12] J. Kittler and F. Roli, Multiple Classifier Systems, vol. 2096,Springer, Berlin, Germany, 2001.
[13] L. Xu, A. Krzyzak, and C. Y. Suen, “Methods of combiningmultiple classifiers and their applications to handwritingrecognition,” IEEE Transactions on Systems, Man and Cyber-netics, vol. 22, no. 3, pp. 418–435, 1992.
[14] A. Verikas, A. Lipnickas, K. Malmqvist, M. Bacauskiene,and A. Gelzinis, “Soft combining of neural classifiers: acomparative study,” Pattern Recognition Letters, vol. 20, pp.429–444, 1999.
[15] F. Roli and G. Fumera, “Analysis of linear and order statisticscombiners for fusion of imbalanced classifiers,” in Proceedingsof the 3rd International Workshop on Multiple Classifier Sys-tems, pp. 252–261, Springer, Cagliari, Italy, June 2002.
[16] Y. Freund and R. E. Schapire, “A decision-theoretic general-ization of on-line learning and an application to boosting,”Journal of Computer and System Sciences, vol. 55, no. 1, pp.119–139, 1997.
[17] R. P.W. Duin, “The combining classifier: to train or not totrain?” in Proceedings of the International Conference on PatternRecognition, vol. 16, no. 2, pp. 765–770, 2002.
[18] K. Maghooli and M. S. Moin, “A new approach on multi-modal biometrics based on combining neural networks usingAdaBoost,” in Proceedings of the International ECCV Workshopon Biometric Authentication (BioAW ’04), vol. 3087, pp. 332–341, Prague, Czech, May 2004.
[19] M. T. Sadeghi, M. Samiei, and J. Kittler, “Selection and fusionof similarity measure based classifiers using support vectormachines,” in Proceedings of Joint IAPR International Workshopon Structural, Syntactic, and Statistical Pattern Recognition(SSPR ’08), vol. 5342 of Lecture Notes in Computer Science, pp.479–488, 2008.
[20] G. L. Marcialis and F. Roli, “Fusion of LDA and PCA forface verification,” in Proceedings of the International ECCVWorkshop on Biometric Authentication, M. Marcialis and J.Bigun, Eds., vol. 2359 of Lecture Notes in Computer Science,pp. 30–37, 2002.
[21] M. T. Sadeghi and J. Kittler, “Decision making in the LDAspace: generalised gradient direction metric,” in Proceedings of
12 EURASIP Journal on Advances in Signal Processing
the 6th IEEE International Conference on Automatic Face andGesture Recognition, pp. 248–253, Seoul, Korea, May 2004.
[22] A. Jain, K. Nandakumar, and A. Ross, “Score normalization inmultimodal biometric systems,” Pattern Recognition, vol. 38,no. 12, pp. 2270–2285, 2005.
[23] V. Vapnik, The Nature of Statistical Learning Theory, Springer,New York, NY, USA, 1995.
[24] J. Platt, “Sequential minimal optimization: a fast algorithmfor training support vector machines,” Tech. Rep. 98-14,Microsoft Research, Redmond, Wash, USA, April 1998.
[25] M. S. Bartlett, J. R. Movellan, and T. J. Sejnowski, “Face recog-nition by independent component analysis,” IEEE Transactionson Neural Networks, vol. 13, no. 6, pp. 1450–1464, 2002.
[26] M. Hamouz, J. Kittler, J.-K. Kamarainen, P. Paalanen, H.Kalviainen, and J. Matas, “Feature-based affine-invariantlocalization of faces,” IEEE Transactions on Pattern Analysisand Machine Intelligence, vol. 27, no. 9, pp. 1490–1495, 2005.
[27] K. Messer, J. Matas, J. Kittler, J. Luettin, and G. Maitre, “XM2VTSDB: the extended m2vts database,” in Proceedings ofthe 2nd International Conference on Audio and Video-basedBiometric Person Authentication, pp. 72–77, 1999.
The 2011 European Signal Processing Conference (EUSIPCO 2011) is thenineteenth in a series of conferences promoted by the European Association forSignal Processing (EURASIP, www.eurasip.org). This year edition will take placein Barcelona, capital city of Catalonia (Spain), and will be jointly organized by theCentre Tecnològic de Telecomunicacions de Catalunya (CTTC) and theUniversitat Politècnica de Catalunya (UPC).EUSIPCO 2011 will focus on key aspects of signal processing theory and
li ti li t d b l A t f b i i ill b b d lit
Organizing Committee
Honorary ChairMiguel A. Lagunas (CTTC)
General ChairAna I. Pérez Neira (UPC)
General Vice ChairCarles Antón Haro (CTTC)
Technical Program ChairXavier Mestre (CTTC)
Technical Program Co Chairsapplications as listed below. Acceptance of submissions will be based on quality,relevance and originality. Accepted papers will be published in the EUSIPCOproceedings and presented during the conference. Paper submissions, proposalsfor tutorials and proposals for special sessions are invited in, but not limited to,the following areas of interest.
Areas of Interest
• Audio and electro acoustics.• Design, implementation, and applications of signal processing systems.
l d l d d
Technical Program Co ChairsJavier Hernando (UPC)Montserrat Pardàs (UPC)
Plenary TalksFerran Marqués (UPC)Yonina Eldar (Technion)
Special SessionsIgnacio Santamaría (Unversidadde Cantabria)Mats Bengtsson (KTH)
FinancesMontserrat Nájar (UPC)• Multimedia signal processing and coding.
• Image and multidimensional signal processing.• Signal detection and estimation.• Sensor array and multi channel signal processing.• Sensor fusion in networked systems.• Signal processing for communications.• Medical imaging and image analysis.• Non stationary, non linear and non Gaussian signal processing.
Submissions
Montserrat Nájar (UPC)
TutorialsDaniel P. Palomar(Hong Kong UST)Beatrice Pesquet Popescu (ENST)
Procedures to submit a paper and proposals for special sessions and tutorials willbe detailed at www.eusipco2011.org. Submitted papers must be camera ready, nomore than 5 pages long, and conforming to the standard specified on theEUSIPCO 2011 web site. First authors who are registered students can participatein the best student paper competition.
Important Deadlines:
P l f i l i 15 D 2010
Industrial Liaison & ExhibitsAngeliki Alexiou(University of Piraeus)Albert Sitjà (CTTC)
International LiaisonJu Liu (Shandong University China)Jinhong Yuan (UNSW Australia)Tamas Sziranyi (SZTAKI Hungary)Rich Stern (CMU USA)Ricardo L. de Queiroz (UNB Brazil)
Webpage: www.eusipco2011.org
Proposals for special sessions 15 Dec 2010Proposals for tutorials 18 Feb 2011Electronic submission of full papers 21 Feb 2011Notification of acceptance 23 May 2011Submission of camera ready papers 6 Jun 2011


![Probabilistic Linear Discriminant Analysis · recognition [1,2]. Most notably, these include Principal Component Analysis (PCA) and Linear Discriminant Analysis (LDA). While PCA identifies](https://static.documents.pub/doc/80x56/5ede10ffad6a402d66695710/probabilistic-linear-discriminant-analysis-recognition-12-most-notably-these.jpg)


![Image Compression Methods using Dimension Reduction and ... · improving image compression using PCA, LDA, 2D-PCA for gray scale and colored images. Md. Mofarreh [3] [10] and Telgaonkar](https://static.documents.pub/doc/80x56/5ea403da97bc6a06723a13c0/image-compression-methods-using-dimension-reduction-and-improving-image-compression.jpg)
