Future Challenges for Ensemble VisualizationHarald Obermaier and Kenneth I. JoyUniversity of California, Davis
How often have you executed an algorithm, only to fi nd that getting reasonable results means changing parameters and restart-
ing? How much time did you spend fi nding the correct parameters? Imagine going through the same ordeal with unbelievably complex simulation models used for predicting physical phenomena. Scientists have fought this battle for many years and have long been sick of sitting, waiting, and restarting.
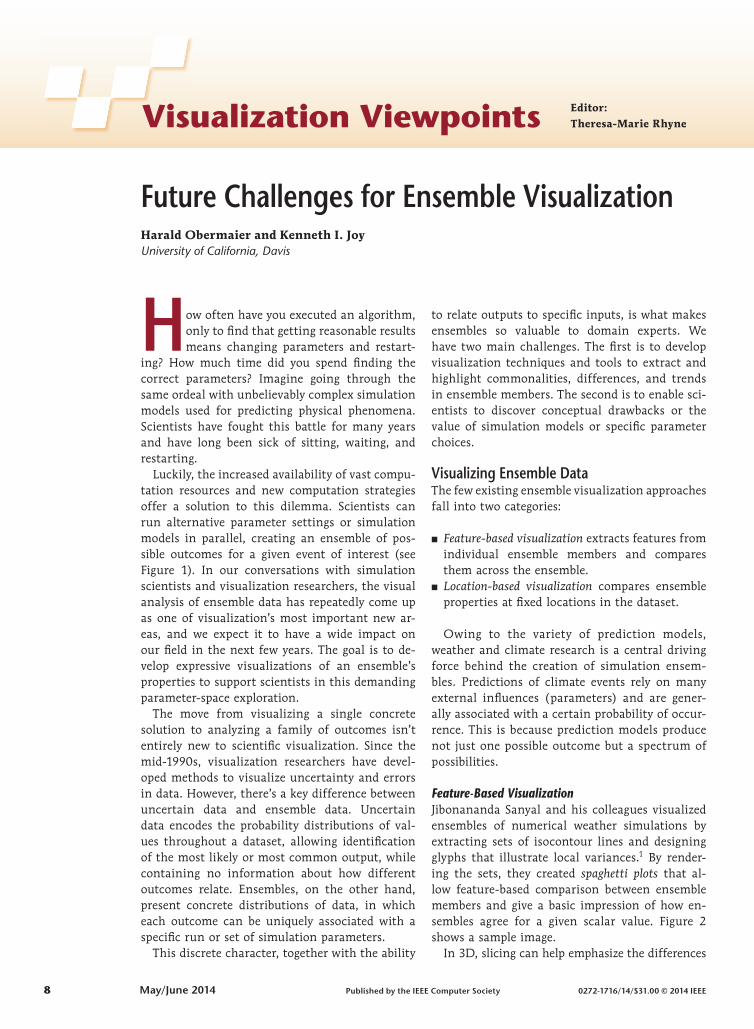
Luckily, the increased availability of vast compu-tation resources and new computation strategies offer a solution to this dilemma. Scientists can run alternative parameter settings or simulation models in parallel, creating an ensemble of pos-sible outcomes for a given event of interest (see Figure 1). In our conversations with simulation scientists and visualization researchers, the visual analysis of ensemble data has repeatedly come up as one of visualization’s most important new ar-eas, and we expect it to have a wide impact on our fi eld in the next few years. The goal is to de-velop expressive visualizations of an ensemble’s properties to support scientists in this demanding parameter-space exploration.
The move from visualizing a single concrete solution to analyzing a family of outcomes isn’t entirely new to scientifi c visualization. Since the mid-1990s, visualization researchers have devel-oped methods to visualize uncertainty and errors in data. However, there’s a key difference between uncertain data and ensemble data. Uncertain data encodes the probability distributions of val-ues throughout a dataset, allowing identifi cation of the most likely or most common output, while containing no information about how different outcomes relate. Ensembles, on the other hand, present concrete distributions of data, in which each outcome can be uniquely associated with a specifi c run or set of simulation parameters.
This discrete character, together with the ability
to relate outputs to specifi c inputs, is what makes ensembles so valuable to domain experts. We have two main challenges. The fi rst is to develop visualization techniques and tools to extract and highlight commonalities, differences, and trends in ensemble members. The second is to enable sci-entists to discover conceptual drawbacks or the value of simulation models or specifi c parameter choices.
Visualizing Ensemble DataThe few existing ensemble visualization approaches fall into two categories:
■ Feature-based visualization extracts features from individual ensemble members and compares them across the ensemble.
■ Location-based visualization compares ensemble properties at fi xed locations in the dataset.
Owing to the variety of prediction models, weather and climate research is a central driving force behind the creation of simulation ensem-bles. Predictions of climate events rely on many external infl uences (parameters) and are gener-ally associated with a certain probability of occur-rence. This is because prediction models produce not just one possible outcome but a spectrum of possibilities.
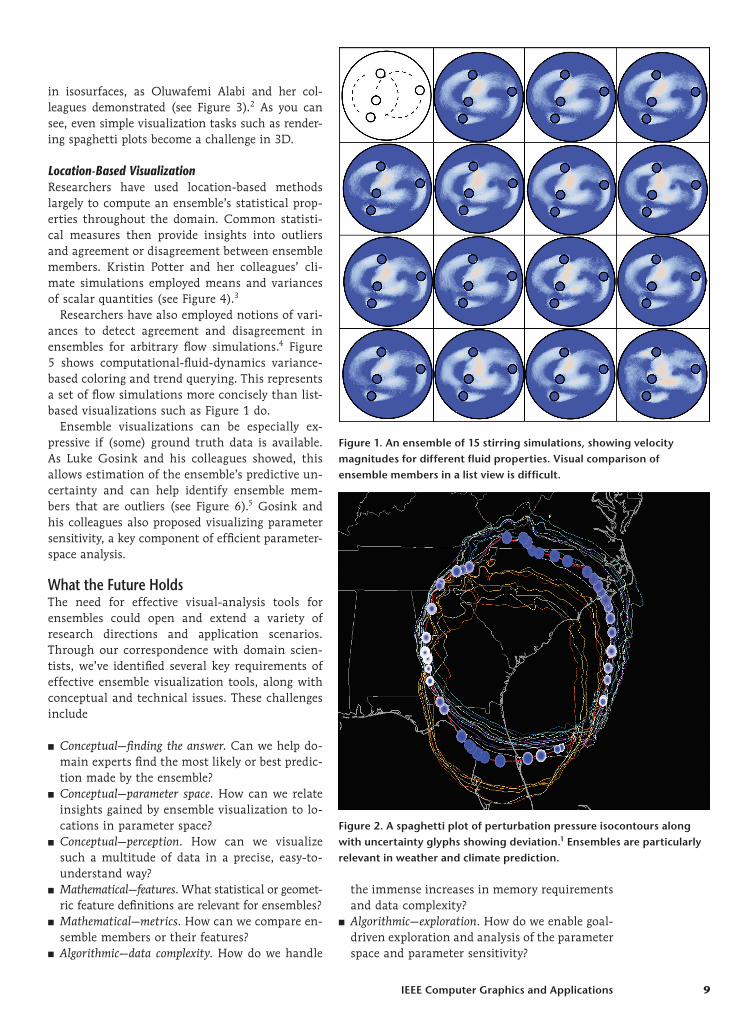
Feature-Based VisualizationJibonananda Sanyal and his colleagues visualized ensembles of numerical weather simulations by extracting sets of isocontour lines and designing glyphs that illustrate local variances.1 By render-ing the sets, they created spaghetti plots that al-low feature-based comparison between ensemble members and give a basic impression of how en-sembles agree for a given scalar value. Figure 2 shows a sample image.
In 3D, slicing can help emphasize the differences
g3vis.indd 8 4/24/14 8:20 PM
IEEE Computer Graphics and Applications 9
in isosurfaces, as Oluwafemi Alabi and her col-leagues demonstrated (see Figure 3).2 As you can see, even simple visualization tasks such as render-ing spaghetti plots become a challenge in 3D.
Location-Based VisualizationResearchers have used location-based methods largely to compute an ensemble’s statistical prop-erties throughout the domain. Common statisti-cal measures then provide insights into outliers and agreement or disagreement between ensemble members. Kristin Potter and her colleagues’ cli-mate simulations employed means and variances of scalar quantities (see Figure 4).3
Researchers have also employed notions of vari-ances to detect agreement and disagreement in ensembles for arbitrary flow simulations.4 Figure 5 shows computational-fluid-dynamics variance-based coloring and trend querying. This represents a set of flow simulations more concisely than list-based visualizations such as Figure 1 do.
Ensemble visualizations can be especially ex-pressive if (some) ground truth data is available. As Luke Gosink and his colleagues showed, this allows estimation of the ensemble’s predictive un-certainty and can help identify ensemble mem-bers that are outliers (see Figure 6).5 Gosink and his colleagues also proposed visualizing parameter sensitivity, a key component of efficient parameter-space analysis.
What the Future HoldsThe need for effective visual-analysis tools for ensembles could open and extend a variety of research directions and application scenarios. Through our correspondence with domain scien-tists, we’ve identified several key requirements of effective ensemble visualization tools, along with conceptual and technical issues. These challenges include
■ Conceptual—finding the answer. Can we help do-main experts find the most likely or best predic-tion made by the ensemble?
■ Conceptual—parameter space. How can we relate insights gained by ensemble visualization to lo-cations in parameter space?
■ Conceptual—perception. How can we visualize such a multitude of data in a precise, easy-to-understand way?
■ Mathematical—features. What statistical or geomet-ric feature definitions are relevant for ensembles?
■ Mathematical—metrics. How can we compare en-semble members or their features?
■ Algorithmic—data complexity. How do we handle
the immense increases in memory requirements and data complexity?
■ Algorithmic—exploration. How do we enable goal-driven exploration and analysis of the parameter space and parameter sensitivity?
Figure 1. An ensemble of 15 stirring simulations, showing velocity magnitudes for different fluid properties. Visual comparison of ensemble members in a list view is difficult.
Figure 2. A spaghetti plot of perturbation pressure isocontours along with uncertainty glyphs showing deviation.1 Ensembles are particularly relevant in weather and climate prediction.
g3vis.indd 9 4/24/14 8:20 PM
10 May/June 2014
Visualization Viewpoints
One especially challenging direction is the vi-sualization and exploration of multidimensional parameter spaces. We’re investigating how high-dimensional data visualization techniques can help connect ensemble and parameter-space analysis. Specifically, a major question still needs answer-ing: whether and how recent research in com-putational steering, parameter-space exploration (for example, Jürgen Waser and his colleagues’ re-search6), and multivariate analysis is applicable to complex ensemble visualization problems.
Providing domain scientists with ensemble vi-sualization solutions will be a key factor in
improving analysis performance in complex simu-lation environments. Solving the inherent visualiza-tion challenges will increase the speed with which scientists can explore, adapt, and validate simulation models. We expect the visualization community to engage in this pursuit, thereby improving the robustness and reliability of simulation-based pre-diction and decision making.
AcknowledgmentsThis research was supported partly by the US Na-tional Science Foundation (contracts IIS 0916289 and IIS 1018097) and the Office of Advanced Scientific Computing Research, Office of Science, through US Department of Energy SciDAC (Scientific Discovery through Advanced Computing) contracts DE-FC02-06ER25780 and DE-FC02-12ER26072 (SDAV; Scal-able Data Management, Analysis, and Visualization).
References 1. J. Sanyal et al., “Noodles: A Tool for Visualization of
Numerical Weather Model Ensemble Uncertainty,” IEEE Trans. Visualization and Computer Graphics, vol. 16, no. 6, 2010, pp. 1421–1430.
2. O.S. Alabi et al., “Comparative Visualization of Ensembles Using Ensemble Surface Slicing,” Visualization and Data Analysis 2012, Proc. SPIE 8294, 2012.
3. K. Potter et al., “Ensemble-Vis: A Framework for the Statistical Visualization of Ensemble Data,” Proc. IEEE Workshop Knowledge Discovery from Climate Data: Prediction, Extremes, 2009, pp. 233–240.
4. M. Hummel et al., “Comparative Visual Analysis of Lagrangian Transport in CFD Ensembles,” IEEE Trans. Visualization and Computer Graphics, vol. 19, no. 12, 2013, pp. 2743–2752.
5. L. Gosink et al., “Characterizing and Visualizing Predictive Uncertainty in Numerical Ensembles
Figure 3. Rendering of sliced isosurfaces from four ensemble members.2 Feature-based comparison in 3D is challenging and can suffer from occlusion and visual complexity. (Source: Oluwafemi Alabi and her colleagues; used with permission.)
Figure 4. This visualization combines isocontouring and color mapping to reveal mean and standard deviation.3 It implicitly conveys correlations of the two variables.
Figure 5. This visualization employs color-mapped transport variance to reveal agreement and disagreement in an ensemble of computational-fluid-dynamics simulations.4 It identifies trends as pathline clusters. A large number of ensemble members might lead to cluttered pathline renderings.
g3vis.indd 10 4/24/14 8:20 PM
IEEE Computer Graphics and Applications 11
through Bayesian Model Averaging,” IEEE Trans. Visualization and Computer Graphics, vol. 19, no. 12, 2013, pp. 2703–2712.
6. J. Waser et al., “Nodes on Ropes: A Comprehensive Data and Control Flow for Steering Ensemble Simulations,” IEEE Trans. Visualization and Computer Graphics, vol. 17, no. 12, 2011, pp. 1872–1881.
Harald Obermaier is a postdoctoral researcher in the
Computer Science Department at the University of Califor-nia, Davis. Contact him at [email protected].
Kenneth I. Joy is a professor in the Computer Science De-partment at the University of California, Davis. Contact him at [email protected].
Figure 6. Evaluating an ensemble member’s predictive uncertainty through accuracy classifi cation according to a probabilistic ground truth model.5 Ground truth data provides a basis for more complex analysis and classifi cation of ensemble data. Visualizing complex classifi cations in 3D can be diffi cult.
IEEE Computer Society’s Conference Publishing Services (CPS) is now offering conference program mobile apps! Let your attendees have their conference schedule, conference information, and paper listings in the palm of their hands.
The conference program mobile app works for Android devices, iPhone, iPad, and the Kindle Fire.