Future Internet Bandwidth Trends: An Investigation on Current and Future Disruptive Technologies Yanyan Zhuang Justin Cappos Theodore S. Rappaport Rick McGeer Department of Computer Science and Engineering Technical Report TR-CSE-2013-04 11/01/2013
Transcript
Future Internet Bandwidth Trends:
An Investigation on Current and Future
Disruptive Technologies
Yanyan Zhuang Justin Cappos Theodore S. Rappaport Rick McGeer
Department of Computer Science and Engineering
Technical Report TR-CSE-2013-04
11/01/2013
Future Internet Bandwidth Trends: An Investigation onCurrent and Future Disruptive Technologies∗
Yanyan Zhuang†‡, Justin Cappos‡, Theodore S. Rappaport‡, Rick McGeerC†University of British Columbia
‡Polytechnic Institute of NYUCHP Labs
Abstract / Executive Summary
New technologies sometimes result in disruptive changesto the existing infrastructure. Without adequate fore-sight, industry, academia, and government can be caughtflat-footed. In this work, we focus on the trends sur-rounding home Internet bandwidth — the bandwidth re-quired by end user applications at home. As building andmanaging last mile network infrastructure incurs sub-stantial cost, the foresight of such trends is necessary toplan upgrades.
Using a bottom-up approach, we look at four poten-tially disruptive technologies, including millimeter wavewireless (mm-wave), the Internet of Things (IoT), FogComputing, and Software Defined Networking (SDN).We examine use cases proposed by academia and indus-try, delve into the bandwidth requirements for proposedapplications, and use this data to forecast future trafficdemands for typical home users. Our projections showthat bandwidth changes at end user devices will mostlikely be driven by two of the above technologies: mil-limeter wave wireless and Fog Computing. These tech-nologies not only change the peak bandwidth, but alsohave noticeable secondary effects on bandwidth such asincreasing upload bandwidth use, improving flash crowdtolerance, and increasing off-peak demand. While IoTand SDN are important, innovative technologies, theywill not drastically alter the bandwidth usage patterns ofordinary users at home. We hope that the data and rec-ommendations from this study can help business leadersand policy makers get an early jump on emerging tech-nologies before they begin to shape the economy and so-ciety.
∗This paper was written with financial support from the TimeWarner Cable Research Program on Digital Communications, 2013.The views expressed are those of the author(s) and not necessarily thoseof Time Warner Cable or the Time Warner Cable Research Program onDigital Communications.
1 Introduction
Disruptive technologies, such as the steam power in theIndustrial Revolution, semiconductor microchips, or theInternet, have transformed the way ordinary people liveand work. These technologies are capable of creatingopportunities for introducing new concepts, and creatingpathways to altering the pre-existing infrastructures andpre-established orders. This work investigates the disrup-tive technologies that can potentially change the Internetbandwidth use of end users with a bottom-up approach.The technologies range from the fundamental physics indata transmission from one device to another, to the ab-stract, high-level programmability in a network.
This work investigates how bandwidth needs willchange over the next 10 years. In particular, there areseveral distinctions that make our work unique in thisspace, and different from previous work [80, 86].
• Providers know their users and deployment.
It is assumed that industrial leaders and policy mak-ers are aware who the targeted users of their net-works are. The question is then “what are the un-known unknowns?” For example, what new wire-less technology can drastically change the band-width needs and usage patterns of users; whatchanges in the Cloud infrastructure can lead tomuch higher bandwidth and much lower latency;etc.
• Focus on home users.
The focus of this work is not enterprise, businessor academic users with super computation and stor-age power, but rather, ordinary home users. Theseusers move relatively more frequently, own deviceswith limited capability, while still require satisfac-tory user experience.
• Focus on bandwidth.
Bandwidth is the main focus of this work, instead ofprogrammability and other factors. Different fromthe industrial or academic networks, home networkshave different providers on the access link. To pro-vide satisfactory user experiences, bandwidth is themajor concern for both users and service providers.
• Focus on technical need.
Only technical aspect, instead of economic, socialor legal aspects, will be considered in this work.While the technologies in this work have a tremen-dous impact on the economy and society, these fac-tors are out of the scope of this work. Any legalissues are also not within the scope.
• Assume existing infrastructure exists.
New technology will only be adopted when appro-priate given other choices in the marketplace. Ifbuilding a service using existing technology makessense from a legal, financial, and performancestandpoint, there is no reason to adopt new technol-ogy to do so.
Finally, we would like to emphasize the last distinc-tion in the above list. A blind-spot that comes up repeat-edly by studies examined in this work is technology thatcould be done much more effectively with cloud com-puting infrastructure. Namely, the cloud provides inex-pensive, medium latency access to effectively unlimitedcomputation and storage capacity. Thus unless the la-tency, financial, or legal attributes of the cloud are not at-tractive for that application domain, the application willlikely be done with existing cloud technologies.
This has the effect of bounding data intensive appli-cations to the bandwidth needed, e.g., to run a VLC ter-minal. For example, assume that an application provideshigh resolution maps. Instead of distributing these highresolution maps to clients and having them select the areato display on the screen, we believe that these serviceswould be built as web applications that are hosted in thecloud. Only the selected map area by clients will betransferred over the Internet, so that both traffic and la-tency will be reduced. This is a common practice used bymost services today, and it effectively limits the amountof bandwidth needed that can saturate the user’s outputdevices.
1.1 Internet Bandwidth and DisruptiveTechnologies
The growth in Internet bandwidth has historically beenfueled by two factors. First is the natural growth in band-width as more user become online, new media formatsare adopted, and users purchase devices with new ca-pabilities. These factors are relatively well-known and
predictable, due to the improvement in the capacity andaffordability of processors, memory and disks, etc. Thesecond factor comes from disruptive technologies thatdramatically shift the bandwidth use pattern by shift-ing how users access the network. This includes tech-nologies and applications discussed in this work, whichhave resulted in a ground-swell of use that was funda-mentally different than previous expectations would havepredicted.
This work will focus on a study of the likely futurebandwidth use of four different emerging trends that maypotentially be disruptive to Internet bandwidth consumedby end users. In particular, we will study the effect thatthe following technologies would have on peak networkbandwidth:
Millimeter wave radio access (mm-wave). One ma-jor factor that is driving Internet bandwidth consumptionis the move to from wired networks to wireless, such asWiFi and cellular services. While wireless technologieshave brought significant flexibility to people’s everydaylife by allowing mobility, the scarce wireless spectrumis facing global bandwidth shortage [93], a fact exac-erbated by the drastically increased number of wirelessdevices. By the end of 2013, there were one and a halfbillion smartphones in use [50], which means 22% of theworld population owns a smartphone. According to therecent data released by the International Data Corpora-tion (IDC), 87% of connected devices sales by 2017 willbe tablets and smartphones [30]. One potentially disrup-tive effort by NYU WIRELESS [49] is looking to usenew spectrum bands and other optimizations to increasewireless bandwidth by a factor of up to 1000 within thenext few years. We will study the potential impact thatthese technologies will have on end user bandwidth.
Internet of things (IoTs). Over time, more and moreconsumer devices are becoming connected to the Inter-net. These not only include laptops and smartphones,but also power meters, washing machines, thermostats,refrigerators and light bulbs. As more daily devices be-come connected and bring more convenience to people’severyday life, this may also shift the use patterns of net-work bandwidth and result in a different bandwidth de-mand curve. We will study the likely impact of such atrend impacted by smart, networked things in daily life.
Community Cloud / Fog Computing. Recent de-velopment in Cloud Computing features centralized dataprocessing and storage. Overlay networks and peer-to-peer systems, on the other hand, have demonstrated ex-cellent growth potential because they can be directly de-ployed by end users. A community cloud will leverage amiddle ground by embracing the distributed network na-ture while providing virtualized computation to request-ing users. Since network operators need not deploy hard-ware or software, these systems can become widely de-
2
ployed in a short time. In a similar vein, Fog Computing,as is advocated by Cisco [76], embeds cloud computinginfrastructure in routers and switches directly connectedto end user devices. By utilizing idle computing and net-work capacity on these edge devices, such systems pos-sess the potential to unlock and pool these capabilities.
Software defined networking (SDN) for home net-works. Technologies such as OpenFlow [51] are be-ing touted in the data center as an easy way to moreefficiently utilize bandwidth and provide additionalprogrammability without repeatedly changing networkhardware. There are efforts like US Ignite [68], MozillaIgnite [42] and GENI [24] that are interested in seeinghow this technology can transform consumer networksand applications. We will study possible consumer appli-cations and deployment paths to understand their impacton bandwidth usage by end users.
1.2 Road MapThrough this work, our goal is to perform an investiga-tion of disruptive technologies from an end-user perspec-tive. Using this analysis policy makers can shift fundingand national priorities, academic researchers can targetfuture research to stay ahead of industry, and industrycan have the agility to adapt to coming market, societal,technical and economical changes. The rest of this pa-per is organized as follows. Sections 2 to 5 introduceour study on the four disruptive technologies: mm-waveradio access, the Internet of Things, Community Cloudand Fog Computing, and Software Defined Networking.Finally, Section 6 concludes this work.
2 Mm-Wave Radio Access
2.1 Background5G [3] denotes the next major phase of mobile telecom-munications standards beyond the current 4G standard.According to historical data, new mobile generationhas appeared approximately every 10th year since thefirst commercially automated cellular network, the 1Ggeneration that was launched in Japan by NTT around1980 [1]. It is suggested that a new generation of 5Gstandards may be introduced approximately in the early2020’s [83]. New mobile generations are typically as-signed new frequency bands and wider spectral band-width per frequency channel. A comparison between 1Gto 5G is given in [90], and the results are presented herein Table 1. As these previous generations of radio tech-nologies have already resulted in substantial increase inthe peak bit rate, it will be interesting to project how 5Gplays a role in radio technology for even higher band-width. One effort by NYU WIRELESS [49] in 5G is
looking to use mm-wave radio access and other optimiza-tions to increase wireless bandwidth by a factor of up to1000 within the next few years. This section providesour insight into the likely bandwidth of mm-wave, andhow it will affect the end user data usage pattern.
2.2 The Usage of Millimeter Wave Spec-trum
The development of wireless technology has led tochanges in the way mobile and wireless network systemsare used. Our vision is that the introduction of millimeterwave (mm-wave) technology, together with the emerg-ing newer generation of wireless devices such as smart-phones and tablets, and the wide variety of exciting ap-plications, will lead to higher data rates and bandwidthuse from denser crowds of users. This will also resultin higher requirements on the end-to-end performance,service quality and user-experience. Compared to thecurrent wireless and mobile networks, where the carrierradio frequencies are between 700 MHz and 2.6 GHz,mm-wave frequencies that are up to 90 GHz is one solu-tion to 5G, which can be used for both wireless backhauland access networks.
In 2009, researchers have proposed 5G as a user-centric concept instead of operator-centric as in 3G orservice-centric concept as seen for 4G [81]. The fol-lowing introduces some of the radio access technologiesin 5G, as well as its advantages in handling higher datarate, increased data traffic, and more efficient use of radiospectrum.
2.2.1 Higher Bandwidth Allocations
The continued advances and discoveries in computingand communications, and the emergence of new con-sumer devices has resulted in ever-increasing demand onbandwidth and capacity. Although the service providerstoday promise to deliver high quality, low latency, con-tent rich applications for mobile devices, the current car-rier frequency spectrum has been limited to the verycrowded range between 700 MHz and 2.6 GHz. Thehigher bandwidth use and traffic poses challenges to pro-viding positive user experience and sustaining increaseddemands on bandwidth. This leads to a major cause ofglobal bandwidth shortage. The global spectrum band-width allocation for all cellular technologies does not ex-ceed 780 MHz, where each major wireless provider hasapproximately 200 MHz across all of the different cellu-lar bands of spectrum available [92]. To support the evergrowing data rate demands and exponentially increasingtraffic volumes, higher spectrum availability and moreadvanced radio access technology is needed.
3
Generation Time Period Definition Technology Bandwidth Features1G 1980 – 1990 Analog AMPS, NMT, TACS 14.4 Kbps (peak) Wireless phones are used for voice only.
2G 1990 – 2000 Digital narrowband circuit data TDMA, CDMA 9.6/14.4 Kbps
Allowing multiple users on a single channel viamultiplexing; wireless phones are used for dataand voice.
Bandwidth is further increased to keep up withdata access demand by various services; highdefinition streaming is supported; new deviceswith HD capabilities surface; portability isincreased further.
5G Likely from 2020 To be determined
LAS-CDMA,OFDM, MC-
CDMA, UWB,Network-LMDS,
IPv6, and many more
At least 1 Gbps
Provide very high bandwidth, efficient use ofavailable bandwidth as seen through developmentof each new technology, affordable rates, higherpeak bandwidth and reliability.
Table 1: The evolution of 1G to 5G: capabilities of each technology and features that can be supported [90].
Different from the current wireless solutions, mm-wave utilizes the unused wireless spectrum at muchhigher frequencies. Therefore, it will not compete withthe existing wireless spectrum allocation that is alreadycrowded. According to a recent research study by NYUWIRELESS [94],
“The main differences of 5G compared to4G will be the use of much greater spectrumallocations at untapped mm-wave frequencybands, longer battery life, lower outage prob-ability, much higher bit rates in larger por-tions of the coverage area, lower infrastructurecosts, and higher aggregate capacity for manysimultaneous users in both licensed and unli-censed spectrum (e.g. the convergence of WiFiand cellular). The backbone networks of 5Gwill move from copper and fiber to mm-wavewireless connections, allowing rapid deploy-ment and mesh-like connectivity with cooper-ation between base stations.”
Mm-wave carrier frequencies allow for larger band-width allocations, which means higher data transferrates, increased data capacity, and much lower latency.Furthermore, given the increased bandwidth, both base-station-to-device links, and the backhaul links betweenbase stations will have greater capacity to accommodateincreased data traffic.
2.2.2 Massive Dense Networks and Advantages
One important advantage of using mm-wave is the re-duced cell size. As seen in Figure 1, a low radio fre-quency corresponds to larger wavelength, and large cov-erage area. In contrast, radio technologies using higher
850 MHz 1.8 GHz 2.1 GHz2.6 GHz
Base Station Coverage Area
Available Bandwidth
LowHigh
Figure 1: Radio frequency and cell size in current wire-less and mobile networks.
carrier frequencies have much smaller cell coverage. Forexample, the carrier frequency of 4G is between 2.4to 2.6 GHz, which requires 9 times the site density tomatch the cell size in 800 MHz. Because of the muchhigher carrier frequency and short wavelength, mm-wave, which operates up to 90 GHz, has much smallercoverage range compared to other radio technologies.
Spatial reuse and flexibility. The reduced coverageis beneficial for the current operators, who continue toreduce cell coverage areas to exploit spatial reuse. Asmm-wave proliferates, the cost per base station will drop,making wireless backhaul essential for flexible, quick de-ployment, and reduced ongoing operating costs. Mm-wave supported base stations will become more plentifuland densely distributed over the urban area. Currently,there are 28 GHz and 38 GHz bands available for oper-ation, with spectrum allocations of over 1 GHz of band-width.
Closer spectral allocation. Instead of the disjointedspectrum allocated to many cellular operators today, themm-wave spectrum will have spectral allocations that are
4
relatively much closer together. Having the frequencyallocation as of today’s radio technologies, the resultingcoverage distances of cells vary largely over three oc-taves [94]. With closer band allocations, the mm-wavespectrum makes the propagation characteristics of differ-ent mm-wave bands much more comparable and homo-geneous.
Traffic offloading, energy efficiency and environ-mental factors. Small cells offload traffic from base sta-tions by overlaying a layer of small cell access points.Such a mechanism decreases the average distance be-tween the access points and end users, resulting in lowerpropagation losses and higher data rates and energy effi-ciency [96]. Moreover, as opposed to the common mythin the wireless engineering community that rain and at-mospheric absorption make mm-wave spectrum uselessfor mobile communications, the study in [94] shows thatmm-wave can overcome these issues.
2.2.3 Radio Penetration and Propagation Charac-teristics
Understanding the characteristics of the new radio tech-nology itself is critical. In particular, radio technologiescan behave differently when indoor as compared to out-doors. These characteristics will serve as a guidance forresearchers, industry practitioners and service providersto plan the wireless network, set up access points andcellular base stations, etc.
Indoor penetration and reflection. According to thestudy in [94], common building materials such as tintedglass and brick pillars that are typical exterior surfaces ofurban buildings, have high penetration losses with mm-wave transmissions. Therefore, building penetration ofmm-waves will be difficult for outdoor transmitters. Thiswill lead to high isolation between outdoor and indoornetworks. On the other hand, common indoor materialssuch as clear non-tinted glass and drywall have relativelylow penetration losses. This suggests that repeaters oraccess points may need to be installed for handoffs atentrances of commercial and residential buildings. Fur-thermore, the indoor penetration loss does not greatly de-pend on the transmitter-receiver separation distance, butmostly depends on the number and type of obstructions.
The reflection coefficient is also studied in [94]. Onthe surface boundary of different materials, a larger re-flection coefficient indicates that more radio signals arereflected back and thus cannot penetrate. The researchfound that the outdoor materials have larger reflectioncoefficients for tinted glass and concrete, as compared toclear non-tinted glass and drywall. The high penetrationloss through outdoor building materials and low attenua-tion through indoor materials suggest that RF energy ofmm-wave can be contained in intended areas.
Urban propagation. The authors of [94] also studiedthe radio propagation in different urban scenarios, e.g.,Brooklyn, Manhattan and Austin, Texas. The 28 GHzradio was tested in New York City, whereas the 38 GHzradio was tested in Austin. The measurement was con-ducted for signal acquisition, path loss, outage probabil-ity around transmitter sites, etc. Although New York Cityshows higher signal cluttering and path loss comparedto Austin, the measurement results showed consistent200 m cell radius, within which signal outage does notoccur. Furthermore, by aligning base station antenna ori-entation, the path loss experienced by mm-wave is iden-tical to today’s 700 MHz to 2.6 GHz bands.
2.3 Typical Use Cases
As one of the important trends and foreseeable futureneeds of mobile and wireless networks, it is expectedthat 5G will bring forward traffic volume explosion innew application areas. From an end user’s point of view,the end user bandwidth usage will be drastically changedby the mm-wave technology of 5G in four aspects, from(1) very high data rate, and hence, much lower latency,to (2) lower energy cost, and by (3) very dense crowds ofusers with a massive number of devices. The followingare some of the typical use cases in these four aspects,demonstrating such dramatic change in network band-width usage pattern.
2.3.1 Very High Data Rate
Traditional wireless 3D videos and remote collaborationapplications face significant challenges when the connec-tions become wireless. Today’s wireless technologies arenot capable to provide, at reasonable costs, the high datarate and capacity requirements posed by these applica-tions on the access and backhaul wireless networks.
To meet the demand of high-definition, real-time videostreaming, access network end users should be able to ex-perience sustainable data rates of around 70 to 140 Mbps,from the end user device to the base station or accesspoint. Such a requirement is particularly prevalent inhome networks with large screens and displays of highresolutions. The calculation of this data rate requirementis given in Section 2.4.1 and Appendix A.2. With the cur-rent wireless network, such as LTE, the peak downloadrates up to 299.6 Mbps and upload rates up to 75.4 Mbpsdepending on the user equipment category [41]. How-ever, in the near future, different applications need to beaggregated or pooled for various purposes, such as theflash crowd situation (Section 2.3.3), or virtual realityapplications (Section 5.4.2). As seen, the bandwidth re-quirement in those application scenarios will very likelyto reach or exceed hundreds of Mbps, or even several
Table 2: Annual electricity cost ($/year) of in-home energy consumption (e.g. charging phones and keeping computersand TVs plugged in): smartphones and tablets use much less energy [27].
Gbps. With mm-wave, the bandwidth provided can eas-ily meet such requirement in the future by supportingdata rate of at least 1 Gbps (Section 2.2.2).
For practitioners and service providers, the backhaulinfrastructure is equally important as the user experi-ence. Whether in a residential apartment or in a corporatebuilding, it is highly desirable to have a high speed con-nection, such as optical fiber, available on each floor andacross different floors. However, for reasons of flexibil-ity, installation simplicity and cost, the amount of cablingand rewiring should be avoided or minimized. For thetransport backhaul, the installation of building’s commu-nication network should be quick and with small impacton the building structure. As in Section 2.2, mm-waveradio can be used as both the access and backhaul net-work. As a result, installation and maintenance of back-haul network becomes smooth without troublesome con-figurations. Even in case of building emergency, such asduring an earthquake or a hurricane, wireless backhaul isless likely to totally collapse. The ultra high speed pro-vided by mm-wave will come to the rescue of hundredsof lives.
Very Low Latency. The high-speed, high-bandwidthlast hop and backhaul wireless connections result in verylow latency. This provides opportunities for real-timemonitoring of events, such as traffic emergency. Ev-eryday devices, like smartphones and embedded sensors,can collect and analyze data in emergent events and pro-vide feedback in real time. Mm-wave technologies henceenable a lot of ultra-low-latency applications for the In-ternet of Things (IoTs). These applications will be de-tailed in Section 3.
2.3.2 Very Low Energy Cost
Today’s end user devices feature rich content and di-verse applications, often operating over wireless networkconnections. Study has shown that if a smartphone isplugged into the wall, it consumes a negligible amount ofenergy compared with other household electronics [27].Table 2 shows the annual electricity cost of smartphonesand tablets compared to other home electronic devicesabout their in-home energy consumption. However, todeliver a total of an hour of video to a smartphoneor tablet each week, over a year it adds up to higherpower consumption than two new Energy Star refriger-ators [27]. Therefore, it is desirable that as little energyas possible is required to maintain the uptime of these de-
vices. As in Section 2.2.2, mm-wave uses small cell sizewith small coverage range, which decreases the averagedistance between the infrastructure, base station and enddevices, resulting in lower propagation losses and higherenergy efficiency.
In February 2013, a project named 5GrEEn started,whose focus is on the design of Green 5G Mobile net-works [5]. The project goal is to develop guidelines forthe definition of new generation network with particularcare of energy efficiency, sustainability and affordabilityaspects. There are also other green 5G wireless initia-tives. For example, some of the world’s biggest telecomsfirms joining forces with the UK government to fund anew 5G research center [4]. Their goal is to offer testingfacilities to operators keen to develop a mobile standardthat uses less energy and radio spectrum. With more rele-vant projects launching, 5G will become a wireless tech-nology that is even more energy efficient.
2.3.3 Very Dense Crowds of Users
In our daily life, we can expect that wireless networksprovide connections with both high data rate and low la-tency. However, there are special events, such as sportsgames or concerts where a huge number of people gatherin a relatively small space. People can exchange multi-media content with their smart devices both within theevent location or transmit the content outside. With to-day’s wireless solutions, service providers experiencedifficulty in providing a service with good quality inthese situations. The difficulties are mainly caused bythe extreme crowdedness, or the huge number of userdevices, that requires very peculiar infrastructure deploy-ment. Meanwhile, such services have to be provided forvery limited time intervals, adding constraints and over-head from a cost perspective.
The potential solution is provide the service operatorsor event organizers the possibility to offer rich wirelesscommunication services at lower deployment cost andenergy consumption than with today’s solutions. Addi-tionally, one has to offer a reliable and extremely hugebandwidth service to a multitude of users temporarily lo-cated in an already deployed area, such as a stadium ora sport facility. 5G mm-wave technology can achievethese requirements with its dense deployment, low costof base station installation, and higher spatial reuse forincreasing system capacity (Section 2.2.2).
6
2.4 Conclusions: Potential for 1,000 Timesthe Capacity of 4G
The uncrowded, license-free mm-wave frequencies canprovide 50 to 100 times more user capacity than that isreadily available. When combined with other optimiza-tions, mm-wave is expected to increase wireless band-width by a factor of up to 1,000 than current 4G withinthe next few years [59]. According to recent measure-ment, current mm-wave already supports a bandwidth ofat least 1 Gbps, the bandwidth that can sustain the mostdemanding applications such as high-definition videostreaming. Such bandwidth demands are calculated inthis section.
2.4.1 Case Study: Bandwidth Requirement of Fu-ture Retina Display
With the increasing number of personal and home de-vices, increased data created, and the resulting content-rich applications, video streaming in particular, has be-come the application that requires the highest amount ofbandwidth. Yet, video streaming is becoming much morewidely used by end users for both work and leisure.
Video streaming is directly related to display technolo-gies, where the pixel density [54], display size, colordepth [13], frame rate, among other factors, determinethe bandwidth requirement. The latest buzz word in thecurrent display technology is the “Retina Display”, abrand name used by Apple for the LCD display that hasa high enough pixel density that the human eye is unableto notice pixelation at a typical viewing distance [58].This term was first invoked by Steve Jobs in 2010, wherea magic number 300 pixels per inch (ppi) was men-tioned [39]. At the pixel density of 300 ppi, if a device isheld between 10 to 12 inches from one’s eye, the resolu-tion of the device display outweigh the ability of humaneye to resolve the differences between the original pixels.
According to a survey, the most popular TV screensize in the US in 2013 is 40 inches diagonally [69]. Atthe 2006 Consumer Electronics Show (CES), THX rec-ommended that the optimal seat-to-screen distance is bymultiplying the diagonal screen size by 1.2 [52]. Thisgives a distance of 48 inches from a 40-inch screen. Atthis distance, a pixel density of 62.5 ppi is required sothat pixels are indistinguishable to a person with perfectvision viewing at the screen. The calculation of this pixeldensity can be found in Appendix A. With an aspect ra-tio of 16:9, a 40-inch screen in diagonal has a size of683 square inches. With 62.5 ppi, such a display hasabout 2.67 million pixels. With 3 bytes per pixel, and8 bits per byte color depth, this gives 64 Mb per frame,and a 30 frames per second refresh rate gives a raw datarate of 1.92 Gbps. With a reasonable compression ra-
tio1, 38.5 Mbps to 64 Mbps will be the resulting band-width required. Another possible factor is 3D TV. 3D TVis achieved by recording images as seen from two per-spectives and sending two video streams [2], thus dou-bling the above calculations. This means a single uncom-pressed high-definition 3D video stream could require asmuch as 3.84 Gbps of bandwidth, and the compressedvideo stream only requires 77 Mbps to 128 Mbps band-width.
Note that, however, many other high-definition de-vices do not require such high bandwidth, as shown inTable 9 in Appendix A. For example, iPhone 5 pixel den-sity is 326 ppi, but only has a total number of 727,040pixels due to a much smaller screen size. With the sameparameters as above, iPhone 5 only requires a bandwidthof 10 Mbps with a compression ratio of 50:1. Under sim-ilar conditions, a 15-inch MacBook Pro with Retina Dis-play requires a bandwidth of 75 Mbps after compression.
2.4.2 Conclusions from Case Study
From the above calculation, mm-wave will be able tosupport the most demanding applications on the mostup-to-date devices. Even when 40-inch Retina Displayscome to exist in future homes, mm-wave can supportthe raw data transmission of high-definition videos (ataround 1.92 Gbps without compression). Additionally,mm-wave will also help develop smaller, smarter cellswith devices that cooperate rather than compete for spec-trum. As a result, the end user bandwidth usage will bedrastically changed to have very high data rate, muchlower latency and energy cost, by very dense crowdsof users with a massive number of devices. In face ofthe exponential wireless data growth and bandwidth de-mand, the mm-wave technology of 5G has the potentialto spur and accelerate the deployment of “more power-ful, bandwidth-intensive, ubiquitous and more affordablewireless applications and services, and the support ofmore versatile, robust and rich-multimedia wireless net-works” [45].
3 Internet of Things (IoT)
In Section 2.3, we stated that mm-wave has paved theway for the Internet of Things (IoTs). The IoTs itself isa disruptive technology that can potentially change theInternet bandwidth use of end users. While the mm-wave technology of 5G focuses on physical transmission
1Compression ratios to maintain excellent quality [64]:
10:1 for general images using JPEG;
30:1 for general video using H.263 and MPEG-2;
50:1 for general video using H.264 / MPEG-4 AVC.
7
of data bits over the wireless medium, IoT is a technol-ogy that uses mm-wave and other wireless solutions foreveryday purposes.
3.1 BackgroundThe phrase “Internet of Things” started life as the titleof a presentation made by Ashton at Procter & Gamble(P&G) in 1999 [65]. It was an idea that was proposedfor adding Radio Frequency Identification (RFID) tech-niques in P&G’s supply chain. The original idea of Ash-ton was as follows:
“Today computers — and, therefore, the In-ternet — are almost wholly dependent on hu-man beings for information. Nearly all of theroughly 50 petabytes (a petabyte is 1,024 ter-abytes) of data available on the Internet werefirst captured and created by human beings— by typing, pressing a record button, tak-ing a digital picture or scanning a bar code.Conventional diagrams of the Internet includeservers and routers and so on, but they leaveout the most numerous and important routersof all: people. The problem is, people havelimited time, attention and accuracy — all ofwhich means they are not very good at captur-ing data about things in the real world.”
The unique idea of the IoT emphasizes the fact thatboth human and the environment are physical, whereas“things” can be extremely logical and can capture ab-stract and repetitive information that humans are notgood at capturing or remembering. To enable “things”to record and capture facts about both the human and theenvironment, object identification, sensor and connec-tion capability are the basis. In essence, the IoT refersto uniquely identifiable objects and their virtual repre-sentations in an Internet-like structure [33]. With thesubjective recording and monitoring by these “things”,people can know when supplies were fresh or past theirbest, and whether they needed replacing, repairing or re-calling, etc. As a result, people “would be able to trackand count everything, and greatly reduce waste, loss andcost” [33]. However, the research into the IoT is still inits infancy. Therefore, there are not any standard def-initions for this research other than a few survey arti-cles [15, 91].
3.2 IoT Technologies: Sensors, RFID,Bluetooth, and Many More
Internet of Things is also sometimes called the Internetof Everything, the Industrial Internet or Machine to Ma-chine (M2M). It is true that RFID, sensor and similar
Figure 2: Total number of autonomous systems in theIPv6 routing table (Source: [6]).
technologies have enabled computers and similar devicesto observe, identify and understand the world without thelimitations of human-entered data. However, accordingto Helen Duce [74], it is also clear that challenges stillexist:
“We have a clear vision — to create a worldwhere every object — from jumbo jets tosewing needles — is linked to the Internet.Compelling as this vision is, it is only achiev-able if this system is adopted by everyone ev-erywhere — Success will be nothing less thanglobal adoption.”
The targeted smart systems of the IoT are the ones thatare able to take over complex human perceptive and cog-nitive functions and frequently act unnoticeably in thebackground. Despite the fact that the IoT is to pro-vide extreme convenience to people, several technolo-gies need to be improved and several challenges need tobe addressed by people before the IoT achieves a globaladoption.
3.2.1 Unique Addressability
According to a survey by Cisco [15], there are 8.7 billionconnected objects globally in 2012, 0.6% of “things” inthe world. Driven by reduced price and rapid growth inM2M connections, by the end of 2013, this number willexceed 10 billion. It is estimated that the total number ofconnected things will reach 50 billion by 2020, or 2.7%of things in the world. Given such a large number, aglobally unique addressing scheme is needed to identifythe large amount of objects.
The original idea of Ashton was based on RFID-tagsand unique identification through the Electronic ProductCode (EPC) [21]. However, this has evolved into objectshaving an IP address and URI, which are much more
8
Figure 3: IPv6 traffic to the Akamai Intelligent Platform,Quarter 2 2013 (Source: [6]).
generic. In particular, because of the extremely large ad-dress space, the next generation of Internet applicationsusing Internet Protocol Version 6 (IPv6) with a muchlarger address space is able to communicate with devicesattached to virtually every man-made object. To helpput this number in perspective, the 128-bit IPv6 addressspace provides 6.5×10²³ addresses for every square me-ter of the Earth’s surface [36]. The pressing need for IPv6is also due to the fact that the number of available IPv4addresses continued to decline in 2013, as Regional In-ternet Registries continued to allocate and assign blocksof IPv4 address space to organizations within their re-spective territories [56]. According to the quarterly sur-vey by Akamai [6], both the number of IPv6 autonomoussystems (Figure 2) and IPv6 traffic (Figure 3) have beenincreasing. Note that the traffic in Figure 3 has a weeklycyclic pattern.
Although IPv6 will be able to scale to the large num-bers of objects envisaged, the lack of its backward com-patibility [8] makes it difficult for general and timelyadoption by the public. Meanwhile, from the aspectof the Semantic Web, great efforts have been made onenabling all things, not just those electronic or RFID-enabled, addressable by the existing naming protocols,such as URIs [67]. A consistent and unique addressingscheme is thus the prerequisite of the IoT and its relevanttechnologies.
3.2.2 Sensor Networks
In the modern Internet, everyday objects in the surround-ings can potentially be the proactive information collec-tors, or be both the generator and consumer of informa-tion. These objects range from the devices that haveexisted in technological world for many years, such asvehicles, toasters or fridges, to objects external to thetechnological environment, such as garments or perish-able food. They can even be plantations, woods or live-
stock. By embedding data storage, networking and com-putational capabilities in all such things, it will be pos-sible to provide a qualitative and quantitative advance-ment in a wide range of sectors, including health care,logistics, and entertainment, etc. In fact, one of the mostessential elements in the IoT is wireless sensor networks(WSN) [91].
The fact is that sensor network is not as a new con-cept as the IoT. The sensor network and related researchexisted a long time before the IoT was introduced. How-ever, sensor networks were used in limited domains toachieve specific purposes, such as environment monitor-ing [84], agriculture [77], medical care [85], event de-tection [95], etc. The benefits of connecting both WSNand other IoT elements are not only remote access toheterogeneous information systems. The integration ofWSN and the IoT is also a fact supported by severalinternational corporations and standardization organiza-tions, such as IBM [29], Internet Engineering Task Force(IETF) [89, 38], social networks and blogs [79], etc.
In order to allow WSN to become an intrinsic partof the IoT in a secure way, several challenges must beconsidered. The most important challenge is the inte-gration of security and privacy mechanisms [88]. First,the growing data demand will require stronger securitymodels employing context related security, which in re-turn will help the citizens to build trust and confidencein these novel technologies rather than increasing fearsof total surveillance scenarios. The sense of security willalso be the most important incentive for wide adoptionby users. Second, data privacy must be considered. Theinformation available regarding a particular user will notonly consist of the personal data, but also of any datagenerated by the objects surrounding this individual. Itis necessary to clarify the data ownership and how theuser data will not be used without user consent.
3.2.3 RFID and Bluetooth
Besides sensor networks, RFID and Bluetooth relatedcommunication technologies will also be the corner-stone of the IoT. Today, almost every smartphone isequipped with certain kind of short range radio commu-nication such as Bluetooth, or more specifically near fieldcommunication (NFC) specifically designed for readingRFID tags. While RFID was initially developed with re-tail and logistics applications in mind in order to replacethe bar code, developments of active components willmake this technology much more than a simple identi-fication scheme. For example, 10 million daily travelersof the public transport system in Paris have already ac-cess to an electronic ticket using a ticket system, Navigo,based on RFID [46].
Similarly, Bluetooth has been used by people for
9
around 15 years, as a means of allowing devices to talkto each other cheaply and wirelessly over short distances.Although Bluetooth has tended to stay largely in theshadows in the past, the recent rapid growth in the use ofmobile and sensing technologies has re-enabled its ap-plications from health and agriculture, to business andelectioneering [70]. One important reason is that Blue-tooth targets lower transmission ranges and data ratesthan WiFi, and as a result has lower cost and lower powerconsumption. Recent advancements in Bluetooth tech-nology make it the best way to free data from even thesmallest devices, able to operate for months or years onbutton-cell batteries [14].
3.3 Typical Use Cases
3.3.1 Retail and Logistics
Replacing bar code with RFID tags in retail is the firstlarge scale application of the IoT. There are multiple ben-efits by using RFID tags over bar code. First, for re-tailers, item identification will be unified throughout thesupply chain, from the producer, to the storage and checkout. Sales aisles equipped with RFID readers can issuerefill orders automatically to the retailer’s storage onceany items are sold out. For consumers, the long lining upat check-out can be avoided.
Similarly, the IoT innovation in logistics allows im-proving efficiency and enabling new features. For exam-ple, in the retail warehouse, orders can be automaticallypassed on to the wholesaler whenever any items are outof stock. On a intelligent farm, for instance, RFID taggedcattle can be automatically monitored for health condi-tions, so that whenever one is sick or pregnant, an alertmessage is sent to the farmer. As a result of IoT inno-vations, products can be shipped automatically, and themanufacturers and farmers will have a direct feedbackon the monitored product or livestock, leading to savedtime, energy, resources and the environment.
However, security and privacy concerns are the biggesthurdle in adopting the IoT from the standpoint of con-sumers. For example, the privacy of a consumer canbe intruded in case a purchase has been made for med-ical products. Farmers also need to protect themselvesfrom competitors who may read their stock quantitiesand the health conditions of livestock. Meanwhile, theIoT technologies normally do not change the industry orproduction fundamentally, but rather, increase the effi-ciency production, manufacturing, sale, etc [74]. Thelow data rate and low update frequency of the IoT alsowill not dramatically change the end user bandwidth pat-tern. For IoT devices, bandwidth needs are typically lowas they collect and send out brief bursts of data infre-quently. For example, on a farm, the data generated by
a cattle is 200 Mb per year. From these aspects, we canexpect that much work remains before the IoT can gainwide adoption among consumers.
3.3.2 Food, Water, Health Care and IntelligentHome
Through labels embedded with microchips, food produc-ers and retailers can easily track the origin of food, its lo-cation and the temperature and humidity of its surround-ings. These factors are critical in the transportation andstorage of fresh vegetables, fish and sea food. Further-more, an IoT system to monitor water quality can be de-veloped using similar concepts. The system can warnpeople in real-time if the turbidity and PH level has ex-ceeded a safety threshold [35].
The IoT technologies have also been used in healthcare [97], where sensors can monitor the patient behav-ior and symptoms in real time and at a lower cost. Thisallows doctors and physicians to better diagnose disease,especially chronic illnesses, and prescribe tailored treat-ment. Patients can have their conditions monitored con-tinuously as they go about their daily activities. As aresult, early warning can be issued to avoid or reducehospitalization and treatment costs [34]. With the recentprevalence in smartphones, many embedded sensors onthese devices carried by people on a daily basis can nowbe utilized for telehealth and telemedicine [53], applyingthe low-energy sensors to individuals with Type-2 Dia-betes [57], etc.
The IoT technologies have created the concept of In-telligent Home. As an example, microchips can detectthe expiration of foods, signal need for new supplies offood, detergents, maintenance, etc. With such intelli-gent chips embedded in a refrigerator, not only the am-bient conditions and food quality can be monitored, anautomated dinner recipe can also be dynamically cre-ated given the food in fridge that is still in good condi-tion, and the amount of nutrients needed for a particularmeal. Further, intelligent control of electric power in thehouse will allow simple tasks such as switching on andoff lights, and more complex ones such as fine-grainedmanagement of electric heaters in order to set the ambi-ent temperature [34, 74].
3.3.3 Enhanced Situational Awareness
The typical scenario in this case is the massive deploy-ment of sensors and actuators, which transmit data oc-casionally and have very low energy requirement. Ap-plications are enabled by sensor network technologies(Section 3.2.2). The deployed devices report collecteddata to an infrastructure. For example, a large numberof sensors are spread out over large agricultural areas to
10
measure the fertility of crops and humidity of soil, to helpthe farmer optimize the right time for harvesting and fer-tilizing. Sensors can also be deployed on the surface ofa wind mill, reporting vibrations and other measures thatmay give an early indication of material damage or sub-optimal usage. In short, a large number of small devicescollect data of interest, including data that is environmentrelated (temperature and humidity), or the wear and tearof critical equipment, even the occupied tables and chairsin a restaurant.
The devices mentioned above create great conveniencein people’s everyday life. Their sizes are relatively small,and their structures are relatively simple. On the otherhand, many of these devices are deployed at places thatare difficult for human access, and thus these networksprefer minimal maintenance. This directly translates tothe requirement for long battery life. Section 2.3.2 de-scribes the support that mm-wave can provide to smalland smart devices in terms of low energy cost. With 5Gand mm-wave proliferation, the applications using sen-sors will benefit tremendously.
3.3.4 Transportation and Traffic Safety
The most demanding use of the Internet of Things in-volves the rapid, real-time sensing of unpredictable con-ditions and instantaneous responses guided by automatedsystems. The automobile industry, for instance, is begin-ning to use the different sensing devices in vehicles togather environment information and provide intelligenttraffic information services [98, 99] utilizing VehicularAd Hoc Networks (VANETs).
VANETs are new applications of sensor networks thatuse different sensing devices in vehicles to gather envi-ronment information and provide intelligent traffic in-formation services. Information exchange among vehi-cles on the move will enable the provisioning of traf-fic safety hints to the driver or warnings about the roadstatus, including road constructions, weather conditions,road hazards, etc. In foggy or rainy weather, when roadvisibility is low, a vehicle could signal to the driver thedirection and velocity of any moving vehicles nearby, inorder to avoid accidents. Such interactions among vehi-cles are vehicle-to-vehicle (V2V) communication [99].Additionally, vehicles communicating with centralizedinfrastructures can receive real-time updates about roadinformation that is relatively far away. As a result, vehi-cle traffic can route through less crowded area, increas-ing traffic efficiency and reducing fuel emissions. Thisis vehicle-to-infrastructure (V2I) communication [100].Infrastructure can also offload part of the V2V traffic andprovide higher speed. Finally, vehicles can collect safetyrelevant information directly from road pedestrians andcyclists so as to avoid running into road users. This can
be achieved through communication to the smartphones,tablets or any sensor tags carried by road users. Suchcommunication is vehicle-to-device (V2D).
All the above V2X communication requires very lowlatency, for both safety and efficiency reasons. The mm-wave technology of 5G again is the enabler of these IoTapplications. It provides much lower latency than thecurrent wireless solutions (Section 2.2.1), a direct endresult of very high data rate by using mm-wave (Sec-tion 2.3.1). The small cell coverage also guarantees lesscontention among vehicles sharing the same road sideaccess point. As a result, both periodic and event-drivenbroadcast traffic in the above V2X scenarios can be de-livered both with low delay and low loss rate. When anaccident happens, public safety agencies can detect im-minent collisions and inform vehicles so as to take eva-sive actions. In addition to these applications with de-mand on very low latency, public transit system can alsobenefit from the IoT technologies, e.g., Navigo based onRFID [46] in Section 3.2.3.
3.4 Conclusions: Providers, Manufactur-ers and Consumers
In conclusion, technology trends such as support fromwireless solutions (mm-wave in Section 2), cloud andmobile computing, Big Data, increased processingpower, etc., are the driving force of IoTs. The dramati-cally increased end-user bandwidth and capacity at lowercosts, the rapid growth of cloud, social media and mobilecomputing, and the ability to analyze Big Data and turnit into actionable information, have realized more valuefrom the connectedness of things.
3.4.1 Created Values
According to a study by the Progressive Policy Institute,the impact of the Internet of Things on the US growthrate could raise the level of US gross domestic product by2%–5% by 2025 [10]. However, such a fact and createdintelligence reflect the projected heavy use of the IoT inmanufacturing, rather than consumer-oriented services.Cisco’s analysis also showed that most of the potentialvalue created by IoTs, 66%, or $9.5 trillion, comes fromtransformation based on industry-specific use cases, suchas smart grid and smart buildings. The other 34%, or $4.9trillion, is produced by cross-industry use cases suchas the future of work (telecommuting) and travel avoid-ance [22]. In the above examples given in Sections 3.3.1to 3.3.4, consumers typically benefit from the added fea-tures of the IoT, such as greater labor efficiencies andeliminated waste. Furthermore, the security and privacyconcerns are prevalent among end users, since the datacaptured from product purchase, health care and vehicles
11
Standard Data Rate Est. # of Devices (Bil.) Est. Global Peak Traffic (per hour) Est. Per-user Peak Traffic (per hour)2012 2013 2020 2012 2013 2020 2012 2013 2020
Table 3: IoT device types, the expected data rates, the estimated device numbers, the estimated global peak trafficper hour, and the estimated per-user peak traffic per hour. The data rate listed for IEEE 802.11 WiFi is for IoTapplications, rather than normal WiFi data communications. The estimated peak data traffic per hour is calculatedas follows: assume the estimated number of devices are equally divided by the four categories, and the device datacollection rate is once per hour. The peak data traffic calculation uses the highest data rate. For example, for RFIDthat has data rates from 26 Kbps to 424 Kbps, the highest rate 424 Kbps is used (peak rate). Note that the calculateddata traffic corresponds to the worst case for all categories, and is the global data without dividing into regions. Theestimated per-user peak traffic per hour is calculated by assuming 20% of of the world population owns the particularcategory of devices. The world population by the end of years 2012, 2013 and 2020 are 7,057, 7,195 and 7,717million [72].
are all related to each individual and contain sensitive in-formation.
3.4.2 Data Rates and Bandwidth
The data transfer rates are also vastly different eitherfrom the manufacturers or consumers point of view. TheIoT technologies in Section 3.2 all have low data rate.For instance, the data rates of RFID vary from 26 Kbpsto 424 Kbps. In sensor networks, nodes equipped withIEEE 802.15.4 transceivers operate at a maximum rawdata rate of 250 Kbps [31], and Bluetooth operates ata rate no more than 1 Mbps [70]. Even in an intel-ligent home network, security surveillance cameras re-quire 2 to 3 Mbps of data transfer rate. Furthermore, thedata update rate for these small devices are also infre-quent, e.g., sales items sold out, food supplies replace-ment, hazardous road conditions and accidents, etc. De-spite the pervasive connectedness of things, the band-width usage from individual end-users will not be drasti-cally changed.
At the manufacturers or public agencies where datafrom millions of devices are aggregated, the data rate willbe drastically different. At the data aggregation point,compression and filtering can be done by the manufac-turers or agencies to reduce redundant data. Therefore,the total data volume can be reduced. However, at in-dividual homes, the low data rate and low update fre-quency are not expected to change the bandwidth pat-terns of end users and consumers. The complete list ofIoT device types and their expected data rates are shownin Table 3. The table also shows the estimated peakdata traffic per hour, which is calculated as follows.Assume the estimated number of devices are equally di-vided by the four categories, and the device data collec-tion rate is once per hour. The peak data traffic calcula-tion uses the highest data rate. For example, for RFID
that has data rates in the rage of 26 Kbps to 424 Kbps,the highest rate 424 Kbps is used. Note that the calcu-lated data traffic corresponds to the worst case for allcategories, and is the global data without dividing intoregions. Even with the worst-case calculation, it can beseen that the peak data traffic is not significant. UseWiFi as an example, which has a total global data traf-fic of 10,410 G per hour by 2020. If dividing this trafficequally among the three regions: Americas, Asia Pacific,and Europe/Middle East/Africa, then peak data traffic is3,470 G per hour, or 0.96 G per second from each ofthe three regions without subdividing into countries orsmaller regions. From an end user perspective, by theend of 2020, the world population will reach 7,717 mil-lion [72]. The total peak traffic generated by IoT devicesis 16,215 G per hour in 2020. Assuming 20% of the pop-ulation owns the IoT devices in Table 3, dividing the totalpeak traffic by this population and we get a per-user peakrate at 10.5 Kb per hour in the worst case from all IoTdevices. Therefore, even with the tremendous increasein the things connected to the Internet, from an end user,the peak IoT traffic is not high and can be supported byany current service provider. With a higher percentageof population owning IoT devices, the per-user peak ratewill be even lower.
4 Community Cloud and Fog Computing
4.1 BackgroundFrom the emerging 5G mm-wave and the Internet ofThings, today’s growing mobile traffic, multimedia data,and end-user diversity has lead to an increasing demandfor applications that are generated by end users and pro-cessed by edge devices. Such an increase is the resultof higher broadband adoption and wireless penetration,higher application demand and affordable storage de-
12
Figure 4: Internet broadband bandwidth. Examples are shown for the Americas (Source: [7]).
vices. As a result, much lower latency is required byusers who can afford higher bandwidth and larger stor-age.
4.1.1 High Bandwidth and Wireless Penetration
The quarterly state of the Internet report from Akamai [6]reported data on average and average peak connectionspeeds — the latter provides insight into the peak speedsthat users can likely expect from their Internet connec-tions. The global average connection speed has keptincreasing in 2013, growing to 3.3 Mbps in the secondquarter. The average peak connection speed, on the otherhand, represents an average of the maximum measuredconnection speeds across all of the unique IP addressesseen from a particular geography, therefore it is morerepresentative of Internet connection capacity. Accord-ing to [6], the global average peak connection speed in-creased in the second quarter of 2013 to 18.9 Mbps. Fig-ure 4 shows this data with the distribution of both theaverage and average peak speeds in Americas. For bothaverage and average peak connection speeds, the US andCanada ranked the first and second in this geographic re-gion.
In the wireless and mobile network domain, both dataand voice traffic, especially data traffic, have increasedtremendously over the past 5 years, as shown in Fig-ure 5. The data are not only from smartphones, but alsolaptops, tablets, and other devices that connect to the In-ternet through mobile networks. The figure representsthe world total mobile traffic in 2G, 3G, and 4G/LTEnetworks, not including WiFi, and Mobile WiMax. Asseen in the figure, the mobile data traffic has been grow-ing exponentially. We can expect such an increase willcontinue in the future. Such high bandwidth will allowmobility to become the norm in user everyday communi-cation.
Note that the reported bandwidth in Figures 4 and 5are different from IoTs in Section 3. The applications inSection 3 have a strong focus on the monitoring the envi-ronment, everyday product, etc., to improve the quality
of human life. The applications in this section have astrong emphasis in computation, storage (Section 4.1.2),and live data streaming (Section 4.1.3), and target at im-proving application responsiveness and enhancing userexperience.
4.1.2 Higher Computation and Affordable Storage
With higher broadband penetration and more devices on-line, the requirement for computation and data-intensiveservices are getting higher at network edge. The tradi-tional Cloud Computing data center with homogeneouscompute, storage, and networking resources featuring re-mote batch processing can no longer meet device het-erogeneity, exponential demand and real time latency re-quirement. Take storage as an example: Disk space hasincreased dramatically and has outgrown the wide-areabandwidth such that, with 3 TB stored data, it requires278 days to transfer it over a 1 Mbps broadband connec-tion [87]. The Cloud-based solutions have a tough timekeeping up with both storage and computation require-ments. Instead, programmable edge network devicessuch as switches and home routers, which are able to ex-pose performance issues related to cross traffic, wirelessnetwork, and end-host configuration, will be crucial inthe near future.
4.1.3 Real-Time Applications and Lower LatencyRequirement
According to the bi-yearly research study published bySandvine, a Canadian broadband management company,real-time entertainment (comprised mainly of streamingvideo and audio) continues to be the largest traffic cate-gory on virtually every network in 2013 [25]. It is ex-pected that this continued growth will lead to the emer-gence of longer form video on mobile networks glob-ally in to 2014. Table 4 is a summary of top 3 peakperiod applications in regions including North America,Europe, Latin America and Asia-Pacific. The data in Ta-ble 4 are reported for wired access networks in [25]. The
13
Figure 5: Total monthly mobile voice and data as measured by Ericsson (Source: [6]).
Region Upstream Downstream AggregateApplication Share Application Share Application Share
North AmericaBitTorrent 36.35% NetFlix 31.62% NetFlix 28.18%
Table 4: Top 3 peak period applications, wired access networks. Across all regions over the globe, BitTorrent, thetraditional peer-to-peer application continues to be the dominant application in the upstream, taking around 1/3 of theupload share among the rest of YouTube, NetFlix, HTTP, Facebook, etc. (This is a summary of data reported in [25]).
report on mobile networks in these regions can also befound in [25]. From Table 4 it is clear that across allregions over the globe, BitTorrent, the traditional peer-to-peer application continues to be the dominant appli-cation in the upstream, taking around 1/3 of the uploadshare among the rest of YouTube, NetFlix, HTTP, Face-book, etc. Note that all these applications mainly featurereal-time data streaming, the application category that re-quires very low latency.
While P2P has existed for decades, using P2P in tra-ditional Cloud is a rather new concept. P2P has little orno infrastructure, and runs directly on end user devices.Cloud Computing, on the other hand, frees the enterpriseand the end user from the specification of many details.This bliss becomes a problem for latency-sensitive ap-plications, which require nodes in the vicinity to meet
their delay requirements [76]. Today’s network infras-tructures are not totally as ad-hoc as P2P, but rather a mixof P2P and infrastructure, such as WiFi access point, cel-lular tower, etc. Such a mixed infrastructure is close tothe end user, while still has dedicated devices for controlthat is within the proximity to end users.
It is known that geographic location accounts for al-most 94% of network latency [82]. Applications behavedifferently depending on their location to the service in-frastructure. Utilizing devices in the vicinity — switchesand routers in the same network as end hosts — for datastorage and computation offloading is thus a natural solu-tion for reducing user perceived latency. Such a conceptis Fog Computing [76], which is essentially everything-as-a-service.
With the dramatically increasing bandwidth at net-
14
work edge (Section 4.1.1), much more powerful com-putation and affordable storage (Section 4.1.2), and thereal-time applications like YouTube, NetFlix and BitTor-rent that require very low latency (Section 4), there willbe an ever-increasing interest and demand in Fog Com-puting services discussed in this section.
4.2 Characterization of Fog Computing
Many applications today require nodes in the vicinity forcomputation and storage resources to meet their delayrequirements. Newly emerging Internet deployments,such as the Internet of Things (Section 3), require mo-bility support and geo-distribution in addition to loca-tion awareness and low latency. A new infrastructureis needed to meet these requirements: a platform calledFog Computing first proposed by Cisco [75, 76]. FogComputing is so named simply because the fog is a cloudclose to the ground. Compared to Cloud Computing thatrelies on centralized data centers, Fog Computing has thefollowing unique characteristics.
4.2.1 Geographical Distribution and LocationAwareness
In contrast to the centralized Cloud, the services andapplications in Fog demand widely distributed deploy-ments. Such geographical distribution will facilitate theapplications that require low latency, such as streaminghigh definition videos to users carrying mobile devicesthrough proxies and access points positioned inside lec-ture halls on a campus, or in buildings in a residentialarea. Applications with low latency requirements willbenefit the most from the more flexible, down to theground infrastructure of Fog. For data storage, on theother hand, if replicating file systems across nearby de-vices, the device diversity makes correlated failure lesslikely, and device proximity avoids the wide-area band-width bottleneck. However, because user devices arehighly dynamic and can be online and offline any time,replication must be fast and light-weight.
4.2.2 Very Large Number of Nodes
As a consequence of the wide geo-distribution, not only alarger number of end user devices will be serviced by theFog infrastructure, more edge routers and access pointswill become part of the Fog infrastructure for both ser-vice orchestration and data delivery. For example, large-scale sensor networks that monitor the environment, andthe Smart Grid are both examples of inherently dis-tributed systems with a large number of deployed nodes.These systems require both distributed computing andstorage resources. In this regard, Fog Computing shares
the same characteristic as the Internet of Things that arecomposed of millions of end devices. The difference isthat Fog Computing includes both end user devices andtheir last hop routers and access points, which belong tothe infrastructure side of the Fog platform.
4.2.3 Support for Wireless Access and Mobility
It is essential for many Fog applications to communicatedirectly with mobile devices, and vice versa. Therefore,the support for mobility techniques is critical, especiallywhen mobile device users are moving across differenthome network, campus network that are usually behindNetwork Address Translators (NATs) and firewalls. Onetechnology that can provide stable services that supportdevice mobility is Zenodotus [73] developed within theSeattle project [60]. As an open Community Cloud com-puting platform itself, Seattle operates on a wide rangeof resources such as laptops, servers, phones and wire-less routers, which are donated by users and institutions.Zenodotus enables a stable URL despite users movingbetween Fog virtual machines. It can be used to deployservices supporting smooth mobile handover and loadbalancing, which are crucial for latency-sensitive appli-cations such as video multicast.
4.3 Typical Use Cases
4.3.1 Offloading Mobile Computation and Storage
Mobile devices with battery and power constraints willbenefit from offloading local computation to network de-vices nearby. While computation offloading has beenshown to be effective using remote Cloud data centers,Fog Computing provides much lower latency via the or-chestration on routers and switches that are typically onehop away from end devices. Irrespective of user locationor device type, Fog users can access applications withhigher performance, reliability and security. Further-more, low latency access to nearby computing resourcessubstantially encourages more offload processing with-out impacting user perceived latency. For data storage,because Fog user devices are highly dynamic and mo-bile, data replication must be fast and light-weight. Forexample, once replication is complete, a replica can beused offline and later merged into other replicas. Simi-lar techniques must also be used to ensure high levels ofsecurity and performance isolation.
4.3.2 Enhanced Video Multicast Services
Video streaming consumes a substantial portion of thebandwidth on end user networks. To provide betteruser experience, there are many existing encodings and
15
IP Traffic (PB per month) 2012 2013 2014 2015 2016 2017 Allc. IPv4 /8 Prefix [28]North America 14,439 18,788 23,520 28,667 34,457 40,672 36
Middle-East and Africa 67.61 101.18 143.04 194.16 256.46 334.20 37.83%Total 609.84 789.44 988.28 1,207.37 1,456.55 1,743.09 23.42%
(b) Aggregatable IP traffic per IPv4 /8 prefix in different geographic regions, by assuming that IP traffic is equally dividedamong the allocated IPv4 /8, and each month has 30 days.
Table 5: Overall IP traffic and aggregatable IP traffic per IPv4 /8 prefix in different geographic regions, 2012 to 2017.
codecs with different screen sizes and loss rates. Partici-pants who are connected to the same networking devicemay desire different codecs, and thus cannot participatein the same multicast stream. In Fog, router and switchescan receive a single incoming stream and re-encode it foreach individual user. With close proximity to streamingdevices, video services can dynamically apply differentcodecs and network optimization techniques to adapt tothe changing conditions and capability of a network.
4.3.3 Improved Network Diagnosis
The primary challenge with network administration isunderstanding the communications from the viewpointof end users. However, this is difficult due to networkpath asymmetry, network components such as firewallsand NATs, ICMP filtering, and other complications ofthe modern Internet. Fog provides more effective prob-ing that replicates the behavior seen by the actual enduser. For example, a network administrator can relayTCP communications through the user’s last hop to ob-serve the exact web browsing behavior experienced bythe user.
4.3.4 Other Use Cases
Many applications require both Fog localization andCloud globalization [76], particularly for data analyt-ics. Fog devices and routers provide direct access to enduser data, with both localization and context awareness.These data are the major sources of applications such asemergency dissemination, protection, and real-time datastreaming and control that require fast and reliable pro-cessing, typically in the range of milliseconds. The datafrom this layer can also be filtered or aggregated beforesent to higher layers. On the other hand, data analyt-ics and reporting that require more data and computation
intensity can be processed at centralized Cloud data cen-ters. These data centers collect raw or semi-processedend user data, and produce results in the time scales ofseconds to minutes, or even hours. Therefore, a combi-nation of both Fog and Cloud Computing infrastructurewill benefit an even wider range of applications.
4.4 Conclusions: Changing the BusinessModel
The current Cloud Computation model is Business-to-Business, where infrastructure resources are bought fromcorporates like Akamai and L3, and such resources arehosted by other corporates for a certain service. Suchmodel, very much similar to the transactions between amanufacturer and a wholesaler, or between a wholesalerand a retailer, is not agile. Fog Computing breaks thismodel and provides services directly to the end users,much similar to the Business-to-Consumer model. FogComputing can potentially utilize the resources on edgerouters, especially home routers, given the fact that theserouters simply forwards traffic between the Internet andhome users. Abundant resources on these devices arejust being idle. If these idle resources would be har-nessed, applications and services could easily obtain anopen and distributed data center with low latency fromthe end users. There will be legal issues, however, whichare outside the scope of this effort.
Table 5(a) lists the global IP traffic in different geo-graphic regions, from both wired and wireless networks.The number of allocated IPv4 /8 prefixes is calculatedfrom [28]2. Table 5(b) shows the aggregatable IP traf-fic per IPv4 /8 prefix, by assuming that the IP traffic
2These prefixes are mainly for ordinary users, not including the pre-fixes allocated for administrative purpose, prefixes for private IP ad-dresses, and reserved prefixes.
16
is equally divided among the allocated IPv4 /8 prefixes,and that each month has exactly 30 days. Overall, NorthAmerica has the highest amount of aggregatable traf-fic each year, whereas its average year-over-year (YoY)growth rate is just about the global average 23.42%. Incontrast, Middle-East and Africa has the lowest aggre-gatable traffic but the highest average YoY growth rate,such that its aggregatable traffic will surpass Europe in2016, and surpass both Europe and Latin America in2017.
From the data shown, it is easy to see that each /8 pre-fix has several hundred GB of data per second in total(or aggregatable). The data in Table 5 underestimatesthe number of prefixes allocated for private addresses,however, it provides a reasonable estimation. By par-titioning data further, e.g., among the /16 prefixes, theamount of aggregatable data is still large. For example,if the data from North America in 2017 is equally di-vided among the 28 = 256 subnets, each subnet will have1.7 Gbps data from all the end users. By aggregating andoffloading this 1.7 GB data from end users to their one-hop router every second, 6,120 GB data per hour willexperience reduced latency, i.e., only from the local de-vice to the edge router, which is equivalent to 4.4 PB dataper month.
Essentially, Fog Computing represents a combinedmodel of Cloud Computing and Content DistributionNetwork (CDN), but at a much lower cost. As a result,end users will benefit from more affordable service andimproved application experience.
5 Software Defined Networking (SDN)
Software defined networking (SDN) allows network ad-ministrators to manage network services through abstrac-tion of lower level functionality. This is done by decou-pling the system that makes decisions about where trafficis sent (the control plane) from the underlying systemsthat forwards traffic to the selected destination (the dataplane) [61].
SDN appeared as a result of the limitation of today’snetworks. In today’s Internet, the data plane and controlplane of protocols are drastically different. Unlike thedata plane that is highly modular and reusable from ap-plication layer to physical layer, protocols on the controlplane tend to be defined in isolation, with each solvinga specific problem and without the benefit of any fun-damental abstractions and modularity. As a result, thenetworks today are becoming increasingly complex. Forexample, while existing networks can provide differenti-ated QoS (quality of service) levels for different applica-tions, the provisioning of those resources is highly man-ual. IT must configure each vendor’s equipment sepa-rately, and adjust parameters such as network bandwidth
and QoS on a per-session, per-application basis. Becauseof its static nature, the network cannot dynamically adaptto changing traffic, application, and user demands.
5.1 Characterization of SDNSDN features the physical separation of the network con-trol plane from the forwarding plane, and where a controlplane controls several devices [62]. In this unique space,SDN has the following characteristics and features.
Directly programmability and flexibility. Networkcontrol is separated from forwarding functions, and thusdirectly programmable. Because of the capability ofhigh-level control, network traffic and forwarding poli-cies can be dynamically adjusted and changed.
Open standard. Control commands and instructionsare implemented by open standard. Vendor specificdevice controls are masked from network operations.Therefore, networks become openly programmable in-stead of proprietary.
Better user experience. Due to the high flexibilityand elasticity, an SDN infrastructure can adapt to dy-namic user needs. For example, video streaming applica-tions of a video content provider will be able to detect thechanging available bandwidth in the network in real time.Whenever the bandwidth degrades, the applications au-tomatically adjust to lower video resolution.
More detailed characteristics of SDN can be foundin [63].
5.2 US and Mozilla IgniteWith this new trend in software-defined networking, afew projects and challenges have been put forward bygovernment, open source communities and public sec-tors. US Ignite and Mozilla Ignite are two importantopen challenges. They are both driven by public inter-est in new technologies and by practical use. The moti-vation of these projects are: average person is generallynot interested in understanding how network technolo-gies make things like ultra-high-speed networks possible,but is instead more interested in discovering the applica-tions that might help them live, work, learn or play betterand more efficiently.
The US Ignite initiative fosters the development ofnext-generation applications that provide transformativepublic benefit using new technologies including softwaredefined networks, cloud computing and gigabit to end-users [68]. Mozilla Ignite [42] is an open innovationchallenge hosted by Mozilla and the National ScienceFoundation as part of the US Ignite initiative. The goalof Mozilla Ignite is to develop applications that showthe full potential of next-generation networks, withoutthe constraint of network speed, latency, and program
17
the entire network, from clients, servers to all the mid-dle boxes in between. Both the US Ignite and MozillaIgnite promote the programmability on high bandwidthnetworks, and building new classes of applications lead-ing to tremendous public benefit by taking advantage ofdeeply programmable, slice-able networks. In additionto the US and Mozilla Ignite, the Global Environmentfor Network Innovations (GENI) [24] is another projectsponsored by the National Science Foundation that pro-vides global programmability for researchers and practi-tioners. Several Mozilla Ignite projects, as listed below,utilize the platform resources provided by GENI.
5.3 Typical Use Cases
5.3.1 Public Safety (Emergency Response)
This use case corresponds to the detection, observa-tion, and assessment of situations requiring interventionby emergency responders and depends on high-quality“live” data. To get first hand, real-time emergency data,the smartphone application is installed on the phones ofpeople in the national guard, military reservists, etc [55].Example use scenarios include events occurred duringand after Hurricane Sandy, earthquake and tsunami onthe Pacific Northwest, etc. In such a use case, the de-mands of routing potentially large numbers of live videostreams, e.g., from such on-site smartphone cameras inan arbitrary location to specific control sites, requiresthe features of programmable networks to manage band-width allocation and possibly multicast distribution ofthe data with minimal latency.
5.3.2 Remote Collaboration and Learning (viaVideo Conferencing)
These use cases aim at promoting remote collaborationand learning, and sparking interest in Science, Technol-ogy, Engineering and Math (STEM) learning through en-gaging real-time simulations and rich media content [12].Scientific datasets can be very large and complex, andanalysis benefits greatly from worldwide review. There-fore, high speed networks provide the necessary head-room to reduce latency. Providing tools and allowingusers to collaborate in real-time on datasets will reducetime to produce results significantly. In real-time col-laboration and learning, the rich media environments re-quire high bandwidth by default. The programmabilityof SDN therefore controls the networked rich media andenables the environment to become collaborative, allow-ing users to contribute large amounts of data without af-fecting their experience negatively.
5.3.3 Health and Energy
Telemedicine [9] and telehealth [37] are future applica-tions that require high bandwidth, high security and highprogrammability. In the case of telemedicine, the band-width requirements for the necessary quality of multi-point encounters (between patient, doctor and guardian)is huge. The bandwidth requirements for multi-point andreal time transmission is 100 Mbps or less, from the datacalculated in Table 6 to Table 8 for typical current appli-cations, and around 150 Mbps for applications involving3D videos. Furthermore, the data transfer between ac-cess points, to health information exchange networks andentities for reporting has to be highly encrypted to pre-serve user privacy. In telehealth use case, data sharingis critical. GENI and OpenFlow allow the exploration ofreal-time data sharing with different routing methods formulti-point and broadcast sessions with recording ability.As a result, more people can participate in each healthexercise session, broadcasting a training session will ex-perience lower latency with higher resolution, feedbackbetween participants and cloud based computing analy-sis for assessment are provided in real time.
5.4 Conclusions: Bandwidth Requirementvs. SDN
While the concept and ideas of SDN is new, the aboveopen challenges are somewhat like solutions looking forproblems. All the awarded Mozilla Ignite projects arelisted in Tables 6 and 7, and the funded US Ignite projectsare in Table 8. The rational for NSF and Mozilla Igniteprojects are “building applications for the future”, wherea bandwidth of up to 1 Gbps is available. Our analysisshows that the application use cases in Section 5.3 can allbe deployed in the current network, and SDN will hardlychange the bandwidth usage patterns of end users. InTables 6 and 7, we provide our suggestions of alterna-tive solutions using the current technologies and Internetbandwidth.
5.4.1 Bandwidth Requirement
The most demanding application today is high-definitionvideo streaming, including those in Section 5.3, whereemergency response, remote collaboration and learningall leverage live video streaming. In Section 2.4 we es-timated the bandwidth required by the of the most up-do-date home devices with Retina Display. In Table 11of Appendix A we provide an analysis of bandwidth re-quirements that are common in modern homes, with dif-ferent screen sizes and various aspect ratios. As seenin the table, the bandwidth requirements are almost in-dependent of screen sizes. The reason is that the pixeldensity is determined by the limit of human vision. The
18
Focus Area Project Name Approach SDN Concerns Predicted Bandwidth Who Will UseProblem Alternative Solution3 Required
AdvancedManufac-
turing
Remote process controlusing reliable
communicationprotocol
Implementing reliablethird-party control algorithms,e.g., 3D printing.
Reliablecommunication
Multi-path TCPwith overlay
Between 38 to 74Mbps Manufacturers
Simulation-as-a-servicefor advanced
manufacturing
Remotely access a virtualdesktop-as-a-service systemfor advanced manufacturingprocesses.
A simulation-as-a-service appbased on cloudresource
Using thin-clientprotocols, e.g.,PCoIP
Several tens of Mbpsof network bandwidthsupporting few tens ofusers
Manufacturers
Cloud computing forcollaborative advanced
manufacturing
Using ultra fast, low latencynetworks to enable remotecollaboration
To be agile inresponding tocustomerrequirements
Current cloudservice withhigher resources
Between 38 to 74Mbps Manufacturers
Consumer 3D ContentCreation
Post to and access aFlickr-like online repositoryfor 3D images and videos.
Video, images,and publishedcontent do notexist for 3D
— Between 77 to 148Mbps End Users
EmergencyPrepared-
ness &PublicSafety
Real-time emergencyresponse
Detect, observe and assesssituations for emergencyresponders using live videoand social media data.
Real-timedetection andresponse
Centralizedemergencyoperations center
Real-time,high-definition devicecommunication at 10to 18 Mbps
Emergencyresponders
The Rashomon project:online multi-perspective
chronologies
Tell the story of an event fromaudio and videosimultaneously captured frommany users.
Obtaining acomprehensiveunderstanding ofan event frommany videos
Multiple-cameravideo streaming
Around 10 to 18Mbps End Users
FloodCube: nationalflood information
platform
Predict flood more preciselywith real-time analysis offlood sensors and tailor alertsfor individuals.
Flood warnings,forecasts,visualizations,mapping andweather info
Using sensors toderiveinformation forscientists
Special sensors at 6Mbps
Emergencymanagers andforecasters
Education&
WorkforceTechnolo-
gies
engage3D videoconferencing
Create engaging learningusing 3D telepresence,streaming Kinect sensor data.
Extend videoconferencing to3D
Multiple-cameravideo streaming
Between 77 to 148Mbps End users
High quality opensource Web
conferencing
Access high-quality,interactive education fromclassrooms throughout thecountry.
Regardless oflocation, all oneneeds is a browser
Google hangoutand Skype
Between 38 to 74Mbps End users
OpenPathEngage in mobile,place-based, collaborativelearning in real-time.
Web conferencingin a broader sense
Google hangoutand Skype
Between 38 to 74Mbps End users
Banyan – sharecollaborate & publish
scientific research
Facilitate collaboration andversion control for scientistsand researchers.
Sharing databetweengeographicallydiverse users
Github in aScientificcontext
Between 38 to 74Mbps
Scientists andresearchers
Hyperaudio Pad andLanguage Course
Creator
Learn, edit and remix mediathrough simple text interfaceto audio/video.
Learninglanguagesthroughtranscripts
Interactive audioand video editing
Between 38 to 74Mbps End users
PeerCDN
A peer-to-peer contentdelivery network (CDN) thatwill make the Web faster,more reliable, and help sitesto reduce bandwidth costs.
Peer-basedcontent deliverynetworks
Serving staticcontent over apeer-to-peernetwork
Between 38 to 74Mbps End users
Software lending libraryCheck-out software from thelibrary using ultra fast lowlatency networks.
Table 7: Mozilla Ignite projects, approaches, alternative solutions and bandwidth requirement (Continued, completelist of funded projects [43]).
larger a screen size is, the fewer number of pixels canbe seen from a far-away distance. This is a trade-offamong the screen size, distance to the screen, total num-ber of pixels can be seen, and the bandwidth. Overall,the bandwidth requirements are almost independent ofscreen sizes, varying around 38 Mbps to 74 Mbps for2D high-definition displays depending on the compres-sion ratio, and 76 Mbps to 148 Mbps for 3D displays.Such a bandwidth requirement can be served by currentnetwork connections.
5.4.2 Conclusions from Case Study
While the Mozilla Ignite participants are drawn from thebroader Internet community (Tables 6 and 7), the US Ig-nite projects have participants from academia (Table 8).Several US Ignite projects require transferring 3D videodata. This can leads to bandwidth requirement higherthan 100 Mbps (between 77 to 148 Mbps specifically).From Tables 6 to Table 8, the majority of the proposedapplications can be deployed in the current network, astheir bandwidth requirement is mostly under 100 Mbps.From these tables, there is no project that requires band-width higher than 1 Gbps, and used by ordinary endusers, i.e., changing the end user bandwidth usage pat-terns.
Should services use uncompressed video? Overall,any bandwidth higher than 1 Gbps can potentially sup-port raw data transfer, e.g., about 2 Gbps data rate cal-culated for the high-definition displays before compres-sion. However, there is no substantiated need for un-compressed videos based upon current research. Cur-rent video compression techniques often employ percep-tual model of human psycho-visual system, which can
achieve an immense compression ratio with an extremelylittle perceptibility of quality loss [40]. In other words,videos can be compressed significantly with little visiblequality loss, and such loss from the original video beforecompression often can hardly be noticed.
However, using uncompressed, raw data streams ischallenging even when the full bandwidth is available.The processing power needed to manage huge volumesof data would make the receiver hardware very expen-sive [71]. For example, when recording an uncom-pressed video to a computer, the computer must act like areal-time operating system. Any significant program ac-tivity including background processes may disrupt, dis-tort or stop the video recording. Hard disk drives have tobe fast solid-state drives (SSDs) or RAID to be capableof the data rate of raw videos [66]. If recording an un-compressed video over a wireless connection, any slightor even short time disruption or bandwidth decrease willalso disrupt the video recording. Even today’s memory,disk space and network connections are more affordable,uncompressed videos can easily exceed their limit, andthus diminishing the benefit of preserving more informa-tion over computation, storage and network resources.
Environments needing more bandwidth. Band-width significantly higher than 1 Gbps can support fu-turistic application environment such as CAVE2 [47].CAVE2 is the current highest resolution LCD-based vir-tual reality system, with a 36-node high-performancecomputer cluster, a 10-camera optical tracking systemand requires a 100-Gbps connection [11].
For most current applications, including all of those inSection 5.3, existing home wireless bandwidths are morethan sufficient.
20
Project Name SDN Concerns Predicted Bandwidth Who Will UseProblem Approach Solution Details Required
Disaster mitigationsystem [18]
Energy production,transportation andutilization are subjectto failures and canhave catastrophicimpact of life andproperty.
Providing emergencyresponse staff withtraining, planning, and realtime guidance on effectivestrategies to protect thegeneral public and firstresponders.
Today’s best-effortInternet used totransport data fromradars to a variety ofend users fordecision-making cancause importantinformation to be lost.
Connecting radars to ultrahigh-speed networks toimprove hazardousweather warning andresponse and theidentification and trackingof small, low-flyingaircraft.
Table 8: US Ignite projects, approaches, alternative solutions and bandwidth requirement (Complete list of fundedprojects [48]).
6 Conclusions
This paper studied four emerging technologies from thestandpoint of whether adoption would spur bandwidthgrowth at edge networks. Our conclusions are that sev-eral technologies, such as SDN and IoT, should not beexpected to drive home user bandwidth. This result goescontrary to the substantial attention that has been foistedupon these technologies for this purpose.
However, the mm-wave technology of 5G will firstlead to a ground-swell of network use that is fundamen-tally different than any previous expectations. Overall,this technology will behave differently in flash crowdsand similar situations which may change usage patterns,increase bandwidth sharing between unknown parties,which may drive end user demand.
Furthermore, Community Cloud offerings as arefound in Fog Computing, would dramatically reducecost and latency for cloud applications. If adopted theywould shift load to more fully utilize the heterogeneousedge devices. This will alter bandwidth to a much morebalanced upload / download ratio while also increasingbandwidth utilization during off-peak hours.
To policy makers or businesses that want to expandhigh bandwidth home networks, increasing the adop-tion of 5G mm-wave technology and Fog Computingwould be the wisest course of action. Businesses that
want to predict future bandwidth growth by home users,would be wise to watch Fog Computing and 5G adoptionclosely.
Acknowledgements
The authors are indebted to Will Barkis for his discus-sion about Mozilla Ignite which inspired us to undertakethis research. We would additionally like to thank BryanLyles, Joe Mambretti, and Suzanne Iacono for discus-sions that helped us to refine the content of this paper.
References[1] 1G. Accessed January 15, 2014,
http://en.wikipedia.org/wiki/1G.
[2] 3D film. Accessed January 15, 2014,http://en.wikipedia.org/wiki/3D film.
[3] 5G. Accessed January 15, 2014,http://en.wikipedia.org/wiki/5G.
[4] 5g research centre gets major funding grant. Accessed January15, 2014, http://www.bbc.co.uk/news/technology-19871065.
[5] 5grEEn - towards green 5g mobile networks. AccessedJanuary 15, 2014, http://www.eitictlabs.eu/innovation-areas/networking-solutions-for-future-media/5green-towards-green-5g-mobile-networks/.
[6] Akamai state of the Internet report, q22013. Accessed January 15, 2014,
[7] Akamai state of the Internet report, q2 2013infographic. Accessed January 15, 2014,http://www.akamai.com/dl/akamai/q2 2013 soti infographic.pdf.
[8] Biggest mistake for IPv6: It’s not backwards compat-ible, developers admit. Accessed January 15, 2014,http://www.networkworld.com/news/2009/032509-ipv6-mistake.html.
[9] Brief+case health. Accessed January 15, 2014,https://mozillaignite.org/apps/457/.
[10] Can the internet of everything bring back the high-growth economy? Accessed January 15, 2014,http://www.progressivepolicy.org/2013/09/can-the-internet-of-everything-bring-back-the-high-growth-economy/.
[11] CAVE2: Next-generation virtual-reality and visual-ization hybrid environment for immersive simula-tion and information. Accessed January 15, 2014,http://www.evl.uic.edu/core.php?mod=4&type=1&indi=424.
[13] Color depth. Accessed January 15, 2014,http://en.wikipedia.org/wiki/Color depth.
[14] Connect the smart way to the broadest range ofBluetooth devices. Accessed January 15, 2014,http://www.bluetooth.com/Pages/Smart-Logos.aspx.
[15] Connections counter: The internet of everything in motion.Accessed January 15, 2014, http://newsroom.cisco.com/feature-content?type=webcontent&articleId=1208342.
[16] Does the iPad (2012, 3rd generation) have the most pix-els of any tablet’s display? Accessed January 15, 2014,http://apple.stackexchange.com/questions/44196/.
[17] Eager: An in-home health alert system with re-mote care coordination. Accessed January 15, 2014,http://www.nsf.gov/awardsearch/showAward?AWD ID=1237970.
[19] Eager: Telehealth and wellness for senior cit-izens utilizing in-home gigabit hd multipointvideoconferencing. Accessed January 15, 2014,http://www.nsf.gov/awardsearch/showAward?AWD ID=1230663.
[20] Eager: Ultra high-speed bandwidth for performanceimprovements in radar networks for weather andaircraft surveillance. Accessed January 15, 2014,http://www.nsf.gov/awardsearch/showAward?AWD ID=1238485.
[21] Electronic product code. Accessed January 15, 2014,http://en.wikipedia.org/wiki/Electronic Product Code.
[22] Embracing the internet of everything to capture yourshare of $14.4 trillion. Accessed January 15, 2014,http://www.cisco.com/web/about/ac79/docs/innov/IoE Economy.pdf.
[23] Frame rate. Accessed January 15, 2014,http://en.wikipedia.org/wiki/Frame rate.
[24] GENI. Accessed January 15, 2014, http://www.geni.net/.
[25] Global internet phenomena. Accessed January 15, 2014,https://www.sandvine.com/trends/global-internet-phenomena/.
[26] How much bandwidth does broadcast hd video use? AccessedJanuary 15, 2014, http://www.ciena.com/connect/blog/How-much-bandwidth-does-Broadcast-HD-video-use.html.
[27] How much energy a smartphone uses in a year (andwhat it means for your budget). Accessed January15, 2014, http://lifehacker.com/5948075/how-much-energy-a-smartphone-uses-in-a-year-and-what-it-means-for-your-budget.
[28] Iana IPv4 address space registry. Accessed January 15, 2014,http://www.iana.org/assignments/ipv4-address-space/ipv4-address-space.xml.
[29] IBM: A smarter planet. Accessed January 15, 2014,http://www.ibm.com/smarterplanet/.
[30] IDC: 87% Of Connected Devices Sales By 2017 WillBe Tablets And Smartphones. Accessed January 15,2014,http://www.forbes.com/sites/louiscolumbus/2013/09/12/idc-87-of-connected-devices-by-2017-will-be-tablets-and-smartphones/.
[31] IEEE 802.15.4. Accessed January 15, 2014,http://en.wikipedia.org/wiki/IEEE 802.15.4.
[32] Interlaced video. Accessed January 15, 2014,http://en.wikipedia.org/wiki/Interlaced video.
[33] Internet of Things. Accessed January 15, 2014,http://en.wikipedia.org/wiki/Internet of Things.
[34] The internet of things. Accessed January 15, 2014,http://www.mckinsey.com/insights/high tech telecoms internet/the internet of things.
[35] Internet of things to booster food safety. AccessedJanuary 15, 2014, http://www.china.org.cn/business/2011-06/17/content 22805362.htm.
[37] KinectHealth. Accessed January 15, 2014,https://mozillaignite.org/apps/396/.
[38] Libelium: Interfacing the sensor networks with the web 2.0. Ac-cessed January 15, 2014, http://www.libelium.com/.
[39] Live blog: Steve Jobs introduces the iPhone 4. Accessed Jan-uary 15, 2014, http://m.npr.org/story/127530049.
[40] Lossy compression. Accessed January 15, 2014,https://en.wikipedia.org/wiki/Lossy compression#Compression ratio.
[41] LTE (telecommunication). Accessed January 15, 2014,http://en.wikipedia.org/wiki/3GPP Long Term Evolution.
[42] Mozilla Ignite. Accessed January 15, 2014,https://mozillaignite.org/.
[43] Mozilla Ignite. Accessed January 15, 2014,https://mozillaignite.org/.
[44] Mu researchers use sensor technologies to remotely mon-itor aging adults’ health. Accessed January 15, 2014,http://munews.missouri.edu/news-releases/2012/0614-mu-researchers-use-sensor-technologies-to-remotely-monitor-aging-adults%E2%80%99-health/.
[45] National science foundation awards a $500k to profs. rappaportand mao for millimeter-wave wireless. Accessed January15, 2014, http://nyuwireless.com/national-science-foundation-awards-500k-to-rappaport-and-mao-for-millimeter-wave-wireless-protocols/.
[46] Navigo. Accessed January 15, 2014,http://fr.wikipedia.org/wiki/Passe Navigo.
[47] The next generation in hybrid virtual environments. AccessedJanuary 15, 2014, http://www.mechdyne.com/cave2.aspx.
[48] Nsf leadership in discovery and innovation sparks whitehouse us ignite initiative. Accessed January 15, 2014,http://www.nsf.gov/news/news summ.jsp?cntn id=124472.
22
[49] NYU WIRELESS. Accessed January 15, 2014,http://nyuwireless.com/.
[50] One In Every 5 People In The World Own A Smart-phone, One In Every 17 Own A Tablet. AccessedJanuary 15, 2014,http://www.businessinsider.com/smartphone-and-tablet-penetration-2013-10.
[51] OpenFlow. Accessed January 15, 2014,http://en.wikipedia.org/wiki/OpenFlow.
[53] Pharmakon features telemedicine: Virtual visits, teledermas-copes, telestethoscopes the boom in healthcare technologyand what telehealth means for us. Accessed January 15,2014, http://pharmakon.me/2012/10/26/pharmakon-features-telemedicine-virtual-visits-teledermascopes-telestethoscopes-the-boom-in-healthcare-technology-and-what-telehealth-means-for-us/.
[54] Pixel density. Accessed January 15, 2014,http://en.wikipedia.org/wiki/Pixel density.
[55] Real-time emergency response. Accessed January 15, 2014,https://mozillaignite.org/apps/404/.
[56] Regional internet registries. Accessed January 15, 2014,https://www.arin.net/knowledge/rirs.html.
[57] Research to link mobile phones and health. Accessed Jan-uary 15, 2014, http://media.murdoch.edu.au/research-to-link-mobile-phones-and-health.
[58] Retina display. Accessed January 15, 2014,http://en.wikipedia.org/wiki/Retina Display.
[59] Searching for 1,000 times the capacity of 4G wire-less. Accessed January 15, 2014, http://www.poly.edu/press-release/2012/07/19/searching-1000-times-capacity-4g-wireless.
[60] Seattle. Accessed January 15, 2014,https://seattle.poly.edu/html/.
[61] Software-defined networking. Accessed January 15, 2014,http://en.wikipedia.org/wiki/Software-defined networking.
[63] Software-defined networking: The new norm for networks. Ac-cessed January 15, 2014, https://www.opennetworking.org/sdn-resources/sdn-library/whitepapers.
[64] Suggested compression ratio with H.264. Accessed January 15,2014, http://stackoverflow.com/questions/5024114/suggested-compression-ratio-with-h-264.
[65] That ’Internet of Things’ thing. Accessed January 15, 2014,http://www.rfidjournal.com/articles/view?4986.
[66] Uncompressed video. Accessed January 15, 2014,http://en.wikipedia.org/wiki/Uncompressed video.
[67] Uniform resource identifier. Accessed January 15, 2014,http://en.wikipedia.org/wiki/URI.
[68] Us Ignite. Accessed January 15, 2014, http://us-ignite.org/.
[69] Which tv screen size is most popular inthe us? Accessed January 15, 2014,https://51degrees.mobi/Blog/TabId/553/ArtMID/1641/ArticleID/184/Which-TV-Screen-Size-is-Most-Popular-in-the-US.aspx.
[70] Why Bluetooth use is on the rise. Accessed January15, 2014, http://www.bbc.com/future/story/20130905-the-rise-of-bluetooth/all.
[71] Why do we need compression? Accessed January 15, 2014,http://www.newmediarepublic.com/dvideo/compression/adv03.html.
[72] World population. Accessed January 15, 2014,http://en.wikipedia.org/wiki/World population.
[73] Zenodotus. Accessed January 15, 2014,https://seattle.poly.edu/wiki/Zenodotus.
[74] BASSI, A., AND HORN, G. Internet of things in 2020: Aroadmap for the future. European Commission: InformationSociety and Media (2008).
[75] BONOMI, F. Connected vehicles, the internet of things, andfog computing. In The Eighth ACM Imemational Workshop onVehiculAr Inter-NETworking (VANET 2011). Las Vegas, USA:ACM (2011).
[76] BONOMI, F., MILITO, R., ZHU, J., AND ADDEPALLI, S. Fogcomputing and its role in the internet of things. In Proceedingsof the first edition of the MCC workshop on Mobile cloud com-puting (2012), ACM, pp. 13–16.
[77] BURRELL, J., BROOKE, T., AND BECKWITH, R. Vineyardcomputing: Sensor networks in agricultural production. Perva-sive Computing, IEEE 3, 1 (2004), 38–45.
[78] FORECAST, C. V. Cisco visual networking index: Global mo-bile data traffic forecast update 2012-2017. Cisco Public Infor-mation (2013).
[79] GUINARD, D., FISCHER, M., AND TRIFA, V. Sharing usingsocial networks in a composable web of things. In PervasiveComputing and Communications Workshops (PERCOM Work-shops), 2010 8th IEEE International Conference on (2010),IEEE, pp. 702–707.
[80] INTELLIGENCE, S. C. B. Disruptive civil technologies. Sixtechnologies with potential impacts on US interests out to 2025(2008).
[81] JANEVSKI, T. 5g mobile phone concept. In Consumer Commu-nications and Networking Conference, 2009. CCNC 2009. 6thIEEE (2009), IEEE, pp. 1–2.
[82] LANDA GAMIOCHIPI, R., ARAUJO, J., CLEGG, R., MYKO-NIATI, E., GRIFFIN, D., AND RIO, M. The large-scale geogra-phy of internet round trip times.
[83] LI, X., GANI, A., SALLEH, R., AND ZAKARIA, O. The fu-ture of mobile wireless communication networks. In Communi-cation Software and Networks, 2009. ICCSN’09. InternationalConference on (2009), IEEE, pp. 554–557.
[84] MAINWARING, A., CULLER, D., POLASTRE, J., SZEWCZYK,R., AND ANDERSON, J. Wireless sensor networks for habi-tat monitoring. In Proceedings of the 1st ACM internationalworkshop on Wireless sensor networks and applications (2002),ACM, pp. 88–97.
[85] MALAN, D., FULFORD-JONES, T., WELSH, M., AND MOUL-TON, S. Codeblue: An ad hoc sensor network infrastructure foremergency medical care. In International workshop on wear-able and implantable body sensor networks (2004), vol. 5.
[86] MANYIKA, J., CHUI, M., BUGHIN, J., DOBBS, R., BISSON,P., AND MARRS, A. Disruptive technologies: Advances thatwill transform life, business, and the global economy. McKinseyGlobal Institute, May (2013).
[87] MASHTIZADEH, A. J., BITTAU, A., HUANG, Y. F., ANDMAZIERES, D. Replication, history, and grafting in the ori filesystem. In Proceedings of the Twenty-Fourth ACM Symposiumon Operating Systems Principles (2013), ACM, pp. 151–166.
[88] MAYER, C. P. Security and privacy challenges in the internetof things. Electronic Communications of the EASST 17 (2009).
[89] MONTENEGRO, G., KUSHALNAGAR, N., HUI, J., ANDCULLER, D. Transmission of ipv6 packets over ieee 802.15.4 networks. Internet proposed standard RFC 4944 (2007).
23
����������������������������������������
����������������������������������������
��������������������������������������
��������������������������������������
hh/2
d
αα/2
eye
display
pixel A
pixel B
Figure 6: The physics behind retina (Source: [16]).
[90] PACHAURI, A. K., AND SINGH, O. 5g technology–redefiningwireless communication in upcoming years.
[91] PERERA, C., ZASLAVSKY, A., CHRISTEN, P., AND GEOR-GAKOPOULOS, D. Context aware computing for the internet ofthings: A survey.
[92] RAPPAPORT, T. S., ET AL. Wireless communications: princi-ples and practice, vol. 2. Prentice Hall PTR New Jersey, 1996.
[93] RAPPAPORT, T. S., MURDOCK, J. N., AND GUTIERREZ,F. State of the art in 60-ghz integrated circuits and systemsfor wireless communications. Proceedings of the IEEE 99, 8(2011), 1390–1436.
[94] RAPPAPORT, T. S., SUN, S., MAYZUS, R., ZHAO, H., AZAR,Y., WANG, K., WONG, G. N., SCHULZ, J. K., SAMIMI, M.,AND GUTIERREZ, F. Millimeter wave mobile communicationsfor 5g cellular: It will work!
[95] ROONEY, S., BAUER, D., AND SCOTTON, P. Techniques forintegrating sensors into the enterprise network. Network andService Management, IEEE Transactions on 3, 1 (2006), 43–52.
[96] RUSEK, F., PERSSON, D., LAU, B. K., LARSSON, E. G.,MARZETTA, T. L., EDFORS, O., AND TUFVESSON, F. Scalingup mimo: Opportunities and challenges with very large arrays.Signal Processing Magazine, IEEE 30, 1 (2013), 40–60.
[97] TAROUCO, L. M. R., BERTHOLDO, L. M., GRANVILLE,L. Z., ARBIZA, L. M. R., CARBONE, F., MAROTTA, M.,AND DE SANTANNA, J. J. C. Internet of things in health-care: Interoperatibility and security issues. In Communications(ICC), 2012 IEEE International Conference on (2012), IEEE,pp. 6121–6125.
[98] ZHUANG, Y., PAN, J., AND CAI, L. A probabilistic model formessage propagation in two-dimensional vehicular ad-hoc net-works. In Proceedings of the seventh ACM international work-shop on VehiculAr InterNETworking (2010), ACM, pp. 31–40.
[99] ZHUANG, Y., PAN, J., LUO, Y., AND CAI, L. Time andlocation-critical emergency message dissemination for vehicu-lar ad-hoc networks. Selected Areas in Communications, IEEEJournal on 29, 1 (2011), 187–196.
[100] ZHUANG, Y., PAN, J., VISWANATHAN, V., AND CAI, L. Onthe uplink mac performance of a drive-thru internet. VehicularTechnology, IEEE Transactions on 61, 4 (2012), 1925–1935.
A Appendix
A.1 The Physics Behind RetinaThe term Retina Display is relative, as the definition fol-lows the human eyes’ perception of the sharpness of adisplay. Figure 6 shows an example of two pixels of adisplay in front of a human eye, where α is the angle
at which the human retina will see two distinct pixels, dis the perpendicular distance from the eye to the displaysurface, and h is the distance between two district pixelsin one dimension. From the figure, we have
tan(
α
2
)=
h/2d
, or α = 2arctan(
h2d
). (1)
Using equation (1), we can determine the angles atwhich two adjacent pixels can be perceived by humaneye. For instance, at the retina limit mentioned by SteveJobs [39], the pixel density is 300 ppi at a distance of10 inches. This is equivalent to h = 1/300 and d = 10,thus giving α∗ = 2arctan
(1
6,000
)= 3.3× 10⁻⁴ radians,
the angle at which the human eye can distinguish twopixels at a distance of 10 inches. In other words, any an-gle larger than 3.3× 10⁻⁴ radians is distinguishable byhuman eyes at 10 inches from the display. We can thuscalculate the values of α and compare with α∗. The datafor current Apple devices, pixel density, α , resolution,etc., are shown in Table 9.
Note that the concept of Retina Display is relative, asseen in the data shown in Table 9. If holding an iPad at anormal distance of 15 inches, then α = 2.5×10⁻⁴ radi-ans, smaller than the minimum α∗ of Retina Display. Ifholding the same iPad closer at a distance of 10 inches,α = 3.8×10⁻⁴ radians and thus no longer meets the re-quirement of Retina Display.
A.2 Bandwidth Requirements by CommonHome Displays
As in Section 2.4, the parameters required to calculatethe digital bandwidth requirements for uncompressedvideo is [26]:
• Video resolution.
This is measured by the number of pixels wide bythe number of pixels high of a video stream. High-definition video is generally defined as having a res-olution of at least 1280×720. However, there arealso a wide variety of available video resolution for-mats. Depending on the screen size, certain crite-ria must be met in order for the pixels to be indis-tinguishable to a person with perfect vision, whenviewing at a certain distance from the screen (Ap-pendix A).
• Frame rate.
This is the number of still images or frames persecond (FPS) sent as part of the video stream [23].Broadcast high-definition videos are transmitted ata rate of 59.94 FPS in North America, and 50 FPS
24
Device Type Pixel Density (ppi) h (inch) d (inch) α (radian) Retina Display Resolution Total PixelsiPhone 4/4S and iPod Touch
MacBook Pro with RetinaDisplay 15” 220 1/220 20 2.3×10⁻⁴ 3 2880 × 1800 5,184,000
Table 9: Current Apple devices: device types, pixel density, resolution and retina display (Source of device types, ppiand resolution: [58]).
Device Type Pixel Density Total Pixels Data per Frame Uncompressed Data Rate Compressed RateiPhone 4/4S and iPod Touch
(4th Generation) 326 ppi 614.4 K 14.75 Mb 442.4 Mbps 8.85 – 14.75 Mbps
iPhone 5/5S/5C and iPodTouch (5th Generation) 326 ppi 727.04 K 17.45 Mb 523.4 Mbps 10.47 – 17.45 Mbps
iPad (3rd/4thGeneration/iPad Air) 264 ppi 3.146 M 75.6 Mb 2.268 Gbps 45.36 – 75.6 Mbps
iPad Mini (2nd Generation) 326 ppi 3.146 M 75.6 Mb 2.268 Gbps 45.36 – 75.6 MbpsMacBook Pro with Retina
Display 13” 227 ppi 4.096 M 98.3 Mb 2.949 Gbps 58.98 – 98.3 Mbps
MacBook Pro with RetinaDisplay 15” 220 ppi 5.184 M 124.42 Mb 3.732 Gbps 74.65 – 124.4 Mbps
Table 10: Bandwidth requirements for current Apple devices: device types, pixel density, resolution and retina display(Source of device types, ppi and resolution: [58]).
in Europe. However, we also need to account forpossible interlaced video [32], which is a way ofsending only half of the video frame at a time, eitherthe odd rows or the even rows of the image. This ef-fectively reduces the number of full frames sent persecond by half, and thus cuts the bandwidth require-ment in half. In the following, we assume the framerate is North America standard with interlacing, or30 FPS.
• Color depth.
This is also referred to as bits-per-pixel or bpp,and defines how many colors can be representedby each pixel in the video. A color depth of 1-bitis monochrome, either black or white, while 8-bitscan generate 256 colors. Most professional broad-cast cameras have a color depth of 24bits or moreper pixel, which is considered true-color with over16 million color variations. However, some profes-sional cameras use a technique called chroma sub-sampling to reduce the number of bits needed, andthus the bandwidth required, to achieve a full spec-trum of color. For example, chroma sub samplingcan reduce the bpp from 24-bits to 16-bits withouta visible effect on video quality.
To calculate the bandwidth required for video trans-mission of a certain screen size, we have the uncom-
pressed data rate as
(No. of total pixels)× (color depth)× (frame rate), (2)
and data rate after compression as the result in equation(2) divided by the compression ratio.
A.2.1 Real Bandwidth Requirements by Apple De-vices
Table 10 shows the required bandwidth for Apple devicesgiven their pixel density. The ppi values are from Ta-ble 9. Current high-definition smart device displays, suchas iPhone 5 in Table 10, has a total number of 727,040pixels at 326 ppi. Due to a much smaller screen size andcloser distance from eyes to the display, this gives merely17.45 Mb per frame with a 24-bit color depth. 30 framesper second refresh rate thus leads to a raw data rate of523.4 Mbps. As a result, an iPhone 5 only requires abandwidth of about 10 Mbps to 18 Mbps depending onthe compression ratio.
Table 11 summarizes the theoretical bandwidth require-ments of different screen sizes with Retina Display stan-dard. As seen in the table, the bandwidth requirementsare almost independent of screen sizes, varying around
25
Size d Pixel Aspect Resolution Total Data per Uncompressed Compressed Rate Compressed 3D Rate(Market Share) Density Ratio Pixels Frame Data Rate4:3 2006×1505 3.02 M 72.45 Mb 2.173 Gbps 43.47 – 72.45 Mbps 86.94 – 144.9 Mbps
Table 11: Theoretical bandwidth requirements of different screen sizes with Retina Display standard (Size: diagonalscreen size in inches; d: distance from human eye to screen in inches). Assuming 24-bit color depth, and frame rate30 FPS.
38 Mbps to 74 Mbps depending on the compression ratio.The reason is that the pixel density is calculated accord-ing to equation (1), which is determined by the limit ofhuman vision. This is a trade-off among the screen size,distance to the screen, total number of pixels can be seen,and the bandwidth.
Note that 3D printing (Table 6) works by slicing a 3Dobject into layers and processing the object by each layer.Therefore, the same bandwidth requirement in 2D ap-plies to 3D printing at each layer, with extra computa-tion and processing in the third dimension. Similarly, thetechnology used to produce 3D videos works by record-ing images as seen from two perspectives [2]. As a result,the bandwidth required will be at most twice as high asin 2D, which is between 76 Mbps to 148 Mbps for thehigh-definition TV screen examples in Table 11.

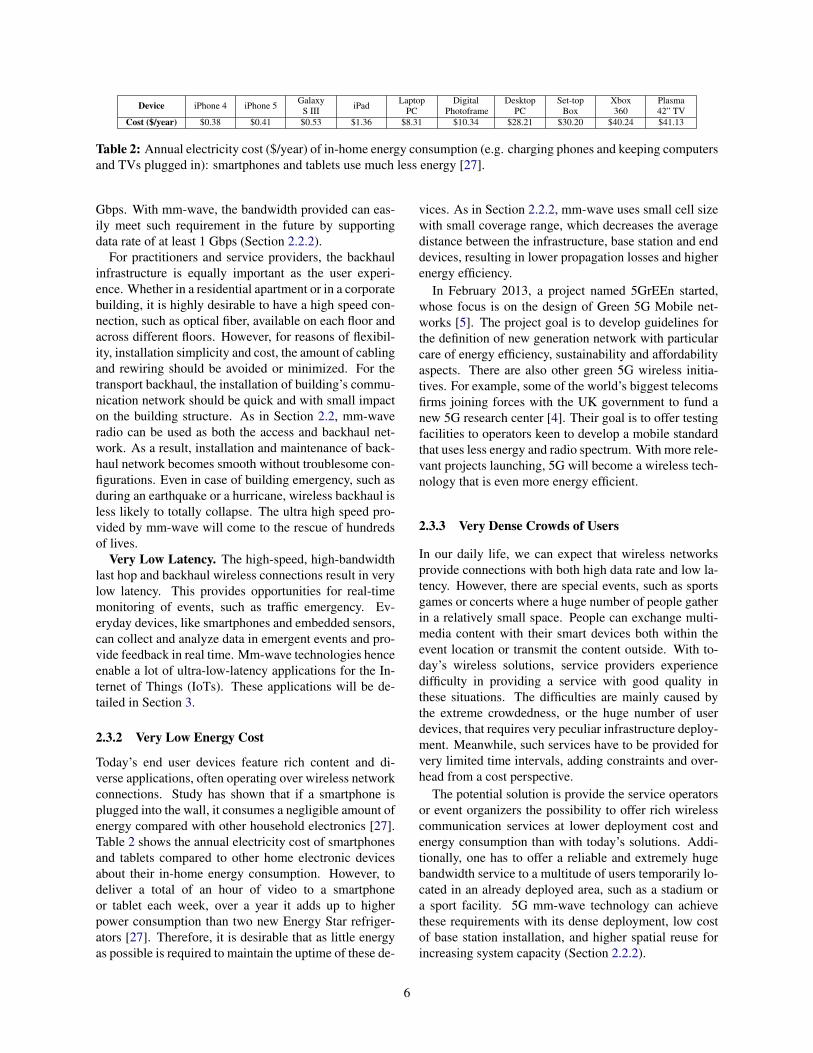
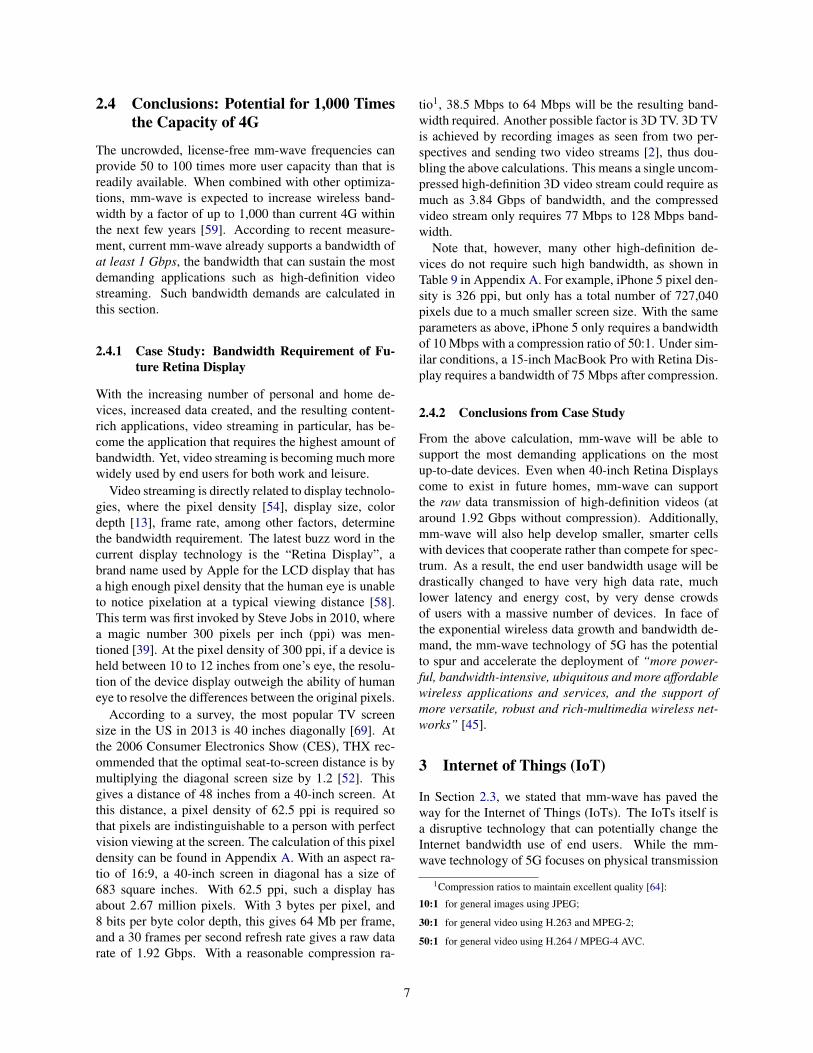
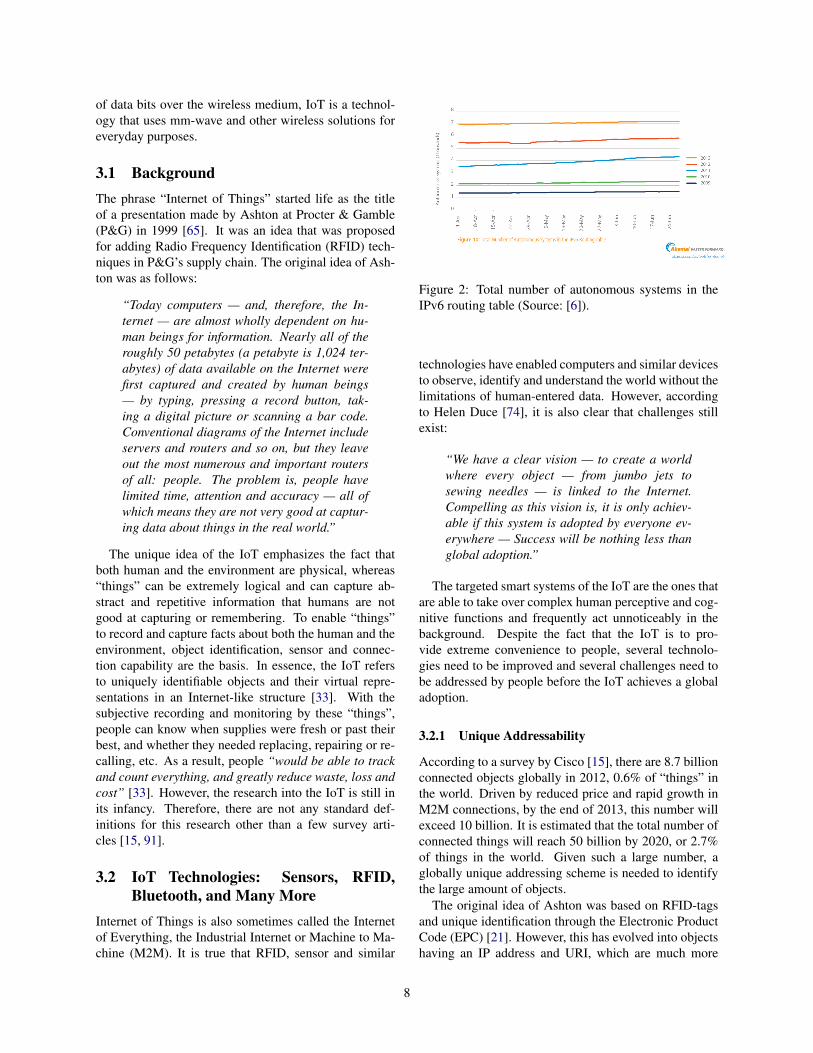
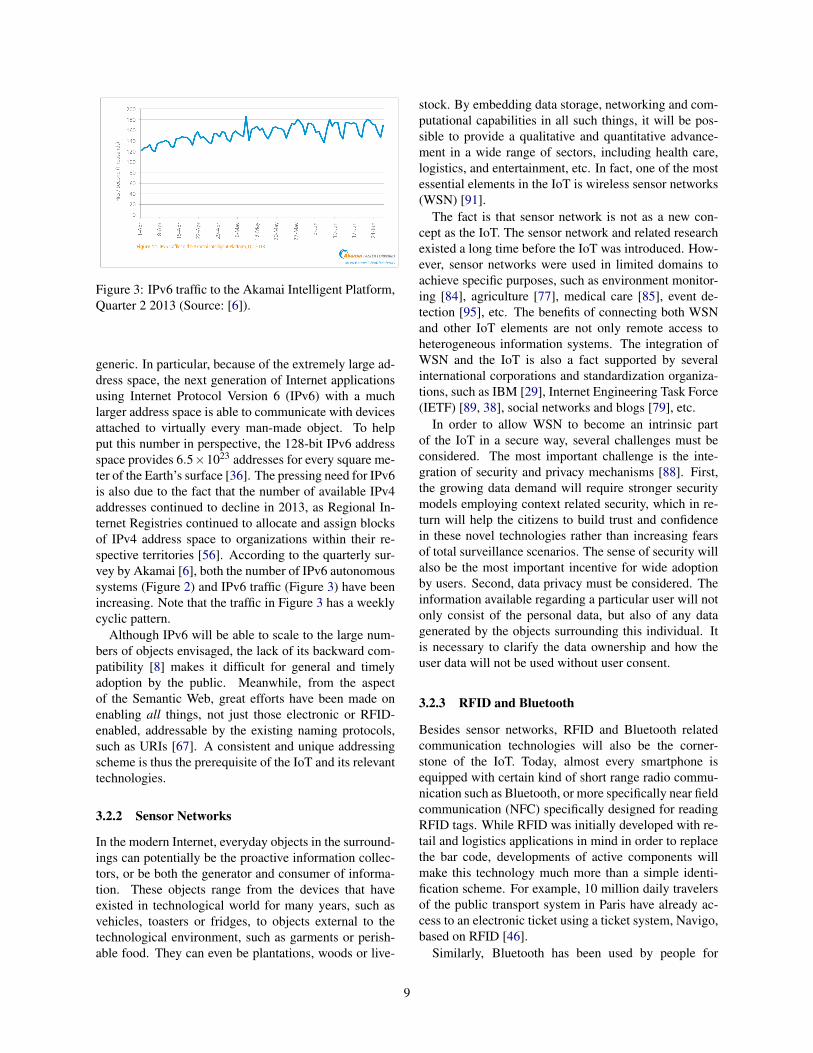
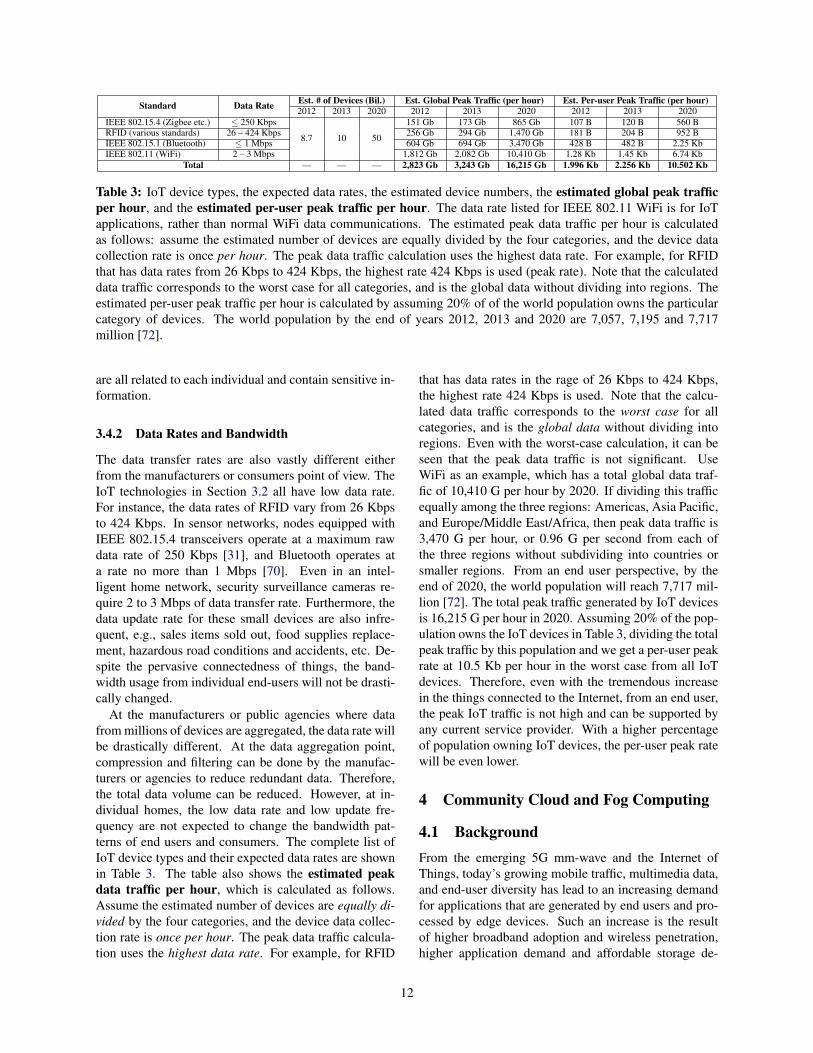
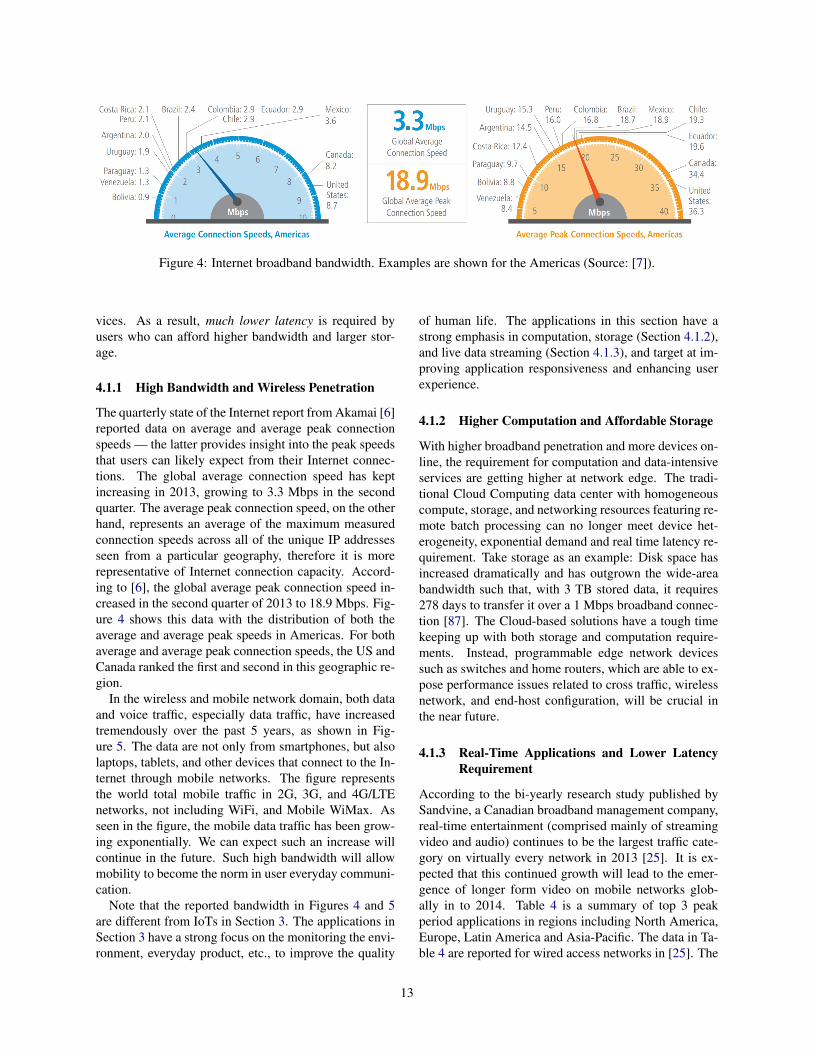
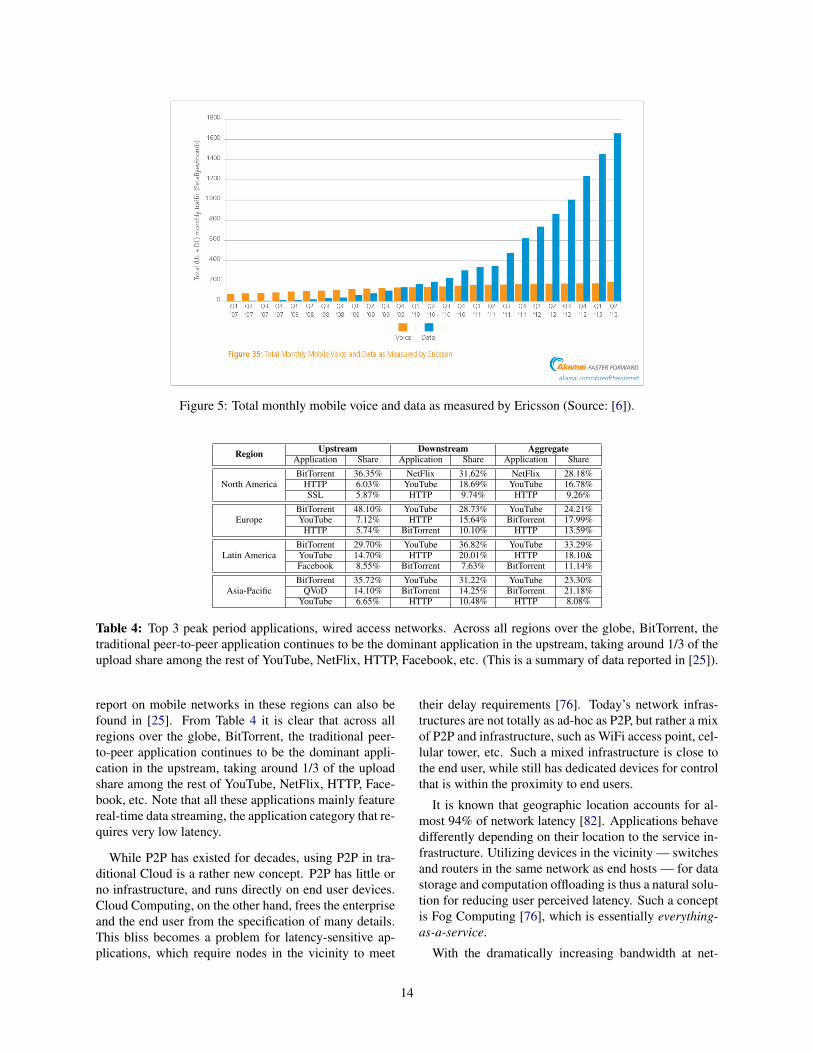
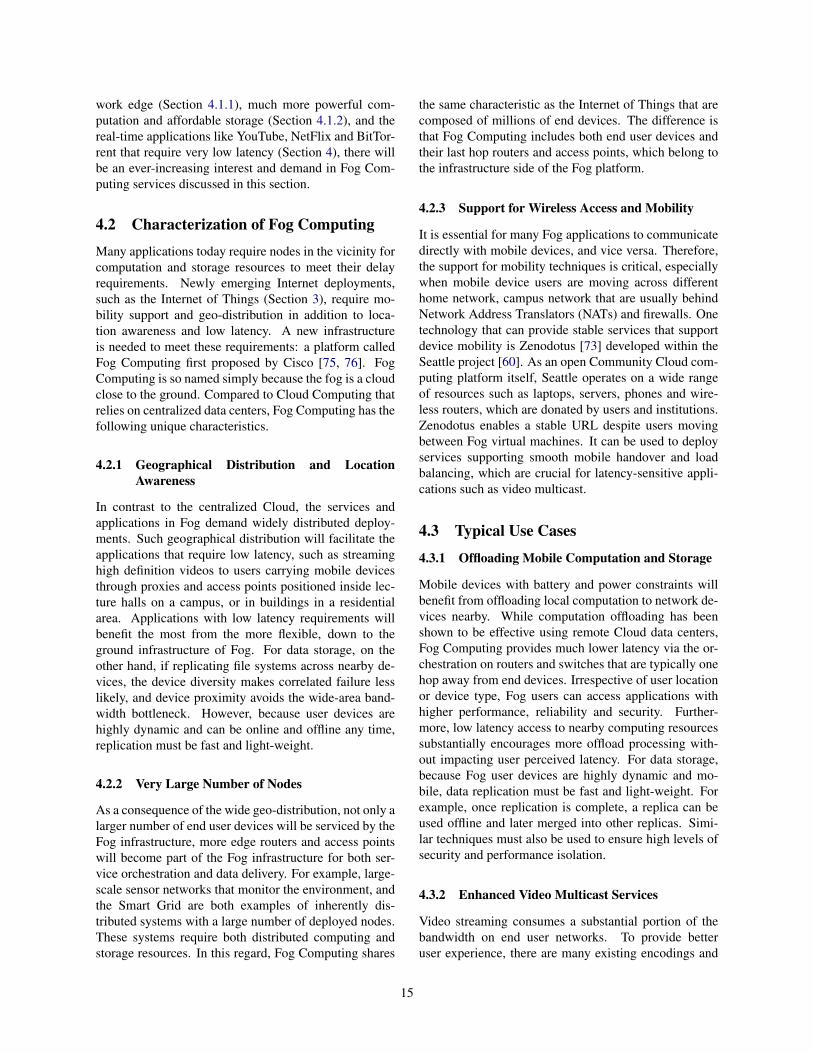
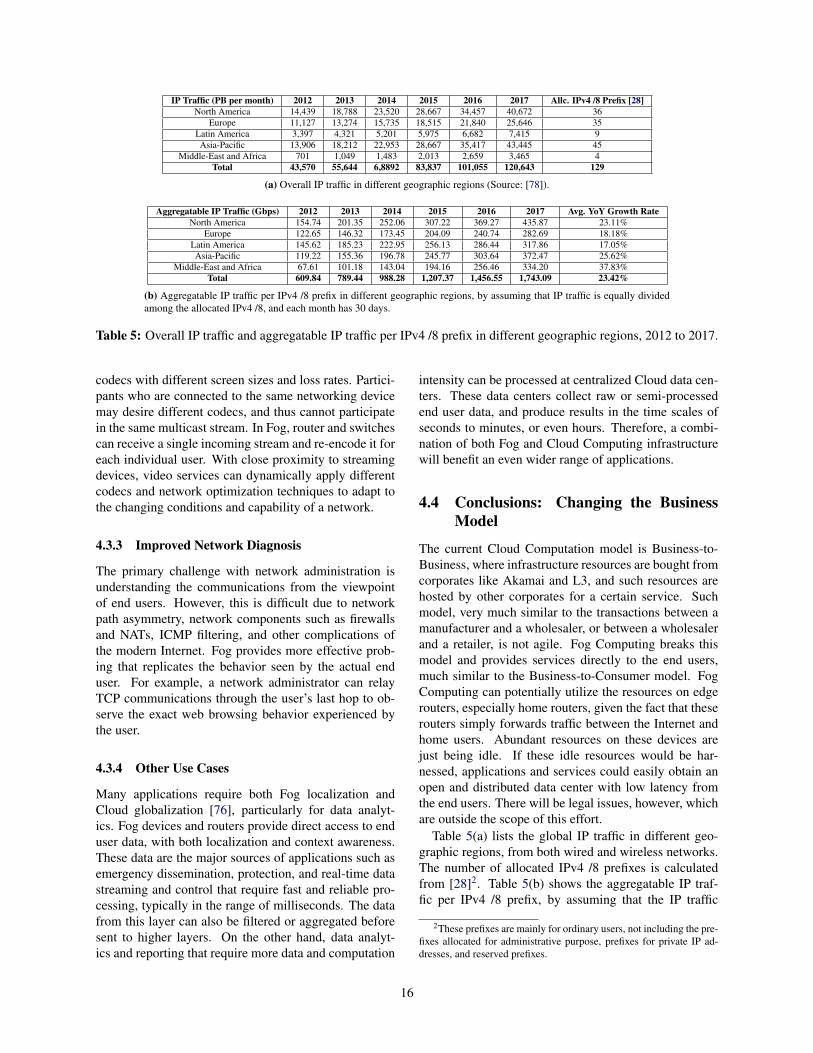
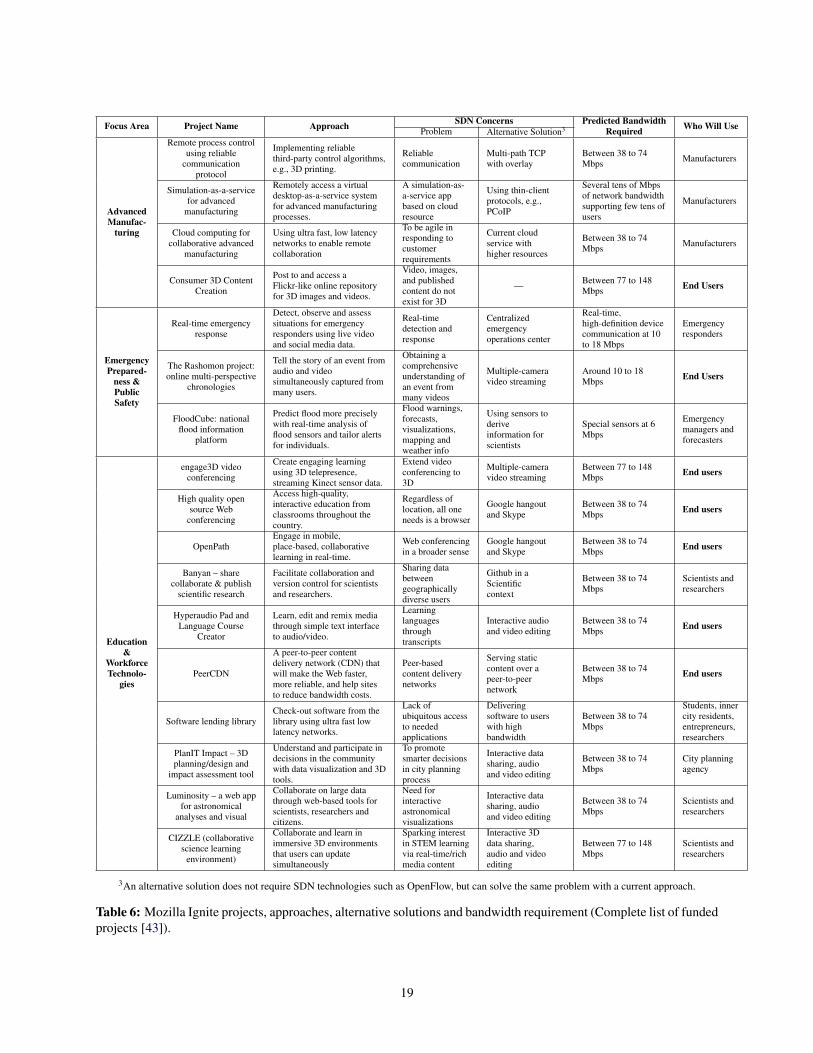
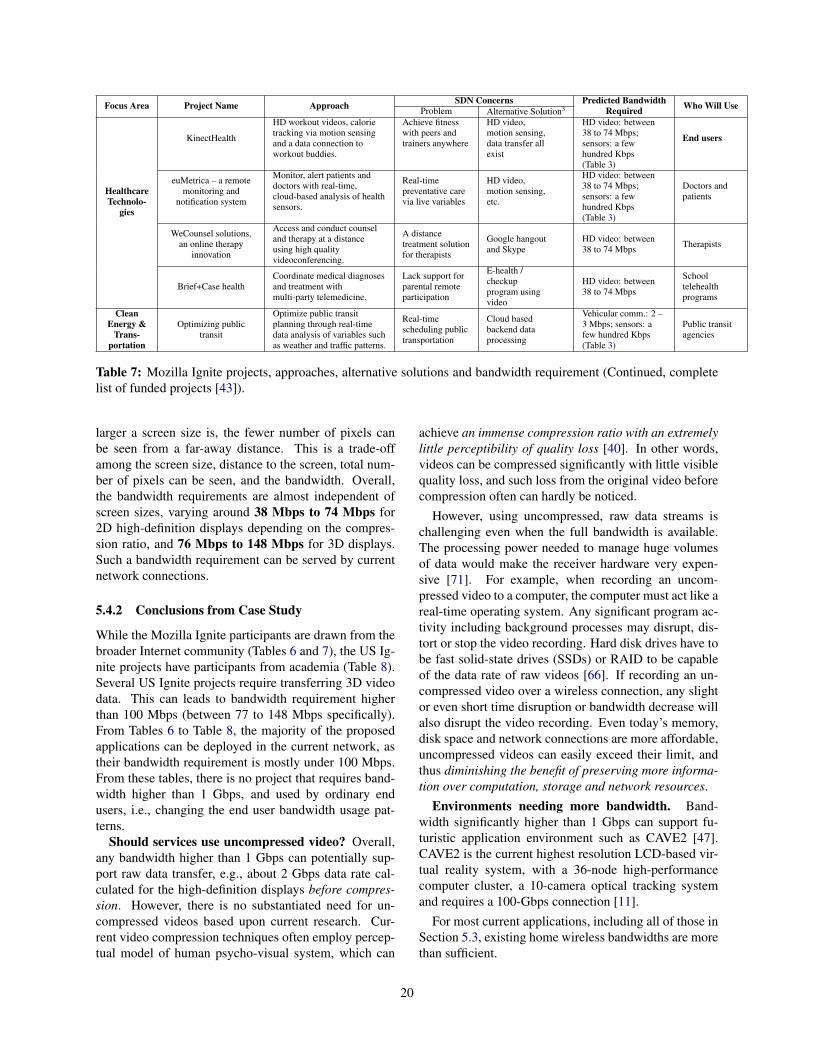
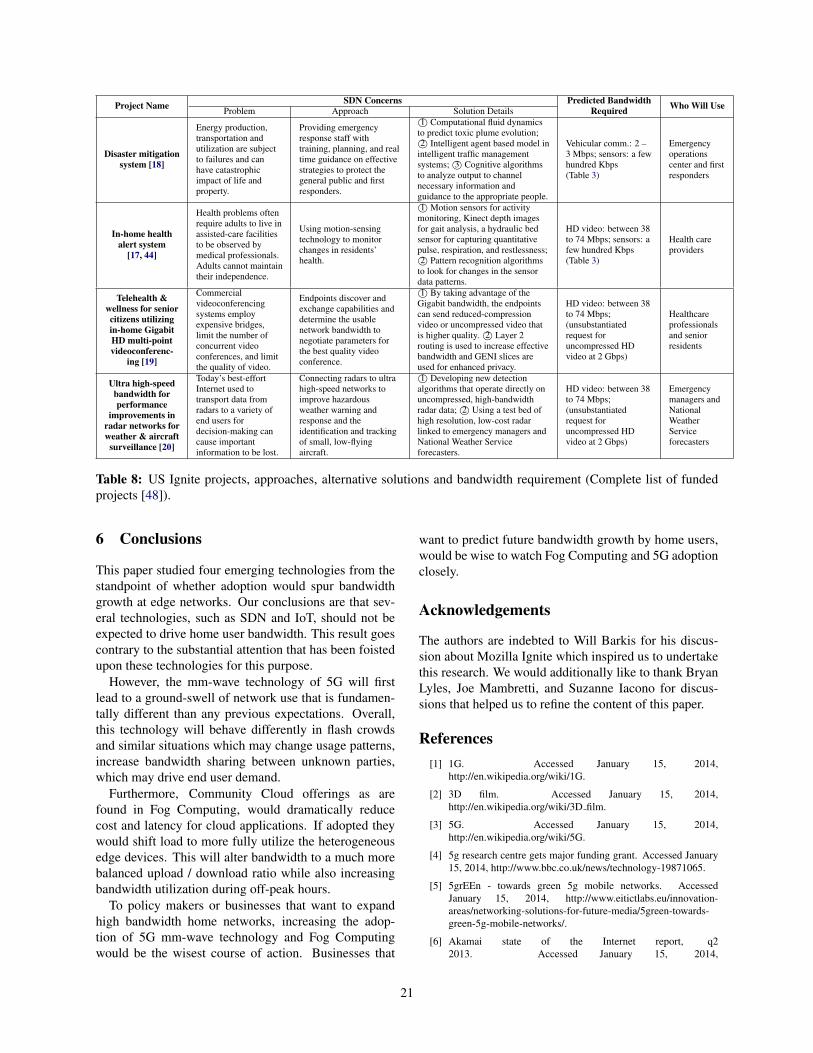
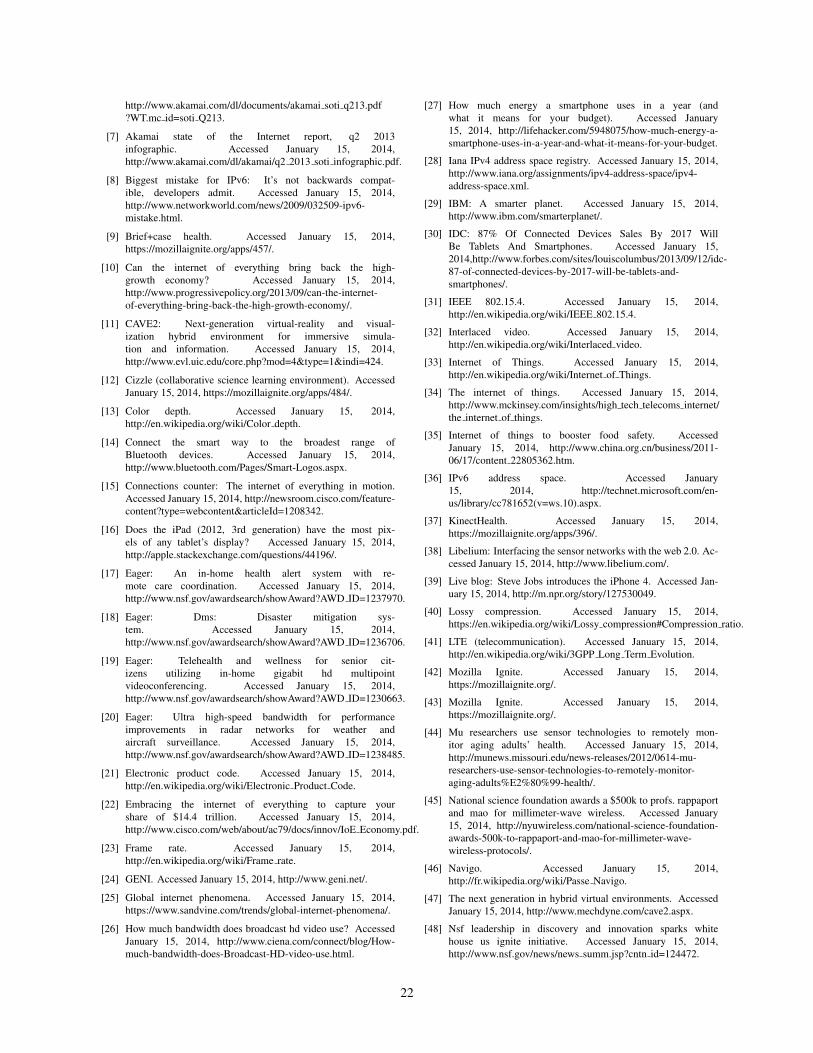
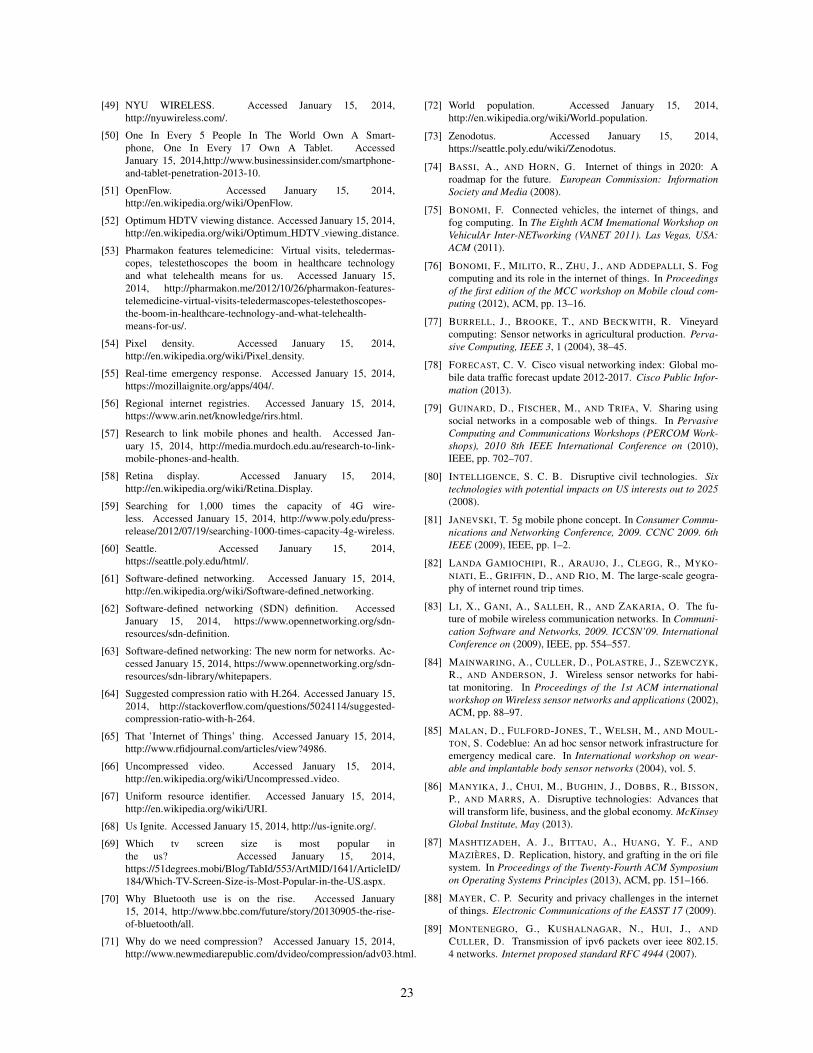

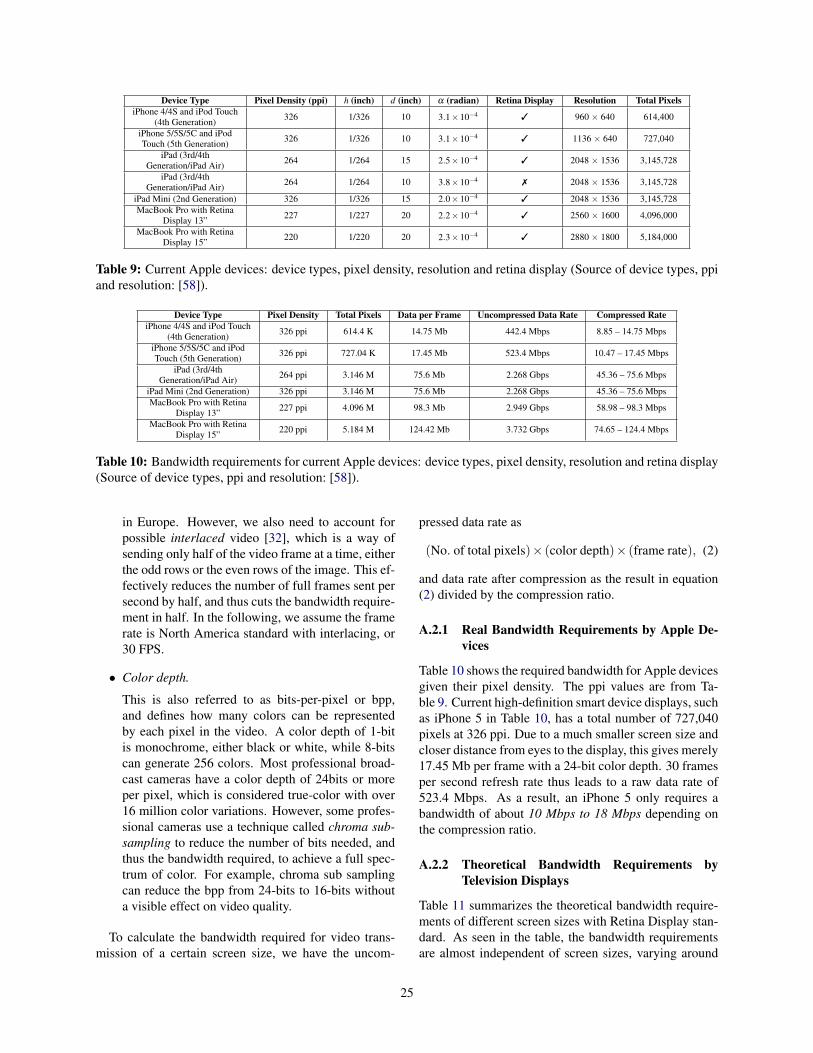
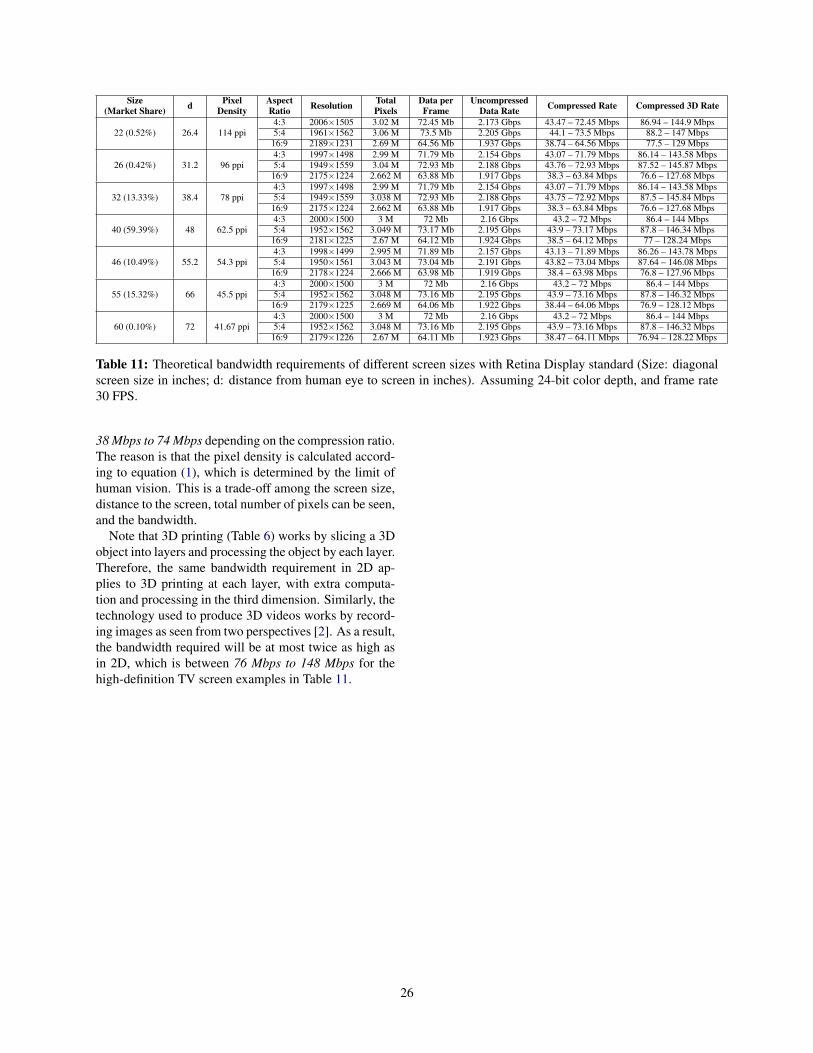


![Index [ptgmedia.pearsoncmg.com]...EIGRP authentication, 101–102 bandwidth command, 103–104 bandwidth configuration, 102–104 bandwidth-percent command, 104 ip bandwidth-percent-eigrp](https://static.documents.pub/doc/80x56/5ed079ce95646c550611f388/index-eigrp-authentication-101a102-bandwidth-command-103a104-bandwidth.jpg)


![Investigation of Bandwidth Requirement of Smart …file.scirp.org/pdf/SGRE_2013070909043506.pdfInvestigation of Bandwidth Requirement of Smart Meter ... tems to use DG ... [16,17].](https://static.documents.pub/doc/80x56/5ae2e20a7f8b9a495c8c934d/investigation-of-bandwidth-requirement-of-smart-filescirporgpdfsgre-of-bandwidth.jpg)


