Future Oil Future Oil MAXIMIZING OIL RECOVERY MAXIMIZING OIL RECOVERY EFFICIENCY AND SEQUESTRATION EFFICIENCY AND SEQUESTRATION Future Oil Recovery Efficiency 60%+ Future Oil Recovery Efficiency 60%+ EFFICIENCY AND SEQUESTRATION EFFICIENCY AND SEQUESTRATION OF CO OF CO 2 WITH “NEXT GENERATION” WITH “NEXT GENERATION” CO CO 2 -EOR TECHNOLOGY EOR TECHNOLOGY Today’s Oil Recovery Today’s Oil Recovery Presented by: Vello A. Kuuskraa, President Advanced Resources International Recovery Efficiency 33% Recovery Efficiency 33% Advanced Resources International [email protected]May 2008 JAF02742..PPT May 9, 2008 1 Advanced Resources International
Transcript
Future OilFuture Oil
MAXIMIZING OIL RECOVERY MAXIMIZING OIL RECOVERY EFFICIENCY AND SEQUESTRATIONEFFICIENCY AND SEQUESTRATION
Future OilRecoveryEfficiency60%+
Future OilRecoveryEfficiency60%+
EFFICIENCY AND SEQUESTRATION EFFICIENCY AND SEQUESTRATION OF COOF CO22 WITH “NEXT GENERATION” WITH “NEXT GENERATION” COCO22--EOR TECHNOLOGYEOR TECHNOLOGY
Today’s Oil RecoveryToday’s Oil Recovery
Presented by:
Vello A. Kuuskraa, PresidentAdvanced Resources International
those companies that support the programby allowing their professionalsby allowing their professionals
to participate as Lecturers.
JAF02742..PPT May 9, 2008
And special thanks to The American Institute of Mining, Metallurgical,
and Petroleum Engineers (AIME) for their contribution to the program.
BackgroundBackgroundBackgroundBackground
1. Status and Outlook for CO2-EOR2. “Next Generation” CO2-EOR Technology2 gy
• Increasing Oil Recovery Efficiency• Expanding CO2 Storage Capacityp g 2 g p y
3. Summary
JAF02742..PPT May 9, 20083
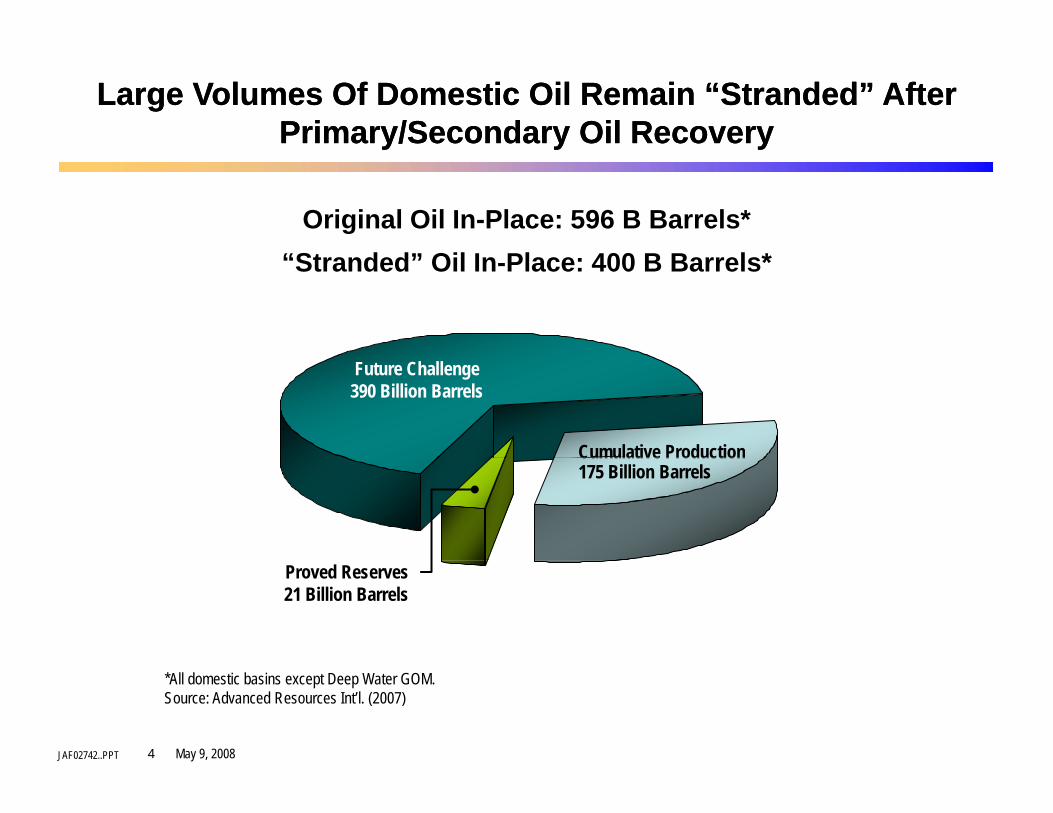
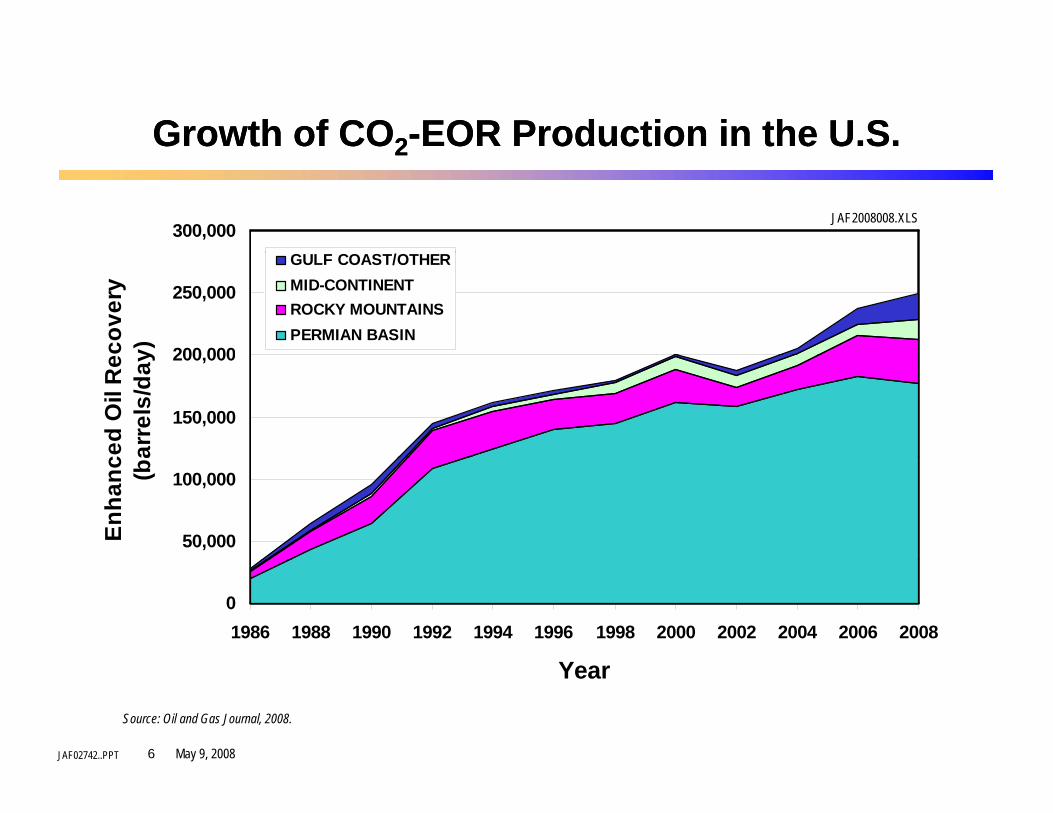
Large Volumes Of Domestic Oil Remain “Stranded” After Large Volumes Of Domestic Oil Remain “Stranded” After Primary/Secondary Oil RecoveryPrimary/Secondary Oil Recovery
Original Oil In-Place: 596 B Barrels*“St d d” Oil I Pl 400 B B l *“Stranded” Oil In-Place: 400 B Barrels*
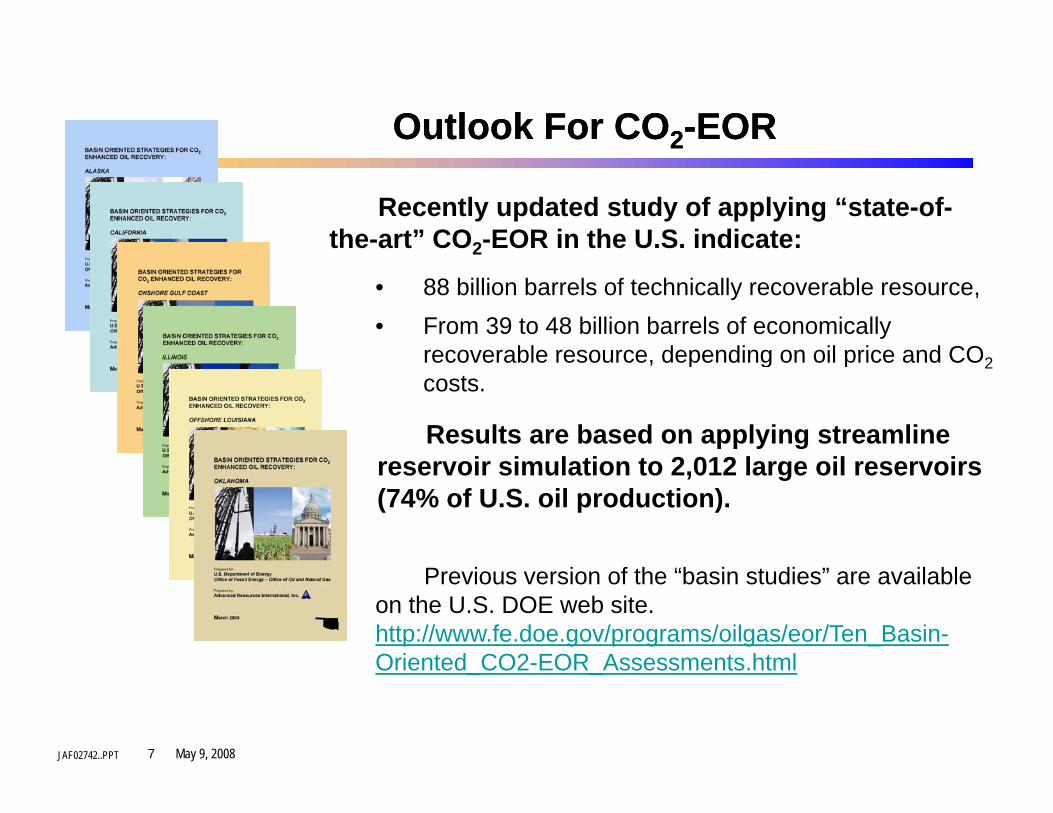
Recently updated study of applying “state-of-the-art” CO2-EOR in the U.S. indicate: 2
• 88 billion barrels of technically recoverable resource, • From 39 to 48 billion barrels of economically
recoverable resource depending on oil price and COrecoverable resource, depending on oil price and CO2costs.
Results are based on applying streamline i i l ti t 2 012 l il ireservoir simulation to 2,012 large oil reservoirs
(74% of U.S. oil production).
Previous version of the “basin studies” are available on the U.S. DOE web site. http://www.fe.doe.gov/programs/oilgas/eor/Ten_Basin-Oriented CO2 EOR Assessments html
JAF02742..PPT May 9, 20087
Oriented_CO2-EOR_Assessments.html
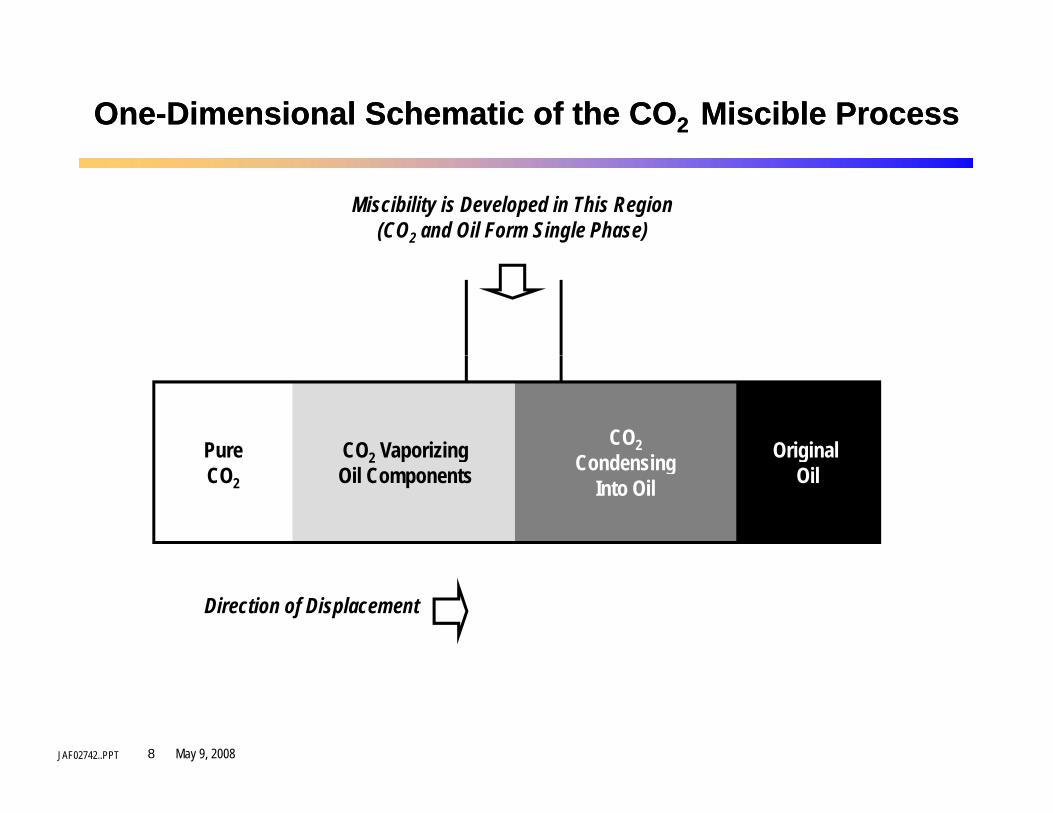
OneOne--Dimensional Schematic of the CODimensional Schematic of the CO2 2 Miscible ProcessMiscible Process
Miscibility is Developed in This Region(CO2 and Oil Form Single Phase)
Pure CO2 Vaporizing CO2C d i Original
CO2
2 p gOil Components Condensing
Into Oil
gOil
Direction of Displacement
JAF02742..PPT May 9, 20088
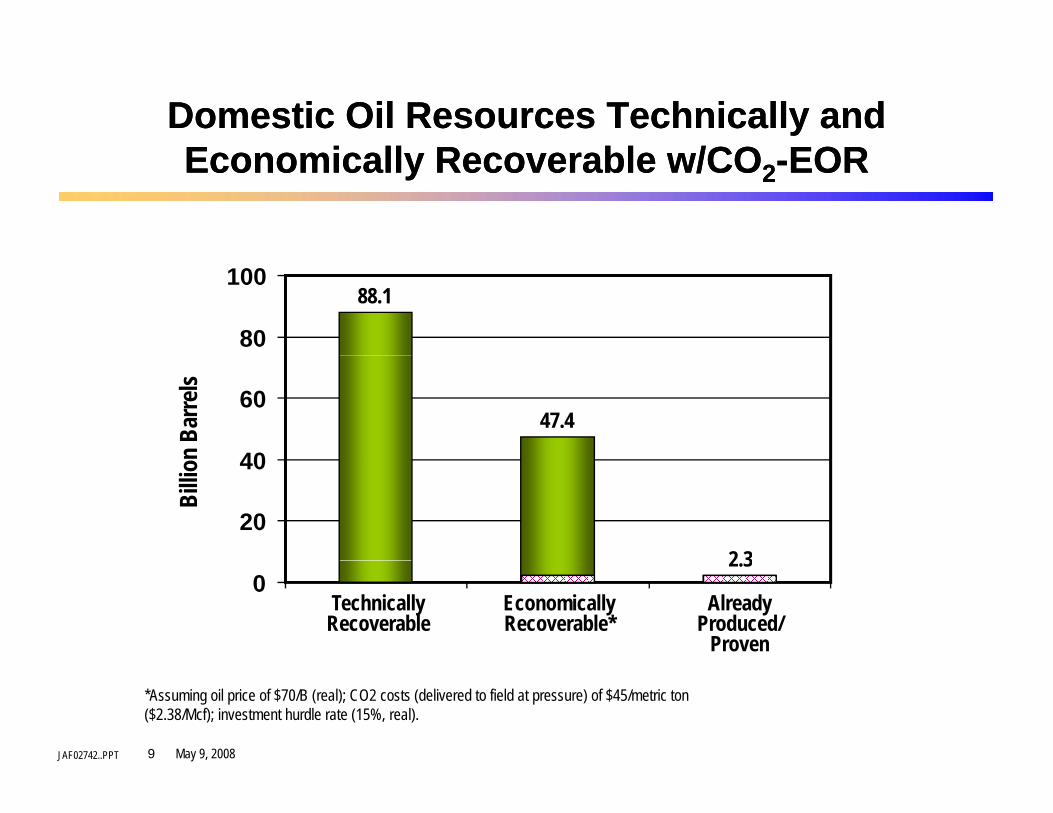
Domestic Oil Resources Technically and Domestic Oil Resources Technically and E i ll R bl /COE i ll R bl /CO EOREOREconomically Recoverable w/COEconomically Recoverable w/CO22--EOREOR
88.1
80
100
n Ba
rrels
47.4
40
60
Billio
n
2 320
40
2.30
TechnicallyRecoverable
EconomicallyRecoverable*
AlreadyProduced/
Proven
JAF02742..PPT May 9, 20089
*Assuming oil price of $70/B (real); CO2 costs (delivered to field at pressure) of $45/metric ton ($2.38/Mcf); investment hurdle rate (15%, real).
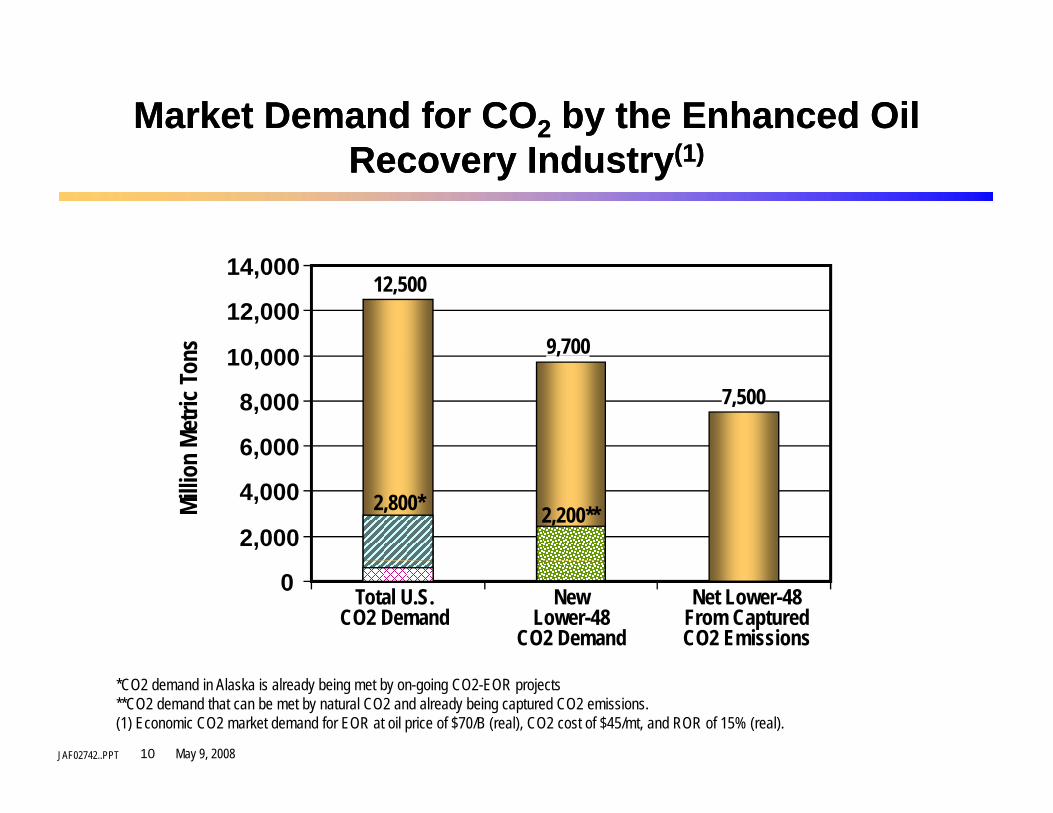
Market Demand for COMarket Demand for CO22 by the Enhanced Oil by the Enhanced Oil R I d tR I d t (1)(1)Recovery IndustryRecovery Industry(1)(1)
ns 10 000
12,000
14,00012,500
9,700
n Me
tric T
on
6,000
8,000
10,000 ,
7,500
Millio
n
2,000
4,000
,
2,800* 2,200**
Total U.S.CO2 Demand
NewLower-48
CO2 Demand
Net Lower-48From CapturedCO2 Emissions
0
JAF02742..PPT May 9, 200810
*CO2 demand in Alaska is already being met by on-going CO2-EOR projects**CO2 demand that can be met by natural CO2 and already being captured CO2 emissions.(1) Economic CO2 market demand for EOR at oil price of $70/B (real), CO2 cost of $45/mt, and ROR of 15% (real).
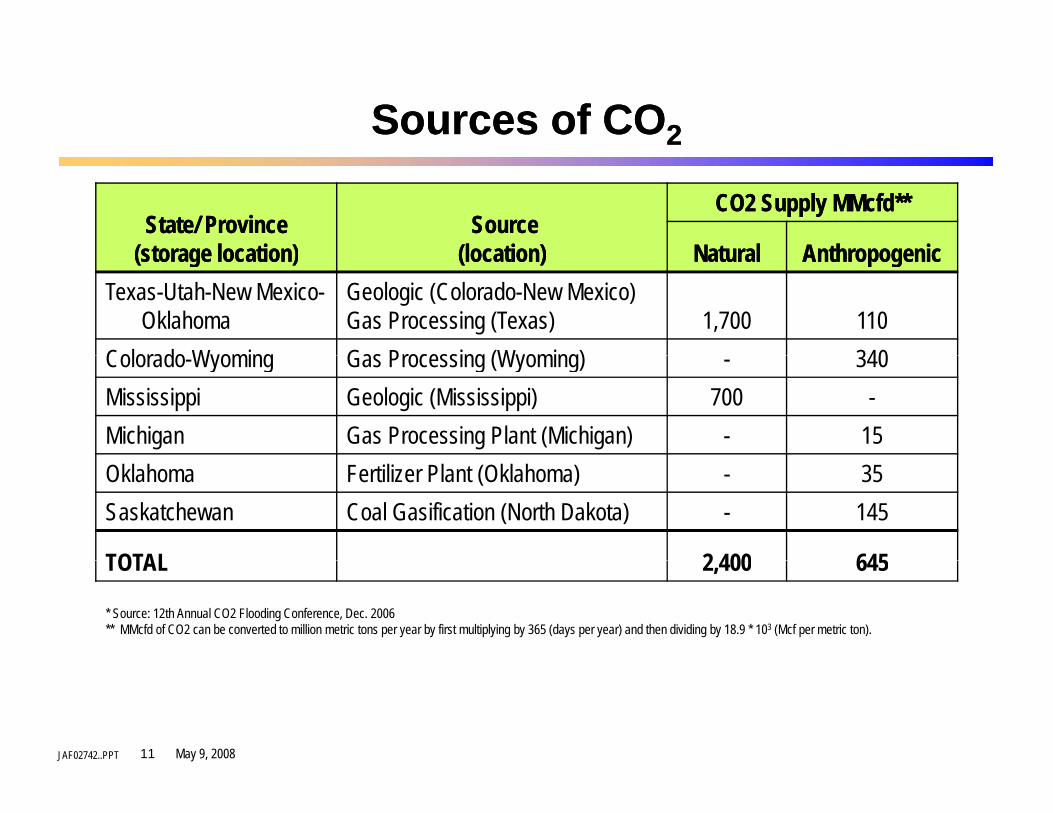
Sources of COSources of CO22
State/ Province State/ Province (storage location)(storage location)
OklahomaGeologic (Colorado-New Mexico) Gas Processing (Texas) 1,700 110
Colorado Wyoming Gas Processing (Wyoming) 340Colorado-Wyoming Gas Processing (Wyoming) - 340Mississippi Geologic (Mississippi) 700 -Michigan Gas Processing Plant (Michigan) - 15Oklahoma Fertilizer Plant (Oklahoma) - 35Saskatchewan Coal Gasification (North Dakota) - 145
TOTAL 2 400 645TOTAL 2,400 645
* Source: 12th Annual CO2 Flooding Conference, Dec. 2006** MMcfd of CO2 can be converted to million metric tons per year by first multiplying by 365 (days per year) and then dividing by 18.9 * 103 (Mcf per metric ton).
JAF02742..PPT May 9, 200811
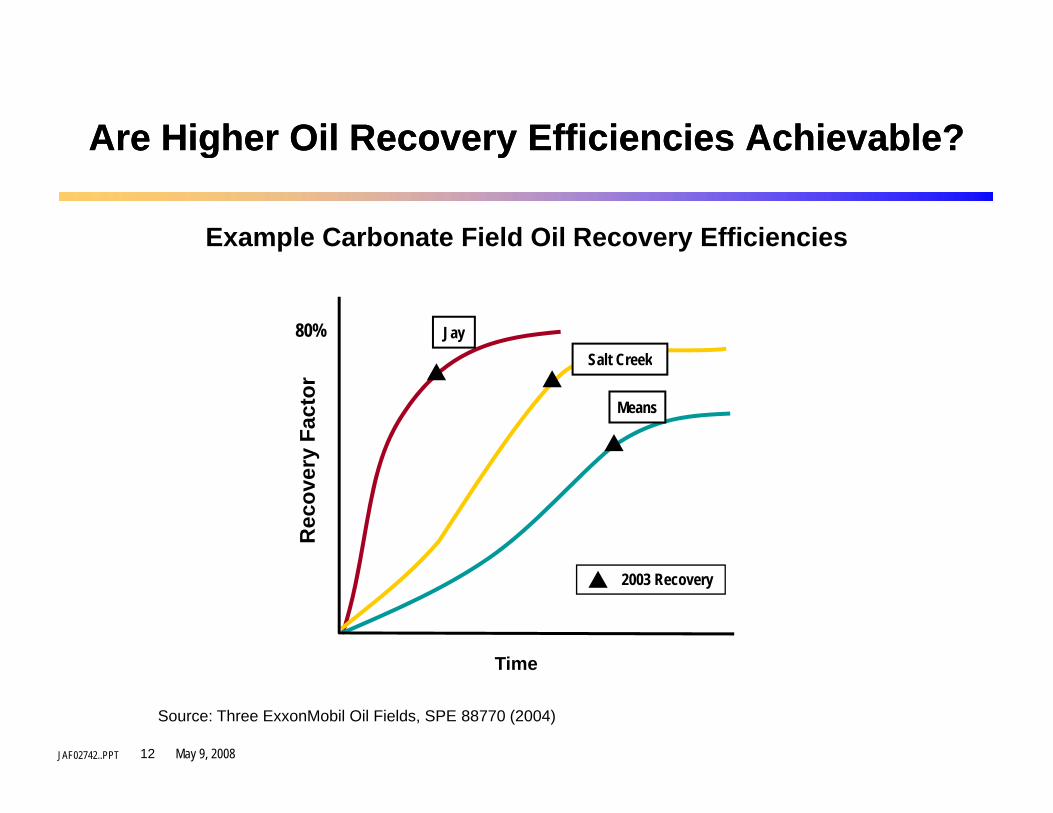
Are Higher Oil Recovery Efficiencies Achievable?Are Higher Oil Recovery Efficiencies Achievable?e g e O eco e y c e c es c e ab ee g e O eco e y c e c es c e ab e
Example Carbonate Field Oil Recovery Efficiencies
80%S lt C k
Jayy
Fact
or
Salt Creek
Means
Rec
over
y
Time
2003 Recovery
JAF02742..PPT May 9, 200812
Source: Three ExxonMobil Oil Fields, SPE 88770 (2004)
Time
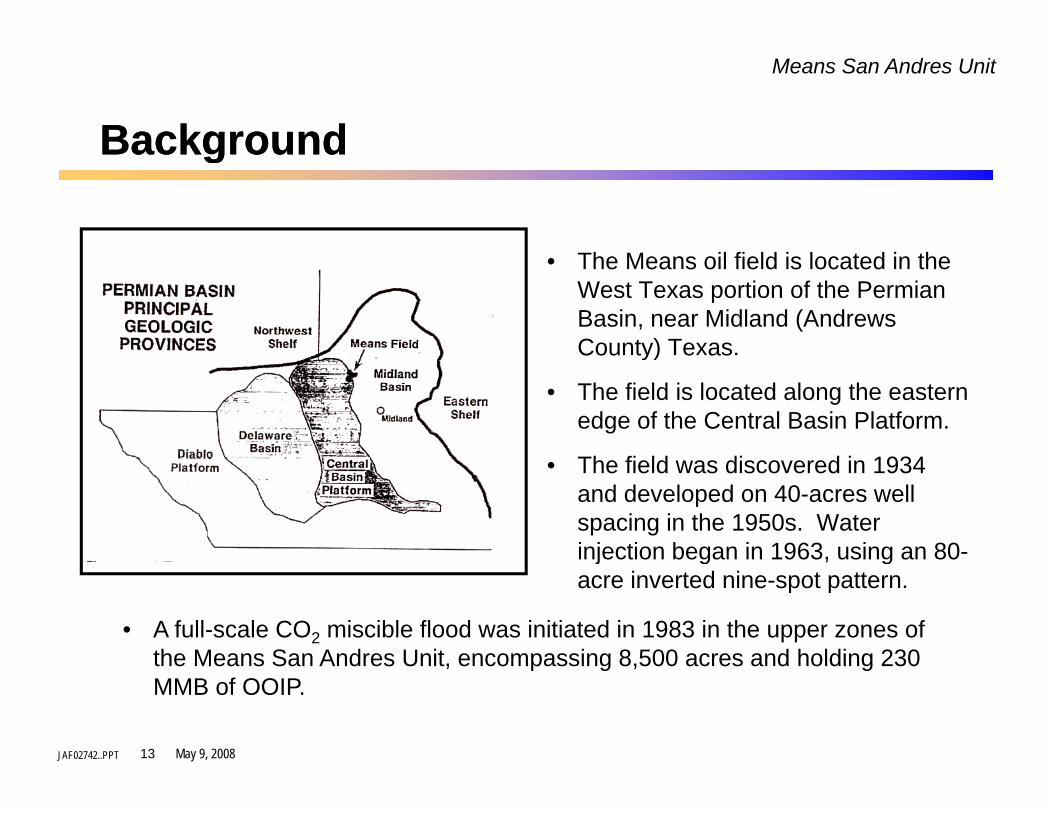
BackgroundBackground
Means San Andres Unit
BackgroundBackground
Th M il fi ld i l t d i th• The Means oil field is located in the West Texas portion of the Permian Basin, near Midland (Andrews County) Texas.Cou ty) e as
• The field is located along the eastern edge of the Central Basin Platform.
Th fi ld di d i 1934• The field was discovered in 1934 and developed on 40-acres well spacing in the 1950s. Water injection began in 1963, using an 80-j g , gacre inverted nine-spot pattern.
• A full-scale CO2 miscible flood was initiated in 1983 in the upper zones of the Means San Andres Unit encompassing 8 500 acres and holding 230
JAF02742..PPT May 9, 200813
the Means San Andres Unit, encompassing 8,500 acres and holding 230 MMB of OOIP.
Reservoir PropertiesReservoir Properties
Means San Andres Unit
Reservoir PropertiesReservoir Properties
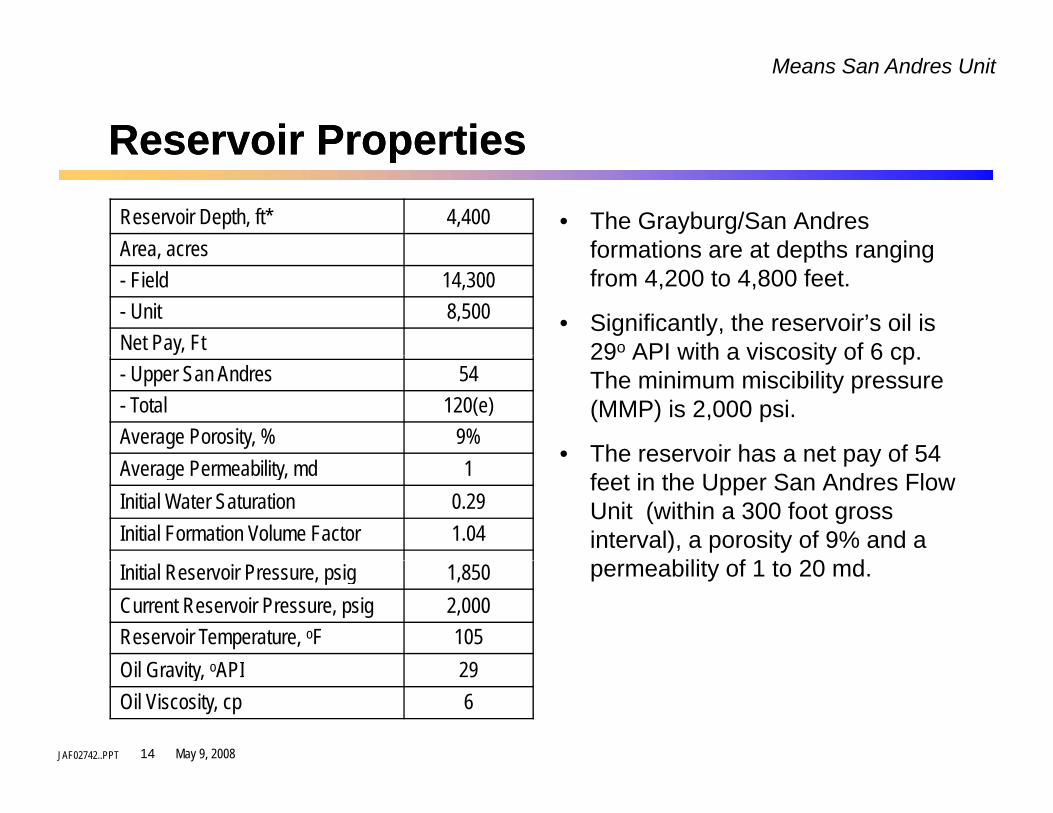
• The Grayburg/San Andres formations are at depths ranging
Reservoir Depth, ft* 4,400Area acres formations are at depths ranging
from 4,200 to 4,800 feet.
• Significantly, the reservoir’s oil is 29o API with a viscosity of 6 cp
Area, acres- Field 14,300- Unit 8,500Net Pay, Ft 29 API with a viscosity of 6 cp.
The minimum miscibility pressure (MMP) is 2,000 psi.
• The reservoir has a net pay of 54
- Upper San Andres 54- Total 120(e)Average Porosity, % 9%
The reservoir has a net pay of 54 feet in the Upper San Andres Flow Unit (within a 300 foot gross interval), a porosity of 9% and a
bilit f 1 t 20 d
Average Permeability, md 1Initial Water Saturation 0.29Initial Formation Volume Factor 1.04
permeability of 1 to 20 md.Initial Reservoir Pressure, psig 1,850Current Reservoir Pressure, psig 2,000Reservoir Temperature, oF 105Oil G it API 29
JAF02742..PPT May 9, 200814
Oil Gravity, oAPI 29Oil Viscosity, cp 6
COCO22--EOR DevelopmentEOR DevelopmentMeans San Andres Unit
22 pp
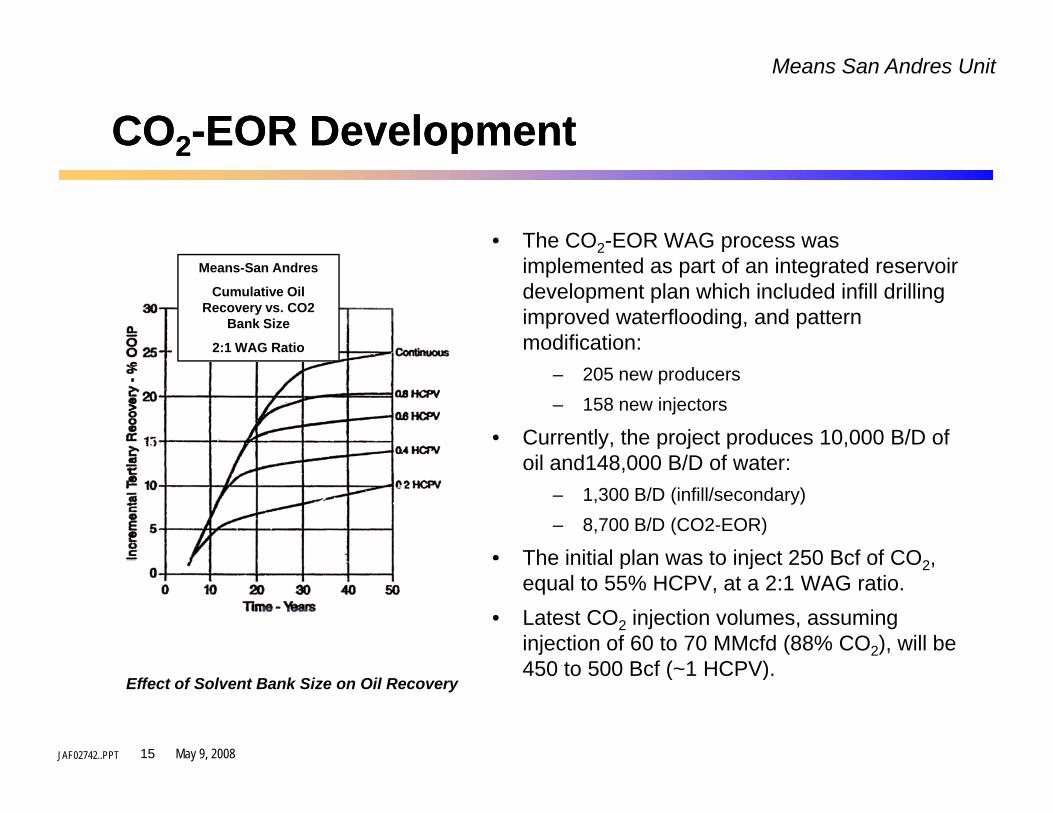
• The CO2-EOR WAG process was implemented as part of an integrated reservoir development plan which included infill drilling improved waterflooding, and pattern modification:
Means-San Andres
Cumulative Oil Recovery vs. CO2
Bank Size
2:1 WAG Ratio
– 205 new producers– 158 new injectors
• Currently, the project produces 10,000 B/D of il d148 000 B/D f toil and148,000 B/D of water:
• The initial plan was to inject 250 Bcf of CO2The initial plan was to inject 250 Bcf of CO2, equal to 55% HCPV, at a 2:1 WAG ratio.
• Latest CO2 injection volumes, assuming injection of 60 to 70 MMcfd (88% CO2), will be 450 t 500 B f ( 1 HCPV)
JAF02742..PPT May 9, 200815
450 to 500 Bcf (~1 HCPV).Effect of Solvent Bank Size on Oil Recovery
SummarySummary
Means San Andres Unit
SummarySummary
• The Means case study is an example of effectively l i CO EOR t hi h i it l API it ilapplying CO2-EOR to a high viscosity, low API gravity oil
reservoir with an underlying weak aquifer.
• An integrated infill drilling and CO2 WAG flood has raisedAn integrated infill drilling and CO2 WAG flood has raised oil recovery efficiency from about 25% to an expected 50%.
• Of the 25% of OOIP increase in recovery efficiency, 15% OOIP is due to CO2-EOR and 10% OOIP is due to infill development associated with CO2-EOR.
JAF02742..PPT May 9, 200816
BackgroundBackground
Salt Creek
gg
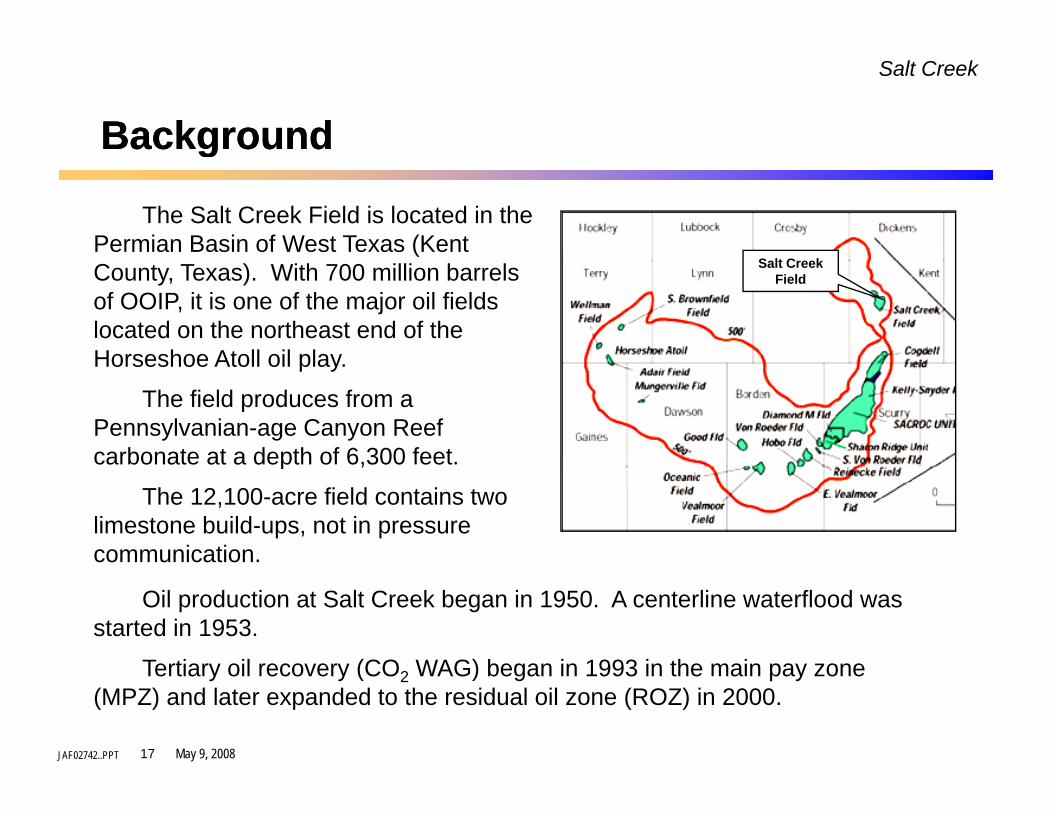
The Salt Creek Field is located in the Permian Basin of West Texas (Kent (County, Texas). With 700 million barrels of OOIP, it is one of the major oil fields located on the northeast end of the Horseshoe Atoll oil play
Salt Creek Field
Horseshoe Atoll oil play.
The field produces from a Pennsylvanian-age Canyon Reef carbonate at a depth of 6 300 feetcarbonate at a depth of 6,300 feet.
The 12,100-acre field contains two limestone build-ups, not in pressure communication.communication.
Oil production at Salt Creek began in 1950. A centerline waterflood was started in 1953.
T ti il (CO WAG) b i 1993 i th i
JAF02742..PPT May 9, 200817
Tertiary oil recovery (CO2 WAG) began in 1993 in the main pay zone (MPZ) and later expanded to the residual oil zone (ROZ) in 2000.
Reservoir PropertiesReservoir Properties
Salt Creek
Reservoir PropertiesReservoir Properties
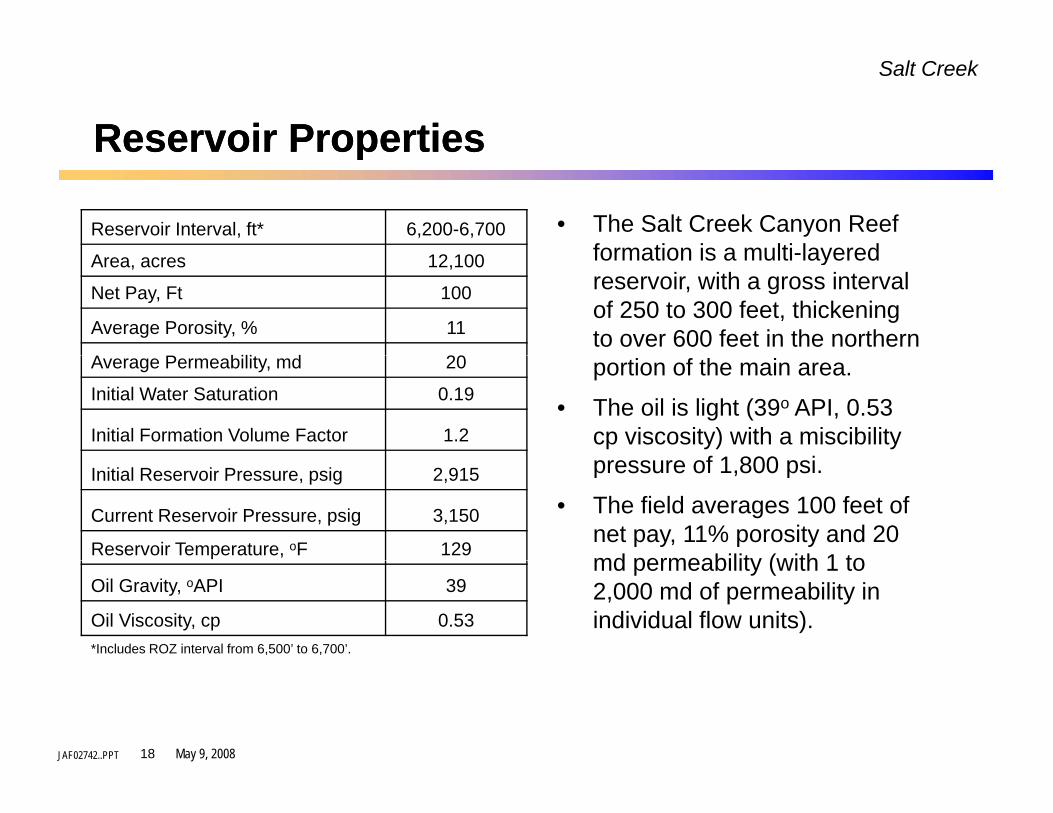
• The Salt Creek Canyon Reef formation is a multi layered
Reservoir Interval, ft* 6,200-6,700formation is a multi-layered reservoir, with a gross interval of 250 to 300 feet, thickening to over 600 feet in the northern
Area, acres 12,100
Net Pay, Ft 100
Average Porosity, % 11
A P bilit d 20 portion of the main area.
• The oil is light (39o API, 0.53 cp viscosity) with a miscibility
f 1 800 i
Average Permeability, md 20
Initial Water Saturation 0.19
Initial Formation Volume Factor 1.2
pressure of 1,800 psi.
• The field averages 100 feet of net pay, 11% porosity and 20 md permeability (with 1 to
Initial Reservoir Pressure, psig 2,915
Current Reservoir Pressure, psig 3,150
Reservoir Temperature, oF 129 md permeability (with 1 to 2,000 md of permeability in individual flow units).
Oil Gravity, oAPI 39
Oil Viscosity, cp 0.53*Includes ROZ interval from 6,500’ to 6,700’.
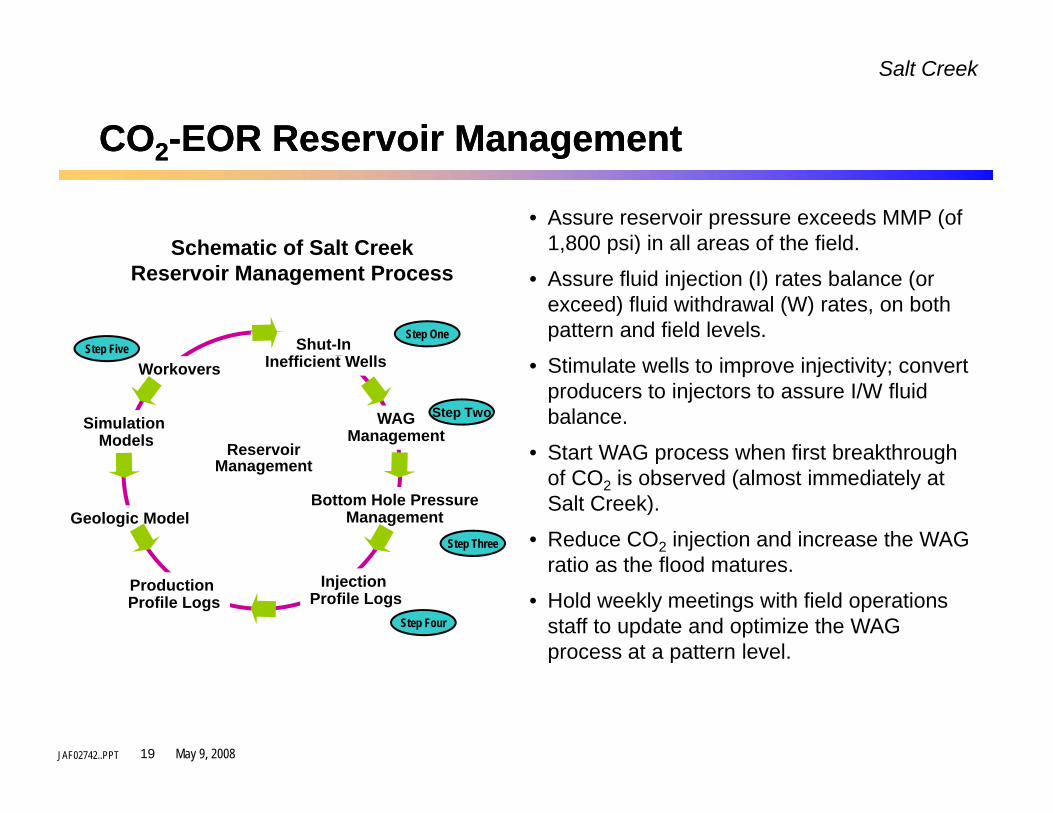
• Assure reservoir pressure exceeds MMP (of 1,800 psi) in all areas of the field.Schematic of Salt Creek , p )
• Assure fluid injection (I) rates balance (or exceed) fluid withdrawal (W) rates, on both pattern and field levels.
Shut-InI ffi i W ll
Step OneStep Five
Schematic of Salt Creek Reservoir Management Process
• Stimulate wells to improve injectivity; convert producers to injectors to assure I/W fluid balance.
• Start WAG process when first breakthrough
Inefficient Wells
WAGManagement
Workovers
Simulation Models Reservoir
Step Two
Start WAG process when first breakthrough of CO2 is observed (almost immediately at Salt Creek).
• Reduce CO2 injection and increase the WAG ti th fl d t
Bottom Hole PressureManagementGeologic Model
Management
Step Three
ratio as the flood matures.
• Hold weekly meetings with field operations staff to update and optimize the WAG process at a pattern level.
Injection Profile Logs
ProductionProfile Logs
Step Four
JAF02742..PPT May 9, 200819
Production History and ExpectationsProduction History and Expectations
Salt Creek
Production History and ExpectationsProduction History and Expectations
Salt Creek Field Oil Recovery F t b P
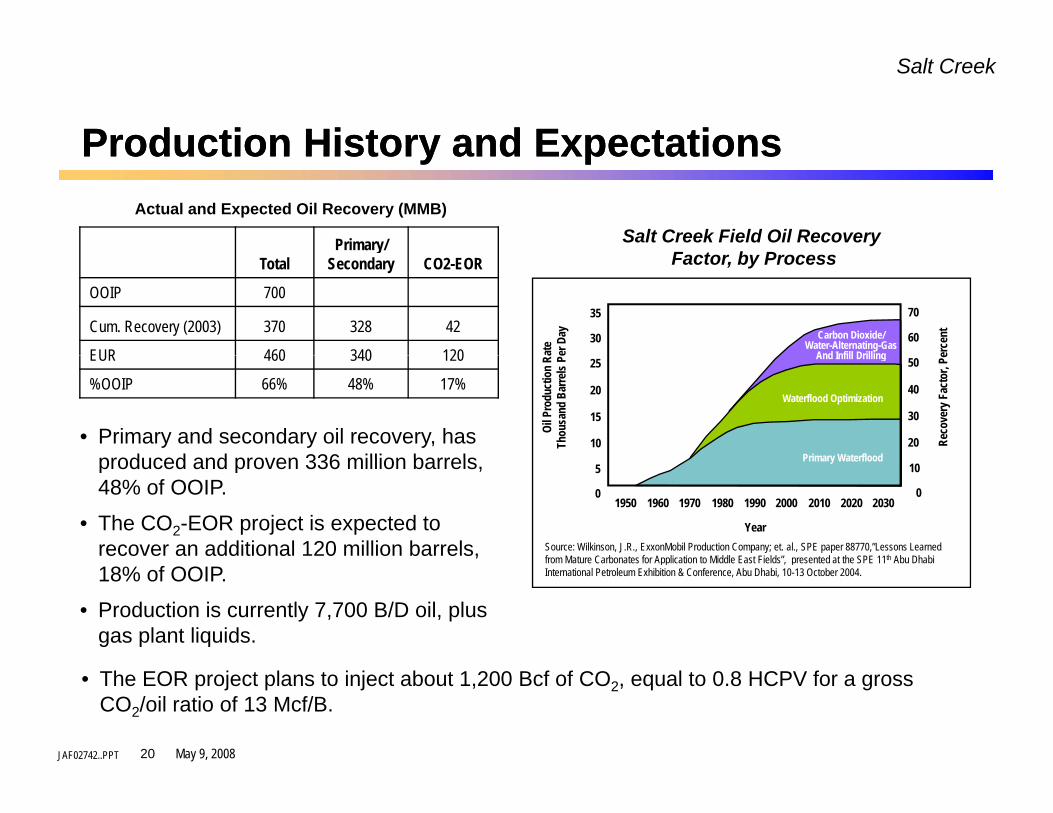
Actual and Expected Oil Recovery (MMB)
Primary/Factor, by Process
35
30
70
60
ate
er D
ay
erce
ntCarbon Dioxide/Water-Alternating-Gas
And Infill Drilling
Totaly
Secondary CO2-EOR
OOIP 700
Cum. Recovery (2003) 370 328 42
EUR 460 340 120
• Primary and secondary oil recovery, has produced and proven 336 million barrels
20
25
15
10
40
50
30
20
Oil P
rodu
ctio
n Ra
Thou
sand
Bar
rels
Pe
Reco
very
Fac
tor,
Pe
Primary Waterflood
Waterflood Optimization
And Infill DrillingEUR 460 340 120
%OOIP 66% 48% 17%
produced and proven 336 million barrels, 48% of OOIP.
• The CO2-EOR project is expected to recover an additional 120 million barrels,
5
0
10
01950 1960 1970 1980 1990 2000 2010 2020 2030
Year
Primary Waterflood
Source: Wilkinson, J.R., ExxonMobil Production Company; et. al., SPE paper 88770,”Lessons Learned from Mature Carbonates for Application to Middle East Fields” presented at the SPE 11th Abu Dhabi
18% of OOIP.
• Production is currently 7,700 B/D oil, plus gas plant liquids.
from Mature Carbonates for Application to Middle East Fields , presented at the SPE 11 Abu Dhabi International Petroleum Exhibition & Conference, Abu Dhabi, 10-13 October 2004.
JAF02742..PPT May 9, 200820
• The EOR project plans to inject about 1,200 Bcf of CO2, equal to 0.8 HCPV for a gross CO2/oil ratio of 13 Mcf/B.
SummarySummary
Salt Creek
SummarySummary
• The Salt Creek case study demonstrates that high oil• The Salt Creek case study demonstrates that high oil recovery efficiencies, in excess of 60% of OOIP, are achievable from a multi-layer, highly heterogeneous carbonate reservoir using optimized water flooding, ca bo ate ese o us g opt ed ate ood g,infill drilling and CO2-EOR.
• The CO2-EOR project is expected to recover 17% of OOIP (in addition to a high 48% of OOIP with P/SOOIP (in addition to a high, 48% of OOIP with P/S recovery) at a gross CO2 to oil ratio of 13 Mcf/B and a net ratio estimated at about 5 Mcf/B.
• A formal CO flood tracking system (Zonal Allocation• A formal CO2 flood tracking system (Zonal Allocation Program) and weekly team meetings are used to alter CO2 injection volumes, improve vertical conformance and optimize oil production
JAF02742..PPT May 9, 200821
and optimize oil production.
Postle COPostle CO22--EOR ProjectEOR Project22 jj
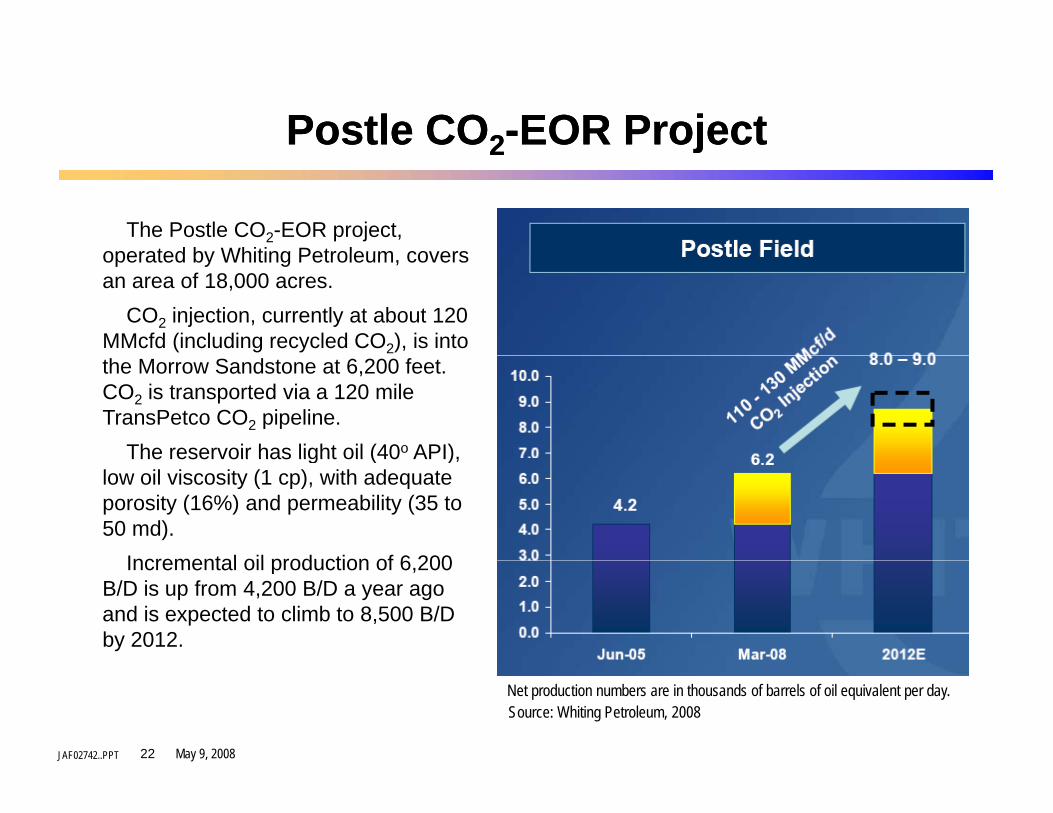
The Postle CO2-EOR project, operated by Whiting Petroleum coversoperated by Whiting Petroleum, covers an area of 18,000 acres.
CO2 injection, currently at about 120 MMcfd (including recycled CO2), is into the Morrow Sandstone at 6,200 feet. CO2 is transported via a 120 mile TransPetco CO2 pipeline.
The reservoir has light oil (40o API),The reservoir has light oil (40 API), low oil viscosity (1 cp), with adequate porosity (16%) and permeability (35 to 50 md).
Incremental oil production of 6 200Incremental oil production of 6,200 B/D is up from 4,200 B/D a year ago and is expected to climb to 8,500 B/D by 2012.
JAF02742..PPT May 9, 200822
Source: Whiting Petroleum, 2008Net production numbers are in thousands of barrels of oil equivalent per day.
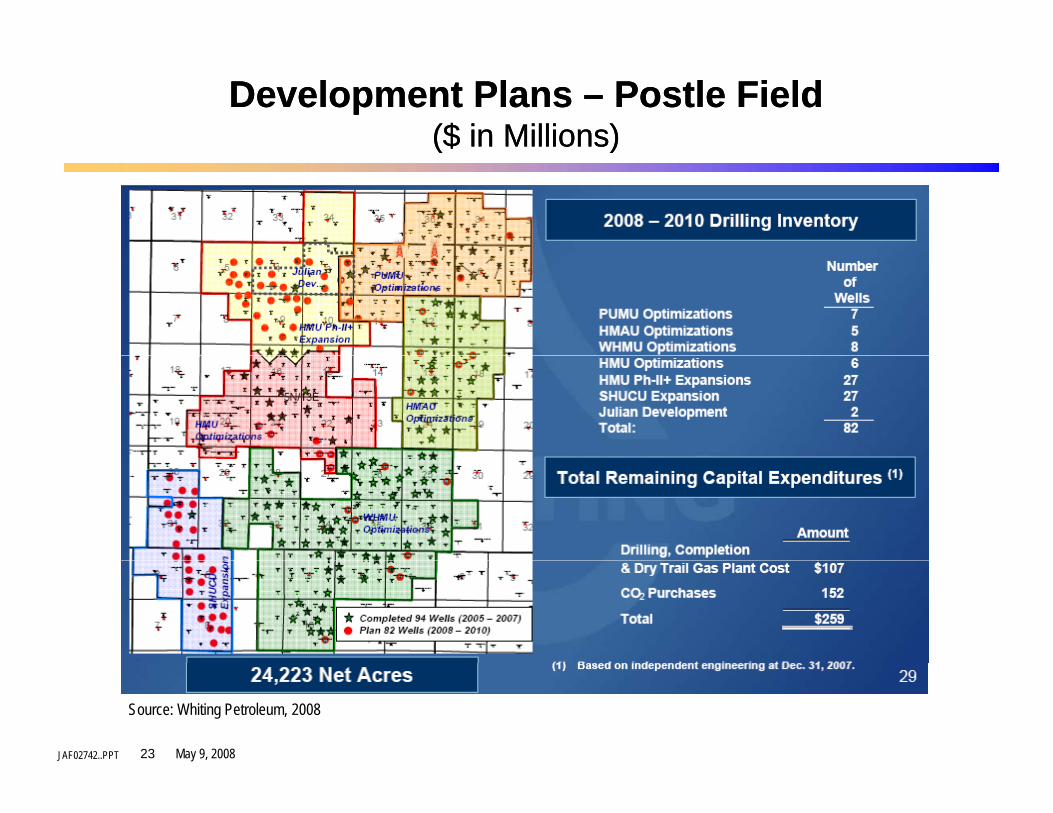
Development Plans Development Plans –– Postle FieldPostle Field($ in Millions)($ in Millions)( )( )
Reservoir modeling and selected field tests showReservoir modeling and selected field tests show that high oil recovery efficiencies are possible with innovative applications of CO2-EOR.
So far, except for a handful of cases, the actual performance of CO2-EOR has been less than optimum due to:due to:
• Geologically complex reservoirs• Limited process control • Insufficient CO2 injection
JAF02742..PPT May 9, 200824
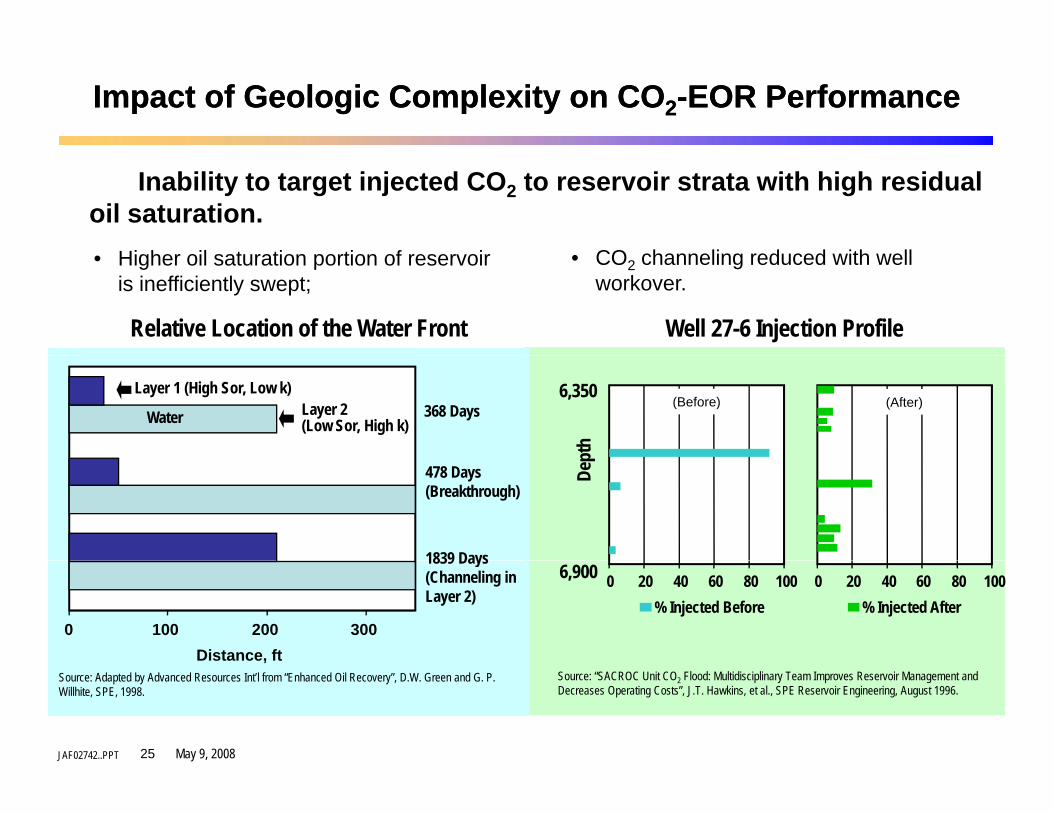
Impact of Geologic Complexity on COImpact of Geologic Complexity on CO22--EOR PerformanceEOR Performance
Inability to target injected CO2 to reservoir strata with high residual oil saturation.
Hi h il t ti ti f i CO h li d d ith ll
Well 27-6 Injection ProfileRelative Location of the Water Front
• Higher oil saturation portion of reservoir is inefficiently swept;
• CO2 channeling reduced with well workover.
pth
6,350(Before) (After)368 Days
Layer 1 (High Sor, Low k)Layer 2 (Low Sor, High k)Water
Dep
1839 Days
478 Days(Breakthrough)
0 20 40 60 80 1006,900
% Injected Before0 20 40 60 80 100
% Injected After
1839 Days(Channeling in Layer 2)
0 100 200 300Distance, ft
JAF02742..PPT May 9, 200825
Source: “SACROC Unit CO2 Flood: Multidisciplinary Team Improves Reservoir Management and Decreases Operating Costs”, J.T. Hawkins, et al., SPE Reservoir Engineering, August 1996.
Source: Adapted by Advanced Resources Int’l from “Enhanced Oil Recovery”, D.W. Green and G. P. Willhite, SPE, 1998.
,
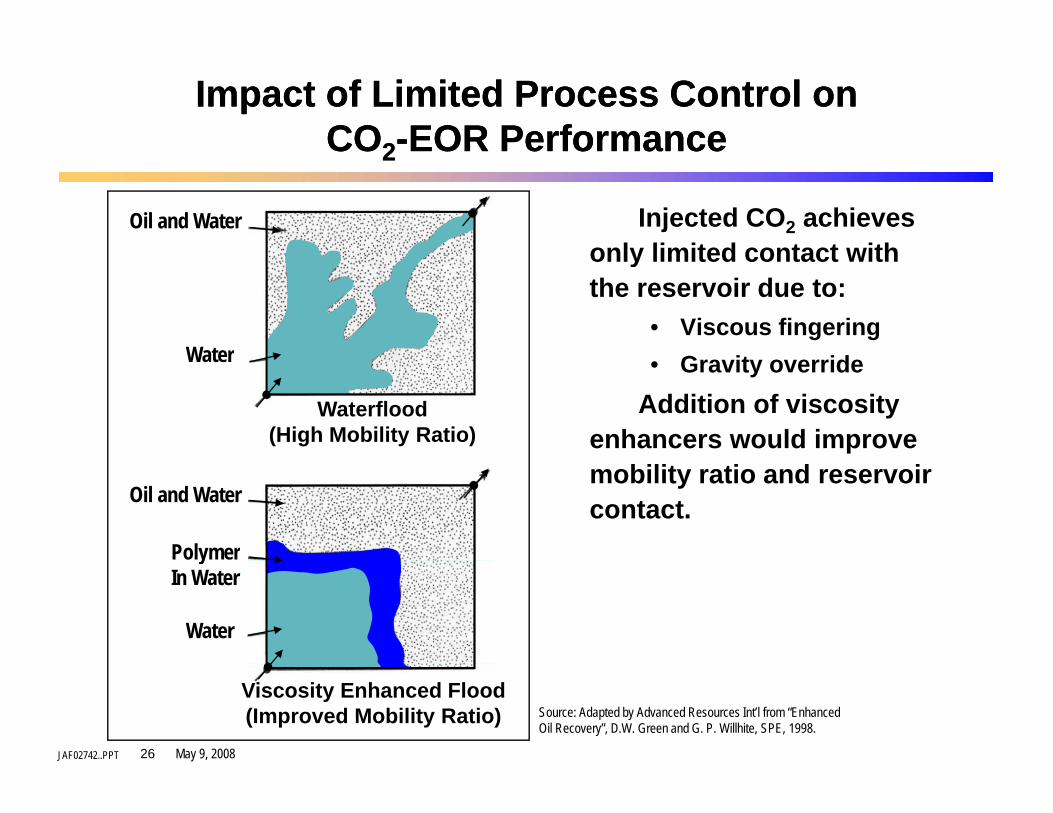
Impact of Limited Process Control on Impact of Limited Process Control on COCO22--EOR PerformanceEOR PerformanceCOCO22 EOR PerformanceEOR Performance
Injected CO2 achieves only limited contact with
Oil and Wateronly limited contact with the reservoir due to:
• Viscous fingering G i idWater • Gravity override
Addition of viscosity enhancers would improve
Water
Waterflood(High Mobility Ratio)
mobility ratio and reservoir contact. Oil and Water
Polymer
Water
yIn Water
JAF02742..PPT May 9, 200826
Source: Adapted by Advanced Resources Int’l from “Enhanced Oil Recovery”, D.W. Green and G. P. Willhite, SPE, 1998.
Viscosity Enhanced Flood(Improved Mobility Ratio)
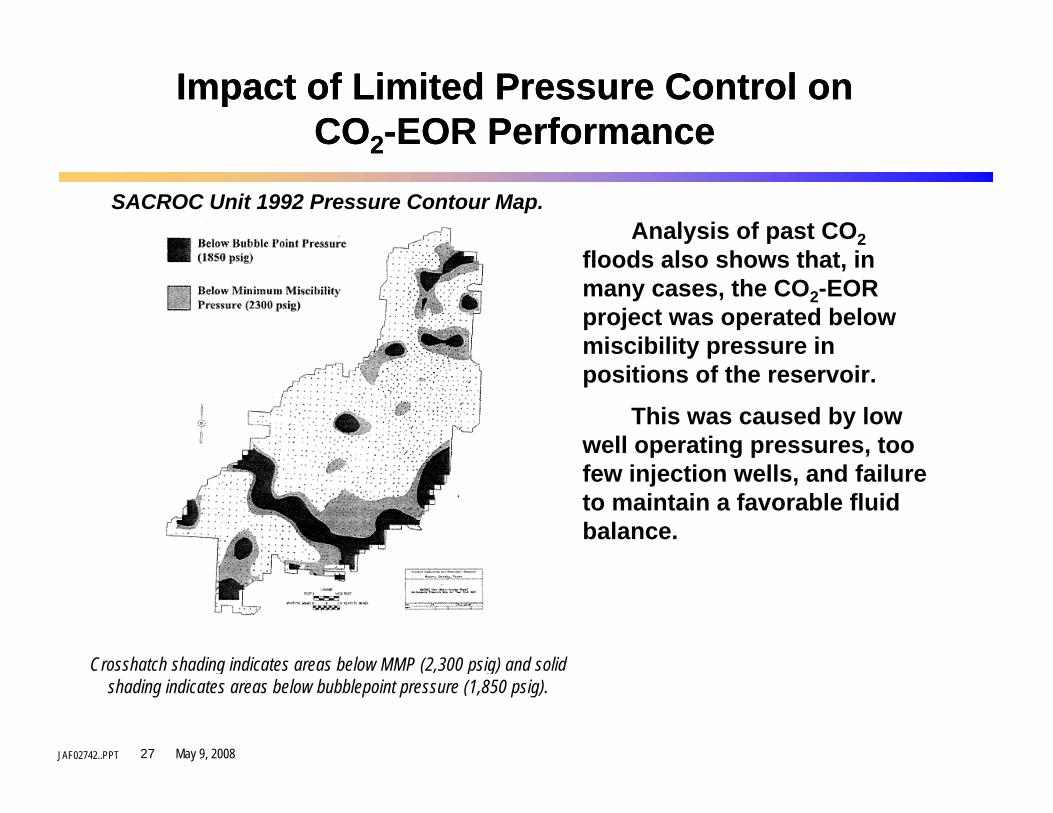
Impact of Limited Pressure Control on Impact of Limited Pressure Control on COCO22--EOR PerformanceEOR Performance22
Analysis of past CO2fl d l h th t i
SACROC Unit 1992 Pressure Contour Map.
floods also shows that, in many cases, the CO2-EOR project was operated below miscibility pressure in y ppositions of the reservoir.
This was caused by low well operating pressures, too few injection wells, and failure to maintain a favorable fluid balance.
Crosshatch shading indicates areas below MMP (2 300 psig) and solid
JAF02742..PPT May 9, 200827
Crosshatch shading indicates areas below MMP (2,300 psig) and solid shading indicates areas below bubblepoint pressure (1,850 psig).
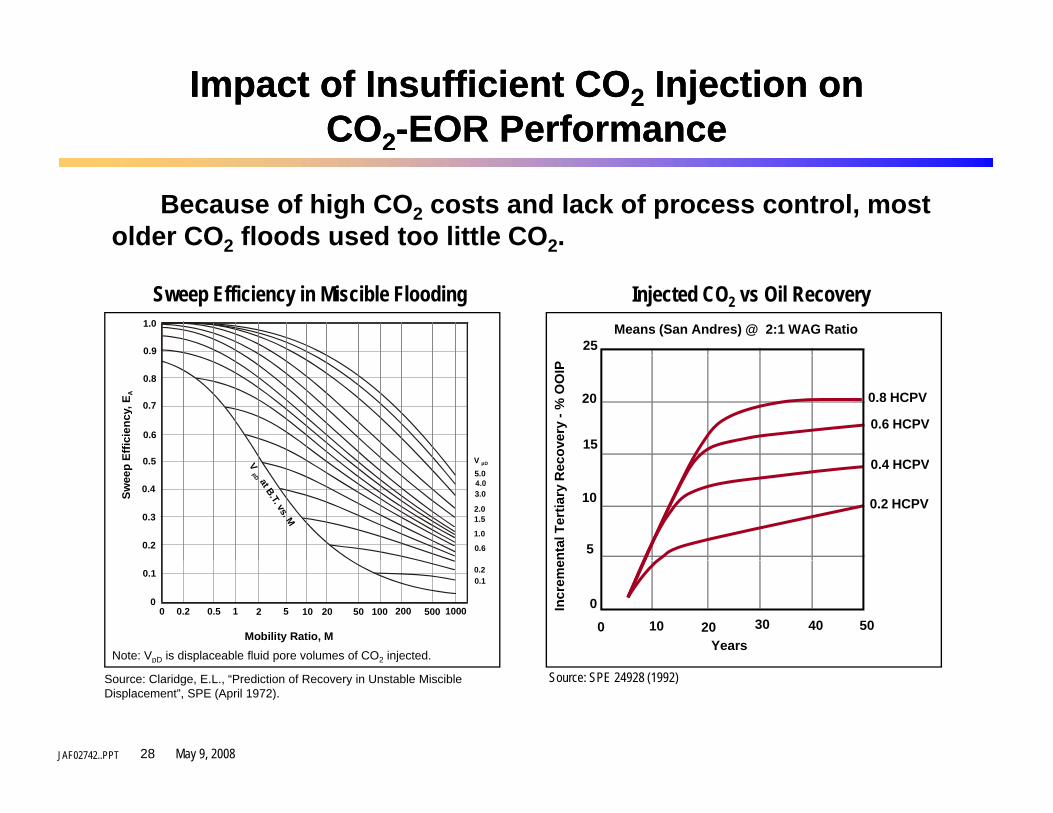
Impact of Insufficient COImpact of Insufficient CO22 Injection on Injection on COCO22--EOR PerformanceEOR Performance
Because of high CO2 costs and lack of process control, most older CO2 floods used too little CO2.
Means (San Andres) @ 2:1 WAG Ratio1.0
0.9
Injected CO2 vs Oil RecoverySweep Efficiency in Miscible Flooding
25
0.8
0.7
0.6
0 5 VEffic
ienc
y, E
A 20
15
cove
ry -
% O
OIP
0.8 HCPV
0.6 HCPV
0.5
0.4
0.3
0.2
5.0
2.0
3.0
1.0
V pD
1.5
0.6
Swee
p E V
at B.T. vs. M
pD
10
5ntal
Ter
tiary
Rec 0.4 HCPV
0.2 HCPV
Note: VpD is displaceable fluid pore volumes of CO2 injected.
0.1
00.20 0.5 1 2 105 5020 200100 1000500
0.10.2
Mobility Ratio, M
0403020 50100
Years
Incr
eme
JAF02742..PPT May 9, 200828
Source: Claridge, E.L., “Prediction of Recovery in Unstable Miscible Displacement”, SPE (April 1972).
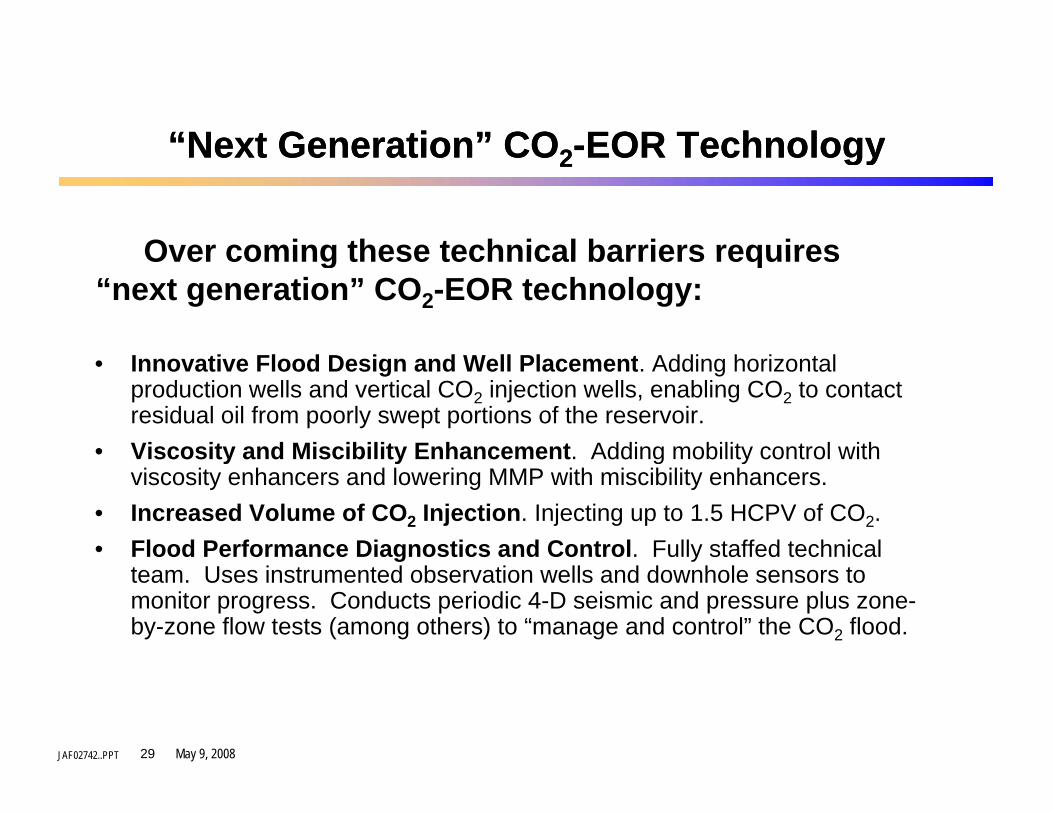
Over coming these technical barriers requires “next generation” CO2-EOR technology:
• Innovative Flood Design and Well Placement. Adding horizontal production wells and vertical CO2 injection wells, enabling CO2 to contact residual oil from poorly swept portions of the reservoir.
• Viscosity and Miscibility Enhancement. Adding mobility control withViscosity and Miscibility Enhancement. Adding mobility control with viscosity enhancers and lowering MMP with miscibility enhancers.
• Increased Volume of CO2 Injection. Injecting up to 1.5 HCPV of CO2.• Flood Performance Diagnostics and Control. Fully staffed technical g y
team. Uses instrumented observation wells and downhole sensors to monitor progress. Conducts periodic 4-D seismic and pressure plus zone-by-zone flow tests (among others) to “manage and control” the CO2 flood.
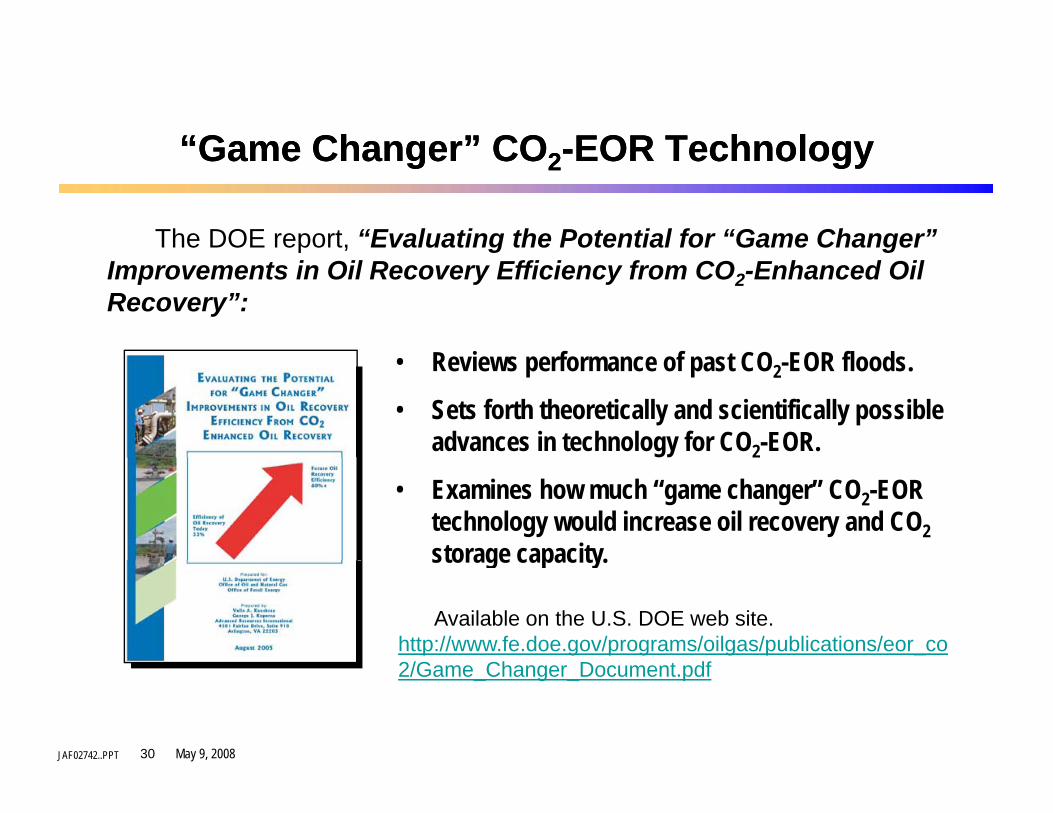
The DOE report, “Evaluating the Potential for “Game Changer”
R i f f t CO EOR fl d
g gImprovements in Oil Recovery Efficiency from CO2-Enhanced Oil Recovery”:
• Reviews performance of past CO2-EOR floods.
• Sets forth theoretically and scientifically possible advances in technology for CO2-EOR.
• Examines how much “game changer” CO2-EOR technology would increase oil recovery and CO2storage capacity. storage capacity.
Available on the U.S. DOE web site. http://www.fe.doe.gov/programs/oilgas/publications/eor_co2/G Ch D t df
JAF02742..PPT May 9, 200830
2/Game_Changer_Document.pdf
Domestic Oil Resources Technically Recoverable Domestic Oil Resources Technically Recoverable /”N t G ti ” CO/”N t G ti ” CO EOREORw/”Next Generation” COw/”Next Generation” CO22--EOREOR
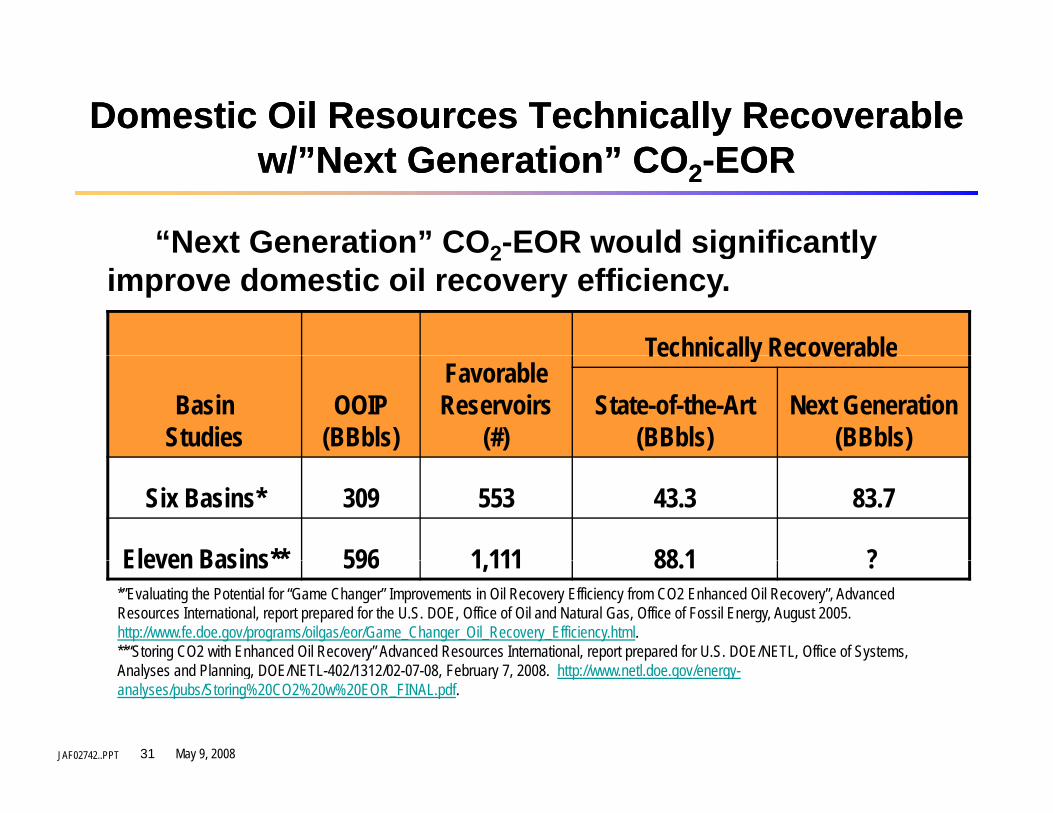
“Next Generation” CO2-EOR would significantly e t Ge e at o CO2 O ou d s g ca t yimprove domestic oil recovery efficiency.
Technically Recoverable
BasinStudies
OOIP(BBbls)
FavorableReservoirs
(#)
Technically Recoverable
State-of-the-Art(BBbls)
Next Generation(BBbls)
Six Basins* 309 553 43.3 83.7
Eleven Basins** 596 1 111 88 1 ?Eleven Basins 596 1,111 88.1 ?*”Evaluating the Potential for “Game Changer” Improvements in Oil Recovery Efficiency from CO2 Enhanced Oil Recovery”, Advanced Resources International, report prepared for the U.S. DOE, Office of Oil and Natural Gas, Office of Fossil Energy, August 2005. http://www.fe.doe.gov/programs/oilgas/eor/Game_Changer_Oil_Recovery_Efficiency.html. **“Storing CO2 with Enhanced Oil Recovery” Advanced Resources International, report prepared for U.S. DOE/NETL, Office of Systems,
JAF02742..PPT May 9, 200831
Analyses and Planning, DOE/NETL-402/1312/02-07-08, February 7, 2008. http://www.netl.doe.gov/energy-analyses/pubs/Storing%20CO2%20w%20EOR_FINAL.pdf.
Integrating COIntegrating CO22--EOR and COEOR and CO22 StorageStorage
Expanding CO2 Storage Capacity: A Case Study. Large Gulf C t il i ith 340 illi b l (OOIP) i th iCoast oil reservoir with 340 million barrels (OOIP) in the main pay zone.
• Primary/Secondary Oil Recovery: 153 million barrels (45% of OOIP)
Another 100 million barrels (OIP) in the underlying 130 feet of
Theoretical CO2 storage capacity: 2,710 Bcf (143 million tonnes)
( ) y gresidual oil zone and an underlying saline reservoir 195 feet thick.
JAF02742..PPT May 9, 200832
Integrating CO2-EOR Storage
First, this Gulf Coast oil reservoir is produced using “state-of-the-art” CO2-EOR project design - - vertical wells, 1 HCPV of CO2(purchased and recycled CO2), and a 1:1 WAG.
Next this Gulf Coast oil reservoir is produced using “nextNext, this Gulf Coast oil reservoir is produced using next generation” CO2-storage and CO2-EOR project design.
• Gravity-stable vertical CO2 injection with horizontal wells• Gravity-stable, vertical CO2 injection with horizontal wells.
• Targeting the main pay zone, plus the transition/residual oil zone and the underlying saline aquifer.
• Injecting continuous CO2 (no water) and continuing to inject CO2 after completion of oil recovery.
JAF02742..PPT May 9, 200833
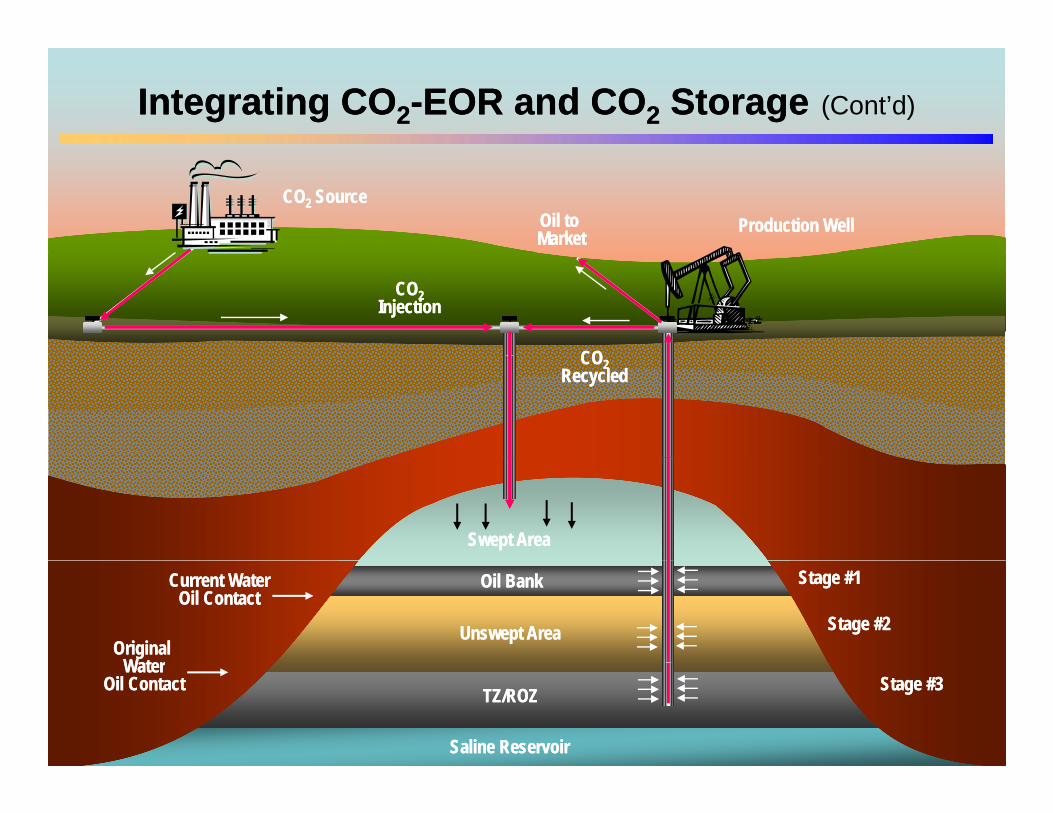
Integrating COIntegrating CO22--EOR and COEOR and CO22 StorageStorage (Cont’d)
CO2 SourceCO2 SourceOil to MarketOil to Market Production WellProduction Well
CO2Injection
CO2Injection
COCOCO2Recycled
CO2Recycled
Swept AreaSwept Area
Current Water Oil Contact
Current Water Oil Contact
Original Water
Original Water
Stage #1Stage #1
Stage #2Stage #2Unswept AreaUnswept Area
Oil BankOil Bank
JAF02742..PPT May 9, 200834
WaterOil Contact
WaterOil Contact Stage #3Stage #3TZ/ROZTZ/ROZ
Saline ReservoirSaline Reservoir
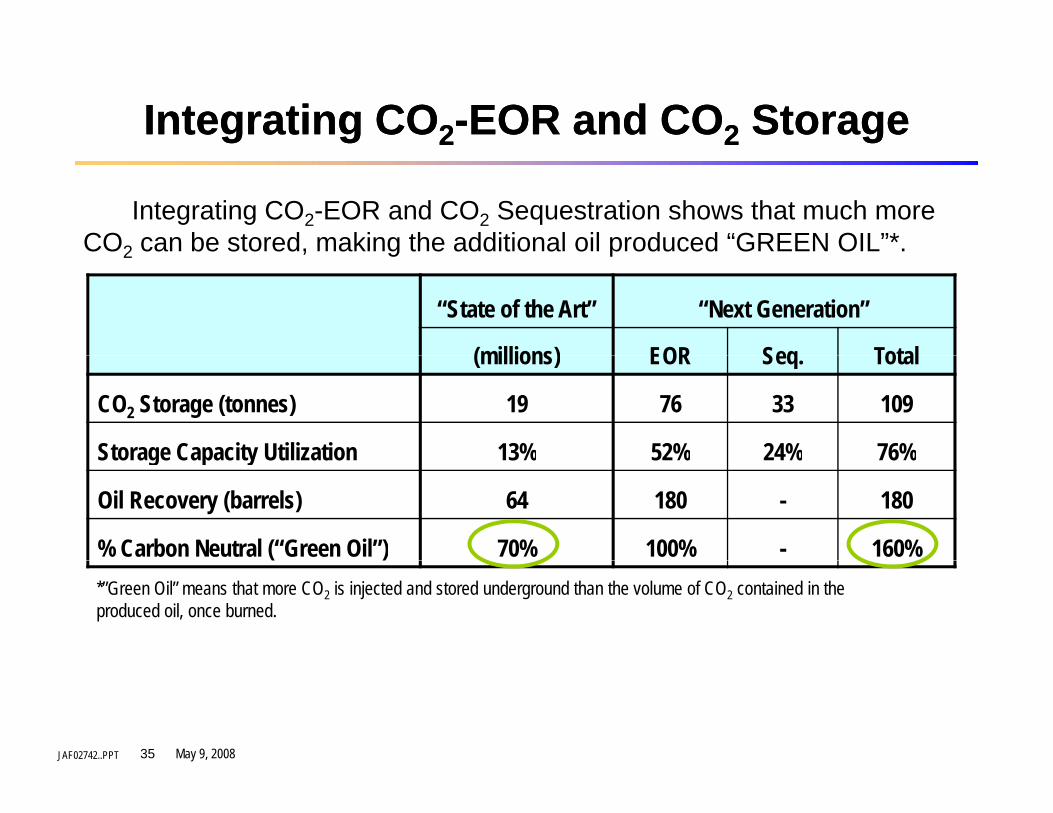
Integrating COIntegrating CO22--EOR and COEOR and CO22 StorageStorage
Integrating CO2-EOR and CO2 Sequestration shows that much more CO2 can be stored, making the additional oil produced “GREEN OIL”*.2 , g p
% Carbon Neutral (“Green Oil”) 70% 100% - 160%( )*”Green Oil” means that more CO2 is injected and stored underground than the volume of CO2 contained in the produced oil, once burned.
JAF02742..PPT May 9, 200835
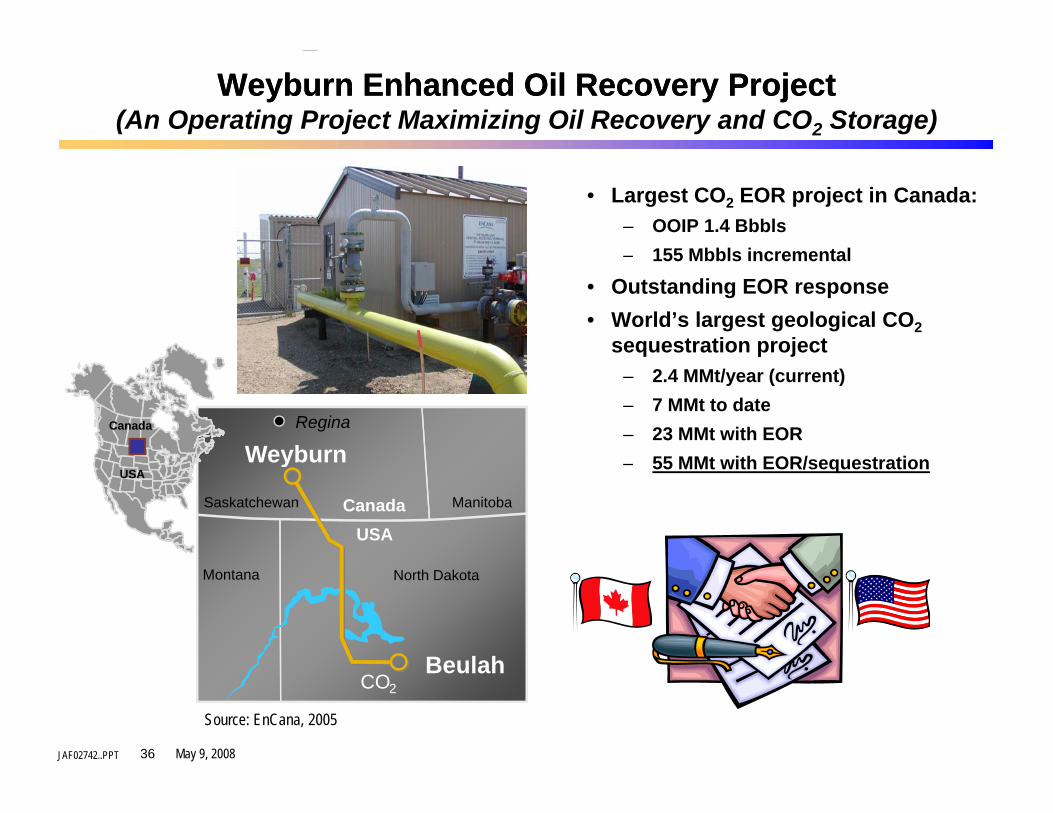
Weyburn Enhanced Oil Recovery ProjectWeyburn Enhanced Oil Recovery Project(An Operating Project Maximizing Oil Recovery and CO2 Storage)
• Largest CO2 EOR project in Canada:– OOIP 1.4 Bbbls
155 Mbbls incremental– 155 Mbbls incremental
• Outstanding EOR response • World’s largest geological CO2
sequestration projectq p j– 2.4 MMt/year (current)– 7 MMt to date– 23 MMt with EOR
55 MMt ith EOR/ t ti
Regina
WeyburnCanada
– 55 MMt with EOR/sequestrationWeyburn
Saskatchewan ManitobaCanadaUSA
USA
Beulah
North DakotaMontana
JAF02742..PPT May 9, 200836
CO2Beulah
Source: EnCana, 2005
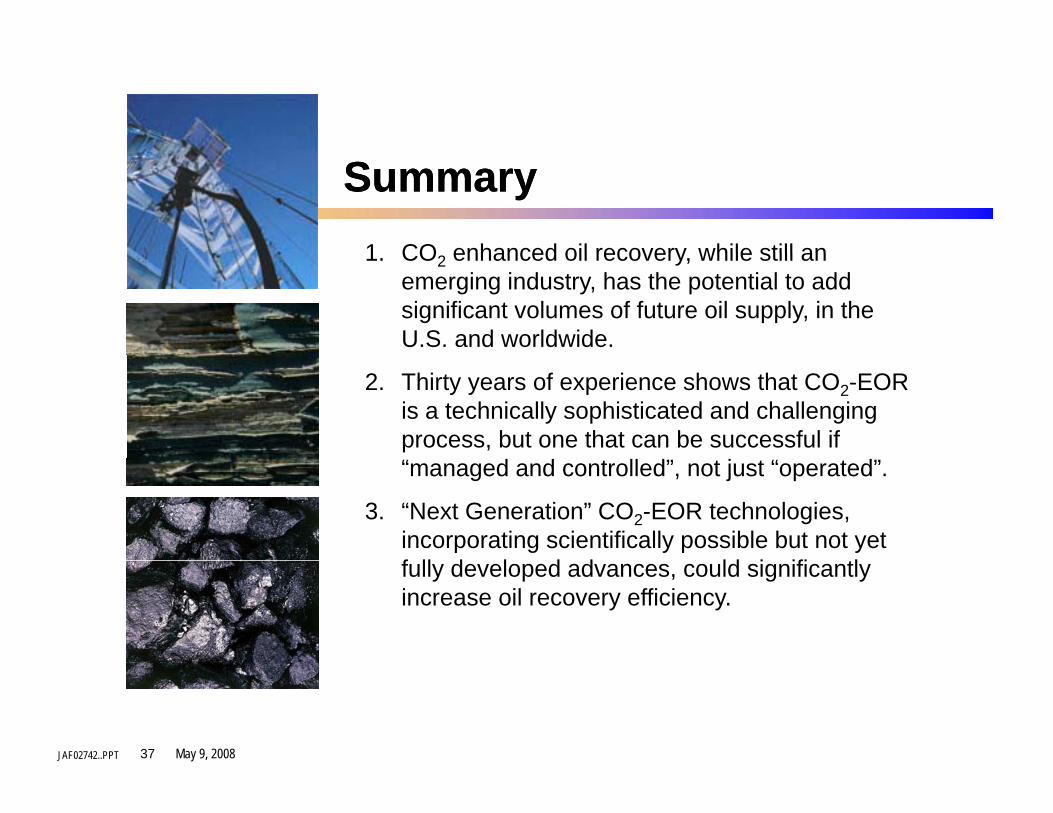
SummarySummary1 CO enhanced oil recovery while still an1. CO2 enhanced oil recovery, while still an
emerging industry, has the potential to add significant volumes of future oil supply, in the U.S. and worldwide.
2. Thirty years of experience shows that CO2-EOR is a technically sophisticated and challenging process, but one that can be successful if “managed and controlled”, not just “operated”.
3. “Next Generation” CO2-EOR technologies, incorporating scientifically possible but not yet f ll d l d d ld i ifi tlfully developed advances, could significantly increase oil recovery efficiency.
JAF02742..PPT May 9, 200837
SummarySummary (Cont’d)
4 Wide scale application of CO EOR is constrained by4. Wide-scale application of CO2-EOR is constrained by lack of sufficient “EOR-Ready” CO2 supplies. A mutually beneficial link exists between CO2-EOR and new industrial sources of CO2.
5. Under a “carbon constrained world”, productively using industrial CO2 emissions for CO2-EOR will become a winning strategy.