18
Future Transport Demand in the North of England 1 Future Transport Demand in the North of England

Future Transport Demand in the North of England 1
Future Transport Demand in the North of England
Future Transport Demand in the North of England
Contents
Executive Summary 1
Introduction 2
About the modelling 3
The Northern Transport Demand Model 4
Development of the future scenarios 6
Findings section 8
Appendix: Results by Scenario 11
1. Compact and Digital 12
2. Compact & Travel Friendly 13
3. Dispersed & Digital 14
4. Dispersed & Travel Friendly 15
Future Transport Demand in the North of England 1
Understanding the future travel needs of a transformed North of England is critical to understanding where improved connectivity and infrastructure investment is needed to support the levels of economic growth of the Northern Powerhouse. The challenge facing Transport for the North is planning that investment for a long term future that is uncertain and where different patterns of travel demand might develop.
In this unique study, Transport for the North worked with Steer Davies Gleave, Cambridge Econometrics, its Northern partners and DfT to produce the first pan-Northern transport demand scenarios for road and rail travel in a future transformed North, that:
• Introduces a new Northern Transport Demand Model (NTDM) to show how the volume and pattern of transport demand would respond to the changes in population and employment resulting from the economic growth envisaged by the Northern Powerhouse Independent Economic Review (NPIER)
• Presents four scenarios that reflect futures in which interventions (including the programme of transport improvements outlined in the Northern Transport Strategy) have achieved the transformation in the economy of the North but with differential patterns of travel demand based on responses to non-transport factors (such as land use policy, energy prices and technological changes).
Executive Summary
Key findings• Total demand for rail travel is expected to be up to 4
times higher than today. This would mean an increase in the total 178 million trips in the North to between 760 million trips by 2050 - an additional 106-582 million trips made annually within the North.
• The strongest growth in rail demand is between the city regions. In 2015 approximately 43 million trips were made between city regions. By 2050 this is forecast to increase to between 105-281 million trips, between 4 and 6 times the level today. In a more connected and integrated North, the level of rail commuting could increase by up to 8 times the level today.
• In a transformed North, total demand for road travel is forecast to increase by up to 54% by 2050. This would mean an increase in the total 126 billion vehicle km travelled in the North to 193 billion vehicle km by 2050 - an additional 33-67 billion vehicle km on roads in the North. Road demand growth in a less connected North could be half that amount.
• Under scenarios 2 and 4 (a more connected North), the growth in road travel demand between LEP areas is greater than that within LEP areas. In 2015 approximately 34 billion vehicle km were driven between city regions and other LEPs in the North. By 2050 this is forecast to increase to between 37-68 billion vehicle km.

Future Transport Demand in the North of England 2
The challenge facing Transport for the North (TfN) is planning investment in the transport network that will support unprecedented levels of transformational economic growth in the North, in a future that is uncertain and in which different patterns of travel demand might develop in response to both transport and non-transport stimuli.
There are a number of reasons why conventional approaches to forecasting travel demand in the North are unlikely to fully capture the economic transformation:
• Understanding how growth affects transport demand in the North. The Northern Powerhouse Independent Economic Review (NPIER) sets out a compelling vision of a transformed North with higher economic, employment and productivity growth until 2050. Conventional approaches to forecasting demand generally rely on past trends and/or elasticities to forecast future travel demand and are therefore not well suited to predict the impact of transformational economic growth on travel.
• Patterns of transport demand will change as the North grows. As the NPIER sets out, a transformed Northern economy built around the key capabilities will change the distribution of people, business and industry across the North, leading to different patterns of travel demand in response. Conventional approaches to forecasting demand do not include for significant redistribution, trip suppression or induced trips.
• Technology is changing choices about work, housing and travel. TfN needs to understand how these factors might affect future Northern travel trends so we can plan for the widest range of possible futures. A number of studies have looked at how travel might be affected by future trends, and Network Rail and Highways England have separately produced national travel scenarios for rail and road respectively1. However to understand how all these factors could affect the North by 2050, and do this consistently across all transport modes, a more specific foresighting exercise is needed.
Introduction
It is for these reasons that TfN has commissioned a new approach to understanding future transport demand in the North of England, that:
• Builds on the NPIER to produce a more detailed forecast of the North’s population and employment in 2050 under the transformational scenarios within it.
• Introduces a new Northern Transport Demand Model (NTDM) to show how the volume and pattern of transport demand would respond to the changes in population and employment resulting from the economic growth envisaged by the NPIER.
• Presents four scenarios that reflect futures in which interventions (including the programme of transport improvements outlined in the 2016 Northern Transport Strategy2) have achieved the transformation in the economy of the North but with differential patterns of travel demand based on responses to non-transport factors (such as land use policy, energy prices and technological changes).
TfN has worked with Steer Davies Gleave, Cambridge Econometrics, its Northern partners and DfT to produce the first pan-Northern transport demand scenarios for road and rail travel.
The four scenarios created all reflect futures in which interventions (including transport improvements) have achieved a transformation in the economy of the North whereby levels of employment, productivity and output are more similar to the South East of England than they are today. The scenarios are not forecasts but illustrate a range of plausible futures that will allow TfN to ensure the investment decisions we make today will be right for the future. To ensure consistency across travel modes, and to align with the NPIER, all of the scenarios are expressed in terms of growth rates between 2015 and 2050.
This report presents the high-level outputs from this innovative project and describes the development of the NTDM. A full technical report will be available later in 2017.
1 Long Distance Market Study, Network Rail, October 2013; Road Traffic Forecasts, DfT, March 2015 2 Northern Transport Strategy Spring 2016 update, Department for Transport and Transport for the North

Future Transport Demand in the North of England 3
Transport demand is essentially the number of trips that are made in an area – in this case the whole of the North of England. Trips are made by people for a variety of purposes and these are commonly reduced to three broad categories:
• Commuting: travel to and from work
• Business: travel to, from or between other businesses
• Other: travel to access services, education, shops, visiting friends and relatives and undertaking leisure activities.
The number of trips made in an area is dependent on the level of activity in each of these categories:
• Commuting: the size of the population, the workforce and the number of jobs available
• Business: the number, size and type of businesses providing goods and services to each other
• Other: the size of the population, the proportion in education or seeking services or leisure activities and the availability of services and activities.
The relative locations of people and jobs or activities are
Modelling travel demand
crucial to understanding where these trips actually take place. Generally, after taking into account all other factors (such as the relative attractiveness of a job), people will make many more short trips than longer ones. For example, someone living in Doncaster is generally likely to make many trips within the Doncaster area, somewhat fewer within the Yorkshire and Humber region, and fewer still within the rest of the North. This is because making trips requires both time and money, both relatively scarce resources.
The economic transformation presented by NPIER envisages that better connectivity across the North will make it easier to make trips thereby reducing one of the main barriers of travel to jobs and activities. To model future travel demand, we therefore need to understand the following key questions:
• What are the existing levels of population and employment in different areas across the North?
• How does the existing level of transport connectivity produce the distribution of trips between and within those areas?
• How will both of the above change in the future?

Future Transport Demand in the North of England 4
The Northern Transport Demand Model (NTDM) is designed to estimate how changes in employment, population and the transport network will affect longer distance travel patterns between Local Authority Districts (LADs) in the North of England. The current model combines a dynamic model of the labour market, which matches employers and the workforce and generates travel to work patterns, with trip generation and distribution models for other trip purposes, it also has two bespoke sub-models to handle freight and travel to/from Manchester Airport.
In summary, the model:
• Takes external sources of population and employment data and representations of the road and rail transport networks, and simulates the number of trips for each trip purpose and for each transport mode, within and between each modelled zone;
• Dynamically simulates how employment supply (the workforce) and demand (job recruitment) respond to changes in the size and location of the labour market relative to available jobs; and
• Simulates the distribution of business-to-business and other trips depending on the locations of households, services and businesses and the transport costs.
The Northern Transport Demand Model
The model covers the regions of the North of England defined as the North East, North West and Yorkshire and the Humber. Six LADs in the East Midlands have also been included to better match the coverage of the source data and to enlarge the catchment area around Sheffield. The model covers 73 Northern LADs, as well as 8 regions outside the North, including Wales, Scotland, the Midlands and other parts of the UK.
The model can respond to changes in:
• The number and distribution of employers: this affects the numbers and distribution of Commute and Business trips;
• The number and distribution of the workforce - this affects the numbers and distribution of commute and other home-based trips
• The cost (time and expense) of travelling between different parts of the North.
Figure 1: The Northern Transport Demand Model: Schematic Representation of Inputs, Processes and Output
Key Inputs Key Outputs
Population and Employment Base
Data
Transport Demand Growth
Transport Costs
NTDM: Main Dynamic Modules
NTDM: Dynamic Labour Market Simulation
Commuting Trips Module
Households/Workers
Businesses
Households/Workers/ Businesses
Businesses/Jobs
Businesses
Businesses/Services
Business to Business Trips
Module
Other Trips Module
NTDM: Sub-Modules
Freight Sub-Model Airport Sub-Model
Population and Employment
Growth (NPIER)
Future Transport Demand in the North of England 5
The NTDM can be used to show how transport demand will change as the North’s economy transforms, by predicting future travel growth rates based on the population and employment forecasts underlying the NPIER. Having a dynamic model also allows us to vary the underlying assumptions about the relationship between population and employment growth, travel trends and connectivity across the north. Doing that in a systematic way will enable the model results to reflect a range of futures in which interventions (including transport improvements) have achieved the transformation in the economy of the North, but with differing patterns of travel demand predicted in response to non-transport factors.
The first fundamental assumption of all the future scenarios explored in the NTDM is that the NPIER transformational scenario is realised in terms of population and employment growth. This equates to an increase of +21% in total employment between 2015 and 2050 (which is just less than double the employment growth forecast of +12% contained within DfT’s National Trip End Model). The NTDM predicts similar output levels of transport demand growth to the input population and employment growth; e.g. +21% commuter travel growth.
The second fundamental assumption in all scenarios is that the transport interventions in road, rail and integrated travel as described in TfN’s ‘Northern Transport Strategy: Spring 2016 Report’ are implemented. This includes the improvements in intercity rail journey times and frequencies envisaged in the Northern Powerhouse Rail conditional outputs, along with maintaining current levels of service on the Major Road Network, and a better door-to-door experience for public transport users. The TfN transport interventions alone, when realised in the NTDM, produce transformational travel demand growth; e.g. +118% intercity rail commuter growth in response to the rail and integrated travel interventions.
Building on these two fundamental assumptions, four scenarios exploring different futures in the North have then been explored incorporating the impact of other important drivers of travel demand such as land use policy, local transport plans, energy prices, technological and socio-cultural change.
Future Transport Demand in the North of England 6
The future scenarios were developed through workshops with stakeholders drawn from across the North of England. This group considered how the variation in the other key assumptions could drive changes in future transport demand. The assumptions were then grouped into two broad dimensions of uncertainty: ‘Enabling Policy & Plans’ and ‘Technological & Social
‘Enabling Policy & Plans’ represent the uncertainty in how local planning processes and policies (local government priorities, land use and development planning, local transport planning) will affect two key drivers of future transport demand:
• The level of future housing development and employment growth that occurs in urban centres (centralised) as opposed to the suburbs (dispersed); and
• The level of improvement achieved in travel conditions (journey times, reliability and travel experience) within and between LADs.
Development of the future scenarios
‘Technological & Socio-Cultural Change’ represent the uncertainty in how technologies such as autonomous vehicles, alternative fuels and digital connectivity will evolve and affect three key drivers of future transport demand:
• The cost of energy (and the consequent effect on travel costs);
• The capacity and usage of the road network;
• The decision to undertake activities face-to-face or digitally.
When combined, the two dimensions create four different future scenarios so that each scenario represents a coherent and plausible view of the future. There is no claim that one scenario is more likely than another – but instead that taken together they represent the likely range of outcomes for travel demand in a transformed North of England.

Future Transport Demand in the North of England 7
Figure 2: Four scenario descriptions and future transport demand: possibilities
Scenario 1: ‘Compact and Digital’
NPIER: Enabled by transport
intervention
Technological and Socio-Cultural
Change
Technological and Socio-Cultural
Change
Enabling Policy & Plans
Enabling Policy & Plans
Scenario 3: Dispersed & Digital
Scenario 2: Compact & Travel Friendly
Scenario 4: Dispersed & Travel Friendly
Scenario 1: Compact & Digital Scenario 2: Compact & Travel Friendly
• Urban areas are ‘Compact’ with brownfield development in the cores
• Local transport systems focus on serving radial movements
• Technological development has led to a preference for ‘Digital’ rather than physical connectivity
• Energy costs and therefore travel costs are high
• Urban areas are ‘Compact’ with brownfield development in the cores
• Local transport systems focus on serving radial movements
• Technological development has led to advances in ‘Travel Friendly’ connectivity options
• Energy costs and therefore travel costs are low
Scenario 3: Dispersed & Digital Scenario 4: Dispersed & Travel Friendly
• Urban areas are ‘Dispersed’ with mixed greenfield and brownfield development in the suburbs and urban fringes
• Local transport systems provide for all types of cross-district movement
• Technological development has led to preference for ‘Digital’ rather than physical connectivity
• Energy costs and therefore travel costs are high
• Urban areas are ‘Dispersed’ with mixed greenfield and brownfield development in the suburbs and urban fringes
• Local transport systems provide for all types of cross-district movement
• Technological development has led to advances in ‘Travel Friendly’ connectivity options
• Energy costs and therefore travel costs are low

Future Transport Demand in the North of England 8
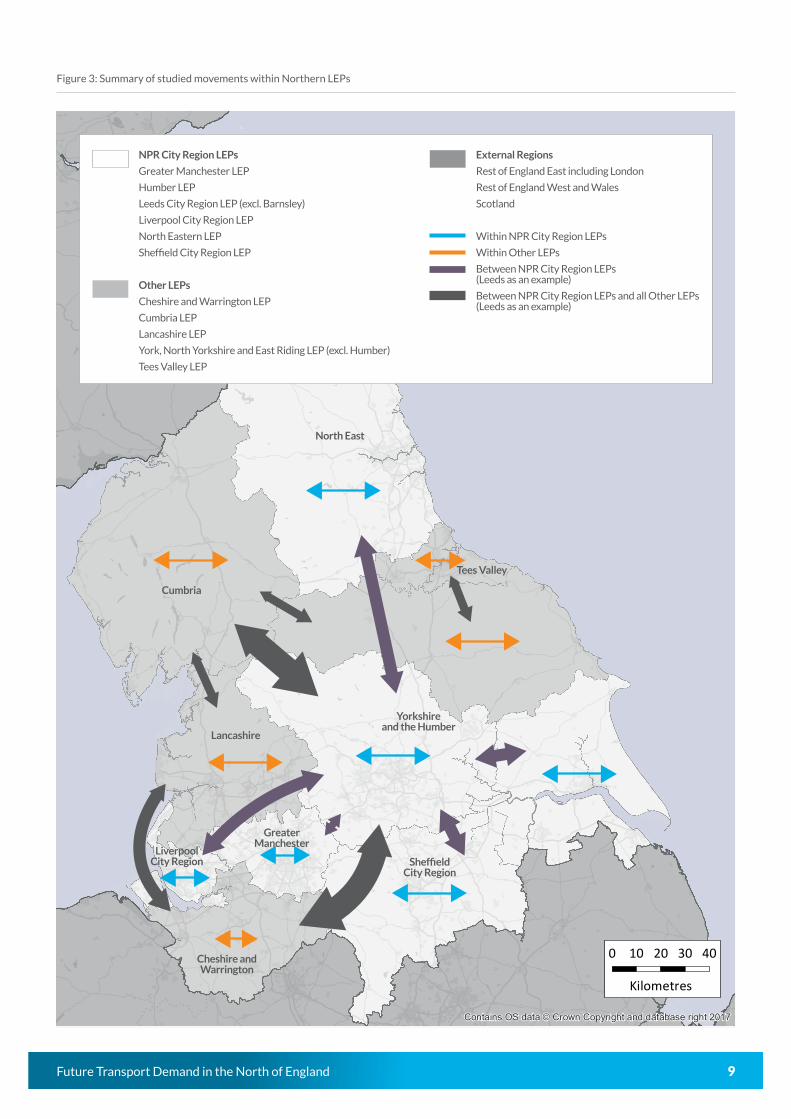
The following section explains the predictions made by the Northern Transport Demand Model. All of the findings are presented in terms of the projected growth between the 2015 baseline and 2050 and reported at a Northern level, and in terms of Local Enterprise Partnership (LEP) area to LEP area movements.
To illustrate the differences between different parts of the North, we have grouped together those LEP areas representing the core City Regions of the North which will also be served by Northern Powerhouse Rail. The predictions made by the NTDM are therefore described in terms of trips made within (intra) NPR City Region LEPs (Humber, Leeds, Liverpool, Greater Manchester, North East and Sheffield), intra Other (Northern) LEPs, between NPR City Region LEPs and between NPR City Region LEPs and Other LEPs. These definitions are illustrated for Leeds City Region on the following map.
Findings section
Table 1: Total Growth in Road Travel Demand 2015-2050
Source: Total growth is calculated by applying NTDM growth to the Highways England Regional Models.
Table 2: Total Growth in Rail Travel Demand 2015-2050
Source: Total growth is calculated by applying NTDM forecast growth to total trips by region in 2015 (ORR passenger journeys) and PLANET Rail long and short distance all day base year trip distributions.
Travel Demand Growth Scenario 1: Scenario 2: Scenario 3: Scenario 4:
Within NPR City Region LEPs 30% 49% 30% 50%
Within Other LEPs 27% 43% 25% 41%
Between NPR City Region LEPs 14% 72% 21% 85%
Between NPR City Region LEPS and Other LEPs 5% 89% 10% 99%
Total 26% 52% 27% 54%
Travel Demand Growth Scenario 1: Scenario 2: Scenario 3: Scenario 4:
Within NPR City Region LEPs 111% 214% 18% 57%
Within Other LEPs 365% 570% 208% 319%
Between NPR City Region LEPs 327% 554% 144% 298%
Between NPR City Region LEPS and Other LEPs 179% 283% 17% 80%
Total 192% 327% 60% 136%
Future Transport Demand in the North of England 9
twork
Contains OS data © Crown Copyright and database right 2017
0 10 20 30 40
Kilometres
Figure 3: Summary of studied movements within Northern LEPs
NPR City Region LEPs
Greater Manchester LEP
Humber LEP
Leeds City Region LEP (excl. Barnsley)
Liverpool City Region LEP
North Eastern LEP
Sheffield City Region LEP
Other LEPs
Cheshire and Warrington LEP
Cumbria LEP
Lancashire LEP
York, North Yorkshire and East Riding LEP (excl. Humber)
Tees Valley LEP
Yorkshire and the Humber
Cumbria
Lancashire
Greater Manchester
Liverpool City Region
Cheshire and Warrington
Sheffield City Region
North East
Tees Valley
External Regions
Rest of England East including London
Rest of England West and Wales
Scotland
Within NPR City Region LEPs
Within Other LEPs
Between NPR City Region LEPs (Leeds as an example)
Between NPR City Region LEPs and all Other LEPs (Leeds as an example)

Future Transport Demand in the North of England 10
The results for each scenario are explained in more detail in the Appendix. Looking across the results from each scenario:
Key messages• In a transformed North, total demand for road travel
is forecast to increase by up to 54% by 2050. This would mean an increase in the total 126 billion vehicle km in the North to 193 billion vehicle km by 2050 - an additional 33-67 billion vehicle km on roads in the North. Road demand growth in a less connected North (scenarios 1 and 3) could be half that amount.
• Under scenarios 2 and 4 (a more connected North), the growth in road travel demand between LEP areas is greater than that within LEP areas. In 2015 approximately 34 billion vehicle km were driven between NPR City Regions and other LEPs in the North. By 2050 this is forecast to increase to between 37-68 billion vehicle KM.
• Road demand within NPR City Region LEPs is forecast to grow by around 50%. This would increase the current 65 billion vehicle km driven within city regions to between 85-98 billion km by 2050.
• Total demand for rail travel is expected to be up to 4 times higher than today. This would mean an increase in the total 178 million trips in the North to between 760 million trips by 2050 - an additional 106-582 million trips made annually within the North.
• The strongest growth is between the NPR City Regions In 2015 approximately 43 million trips were made between city regions. By 2050 this is forecast to increase to between 105-281 million trips, between 2 and 6 times the level today. Currently, there are approximately 70 million annual trips made within NPR City Region LEPs and 42 million between NPR City Region LEPs. Due to significant forecast growth between NPR City Regions, by 2050 100-280 million trips are predicted between NPR City Regions and 80-219 million within NPR City Regions.
• Forecast rail trips within non-City Region LEPs are forecast to grow by a minimum 208%. This would increase trips from 14 million annually in 2015 to between 45-99 million by 2050.
How different are the scenarios?• The ‘Travel Friendly’ scenarios, 2 and 4 have materially
higher growth in road traffic than the ‘Digital’ scenarios, 1 and 3 – and this is principally related to low energy prices and technological developments such as Autonomous and Electric Vehicles.
• For the ‘Digital’ scenarios 1 and 3, energy prices are high and there is a preference for digital interaction, and this drives down road travel growth rates – particularly for long distance travel e.g. between NPR City Region LEPs.
• ‘Compact’ scenarios, 1 and 2 have materially higher growth in rail usage than ‘Dispersed’, scenarios 3 and 4 – and this is principally related to a centralised land-use policy and effective local transport policy.
• Public transport access to urban cores is emphasised for the ‘Compact’ scenarios; this leads to more and longer distance rail travel, particularly between NPR City Region LEPs.
• Conversely, in the ‘Dispersed’ scenarios 3 and 4 development is dispersed across urban areas and public transport access to urban cores is not emphasised; this leads to less and shorter distance rail travel.
Where is the growth likely to occur?Of particular interest is the scale of the potential changes in transport demand across both road and rail as well as the patterns of demand. Assuming the achievement of the NPIER transformational growth scenario:
• The impact of transformational economic growth is likely to increase travel demand within City Regions under all scenarios, but particularly for ‘Travel Friendly’ scenarios (2 and 4) in relation to road travel and ‘Compact’ scenarios (1&2) in relation to rail travel.
• Travel demand to and from places outside of the North is likely to be the greatest for road travel particularly Commuting and Other purposes under a travel friendly scenario. The changes are much more limited for rail travel in this context.
How different are these results?It is important to understand how these scenarios relate to scenarios published by DfT and its agencies. Forecasts of road and rail demand in the North have been made independently by the Department for Transport (DfT) and Network Rail (NR) respectively as part of wider national forecasting exercises. The scenario forecasts for the North have been benchmarked against these and are within the range suggested by these independent national forecasts of both road and rail demand.
Where next?The work described in this non-technical report represents an important step forward in understanding future travel demand in the north. The initial work has been shown to be consistent with growth forecasts produced by DfT and NR whilst better reflecting the economic ambition of the NPIER.
Going forward the results can be used to understand, at a strategic level, travel demand growth patterns across the different parts of the North. Refinements to the modelling work that could allow the forecasts presented above to be used for more detailed planning and appraisal work are now being considered.
Future Transport Demand in the North of England 11
Appendix: Results by Scenario

Future Transport Demand in the North of England 12
1. Compact and Digital
Key messages• Travel within the North is generally increased for both road and rail. Greatly improved rail
travel is counterbalanced somewhat by increasing road generalised costs.
Overall growth in road/rail across the north under Scenario 1
• The most significant growth in road travel is within NPR City Region LEPs. Road travel between NPR City Region LEPs is increased up to 1.2 times whereas the number of internal trips increased by 1.1 - 1.4 times.
• Long distance rail travel between NPR City Region LEPs is increased between 2 – 4.5 times.
• Longer distance rail commuting between NPR City Region LEPs and also between NPR City Region LEPs and Other LEPs is significantly increased.
• There is a significant reduction in longer distance car commuting, primarily because of the reduction in the commuting rate coupled with the increase in road generalised costs.
• Shorter and medium distance commuting within NPR City Region LEPs and within the Other LEPs is increased for both road and rail because of the interactive effect of centralised development and improved rail linkages
Functional Geography Road Rail
Commute Other Business Commute Other Business
Within NPR City Region LEPs +8% +33% +22% +90% +35% +9%
Within Other LEPs +9% +27% +22% +30% +2% +8%
Between NPR City Region LEPs -31% +8% +20% +259% +27% +1%
Between NPR City Region LEPs and Other LEPs -19% +1% +19% +129% +12% +1%
Total (within the North) +3% +29% +21% +90% +27% +5%
Future Transport Demand in the North of England 13
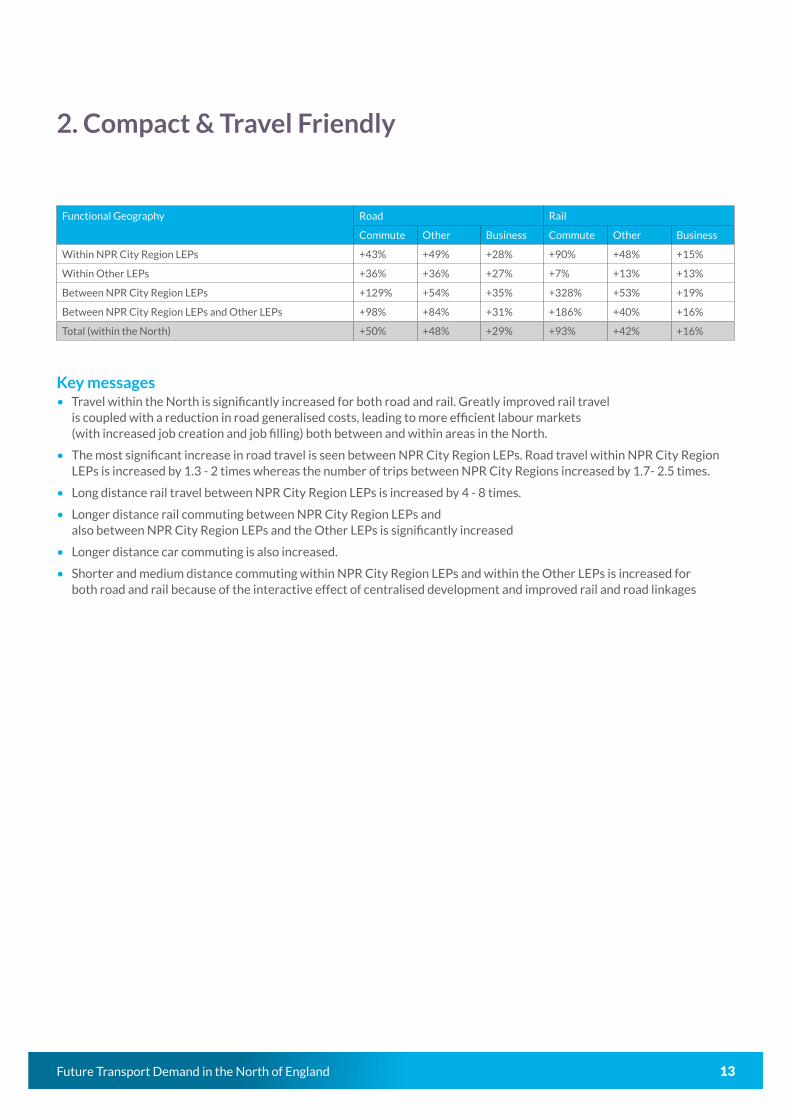
2. Compact & Travel Friendly
Key messages• Travel within the North is significantly increased for both road and rail. Greatly improved rail travel
is coupled with a reduction in road generalised costs, leading to more efficient labour markets (with increased job creation and job filling) both between and within areas in the North.
• The most significant increase in road travel is seen between NPR City Region LEPs. Road travel within NPR City Region LEPs is increased by 1.3 - 2 times whereas the number of trips between NPR City Regions increased by 1.7- 2.5 times.
• Long distance rail travel between NPR City Region LEPs is increased by 4 - 8 times.
• Longer distance rail commuting between NPR City Region LEPs and also between NPR City Region LEPs and the Other LEPs is significantly increased
• Longer distance car commuting is also increased.
• Shorter and medium distance commuting within NPR City Region LEPs and within the Other LEPs is increased for both road and rail because of the interactive effect of centralised development and improved rail and road linkages
Functional Geography Road Rail
Commute Other Business Commute Other Business
Within NPR City Region LEPs +43% +49% +28% +90% +48% +15%
Within Other LEPs +36% +36% +27% +7% +13% +13%
Between NPR City Region LEPs +129% +54% +35% +328% +53% +19%
Between NPR City Region LEPs and Other LEPs +98% +84% +31% +186% +40% +16%
Total (within the North) +50% +48% +29% +93% +42% +16%
Future Transport Demand in the North of England 14
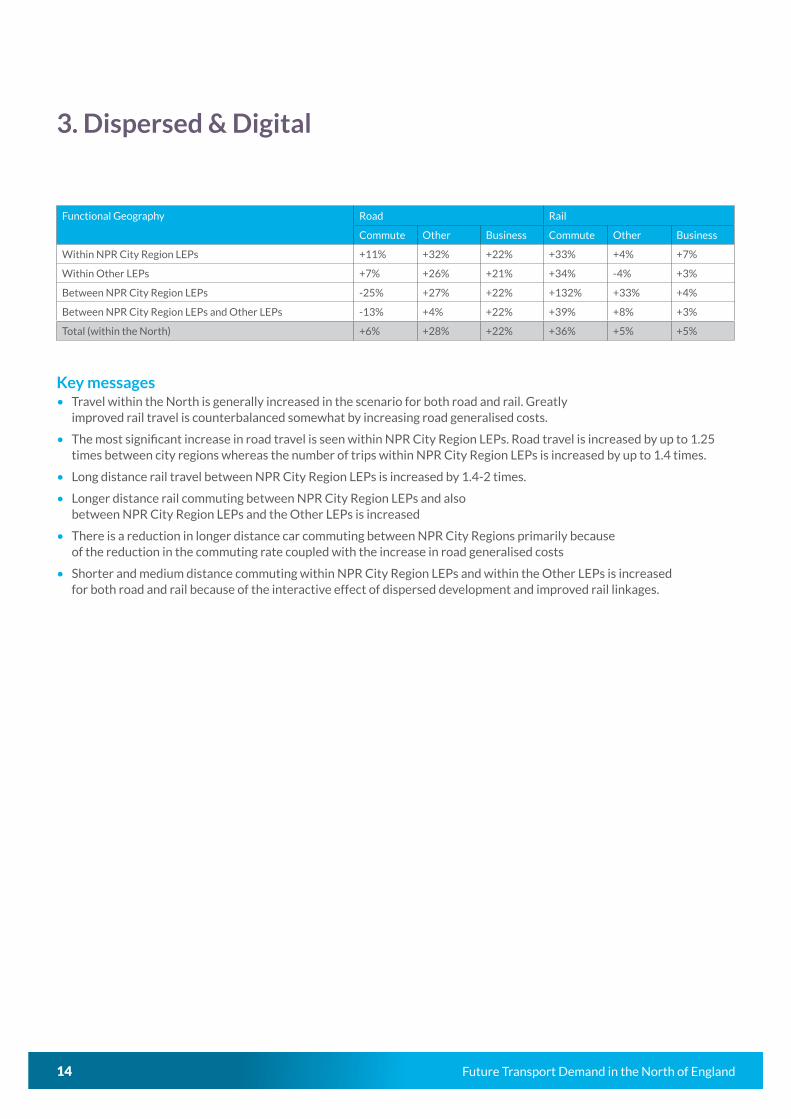
3. Dispersed & Digital
Key messages• Travel within the North is generally increased in the scenario for both road and rail. Greatly
improved rail travel is counterbalanced somewhat by increasing road generalised costs.
• The most significant increase in road travel is seen within NPR City Region LEPs. Road travel is increased by up to 1.25 times between city regions whereas the number of trips within NPR City Region LEPs is increased by up to 1.4 times.
• Long distance rail travel between NPR City Region LEPs is increased by 1.4-2 times.
• Longer distance rail commuting between NPR City Region LEPs and also between NPR City Region LEPs and the Other LEPs is increased
• There is a reduction in longer distance car commuting between NPR City Regions primarily because of the reduction in the commuting rate coupled with the increase in road generalised costs
• Shorter and medium distance commuting within NPR City Region LEPs and within the Other LEPs is increased for both road and rail because of the interactive effect of dispersed development and improved rail linkages.
Functional Geography Road Rail
Commute Other Business Commute Other Business
Within NPR City Region LEPs +11% +32% +22% +33% +4% +7%
Within Other LEPs +7% +26% +21% +34% -4% +3%
Between NPR City Region LEPs -25% +27% +22% +132% +33% +4%
Between NPR City Region LEPs and Other LEPs -13% +4% +22% +39% +8% +3%
Total (within the North) +6% +28% +22% +36% +5% +5%

Future Transport Demand in the North of England 15
4. Dispersed & Travel Friendly
Key messagesTravel within the North is significantly increased in the scenario for both road and rail. Greatly improved rail travel is coupled with a reduction in road generalised costs, leading to more efficient labour markets (with increased job creation and job filling) both between and within areas in the North.
• The most significant increase in road travel is seen between NPR City Region LEPs. Road travel is increased up to 1.3 - 2 times within city regions whereas the number of trips between NPR City Region LEPs is increased by 1.7 - 2.4 times.
• Long distance rail travel between NPR City Region LEPs is increased by 2 - 6 times.
• Longer distance rail commuting between NPR City Region LEPs and also between NPR City Region LEPs and the Other LEPs is increased
• Longer distance car commuting is also increased.
• Shorter and medium distance commuting within NPR City Region LEPs and within Other LEPs is increased because of the interactive effect of dispersed development and improved rail and road linkages
Functional Geography Road Rail
Commute Other Business Commute Other Business
Within NPR City Region LEPs +48% +50% +29% +31% +16% +13%
Within Other LEPs +35% +35% +26% +7% +8% +8%
Between NPR City Region LEPs +150% +78% +37% +194% +60% +23%
Between NPR City Region LEPs and Other LEPs +107% +95% +35% +76% +36% +18%
Total (within the North) +55% +49% +30% +35% +21% +15%

Future Transport Demand in the North of England 16
General enquiries
0161 244 0888
Write to
Transport for the North2nd Floor4 Piccadilly PlaceManchesterM1 3BN
Website
transportforthenorth.com
Connect


