NOAA Future Weather Doppler Radar Study ______________________________________________________________________________________ THE AEROSPACE C O R P O R A TI O N Future Weather Doppler Radar Feasibility Study Phase I. February 26, 2004 Prepared by The Aerospace Corporation Chantilly, VA and El Segundo, CA Prepared for NOAA / NWS Office of Science and Technology Silver Spring, MD
4.1 Weather and Radar .......................................................................................................................................15
4.2 Improving Tornado Detections and Warnings with Weather Radars ............................................21
4.3 Improved Tornado Detection Using Weather Radars and the Prospect for Improvement......22
NOAA Future Weather Doppler Radar Study ______________________________________________________________________________________
iv THE AEROSPACE C O R P O R A T I O N
LIST OF FIGURES AND TABLES
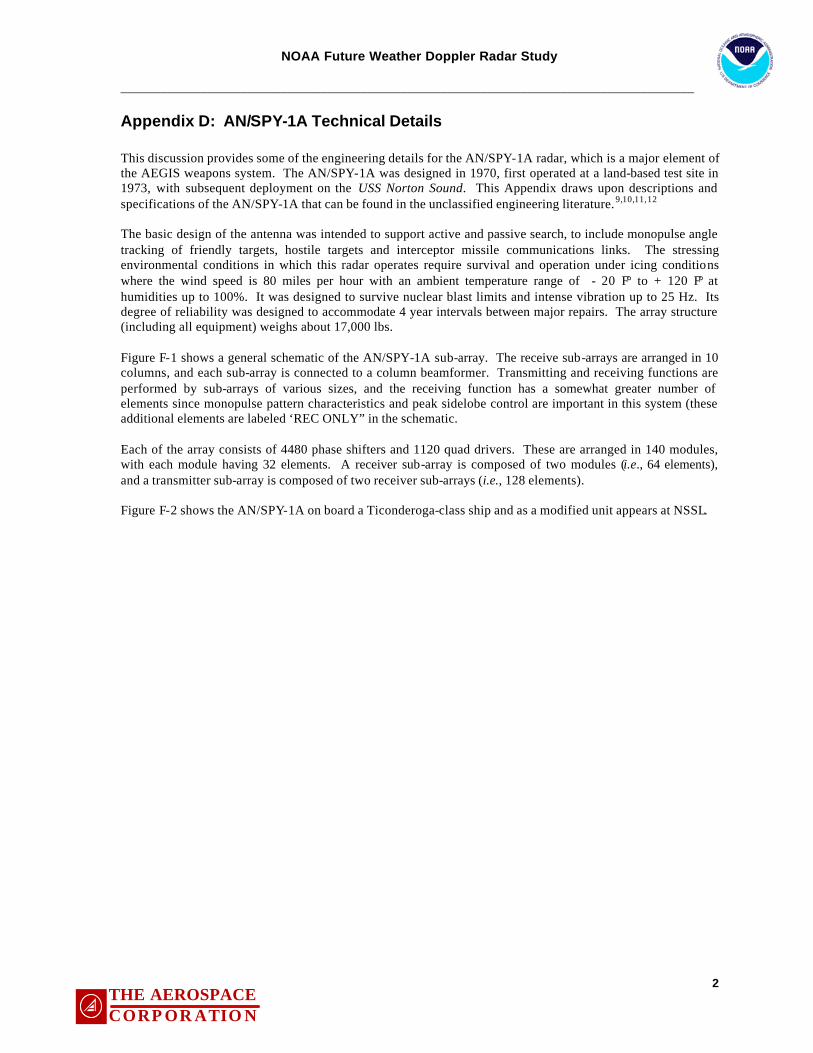
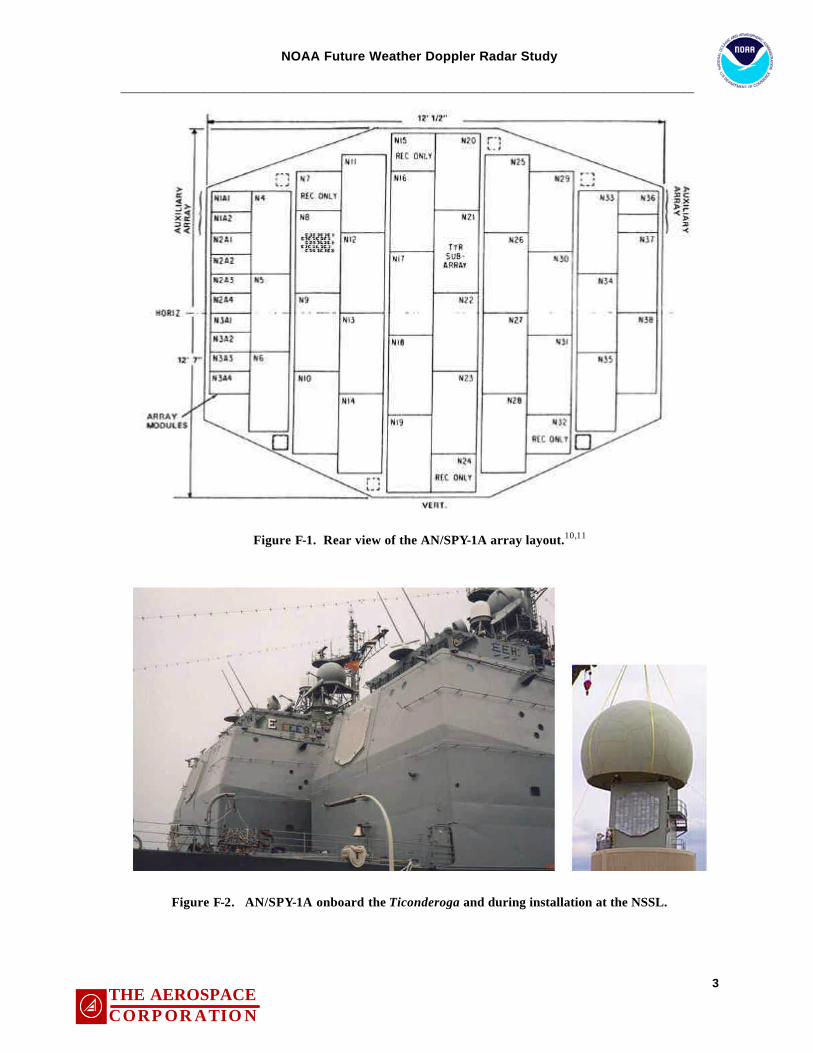
Figure 2-1. Notional View of Weather Radar Systems Architecture ....................................................................3 Figure 2-2. High Level Functional Boundaries of Ground Based Weather Radar.............................................4 Figure 3-1. Passive PAR Functional Diagram..........................................................................................................5 Figure 3-2. Active PAR Functional Diagram............................................................................................................7 Table 3-1. AN/SPY-1A Passive PAR Functional Parameters .................................................................................9 Table 3-2. AN/SPY-1A Passive PAR Performance Parameters ............................................................................9 Table 3-3. AN/SPY-1A Passive PAR Performance Parameters ..........................................................................10 Table 3-4. AN/SPY-1A Passive PAR Physical Parameters ...................................................................................10 Table 3-5. Performance Comparisons........................................................................................................................11 Table 3-6. Key Performance of CEA -FAR...............................................................................................................13 Figure 4-1. The Electromagnetic Spectrum..............................................................................................................16 Table 4-1. IEEE RF Band Designations....................................................................................................................16 Figure 4-2. Atmospheric Transmission vs. Frequency...........................................................................................17 Figure 4-2. Tornado Statistics .....................................................................................................................................21 Figure 4-3. Geographical Tornado Distribution......................................................................................................22 Figure 4-4. Tornado Lead Times ...............................................................................................................................23 Figure 4-5. Tornados and the Earth’s Curvature......................................................................................................23 Figure 5-1. Active Phased Array EIRP vs. Elements.............................................................................................25 Figure 5-2. Passive Phased Array EIRP vs. Elements ...........................................................................................26 Figure 5-3. Active Phased Array G/T vs. Elements ................................................................................................27 Figure 5-4. Passive Phased Array G/T vs. Elements..............................................................................................28 Figure 5-5. Notional View of a Ground-Based Weather Doppler Radar System.............................................29 Figure 5-6. Functional Allocations of a Weather Radar........................................................................................30 Table 5-1. Key Functional Requirements .................................................................................................................31 Table 5-2. Key Performance Requirements..............................................................................................................31 Table 5-3. Key Interface Requirements.....................................................................................................................32 Table 5-4. Key Environmental Requirements ..........................................................................................................33 Table 5-5. Key Physical Requirements .....................................................................................................................33 Table 5-6. Active Phased Array Antenna Pros and Cons.......................................................................................34 Table 5-7. Planar Panel Antenna Pros and Cons......................................................................................................35 Figure 5-7. Future Weather Radar Roadmap............................................................................................................36 Figure 6-1. Top-Level Process for an In-Depth Study of Active PAR................................................................38 Figure F-1. Rear view of the AN/SPY-1A array layout.10,11....................................................................................3 Figure F-2. AN/SPY-1A onboard the Ticonderoga and during installation at the NSSL. ................................3 Figure F-3. Functional diagram for the AN SPY-1A array.12 ................................................................................4 Table F-1. AN/SPY-1A Array Reliability (1974-1977)11 .......................................................................................4
NOAA Future Weather Doppler Radar Study ______________________________________________________________________________________
v THE AEROSPACE C O R P O R A T I O N
Acknowledgement
The authors wish to thank staff members of the National Severe Storms Lab (NSSL), Ball Aerospace, Lockheed Martin, and CEA for numerous technical discussions, as well as their help in providing data in support of this study. Staff members at the NWS Office of Science and Technology (NWS / OS&T) were especially helpful in coordinating visits to the NSSL and in commenting on early versions of this report. This effort covers performance previously initiated under Air Force contract number F04701-00-C-0009.
NOAA Future Weather Doppler Radar Study ______________________________________________________________________________________
1THE AEROSPACE C O R P O R A T I O N
1. Executive Summary The October 2003 version of the Omnibus Appropriations Bill specifies, “A parallel assessment of the practicality of commercializing the SPY-1 or successor for weather forecasting is funded under the National Weather Service. … NWS shall submit a feasibility study to the Committees on Appropriations no later than May 1, 2004.” The present document is the result of a two-month, quick-look study effort that addresses these Congressional concerns at a high level. However, a more detailed effort is needed to more quantitatively address cost-benefits and technical details. The results of this report and the language of the Omnibus Appropriations bill are consistent with top-level recommendations found in the “Beyond NEXRAD”1 report recently prepared by the National Academy of Sciences. A fundamental NWS issue of concern to Congress is the need to achieve faster, more timely severe weather early warning, at lower cost, and within the framework of the existing NEXRAD Weather Doppler Radar system. Within the context of the Omnibus Appropriations Bill, the AN/SPY-1A is of interest because it is a phased array radar (PAR), capable of tracking multiple objects of interest simultaneously and revisiting these objects much quicker than can the existing NEXRAD Doppler radar. In general, PAR offers fundamental technical advantages that are especially useful for the early detection and tracking of severe storms such as tornados. Major advances in solid-state radar technology have occurred during the last decade. These advances have been commercialized and implemented in PAR systems. For example, both Ball Aerospace and Lockheed Martin have done extensive research on applying PAR systems to weather applications. CEA Technologies (Canberra, Australia), has developed a commercial PAR system used for air traffic control. Briefings from each of these companies are included in the Appendices of this report. PAR technology has traditionally been used in high performance military or intelligence systems, but the telecommunications boom of the 1990s changed the economics associated with this technology. Radar techniques formerly envisioned only in unconstrained cost scenarios are now viable for commercial and civil implementation. Even very-low cost applications for automobiles may now be possible. The New York Times reported on February 3, 2004 that PAR technology will be used to provide blind spot warning to motorists; tests on crowded freeways near Valeo Raytheon headquarters (Auburn Hills, MI) have already demonstrated the system’s effectiveness. The current document is limited to identifying the potential of PAR technology for Weather Doppler Radar applications. Numerous science and engineering implications need to be fully understood, and quantified in terms of cost and performance, prior to specifying PAR technology for future weather radar systems. Our primary conclusions and observations are:
• One company stated that the cost of PAR transmit/receive elements will go from $1,200 in 1999 to $250 in 2010; another company informally estimated the 2010 cost at $100. The Aerospace Corporation thinks that the cost will be closer to $35, but this estimate needs additional substantiation.
• Market evidence and engineering statistics indicate significant increases to component reliability, which will greatly reduce the impact of single-point-of failure components and result in much lower recurring costs.
• Integration of PAR technology into the existing NEXRAD system could be done gracefully. • A formal, in-depth analysis is required to provide a clear picture of the costs / benefits of Phased Array
Radar for weather Doppler radar application. • A more comprehensive, top-down study should be undertaken to define architectural requirements and
performance objectives that can be addressed by PAR in the 2005-2020 timeframe. • This comprehensive study needs to be done in concert with the NSSL to quantitatively identify the
performance benefits of PAR in terms of severe weather detection and potential savings in life and property.
1 New Priorities for the 21st Century, Department of Commerce, 31 March 2003.
NOAA Future Weather Doppler Radar Study ______________________________________________________________________________________
2THE AEROSPACE C O R P O R A T I O N
2. Introduction
Future weather forecasting systems will encompass a variety of advanced sensor technologies, including visible, infrared and hyperspectral imagers, as well as new classes of advanced Doppler radars. Such active and passive sensors are expected to provide greatly enhanced detection times for severe storms and to provide increasingly accurate weather forecasts.
It is likely that these technologies will be implemented on a variety of ground, oceanic, airborne and space platforms. This document focuses on PAR implemented on ground based fixed and mobile platforms. The following issues will require further investigation:
• Is it likely that low-cost commercial PAR will be available in 2012?
• What is the likely cost of a PAR system in that timeframe?
• How does this cost compare with that of the NEXRAD system?
• How do the key performance parameters of a PAR system compare with those of NEXRAD?
• Is a PAR system a likely replacement for NEXRAD, or should PAR technology be viewed as a supplement to an enhanced NEXRAD system?
Figure 2-1 illustrates a notional view of the weather radar systems architecture. The operations control centers that process and analyze weather data are not shown in Figure 2-1, because they have been excluded from the scope of this study. Today’s weather forecasting system includes all platforms shown in Figure 2-1, except the UAV and PAR platforms. Current weather forecasting systems have excellent capabilities for predicting, detecting and tracking hurricanes and storms. Accurately predicting severe storms and hurricanes can provide early warning for affected areas in hope of minimizing loss of life and property. Scientific and technological advances in image sensors, radars, signal and data processing algorithms, computers, networks, and system integration are likely to greatly enhance current capabilities in weather forecasting, storm detection and storm track prediction. According to NOAA, in year 2000 there were 14 tornados in the US, resulting in loss of 40 lives and millions of dollars in property damage. In 2002 there were 28 tornados, resulting in loss of 55 lives and millions of dollars in property damage. In 2003 there were 18 tornados, resulting in 51 deaths and millions dollars in property damage. PAR is a technology that may be well suited for the early detection of developing tornados. Enhanced early warning should result in saving lives, and may help mitigate property damage. To improve the performance of current radar systems, NOAA and NSSL technical team members are in the process of evaluating PAR technology. Until recently, PAR technology was practical only for military radars because of the high cost. However, the commercial wireless telecommunications boom in the late 1990s enabled high volume production of antenna elements, RF components, digital signal processing components and signal processing algorithms. As a result, many component costs have been decreased by an order of magnitude. Since high cost was the primary obstacle blocking development of commercial PARs, and given the extremely high performance of PAR, it is reasonable to expect extensive commercialization of PAR in the near future. The Aerospace Corporation has been tasked to assess and evaluate Phased Array Antennas (PAA) and Transmitter / Receiver Modules (TRM) for NOAA in terms of their commercial viability. The objective is to examine the potential for minimizing life cycle costs, deployment schedules, technical performance improvements, while providing backwards interoperability to existing control and operations centers. Conceptually, this represents the front end of a phased array radar, as depicted in Figure 2-2. Technological and manufacturing advancements in the areas of solid state amplifiers, switches, analog to digital converters, and low noise amplifiers are enabling the replacement of phased array antenna panels that use passive components (i.e., wave guides, coax cables, phase shifters) with panels that use active radar components. As will be seen, there are substantial advantages associated with PAR. In Appendix D, Lockheed Martin Corporation
NOAA Future Weather Doppler Radar Study ______________________________________________________________________________________
3THE AEROSPACE C O R P O R A T I O N
(Camden, NJ) indicates that the cost of PAR TRM elements has dropped from $2,000 in 1995 to $1,200 in 1999. This cost is expected to decline substantially over the next decade. The lower cost of TRM elements is being driven by the commercial wireless telecommunications industry and by technology advancements in the electronics components industry. Companies such as CEA Technologies PTY Limited (Canberra, Australia) have already produced relatively inexpensive commercial, active phased array systems. However, new technologies and their development always raise questions regarding risk. Throughout this quick-look study, we provide some examples and rationales regarding risk mitigation approaches. The basic structure of this report deserves comment, since the brevity of the study and the complexity of its subject, have demanded an abbreviated approach. Section 3 discusses current PAR and provides a review of capabilities, performance advantages and costs. These parameters can be used to establish a preliminary reference model. Section 4 discusses weather physics issues that form the fundamental basis for all Doppler weather radar systems. Section 5 describes a tentative architecture for a future phased array Doppler weather radar. This section provides some calculations of power versus number of TRM elements, and a discussion of interfaces and functional requirements. It also provides an engineering basis for future PAR feasibility studies. Many “To Be Determined” items appear in the latter section; these will be resolved in a more detailed study. Section 6 provides recommendations of the future weather radar. Subsequent sections contain acronyms, appendices and references.
Figure 2-1. Notional View of Weather Radar Systems Architecture
GEOLEO
UAV
LEO
Airborne
PAR
NEXRAD
NOAA Future Weather Doppler Radar Study ______________________________________________________________________________________
4THE AEROSPACE C O R P O R A T I O N
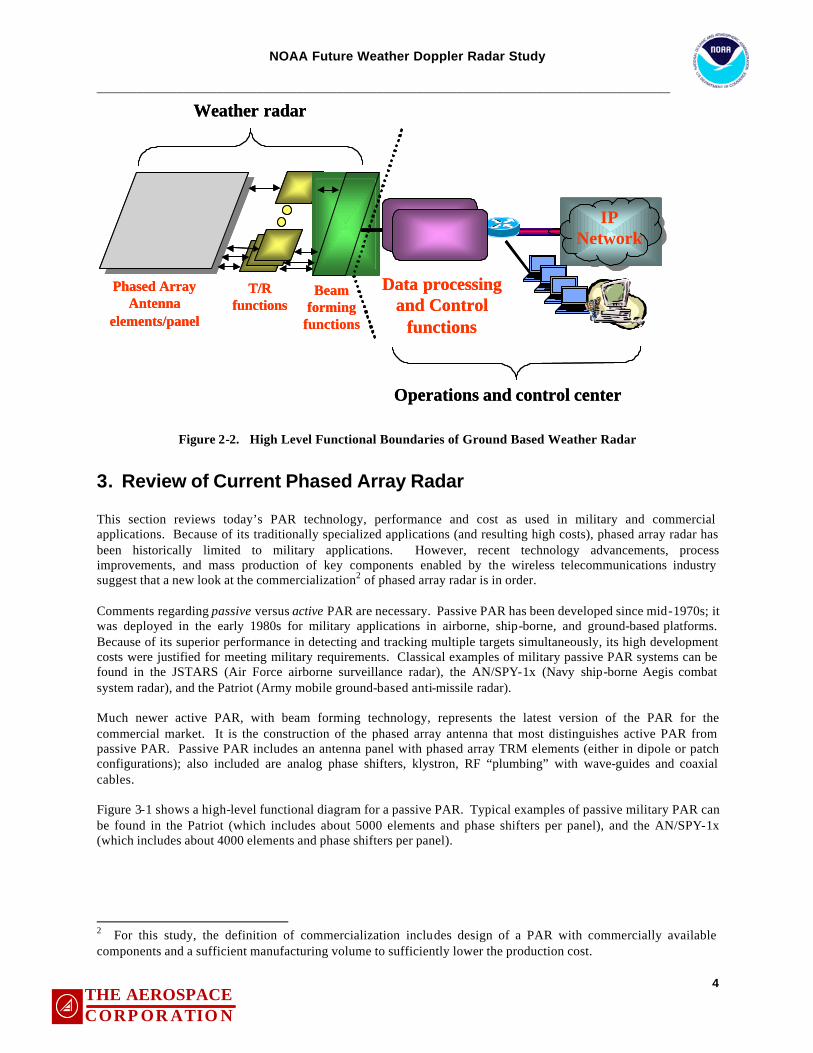
Figure 2-2. High Level Functional Boundaries of Ground Based Weather Radar
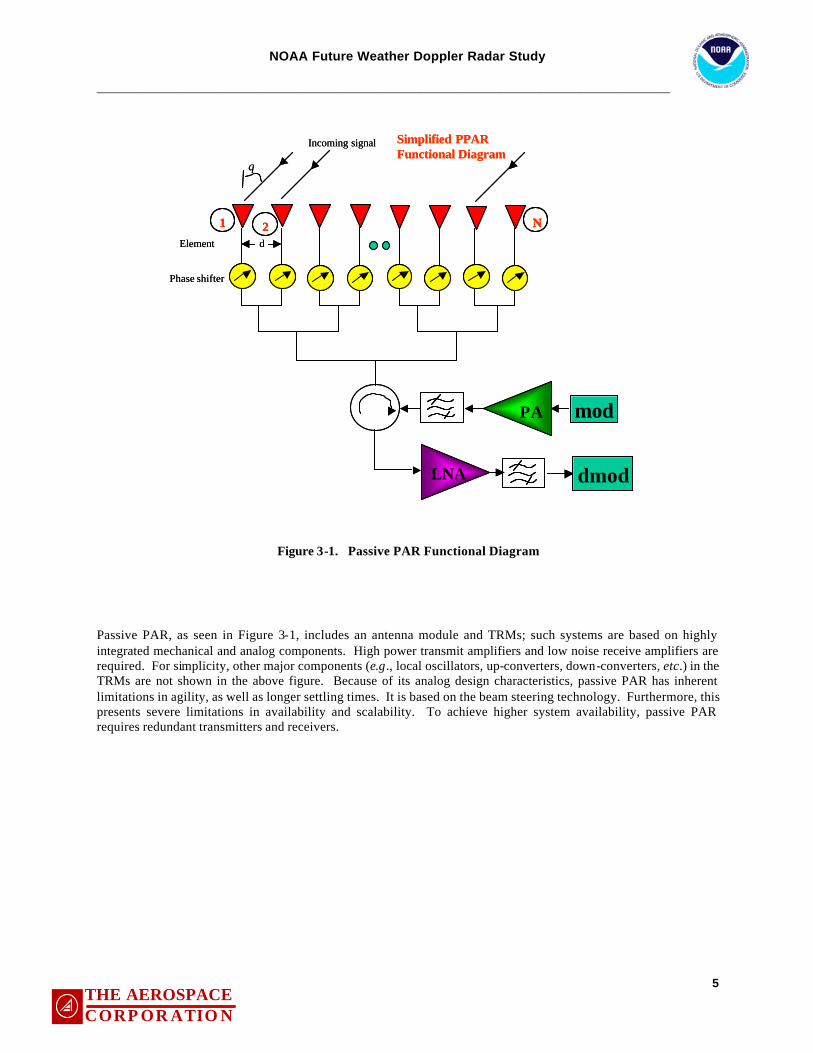
3. Review of Current Phased Array Radar This section reviews today’s PAR technology, performance and cost as used in military and commercial applications. Because of its traditionally specialized applications (and resulting high costs), phased array radar has been historically limited to military applications. However, recent technology advancements, process improvements, and mass production of key components enabled by the wireless telecommunications industry suggest that a new look at the commercialization2 of phased array radar is in order. Comments regarding passive versus active PAR are necessary. Passive PAR has been developed since mid-1970s; it was deployed in the early 1980s for military applications in airborne, ship-borne, and ground-based platforms. Because of its superior performance in detecting and tracking multiple targets simultaneously, its high development costs were justified for meeting military requirements. Classical examples of military passive PAR systems can be found in the JSTARS (Air Force airborne surveillance radar), the AN/SPY-1x (Navy ship-borne Aegis combat system radar), and the Patriot (Army mobile ground-based anti-missile radar). Much newer active PAR, with beam forming technology, represents the latest version of the PAR for the commercial market. It is the construction of the phased array antenna that most distinguishes active PAR from passive PAR. Passive PAR includes an antenna panel with phased array TRM elements (either in dipole or patch configurations); also included are analog phase shifters, klystron, RF “plumbing” with wave-guides and coaxial cables. Figure 3-1 shows a high-level functional diagram for a passive PAR. Typical examples of passive military PAR can be found in the Patriot (which includes about 5000 elements and phase shifters per panel), and the AN/SPY-1x (which includes about 4000 elements and phase shifters per panel). 2 For this study, the definition of commercialization includes design of a PAR with commercially available components and a sufficient manufacturing volume to sufficiently lower the production cost.
IPNetwork
Data processing and Control
functions
Phased Array Antenna
elements/panel
T/Rfunctions
Beamforming
functions
Weather radar
Operations and control center
IPNetwork
Data processing and Control
functions
Phased Array Antenna
elements/panel
T/Rfunctions
Beamforming
functions
Weather radar
Operations and control center
NOAA Future Weather Doppler Radar Study ______________________________________________________________________________________
5THE AEROSPACE C O R P O R A T I O N
Figure 3-1. Passive PAR Functional Diagram
Passive PAR, as seen in Figure 3-1, includes an antenna module and TRMs; such systems are based on highly integrated mechanical and analog components. High power transmit amplifiers and low noise receive amplifiers are required. For simplicity, other major components (e.g., local oscillators, up-converters, down-converters, etc.) in the TRMs are not shown in the above figure. Because of its analog design characteristics, passive PAR has inherent limitations in agility, as well as longer settling times. It is based on the beam steering technology. Furthermore, this presents severe limitations in availability and scalability. To achieve higher system availability, passive PAR requires redundant transmitters and receivers.
1 N
θ
Incoming signal
d
Phase shifter
Element
PA
LNA
mod
dmod
2
Simplified PPARFunctional Diagram
11 NN
θ
Incoming signal
d
Phase shifter
Element
PA
LNA
mod
dmod
22
Simplified PPARFunctional Diagram
NOAA Future Weather Doppler Radar Study ______________________________________________________________________________________
6THE AEROSPACE C O R P O R A T I O N
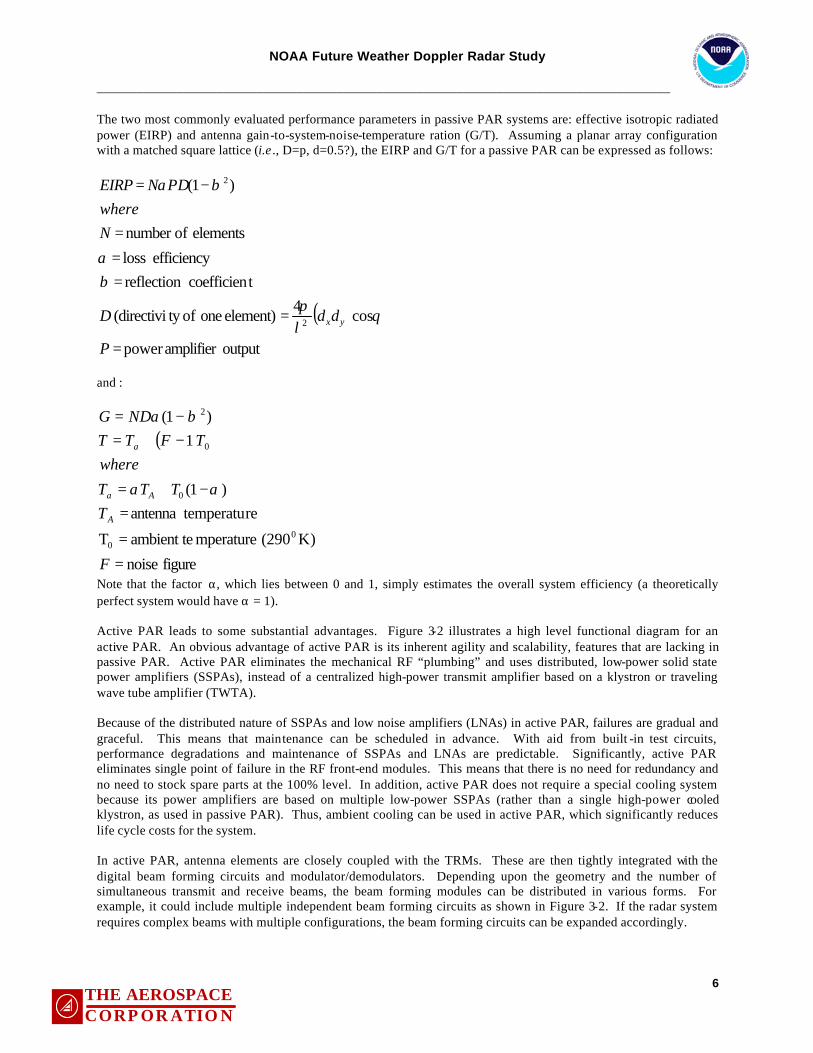
The two most commonly evaluated performance parameters in passive PAR systems are: effective isotropic radiated power (EIRP) and antenna gain-to-system-noise-temperature ration (G/T). Assuming a planar array configuration with a matched square lattice (i.e ., D=p, d=0.5?), the EIRP and G/T for a passive PAR can be expressed as follows:
( )outputamplifier power
cos4
element) one ofty (directivi
tcoefficien reflection efficiency loss
elements ofnumber
)1(
2
2
=
=
==
=
−=
P
ddD
Nwhere
PDNEIRP
yx θλπ
βα
βα
and :
( )
figure noise
K)(290 mperatureambient te T
re temperatuantenna )1(
1)1(
00
0
0
2
=
=
=−+=
−+=−=
F
TTTT
whereTFTT
NDG
A
Aa
a
αα
βα
Note that the factor α, which lies between 0 and 1, simply estimates the overall system efficiency (a theoretically perfect system would have α = 1). Active PAR leads to some substantial advantages. Figure 3-2 illustrates a high level functional diagram for an active PAR. An obvious advantage of active PAR is its inherent agility and scalability, features that are lacking in passive PAR. Active PAR eliminates the mechanical RF “plumbing” and uses distributed, low-power solid state power amplifiers (SSPAs), instead of a centralized high-power transmit amplifier based on a klystron or traveling wave tube amplifier (TWTA). Because of the distributed nature of SSPAs and low noise amplifiers (LNAs) in active PAR, failures are gradual and graceful. This means that maintenance can be scheduled in advance. With aid from built -in test circuits, performance degradations and maintenance of SSPAs and LNAs are predictable. Significantly, active PAR eliminates single point of failure in the RF front-end modules. This means that there is no need for redundancy and no need to stock spare parts at the 100% level. In addition, active PAR does not require a special cooling system because its power amplifiers are based on multiple low-power SSPAs (rather than a single high-power cooled klystron, as used in passive PAR). Thus, ambient cooling can be used in active PAR, which significantly reduces life cycle costs for the system. In active PAR, antenna elements are closely coupled with the TRMs. These are then tightly integrated with the digital beam forming circuits and modulator/demodulators. Depending upon the geometry and the number of simultaneous transmit and receive beams, the beam forming modules can be distributed in various forms. For example, it could include multiple independent beam forming circuits as shown in Figure 3-2. If the radar system requires complex beams with multiple configurations, the beam forming circuits can be expanded accordingly.
NOAA Future Weather Doppler Radar Study ______________________________________________________________________________________
NOAA Future Weather Doppler Radar Study ______________________________________________________________________________________
8THE AEROSPACE C O R P O R A T I O N
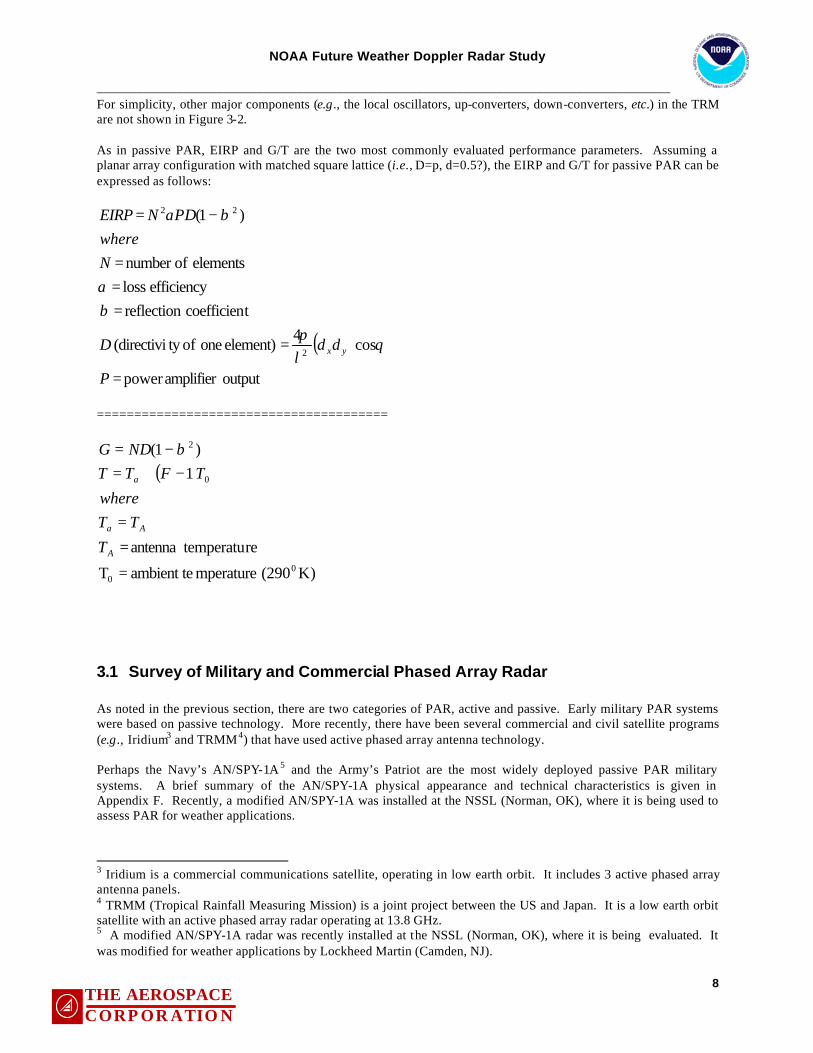
For simplicity, other major components (e.g., the local oscillators, up-converters, down-converters, etc.) in the TRM are not shown in Figure 3-2. As in passive PAR, EIRP and G/T are the two most commonly evaluated performance parameters. Assuming a planar array configuration with matched square lattice (i.e., D=p, d=0.5?), the EIRP and G/T for passive PAR can be expressed as follows:
( )outputamplifier power
cos4
element) one ofty (directivi
tcoefficien reflection efficiency loss
elements ofnumber
)1(
2
22
=
=
===
−=
P
ddD
Nwhere
PDNEIRP
yx θλπ
βα
βα
=======================================
( )
K)(290 mperatureambient te T
re temperatuantenna
1)1(
00
0
2
=
=
=
−+=−=
A
Aa
a
T
TTwhere
TFTTNDG β
3.1 Survey of Military and Commercial Phased Array Radar As noted in the previous section, there are two categories of PAR, active and passive. Early military PAR systems were based on passive technology. More recently, there have been several commercial and civil satellite programs (e.g., Iridium3 and TRMM4) that have used active phased array antenna technology. Perhaps the Navy’s AN/SPY-1A 5 and the Army’s Patriot are the most widely deployed passive PAR military systems. A brief summary of the AN/SPY-1A physical appearance and technical characteristics is given in Appendix F. Recently, a modified AN/SPY-1A was installed at the NSSL (Norman, OK), where it is being used to assess PAR for weather applications.
3 Iridium is a commercial communications satellite, operating in low earth orbit. It includes 3 active phased array antenna panels. 4 TRMM (Tropical Rainfall Measuring Mission) is a joint project between the US and Japan. It is a low earth orbit satellite with an active phased array radar operating at 13.8 GHz. 5 A modified AN/SPY-1A radar was recently installed at the NSSL (Norman, OK), where it is being evaluated. It was modified for weather applications by Lockheed Martin (Camden, NJ).
NOAA Future Weather Doppler Radar Study ______________________________________________________________________________________
9THE AEROSPACE C O R P O R A T I O N
Table 3-2 includes key functional parameters of the modified version of the AN/SPY-1A.
Table 3-1. AN/SPY-1A Passive PAR Functional Parameters
System Functions Parameters Specifications
Active/Passive PAR Passive Transmit functions See Figure 3.1 Receive functions See Figure 3.1 Signal Processing functions Block diagrams (TBD) Digital Beam Forming method Beam steering Beamwidth (deg) & beam patterns
1.5 (bore sight), 2.1 (slant +/- 45) TBD
Waveform Pulsed short (1.57 µs) and long (4.71 µs) Freq-Diversity Pol-Diversity
N/A (designed for single frequency and single polarization)
Number of beams (Tx) TBD Number of beams (Rx) TBD Remote operations, test, diagnostic, and maintenance
interface diagrams (TBD)
Local operations, test, diagnostic, and maintenance
interface diagrams (TBD)
Scaleability N/A (designed for fixed platform) Portability N/A (designed for fixed platform) Table 3-2 includes key performance parameters of the modified version of the AN/SPY-1A.
Table 3-2. AN/SPY-1A Passive PAR Performance Parameters
System Performance Parameters (unit) Specifications
Tx=Rx Freq (GHz) 3.195 Bandwidth (kHz) TBD Coverage Range (km) 460 Detection Range (km) 460 Pulse Repetition Freq (kHz) TBD EIRP (dBW) TBD G/T (dB-K) TBD Elevation coverage (deg) 0.5 to 55 (14 steps for volume scan takes less than 60s) Range resolution (m) 230 Angle accuracy (deg) TBD Settling time (ms) TBD Clutter suppression (dB) TBD Side lobe suppression (dB) TBD Rx sensitivity (dBm) TBD RF Dynamic Range (dB) TBD ADC Dynamic Range (dB) TBD Prob of detection TBD
NOAA Future Weather Doppler Radar Study ______________________________________________________________________________________
10THE AEROSPACE C O R P O R A T I O N
System Performance Parameters (unit) Specifications
Prob of false alarm TBD Availability (reliability) TBD Table 3-3 includes key design parameters of the phased array antennas of the modified version of the AN/SPY-1A.
Table 3-3. AN/SPY-1A Passive PAR Performance Parameters
Tx=Rx Freq (GHz) 3.195 Antenna Tx Gain (dBi) TBD Antenna Rx Gain (dBi) TBD Polarization Linear vertical G/T (dB-K) TBD Front to back ratio (dB) TBD Table 3-4 includes key physical parameters of the phased array antennas of the modified version of the AN/SPY-1A.
Table 3-4. AN/SPY-1A Passive PAR Physical Parameters
Number of elements/panel 4352 (68 modules, 32 elements/module) Number of Tx and Rx modules 1 Tx and 1 Rx Number of A/D and DSP TBD Panel size, volume & geometry ~40’ x 40’, ~hexagonal-like flat panel Panel weight (kg) TBD Power consumption (W) TBD Cooling method Chilled water, forced convection Altitude/Op-Temp/Op-Humidity TBD Wind loading/Vib/Shock TBD Lightening protection TBD Connectors TBD Mounting structures TBD
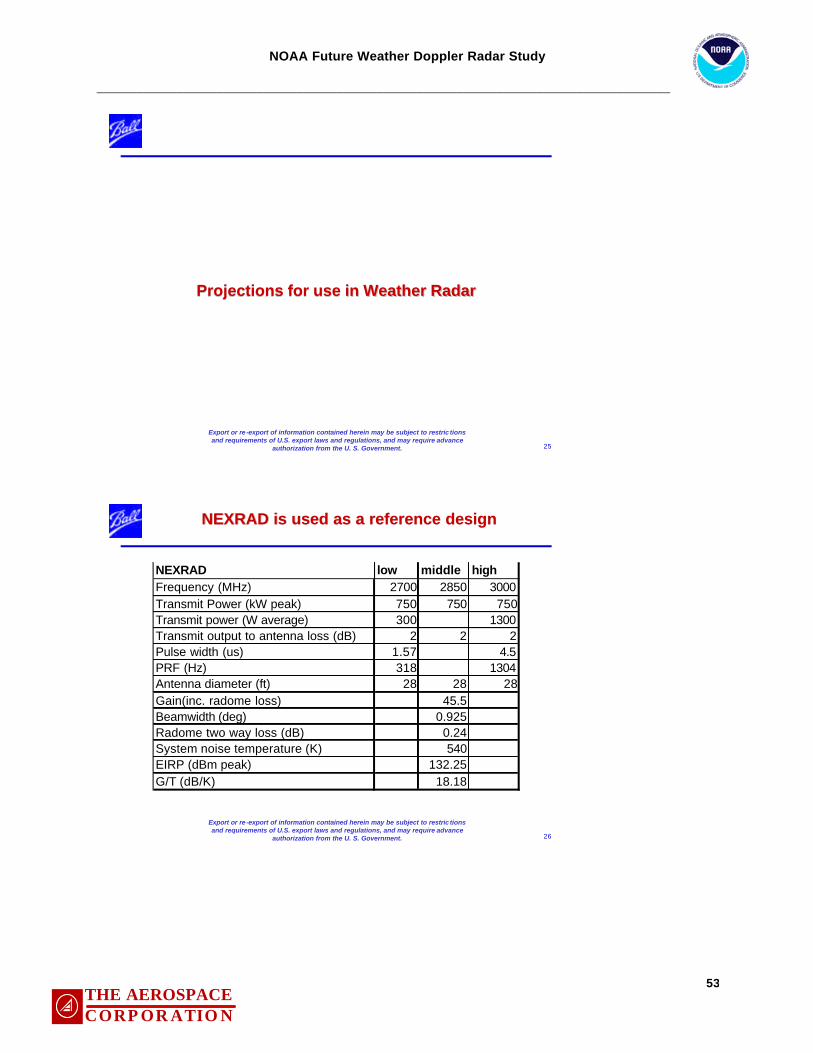
3.2 AN/SPY-1A PAR Test Results from the NSSL An AN/SPY-1A PAR was recently installed at the NSSL. This radar is currently being tested and evaluated for weather applications. Table 3-5 includes NEXRAD Doppler radar specifications. To verify the AN/SPY-1A performance, it is necessary to compare its specifications with those for NEXRAD where applicable and possible. Of course, the NEXRAD and the AN/SPY-1A are different systems that were designed for different purposes. The AN/SPY-1A was designed to detect and track multiple small hard targets moving with high velocity. The present intent is not to make a line-by-line specification comparison, but to assess the general capabilities of the AN/SPY-1A for weather applications. A logical approach is to compare the key parameters of the AN/SPY-1A with those of NEXRAD that may measure
NOAA Future Weather Doppler Radar Study ______________________________________________________________________________________
11THE AEROSPACE C O R P O R A T I O N
PAR suitability for future weather applications. For example, multiple beams for tracking multiple weather targets and conditions (e.g., large amorphous targets with both slow and fast velocities), range resolutions, pointing accuracies, settling time, etc.
Table 3-5. Performance Comparisons6
Parameters Values (SPY-1A) Values (NEXRAD) Detection Range Reflectivity (km) 460 km 460 (~248 NM) Velocity (km) 460 km 230 (~124 NM) Angular Coverage Azimuth (deg) 360 or a fixed sector Full circle or sector Elevation (deg) 0.5 to 55 -1 to +20 Antenna Type Passive Phased Array, S-band,
4352 elements and phase shifters S-band, center fed, parabolic dish
Reflector aperture NA 8.54 m (28 ft) diameter, circular
Polarization Linear, Vertical Linear, Horizontal 1st side lobe level -29 dB Steerability (deg) 360 az, -1 to +45 el Mechanical limits (deg) NA -1 to +60 El Rotational rate (deg/s) NA 30 Az rotational rate (deg/s) NA 36 Angular acceleration (deg/s²) NA 15 Pointing accuracy (deg) NA ± 0.2 Radome Type Fiberglass skin, form sandwich Fiberglass skin, form
sandwich Diameter TBD 11.89 m (39 ft) RF loss, two-way (dB) TBD 0.3 ± 0.06 dB
over 2.7 to 3.0 GHz Transmitter Type Master Osc power amp Master Osc power amp Frequency (GHz) 3.195 2.7 to 3.0 Peak power output (kW) 600 750 Average power output (kW) 1.56 Pulse width nominal (us) 1.57 (short pulse)
RF duty cycle (max) 800 µs 0.002 Range sample (m) 15 250 Number of simultaneous Tx beams 1 NA
6 Data shown in Table 3.5 are obtained from the NSSL in January 2004.
NOAA Future Weather Doppler Radar Study ______________________________________________________________________________________
12THE AEROSPACE C O R P O R A T I O N
Parameters Values (SPY-1A) Values (NEXRAD) Pulse repetition frequency Long pulse (Hz) TBD 322 to 422 ( ± 1.7%) Short pulse (Hz) TBD 322 to 1282 ( ± 1.7%) Waveform TBD Contiguous and batch Receiver Type Linear Linear Frequency (GHz) 3.195 2.7 to 3.0 3 dB bandwidth (MHz) TBD 0.63 (short pulse)
0.22 (long pulse) Phase control TBD Selectable Rx channels output Linear I/Q Linear I/Q, log Dynamic range (dB) TBD 95 max, 93 @ 1 dB
compression Rx sensitivity (dBm) TBD -113 Noise temp (deg K) TBD 450 IF (MHz) TBD 57.6 Sampling rate (kHz) 10000, 5000, 2500 600 Number of simultaneous Rx beams 1 NA Signal Processor Type SKY, 5 boards , each with 4 power
PCs Hardwired/programmable
Derived parameters Reflectivity, mean radial velocity, Doppler spectral width
Reflectivity, mean radial velocity, Doppler spectral width
Accuracy Reflectivity (dB) TBD < 1 Velocity and spectrum width (m/s) TBD < 1 Number of pulses averaged Reflectivity Selectable 6 to 64 Velocity and spectrum width Selectable 40 to 200 Range resolution Reflectivity (km) 0.23 1 Velocity and spectrum width (km) 0.23 0.25 Azimuth resolution Reflectivity (deg) Variable 1 Velocity and spectrum width (deg) Variable 1 Clutter suppression (dB) TBD 30 to 50 Notch filter half width (m/s) TBD 0.5 to 4 Loss efficiency TBD Directivity of one element TBD
NOAA Future Weather Doppler Radar Study ______________________________________________________________________________________
13THE AEROSPACE C O R P O R A T I O N
3.3 AN/SPY-1A PAR Lessons Learned from the NSSL Test Bed NSSL testing of an AN/SPY-1A PAR is currently underway. It is anticipated that more extensive data comparisons with NEXRAD data will occur in the near future. From the weather radar systems engineering perspective, it is good to have a higher G/T; however, a higher EIRP is not needed, because long-range detection of incoming missiles is obviously not a weather service issue. Desirable weather PAR attributes are listed below in random order of importance:
• High-agile clutter rejection ratio and high side-band suppression ratio. • High dynamic range with adequate receiver sensitivity. • No moving parts, heavy-duty RF plumbing or cooling. • No components that are prone to be single-point-failures. • Multiple transmit-receive beams (simu ltaneous) with independent beam forming capabilities. • On-the-fly beam width control for each beam (varying degrees from narrow to wide). • Fast beam scanning and settling time capabilities, with higher range and angle resolutions. • On-the-fly frequency, waveform, and polarization diversities. • Control the sampling rate and do I/Q sampling at IF rather than at base band. • Real time signature processing algorithms that will perform statistical correlation between models and
detected weather phenomena (e.g., wind velocity, moisture density, pressure and temperature). • Networked radar stations allowing data from different stations to be simultaneously analyzed at central or
regional control centers. • Micro-radar platforms (small scale radar sites) sandwiched between macro radar platforms (large scale
radar sites, similar to the current NEXRAD sites) to optimize data collection granularity. • Mobile radar platforms to support quick deployment at changing, high-need areas.
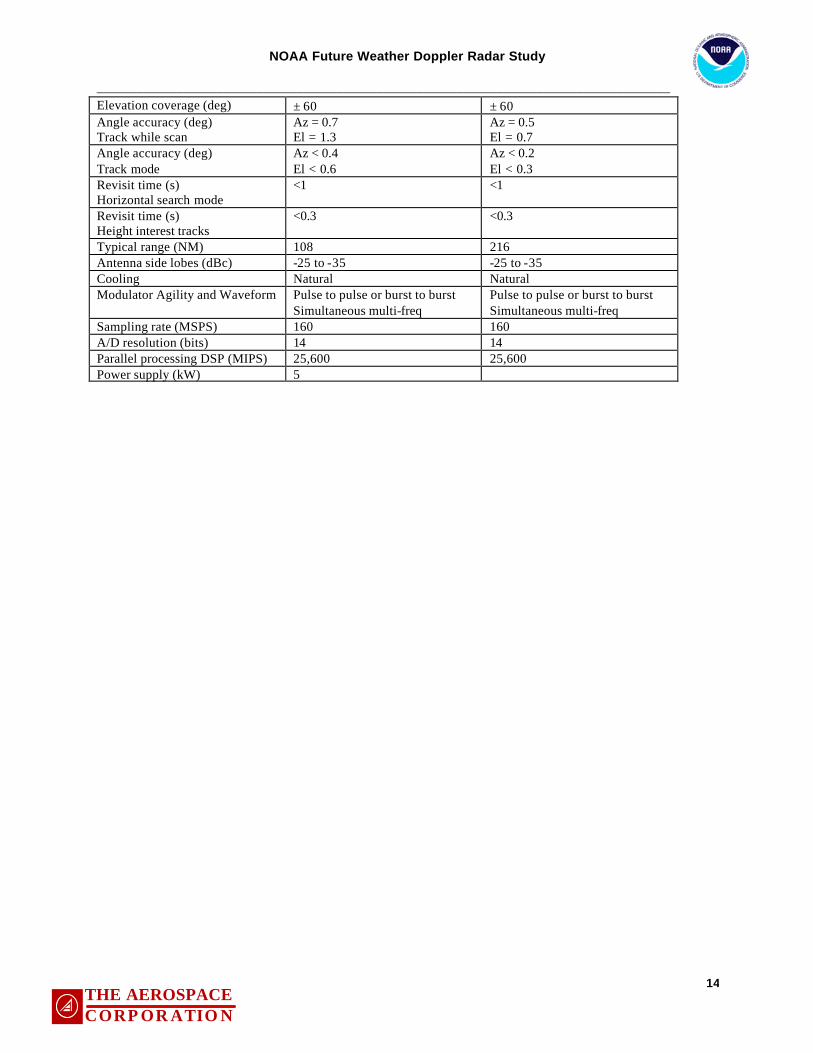
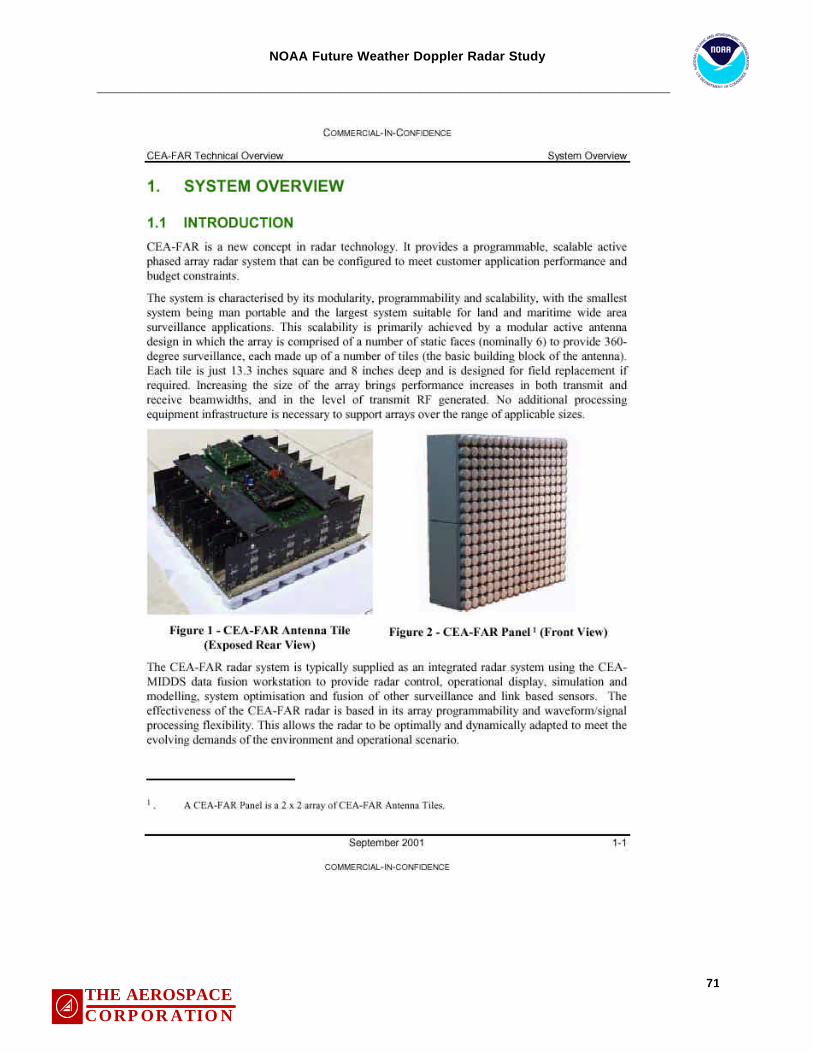
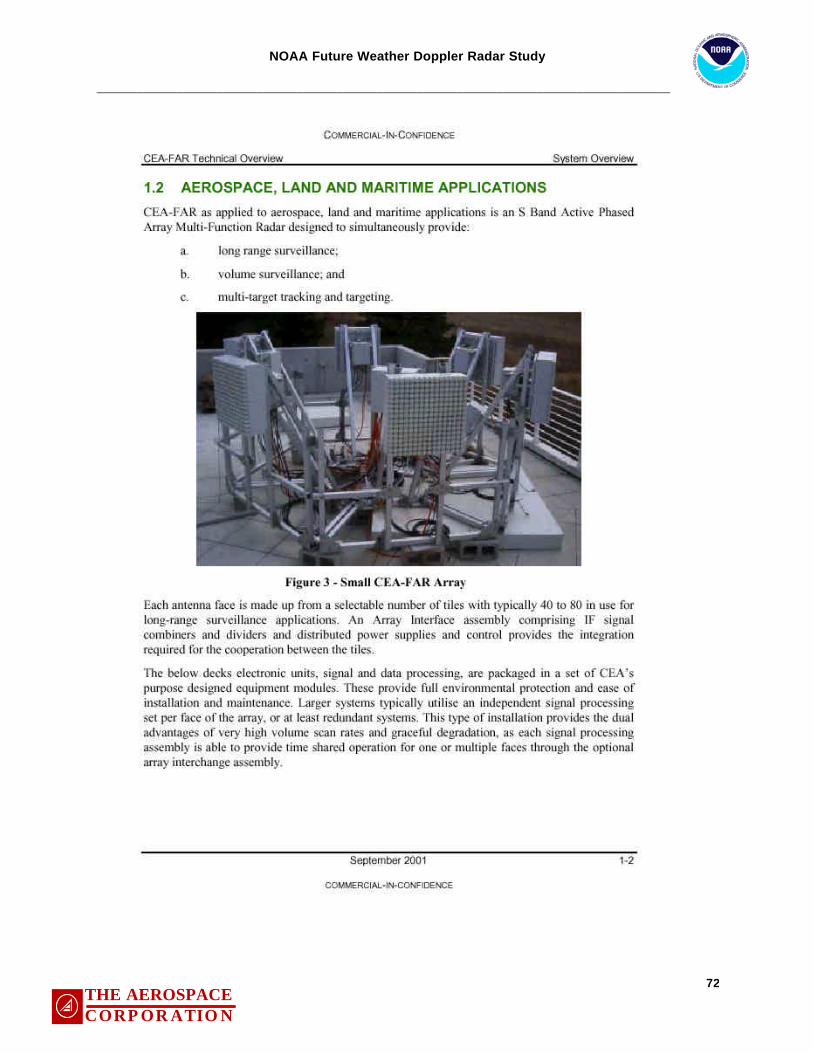
3.4 CEA-FAR The CEA -FAR was originally designed for the Australian Navy. CEA technologies later converted this product for commercial markets. It includes modularized panels, TRMs and DSPs, which allow scaleable integration of the radar. Table 3-6 includes key performance parameters. It is based on an active PAR that requires no wave-guide and includes GaAs MMIC phase shifters with large scale FPGA and high speed DSPs (1600 MIPS). Appendix C includes a technical overview of the CEA -FAR.
Table 3-6. Key Performance of CEA-FAR
Parameters (unit) Area Surveillance System Full Capability System Tx/Rx frequenncy L, S, or X band L, S, or X band Bandwidth (MHz) > 400 > 400 Panel height (m) 1.35 2.7 Panel width (m) 2.7 3.4 Antenna weight per panel (kg) <400 <800 # of elements per panel 64 64 Signal processing modules 2 6 Detection range (km) 40 against small missile targets
(waveform and scan dependent) 70 against small missile targets (waveform and scan dependent)
Clutter rejection (dB) 45 to 65 (waveform dependent) 45 to 65 (waveform dependent)
NOAA Future Weather Doppler Radar Study ______________________________________________________________________________________
Typical range (NM) 108 216 Antenna side lobes (dBc) -25 to -35 -25 to -35 Cooling Natural Natural Modulator Agility and Waveform Pulse to pulse or burst to burst
Simultaneous multi-freq Pulse to pulse or burst to burst Simultaneous multi-freq
NOAA Future Weather Doppler Radar Study ______________________________________________________________________________________
15THE AEROSPACE C O R P O R A T I O N
3.5 Summary of Current Phased Array Radar This quick-look study has exa mined both military and commercial versions of phased array radar. Some performance comparisons between the AN/SPY-1A and NEXRAD are also provided. It is too early to make total system performance comparisons (due to the limited test data from the NSSL). However, it is reasonable to state that active PAR with adaptive beam forming algorithms, frequency diversity, polarization diversity and waveform diversity will provide significant improvements in predicting severe weather conditions. These advantages should be especially important for tornado prediction. Section 5 will consider how active PAR technology might be implemented for future weather Doppler radar applications.
4. Weather Physics
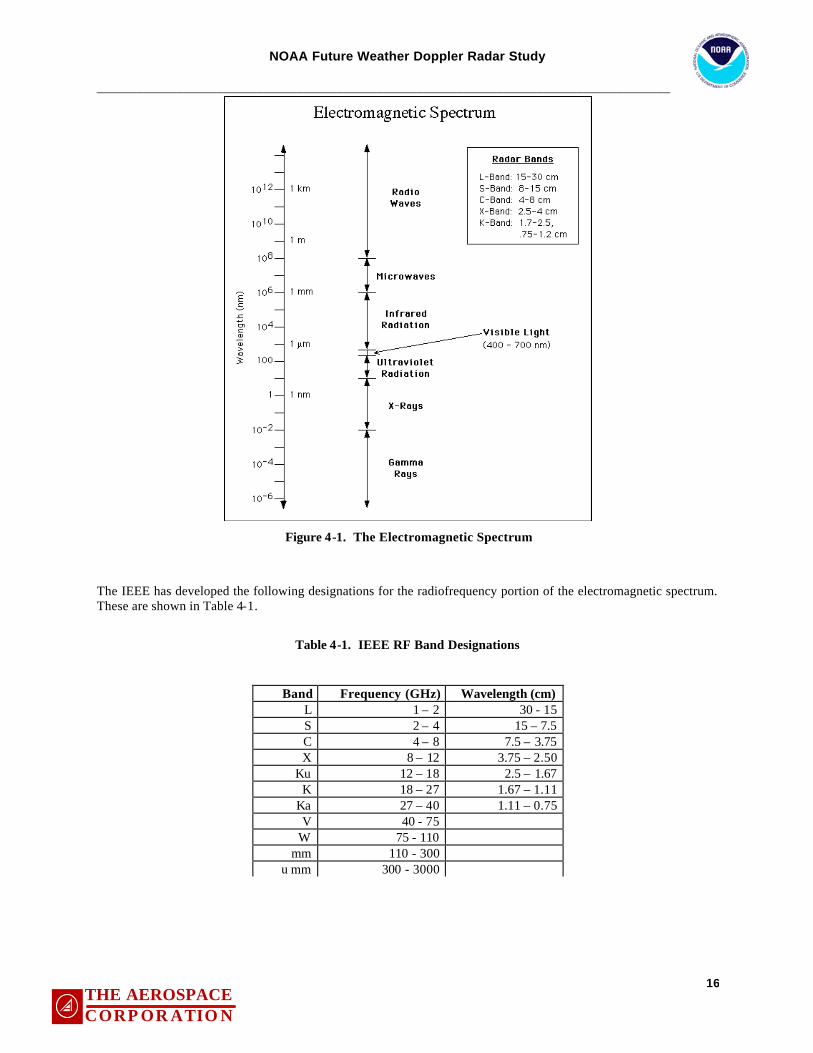
4.1 Weather and Radar This section is intended to provide a succinct discussion of the fundamental physical principles that underlie practical weather radar. Its purpose is to show in general terms why radar systems designed for weather monitoring assume the technical characteristics that embody today’s systems, and whether such characteristics lend themselves to future advances that may provide greater performance and lower costs. One may ask why radar is so useful for probing the state of the atmosphere. When examined in the most fundamental terms, radar consists of the generation and manipulation of photons whose frequencies interact very weakly with gas-phase atmospheric molecules, but reflect strongly from airborne macroscopic constituents. Stated differently, radio frequencies are not appreciably absorbed by aerosols, major gases of the atmosphere (78% N2 and 21% O2) or the remaining 1% of various trace gases (mostly H2O and CO2). Molecular transitions that absorb photons commonly occur in the high frequency spectral region, where photon wavelengths are in the 1 x 10⁻⁶ m range. Photons of much lower energy (wavelengths in the 0.01 to 0.3 m range) do not strongly interact with molecular electronic states, and hence are chosen for probing atmospheric properties.
NOAA Future Weather Doppler Radar Study ______________________________________________________________________________________
16THE AEROSPACE C O R P O R A T I O N
Figure 4-1. The Electromagnetic Spectrum
The IEEE has developed the following designations for the radiofrequency portion of the electromagnetic spectrum. These are shown in Table 4-1.
Table 4-1. IEEE RF Band Designations
Band Frequency (GHz) Wavelength (cm) L 1 – 2 30 - 15 S 2 – 4 15 – 7.5 C 4 – 8 7.5 – 3.75 X 8 – 12 3.75 – 2.50
Ku 12 – 18 2.5 – 1.67 K 18 – 27 1.67 – 1.11
Ka 27 – 40 1.11 – 0.75 V 40 - 75
W 75 - 110 mm 110 - 300
u mm 300 - 3000
NOAA Future Weather Doppler Radar Study ______________________________________________________________________________________
17THE AEROSPACE C O R P O R A T I O N
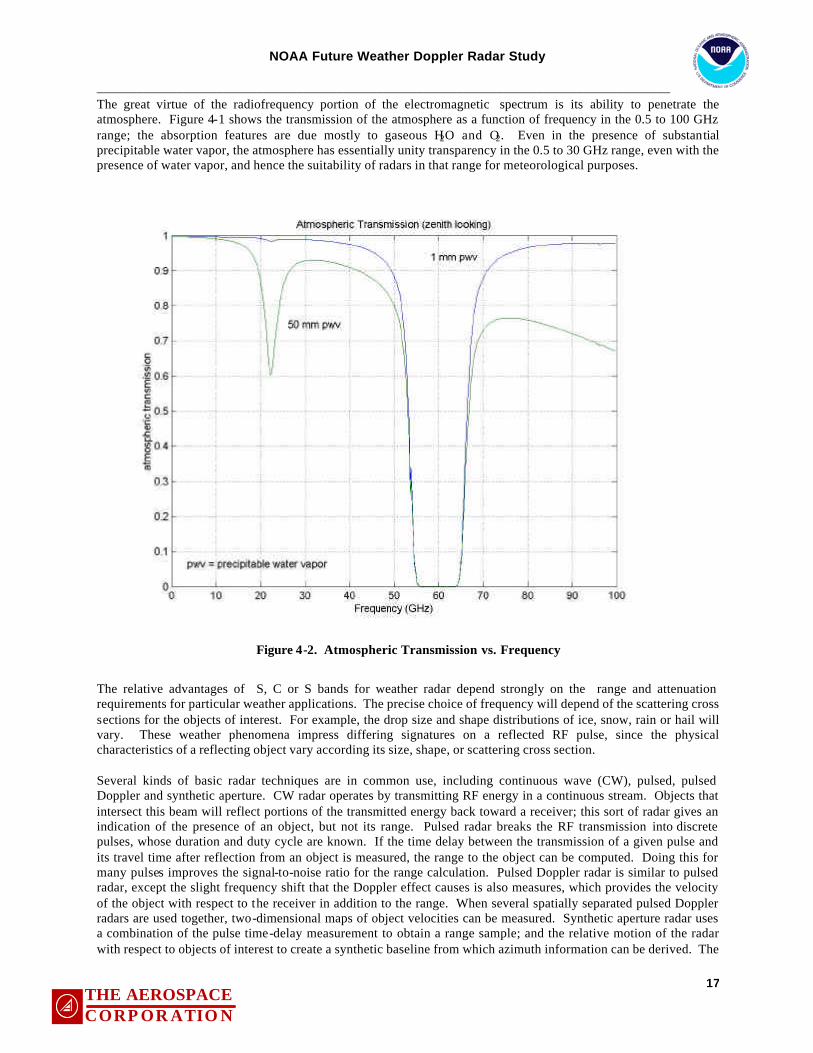
The great virtue of the radiofrequency portion of the electromagnetic spectrum is its ability to penetrate the atmosphere. Figure 4-1 shows the transmission of the atmosphere as a function of frequency in the 0.5 to 100 GHz range; the absorption features are due mostly to gaseous H2O and O2. Even in the presence of substantial precipitable water vapor, the atmosphere has essentially unity transparency in the 0.5 to 30 GHz range, even with the presence of water vapor, and hence the suitability of radars in that range for meteorological purposes.
Figure 4-2. Atmospheric Transmission vs. Frequency
The relative advantages of S, C or S bands for weather radar depend strongly on the range and attenuation requirements for particular weather applications. The precise choice of frequency will depend of the scattering cross sections for the objects of interest. For example, the drop size and shape distributions of ice, snow, rain or hail will vary. These weather phenomena impress differing signatures on a reflected RF pulse, since the physical characteristics of a reflecting object vary according its size, shape, or scattering cross section. Several kinds of basic radar techniques are in common use, including continuous wave (CW), pulsed, pulsed Doppler and synthetic aperture. CW radar operates by transmitting RF energy in a continuous stream. Objects that intersect this beam will reflect portions of the transmitted energy back toward a receiver; this sort of radar gives an indication of the presence of an object, but not its range. Pulsed radar breaks the RF transmission into discrete pulses, whose duration and duty cycle are known. If the time delay between the transmission of a given pulse and its travel time after reflection from an object is measured, the range to the object can be computed. Doing this for many pulses improves the signal-to-noise ratio for the range calculation. Pulsed Doppler radar is similar to pulsed radar, except the slight frequency shift that the Doppler effect causes is also measures, which provides the velocity of the object with respect to the receiver in addition to the range. When several spatially separated pulsed Doppler radars are used together, two-dimensional maps of object velocities can be measured. Synthetic aperture radar uses a combination of the pulse time-delay measurement to obtain a range sample; and the relative motion of the radar with respect to objects of interest to create a synthetic baseline from which azimuth information can be derived. The
NOAA Future Weather Doppler Radar Study ______________________________________________________________________________________
18THE AEROSPACE C O R P O R A T I O N
combination of range and azimuth data are then synthesized mathematically to produce a two dimensional image of a scene. There are numerous variants on the basic radar techniques just mentioned. However, this study is concerned with PAR, and how it compares with pulsed Doppler radar,1,2 which is the technique used by NEXRAD (and most other weather radars). Pulsed Doppler radar in the S band regime is of value because of its ability to map out reflectivity and velocity within regions that are enshrouded by storm clouds. However, producing a three-dimensional representation of a storm requires about 2 to 5 minutes of time, with the time limit basically defined by the need to physically move the radar antenna and the need to transmit and receive enough radar pulses to achieve an adequate signal-to-noise ratio. Severe weather phenomena obviously can change very rapidly during a 2 to 5 minute interval, which illustrates the need to achieve rapid spatial pointing and high data rates. Of course, the intrinsic inertia associated with mechanical Doppler radar antennas is completely eliminated by electronic steering, and is a major potential advance for weather radar sensing. The physical means by which a radar transmitter directs a series of pulses toward a target, and by which the receiver detects very weak energy from reflected pulses, greatly influences how effectively a given radar sensing technique can be implemented. For example, the need to physically move the transmit/receive antenna imposes fundamental limitations on the speed with which data can be collected. Mechanical structures associated with weather radars must usually be both rugged and heavy, since they must survive stressful environments and also not be prohibitively expensive. Although electronic switching and computing may occur on time scales in the nanosecond (10-9) range, the movement and reaction of massive antennas occurs in timeframes greater than 1 millisecond (> 10-3 s). It can be seen that important performance limiting factors for weather radars are linked to fundamental characteristics of the currently imp lemented pulsed Doppler radar technology, namely mechanically-steered systems. Phased array radar systems avoid some fundamental limitations and performance bottlenecks of mechanically steered radars. This is done by mounting many small transmit / receive elements on flat or curved surfaces. A computer then controls the firing of specific transmitters and the reception of return signals by specific receivers. Control of the phase relationship (i.e., the slight time variation between the operation of groups of transmitter elements and groups of receiver elements) permits extraordinarily rapid operation of the antenna. The shape and direction of the transmit beams can be rapidly altered, and the array antenna can be adaptively operated to null out interference from RF noise sources or intentional jamming. These characteristics are of obvious importance for military and intelligence systems. The more recent use of array antennas for commercial systems reflects the changing markets and costs for phased array technology. As is true of any sensor system, the characteristics of the sensor must be designed to measure the physical observables that directly or indirectly provide information that is useful in a “real world” context. For example, a Doppler radar system is capable of measuring small differences between the frequency of a transmitted RF pulse and the frequency of the reflected pulse. These frequency shifts are used to derive quantities that describe the state of the atmosphere. In the case of Doppler radar, the frequency difference and its sign provide a measure of wind velocity and wind direction. The energy of the reflected pulses can be used to compute the spatial extent of precipitation, and observing the variation of reflected pulse energy as a function of frequency can provide a measure of the kind of precipitation that is present. Suppose a radar transmitter emits a pulse of frequency fo (corresponding to a wavelength λ), and suppose the pulse travels outward, is reflected from some object (such as rain or hail) at a range r from the radar, propagates back toward the radar and is collected by a receiver. The total traversed distance 2r measured in terms of wavelength is 2r/λ or, 2π(2r/ λ) = 4πr/λ radians. If the transmitted wave has an init ial phase of φo then the phase after it returns will be φ = φo + 4πr/λ The change of phase as a function of time is then dφ/dt = (4π/λ) dr/dt
NOAA Future Weather Doppler Radar Study ______________________________________________________________________________________
19THE AEROSPACE C O R P O R A T I O N
where dr/dt is the target radial velocity v and the quantity dφ/dt is the target angular frequency 2πfd. Substitution gives, fd = 2v/λ where fd is Doppler shift frequency of the target. At the center of the S band (3 GHz), an object heading radially toward (or away) from a radar at 40 mph (about 18 m/s) would have a Doppler shift of only about 180 Hz. A puls ed Doppler radar corresponds discrete time and space sampling of the target medium, where time corresponds to the pulse repetition time (PRT) and space to the sample volume depth of the radar. Thus the maximum unambiguous, rmax, the maximum range to which a transmitted pulse wave can travel and return to the radar before the next pulse is transmitted, is: rmax = c PRT/2 or rmax = c 1/2(1/PRF) where c is the speed of light and PRF is the pulse repetition frequency of the transmitted pulse train. Samling at the radar PRT interval also limits the maximum frequency that can be resolved. The rigor for this is given by the Nyquist Sampling Theorem, which simply states that the sampling rate PRF must be at least twice the rate of the maximum unambiguous Doppler frequency fmax, i.e., fmax = PRF/2 that corresponds to a maximum Doppler velocity of vmax = (PRF) λ/4 . Combining the maximum range and velocity gives rmax vmax = cλ/8 This shows that one has to compromise between rmax and vmax for a given radar. There are, however, some advanced techniques such as staggered PRT, phase coding, etc., that allows for an increased vmax without compromising rmax up to a certain limit. A pulsed Doppler radar emits a train of intense microwave pulses that leave the antenna in essentially a collimated beam. In the absence of attenuation, the incident power density Si on a target at range r and direction θ,φ is given by
Si(r,θ,φ) = Pt g t f2(θ,φ) / ( 4π r2 )
Where f2(θ,φ) is the normalized power gain (defined as unity along the beam axis), gt is the antenna gain, and Pt is the power delivered to the antenna’s waveguide port. Transmitted pulses are reflected and backscattered by atmospheric phenomena of interest (snow, hail, water drops, etc.) or clutter (birds, airplanes, etc.). The scattering cross section σ b is an apparent area that intercepts a power σ b Si which, if radiates isotropically, produces at the receiver a power density
Sr = Si σ b / ( 4π r2 ) equal to that scattered by the actual hydrometeor. Mie theory3 provides a general solution for the scattering of a plane wave by a sphere. At non-attenuating wavelengths, i.e. for scatterers with radii much smaller than the radar wavelength, a more involved Mie solution can be approximated by: σi = (π5/λ4) |K|2 Di
6
NOAA Future Weather Doppler Radar Study ______________________________________________________________________________________
20THE AEROSPACE C O R P O R A T I O N
known as Rayleigh approximation. σi is backscattering cross section of individual scatterers with diameter Di and K = (m2-1)/(m2 +2) where m is the complex index of refraction. Knowing σi, the total backscattered power received at the antenna for Rayleigh scattering is 1:
2
2
r
ZKCPr =
where C is a radar constant and Z is radar reflectivity factor that can be calculated from:
∫∞
=0
6 )( dDDNDZ
where N(D) is drop size distribution and N(D)dD gives the number of particles per unit volume with diameters between D and D+dD. For a wide range of rain and snow one can write N(D) as a two parameter drop size distribution as:
DeNDN Λ−= 0)(
In the same way that Z can be re lated to drop size distribution, other parameters of interest such as precipitation rate, R, and liquid water content, W, are also related to drop size distribution. Therefore, under certain conditions a unique relationship between Z and R can generally expressed as: Z = aRb There is a fundamental trade-off between area coverage for velocity (requires more spatial separation) and greater spatial resolution (requires greater sensor density). It is important to note that microbursts and divergent flows require spatial resolutions in 100 m range. This has been a special area of concern for air traffic, since most hazardous shears for flight are within few 100 m of surface. If small-scale diverging flows are to be detected, only high angular resolution ( <= 1 deg) radars will suffice. Wind shear has very short time scale (microbursts in the 5-15 minute range, with severe wind shear in the 2-4 minute range and average velocity difference of only 25 m/s across the divergent flow. It is significant that small-scale (but highly dangerous) phenomena are sometimes buried in larger-scale (and longer lived) mesocyclones, gust fronts, etc. Microburst prediction is an extremely significant requirement for modern severe weather warning systems. Practical experience has identified several microburst indicators that can be observed with Doppler radar.4 These are:
• A descending high reflectivity core.
• A mid-level velocity convergence within and near the cloud base.
• A reflectivity notch and rotation
• Divergent winds near the surface. The first two indicators occur before the advent of microburst winds; the presence of a reflectivity notch and rotation are good predictors only if the first two phenomena are observed; the fourth effect occurs during the microburst event.
NOAA Future Weather Doppler Radar Study ______________________________________________________________________________________
21THE AEROSPACE C O R P O R A T I O N
4.2 Improving Tornado Detections and Warnings with Weather Radars A tornado is a violently rotating column of air extending from a thunderstorm to the ground. These destructive forces of nature are found most frequently in the United States east of the Rocky Mountains during the spring and summer months. In an average year, 800 tornadoes are reported nationwide, resulting in 80 deaths and over 1,500 injuries. Based on their shapes and sizes tornadoes are grouped into three categories:
1. Weak Tornadoes (F0-F1 on the Fujita scale) with winds less than 110 mph and lifetime of 1-10+ minutes constitute about 69% of all tornadoes and responsible for less than 5% of tornado annual deaths.
2. Strong Tornadoes (F2-F3) with 110-205 mph winds that may last 20 minutes or longer. These tornadoes
constitute about 29% of all tornadoes and causes nearly 30% of tornado annual deaths. 3. Violent Tornadoes (F4-F5) with greater than 205 mph winds that can last for more than 1 hour. Only 2% of
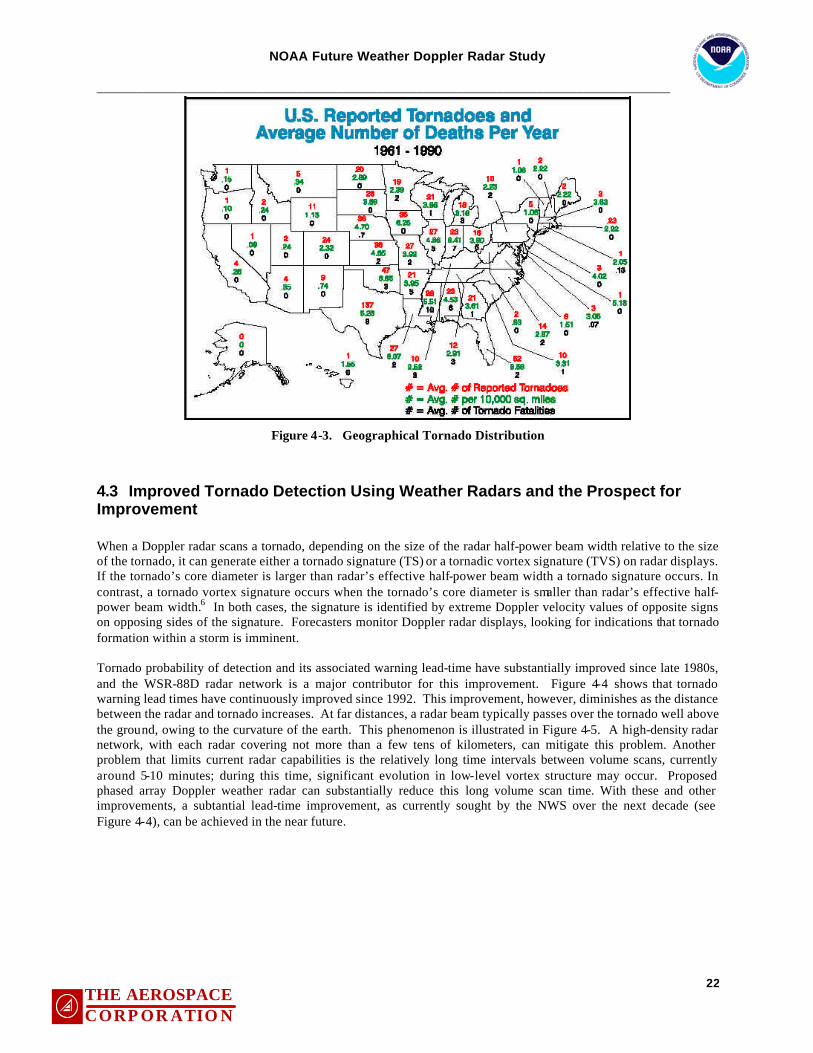
all tornadoes fall into this category but they cause about 70% of all tornado deaths in the country. Figure 4-2 shows the total number of tornadoes and the corresponding number of deaths between the years 1961 and 1993. To accurately establish the risk posed by tornadoes, it is important to know the frequency and location of tornado occurrences. Figure 4-3 depicts geographical distribution of tornado related statistics across the country.
Figure 4-2. Tornado Statistics5
NOAA Future Weather Doppler Radar Study ______________________________________________________________________________________
22THE AEROSPACE C O R P O R A T I O N
Figure 4-3. Geographical Tornado Distribution
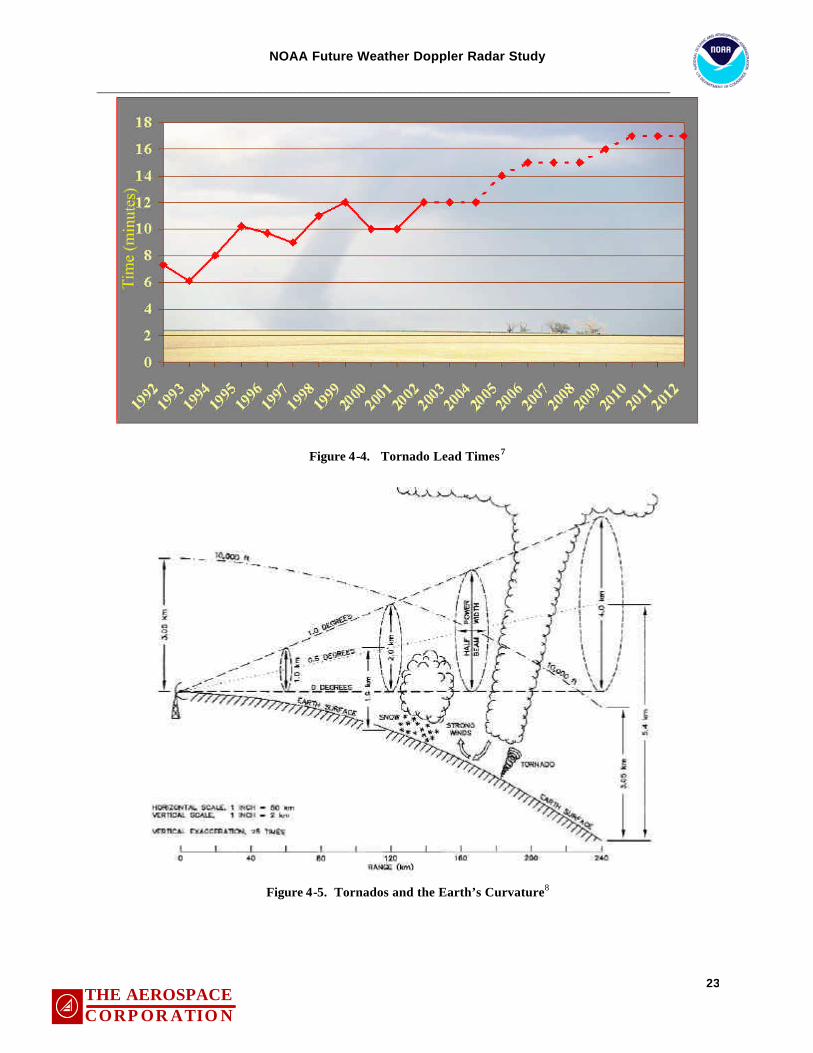
4.3 Improved Tornado Detection Using Weather Radars and the Prospect for Improvement When a Doppler radar scans a tornado, depending on the size of the radar half-power beam width relative to the size of the tornado, it can generate either a tornado signature (TS) or a tornadic vortex signature (TVS) on radar displays. If the tornado’s core diameter is larger than radar’s effective half-power beam width a tornado signature occurs. In contrast, a tornado vortex signature occurs when the tornado’s core diameter is smaller than radar’s effective half-power beam width.6 In both cases, the signature is identified by extreme Doppler velocity values of opposite signs on opposing sides of the signature. Forecasters monitor Doppler radar displays, looking for indications that tornado formation within a storm is imminent. Tornado probability of detection and its associated warning lead-time have substantially improved since late 1980s, and the WSR-88D radar network is a major contributor for this improvement. Figure 4-4 shows that tornado warning lead times have continuously improved since 1992. This improvement, however, diminishes as the distance between the radar and tornado increases. At far distances, a radar beam typically passes over the tornado well above the ground, owing to the curvature of the earth. This phenomenon is illustrated in Figure 4-5. A high-density radar network, with each radar covering not more than a few tens of kilometers, can mitigate this problem. Another problem that limits current radar capabilities is the relatively long time intervals between volume scans, currently around 5-10 minutes; during this time, significant evolution in low-level vortex structure may occur. Proposed phased array Doppler weather radar can substantially reduce this long volume scan time. With these and other improvements, a subtantial lead-time improvement, as currently sought by the NWS over the next decade (see Figure 4-4), can be achieved in the near future.
NOAA Future Weather Doppler Radar Study ______________________________________________________________________________________
23THE AEROSPACE C O R P O R A T I O N
Figure 4-4. Tornado Lead Times7
Figure 4-5. Tornados and the Earth’s Curvature8
NOAA Future Weather Doppler Radar Study ______________________________________________________________________________________
24THE AEROSPACE C O R P O R A T I O N
5. Future Weather Radar
5.1 Active PAR Parameter Calculations As discussed above, the scope of this quick-look effort has been limited to a feasibility study of the RF front-end infrastructure for future radar systems. Some of the items omitted from this effort are algorithm development of signal/image processing and modeling efforts. These will be critical for the real time analysis and correlation that will tie observables to weather phenomena. There are three fundamental parameter values that will dominate the upper bound of performance and cost issues. They are:
• Transmit -Receive Frequency • EIRP • G/T
The FCC and military spectrum allocations in most radar systems include the L, S, C and X-bands.7 The L-band and C-band spectra are very crowded today. Most terrestrial wireless telecommunications systems and GPS systems use the L-band spectrum, and most commercial satellite communications systems use the C-band spectrum. S-band is frequently used by satellite systems for telemetry and commanding. This leaves a choice between S-band and X-band. Securing frequency allocation is a significant task that needs to be performed before the specifications of a future active phased array Doppler weather system are defined. S-band is the frequency range of choice because it is not susceptible to rain attenuation,8 and requires inexpensive components to design transmit/receive modules. Budgeting adequate EIRP is critical in radar systems because it determines the detection range capability and the RF subsystem cost. The current NEXRAD EIRP is 102.78 dBW (klystron running at peak power, and the frequency at mid S-band), which provides a reflectivity detection range up to 460 km. Assuming the peak to average ratio of 7 dB, the average EIRP is 95.78 dBW. Computing the detection range for an S-band PAR is useful for understanding how system requirements must be defined for a future system. The following calculations provide some estimates: The path loss in free space is defined as:
kmin distanceGHzin frequency
)log(20)log(2045.92
==
++=
df
dfL fs
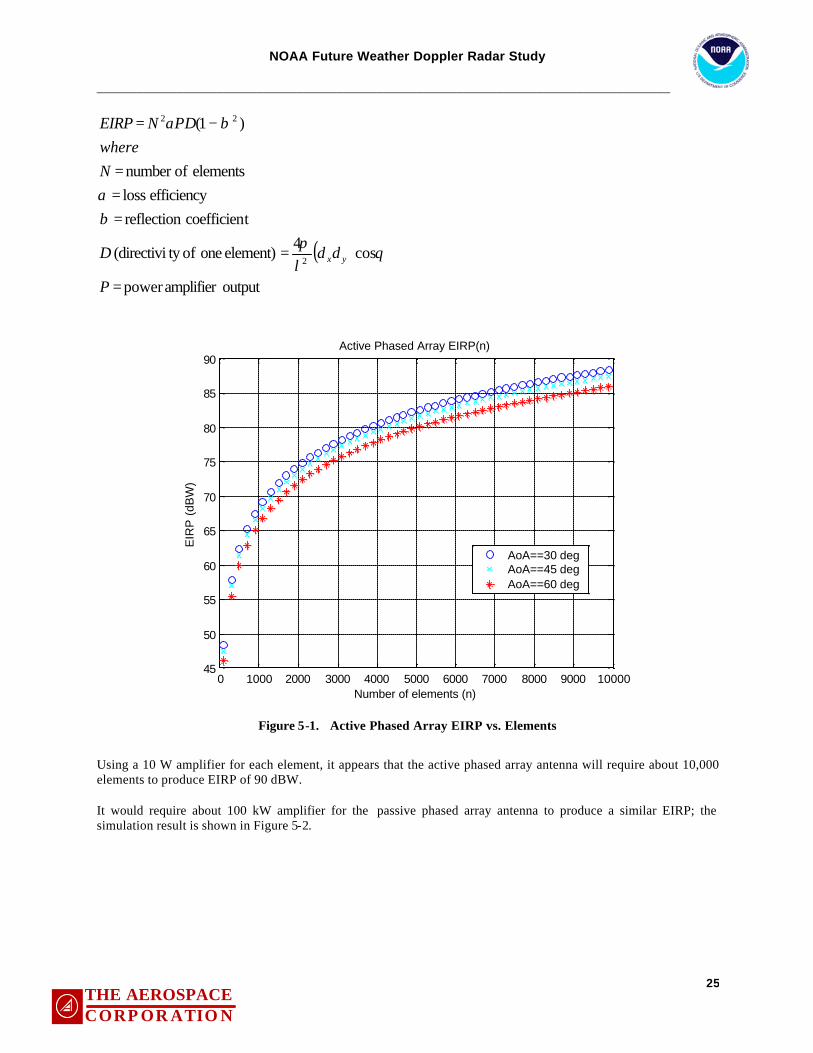
This equation says that, holding the frequency as a constant variable, the path loss in free space is 20 dB per decade of range. Starting with an EIRP value of 6 dB below the average EIRP of NEXRAD will reduce coverage range by one-half; the starting EIRP is then 89.78 dBW. This may not provide a sufficient coverage, but will provide a rough estimate for sizing the antenna panel and the required number of elements per panel. Using this EIRP, the number of elements required for the active and passive phased array can be simulated, which in turn provides a rough cost estimate that can be tied back to detection range requirements. Figure 5-1 shows the simulation results that will produce about 90 dBW of EIRP using an active phased array antenna (assuming F = 3 GHz, and P = 10W per amplifier). Note that the factor α, which lies between 0 and 1, simply estimates the overall system efficiency (a theoretically perfect system would have α = 1).
7 See Figure 4-1 and Table 4-1 for definitions of these bands. 8 See Figure 4-2.
NOAA Future Weather Doppler Radar Study ______________________________________________________________________________________
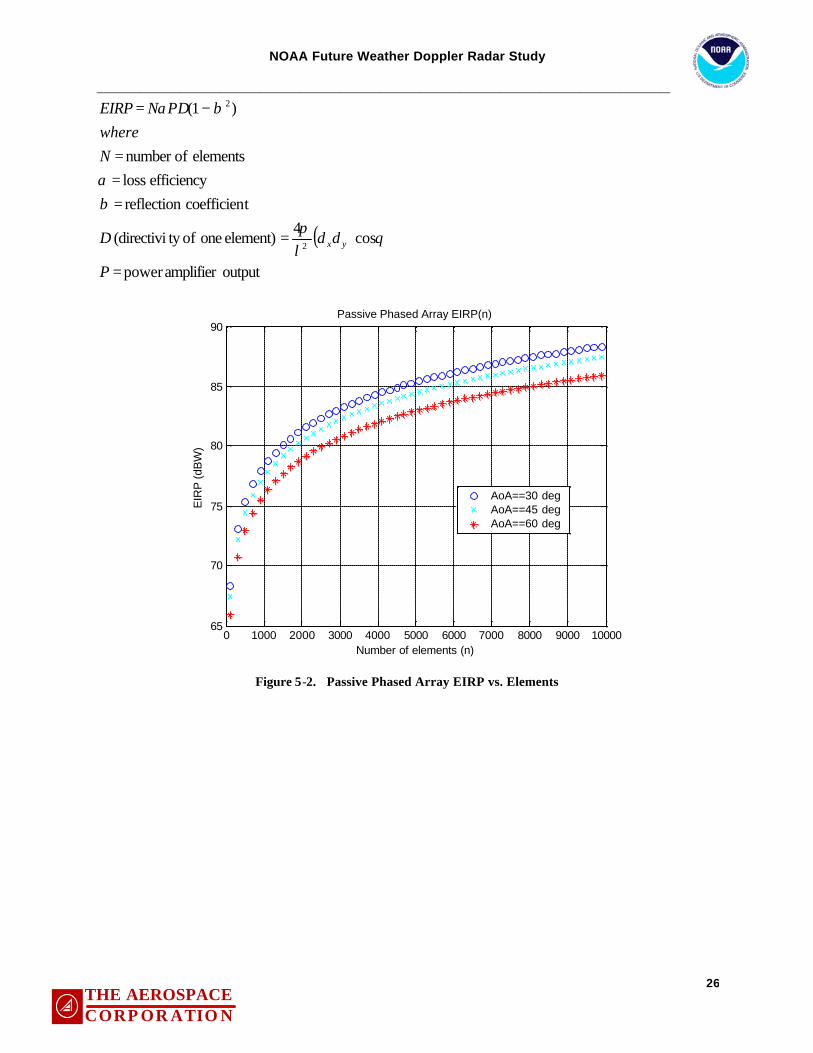
Using a 10 W amplifier for each element, it appears that the active phased array antenna will require about 10,000 elements to produce EIRP of 90 dBW. It would require about 100 kW amplifier for the passive phased array antenna to produce a similar EIRP; the simulation result is shown in Figure 5-2.
NOAA Future Weather Doppler Radar Study ______________________________________________________________________________________
Figure 5-2. Passive Phased Array EIRP vs. Elements
NOAA Future Weather Doppler Radar Study ______________________________________________________________________________________
27THE AEROSPACE C O R P O R A T I O N
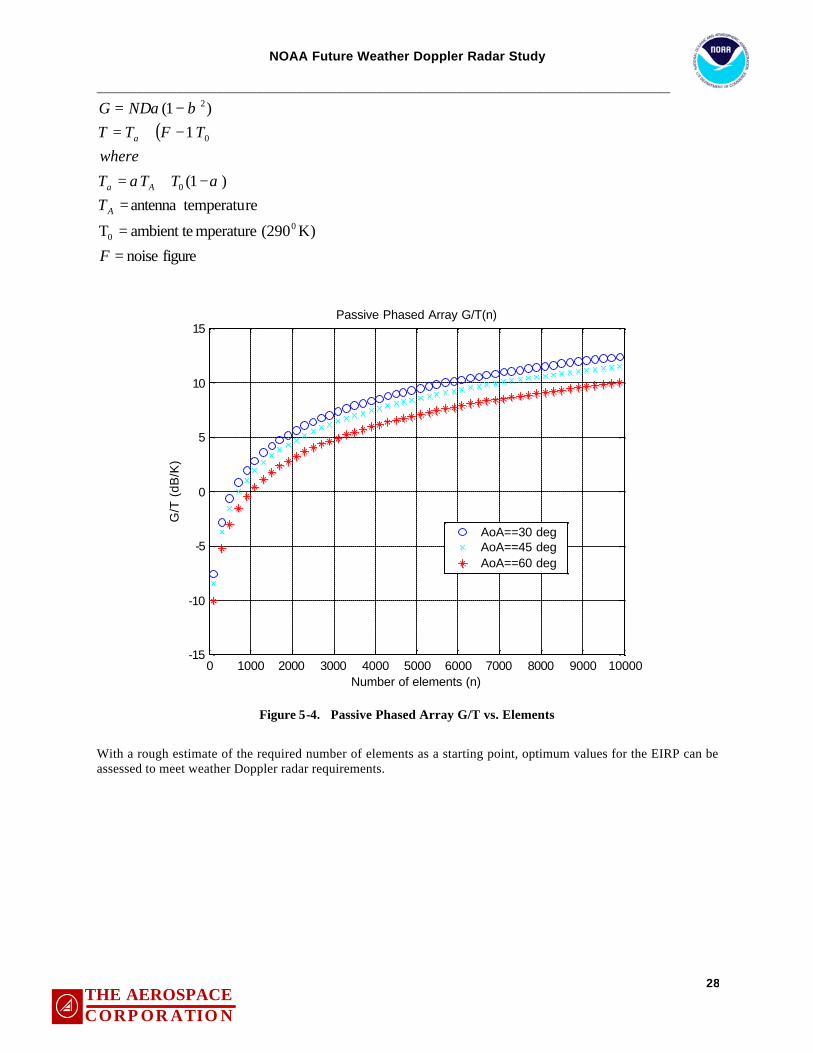
Holding the number of elements used in EIRP simulations constant, simulated G/T for an active phased array antenna can be computed;9 the simulation result is shown in Figure 5-3.
With a rough estimate of the required number of elements as a starting point, optimum values for the EIRP can be assessed to meet weather Doppler radar requirements.
NOAA Future Weather Doppler Radar Study ______________________________________________________________________________________
29THE AEROSPACE C O R P O R A T I O N
5.2 Ground Based Weather Doppler Radar Systems Architecture Figure 5-5 illustrates a notional view for a ground based weather Doppler radar system. Although this section will focus on fixed, ground-based weather Doppler radars, it is envisioned that UAV radar platforms may play a role in future weather radar system operations.
Figure 5-5. Notional View of a Ground-Based Weather Doppler Radar System
A ground based fixed platform size and performance suite may vary, depending upon the locations and surrounding environment. Figure 5-5 illustrates small radar sites (micro sites) sandwiched between the large sites (macro cites). Each site could be connected to an IP network (either private or public) with adequate security to form a wide area network between the sites and regional and central operations-control centers. The observed weather data from each site could be transferred over the network and made available from the regional and central operations-control centers for real time processing. Some macro sites may include 3 or 4 panels to cover 360 degrees azimuth, and some micro sites may include 2 or 3 panels to cover sectored areas that depend upon the location and environment. In addition, each panel may be configured with varying number of element. This architecture will provide flexibility for configuring each site based on current coverage needs, and thus enable reduced life-cycle costs.
WestWest
South
NorthNorthNOAA
EastEastWestWest
South
NorthNorthNOAA
EastEast
(Notional View)
NOAA Future Weather Doppler Radar Study ______________________________________________________________________________________
30THE AEROSPACE C O R P O R A T I O N
5.2.1 Functional Allocations Figure 5-6 illustrates the high level functional allocations of a weather radar systems front-end which includes the antenna, RF, interface (IF), and Base Band (BB) modules.
Figure 5-6. Functional Allocations of a Weather Radar
The antenna module will consist of the elements, phase shifters, and panels. The number of panels per site and number of elements per panel may vary depending on the coverage objectives and the geographical location of the sites. The RFM 10 will consist of the filters, circulators, transmit power amplifiers, low noise amplifiers, and switches. The IFM will consist of the filters, down converters, up converters and local oscillators. To eliminate RF plumbing, the IF and RF modules will be integrated in the antenna panels. The BB modules will consist of the analog to digital converters, digital to analog converters, ASICs and DSPs to modulate and demodulate signals. The BB modules will be integrated in a separate frame.
5.2.2 Interface Definitions There are two external interface boundaries in the future weather radar, as shown in Figure 5-6. The IF interface boundary provides in-phase and quadrature (I/Q) serial analog signals between the BB modules and IF modules. The BB interface boundary provides parallel digital data between the BB module and control and data processors. The systems will include clearly defined open interfaces between the IF modules and base band modules; between the base band modules and control-data processors; and between control-data processing modules and operations-control centers. The interfaces between control-data processing modules and operations-control centers could be either in private or public IP network, assuming adequate security.
5.3 Requirements The weather radar requirements will cover both system level requirements and design level requirements. The system level requirements will include functional requirements, performance requirements, interface requirements, environmental requirements, and physical requirements as a fixed station platform; the design requirements will focus on the active phased array antenna.
10 The TRM will include both RFM and IFM.
AntennaModule
RFModule
IFModule
BaseBandModule
ControlDataProcessors
Weather radar functions IF Interface BB Interface
AntennaModule
RFModule
IFModule
BaseBandModule
ControlDataProcessors
AntennaModule
RFModule
IFModule
BaseBandModule
ControlDataProcessors
Weather radar functions IF Interface BB Interface
NOAA Future Weather Doppler Radar Study ______________________________________________________________________________________
31THE AEROSPACE C O R P O R A T I O N
Weather Doppler radar system requirements are partitioned in 5 categories, and antenna design requirements are partitioned in 2 categories:
In the following sections, the required parameters are defined. Nearly all of their values are TBD through a future effort.
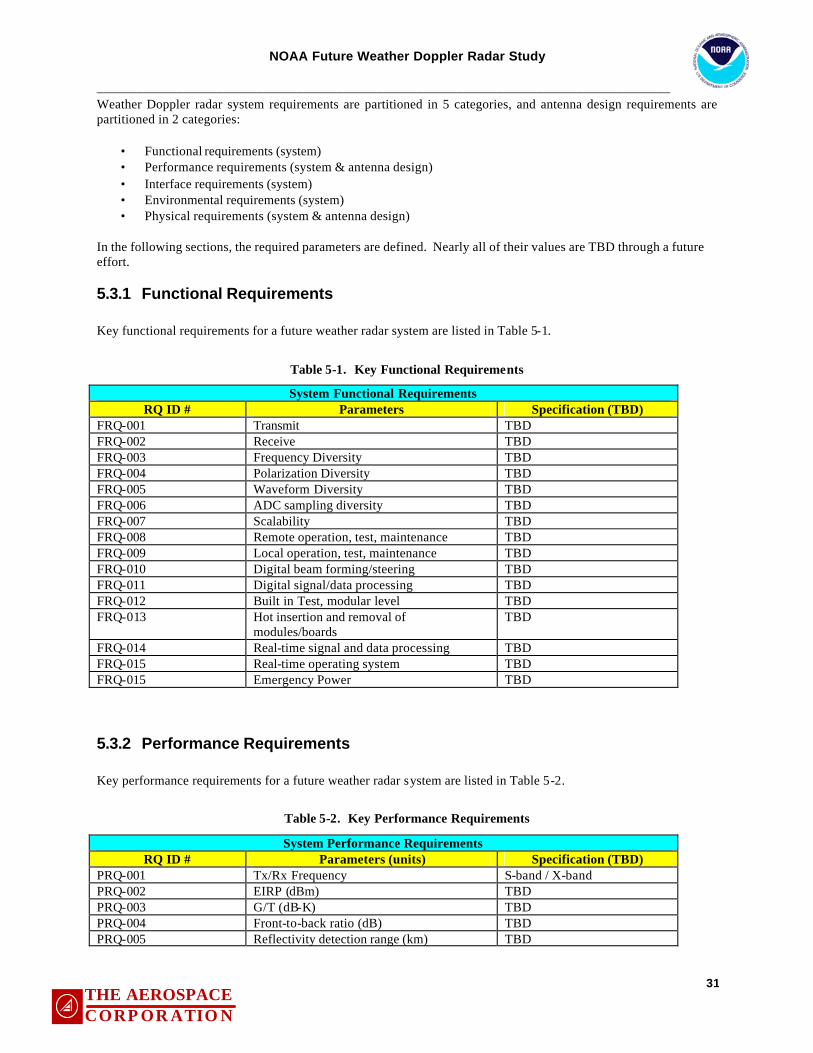
5.3.1 Functional Requirements Key functional requirements for a future weather radar system are listed in Table 5-1.
Table 5-1. Key Functional Requirements
System Functional Requirements RQ ID # Parameters Specification (TBD)
FRQ-001 Transmit TBD FRQ-002 Receive TBD FRQ-003 Frequency Diversity TBD FRQ-004 Polarization Diversity TBD FRQ-005 Waveform Diversity TBD FRQ-006 ADC sampling diversity TBD FRQ-007 Scalability TBD FRQ-008 Remote operation, test, maintenance TBD FRQ-009 Local operation, test, maintenance TBD FRQ-010 Digital beam forming/steering TBD FRQ-011 Digital signal/data processing TBD FRQ-012 Built in Test, modular level TBD FRQ-013 Hot insertion and removal of
modules/boards TBD
FRQ-014 Real-time signal and data processing TBD FRQ-015 Real-time operating system TBD FRQ-015 Emergency Power TBD
5.3.2 Performance Requirements Key performance requirements for a future weather radar system are listed in Table 5-2.
Table 5-2. Key Performance Requirements
System Performance Requirements RQ ID # Parameters (units) Specification (TBD)
PRQ-001 Tx/Rx Frequency S-band / X-band PRQ-002 EIRP (dBm) TBD PRQ-003 G/T (dB-K) TBD PRQ-004 Front-to-back ratio (dB) TBD PRQ-005 Reflectivity detection range (km) TBD
NOAA Future Weather Doppler Radar Study ______________________________________________________________________________________
32THE AEROSPACE C O R P O R A T I O N
System Performance Requirements RQ ID # Parameters (units) Specification (TBD)
PRQ-006 Pulse repetition frequency (kHz) TBD PRQ-007 Elevation coverage/steps (deg) TBD PRQ-008 Range resolution (m) TBD PRQ-009 Angle accuracy (deg) TBD PRQ-010 Settling time (ms) TBD PRQ-011 Clutter suppression (dB) TBD PRQ-012 Side lobe suppression (dB) TBD PRQ-013 Receiver sensitivity (dBm) TBD PRQ-014 RF dynamic range (dB) TBD PRQ-015 ADC resolution (bits) TBD PRQ-016 Probability of detection TBD PRQ-017 Probability of false alarm TBD PRQ-018 Lead time (min) TBD PRQ-019 Availability 11 TBD PRQ-020 Carrier Freq stability TBD PRQ-021 Phase noise TBD PRQ-022 MIPS TBD PRQ-023 Memory TBD PRQ-024 Throughput TBD
5.3.3 Interface Requirements Key interface requirements for a future weather radar system are listed in Table 5-3.
Table 5-3. Key Interface Requirements
System Interface Requirements RQ ID # Parameters Specification (TBD)
IRQ-001 Power interface (normal/emergency) AC/DC/UPS IRQ-002 Control interface TBD Protocols and format IRQ-003 Data interface TBD Protocols and format IRQ-004 Type of connectors & cables TBD IRQ-005 Local Operation, Maintenance and Test
interface TBD Protocols and format
IRQ-006 Remote Operation, Maintenance and Test interface
TBD Protocols and format
IRQ-007 IF in-phase IRQ-008 IF quadrature phase
11 Availability is defined as MTBF/(MTBF+MTTR), where MTBF is mean time between failures and MTTR is mean time to repair.
NOAA Future Weather Doppler Radar Study ______________________________________________________________________________________
33THE AEROSPACE C O R P O R A T I O N
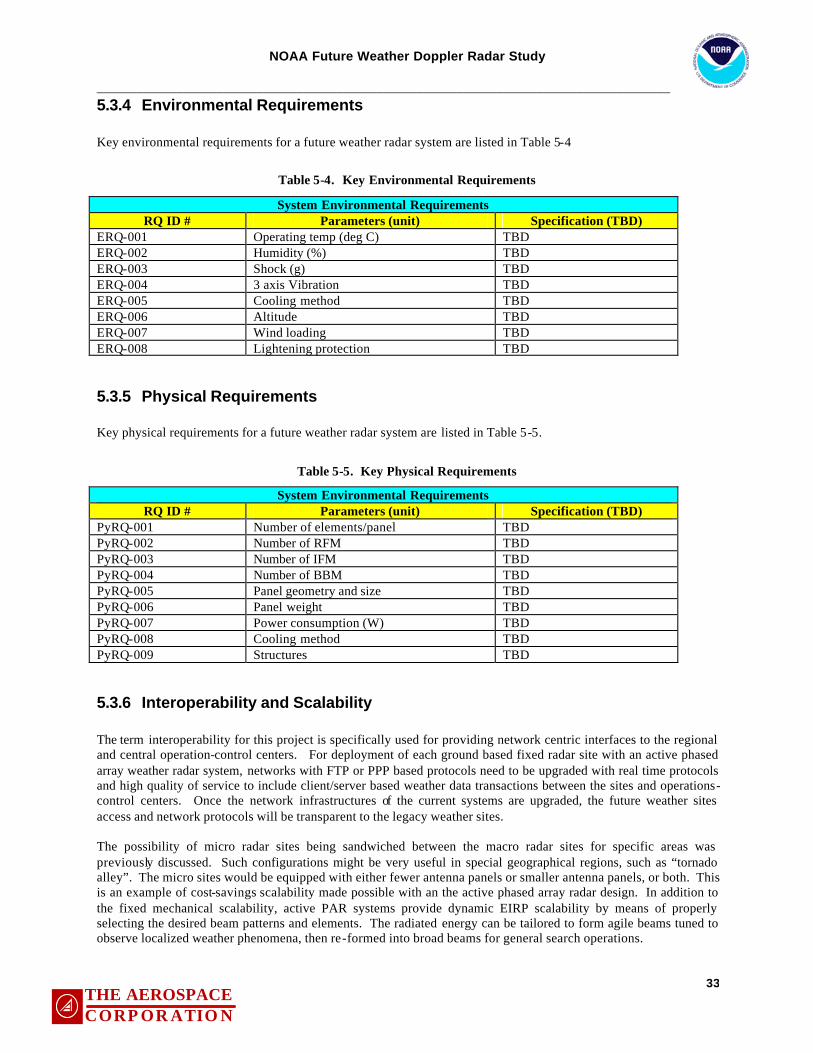
5.3.4 Environmental Requirements Key environmental requirements for a future weather radar system are listed in Table 5-4
Table 5-4. Key Environmental Requirements
System Environmental Requirements RQ ID # Parameters (unit) Specification (TBD)
5.3.5 Physical Requirements Key physical requirements for a future weather radar system are listed in Table 5-5.
Table 5-5. Key Physical Requirements
System Environmental Requirements RQ ID # Parameters (unit) Specification (TBD)
PyRQ-001 Number of elements/panel TBD PyRQ-002 Number of RFM TBD PyRQ-003 Number of IFM TBD PyRQ-004 Number of BBM TBD PyRQ-005 Panel geometry and size TBD PyRQ-006 Panel weight TBD PyRQ-007 Power consumption (W) TBD PyRQ-008 Cooling method TBD PyRQ-009 Structures TBD
5.3.6 Interoperability and Scalability The term interoperability for this project is specifically used for providing network centric interfaces to the regional and central operation-control centers. For deployment of each ground based fixed radar site with an active phased array weather radar system, networks with FTP or PPP based protocols need to be upgraded with real time protocols and high quality of service to include client/server based weather data transactions between the sites and operations-control centers. Once the network infrastructures of the current systems are upgraded, the future weather sites access and network protocols will be transparent to the legacy weather sites. The possibility of micro radar sites being sandwiched between the macro radar sites for specific areas was previously discussed. Such configurations might be very useful in special geographical regions, such as “tornado alley”. The micro sites would be equipped with either fewer antenna panels or smaller antenna panels, or both. This is an example of cost-savings scalability made possible with an the active phased array radar design. In addition to the fixed mechanical scalability, active PAR systems provide dynamic EIRP scalability by means of properly selecting the desired beam patterns and elements. The radiated energy can be tailored to form agile beams tuned to observe localized weather phenomena, then re-formed into broad beams for general search operations.
NOAA Future Weather Doppler Radar Study ______________________________________________________________________________________
34THE AEROSPACE C O R P O R A T I O N
5.3.7 Availability The antenna elements and TRMs are closely integrated in distributed form in active phased array radar systems. This eliminates single point of failures in the RF front-end infrastructure. In addition, performance degradations are expected to be graceful. When a certain percentage of RF components experience failures, built -in test circuits could be used to notify the operations-control center and summon for maintenance. Depending upon the performance threshold established by the operations center, the system can be configured to accommodate various maintenance schedules. Furthermore, the operators can conduct scheduled or event-driven diagnostic or test routines remotely from regional or central operations-control centers. If test results warrant maintenance, technicians can be dispatched to specific radar sites with full understanding of system health status, thus minimizing the mean time to repair. Minimizing the mean time to repair will yield high availability of the systems. Cumulative experience with such a maintenance strategy will reduce the life cycle cost of the systems, while eliminating single point of failures.
5.4 Tradeoff Study and Risk Analysis Conducting a formal risk analysis is beyond the scope of this effort; however, it is possible to do a preliminary tradeoff with respect to certain technical aspects of PAR. An active phased array antenna will be selected over a passive phased array antenna, as justified in terms of the discussion given in the previous sections. High level pros and cons for selecting an active phased array antenna are listed in Table 5-6.
Table 5-6. Active Phased Array Antenna Pros and Cons
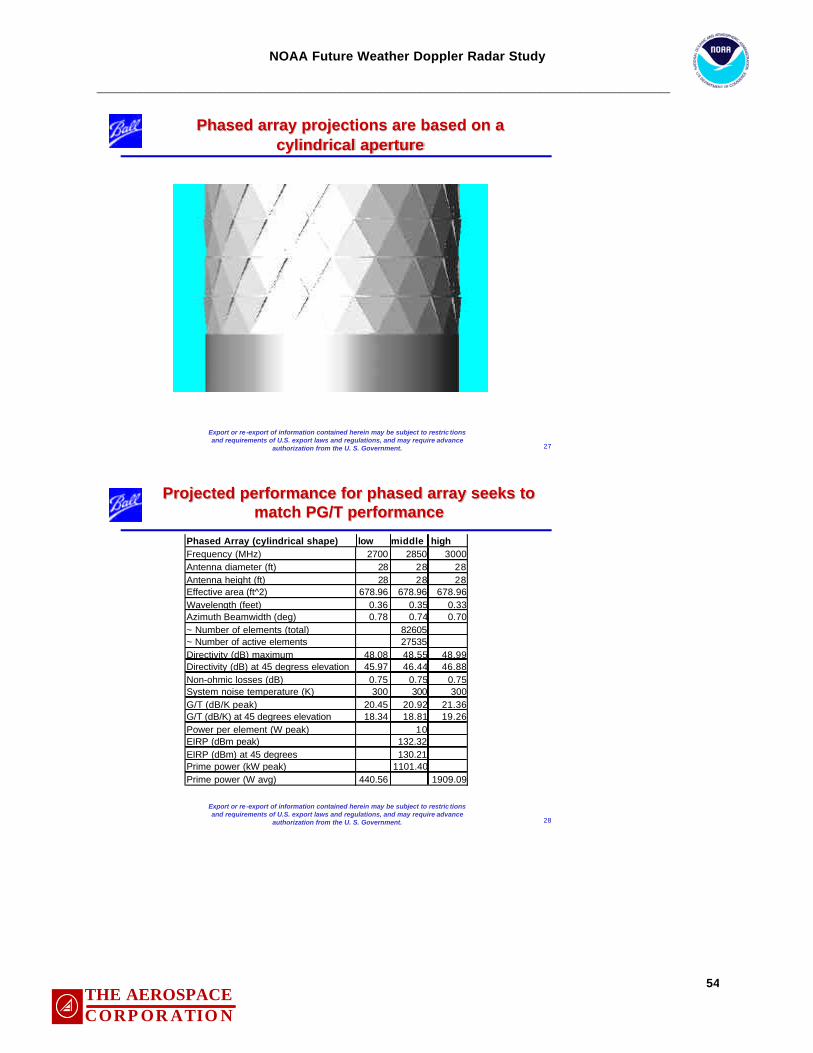
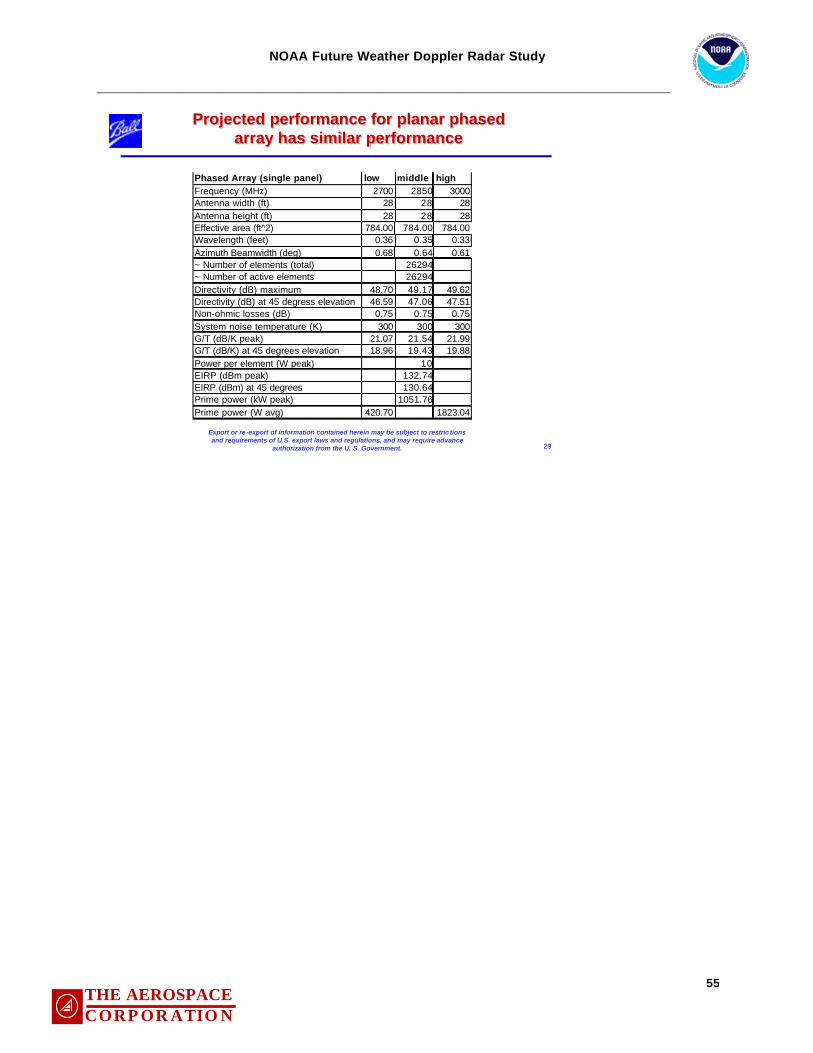
Pros Cons Provides multiple-agile beam forming capability Provides scaleable EIRP to each beam No mechanical moving parts No RF plumbing (wave guides, coaxial cables) No need for antenna cooling system Fast settling time and beam scanning Scaleable panel size and antenna size Scaleable RF/IF/BB modules High number of RF/IF modules High availability Graceful performance degradation Built in test circuit complexity Ease of maintenance Eliminates single point of failure The panel size and geometry of a phased array antenna are very important factors for estimating performance and cost. Since the EIRP requirement for weather Doppler radar is not yet finalized, it is too soon to estimate the number of elements that will determine the panel size. However, it is reasonable to do a preliminary tradeoff study for the panel geometry. There are two categories of panel geometry for phased array antennas: planar and non-planar. Non-planar geometry provide the best design flexibility and adaptability. They can be made to conform to various shapes: spherical, hemispherical, cylindrical, etc. For fixed ground-based radar platforms, a planar geometry with 2, 3 or 4 panels will be selected. High level pros and cons for planar panel active phased array antenna are listed in Table 5-7.
NOAA Future Weather Doppler Radar Study ______________________________________________________________________________________
35THE AEROSPACE C O R P O R A T I O N
Table 5-7. Planar Panel Antenna Pros and Cons
Pros Cons Ease of construction Stable and fixed tilt angle Flexible to adjust panel size (x, y) based on modularized sub-panel (the sub-panel will be a standard size).
Well defined bore-sight directivity Relatively accurate radiation pattern control Degraded radiation pattern at the edges of panel Well defined synthesis methods for narrow beam and low side lobe
The tradeoffs regarding the required number of elements per sub-panel, phase shifters, TRMs, and BBMs are TBD because the required EIRP is itself TBD.
NOAA Future Weather Doppler Radar Study ______________________________________________________________________________________
36THE AEROSPACE C O R P O R A T I O N
5.5 Roadmap of Future Weather Radar NOAA priorities will serve to formulate a PAR technology roadmap for the evolution of current weather Doppler radar systems such as NEXRAD. In general terms, a major goal of future weather Doppler radar is to increase tornado warning time, the probability of detection, and to decrease the probability of false alarms. However, PAR holds the potential for providing much greater weather science capabilities by virtue of its ability to interrogate a wide variety of meteorological phenomena. Achieving such goals at low cost rules out radical modifications of current operations-control centers where well-tested real-time image processing algorithms, signature recognition algorithms, and weather phenomena models reside. Evolution of the RF front-end infrastructure of the existing NEXRAD weather radar using PAR technology should significantly lower future life-cycle costs. Figure 5-7 shows expected qualitative cost / performance trends for active PAR integrated into future weather Doppler radar systems.
Figure 5-7. Future Weather Radar Roadmap12
12 Note that + 3 dB represents a times 2 improvement, while - 3 dB represents a 50 % reduction.
-10 dBAssume phase 1 deployment starts in 2010. Time (years)
Rel
ativ
e C
hang
e
NOAA Future Weather Doppler Radar Study ______________________________________________________________________________________
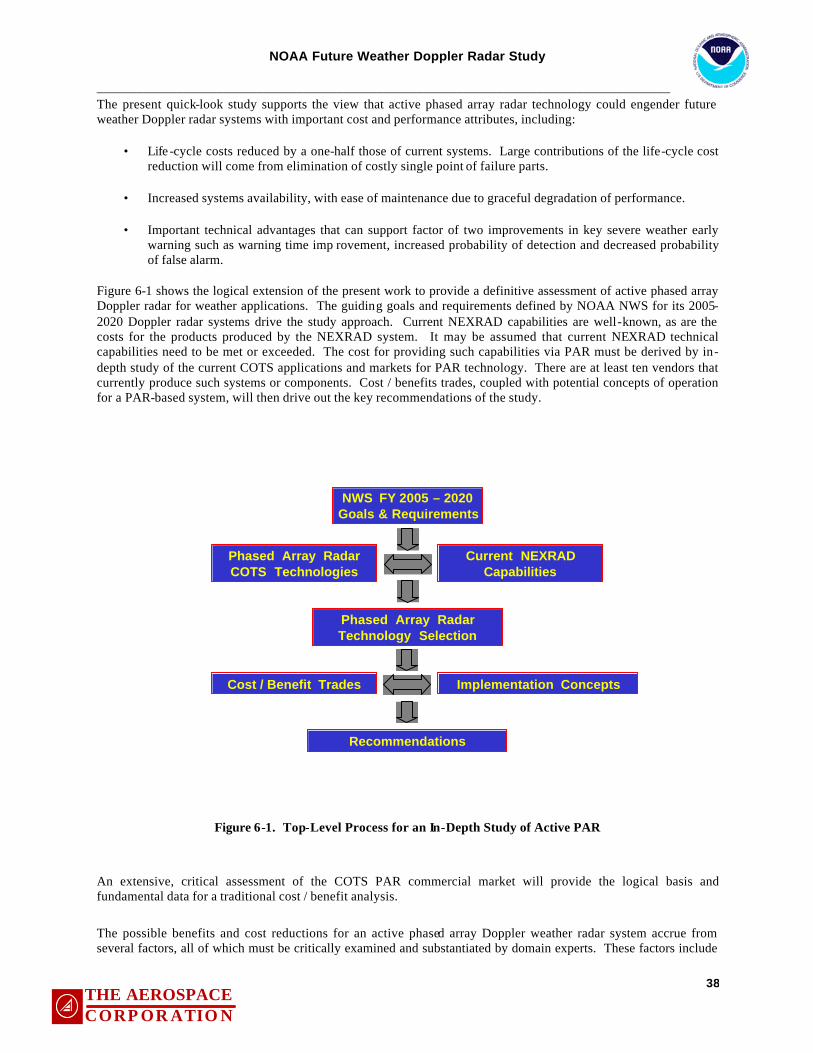
37THE AEROSPACE C O R P O R A T I O N
6. Recommendations In 2003, The National Academy of Science produced a report for NOAA entitled Weather Radar Technology. Beyond NEXRAD.8 Beyond NEXRAD, while very top-level, clearly indicates the need to perform in-depth studies to assess the role of active phased array radar for future Doppler weather radar systems. The present report begins the in-depth study process for a comprehensive analysis of PAR and its role for 21st century weather Doppler radar applications. Several important recommendations can be quoted from Beyond NEXRAD that are consistent with the findings of the present work: • “Adaptive waveform selection, which may even be applied to present systems, and agile beam scanning strategies, which require an electronically scanned phased array system, should be explored to optimize performance in diverse weather • The technical characteristics, design, and costs of phased array radar systems that would provide the needed rapid scanning, while preserving important capabilities such as polarization diversity, should be established. • The next generation of radars should be designed as part of an integrated observing system aimed at improving forecasts and warnings on relevant time and space scales. • Weather surveillance needs should be evaluated by geographic region to determine if a common radar system design is appropriate for all regions.” The latter two points are especially notable in that Beyond NEXRAD calls for improving forecasts and warnings on relevant time and space scales. The scalability of active PAR supports this need implicitly. Based on the present limited study, the following recommendations concerning phased array radar technology and future weather Doppler radar warning systems include:
• A fundamental examination of basic weather science issues to drive out the complementary roles of phased array and traditional approaches to weather Doppler radar.
• In-depth analysis to understand the importance of real-time frequency diversity, polarization diversity,
sampling rate diversity, and waveform diversity for new weather Doppler radars.
• The use of planar active phased array antennas in future weather Doppler radar systems.
• The use of real-time adaptive beam forming and beam steering techniques in future weather Doppler radar systems.
• The use of real-time, multiple transmit -receive beams (simultaneous) with independent beam forming
capabilities in future weather Doppler radar systems.
• An in-depth analysis of real-time networking concepts to fully exploit the potential of PAR for true factor of two severe weather early warning improvements.
• The definition of future weather radar systems architecture concepts where re-locatable micro-radar
platforms operate near traditional (or existing) radar platforms.
NOAA Future Weather Doppler Radar Study ______________________________________________________________________________________
38THE AEROSPACE C O R P O R A T I O N
The present quick-look study supports the view that active phased array radar technology could engender future weather Doppler radar systems with important cost and performance attributes, including:
• Life -cycle costs reduced by a one-half those of current systems. Large contributions of the life-cycle cost reduction will come from elimination of costly single point of failure parts.
• Increased systems availability, with ease of maintenance due to graceful degradation of performance.
• Important technical advantages that can support factor of two improvements in key severe weather early
warning such as warning time imp rovement, increased probability of detection and decreased probability of false alarm.
Figure 6-1 shows the logical extension of the present work to provide a definitive assessment of active phased array Doppler radar for weather applications. The guiding goals and requirements defined by NOAA NWS for its 2005-2020 Doppler radar systems drive the study approach. Current NEXRAD capabilities are well-known, as are the costs for the products produced by the NEXRAD system. It may be assumed that current NEXRAD technical capabilities need to be met or exceeded. The cost for providing such capabilities via PAR must be derived by in-depth study of the current COTS applications and markets for PAR technology. There are at least ten vendors that currently produce such systems or components. Cost / benefits trades, coupled with potential concepts of operation for a PAR-based system, will then drive out the key recommendations of the study.
Phased Array RadarCOTS Technologies
NWS FY 2005 – 2020Goals & Requirements
Current NEXRAD Capabilities
Implementation ConceptsCost / Benefit Trades
Phased Array RadarTechnology Selection
Recommendations
Figure 6-1. Top-Level Process for an In-Depth Study of Active PAR
An extensive, critical assessment of the COTS PAR commercial market will provide the logical basis and fundamental data for a traditional cost / benefit analysis.
The possible benefits and cost reductions for an active phased array Doppler weather radar system accrue from several factors, all of which must be critically examined and substantiated by domain experts. These factors include
NOAA Future Weather Doppler Radar Study ______________________________________________________________________________________
39THE AEROSPACE C O R P O R A T I O N
significant reductions in single-point-of-failure components, graceful system performance degradation, highly predictable system maintenance schedules, and elimination or reduction of mechanical components.
In addition, the technical potential of COTS PAR for Doppler weather radar science is enormous. This is due to the fundamentally different means by which radar transmission and reception is accomplished in a PAR system. Factor of 2 improvements for tornado early warning are credible, but must be substantiated by detailed technical analysis by weather science experts. A major study objective would be to quantify PAR weather Doppler radar costs and benefits from the perspective of systems architecture and operations, and to understand the specific improvements to radar products that ultimately are provided to meteorological and weather science users.
7. Acronyms az azimuth ADC Analog to Digital Converter APAR Active Phased Array Radar BBM Base Band Module cm centimeter C Centigrade temperature CW Continuous Wave dB decibel deg degree DSP Digital Signal Processing DAC Digital to Analog Converter DSP Digital Signal Processor el elevation EIRP Effective Isotropic Radiated Power ft foot FEMA Federal Emergency Management Agency FFT Fast Fourier Transform FPGA Field Programmable Gate Array FTP File Transfer Protocol g acceleration due to gravity GaAs Gallium Arsenide GHz Gigahertz GOES Geostationary Operational Environmental Satellite G/T Gain-to-system-noise-Temperature ratio JSTARS Joint Surveillance and Target Attack Radar System IEEE Institute of Electrical and Electronics Engineers IFM IF Module IP Internet Protocol I/Q Inphase/Quadrature kHz kilohertz km kilometer kW kilowatt K Kelvin temperature LNA Low Noise Amplifier m meter MIPS Millions of Instructions Per Second MHz megahertz MMIC Monolithic Microwave Integrated Circuit
NOAA Future Weather Doppler Radar Study ______________________________________________________________________________________
40THE AEROSPACE C O R P O R A T I O N
MTBF Mean Time Between Failures MTTR Mean Time To Repair NM Nautical mile NOAA National Oceanic and Atmospheric Administration NSSL National Severe Storms Lab NPOESS National Polar-orbiting Operational Environmental Satellite System PA Power Amplifier PAA Phased Array Antenna PAR Phased Array Radar PPAR Passive PAR PPP Point-to-Point Protocol POES Polar-orbiting Operational Environmental Satellite PRT Pulse Repetition Time RF Radio Frequency RFI Request For Information RFM RF Module RFP Request For Proposal RX receive s second SAR Synthetic Aperture Radar SSPA Solid State Power Amplifier TBD To Be Determined TRM Transmit/Receive Module TRMM Tropical Rainfall Measuring Mission TS Tornado System TVS Tornadic Vortex System TWTA Traveling Wave Tube Amplifier TX transmit UAV Unmanned Aerial Vehicle
NOAA Future Weather Doppler Radar Study ______________________________________________________________________________________
41THE AEROSPACE C O R P O R A T I O N
8. Appendices
Appendix A: Ball Aerospace Presentations and Documents NOAA, Aerospace and Ball held a meeting to discuss phased array radar technology on January 16, 2004. Ball presented the following charts to describe their capabilities in phased array antenna design, test and manufacturing.
Defense Systems
Export or re -export of information contained herein may be subject to restric tionsand requirements of U.S. export laws and regulations, and may require advance
authorization from the U. S. Government. 1
Antenna SystemsAntenna Systemsand and
Technologies Technologies (AST)(AST)
Defense Systems
Export or re -export of information contained herein may be subject to restric tionsand requirements of U.S. export laws and regulations, and may require advance
authorization from the U. S. Government. 2
Ball antennas cover a wide range of technologiesBall antennas cover a wide range of technologies
Defense Systems
Export or re -export of information contained herein may be subject to restric tionsand requirements of U.S. export laws and regulations, and may require advance
authorization from the U. S. Government. 1
Antenna SystemsAntenna Systemsand and
Technologies Technologies (AST)(AST)
NOAA Future Weather Doppler Radar Study ______________________________________________________________________________________
42THE AEROSPACE C O R P O R A T I O N
Defense Systems
Export or re -export of information contained herein may be subject to restric tionsand requirements of U.S. export laws and regulations, and may require advance
authorization from the U. S. Government. 3
Ball antenna technologies meet needs of multiple Ball antenna technologies meet needs of multiple customerscustomers
NEEDSTelemetry, Tracking &
Commanding (TT&C)
EW (transmit and receive)
Communication
Navigation
Identification
Radar
Seekers
TECHNOLOGIESLow Observable
Phased Arrays
Conformal
Frequency Selective Surfaces
Advanced RF Analysis
CUSTOMERSIntelligence Community
Warfighter
Missile Defense
Science Community
Defense Systems
Export or re -export of information contained herein may be subject to restric tionsand requirements of U.S. export laws and regulations, and may require advance
authorization from the U. S. Government. 4
Phased ArraysPhased Arrays
NOAA Future Weather Doppler Radar Study ______________________________________________________________________________________
43THE AEROSPACE C O R P O R A T I O N
Defense Systems
Export or re -export of information contained herein may be subject to restric tionsand requirements of U.S. export laws and regulations, and may require advance
authorization from the U. S. Government.
The phased array antenna is now used The phased array antenna is now used commerciallycommercially
AIRLINK® products are antenna systems and related avionics designed to provide in-flight telephone, fax and data transmission. AIRLINK® systems provide dependable communication services to general aviation, air transport and government aircraft.
AIRLINKAIRLINK® ®
Aeronautical Aeronautical SatelliteSatellite
ProductsProducts
94-1
55c
92-2249c
89-
3984
c
89-5045c
AIRLINKAIRLINK® ®
Low GainLow Gain
Defense Systems
Export or re -export of information contained herein may be subject to restric tionsand requirements of U.S. export laws and regulations, and may require advance
authorization from the U. S. Government.
AIRLINKAIRLINK®® Secure Satcom System adds STUSecure Satcom System adds STU--III III interfaceinterface
The Secure The Secure AIRLINKAIRLINK®® Aeronautical Satellite Aeronautical Satellite Communications System offers worldwide, Communications System offers worldwide, reliable communications from an aircraft, or reliable communications from an aircraft, or from the ground to the aircraft, in secure or from the ground to the aircraft, in secure or nonnon--secure modes. This secure modes. This AIRLINKAIRLINK®® product product provides multiple channels for inprovides multiple channels for in--flight flight telephone, fax, data and limitedtelephone, fax, data and limited--motion video motion video using the Inmarsat satellite system.using the Inmarsat satellite system.
NOAA Future Weather Doppler Radar Study ______________________________________________________________________________________
44THE AEROSPACE C O R P O R A T I O N
Defense Systems
Export or re -export of information contained herein may be subject to restric tionsand requirements of U.S. export laws and regulations, and may require advance
authorization from the U. S. Government.
Spaceborne Imaging Radar C (SIRSpaceborne Imaging Radar C (SIR--C) antenna aids C) antenna aids imagingimaging
SIR-C uses synthetic aperture radar beams to map the Earth from space. Synthetic aperture radar technology provides day and night measurements through cloud cover. Ball has supported five NASA missions: SEASAT, SIR-A, SIR-B and two flights of SIR-C.
Defense Systems
Export or re -export of information contained herein may be subject to restric tionsand requirements of U.S. export laws and regulations, and may require advance
authorization from the U. S. Government.
Launched in February 2000, SRTM returned images of 80 percent of the Earth’s land surface for the Department of Defense. Data will be used to create 3-D topographical maps with a vertical resolution of better than 16 meters.
NOAA Future Weather Doppler Radar Study ______________________________________________________________________________________
45THE AEROSPACE C O R P O R A T I O N
Defense Systems
Export or re -export of information contained herein may be subject to restric tionsand requirements of U.S. export laws and regulations, and may require advance
authorization from the U. S. Government. 9
Background on Existing SBackground on Existing S--band antennasband antennas
Defense Systems
Export or re -export of information contained herein may be subject to restric tionsand requirements of U.S. export laws and regulations, and may require advance
authorization from the U. S. Government. 10
Navy S-band
BCW
IR&D
MGT
RDFA
Ball has a long history in SBall has a long history in S--band phased arrays band phased arrays
NOAA Future Weather Doppler Radar Study ______________________________________________________________________________________
46THE AEROSPACE C O R P O R A T I O N
Defense Systems
Export or re -export of information contained herein may be subject to restric tionsand requirements of U.S. export laws and regulations, and may require advance
authorization from the U. S. Government. 11
Navy SNavy S--band phased arrays are targeted band phased arrays are targeted towards future ship applications towards future ship applications
Defense Systems
Export or re -export of information contained herein may be subject to restric tionsand requirements of U.S. export laws and regulations, and may require advance
Current Navy SCurrent Navy S--band antenna creates three band antenna creates three receivereceive--only beamsonly beams
NOAA Future Weather Doppler Radar Study ______________________________________________________________________________________
47THE AEROSPACE C O R P O R A T I O N
Defense Systems
Export or re -export of information contained herein may be subject to restric tionsand requirements of U.S. export laws and regulations, and may require advance
authorization from the U. S. Government. 13
LO ApertureProvides low RCS with minimal loss in efficiency.Achieves DDX RCS requirements.• FSS integrated at the element level eliminates FSS Radome• RCS measured at Ball and NAWC– meet DDX requirements
DACS CorrelatorCombines energy from 2 adjacent sides for around-the-corner gain improvement. Arrays can be 33% smaller.Array faces do not need to be co-located.• Handoff demonstrated during satellite tracking
Thin and FlatCan be embedded in Ship Superstructure• Subarray panel is 1.5” thick• Compatible with composite or metal
Existing SExisting S--band phased array has special featuresband phased array has special features
Defense Systems
Export or re -export of information contained herein may be subject to restric tionsand requirements of U.S. export laws and regulations, and may require advance
authorization from the U. S. Government. 14
Existing SExisting S--band phased array has special featuresband phased array has special features
State-of-the-Art, Low Cost, Producible HardwareDispells the myth that Phased Arrays must be expensive. Low cost materials/parts/processes. Pick and place.• Circuit board technology• room temperature low pressure lamination• low cost “cell phone technology” components
3 Simultaneous Beams per Array FaceAllows for multiple tracking and multifunction operation. More beams could be added.• Demonstrated with satellite tracking• Stereo DSP downlink demonstrated
EMI ProtectionProtected from shipboard EMI environment during operation (SPS-48, TAS, INMARSAT, SPS-49, SPY-1). Protected for in-band survival.• EMI protection analyzed, designed and tested at Ball• EMI protection tested at Dahlgren• EMI protection tested on the ship
NOAA Future Weather Doppler Radar Study ______________________________________________________________________________________
48THE AEROSPACE C O R P O R A T I O N
Defense Systems
Export or re -export of information contained herein may be subject to restric tionsand requirements of U.S. export laws and regulations, and may require advance
Export or re -export of information contained herein may be subject to restric tionsand requirements of U.S. export laws and regulations, and may require advance
authorization from the U. S. Government. 16
Exploded subarray view shows constructionExploded subarray view shows construction
NOAA Future Weather Doppler Radar Study ______________________________________________________________________________________
49THE AEROSPACE C O R P O R A T I O N
Defense Systems
Export or re -export of information contained herein may be subject to restric tionsand requirements of U.S. export laws and regulations, and may require advance
authorization from the U. S. Government. 17
Graphs show 2Graphs show 2--panel gain at panel gain at broadsidebroadside
Patterns are for Subscale Tests only and do not represent the full
array performance
2200 MHz
2300 MHz
2400 MHz
Defense Systems
Export or re -export of information contained herein may be subject to restric tionsand requirements of U.S. export laws and regulations, and may require advance
authorization from the U. S. Government. 18
Graphs show 2Graphs show 2--panel gain at 45panel gain at 45°°elevationelevation
2200 MHz
2300 MHz
2400 MHz
NOAA Future Weather Doppler Radar Study ______________________________________________________________________________________
50THE AEROSPACE C O R P O R A T I O N
Defense Systems
Export or re -export of information contained herein may be subject to restric tionsand requirements of U.S. export laws and regulations, and may require advance
authorization from the U. S. Government. 19
Graphs show 2Graphs show 2--panel gain at 60panel gain at 60°°elevationelevation
2200 MHz
2300 MHz
2400 MHz
Defense Systems
Export or re -export of information contained herein may be subject to restric tionsand requirements of U.S. export laws and regulations, and may require advance
authorization from the U. S. Government. 20
View shows antennas on the USS Lake ErieView shows antennas on the USS Lake Erie
NOAA Future Weather Doppler Radar Study ______________________________________________________________________________________
51THE AEROSPACE C O R P O R A T I O N
Defense Systems
Export or re -export of information contained herein may be subject to restric tionsand requirements of U.S. export laws and regulations, and may require advance
authorization from the U. S. Government. 21
Concepts exist for other SConcepts exist for other S--band phased array band phased array applicationsapplications
Defense Systems
Export or re -export of information contained herein may be subject to restric tionsand requirements of U.S. export laws and regulations, and may require advance
authorization from the U. S. Government. 22
Flat panelsubarray
LEOMEOGEO
TT&C
Integrated6-Panel DemoUnit
The Phased Array for TT&C (PAT) program is The Phased Array for TT&C (PAT) program is developing a transmit/receive array w/ up to 8 beamsdeveloping a transmit/receive array w/ up to 8 beams
NOAA Future Weather Doppler Radar Study ______________________________________________________________________________________
52THE AEROSPACE C O R P O R A T I O N
Defense Systems
Export or re -export of information contained herein may be subject to restric tionsand requirements of U.S. export laws and regulations, and may require advance
authorization from the U. S. Government. 23
Module from Module from PATprogramPATprogram provides two beams for provides two beams for transmit and two beams for receivetransmit and two beams for receive
• 1.75-1.85 GHz Transmit• 2.2-2.3 GHz Receive• One module per element mounted perpendicular to array face• Not a low profile array solution
Defense Systems
Export or re -export of information contained herein may be subject to restric tionsand requirements of U.S. export laws and regulations, and may require advance
authorization from the U. S. Government. 24
Modified Navy SModified Navy S--band panel recently band panel recently demonstrated transmit operationdemonstrated transmit operation
NOAA Future Weather Doppler Radar Study ______________________________________________________________________________________
53THE AEROSPACE C O R P O R A T I O N
Defense Systems
Export or re -export of information contained herein may be subject to restric tionsand requirements of U.S. export laws and regulations, and may require advance
authorization from the U. S. Government. 25
Projections for use in Weather RadarProjections for use in Weather Radar
Defense Systems
Export or re -export of information contained herein may be subject to restric tionsand requirements of U.S. export laws and regulations, and may require advance
authorization from the U. S. Government. 26
NEXRAD is used as a reference designNEXRAD is used as a reference design
NEXRAD low middle highFrequency (MHz) 2700 2850 3000Transmit Power (kW peak) 750 750 750Transmit power (W average) 300 1300Transmit output to antenna loss (dB) 2 2 2Pulse width (us) 1.57 4.5PRF (Hz) 318 1304Antenna diameter (ft) 28 28 28Gain(inc. radome loss) 45.5Beamwidth (deg) 0.925Radome two way loss (dB) 0.24System noise temperature (K) 540EIRP (dBm peak) 132.25G/T (dB/K) 18.18
NOAA Future Weather Doppler Radar Study ______________________________________________________________________________________
54THE AEROSPACE C O R P O R A T I O N
Defense Systems
Export or re -export of information contained herein may be subject to restric tionsand requirements of U.S. export laws and regulations, and may require advance
authorization from the U. S. Government. 27
Phased array projections are based on a Phased array projections are based on a cylindrical aperturecylindrical aperture
Defense Systems
Export or re -export of information contained herein may be subject to restric tionsand requirements of U.S. export laws and regulations, and may require advance
authorization from the U. S. Government. 28
Projected performance for phased array seeks to Projected performance for phased array seeks to match PG/T performancematch PG/T performance
Phased Array (cylindrical shape) low middle highFrequency (MHz) 2700 2850 3000Antenna diameter (ft) 28 28 28Antenna height (ft) 28 28 28Effective area (ft^2) 678.96 678.96 678.96Wavelength (feet) 0.36 0.35 0.33Azimuth Beamwidth (deg) 0.78 0.74 0.70~ Number of elements (total) 82605~ Number of active elements 27535Directivity (dB) maximum 48.08 48.55 48.99Directivity (dB) at 45 degress elevation 45.97 46.44 46.88Non-ohmic losses (dB) 0.75 0.75 0.75System noise temperature (K) 300 300 300G/T (dB/K peak) 20.45 20.92 21.36G/T (dB/K) at 45 degrees elevation 18.34 18.81 19.26Power per element (W peak) 10EIRP (dBm peak) 132.32EIRP (dBm) at 45 degrees 130.21Prime power (kW peak) 1101.40Prime power (W avg) 440.56 1909.09
NOAA Future Weather Doppler Radar Study ______________________________________________________________________________________
55THE AEROSPACE C O R P O R A T I O N
Defense Systems
Export or re -export of information contained herein may be subject to restric tionsand requirements of U.S. export laws and regulations, and may require advance
authorization from the U. S. Government. 29
Projected performance for planar phased Projected performance for planar phased array has similar performancearray has similar performance
Phased Array (single panel) low middle highFrequency (MHz) 2700 2850 3000Antenna width (ft) 28 28 28Antenna height (ft) 28 28 28Effective area (ft^2) 784.00 784.00 784.00Wavelength (feet) 0.36 0.35 0.33Azimuth Beamwidth (deg) 0.68 0.64 0.61~ Number of elements (total) 26294~ Number of active elements 26294Directivity (dB) maximum 48.70 49.17 49.62Directivity (dB) at 45 degress elevation 46.59 47.06 47.51Non-ohmic losses (dB) 0.75 0.75 0.75System noise temperature (K) 300 300 300G/T (dB/K peak) 21.07 21.54 21.99G/T (dB/K) at 45 degrees elevation 18.96 19.43 19.88Power per element (W peak) 10EIRP (dBm peak) 132.74EIRP (dBm) at 45 degrees 130.64Prime power (kW peak) 1051.76Prime power (W avg) 420.70 1823.04
NOAA Future Weather Doppler Radar Study ______________________________________________________________________________________
56THE AEROSPACE C O R P O R A T I O N
Appendix B: Lockheed Martin Presentations and Documents
NOAA Future Weather Doppler Radar Study ______________________________________________________________________________________
57THE AEROSPACE C O R P O R A T I O N
NOAA Future Weather Doppler Radar Study ______________________________________________________________________________________
58THE AEROSPACE C O R P O R A T I O N
NOAA Future Weather Doppler Radar Study ______________________________________________________________________________________
59THE AEROSPACE C O R P O R A T I O N
NOAA Future Weather Doppler Radar Study ______________________________________________________________________________________
60THE AEROSPACE C O R P O R A T I O N
NOAA Future Weather Doppler Radar Study ______________________________________________________________________________________
61THE AEROSPACE C O R P O R A T I O N
NOAA Future Weather Doppler Radar Study ______________________________________________________________________________________
62THE AEROSPACE C O R P O R A T I O N
NOAA Future Weather Doppler Radar Study ______________________________________________________________________________________
63THE AEROSPACE C O R P O R A T I O N
NOAA Future Weather Doppler Radar Study ______________________________________________________________________________________
64THE AEROSPACE C O R P O R A T I O N
NOAA Future Weather Doppler Radar Study ______________________________________________________________________________________
65THE AEROSPACE C O R P O R A T I O N
NOAA Future Weather Doppler Radar Study ______________________________________________________________________________________
66THE AEROSPACE C O R P O R A T I O N
NOAA Future Weather Doppler Radar Study ______________________________________________________________________________________
67THE AEROSPACE C O R P O R A T I O N
NOAA Future Weather Doppler Radar Study ______________________________________________________________________________________
68THE AEROSPACE C O R P O R A T I O N
Appendix C: CEA-FAR Presentations and Documents
NOAA Future Weather Doppler Radar Study ______________________________________________________________________________________
69THE AEROSPACE C O R P O R A T I O N
NOAA Future Weather Doppler Radar Study ______________________________________________________________________________________
70THE AEROSPACE C O R P O R A T I O N
NOAA Future Weather Doppler Radar Study ______________________________________________________________________________________
71THE AEROSPACE C O R P O R A T I O N
NOAA Future Weather Doppler Radar Study ______________________________________________________________________________________
72THE AEROSPACE C O R P O R A T I O N
NOAA Future Weather Doppler Radar Study ______________________________________________________________________________________
73THE AEROSPACE C O R P O R A T I O N
NOAA Future Weather Doppler Radar Study ______________________________________________________________________________________
74THE AEROSPACE C O R P O R A T I O N
NOAA Future Weather Doppler Radar Study ______________________________________________________________________________________
75THE AEROSPACE C O R P O R A T I O N
NOAA Future Weather Doppler Radar Study ______________________________________________________________________________________
76THE AEROSPACE C O R P O R A T I O N
NOAA Future Weather Doppler Radar Study ______________________________________________________________________________________
77THE AEROSPACE C O R P O R A T I O N
NOAA Future Weather Doppler Radar Study ______________________________________________________________________________________
78THE AEROSPACE C O R P O R A T I O N
NOAA Future Weather Doppler Radar Study ______________________________________________________________________________________
79THE AEROSPACE C O R P O R A T I O N
NOAA Future Weather Doppler Radar Study ______________________________________________________________________________________
1THE AEROSPACE C O R P O R A T I O N
NOAA Future Weather Doppler Radar Study ______________________________________________________________________________________
2THE AEROSPACE C O R P O R A T I O N
Appendix D: AN/SPY-1A Technical Details This discussion provides some of the engineering details for the AN/SPY-1A radar, which is a major element of the AEGIS weapons system. The AN/SPY-1A was designed in 1970, first operated at a land-based test site in 1973, with subsequent deployment on the USS Norton Sound. This Appendix draws upon descriptions and specifications of the AN/SPY-1A that can be found in the unclassified engineering literature.9,10,11,12 The basic design of the antenna was intended to support active and passive search, to include monopulse angle tracking of friendly targets, hostile targets and interceptor missile communications links. The stressing environmental conditions in which this radar operates require survival and operation under icing conditions where the wind speed is 80 miles per hour with an ambient temperature range of - 20 F° to + 120 F° at humidities up to 100%. It was designed to survive nuclear blast limits and intense vibration up to 25 Hz. Its degree of reliability was designed to accommodate 4 year intervals between major repairs. The array structure (including all equipment) weighs about 17,000 lbs. Figure F-1 shows a general schematic of the AN/SPY-1A sub-array. The receive sub-arrays are arranged in 10 columns, and each sub-array is connected to a column beamformer. Transmitting and receiving functions are performed by sub-arrays of various sizes, and the receiving function has a somewhat greater number of elements since monopulse pattern characteristics and peak sidelobe control are important in this system (these additional elements are labeled ‘REC ONLY” in the schematic. Each of the array consists of 4480 phase shifters and 1120 quad drivers. These are arranged in 140 modules, with each module having 32 elements. A receiver sub-array is composed of two modules (i.e., 64 elements), and a transmitter sub-array is composed of two receiver sub-arrays (i.e., 128 elements). Figure F-2 shows the AN/SPY-1A on board a Ticonderoga-class ship and as a modified unit appears at NSSL.
NOAA Future Weather Doppler Radar Study ______________________________________________________________________________________
3THE AEROSPACE C O R P O R A T I O N
Figure F-1. Rear view of the AN/SPY-1A array layout.10,11
Figure F-2. AN/SPY-1A onboard the Ticonderoga and during installation at the NSSL.
NOAA Future Weather Doppler Radar Study ______________________________________________________________________________________
4THE AEROSPACE C O R P O R A T I O N
Figure F-3. Functional diagram for the AN SPY-1A array.12
The degree of component reliability actually achieved for the AN/SPY-1A is known from four years of field experience in the late 1970s. The limit ing components are the phase shifters and drivers, as indicated in the data in Table F-1.
NOAA Future Weather Doppler Radar Study ______________________________________________________________________________________
5THE AEROSPACE C O R P O R A T I O N
9. References 1 R.J. Doviak and D.S. Zrnic, Doppler Radar and Weather Observations, Academic Press, New York (1984). 2 Aspects of Modern Radar, (Eli Brookner, Ed.), “The Doppler Weather Radar”, Chapter 9, Artech House, Boston (1988). 3 M. Born and E. Wolf, Principles of Optics, Pergamon Press, Oxford (1975). 4 R.D. Roberts and J. W. Wilson, “A Proposed Microburst Nowcasting Procedure Using Single-Doppler Radar,” J. Am. Meteor. 28, 285-303 (1989). 5 From the NOAA National Severe Storm Laboratory’s educational website. 6 R.A Brown, V.T. Wood, D. Sirmans, “Improved Tornado Detection Using Simulated and Actual WSR-88D Data with Enhanced Resolution,” Journal of Atmospheric and Oceanic Technology Vol. 19, No. 11, 1759-1771 (2002). 7 NWS OS&T data (private communication, Dr. Daniel Melendez). 8 Weather Radar Technology. Beyond NEXRAD, National Academy of Sciences Press, Washington, D.C. (2003). 9 Jane’s Radar and Electronic Warfare Systems (2004 Edition), Naval / Coastal Surveillance and Navigation Radars, Article # 1364. 10 R.M. Scudder and W.H. Sheppard, “AN/SPY-1 Phased Array Antenna,” Microwave Journal, pp. 51-55 (May 1974). 11 W.T. Patton, “Microwave Design for Reliability-Availability – The AN/SPY-1 Radar System,” Military Microwave Conf. Proc., London, pp. 177-192 (Oct. 1978). 12 Practical Phased-Array Antenna Systems, (Eli Brookner, Ed.), “Compact, Constrained Feed Phased Array for AN/SPY-1”, section 8. Artech House, Boston (1991).