28
Financial Valuation Tool for SustainabilitY Investments User Guide
Financial Valuation Tool for SustainabilitY InvestmentsUser Guide
IntroductionFinancial Valuation tool For SuStainability inVeStmentSUser Guide 2
Companies are spending millions of dollars in local communities to support sustainability programs in the areas of environmental, social and governance (ESG) issues. These programs safeguard natural resources, develop infrastructure, provide vocational training, transfer skills, support local institutions, engage stakeholder groups, and much more. Measuring the real and perceived benefits to communities from sustainability programs is important for assuring positive outcomes. There are many proven tools and practices for measuring the impact of sustainability programs on the community, but this is only half the story.
In addition to creating benefits for local communities, sustainability investments also create significant business value for companies by making the business operation sustainable as well. Intuitively, companies understand that there is a business case for being a good corporate citizen. Positive relationships with communities, civil society and governments help ensure that, among other things, production schedules are met, access to labour, land and resources are maintained, and reputations are kept intact.
The Financial Valuation Tool for Sustainability Investments helps companies make sound financial investments in programs and initiatives that contribute to the bottom line but also help increase the positive environmental, social and economic impacts of a large project.
This ground-breaking financial tool brings a degree of rigor and scrutiny to the non-technical risks involved in a large project and the company’s ability to mitigate those risks through investments in sustainability initiatives, as well as factoring in traditional cost/benefit analysis.
Our goal is to ensure better-informed investment decision making in order to ensure more successful outcomes for both project proponents and the people and environment impacted by projects, thus ensuring higher triple bottom line performance.
Created by The International Finance Corporation and Deloitte LLP
© 2014 IFC
about thiS uSer Guide
This User Guide is intended to provide a brief but comprehensive overview of the IFC’s Financial Valuation Tool, including an explanation of what it is, how it works, and the steps involved in using it.
For more general information about the rationale, the applications of the tool, and case studies, visit: FVTool.com
For further support and questions on the FV Tool, contact the FV Tool Help Desk team at: FVTool.com/page.php?node=aWQ9Nzc=
User Guide For FV Tool Version. 1.0.1.8
Veronica Nyhan JonesLead, Strategic Community Investment / CommDevIFC

IntroductionFinancial Valuation tool For SuStainability inVeStmentSUser Guide 3
FV Tool User Guide - Table of Contents
GLOSSARY OF KEY TERMS: 4
PART 1. InTROdUCTIOn 5
1.1 What is the FV Tool? 5
1.2 Value Protection and Value Creation from Sustainability Investments 6
1.3 Scenarios 7
1.4 Before getting started 7
PART 2. WORKInG WITh ThE FV TOOL 9
2.1 Software Download & Set up 9
2.2 Opening the Tool - First Glance 9
2.3 Navigating the Main Toolbar 10
2.4 Data Entry, Calculate & See Results 11
2.5 Basic Overview of Steps Involved 11
PART 3. MOdELLInG InVESTMEnT SCEnARIOS 12
PROjECT dEFInITIOn 13
TAB 1 - General Information 14
TAB 2 - Project Cash Flows 15
VALUE PROTECTIOn 16
Tab 3 - Project Risks 17
A - Making a List of Risks 17
B - Define Risk Consequences 18
C - Define Risk Parameters 19
SUSTAInABILITY PROGRAMS 20
Risk Mitigation Ratings Tool Instructions 21
TAB 4 - Sustainability Investments 22
TAB 5 - Quality of Sustainability Investments 23
VALUE CREATIOn 24
TAB 6 - Costs & Benefits 25
PART 4 - EVALUATInG OUTPUTS 26
See Results 27

IntroductionFinancial Valuation tool For SuStainability inVeStmentSUser Guide 4
CAPEX: Capital expenditures creating future benefits. A capital expenditure is incurred when a business spends money either to buy fixed assets or to add to the value of an existing fixed asset with a useful life that extends beyond the taxable year. CAPEX are used by a company to acquire or upgrade physical assets such as equipment, property or industrial buildings.
direct Costs: Any direct expenses budgeted (or spent) by the company for implementation of sustainability initiatives (e.g., salaries, studies, equipment, consultants, training programs).
direct Benefits: Any direct savings or additional revenues generated to the company as a result of sustainability initiatives (e.g., lower cost of ownership of the project due to faster access to land; lower expenses related to expatriates due to better access to qualified local workforce).
Monte Carlo Simulations or Methods: A class of computational algorithms that rely on repeated random sampling to compute their results. Monte Carlo methods tend to be used when it is infeasible or impossible to compute an exact result with a deterministic algorithm. More broadly, Monte Carlo methods are useful for modeling phenomena with significant uncertainty in inputs, such as the calculation of risk in business. As such, Monte Carlo analysis is used to reflect uncertainty around many inputs and changing risk conditions in the FV Tool model.
net Present Value (nPV): The total present value (PV) of a time series of cash flows. It is a standard method for using the time value of money to appraise long-term projects. Used for capital budgeting, and widely throughout economics, it measures the excess or shortfall of cash flows, in present value terms, once financing charges are met. The rate used to discount future cash flows to their present values is a key variable of this process. A firm’s weighted average cost of capital (WACC), after tax, is often used.
Inherent Risk: Pre-defined generic values to quantify the neutral (inherent) risks embedded in the model, and proposed to guide the user’s assumptions on risk values. The possible ranges of neutral (base) values for event risk and magnitude are derived from a specific fact-base as well as from historical observations in a fact-base of close to 100 cases in the mining, and oil and gas sectors.
OPEX: Operational expenditures, typically captured in annual operational budgets. Note that the model does not differentiate between CAPEX and OPEX, as it works with cash flows (discounted cash flow model).
Portion of Manageable Risk: The portion of a specific risk that can be reduced by sustainability investments (in %). For example, it can be estimated that only 20 percent of expropriation or cancellation risks are affected by a company’s sustainability program.
Scenario A: A reference scenario that characterizes a given baseline for a sustainability program portfolio of initiatives. Typically the Scenario a is modeled as ‘business as usual’.
Scenario B: A hypothetical scenario that characterizes a (second) sustainability program portfolio, to be compared with Scenario A. In the case study, Scenario B is defined as the proposed complete/robust sustainability program; i.e., Scenario B is most often a greater investment than Scenario A – although this is not necessarily true.
Sustainability Investments: Sustainability investments are generally understood as programs, initiatives or infrastructure investments by companies to manage environmental and social risks and support the development needs of surrounding communities. These investments could include, for example, local supplier development programs, health & safety training, or investments in water management.
Value Creation: The financial value of a sustainability initiative which results from direct costs (investments) and direct benefits (e.g., savings related to using a local workforce vs. expatriates or local suppliers vs. international). The value created is readily calculated using traditional NPV calculations.
Value Protection: The financial value protected (potential loss avoidance), which results from the indirect risk mitigation potential of all sustainability issues combined together (e.g., avoided delays, less disruption of operations). The value protected is estimated based on risk quantification methodologies and on assumptions informed by the external fact-base, the project team and expert opinion on risk characteristics.
Weighted Average Cost of Capital (WACC): The WACC is the rate that a company is expected to pay to finance its assets. It is the minimum return that a company must earn on its existing asset base to satisfy its creditors.
GLOSSARY OF KEY TERMS:

IntroductionFinancial Valuation tool For SuStainability inVeStmentSUser Guide 5
need for Value Calculation on Sustainability Investments
The FV Tool facilitates a rigorous process that brings together a cross functional team to assess how sustainability/community investments yield a reduction in costly risk events in other business areas, such as land access and community health & safety.
The FV Tool and the implementation process provide a common platform and language (financial value) for many business units, such as finance, risk, sustainability, procurement and human resources, to assess the returns from investing in sustainability. The process encourages the communication and coordination between business functions that traditionally do not work in alignment to mitigate risks.
how Will it help Your Organization?
The FV Tool can help evaluate investment decisions and proposed projects through:• Robust process and analysis to support sustainability investment decisions• Determining the right portfolio of sustainability investments for a given site/operation• Estimating the financial return from your sustainability investments
What is a Sustainability Investment?
Sustainability investments are generally understood as programs, initiatives or infrastructure investments by companies to manage environmental and social risks and support the development needs of surrounding communities. These investments could include, for example, local supplier development programs, health & safety training, or investments in water management.
how the FV Tool Works
The Financial Valuation Tool calculates a probable range for the Net Present Value (NPV) back to the company from a portfolio of sustainability investments, including value protected through risks mitigated and value created through added benefits.
The FV Tool, which is used to plan, prioritize, measure and scale a company’s site-level sustainability investments, is designed to supplement a company’s traditional discounted cash flow valuation model. The FV Tool uses quantitative analysis based on risk evaluation methods, financial valuation, and modelling using Monte Carlo simulations.
The tool can compare two different sustainability investment scenarios, based on risks and opportunities faced by an operation/asset, such as a mine or pipeline, to help managers decide which scenario is likely to yield the most value for the company by creating positive impact for surroundings communities.
Sectors Where the FV Tool Can be Applied
While the FV Tool is not designed exclusively for any particular industry or market, there are some sectors it will be more valuable for, including:• Mining• Oil & Gas• Manufacturing and Production (processing, chemicals, food, electronics, etc.)• Infrastructure• Any industry that has a significant impact on livelihoods and surrounding environment,
especially those where there is a strong social and environmental footprint to the operation that would be sensitive to local people and ecosystems.
Part 1. Introduction
The FV Tool dashboard allows users to evaluate and compare sustainability investment portfolios.
1.1 WhAT IS ThE FV TOOL?
“This tool fills one of the most paramount needs in our field: to be as robust in valuing sustainability as we are about other elements of risk management and commercial performance.”
- aaron Padilla, Ph.d., Senior advisor, community engagement, chevron Policy, Government and Public affai

IntroductionFinancial Valuation tool For SuStainability inVeStmentSUser Guide 6
1.2 VALUE PROTECTIOn And VALUE CREATIOn FROM SUSTAInABILITY InVESTMEnTS
Before sustainability investments
PROjECT VALUE BEFORE SUSTAInABILITY InVESTMEnTS
After sustainability investments
VA
LUE
CR
EA
TE
d
PROjECT VALUE AFTER SUSTAInABILITY InVESTMEnTS
VALUE P
ROTE
CTEd
Value Protection is the value saved by mitigating risks through sustainability investments. It is the value of avoiding risks such as costly delays in planning, construction and operations, lawsuits or other unforeseen added costs, project cancellation, or appropriation.
The Project Net Present Value is a calculation of the total financial value of the entire life of the project, such as a mine or oil & gas well. The square represents the NPV of the projected costs and revenues for the underlying project where sustainability investments are being considered.
Value Creation is direct cost-benefit calculation of sustainability investments. For example, it can be the value from input savings or productivity gains (e.g. local workforce training that enables the substitution of expensive expatriates with local hires).
The FV Tool quantifies the value created by calculating the Net Present Value (NPV) from sustainability investments. The NPV is calculated based on the CAPEX, OPEX, and benefits (i.e. revenue or cost savings) of the sustainability investment.
Every project inherently faces non-technical risks that carry financial consequences to the viability of the project, such as disputes with communities, environmental impacts, regulatory changes, etc. This is referred to as the Value at Risk.
The main risks related to sustainability at the project-level currently accounted for in the FV Tool:
1. Planning delays; 2. Construction delays; 3. Production disruption; 4. Project cancellation/expropriation; 5. Added (unforeseen) costs; and 6. Lawsuits.
The FV Tool helps you calculate the Total Value Added for a portfolio of sustainability investments. The final output of the FV Tool - financial return expressed as the NPV over the lifespan of the asset/operation - communicates the value to the company of corporate responsibility and sustainability in the language of the financial world.
IntroductionFinancial Valuation tool For SuStainability inVeStmentSUser Guide 7
1.3 SCEnARIOS
the FV tool FacilitateS a ProceSS oF comParinG inherent buSineSS ScenarioS with Potential inVeStment oPtionS
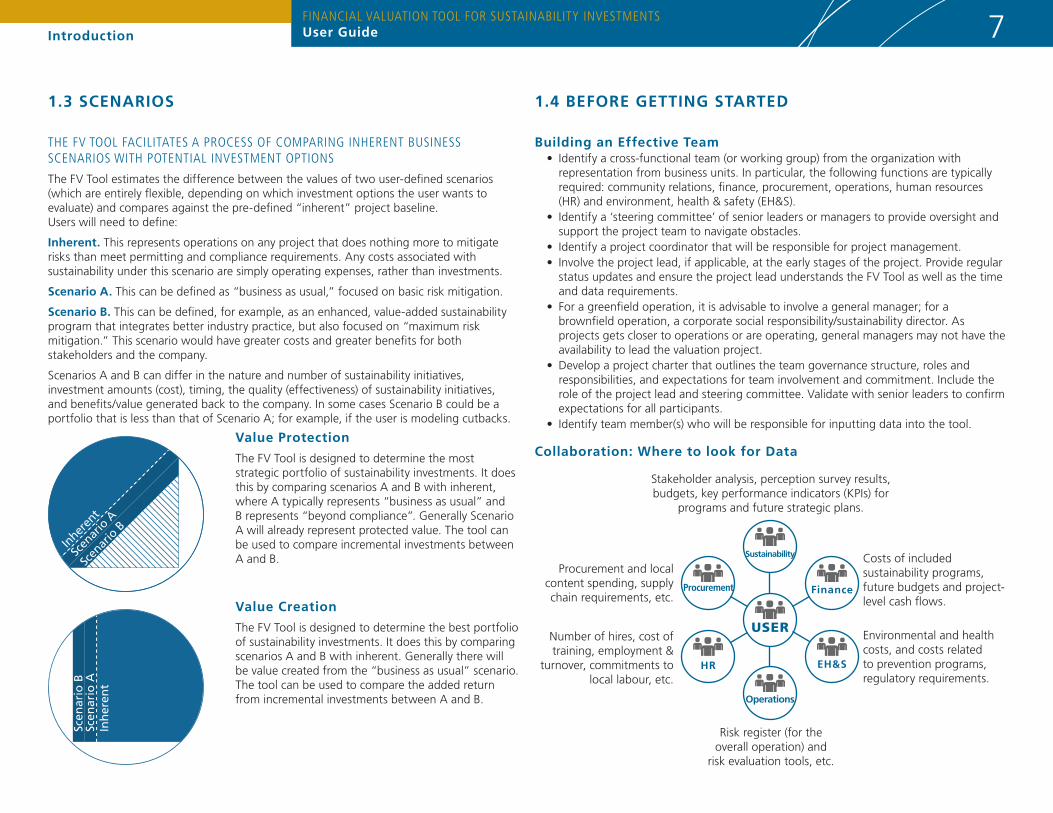
The FV Tool estimates the difference between the values of two user-defined scenarios (which are entirely flexible, depending on which investment options the user wants to evaluate) and compares against the pre-defined “inherent” project baseline. Users will need to define:
Inherent. This represents operations on any project that does nothing more to mitigate risks than meet permitting and compliance requirements. Any costs associated with sustainability under this scenario are simply operating expenses, rather than investments.
Scenario A. This can be defined as “business as usual,” focused on basic risk mitigation.
Scenario B. This can be defined, for example, as an enhanced, value-added sustainability program that integrates better industry practice, but also focused on “maximum risk mitigation.” This scenario would have greater costs and greater benefits for both stakeholders and the company.
Scenarios A and B can differ in the nature and number of sustainability initiatives, investment amounts (cost), timing, the quality (effectiveness) of sustainability initiatives, and benefits/value generated back to the company. In some cases Scenario B could be a portfolio that is less than that of Scenario A; for example, if the user is modeling cutbacks.
1.4 BEFORE GETTInG STARTEd
Building an Effective Team• Identify a cross-functional team (or working group) from the organization with
representation from business units. In particular, the following functions are typically required: community relations, finance, procurement, operations, human resources (HR) and environment, health & safety (EH&S).
• Identify a ‘steering committee’ of senior leaders or managers to provide oversight and support the project team to navigate obstacles.
• Identify a project coordinator that will be responsible for project management. • Involve the project lead, if applicable, at the early stages of the project. Provide regular
status updates and ensure the project lead understands the FV Tool as well as the time and data requirements.
• For a greenfield operation, it is advisable to involve a general manager; for a brownfield operation, a corporate social responsibility/sustainability director. As projects gets closer to operations or are operating, general managers may not have the availability to lead the valuation project.
• Develop a project charter that outlines the team governance structure, roles and responsibilities, and expectations for team involvement and commitment. Include the role of the project lead and steering committee. Validate with senior leaders to confirm expectations for all participants.
• Identify team member(s) who will be responsible for inputting data into the tool.
Collaboration: Where to look for dataValue Protection
The FV Tool is designed to determine the most strategic portfolio of sustainability investments. It does this by comparing scenarios A and B with inherent, where A typically represents “business as usual” and B represents “beyond compliance”. Generally Scenario A will already represent protected value. The tool can be used to compare incremental investments between A and B.
Value Creation
The FV Tool is designed to determine the best portfolio of sustainability investments. It does this by comparing scenarios A and B with inherent. Generally there will be value created from the “business as usual” scenario. The tool can be used to compare the added return from incremental investments between A and B.
Costs of included sustainability programs, future budgets and project-level cash flows.
Risk register (for the overall operation) and
risk evaluation tools, etc.
Procurement and local content spending, supply chain requirements, etc.
Environmental and health costs, and costs related to prevention programs, regulatory requirements.
Number of hires, cost of training, employment &
turnover, commitments to local labour, etc.
Stakeholder analysis, perception survey results, budgets, key performance indicators (KPIs) for
programs and future strategic plans.
UseR
Operations
FinanceProcurement
Eh&ShR
Sustainability

IntroductionFinancial Valuation tool For SuStainability inVeStmentSUser Guide 8
A nOTE On EXPECTATIOnS The FV Tool can serve as a powerful management tool. It may take several rounds of refining assumptions and data input before the model output is considered robust enough by the cross-functional management
team to be appropriate to guide decision-making. While this refining and validating process may be time consuming, the exercise and surrounding discussions typically yields learning that, in turn, amplifies the benefits of using the FV Tool.
In order to use the tool successfully and generate meaningful output, the assistance and collaboration of multiple departments is required. Consider this exercise an opportunity to perform valuable investigation and background analysis on proposed sustainability initiatives, and to gauge overall risks and values that exist for the project.
Estimating the Level of Effort
Time and resources to implement the FV Tool vary significantly from as little as 1-2 weeks by a small team to more than 12+ weeks in order to configure the tool and interpret the results. The range of time of time required to model investment scenarios is dependant on the skill set of the team, management buy-in, and the availability of information.
Rarely does a company have all the information available to run investment scenarios, so in many cases, a collaborative process with different departments must be used to access or develop the documentation required to run the model. This is why it is critical to have management buy-in for the tool. Each step of Section 3 outlines what data is required and who should be consulted.
In order to implement the tool effectively, the following is a broad overview of information that will be needed to model investment scenarios:
• Project-level cash flows: Defined project cash flows and operational phases.• documentation on stakeholder consultations: Documentation on stakeholder
engagement activities. • defined environmental and social risks: Well documented environmental
and social risks through company risk registers, environmental and social impact assessments or documentation of stakeholder engagement activities.
• Quantified risk parameters: Historical or country level data on risk events. The tool requires estimated ranges on the likelihood and severity of each risk event.
• defined costs and benefits of sustainability investments: Defined investment scenarios and associated capital expenditures (CAPEX), operating expenditures (OPEX), and quantifiable benefits (BENEFTS).
Getting Buy-in• Request the project sponsor to coordinate a management meeting to launch the
valuation project in order to create awareness among senior leadership and generate interest in the process and results.
• Engage leaders throughout the process with open forums, status updates or other communication initiatives. Do not wait until the results are available before opening lines of communications.
Using the FV Tool for decision-Making
Consider the following factors when evaluating the results of FV Tool for investment decision-making purposes:
1. Prioritize sustainability investments according to their total value added and impact on risk mitigation and alignment with community needs and interests.
2. Scale investment programs by downsizing or increasing investments, reallocating resources, etc. For example, if an investment is increased by 30 percent, its impact on risk mitigation may increase, as well as the overall value protected. This applies also to the quality of investment – the higher the quality, the more value is protected by the specific investment.
3. determine the most effective timing for each investment. For example, investing in local workforce development in the early stages of the project can create a lot more value added throughout its life span.
4. Measure and evaluate investments by revisiting costs and benefits that actually occurred, and correcting accordingly the assumptions on an ongoing basis. The model could also inform performance indicators for more accurate measuring of results, as well as costs and benefits tracking from year to year.
“Before, we got a [budget] number [for sustainability initiatives] and decided what to do with the budget without any analytic framework, based on instinct. Now, we use the same [financial modeling] tools [that financial and mine operations functions use] when they decide what to mine.”
- anonymous member of environment & Social responsibility (eSr) team, newmont Ghana Gold ltd.

The Home tab is where all main work happens.
The “Set Up” tab is for editing Risk Categories, Currency and Country data. As well, you can change the visual style in which the final output graphs are presented.
Upon opening the FV Tool software, you will see this screen first. There are two top-level tabs, Home and Set Up. You only need to access the Set Up tab to modify advanced settings later.
The first choice to make is to select New or Open (existing project.) For the purposes of exploring the tool at first, select Open and choose the GoldStar example project. There is a full tutorial offered for download on the FVTool.com website that uses this example project.
Financial Valuation tool For SuStainability inVeStmentSUser Guidenavigating the FV Tool 9
Visit FVTool.com and go to the FV Tool menu and select “Download FV Tool”
FVTool.com/download.php
• Registration is required to download the tool. • Follow the link in the download window to access an
installation guide.• The FV Tool is only compatible with Windows, not Mac OSX.
Part 2. Working with the FV Tool
2.2 OPEnInG ThE TOOL - FIRST GLAnCE
2.1 SOFTWARE dOWnLOAd & SET UP

Financial Valuation tool For SuStainability inVeStmentSUser Guidenavigating the FV Tool 10
new - The “New” button opens a blank database ready for data entry.
Open - Select from a list of projects that have been previously saved.
Save - When entering or editing project data, click “Save” periodically to ensure work is not lost when the database is closed or when exiting the program.
Save As - For a new project, click the “Save As” button to give it a name and a location.
delete - To remove a project from a database, open the project and then click “Delete.”
Steps - Data entry is performed in the 1. Enter data step. After completing all the data entry up to Tab 6, click 2. Calculate in order to run the calculation. Clicking 3. See Results will show the results of the calculation.
Export to Excel - Export the data and the results at any stage of the process, for external editing or archiving.
Exit - During data entry or after the process is complete, click “Exit” to close the project.
help Function - Additional user guidance can be found in this space.
Other data Entry Components
Entering data into fields: All of the data entry fields are identifiable as boxes for text/numerical input.
The tool bar for tables (bottom left corner): For data entry where there is a table to complete, there is a special toolbar that allows users an extra set of controls to add, remove or modify rows.
2.3 nAVIGATInG ThE MAIn TOOLBAR
new database: Creating a new database allows users to save a set of projects together but in a different place (i.e., file path) than the original/default database. First select the “Open” button on the toolbar. Instead of selecting a project from the listing provided, choose the “New database” button on the top right of the pop-up window and then name/save the database under the desired file path. Create any number of new databases that can each hold a series of defined project scenarios.
Changing databases: This function is only applicable when users have previously created more than one database. After selecting the Open button on the toolbar, choose the “Change database” button on the top right of the pop-up window and then select the desired database from file path it was previously saved under. Then create or select from an entirely different set of projects under that database.
Options not in the Main Toolbar

Financial Valuation tool For SuStainability inVeStmentSUser Guidenavigating the FV Tool 11
2.4 dATA EnTRY, CALCULATE & SEE RESULTS
The FV Tool is divided into three main modules. All data entry must be completed before you can calculate the results. Clicking “Calculate” before all the fields are completed will return an error message.
1. Enter data: Steps 1-6, as described in the next section, take place in the Enter Data section of the tool.
2. Calculate: Once the data has been entered, click “Calculate” to model the results.
3. See Results: Select this module to view and interpret the results of the tool’s output.
2.5 BASIC OVERVIEW OF STEPS InVOLVEd
Modelling scenarios involves six steps, corresponding to the tabs inside a project. Section 3 of this guide is organized according to the tabs. They are color-coded into four groupings: Project definition, Value Protection, Sustainability Programs, and Value Creation.
1. General Information - Enter information and set up the Project Phases of the project (e.g. mine site) and baseline financial information.
2. Project Cash Flows - Enter forecast revenue, costs, and net cash flow minus sustainability spend for the each year in the projects life span.
3. Project Risks - Determine project Risks / Consequences, and calculate Portion of Manageable Risks for each.
4. Sustainability Investments - This tab is oriented towards defining the portfolio of sustainability investments under consideration. A stand-alone tool is downloaded and used to calculate the Risk Mitigation of Sustainability Investments. Access it here: https://fvtool.com/files/Risk%20Mitigation%20Ratings.xlsm
5. Quality of Sustainability Investments A self-assessment questionnaire that opens in a pop-up window and upon completion automatically fills in the fields of the tab.
6. Costs and Benefits - Calculate and enter traditional Cost Benefit Analysis (CBA) data for each of the potential sustainability investments.

Financial Valuation tool For SuStainability inVeStmentSUser GuideUsing the FV Tool 12
Modeling sustainability investments is a complex process that involves collaboration, consultation, and data analysis with various departments across an organization. While the process can be complex and time consuming, the FV Tool can profoundly enhance the level of rigor behind investment analysis and provide a sound platform for decision-making and collaboration across the organization.
The framework is intended to guide new users through the process of valuing sustainability investments. Each company is encouraged to develop their own unique approach.
Initiating the Process
Modelling investment scenarios with the FV Tool involves a team-based approach and a number of preparatory steps. We strongly recommend assembling a group of key team members to work together to model scenarios with the FV Tool. See section “1.4. Building an Effective Team.”
1. hold an Initiation Meeting: Hold a project initiation meeting where you review the entire process and discuss the desired outcomes. A steering committee should be formed to establish expectations, time lines, key roles and responsibilities, and support in the decision making process. Consider documenting this in a project charter.
2. define Project Scope and Boundary: The steering committee should define the timeline and boundaries of the project (e.g., within one operational site or geographic area).
3. Establish data Collection Requirements: Review all necessary data and consultation requirements. Gather as much as possible of the data before preparing it and entering it into the tool.
4. Risks & Opportunities Mapping: Collaborate with Operations, EH&S and Sustainability departments to develop a risks and opportunities map. Based on the identification of site-level social and environmental risks (see Tab 3) and community engagement processes, identify the areas of highest risk and highest opportunity for impact at the site. This should be used to inform the sustainability investment portfolio. For guidance on creating a risk and opportunity map, visit: http://www.fvtool.com/files/Risk%20and%20Opportunity%20Map.pdf
5. define Sustainability Investment Portfolio: The sustainability initiatives portfolio selected for evaluation should include broader categories of programs (e.g., local economic development, suppliers programs, livelihood restoration, biodiversity) for which direct cost/benefit information is available.
Part 3. Modelling Investment ScenariosThe Organization of Content in Part 3
Part 3 is instructive and describes the steps and input requirements for each of the six main tabs. In this section, content is grouped into the following five categories:
description
This explains the key concepts of the step and how it fits into the bigger picture.
data Source:
This is a suggestion of where you might find the required data needed for that specific tab/step.
data Entry
This is an explanation of how to correctly enter the data inputs required to correctly fill in the fields to ensure proper calculation.
Consultation
Suggestions for consulting with other departments and personnel in the company in order to gather the required input data.
Example
The pre-configured example project is used to illustrate the specific example of what type of data is to be entered into various fields.
“The (Financial Valuation) Tool can be used to assist non-finance functions to improve understanding of community investment connection to financial drivers. It may assist the company in communicating in more concrete terms the business case for community investment.”
- walter richards, regional controller africa, newmont Ghana
Collaborate with:• Sustainability• Finance• Operations
UseR
Operations
FinanceProcurement
Eh&ShR
Sustainability
Financial Valuation tool For SuStainability inVeStmentSUser GuideInPUT: Project definition 13
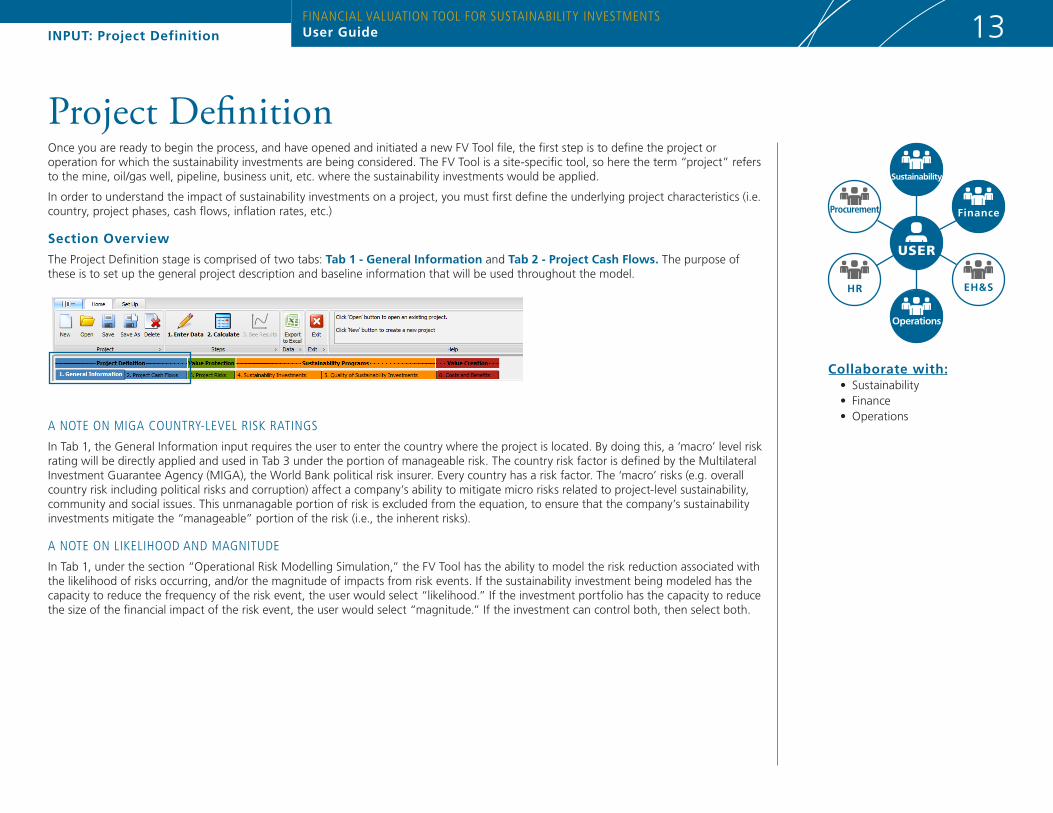
Once you are ready to begin the process, and have opened and initiated a new FV Tool file, the first step is to define the project or operation for which the sustainability investments are being considered. The FV Tool is a site-specific tool, so here the term “project” refers to the mine, oil/gas well, pipeline, business unit, etc. where the sustainability investments would be applied.
In order to understand the impact of sustainability investments on a project, you must first define the underlying project characteristics (i.e. country, project phases, cash flows, inflation rates, etc.)
Section Overview
The Project Definition stage is comprised of two tabs: Tab 1 - General Information and Tab 2 - Project Cash Flows. The purpose of these is to set up the general project description and baseline information that will be used throughout the model.
a note on miGa country-leVel riSk ratinGS
In Tab 1, the General Information input requires the user to enter the country where the project is located. By doing this, a ‘macro’ level risk rating will be directly applied and used in Tab 3 under the portion of manageable risk. The country risk factor is defined by the Multilateral Investment Guarantee Agency (MIGA), the World Bank political risk insurer. Every country has a risk factor. The ‘macro’ risks (e.g. overall country risk including political risks and corruption) affect a company’s ability to mitigate micro risks related to project-level sustainability, community and social issues. This unmanagable portion of risk is excluded from the equation, to ensure that the company’s sustainability investments mitigate the “manageable” portion of the risk (i.e., the inherent risks).
a note on likelihood and maGnitude
In Tab 1, under the section “Operational Risk Modelling Simulation,” the FV Tool has the ability to model the risk reduction associated with the likelihood of risks occurring, and/or the magnitude of impacts from risk events. If the sustainability investment being modeled has the capacity to reduce the frequency of the risk event, the user would select “likelihood.” If the investment portfolio has the capacity to reduce the size of the financial impact of the risk event, the user would select “magnitude.” If the investment can control both, then select both.
Project Definition

Financial Valuation tool For SuStainability inVeStmentSUser GuideInPUT: Project definition 14
description
This fi rst tab requires the user to describe the project, defi ne the operational phases, and enter variables such as Weighted Average Cost of Capital, the country of operation and infl ation rate, as well as parameters for operational risk modeling simulation. This information will be used in the NPV calculation for your sustainability investments.
data Source
Project planning documents, engineering work packages, capital expenditure budgets, etc.
data Entry
i. Briefl y describe the Project Name, User and Project Description in the General Project Information panel.
ii. In the lower left panel under Project Phases, enter the various project phases (e.g. exploration, feasibility, construction, operation, closure and post-closure, etc.) with a start and end date for each. The length in years of each phase is then calculated by the software.
iii. Click Synchronize Cash Flow Timeline to align operational Project Phases with project cash fl ows in Tab 2.
iv. On the right hand panel under Financial Information, enter the fi nancial information pertaining the geography and project, i.e. weighted average cost of capital, infl ation, etc.
v. Under Operational Risk Modeling, enter the modeling parameters. Typically the Quality Framework is selected and “Likelihood and Magnitude” are selected under Impacts on Operational Risks.
vi. Advanced users can change the risk modeling simulations settings, including the Number of Simulations - from 1,500 to 5,000. The higher the number of simulations, the higher the convergence of results; in other words, the standard deviation decreases as the simulations increase. It is advisable to select 5,000 simulations for your fi nal calculation.
Consultation
You will likely need to consult with operations personnel to obtain information about project phases. Financial information such as infl ation rates, Weighted Average Cost of Capital are typically obtained from the company’s fi nance team.
Example
Throughout this User Guide, we will follow along with the “GoldStar Version 2.0” example, which you can download from the FVTool.com website. It is an example of a gold mine located in Mexico, with Phase 1 construction having started in 2012. Mine closure is scheduled for 2041 We have set the Weighted Average Cost of Capital at 9.9%
This project has nine phases over the life of the mine, each of which has been entered into the tool. By specifying the beginning and end date of each phase, Phase duration is automatically calculated by the tool.
The Location is indicated as “Mexico” which gets factored into the equation by way of MIGA rating. As well, the infl ation rate is at 3.5% and the project is using US dollars as the currency of calculation.
In this scenario, the number of Simulations is set at 5000. For quicker calculations while testing multiple variables on different scenarios, reduce the number of simulations.
The Impacts on Operational Risk are only being modelled on the “Likelihood”, in this example. For further explanation, see section on Value Protection.
TAB 1 - General Information

Financial Valuation tool For SuStainability inVeStmentSUser GuideInPUT: Project definition 15
TAB 2 - Project Cash Flowsdescription
In the Project Cash Flows tab, users must enter the data in the Cash Flows table from Financial Projections (in $1000s). This information is a “financial bridge” with the project financial evaluation (i.e. project expected costs and revenues) performed before applying sustainability initiatives. It represents aggregated yearly cash flows (revenues, costs) over the life span of the project, as estimated by the financial analysts in the initial evaluation of the project, irrespective of sustainability investments.
data Source
Financial reports and projections, budgets and planning documents, financial reporting systems (e.g. SAP, etc.)
data Entry
Enter the data in the Cash Flows table from Financial Projections without sustainability spend (in $1000s) table
It is important to avoid double counting of any costs and benefits in basic project cash flows and the sustainability valuation model. If some sustainability initiatives have been included in basic financial cash flows, they may need to be subtracted using the sustainability spend reversal.
note: Users will need to have applied the Synchronize Case Flow Timeline link on the bottom of Tab 1 to link the project dates in Tab 2.Consultation
Consult with finance department to obtain relevant cash flows associated with project phases.
Example
Cashflows for the GoldStar project have been obtained from the finance department.
Costs and Revenues over the life of the mine, prior to sustainability investment spend, are entered into the cash flows panel.
Note: Revenue does not begin until 2015 when production begins in Phase 1.
Collaborate with:• Sustainability• Finance• EH&S (Env, Health & Safety)• Operations
UseR
Operations
FinanceProcurement
Eh&ShR
Sustainability
Financial Valuation tool For SuStainability inVeStmentSUser GuideInPUT: Risk / Value Protection 16
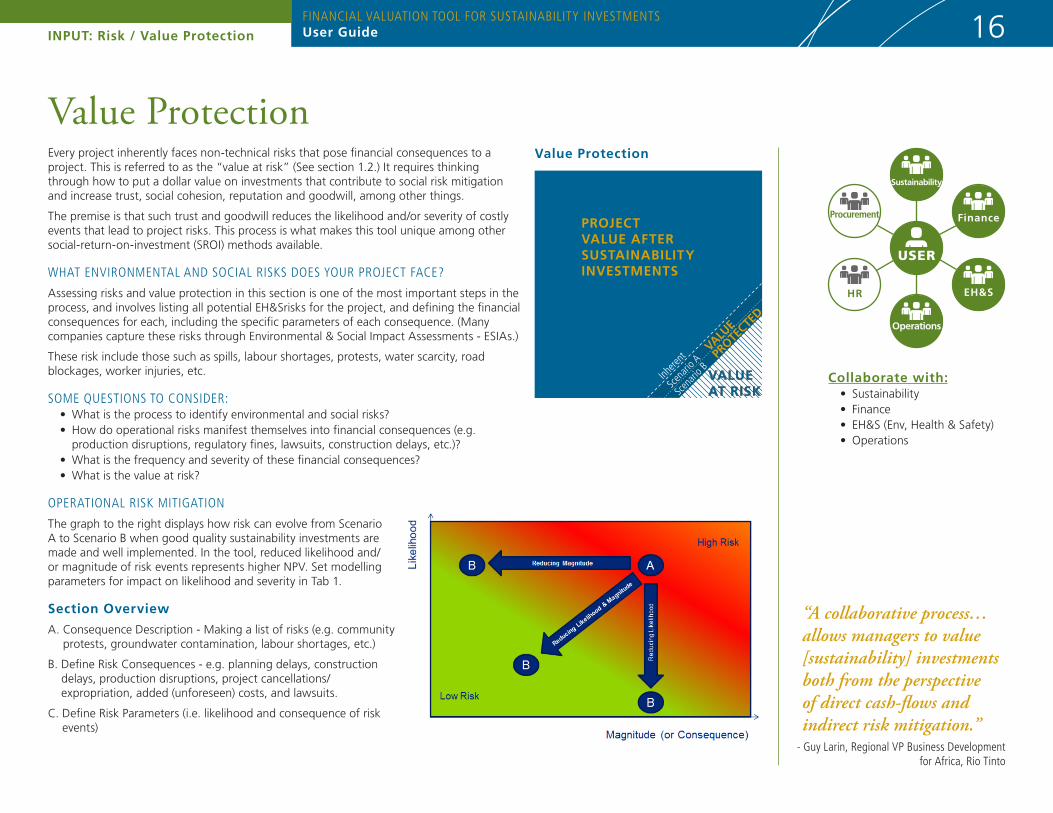
Every project inherently faces non-technical risks that pose financial consequences to a project. This is referred to as the “value at risk” (See section 1.2.) It requires thinking through how to put a dollar value on investments that contribute to social risk mitigation and increase trust, social cohesion, reputation and goodwill, among other things.
The premise is that such trust and goodwill reduces the likelihood and/or severity of costly events that lead to project risks. This process is what makes this tool unique among other social-return-on-investment (SROI) methods available.
what enVironmental and Social riSkS doeS your Project Face?
Assessing risks and value protection in this section is one of the most important steps in the process, and involves listing all potential EH&Srisks for the project, and defining the financial consequences for each, including the specific parameters of each consequence. (Many companies capture these risks through Environmental & Social Impact Assessments - ESIAs.)
These risk include those such as spills, labour shortages, protests, water scarcity, road blockages, worker injuries, etc.
Some queStionS to conSider:• What is the process to identify environmental and social risks?• How do operational risks manifest themselves into financial consequences (e.g.
production disruptions, regulatory fines, lawsuits, construction delays, etc.)?• What is the frequency and severity of these financial consequences?• What is the value at risk?
oPerational riSk mitiGation
The graph to the right displays how risk can evolve from Scenario A to Scenario B when good quality sustainability investments are made and well implemented. In the tool, reduced likelihood and/or magnitude of risk events represents higher NPV. Set modelling parameters for impact on likelihood and severity in Tab 1.
Section Overview
A. Consequence Description - Making a list of risks (e.g. community protests, groundwater contamination, labour shortages, etc.)
B. Define Risk Consequences - e.g. planning delays, construction delays, production disruptions, project cancellations/expropriation, added (unforeseen) costs, and lawsuits.
C. Define Risk Parameters (i.e. likelihood and consequence of risk events)
Value Protection
PROjECT VALUE AFTER SUSTAInABILITY InVESTMEnTS
VALUE
PROTE
CTEd
inhere
nt
Scen
ario b
Scen
ario a
Value Protection
“A collaborative process…allows managers to value [sustainability] investments both from the perspective of direct cash-flows and indirect risk mitigation.”
- Guy larin, regional VP business development for africa, rio tinto

Financial Valuation tool For SuStainability inVeStmentSUser GuideInPUT: Risk / Value Protection 17
description
Review or develop a list of any and all non-technical risks associated with project, covering all aspects and stages of operations. If it has not been done before, give this step sufficient time, as it is a valuable exercise in it’s own right. Refine the list, combining any overlapping risks that have the same types of consequences.
data Source
Existing corporate risk registers could be a key resource for the risk identification activity. The company may have identified risks associated with sustainability issues and this provides a useful starting point. You may also find this information in Participatory Rural Appraisals (PRAs), Environmental and Social Impact Assessment (ESIA), documentation on stakeholder engagement, or baseline studies.
A - MAKInG A LIST OF RISKS
data Entry
N/A
Consultation
This informative process should involve both those familiar with the details regarding the specific types of risks on a project, and those who understand the financial consequences of them. Consider holding workshops or in-depth interviews with Sustainability, Operations and Finance representatives.
Example
Tab 3 - Project Risks
iii) Environmental and social risks were identified by reviewing the company’s risk register. Through a risk workshop with finance and operations, the following risks were validated:• Delays with community development agreements• Community unrest leading to road blockages during construction• Lawsuits with contractors over injury claims• Forced shutdown from exceeding freshwater withdrawal limits• Failure to obtain relevant approvals• Land disputes with local communities• Temporary shutdown for dust• Release of stormwater runoff containing process water
• Freshwater availability• Traditional land use• Employment opportunities• Skills training
• Health & Safety• Biodiversity• Dust suppression• Stormwater run-off
ii) The following environmental and social issues were identified by reviewing the environmental and social impact assessment conducted during the feasibility phase of the project:
• Local regulators• Indigenous communities• Environmental NGOs
• Local impacted communities• Employees• Contractors
i) Through a careful review of the stakeholder mapping process, conducted by the Sustainability department, the following stakeholders groups were identified:
Financial Valuation tool For SuStainability inVeStmentSUser GuideInPUT: Risk / Value Protection 18
B - dEFInE RISK COnSEQUEnCES
description
The FV Tool quantifies the value at risk from environmental and social risks by determining the financial consequence of each. Consequences are defined as:
1. Planning delays; 2. Construction delays; 3. Production disruption; 4. Project cancellation/expropriation; 5. Added (unforeseen) costs; or 6. Lawsuits.
Keep in mind that one risk might trigger multiple financial consequences. For example, groundwater contamination from a spill could trigger a production disruption and added costs from remediation, regulatory fines and/or lawsuits.
The risk consequences help to quantify the value that is mitigated through your sustainability investments. In the next step you will need to define the frequency and severity of financial consequence and the time period where it applies.
data Source
Data sources are largely driven through the consultation process but may include data sources listed in step A.
data Entry
i. Using the list of risks you’ve developed in Step A, select which financial consequence applies.
ii. Use pre-determined consequences in the drop-down menu or create new categories.
iii. Enter all time variables for each risk/consequence you’ve entered, either by Start/End Project Phase (as determined by the phases entered in Tab 1) or by Start/End Project Year.
iv. The portion of manageable risk is determined based on the project country’s MIGA rating, but can be overwritten by advanced users. (See Tab 1.)
v. Financial implications of specific consequences can be adjusted by clicking on the new Risk Categories button.
Consultation
The FV Tool requires users to define financial consequences from risks identified in step A. Generally this is done through a consultative process with Operations or Sustainability to determine what financial consequences can or have occurred from other risk events.
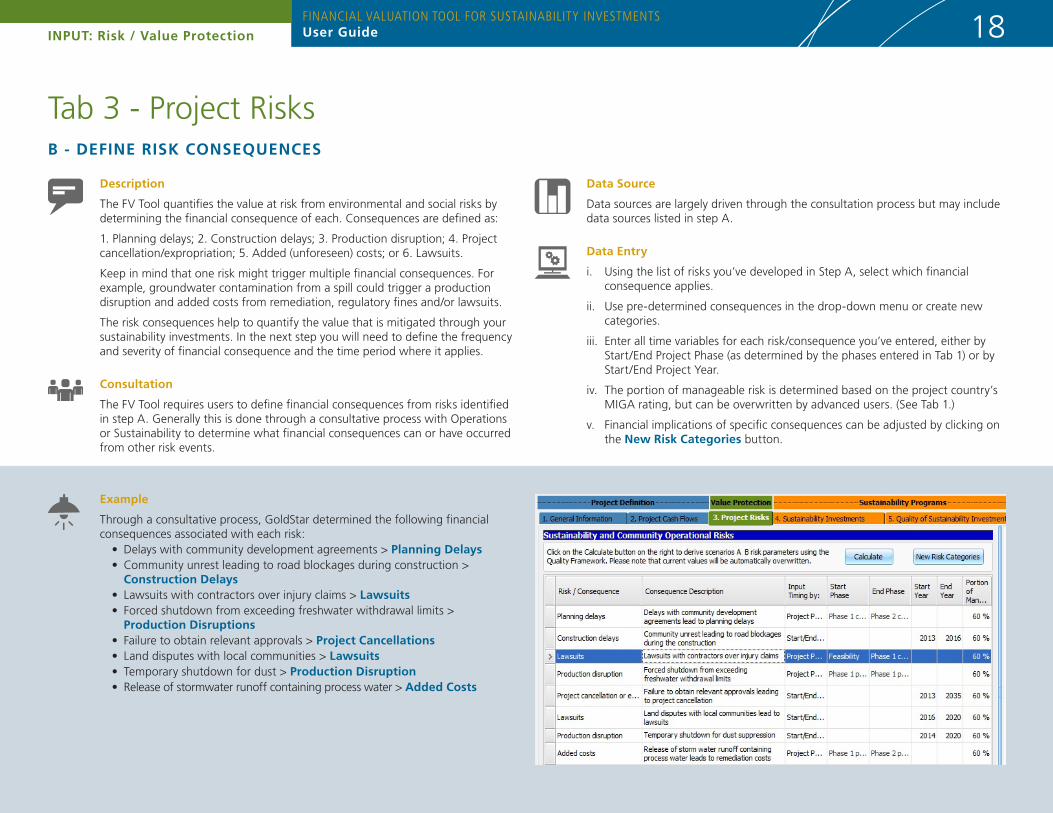
Example
Through a consultative process, GoldStar determined the following financial consequences associated with each risk:• Delays with community development agreements > Planning delays• Community unrest leading to road blockages during construction >
Construction delays• Lawsuits with contractors over injury claims > Lawsuits• Forced shutdown from exceeding freshwater withdrawal limits >
Production disruptions• Failure to obtain relevant approvals > Project Cancellations• Land disputes with local communities > Lawsuits• Temporary shutdown for dust > Production disruption• Release of stormwater runoff containing process water > Added Costs
Tab 3 - Project Risks
Financial Valuation tool For SuStainability inVeStmentSUser GuideInPUT: Risk / Value Protection 19
C - dEFInE RISK PARAMETERS
description
In order to quantify the risks identified in steps A and B, users will need to determine the parameters, or risk criteria, for the evaluation. Typically, risks are quantified according to the consequence (or magnitude) of the risk and the likelihood (or rate) of occurrence. The FV Tool requires additional information about the specific financial impacts associated with a risk on the asset/project.
In this step, you will define consequence parameters for each risk for the Inherent Scenario (without any investments.) These parameters are used to calculate the project’s financial value that is protected through your sustainability investments.
data Source
Data sources are largely generated through the consultation process but may include data sources listed in step A. The consequence parameters for Scenarios A & B will be calculated automatically based on the risk mitigation potential of sustainability investments from Tab 4 (as calculated by the Risk Tool - download via the FV Tool website), and the Quality Framework Self-Assessment Questionnaire in Tab 5. Risk Mitigation Tool: https://fvtool.com/files/Risk%20Mitigation%20Ratings.xlsm
data Entry
i. In the right panel, define consequence parameters for each risk listed in the Inherent Scenario based on the data that was compiled in the Risk Table. (Parameters for Scenarios A & B are automatically calculated, but can be over-written by advanced users.)
ii. The FV Tool already sets parameters for each risk, but you can open the categories box to further configure the consequence parameters.
Consultation
Consider developing a Risk Table to document the associated consequences of your risks. Populate the risk table with the following information for each risk: 1) description and assumptions; 2) annual rate of occurrence; 3) duration; 4) related costs (one-time); 5) recurring costs; and 6) lost revenue.
The Risk table is developed in collaboration with operations, finance, and sustainability managers and additional internal stakeholders as required.
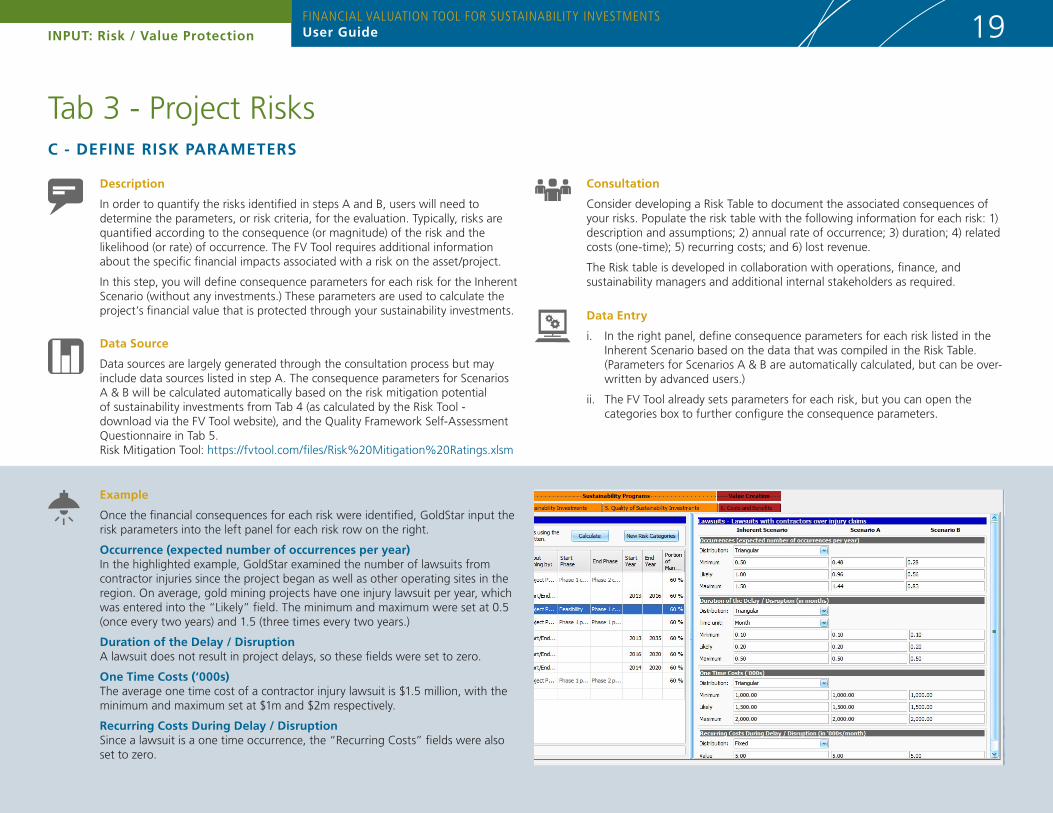
Example
Once the financial consequences for each risk were identified, GoldStar input the risk parameters into the left panel for each risk row on the right.
Occurrence (expected number of occurrences per year)In the highlighted example, GoldStar examined the number of lawsuits from contractor injuries since the project began as well as other operating sites in the region. On average, gold mining projects have one injury lawsuit per year, which was entered into the “Likely” field. The minimum and maximum were set at 0.5 (once every two years) and 1.5 (three times every two years.)
duration of the delay / disruptionA lawsuit does not result in project delays, so these fields were set to zero.
One Time Costs (‘000s)The average one time cost of a contractor injury lawsuit is $1.5 million, with the minimum and maximum set at $1m and $2m respectively.
Recurring Costs during delay / disruptionSince a lawsuit is a one time occurrence, the “Recurring Costs” fields were also set to zero.
Tab 3 - Project Risks

Collaborate with:• Sustainability• Finance• HR• Procurement
Sustainability
UseR
Operations
FinanceProcurement
Eh&ShR
Financial Valuation tool For SuStainability inVeStmentSUser GuideInPUT: Sustainability Programs 20
Now that you have selected and defined a project in Tab 1 and 2, and assessed the underlying environmental and social risks in Tab 3, this section allow users to begin defining sustainability programs be evaluated by the tool.
What are Sustainability Investments?
The term Sustainability Programs is a very broad, all-encompassing definition and that covers investments in initiatives, infrastructure, training, capacity building, etc. which are designed to minimize negative environmental, social and local economic impacts, while enhancing the benefits to communities and the local environment.
Sustainability investments are specific to each project and may include, for example: • Resettlement and livelihood restoration programs (e.g. crop compensation, cost of housing, cost of negotiations, etc.)• Local business development programs (e.g. local suppliers programs, small business development, skills training, etc.)• Community engagement activities (e.g. consultation, community baseline studies, etc.)• Access to water initiatives (e.g. extended water infrastructure/water to local communities, efficiency solutions in plant design, etc.)• Health programs at the workplace and in communities (e.g. building primary health infrastructure, employee health prevention
programs, etc.)• Biodiversity programs (e.g. assessment of water/land biodiversity impacts, biodiversity offset programs, etc.)
how the FV Tool Factors Investment Scenarios
The FV Tool is designed to evaluate two user defined portfolios of investments described as scenarios A and B (see section 1.3). While the inherent scenario generally represents the minimal level of investment required to meet regulatory requirements, Scenarios A & B represent different level / types of sustainability investments.
Typically Scenario A is set up as “business as usual,” minimal investment, focused on basic risk mitigation. Scenario B often represents a more intensive sustainability investment portfolio, that may include an expanded scope for the initiatives in the portfolio outlined in Scenario A, or a new set of investments that includes more investments than Scenario A. Ultimately, users can set up the two scenarios however they feel will yield the most beneficial insights by comparison. The FV Tool will calculate the financial return on the incremental value between scenarios A and B.
Section Overview
In this section, we are looking to answer the following critical questions:
what SuStainability inVeStmentS/ProGramS do you want to eValuate?• Defining scenarios A and B (see section 1.3)
how much riSk can your SuStainability inVeStmentS mitiGate?
•Overviewoftheriskmitigationtool
•Sub-processformappinginterdependenciesbetweenstakeholders,issues,risks,andsustainabilityinvestmentsusingtherisktool
what iS the quality oF your SuStainability inVeStmentS?
•Overviewofself-assessmentquestionnaire
•Howtooverrideself-assessmentratings
Sustainability Programs

1. Review existing registers (e.g. stakeholders, risks) and relevant documentation (e.g. perception survey, environmental social assessment, public consultation and disclosure plan)to develop and enter the following lists on the “Control Panel” tab without leaving empty rows in between items:
a) List of Stakeholders
b) List of Issues
c) List of Risks
d) List of Initiatives
Items in the stakeholders, issues, risks and initiatives lists should be entered only once to avoid unnecessary repetition.
2. Once the lists have been entered in the Risk Mitigation Ratings tool, click on the “Create Tables” button on the “Control Panel” tab.
3. On the “Stakeholders vs Issues” tab, assign each stakeholder an influence rating (e.g. numerical rating such as 1, 5 or 10) in column C.
4. On the “Stakeholders vs Issues” tab, assign a rating (e.g. certain, likely, possible, unlikely, rare) to each pair of stakeholder and issue.
5. On the “Risks vs Issues” tab, assign a rating (e.g. certain, likely, possible, unlikely, rare) to each pair of risk and issue.
6. On the “Initiatives vs Issues” tab, assign a rating (e.g. certain, likely, possible, unlikely, rare) to each pair of initiative and issue.
7. Click on the “Run” button on the “Control Panel” tab to generate the risk mitigation factors.
8. Copy the risk mitigation factors displayed on the Results tab into the FV Tool on the “4. Sustainability Investments” tab in the input section.
The Excel-based stand-alone Risk Mitigation Tool at www.FVTool.com
Financial Valuation tool For SuStainability inVeStmentSUser GuideInPUT: Sustainability Programs 21
Risk Mitigation Ratings Tool Instructions
Financial Valuation tool For SuStainability inVeStmentSUser GuideInPUT: Sustainability Programs 22
description
In this step, the user needs to define possible sustainability investments and the potential for each investment to mitigate against the risks defined in Tab 3. The tool will automatically populate the defined risks.
The IFC has developed a separate tool called the Risk Mitigation Tool (https://fvtool.com/files/Risk%20Mitigation%20Ratings.xlsm) to help calculate the risk mitigation potential of each investment. It does this through an exercise mapping the interdependencies between the project’s stakeholders, issues, risks, and sustainability initiatives.
data Source
Sustainability planning budgets; Monitoring & Evaluation (M&E) logical framework, stakeholder engagement plan, etc.
data Entry
i. Enter the name of each program or initiative under “Sustainability Initiatives” in the first column of the table.
ii. Download and complete the Risk Mitigation Tool from the FVTool.com website. This tool will require users to map the interdependency between project stakeholders, issues, risks, and initiatives. Ensure that the risks and initiatives that are entered into the risk tool match the initiatives described in the FV Tool.
iii. Copy the risk mitigation percentages from the Results tab of the Risk Tool and enter them into the corresponding fields of Tab 4.
iv. Using the tick boxes, select whether the risk mitigation percentages apply to Scenarios A, B or both. If it does not apply, the tool will assume that no risk mitigation is taking place.
Consultation
In this step, the user will need to consult with the individuals responsible for planning sustainability programs and investments. Typically information on sustainability programs can be obtained from consultations with sustainability departments. As well, the finance department would be involved in any budgeting calculations for the costs of these programs or initiatives.
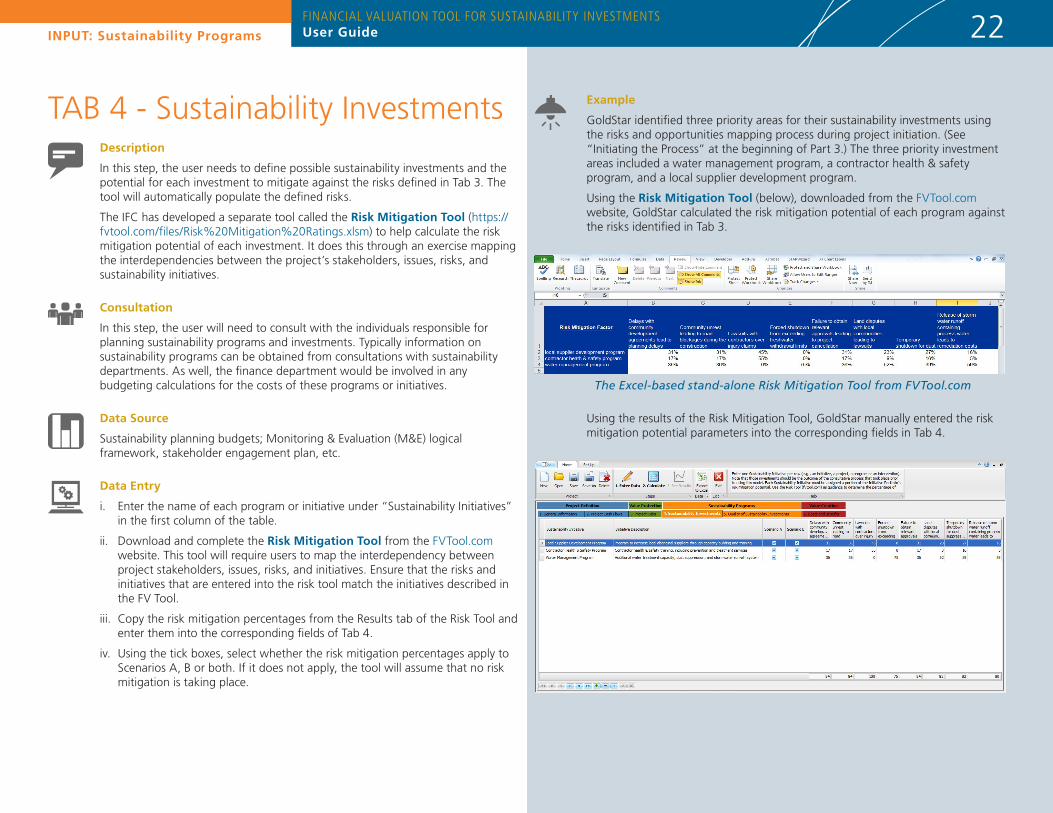
Example
GoldStar identified three priority areas for their sustainability investments using the risks and opportunities mapping process during project initiation. (See “Initiating the Process” at the beginning of Part 3.) The three priority investment areas included a water management program, a contractor health & safety program, and a local supplier development program.
Using the Risk Mitigation Tool (below), downloaded from the FVTool.com website, GoldStar calculated the risk mitigation potential of each program against the risks identified in Tab 3.
Using the results of the Risk Mitigation Tool, GoldStar manually entered the risk mitigation potential parameters into the corresponding fields in Tab 4.
TAB 4 - Sustainability Investments
The Excel-based stand-alone Risk Mitigation Tool from FVTool.com
Financial Valuation tool For SuStainability inVeStmentSUser GuideInPUT: Sustainability Programs 23
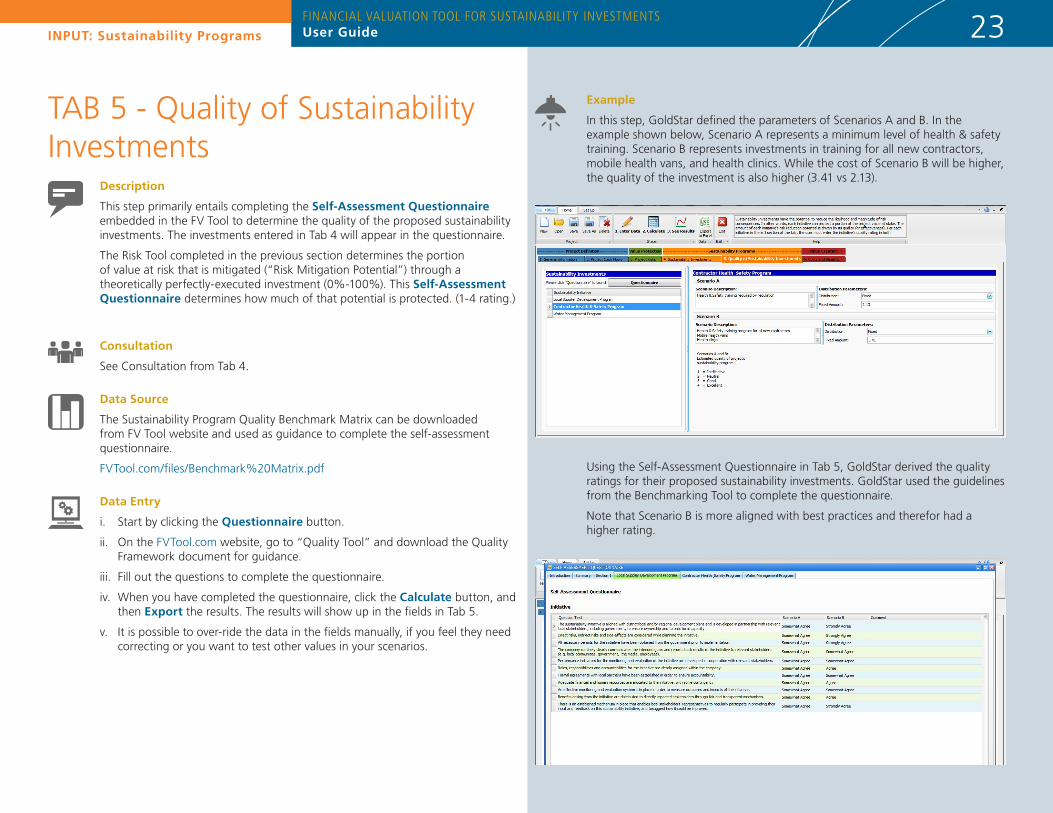
description
This step primarily entails completing the Self-Assessment Questionnaire embedded in the FV Tool to determine the quality of the proposed sustainability investments. The investments entered in Tab 4 will appear in the questionnaire.
The Risk Tool completed in the previous section determines the portion of value at risk that is mitigated (“Risk Mitigation Potential”) through a theoretically perfectly-executed investment (0%-100%). This Self-Assessment Questionnaire determines how much of that potential is protected. (1-4 rating.)
data Source
The Sustainability Program Quality Benchmark Matrix can be downloaded from FV Tool website and used as guidance to complete the self-assessment questionnaire.
FVTool.com/files/Benchmark%20Matrix.pdf
data Entry
i. Start by clicking the Questionnaire button.
ii. On the FVTool.com website, go to “Quality Tool” and download the Quality Framework document for guidance.
iii. Fill out the questions to complete the questionnaire.
iv. When you have completed the questionnaire, click the Calculate button, and then Export the results. The results will show up in the fields in Tab 5.
v. It is possible to over-ride the data in the fields manually, if you feel they need correcting or you want to test other values in your scenarios.
Consultation
See Consultation from Tab 4.
Example
In this step, GoldStar defined the parameters of Scenarios A and B. In the example shown below, Scenario A represents a minimum level of health & safety training. Scenario B represents investments in training for all new contractors, mobile health vans, and health clinics. While the cost of Scenario B will be higher, the quality of the investment is also higher (3.41 vs 2.13).
TAB 5 - Quality of Sustainability Investments
Using the Self-Assessment Questionnaire in Tab 5, GoldStar derived the quality ratings for their proposed sustainability investments. GoldStar used the guidelines from the Benchmarking Tool to complete the questionnaire.
Note that Scenario B is more aligned with best practices and therefor had a higher rating.
Collaborate with:• Sustainability• Finance• HR• Procurement
UseR
Operations
FinanceProcurement
Eh&ShR
Sustainability
Financial Valuation tool For SuStainability inVeStmentSUser GuideInPUT: Value Creation 24
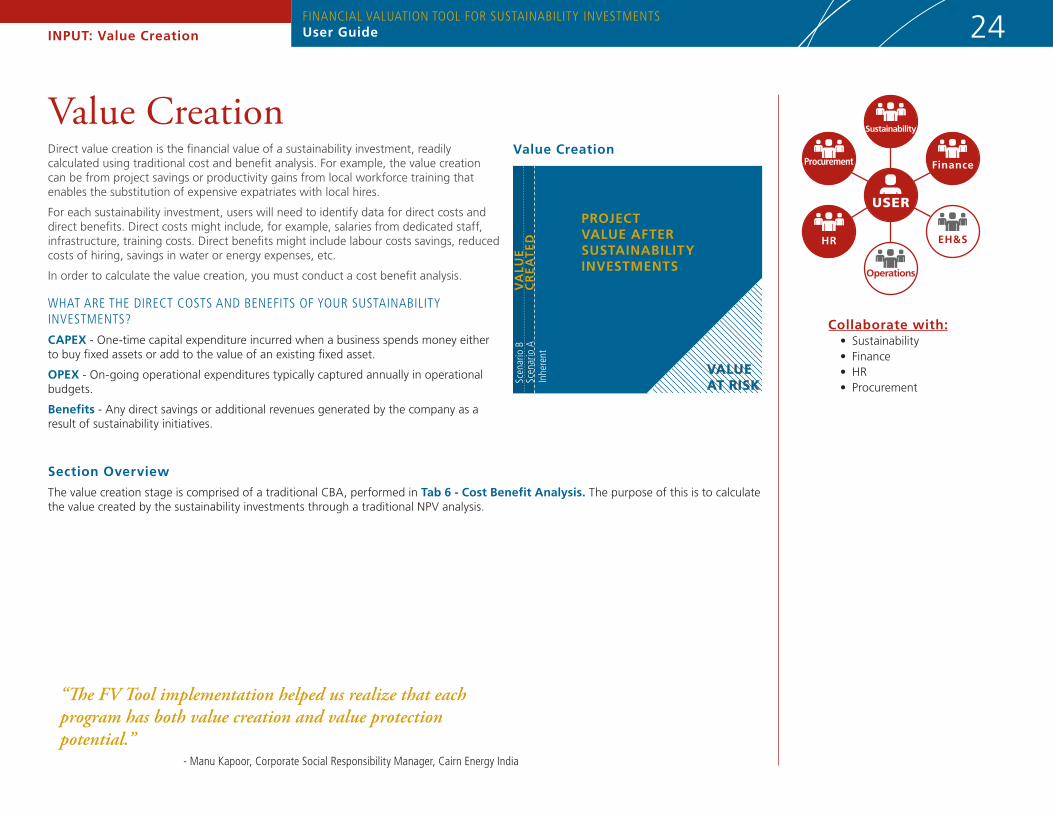
Value CreationDirect value creation is the financial value of a sustainability investment, readily calculated using traditional cost and benefit analysis. For example, the value creation can be from project savings or productivity gains from local workforce training that enables the substitution of expensive expatriates with local hires.
For each sustainability investment, users will need to identify data for direct costs and direct benefits. Direct costs might include, for example, salaries from dedicated staff, infrastructure, training costs. Direct benefits might include labour costs savings, reduced costs of hiring, savings in water or energy expenses, etc.
In order to calculate the value creation, you must conduct a cost benefit analysis.
what are the direct coStS and beneFitS oF your SuStainability inVeStmentS?
CAPEX - One-time capital expenditure incurred when a business spends money either to buy fixed assets or add to the value of an existing fixed asset.
OPEX - On-going operational expenditures typically captured annually in operational budgets.
Benefits - Any direct savings or additional revenues generated by the company as a result of sustainability initiatives.
Section Overview
The value creation stage is comprised of a traditional CBA, performed in Tab 6 - Cost Benefit Analysis. The purpose of this is to calculate the value created by the sustainability investments through a traditional NPV analysis.
“The FV Tool implementation helped us realize that each program has both value creation and value protection potential.”
- manu kapoor, corporate Social responsibility manager, cairn energy india
Value Creation
VA
LUE
CR
EA
TE
d
PROjECT VALUE AFTER SUSTAInABILITY InVESTMEnTS
inhe
rent
Scen
ario
aSc
enar
io b

Financial Valuation tool For SuStainability inVeStmentSUser GuideInPUT: Value Creation 25
TAB 6 - Costs & Benefi tsdescription
In this step, users conduct a traditional cost-benefi t analysis of the investments defi ned in Tab 4. The defi ned investments appear automatically in the left-hand panel of Tab 6. Each investment requires a break-down in terms of capital expenditures, operating expenses and savings or productivity gains due to the investment.
Users are encouraged to develop a separate Excel worksheet to defi ne the assumptions for costs for different scenarios in order to refi ne the assumptions through a consultative process before fi nalizing data entry.
data Source
Sustainability planning budgets, salary costs, etc.
data Entry
i. Develop an Excel worksheet to defi ne costs and benefi t associated with each of your sustainability investments. You can set up the spreadsheet according to the columns in Tab 6.
ii. Ensure that you create different cost and benefi t categories for scenarios A and B. Typically investments in scenario B will have higher costs but might also bring higher benefi ts.
iii. In the Excel fi le, costs should be broken out into capital expenditures (e.g. buildings, vehicles, latrines, etc.) and ongoing operating costs (e.g. salaries, training, etc.) throughout the life of the program.
iv. In the Excel fi le, estimate the tangible benefi ts that can be attributed to the program such as reduced labour costs, reduced hiring costs, water cost savings, energy cost savings, productivity increases. These will be represented as positives in the cost-benefi t analysis. Document all assumptions.
v. In the Excel fi le, explicitly state the differences between scenarios A and B.
vi. When you have completed the Excel fi le, enter data into the corresponding fi elds in Tab 6. Scenarios A & B are defi ned in the right-hand panel.
Consultation
Data sources are largely driven through the consultation process with the following departments.
Sustainability – Estimates for costs & benefi ts of the proposed programs.Finance – Cost estimates for sustainability spending.HR – Costs associated with labour, hiring retention, cost of training, etc. Procurement – Supply chain costs and local content spending.
Example
In the example below, GoldStar has quantifi ed the CAPEX, OPEX, and BENEFITS associated with the Local Supplier Development Program. For illustrative purposes, the results from the excel worksheet are displayed in a graphic.
CAPEX: Baseline study, building an enterprise centre
OPEX: Ongoing costs associated with coaching, additional procurement costs, community relations staff, and apprentice training.
BEnEFITS: Benefi ts included reduced cost of land negotiations and reduced complaints and grievances. These were estimated through a consultative process with fi nance and sustainability.
Note: Based on a direct cost-benefi t analysis, the local supplier development program yields a negative NPV since costs outweigh tangible benefi ts.
Once the costs and benefi ts of each program were clearly defi ned for scenarios A and B, they were entered into the FV Tool.
local SuPPlier deVeloPment ProGram

Collaborate with:• Sustainability• Finance• Operations
UseR
Operations
FinanceProcurement
Eh&ShR
Sustainability
Financial Valuation tool For SuStainability inVeStmentSUser GuideInterpreting Results 26
The Financial Valuation Tool for Sustainability Investments provides a wealth of information for users and other company stakeholders. This section introduces the reports generated and provides information on how to use them.
It may take several rounds of refi ning assumptions and tweaking data inputs before the model output is considered robust enough by the cross-functional management team to be appropriate to guide decision-making. While this refi ning and validating process may be time consuming, the exercise and debate typically yields learning that amplifi es the benefi ts of using the FV Tool.
Key questions:
what inVeStment PortFolioS haVe the hiGheSt return baSed on Value Protection and creation?
how to comPare inVeStment ScenarioS (inherent, a, and b)?
how to teSt inPutS and Validate FindinGS
Calculating the Results:
Once all the sub-tabs have been populated, the Calculate button prompts the software to generate (or model) the results.
Click See Results to view the output from the model.
The software generates a number of additional tabs that express the results from the valuation. These fi nal tabs are reporting tabs that have been locked to prevent manual editing. The tabs illustrate the results of direct value creation and indirect value protection. This section provides users with information on the reports generated. Before presenting reports to management, it is advisable to review and validate the results in an iterative manner.
In This Section
The overview of the modelling results is in the sub-tab called “Dashboard.”
Further analysis can be done in the other sub-tabs.
Part 4 - Evaluating OutPuts

Financial Valuation tool For SuStainability inVeStmentSUser GuideInterpreting Results 27
Example
After the software has finished calculating, the GoldStar team began their analysis by reviewing the dashboard. The following conclusions were drawn from the resulting output:• Every program being evaluated has a positive NPV overall• The total sustainability value added is approximately $62M• The Water Management Program has the highest overall NPV of $36 million• More than 75% of the overall value comes from value protection through
risk mitigation• The Local Supplier Development Program would have a negative NPV of $5
million based on a simple cost benefit analysis
description
The FV Tool calculates the NPV of the Inherent Scenario, Scenario A and Scenario B, and reports the average outcome in the Net Present Value (NPV) in the Analysis tab.
The Dashboard sub-tab reports the expected Value Creation, the relative share of Value Projection and Total Sustainability Added per sustainability investment. This information helps companies understand which sustainability investments perform better risk mitigation.
data Source
N/A
data Entry
i. Select the dashboard sub-tab.
ii. Select “Scenarios” from the drop-down menu. This is where you can compare the incremental differences between the three scenarios: Inherent, A, and B.
iii. Consider exporting the results to Excel to conduct detailed cash flow analysis.
Consultation
Once the results are generated, the valuation process team can review the various reports, and validate the results with company management and other internal stakeholders (e.g. operations, finance, etc.). Discussions and focus groups may require updating the FV Tool with changes to data, assumptions, scenarios and other inputs as new information becomes available. The FV Tool is intended to be used in an iterative process.
See Results
Value Creation (nPV): Average Net Present Value generated by the simulation of direct costs and benefits of each initiative.*
Value Protection (nPV): Average Net Present Value generated by indirect/intangible value protection through better risk management practices.*
Total Value Added (nPV): Sum of the Value Creation NPV and the Value Protection NPV (direct and indirect values).*
*All figures expressed in $1000s

IFC - Financial Valuation Tool for Sustainability Investments
User Guide For FV Tool Version. 1.0.1.8
Created by The International Finance Corporation and Deloitte LLP
© 2014 IFC


