26
0 FY 12/3 Results Presentation May 15, 2012 http://www.dts.co.jp/ DTS Corporation

0
FY 12/3Results Presentation
May 15, 2012
http://www.dts.co.jp/DTS Corporation

1
ContentsContents
I FY 12/3 Results
II Progress of Key Initiatives
III FY 13/3 Forecast
Sales and income forecasts included in this document are based on assumptions made on the basis of information currently available, including business trends, economic circumstances, clients’ trends, etc., and can be affected by various uncertainties. Actual sales and income may differ materially from the forecasts.
Caution

2
I. FY 12/3 ResultsI. FY 12/3 Results

3
FY12/3 Results (NonFY12/3 Results (Non--Consolidated)Consolidated)
Amount Ratio to sales (%) Year on year vs. initial forecasts
Net sales 34,502 – 97.4% -904 95.3% -1,697
Gross profit 5,727 16.6% 121.8% +1,023 106.1% +321
SG&A expenses 3,020 8.8% 99.8% -6 94.4% -179
Operating income 2,707 7.8% 161.4% +1,029 123.1% +507
Recurring income 2,882 8.4% 154.8% +1,020 122.6% +532
Net income 1,595 4.6% 173.2% +674 118.2% +245
(Units: Million yen, %)
24,913
10,067
425
24,080
10,043
3780
5,000
10,000
15,000
20,000
25,000
30,000
System Operation Products and other
Year ended March 2011Year ended March 2012 (fiscal year under review)
4
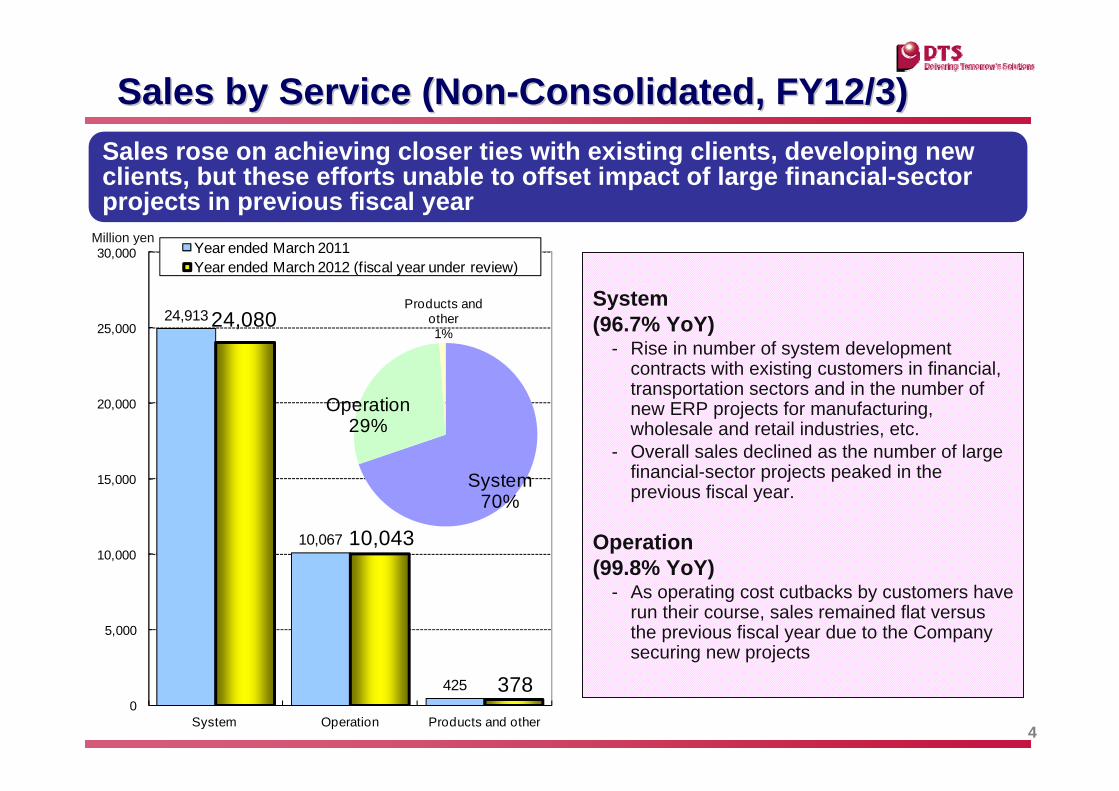
Sales by Service (NonSales by Service (Non--Consolidated, FY12/3)Consolidated, FY12/3)Sales rose on achieving closer ties with existing clients, developing new clients, but these efforts unable to offset impact of large financial-sector projects in previous fiscal year
Million yen
System 70%
Operation29%
Products and other1%
System (96.7% YoY)
- Rise in number of system development contracts with existing customers in financial, transportation sectors and in the number of new ERP projects for manufacturing, wholesale and retail industries, etc.
- Overall sales declined as the number of large financial-sector projects peaked in the previous fiscal year.
Operation(99.8% YoY)
- As operating cost cutbacks by customers have run their course, sales remained flat versus the previous fiscal year due to the Company securing new projects

13,426
9,411
6,718
5,424
12,144
8,996
7,404
5,578
0
2,000
4,000
6,000
8,000
10,000
12,000
14,000
16,000
Finance Transportation &Communications
Services Other
Year ended March 2011Year ended March 2012 (f iscal year under review)
5
Sales by End User (NonSales by End User (Non--Consolidated, FY12/3)Consolidated, FY12/3)Financial-related sales rose due to intensified ties with existing clients and garnering new clients, offsetting a fall in the number of large projects; services and manufacturing sector sales up as new clients secured
Million yen
Finance (90.5% YoY)- Sales down in reaction to impact of large projects
in previous fiscal year - Sales rose in megabank and integration projects- Increased amount of services to the securities
industry as new AMO projects wonTransportation & Communications (95.6% YoY)
- Sales rose in transportation and mobile communications
- Frontline sales projects downServices (110.2% YoY)
- Sales up in a broad range of customer segments, including advertising and amusement
Other (102.8% YoY)- Sales rose in ERP-related projects, etc. in the
manufacturing sector- Sales rose in the wholesale and retail sectors,
sales down in the public sectorPortion for the manufacturing
industry
2,0792,496
(Analyses of Systems and Operation items)
Finance36%
Communi-cations
26%
Services22%
Other16%

Year endedMarch 2011
Year endedMarch 2012
1.3%4) O
ther cost-cuttinginitiatives
0.6%
1) Improvem
entin low
-returnbusiness
+3.3 pt
16.6%
0.5%
0.9%
3) Rise in the labor
utilization ratio13.3%
2) Decline in less
profitable projects
6
Gross Profit (NonGross Profit (Non--Consolidated, FY12/3)Consolidated, FY12/3)Gross profit margin improved mainly due to:Gross profit margin improved mainly due to:
(i) improvement in low(i) improvement in low--return business, (ii) decline in less profitable return business, (ii) decline in less profitable projects, (iii) higher labor utilization ratioprojects, (iii) higher labor utilization ratio

7
Operating Income and Recurring Income Operating Income and Recurring Income (Non(Non--Consolidated, FY12/3)Consolidated, FY12/3)
Strategic investment outlays in line with mediumStrategic investment outlays in line with medium--term management planterm management planSG&A expense fell on aggressive costSG&A expense fell on aggressive cost--cutting initiativescutting initiatives
SG&A expenses ¥3,020 million yen(99.8% YoY; 8.8% of sales (+0.3 pts YoY))
Operating income ¥2,707 million yen(161.4% YoY; 7.8% of sales (+3.1 pts YoY))
Recurring income ¥2,882 million yen(154.8% YoY; 8.4% of sales (+3.1 pts YoY))
Rise in strategic investment (Creation of new businesses, strengthening of sales systems and management infrastructure, etc.)
+¥107 millionReduction due to cost cuts, etc. -¥113 million
8
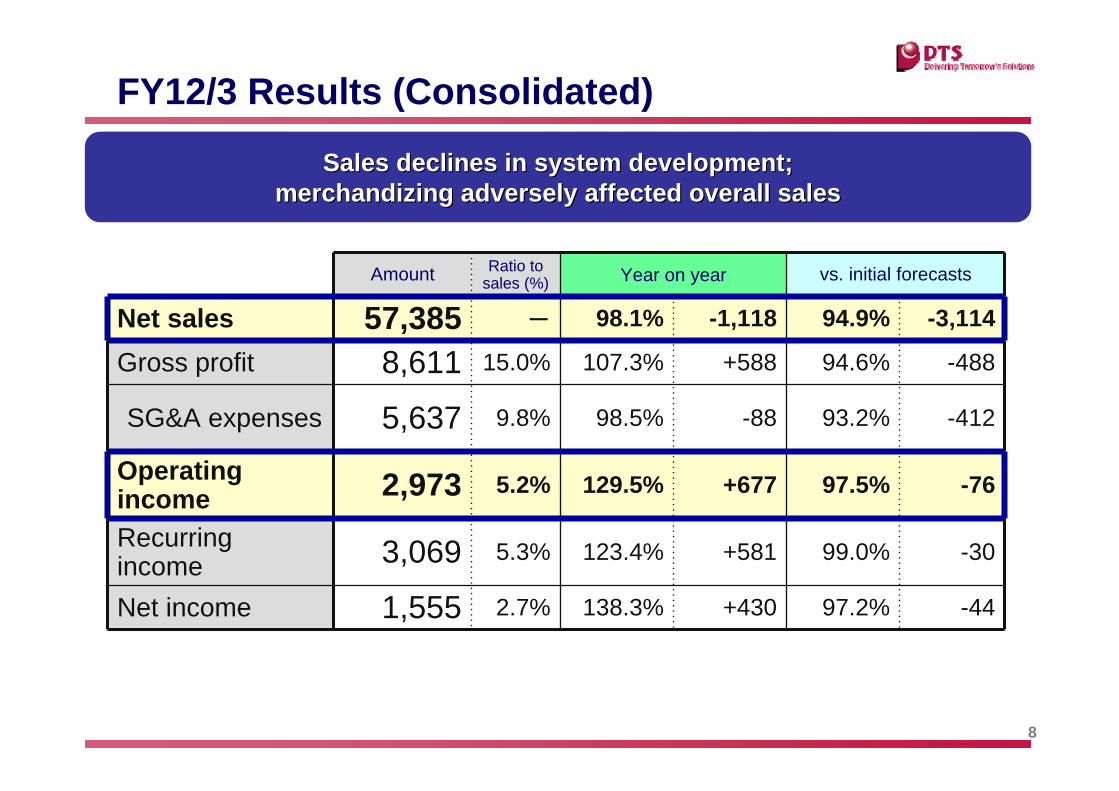
FY12/3 Results (Consolidated)
Amount Ratio to sales (%) Year on year vs. initial forecasts
Net sales 57,385 - 98.1% -1,118 94.9% -3,114
Gross profit 8,611 15.0% 107.3% +588 94.6% -488
SG&A expenses 5,637 9.8% 98.5% -88 93.2% -412
Operating income 2,973 5.2% 129.5% +677 97.5% -76
Recurring income 3,069 5.3% 123.4% +581 99.0% -30
Net income 1,555 2.7% 138.3% +430 97.2% -44
(Units: Million yen, %)
Sales declines in system development; Sales declines in system development; merchandizing adversely affected overall salesmerchandizing adversely affected overall sales
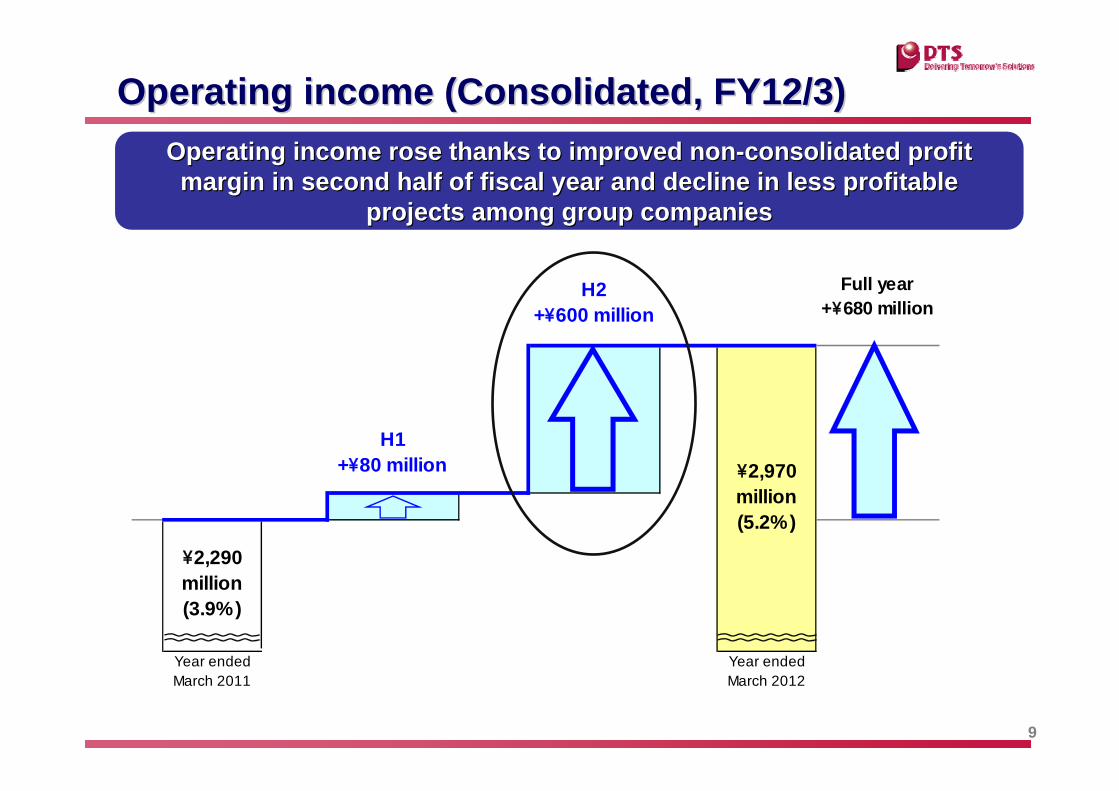
Year endedMarch 2011
Year endedMarch 2012
Full year+\680 million
\2,970million(5.2%)
H2+\600 million
\2,290million(3.9%)
H1+\80 million
9
Operating income (Consolidated, FY12/3)Operating income (Consolidated, FY12/3)Operating income rose thanks to improved nonOperating income rose thanks to improved non--consolidated profit consolidated profit margin in second half of fiscal year and decline in less profitamargin in second half of fiscal year and decline in less profitable ble
projects among group companiesprojects among group companies

10
Group Company Results (FY12/3)(Units: Million yen, %) Net sales Operating income
Company name Amount YoY (%) vs plan Amount Ratio to sales (%) YoY (%) vs plan
DATALINKS CORPORATION 7,971 97.8% 97.7% 215 2.7% 91.9% 86.0%
DIGITAL TECHNOLOGIES CORPORATION
5,608 89.4% 87.9% 25 0.5% 117.4% 17.8%
FAITEC CORPORATION 5,483 111.6% 101.6% 103 1.9% 21.1% 99.6%
JAPAN SYSTEMS ENGINEERING CORPORATION
4,027 87.5% 98.0% 167 4.2% 49.4% 90.9%
KYUSHU DTS CORPORATION 1,336 135.5% 106.1% 45 3.4% 258.1% 107.0%
SOUGOU SYSTEM SERVICE CORPORATION
1,013 101.9% 94.5% -111 - [+20] [-43]
MIRUCA CORPORATION 385 99.2% 95.2% 3 1.0% 35.1% 48.8%
Notes: Figures for each company are on a non-consolidated basis, so the total does not equal consolidated figures. Figures in brackets represent FY 12/3 amount minus FY 11/3 amount.
11
II. Progress of Key InitiativesII. Progress of Key Initiatives

12
Key InitiativesKey Initiatives
1.1. Strengthening the Sales ForceStrengthening the Sales Force
2.2. Enhancement of SI CapabilitiesEnhancement of SI Capabilities
3.3. Strengthening New Businesses and Strengthening New Businesses and Global DevelopmentGlobal Development
4.4. Establishing the Business FoundationsEstablishing the Business Foundations
5.5. Strengthening Collective Strength of the Strengthening Collective Strength of the Group Group
13
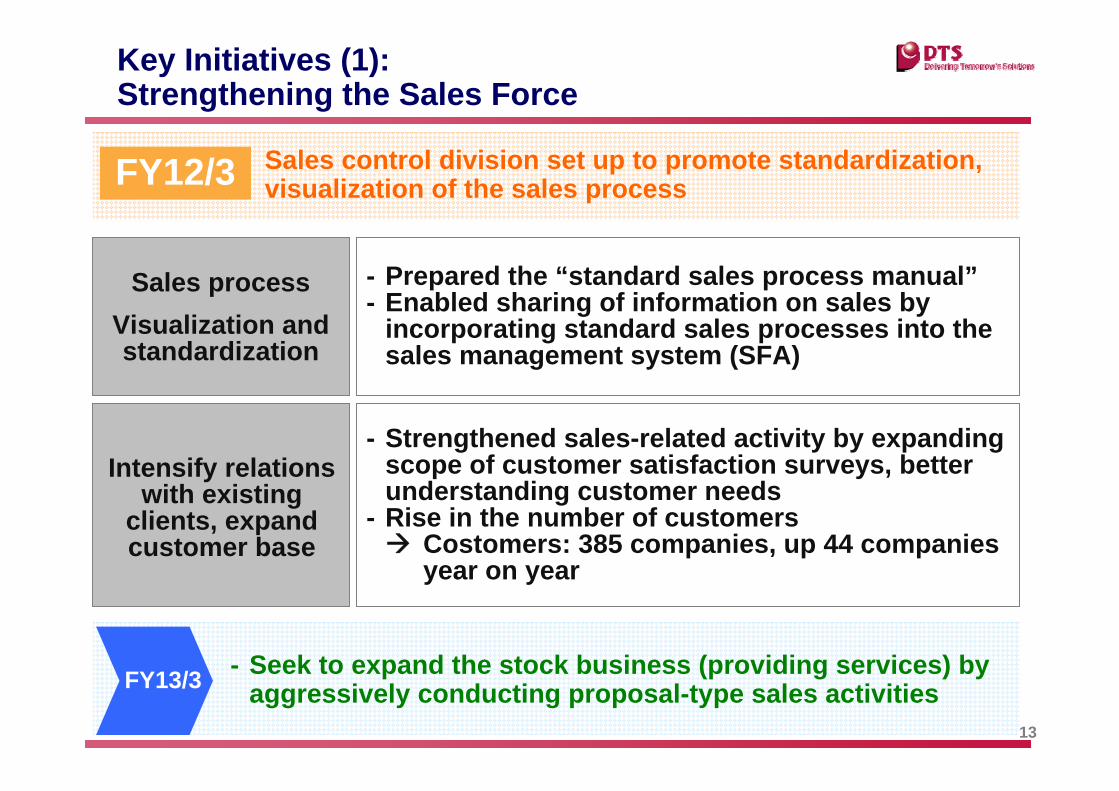
Key Initiatives (1): Strengthening the Sales Force
Sales processVisualization and standardization
- Prepared the “standard sales process manual”- Enabled sharing of information on sales by
incorporating standard sales processes into the sales management system (SFA)
- Strengthened sales-related activity by expanding scope of customer satisfaction surveys, better understanding customer needs
- Rise in the number of customers Costomers: 385 companies, up 44 companies
year on year
Sales control division set up to promote standardization, visualization of the sales process
FY13/3 - Seek to expand the stock business (providing services) by aggressively conducting proposal-type sales activities
Intensify relations with existing
clients, expand customer base
FY12/3
14
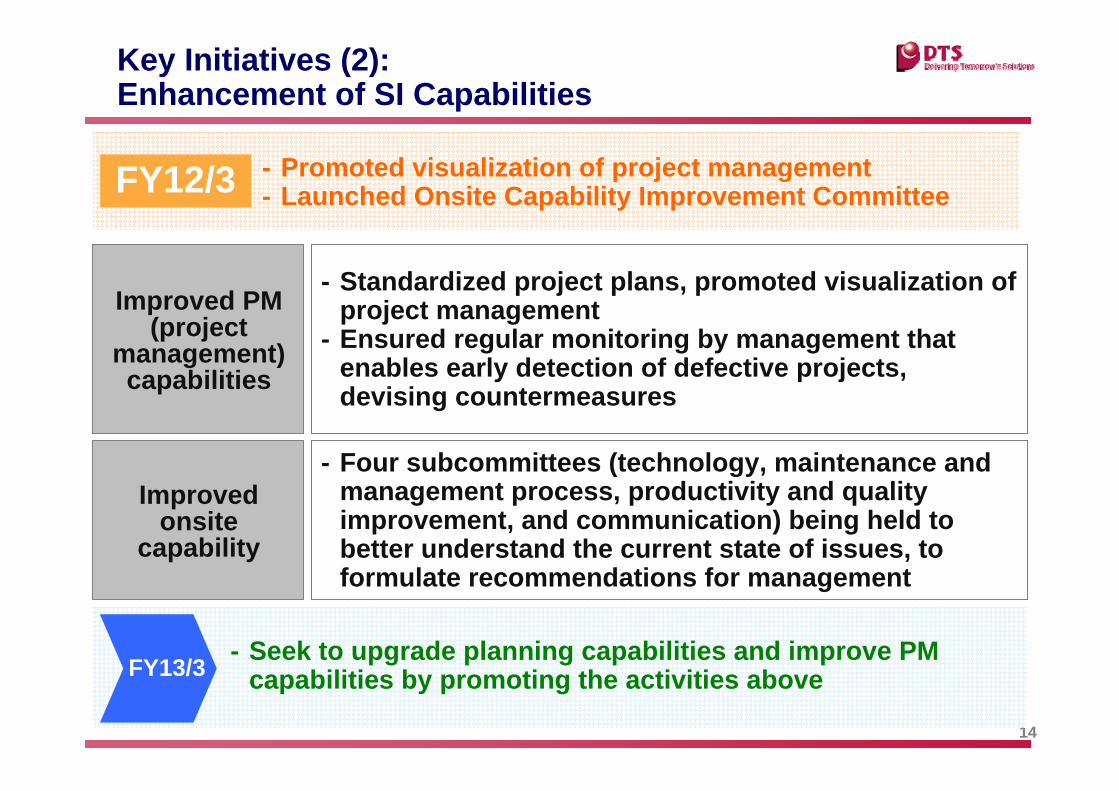
Key Initiatives (2): Enhancement of SI Capabilities
Improved onsite
capability
- Four subcommittees (technology, maintenance and management process, productivity and quality improvement, and communication) being held to better understand the current state of issues, to formulate recommendations for management
- Standardized project plans, promoted visualization of project management
- Ensured regular monitoring by management that enables early detection of defective projects, devising countermeasures
- Promoted visualization of project management- Launched Onsite Capability Improvement Committee
- Seek to upgrade planning capabilities and improve PM capabilities by promoting the activities aboveFY13/3
FY12/3
Improved PM (project
management) capabilities

15
Key Initiatives (3): Strengthening New Businesses and Global Development
- BI Tools:“DaTaStudio Finder”“BI NavigationStudio”
- Electricity saving measures: “Smart Lighting Controller”- Security:“EAGISCORP for Let’s note”
Creation of new solutions
- Promote aggressive investments for swift business development
- Expand overseas bases to establish global business base
- New solutions created through active use of alliances- Global business expanded in manufacturing, finance,
construction
Expansion of global
business
- China: Business expanded through development projects for local manufacturers, operating projects for a Japanese affiliated financial institution, etc.
- Vietnam: BPO project for a Japanese affiliated construction company (CAD-related)
- Singapore: Data center project for a Japanese affiliated financial institution
- United States: Incorporated local affiliate; launched development project for a Japanese affiliated financial institution
FY13/3
FY12/3

16
Key Initiatives (4): Establishing the Business Foundations
Establishment of in-house systems for
the next business year
- Built human resources systems that comply with project management systems, new human resources system
- Launched work on establishing systems to achieve enhanced sales, development processes, including customer management and project management systems
Human resources
systems and human
resource development
- Built a human resources system that works with employees based on their role and achievements to spur them to initiate independent innovation
- Promoted development of human resources with high skill levels (internal certification, external qualifications)
* Ratio of external qualification acquisition: 242.3%, up 12.2 percentage points year on year
- In order to continue expansion and growth, work on improving and expanding internal information systems in a bid to strengthen management base
- Personnel program reforms and the establishment of in-house systems for the next business year were promoted.
FY13/3
FY12/3

17
Key Initiatives (5):Strengthening the Collective Strength of the Group
Enhancement of group
governance /SI capabilities
- Risk / cost management for the entire Group Launched the group SI capability improvement
conference that monitors project status and takes necessary action; set up to enable early understanding of important projects and information of each Group company
- Expanded joint order acceptance by using each Group company’s strength
- Enhanced group governance / SI capabilities
Joint order acceptance
Enhancement of group sales
capabilities
- Joint development of life, non-life insurance-related, mutual aid-related projects
- Mutual synergy in both infrastructure and hardware- Joint order acceptance for nearshore projects for
banks, etc. Launched group sales capability conference to
promote cooperation within the Group
- Work on improving profitability of each Group company through business structural reform FY13/3
FY12/3

18
III. III. FY 13/3 ForecastFY 13/3 Forecast

19
Outlook for Business Environment Outlook for Business Environment (FY13/3)(FY13/3)
Sector Topic Market trend
FinanceFinance
• Large projects will shift from the review phase to full-fledged launch.
• Projects related to settlement, information, overseas are expected to take form.
• Strong investments in integrated projects will likely continue.
• Strong activity expected among life and non-life insurance, other trust companies, etc.
Transportation & Transportation & CommunicationsCommunications
• Strong investments will likely continue for mobile communications, especially in the smartphone-related areas.
• Transportation sector projects expected to remain firm
ServicesServicesOtherOther
• Strong investments will likely continue in ERP-(manufacturing, wholesale, retail, etc.) and embedding-related (manufacturing) areas; to focus on new areas in the public sector.
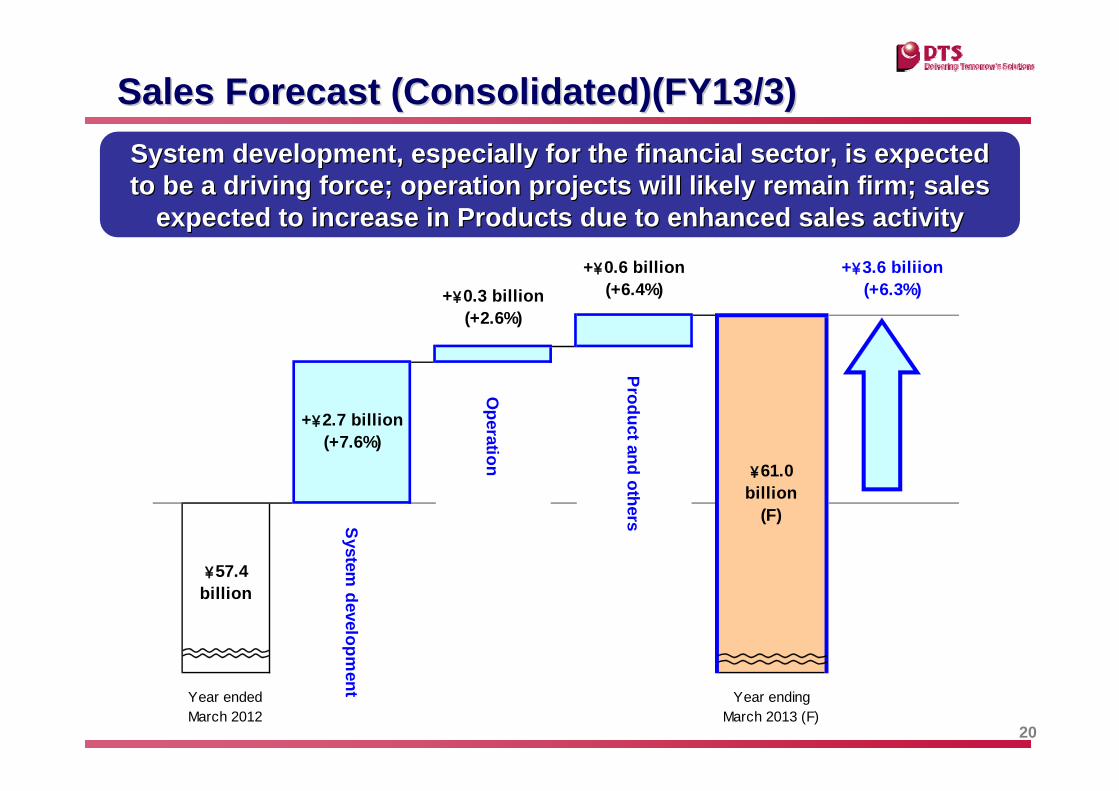
Year endedMarch 2012
Year endingMarch 2013 (F)
+\3.6 biliion(+6.3%)
System developm
ent
Product and others
Operation
+\0.3 billion(+2.6%)
+\0.6 billion(+6.4%)
\57.4billion
+\2.7 billion(+7.6%)
\61.0billion
(F)
20
Sales Forecast (ConsolidatedSales Forecast (Consolidated)(FY13/3))(FY13/3)System development, especially for the financial sector, is expeSystem development, especially for the financial sector, is expected cted to be a driving force; operation projects will likely remain firto be a driving force; operation projects will likely remain firm; sales m; sales
expected to increase in Products due to enhanced sales activityexpected to increase in Products due to enhanced sales activity
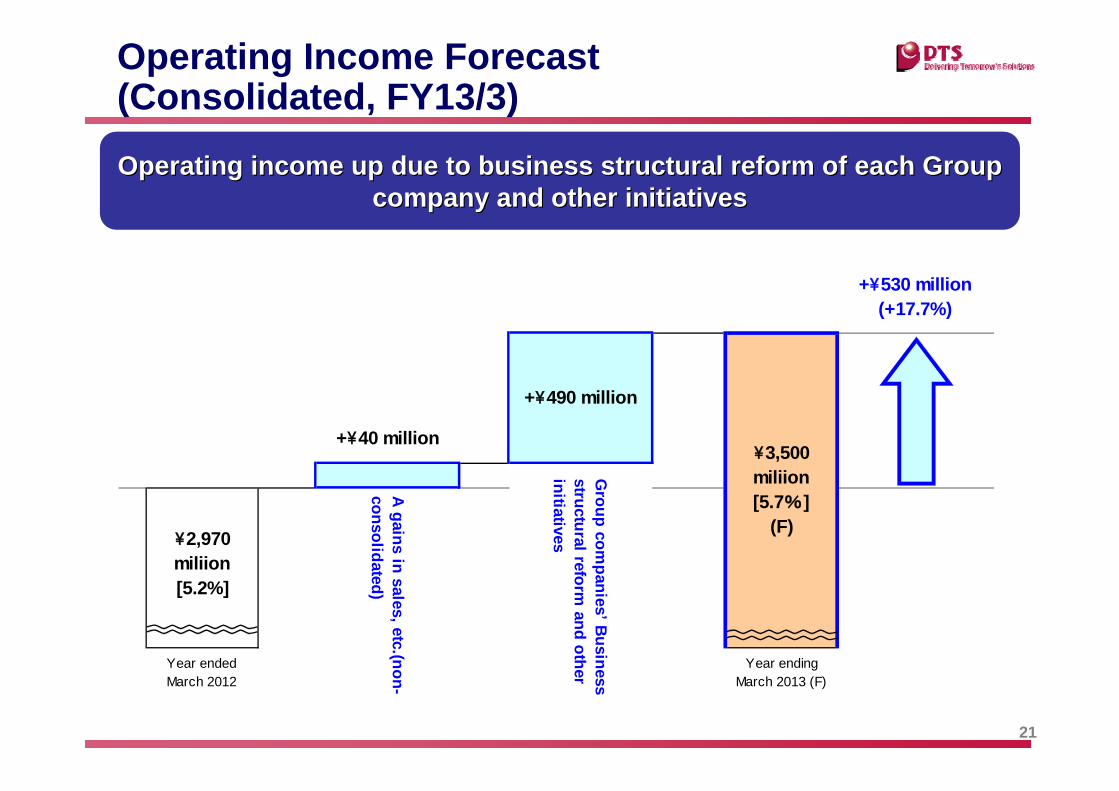
Year endedMarch 2012
Year endingMarch 2013 (F)
+\530 million(+17.7%)
Group com
panies’ Business
structural reform and other
initiatives\2,970miliion[5.2%]
A gains in sales, etc.(non-
consolidated)
\3,500miliion[5.7%]
(F)
+\490 million
+\40 million
21
Operating Income Forecast(Consolidated, FY13/3)
Operating income up due to business structural reform of each GrOperating income up due to business structural reform of each Group oup companycompany and other initiativesand other initiatives

22
Non-Consolidated and Consolidated Performance Forecasts for Fiscal Year Ending March 2013
(Units: Million yen, %)
Non-consolidated Consolidated
Amount Ratio to sales (%) YoY Amount Ratio to
sales (%) YoY
Net sales 36,900 – 107.0% +2,397 61,000 – 106.3% +3,614
Gross profit 5,950 16.1% 103.9% +222 9,300 15.2% 108.0% +688
SG&A expenses 3,200 8.7% 105.9% +179 5,800 9.5% 102.9% +162
Operating income 2,750 7.5% 101.6% +42 3,500 5.7% 117.7% +526
Recurring income 2,900 7.9% 100.6% +17 3,550 5.8% 115.7% +480
Net income 1,650 4.5% 103.4% +54 1,800 3.0% 115.7% +244

23
Non-Consolidated and Consolidated Performance Forecasts for First Half of Fiscal Year Ending March 2013
Non-consolidated Consolidated
Amount Ratio to sales (%) YoY Amount Ratio to
sales (%) YoY
Net sales 17,300 – 102.7% +451 29,700 – 105.3% +1,499
Gross profit 2,450 14.2% 92.7% -191 4,100 13.8% 104.6% +180
SG&A expenses 1,600 9.2% 103.4% +52 2,950 9.9% 101.6% +45
Operating income 850 4.9% 77.7% -244 1,150 3.9% 113.3% +134
Recurring income 900 5.2% 73.2% -329 1,200 4.0% 112.4% +132
Net income 500 2.9% 62.3% -302 600 2.0% 117.7% +90
(Units: Million yen, %)
24
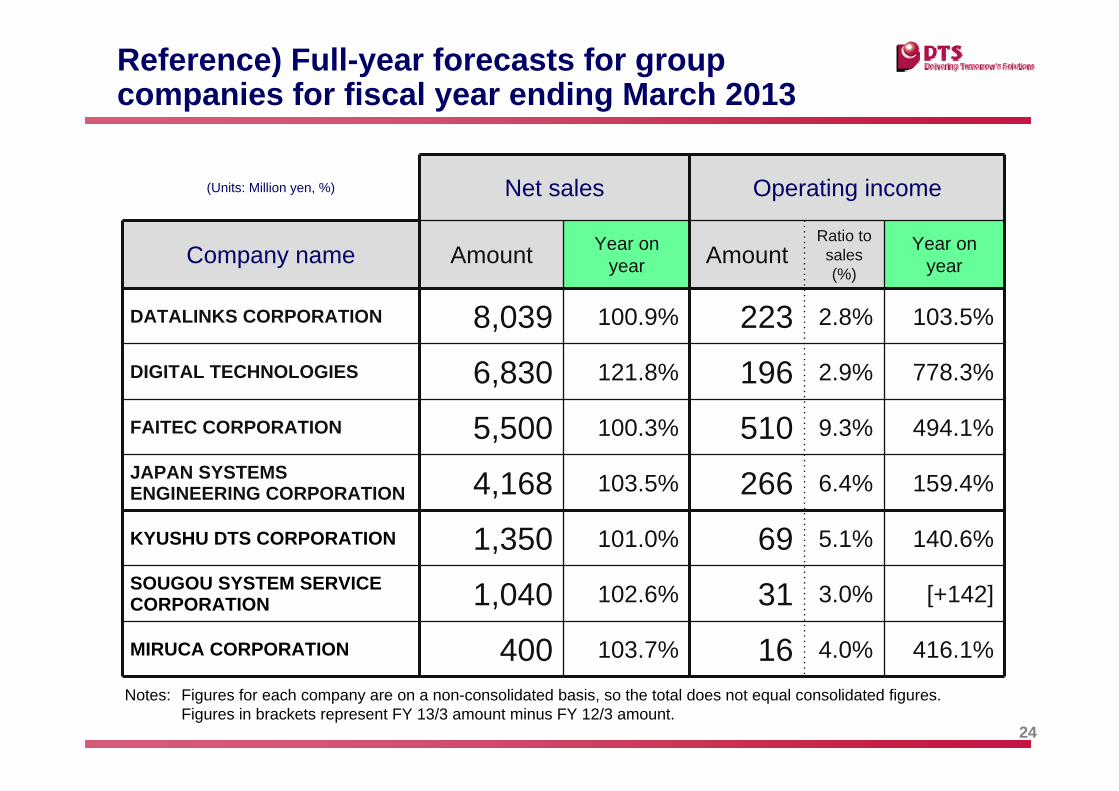
Reference) Full-year forecasts for group companies for fiscal year ending March 2013
Notes: Figures for each company are on a non-consolidated basis, so the total does not equal consolidated figures. Figures in brackets represent FY 13/3 amount minus FY 12/3 amount.
(Units: Million yen, %) Net sales Operating income
Company name Amount Year on year Amount
Ratio to sales (%)
Year on year
DATALINKS CORPORATION 8,039 100.9% 223 2.8% 103.5%
DIGITAL TECHNOLOGIES 6,830 121.8% 196 2.9% 778.3%
FAITEC CORPORATION 5,500 100.3% 510 9.3% 494.1%
JAPAN SYSTEMS ENGINEERING CORPORATION 4,168 103.5% 266 6.4% 159.4%
KYUSHU DTS CORPORATION 1,350 101.0% 69 5.1% 140.6%
SOUGOU SYSTEM SERVICE CORPORATION 1,040 102.6% 31 3.0% [+142]
MIRUCA CORPORATION 400 103.7% 16 4.0% 416.1%
25
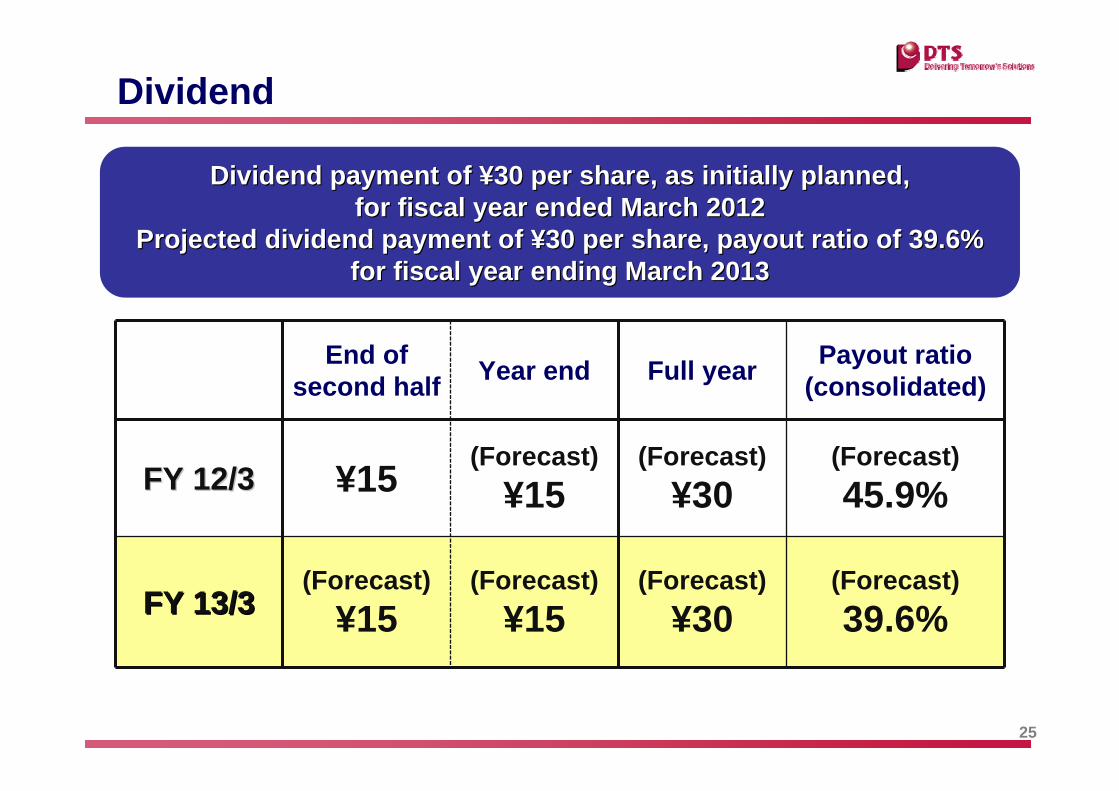
Dividend
円 Dividend payment of Dividend payment of ¥¥30 per share, as initially planned,30 per share, as initially planned,for fiscal year ended March 2012for fiscal year ended March 2012
Projected dividend payment of Projected dividend payment of ¥¥30 per share, payout ratio of 39.6% 30 per share, payout ratio of 39.6% for fiscal year ending March 2013for fiscal year ending March 2013
End of second half Year end Full year Payout ratio
(consolidated)
FY 12/3FY 12/3 ¥15(Forecast)
¥15(Forecast)
¥30(Forecast)45.9%
FY 13/3FY 13/3(Forecast)
¥15(Forecast)
¥15(Forecast)
¥30(Forecast)39.6%


