36
FY 2016 Financial Results Milan – March 1 st 2017

FY 2016 Financial Results
Milan – March 1st 2017

Agenda
FY 2016 Financial Results 2
FY 2016 Highlights
o Group overview
o Results by business
Financial results
Appendix
FY 2016 Financial Results 3
FY 2016 Highlights
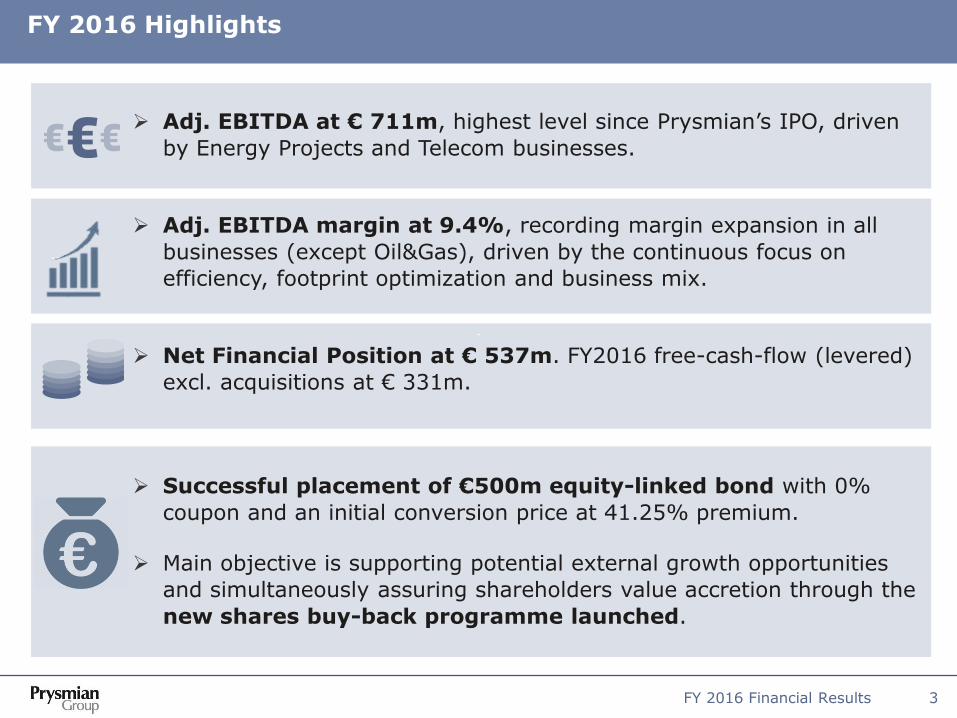
Adj. EBITDA at € 711m, highest level since Prysmian’s IPO, driven
by Energy Projects and Telecom businesses.
Adj. EBITDA margin at 9.4%, recording margin expansion in all
businesses (except Oil&Gas), driven by the continuous focus on
efficiency, footprint optimization and business mix.
Net Financial Position at € 537m. FY2016 free-cash-flow (levered)
excl. acquisitions at € 331m.
Successful placement of €500m equity-linked bond with 0%
coupon and an initial conversion price at 41.25% premium.
Main objective is supporting potential external growth opportunities
and simultaneously assuring shareholders value accretion through the
new shares buy-back programme launched.

FY 2016 Financial Results 4
623 711
2015 2016
FY 2016 Key Financials Euro Millions, % on Sales
Sales Adjusted EBITDA (1)
Operative Net Working Capital (2) Net Financial Position
388
318
Dec-15 Dec-16
750
537
Dec-15 Dec-16
(1) Adjusted excluding non-recurring income/expenses, restructuring costs and other non-operating income (expenses); (2) Defined as NWC excluding derivatives; % on sales is defined as Operative NWC on annualized last quarter sales;
* Calculated on pro-forma annualized Q4 2015 Sales including OCI.
**∆ OCI Contribution FY’16 vs. FY’15
**∆ OCI Contribution FY’16 vs. FY’15 * Excl. €24m WL previous loss write-up
* Org. Growth
7,361 7,567
2015 2016
+1.0%*
537**
8.5% 9.4%
37**
4.9%* 4.2%
599*

FY 2016 Financial Results 5
221
260
128
154
122 127
16 8
134
163
15.6% 15.9%
4.6% 5.1% 8.1%
9.5%
3.8% 2.7%
12.1% 14.0% 8.5% 9.4%
Continued profitability improvement
FY’15 FY’16
Energy Projects
Underlying margin increase in all business excluding Oil&Gas
Oil&Gas Industrial & NWC.
Telecom Total
Ad
j. E
BITD
A (
€ m
illio
n) /
% O
rg
. G
ro
wth
E&I
+18.5% -3.1% -4.6% -29.3% +8.5%
Ad
j. E
BIT
DA
Marg
in
+1.0%
Energy Projects Oil&Gas
Industrial & NWC. Telecom Total E&I
FY’15 FY’16
±X.X% = Organic Growth
* Excl. €24m WL previous loss write-up
37**
**∆ OCI Contribution FY’16 vs. FY’15
37**
197*
~14%*
* Excl. €24m WL provision write-up
599*
8.1%*
711
623
14.7%**
** Excl. €8m bad debt provision
FY 2016 Financial Results 6
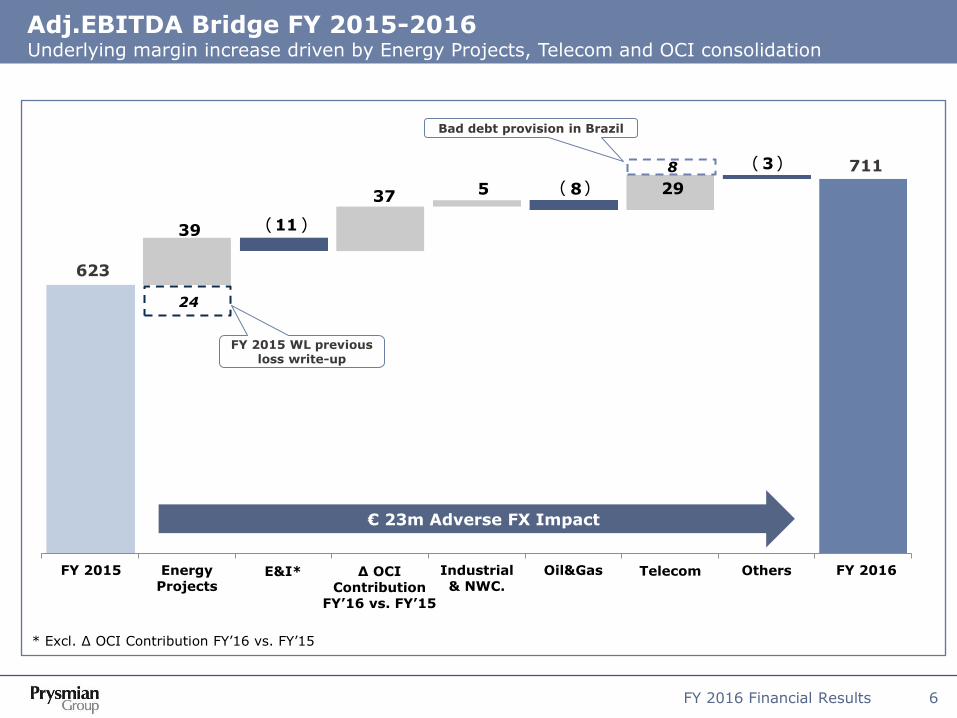
Adj.EBITDA Bridge FY 2015-2016 Underlying margin increase driven by Energy Projects, Telecom and OCI consolidation
623
623
651 651
688 685 685 711
711
39 11
37 5 8 29
3
24
8 ( )
FY 2015 WL previous loss write-up
Bad debt provision in Brazil
€ 23m Adverse FX Impact
( )
Energy Projects
Oil&Gas Industrial & NWC.
Telecom E&I* Others FY 2015 FY 2016 ∆ OCI Contribution
FY’16 vs. FY’15
( )
* Excl. ∆ OCI Contribution FY’16 vs. FY’15
FY 2016 Financial Results 7
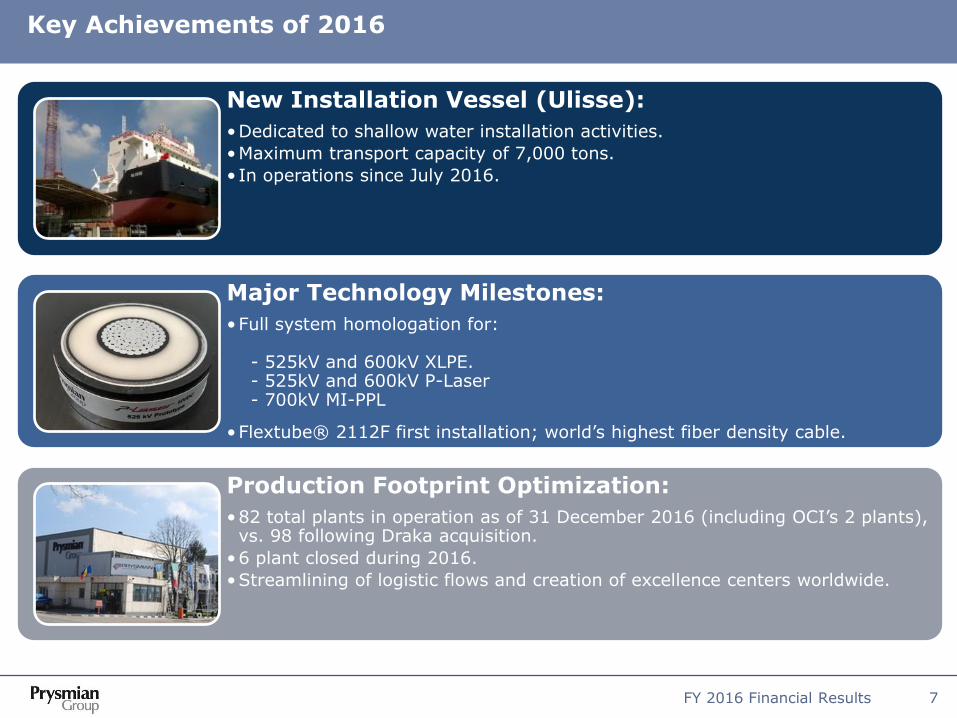
Key Achievements of 2016
New Installation Vessel (Ulisse):
•Dedicated to shallow water installation activities.
•Maximum transport capacity of 7,000 tons.
• In operations since July 2016.
Major Technology Milestones:
•Full system homologation for: - 525kV and 600kV XLPE. - 525kV and 600kV P-Laser - 700kV MI-PPL
•Flextube® 2112F first installation; world’s highest fiber density cable.
Production Footprint Optimization:
•82 total plants in operation as of 31 December 2016 (including OCI’s 2 plants), vs. 98 following Draka acquisition.
•6 plant closed during 2016.
•Streamlining of logistic flows and creation of excellence centers worldwide.

Agenda
FY 2016 Financial Results 8
FY 2016 Highlights
o Group overview
o Results by business
Financial results
Appendix
FY 2016 Financial Results 9
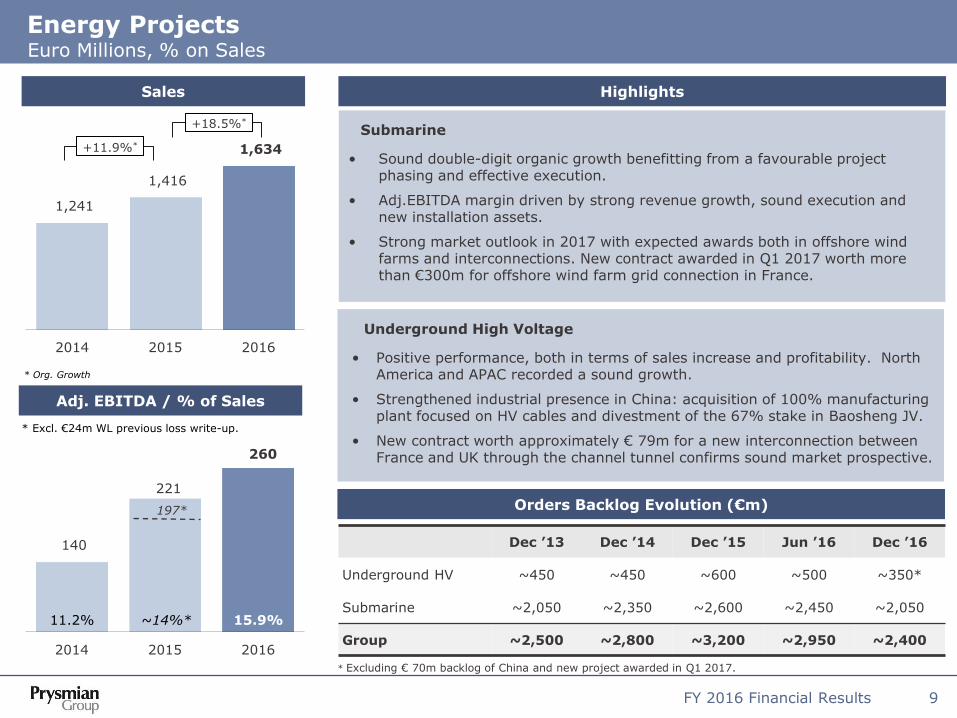
Energy Projects Euro Millions, % on Sales
Sales
Adj. EBITDA / % of Sales
Highlights
Orders Backlog Evolution (€m)
Dec ’13 Dec ’14 Dec ’15 Jun ’16 Dec ’16
Underground HV ~450 ~450 ~600 ~500 ~350*
Submarine ~2,050 ~2,350 ~2,600 ~2,450 ~2,050
Group ~2,500 ~2,800 ~3,200 ~2,950 ~2,400
Submarine
• Sound double-digit organic growth benefitting from a favourable project phasing and effective execution.
• Adj.EBITDA margin driven by strong revenue growth, sound execution and new installation assets.
• Strong market outlook in 2017 with expected awards both in offshore wind farms and interconnections. New contract awarded in Q1 2017 worth more than €300m for offshore wind farm grid connection in France.
Underground High Voltage
• Positive performance, both in terms of sales increase and profitability. North America and APAC recorded a sound growth.
• Strengthened industrial presence in China: acquisition of 100% manufacturing plant focused on HV cables and divestment of the 67% stake in Baosheng JV.
• New contract worth approximately € 79m for a new interconnection between France and UK through the channel tunnel confirms sound market prospective.
1,241
1,416
1,634
2014 2015 2016
* Org. Growth
+18.5%*
140
221
260
2014 2015 2016
11.2% ~14%* 15.9%
* Excl. €24m WL previous loss write-up.
+11.9%*
197*
* Excluding € 70m backlog of China and new project awarded in Q1 2017.
FY 2016 Financial Results 10
Energy & Infrastructure Euro Millions, % on Sales
Sales
Adj. EBITDA / % of Sales
Highlights
LTM Adj. EBITDA Evolution / % on LTM Sales
123 113 108 108 113 117 122
128 140
152 152 154
40
60
80
100
120
140
160
180
3.0%
3.5%
4.0%
4.5%
5.0%
5.5%
6.0%
6.5%
7.0%
7.5%
8.0%
Q1'14 Q2'14 Q3'14 Q4'14 Q1'15 Q2'15 Q3'15 Q4'15 Q1'16 Q2'16 Q3'16 Q4'16
LTM Adj.EBITDA
% on LTM Sales
24
∆ OCI Contribution LTM
12
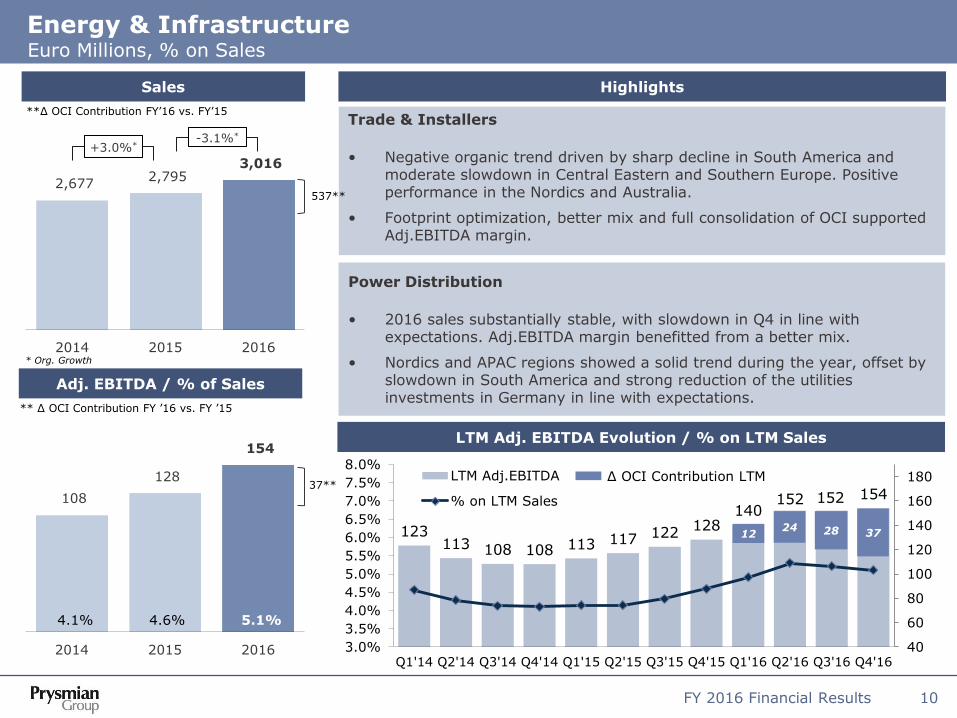
2,677 2,795
3,016
2014 2015 2016* Org. Growth
-3.1%*
**∆ OCI Contribution FY’16 vs. FY’15
108
128
154
2014 2015 2016
4.1% 4.6% 5.1%
** ∆ OCI Contribution FY ’16 vs. FY ’15
37**
28 37
+3.0%*
Trade & Installers
• Negative organic trend driven by sharp decline in South America and moderate slowdown in Central Eastern and Southern Europe. Positive performance in the Nordics and Australia.
• Footprint optimization, better mix and full consolidation of OCI supported Adj.EBITDA margin.
Power Distribution
• 2016 sales substantially stable, with slowdown in Q4 in line with expectations. Adj.EBITDA margin benefitted from a better mix.
• Nordics and APAC regions showed a solid trend during the year, offset by slowdown in South America and strong reduction of the utilities investments in Germany in line with expectations.
537**
FY 2016 Financial Results 11
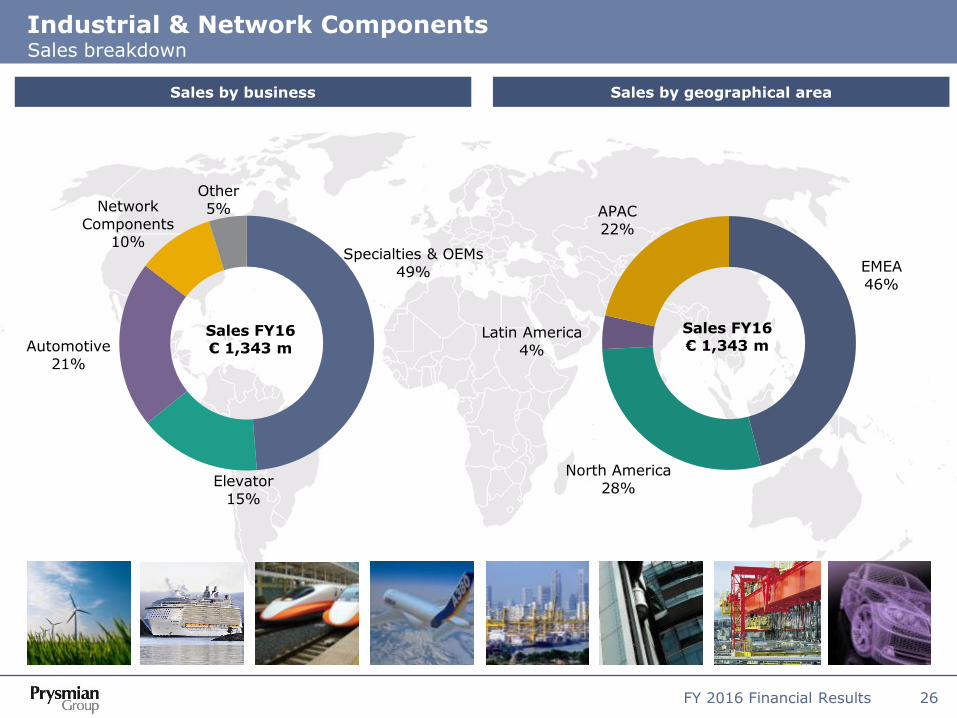
Industrial & Network Components Euro Millions, % on Sales
Highlights Sales
Adj. EBITDA / % of Sales
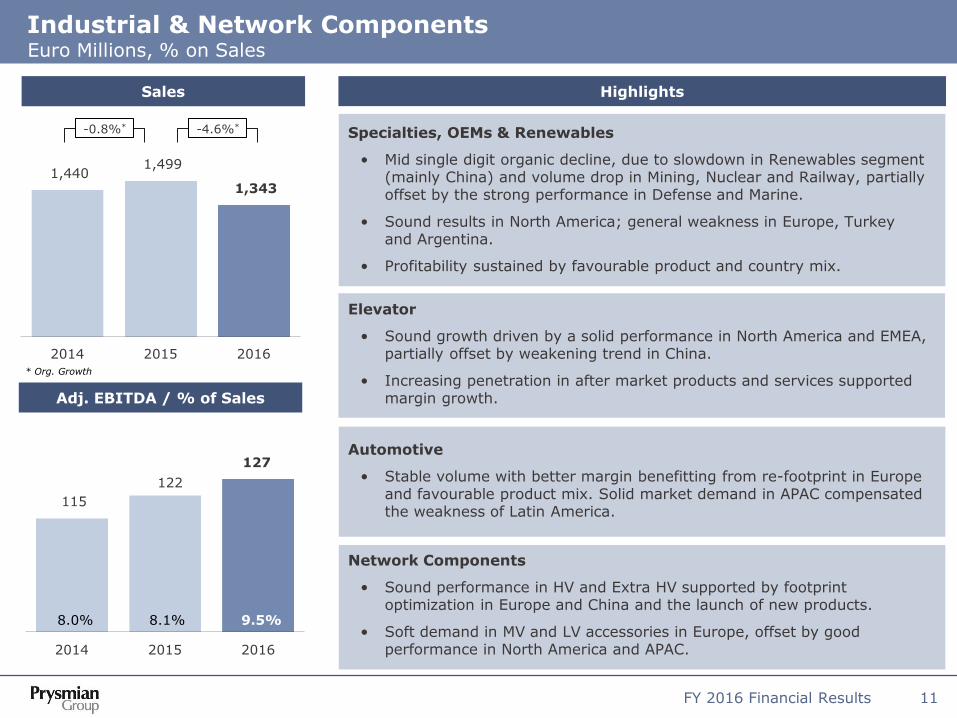
Specialties, OEMs & Renewables
• Mid single digit organic decline, due to slowdown in Renewables segment (mainly China) and volume drop in Mining, Nuclear and Railway, partially offset by the strong performance in Defense and Marine.
• Sound results in North America; general weakness in Europe, Turkey and Argentina.
• Profitability sustained by favourable product and country mix.
Elevator
• Sound growth driven by a solid performance in North America and EMEA, partially offset by weakening trend in China.
• Increasing penetration in after market products and services supported margin growth.
Automotive
• Stable volume with better margin benefitting from re-footprint in Europe and favourable product mix. Solid market demand in APAC compensated the weakness of Latin America.
Network Components
• Sound performance in HV and Extra HV supported by footprint optimization in Europe and China and the launch of new products.
• Soft demand in MV and LV accessories in Europe, offset by good performance in North America and APAC.
1,440 1,499
1,343
2014 2015 2016* Org. Growth
-4.6%*
115
122
127
2014 2015 2016
8.0% 8.1% 9.5%
-0.8%*
FY 2016 Financial Results 12
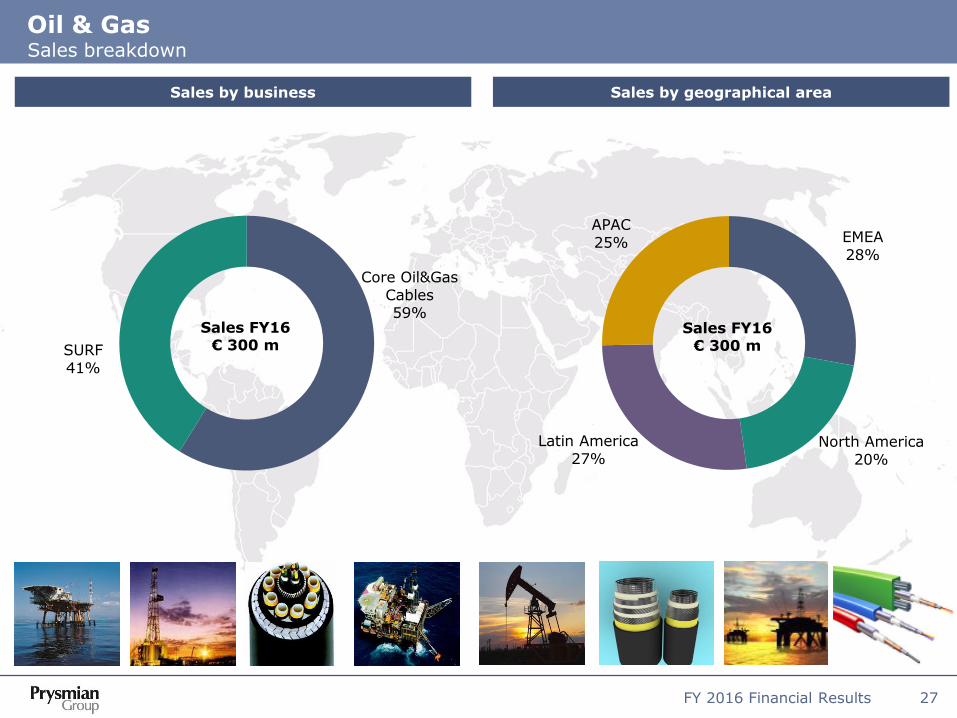
Oil & Gas Euro Millions, % on Sales
Sales
Adj. EBITDA / % of Sales
Highlights
Quarterly organic growth* evolution
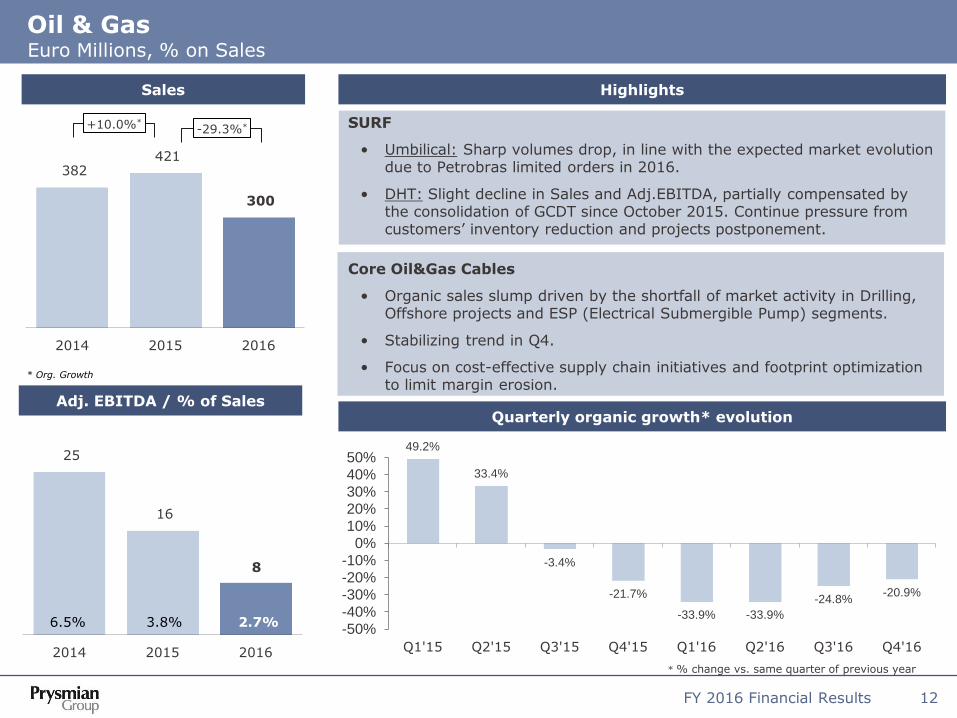
49.2%
33.4%
-3.4%
-21.7%
-33.9% -33.9%
-24.8% -20.9%
-50%-40%-30%-20%-10%
0%10%20%30%40%50%
Q1'15 Q2'15 Q3'15 Q4'15 Q1'16 Q2'16 Q3'16 Q4'16
SURF
• Umbilical: Sharp volumes drop, in line with the expected market evolution due to Petrobras limited orders in 2016.
• DHT: Slight decline in Sales and Adj.EBITDA, partially compensated by the consolidation of GCDT since October 2015. Continue pressure from customers’ inventory reduction and projects postponement.
Core Oil&Gas Cables
• Organic sales slump driven by the shortfall of market activity in Drilling, Offshore projects and ESP (Electrical Submergible Pump) segments.
• Stabilizing trend in Q4.
• Focus on cost-effective supply chain initiatives and footprint optimization to limit margin erosion.
382 421
300
2014 2015 2016
* Org. Growth
-29.3%*
25
16
8
2014 2015 2016
6.5% 3.8% 2.7%
+10.0%*
* % change vs. same quarter of previous year

FY 2016 Financial Results 13
116 134 163
2014 2015 2016
994
1,109 1,164
2014 2015 2016
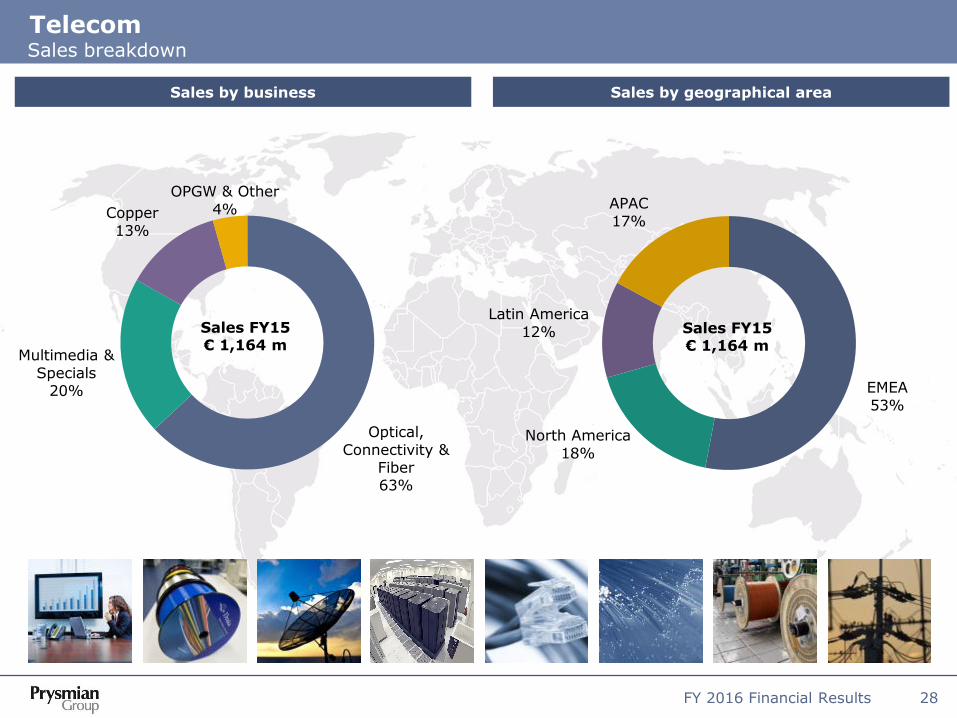
Telecom Euro Millions, % on Sales
Highlights
Quarterly LTM Adj. EBITDA and % on Sales evolution
Sales
Adj. EBITDA / % of Sales
104 99 100 116
126 144 146
134 147 141
157 163
-
50
100
150
200
9%
10%
11%
12%
13%
14%
15%
16%LTM Adj.Ebitda
% on LTM Sales
* Adj. EBITDA margin excl. €8mln bad debt provision in Brazil
* Org. Growth
+8.5%*
11.7% 12.1% 14.0%
14.7%*
Telecom Solutions
• Positive trend in Optical cables and fiber, accelerating in Q4, driven by solid performance in the US, France, Eastern Europe and Australia.
• Investments in fiber manufacturing efficiency paying off.
• Adj.EBITDA Margin benefitting from production footprint rationalization with the creation of excellence centres worldwide.
• Double-digit organic trend in copper cables fuelled by the positive market momentum in Australia.
MMS
• Profitable growth in Europe supported by production capacity extension in copper cables business and footprint optimization in fiber cable. Positive performance in South America.
€8m bad debt provision
+9.9%*

Agenda
FY 2016 Financial Results 14
FY 2016 Highlights
o Group overview
o Results by business
Financial results
Appendix
FY 2016 Financial Results 15
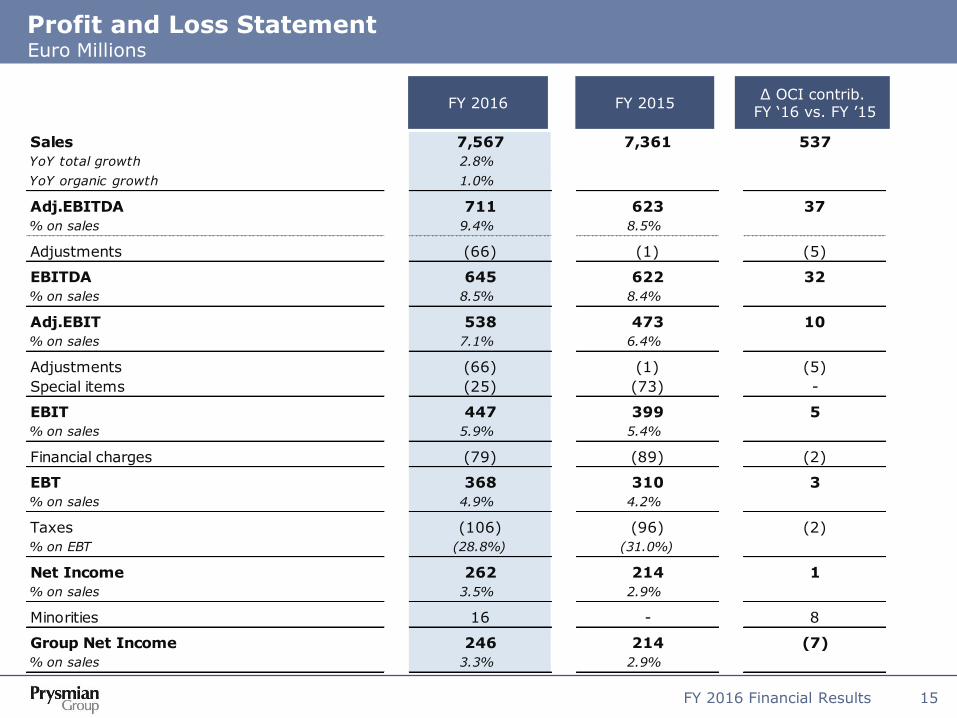
FY 2016 FY 2015 ∆ OCI contrib.
FY ‘16 vs. FY ’15
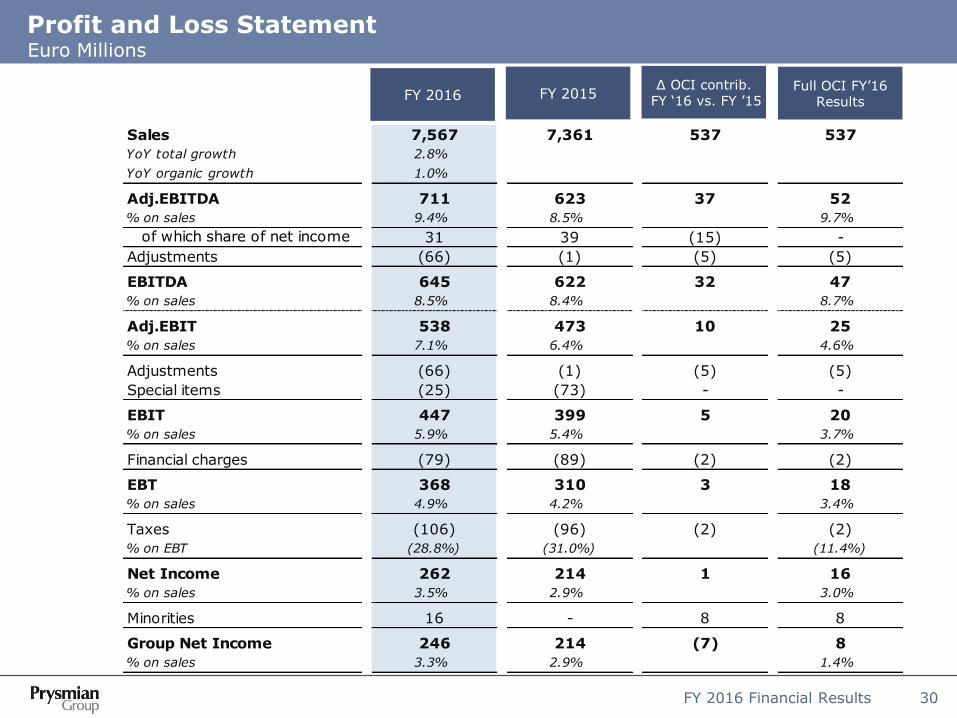
Profit and Loss Statement Euro Millions
Sales 7,567 7,361 537
YoY total growth 2.8% 7.6% 0.0%
YoY organic growth 1.0% 5.3% 0.0%
Adj.EBITDA 711 623 37
% on sales 9.4% 8.5%
Adjustments (66) (1) (5)
EBITDA 645 622 32
% on sales 8.5% 8.4%
Adj.EBIT 538 473 10
% on sales 7.1% 6.4%
Adjustments (66) (1) (5)
Special items (25) (73) -
EBIT 447 399 5
% on sales 5.9% 5.4%
Financial charges (79) (89) (2)
EBT 368 310 3
% on sales 4.9% 4.2%
Taxes (106) (96) (2)
% on EBT (28.8%) (31.0%)
Net Income 262 214 1
% on sales 3.5% 2.9%
Minorities 16 - 8
Group Net Income 246 214 (7)
% on sales 3.3% 2.9%

FY 2016 Financial Results 16
Adjustments and Special Items on EBIT Euro Millions
FY 2016 FY 2015
Non-recurring Items (Antitrust Investigation) 1 29
Restructuring (50) (48)
Other Non-operating Income / (Expenses) (17) 18
EBITDA adjustments (66) (1)
Special items (25) (73)
Gain/(loss) on metal derivatives 54 (27)
Assets impairment (30) (21)
Other (49) (25)
EBIT adjustments (91) (74)
FY 2016 Financial Results 17
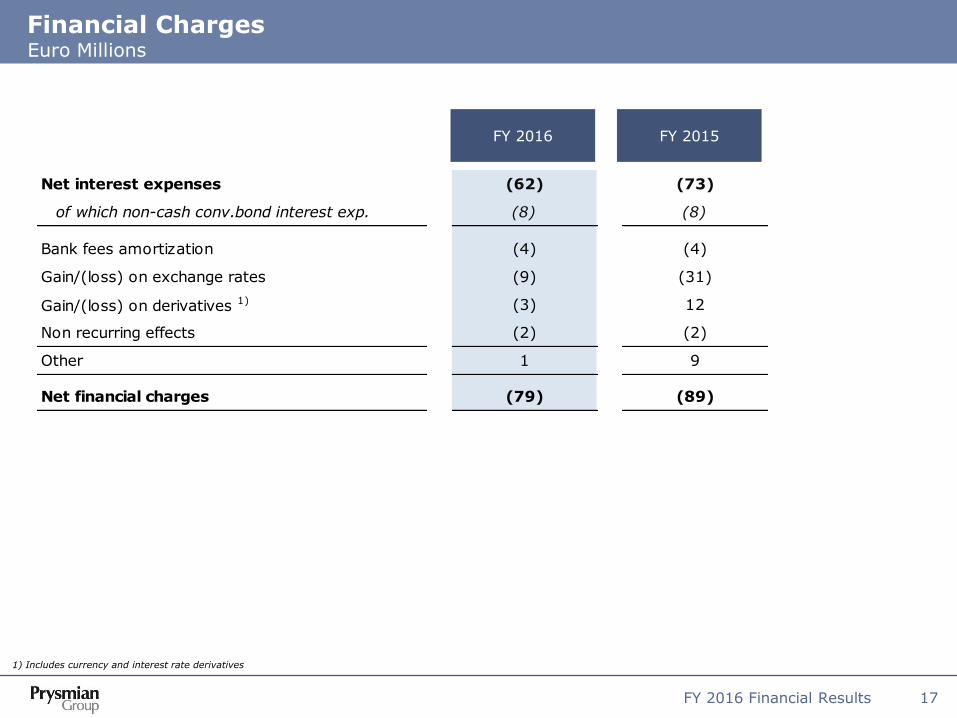
FY 2016 FY 2015
Financial Charges Euro Millions
Net interest expenses (62) (73)
of which non-cash conv.bond interest exp. (8) (8)
Bank fees amortization (4) (4)
Gain/(loss) on exchange rates (9) (31)
Gain/(loss) on derivatives 1) (3) 12
Non recurring effects (2) (2)
Other 1 9
Net financial charges (79) (89)
1) Includes currency and interest rate derivatives

FY 2016 Financial Results 18
Statement of financial position (Balance Sheet) Euro Millions
31 Dec 2016 31 Dec 2015*
* Restated figures
Net fixed assets 2,630 2,581
of which: goodwill 448 452
of which: intangible assets 344 371
of which: property, plants & equipment 1,631 1,552
Net working capital 325 347
of which: derivatives assets/(liabilities) 7 (41)
of which: Operative Net working capital 318 388
Provisions & deferred taxes (360) (330)
Net Capital Employed 2,595 2,598
Employee provisions 383 341
Shareholders' equity 1,675 1,507
of which: attributable to minority interest 227 229
Net financial position 537 750
Total Financing and Equity 2,595 2,598
FY 2016 Financial Results 19
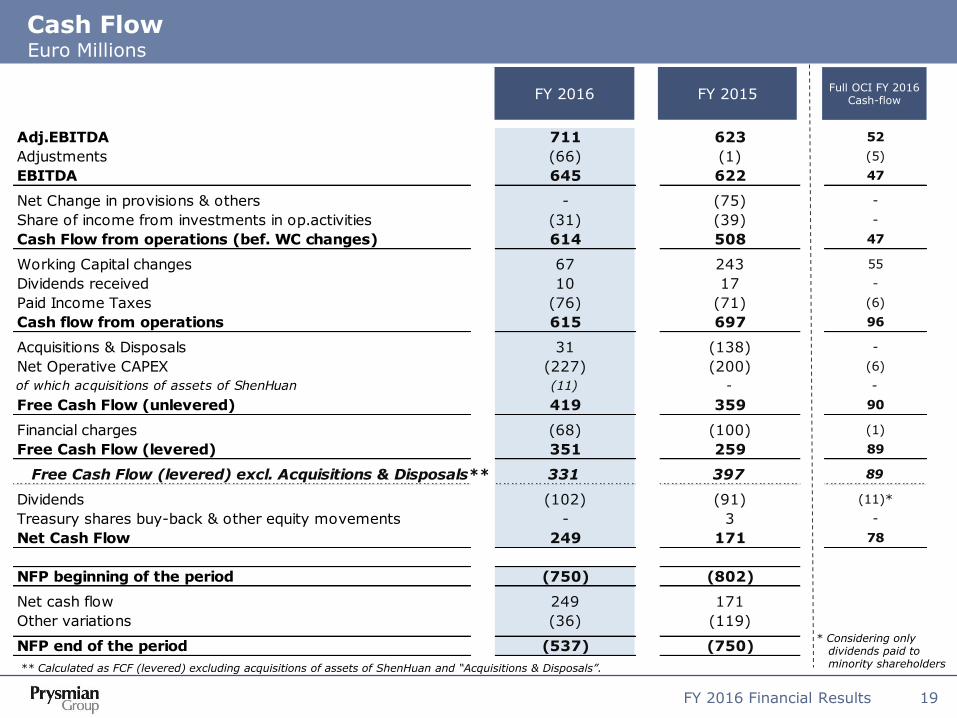
Adj.EBITDA 711 623 52
Adjustments (66) (1) (5)
EBITDA 645 622 47
Net Change in provisions & others - (75) -
Share of income from investments in op.activities (31) (39) -
Cash Flow from operations (bef. WC changes) 614 508 47
Working Capital changes 67 243 55
Dividends received 10 17 -
Paid Income Taxes (76) (71) (6)
Cash flow from operations 615 697 96
Acquisitions & Disposals 31 (138) -
Net Operative CAPEX (227) (200) (6)
of which acquisitions of assets of ShenHuan (11) - -
Free Cash Flow (unlevered) 419 359 90
Financial charges (68) (100) (1)
Free Cash Flow (levered) 351 259 89
Free Cash Flow (levered) excl. Acquisitions & Disposals** 331 397 89
Dividends (102) (91) (11)*
Treasury shares buy-back & other equity movements - 3 -
Net Cash Flow 249 171 78
NFP beginning of the period (750) (802)
Net cash flow 249 171
Other variations (36) (119)
NFP end of the period (537) (750)
Cash Flow Euro Millions
FY 2016 FY 2015 Full OCI FY 2016
Cash-flow
* Considering only dividends paid to minority shareholders ** Calculated as FCF (levered) excluding acquisitions of assets of ShenHuan and “Acquisitions & Disposals”.
FY 2016 Financial Results 20
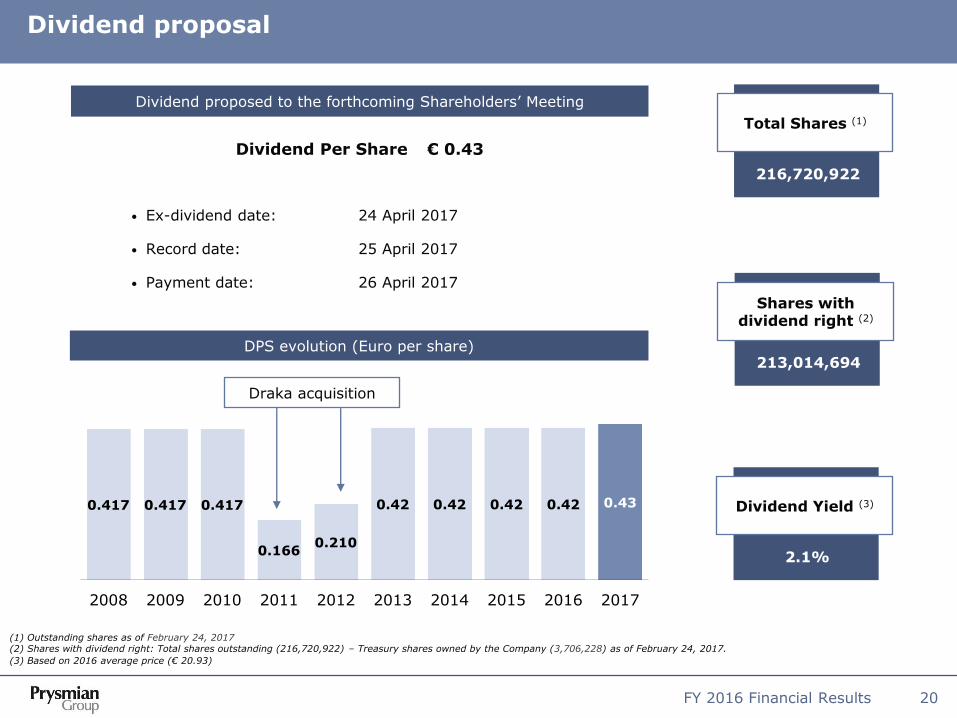
Dividend proposal
Dividend Per Share € 0.43
• Ex-dividend date: 24 April 2017
• Record date: 25 April 2017
• Payment date: 26 April 2017
(1) Outstanding shares as of February 24, 2017 (2) Shares with dividend right: Total shares outstanding (216,720,922) – Treasury shares owned by the Company (3,706,228) as of February 24, 2017.
(3) Based on 2016 average price (€ 20.93)
Dividend proposed to the forthcoming Shareholders’ Meeting
216,720,922
0.417 0.417 0.417
0.166 0.210
0.42 0.42 0.42 0.42 0.43
2008 2009 2010 2011 2012 2013 2014 2015 2016 2017
DPS evolution (Euro per share)
Total Shares (1)
213,014,694
Shares with dividend right (2)
2.1%
Dividend Yield (3)
Draka acquisition

FY 2016 Financial Results 21
Successful placement of €500m equity-linked bond
Equity-linked Bond
New Shares Buy-Back Programme
Key Features:
• Total amount: € 500 million
• Coupon: Zero Coupon
• Initial Conversion Price: €34.2949 (41.25% premium)
• Maturity: January 2022 (5 Years)
• Redemption at maturity: 100%
• Issuer call (130% trigger): 1 February 2020
Finance possible M&A deals
Fund shares buy-back
General corporate purposes
1.
2.
3.
AMOUNT
Up to €125 mln 3.706.228 shares*
Of which 1.087.911 purchased as of February 24, 2017 since the beginning of the program on January 23, 2017.
TREASURY SHARES CURRENTLY OWNED
PERIOD
Start 23 Jan. 2017
End 30 Sep. 2017
To serve possible M&A deals with shares exchange
To serve any conversion right under the bond
OBJECTIVES
* Treasury shares as of February 24, 2017.

Agenda
FY 2016 Financial Results 22
FY 2016 Highlights
o Group overview
o Results by business
Financial results
Appendix

FY 2016 Financial Results 23
Energy Projects
36%
E&I 22%
Industrial & Netw.Comp.
18%
Oil&Gas 1%
Telecom 23%
Energy Projects
22%
E&I 40%
Industrial & Netw.Comp.
18%
Other 1%
Oil&Gas 4%
Telecom 15%
Prysmian group at a glance FY 2016 Financial Results
Sales breakdown by business Sales breakdown by geography
€ 7,567m
Energy Products
59%
EMEA
67% North America
14%
Latin America
6%
APAC
13%
€ 7,567m
Adj. EBITDA by business Adj. EBITDA margin
Energy Products
40%
€ 711m
15.9%
5.1%
9.5%
2.7%
14.0%
9.4%
Energy Projects
E&I Industrial& Netw.Comp.
Telecom Total Oil&Gas

FY 2016 Financial Results 24
Sales breakdown
Sales by business Sales by geographical area
Submarine
68%
High Voltage
32%
Sales FY16 € 1,634 m
EMEA
87%
North America
4%
Latin America 2%
APAC
7%
Sales FY16 € 1,634 m
Energy Projects
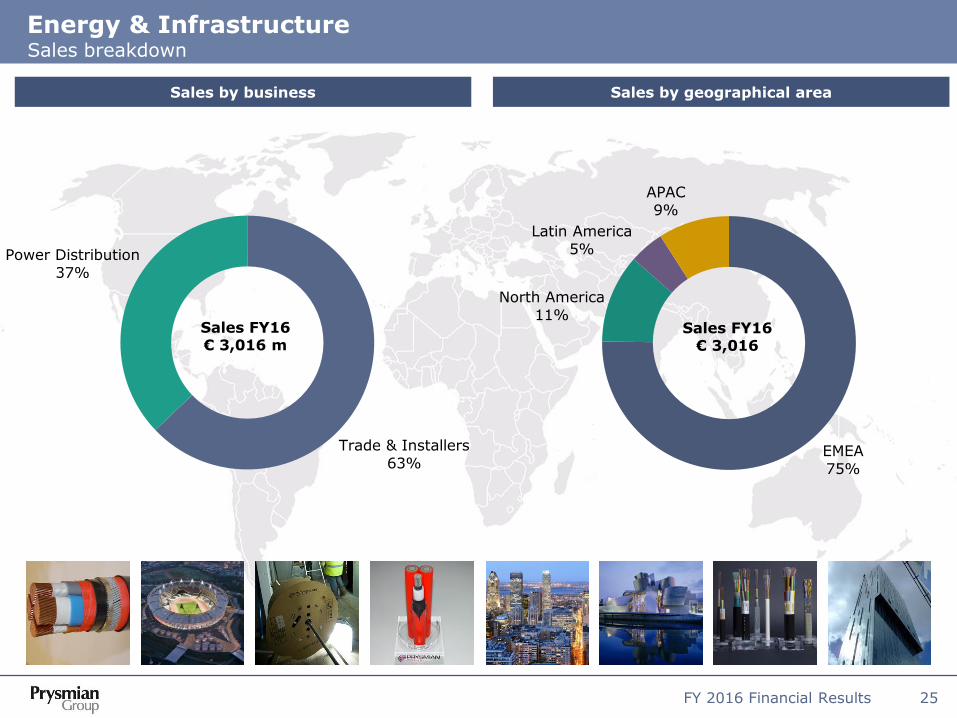
FY 2016 Financial Results 25
Sales breakdown
Sales by business Sales by geographical area
Sales FY16 € 3,016 m
EMEA
75%
North America
11%
Latin America
5%
APAC 9%
Sales FY16 € 3,016
Energy & Infrastructure
Trade & Installers
63%
Power Distribution
37%
FY 2016 Financial Results 26
EMEA
46%
North America
28%
Latin America
4%
APAC
22%
Specialties & OEMs
49%
Elevator 15%
Automotive
21%
Network
Components 10%
Other
5%
Sales breakdown
Sales by business Sales by geographical area
Sales FY16 € 1,343 m
Sales FY16 € 1,343 m
Industrial & Network Components
FY 2016 Financial Results 27
Core Oil&Gas
Cables 59%
SURF
41%
Sales breakdown
Sales by business Sales by geographical area
Sales FY16 € 300 m
Sales FY16 € 300 m
Oil & Gas
EMEA
28%
North America
20%
Latin America
27%
APAC
25%
FY 2016 Financial Results 28
EMEA
53%
North America 18%
Latin America
12%
APAC
17%
Optical,
Connectivity & Fiber 63%
Multimedia &
Specials 20%
Copper
13%
OPGW & Other
4%
Telecom Sales breakdown
Sales by business Sales by geographical area
Sales FY15 € 1,164 m
Sales FY15 € 1,164 m

FY 2016 Financial Results 29
1,416
1,634 1,634
262 10 26 8
Bridge Consolidated Sales Euro Millions
( )
Energy Projects Industrial & NWC
Total Consolidated Telecom
Org.growth +18.5%
1,499 1,343 1,343
69 55 31 1 ( )
Org.growth -4.6%
1,109 1,162 1,164
94 11 30 2
Org.growth +8.5%
7,361 7,020
7,567
73 211 203
547 ( )
Org.growth +1.0%
Oil & Gas
421
283 300
123
7 8 17
Org.growth -29.3%
( )
( )
( )
( ) ( )
( )
( )
( )
( )
E&I
2,795 2,479
3,016
86 126 104
537
Org.growth -3.1%
( ) ( )
( ) ( ) ( )
FY 2016 Financial Results 30
Profit and Loss Statement Euro Millions
FY 2016 ∆ OCI contrib.
FY ‘16 vs. FY ’15 Full OCI FY’16
Results FY 2015
Sales 7,567 7,361 537 537
YoY total growth 2.8% 7.6% 0.0% 0.0%
YoY organic growth 1.0% 5.3% 0.0% 0.0%
Adj.EBITDA 711 623 37 52
% on sales 9.4% 8.5% 9.7%
of which share of net income 31 39 (15) -
Adjustments (66) (1) (5) (5)
EBITDA 645 622 32 47
% on sales 8.5% 8.4% 8.7%
Adj.EBIT 538 473 10 25
% on sales 7.1% 6.4% 4.6%
Adjustments (66) (1) (5) (5)
Special items (25) (73) - -
EBIT 447 399 5 20
% on sales 5.9% 5.4% 3.7%
Financial charges (79) (89) (2) (2)
EBT 368 310 3 18
% on sales 4.9% 4.2% 3.4%
Taxes (106) (96) (2) (2)
% on EBT (28.8%) (31.0%) (11.4%)
Net Income 262 214 1 16
% on sales 3.5% 2.9% 3.0%
Minorities 16 - 8 8
Group Net Income 246 214 (7) 8
% on sales 3.3% 2.9% 1.4%
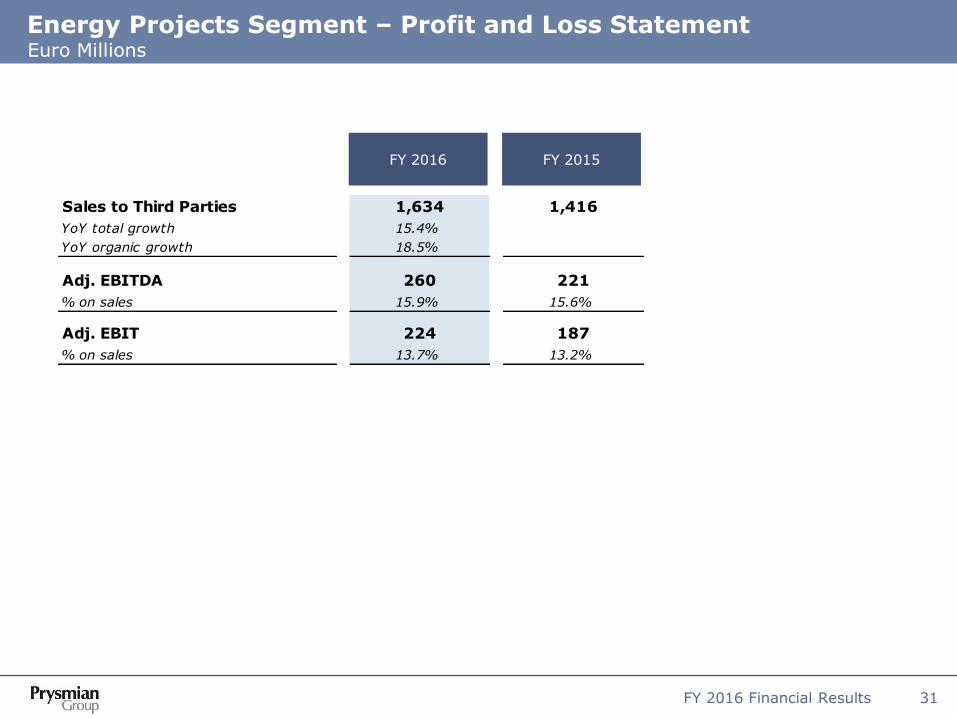
FY 2016 Financial Results 31
Energy Projects Segment – Profit and Loss Statement Euro Millions
FY 2016 FY 2015
Sales to Third Parties 1,634 1,416
YoY total growth 15.4% 0.0%
YoY organic growth 18.5% 0.0%
Adj. EBITDA 260 221
% on sales 15.9% 15.6%
Adj. EBIT 224 187
% on sales 13.7% 13.2%
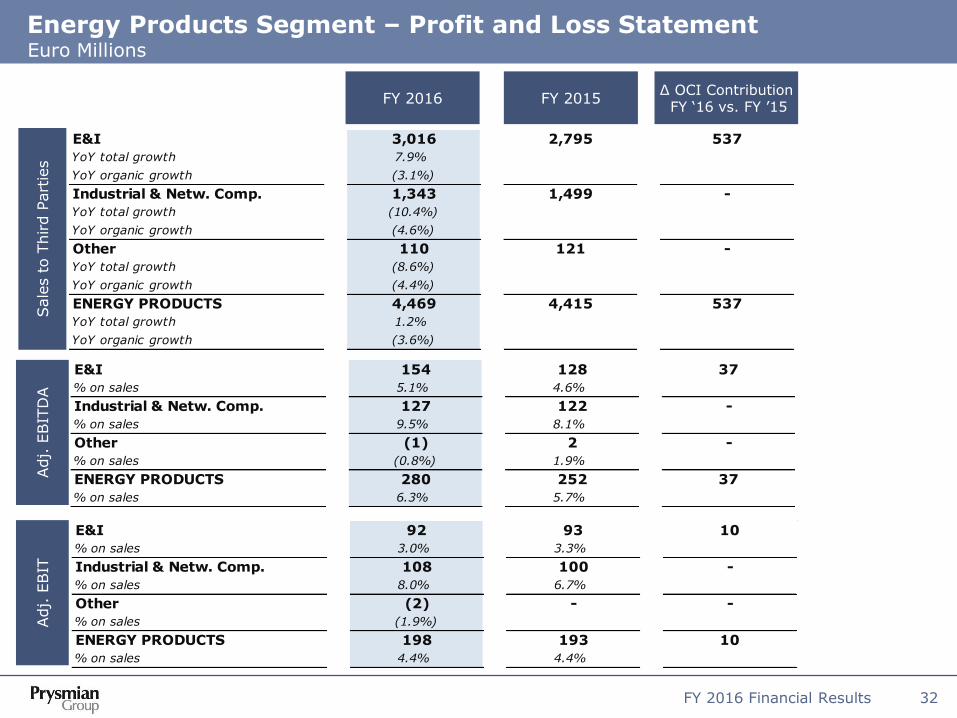
FY 2016 Financial Results 32
Energy Products Segment – Profit and Loss Statement Euro Millions
Sale
s t
o T
hird P
art
ies
Adj.
EBIT
DA
Adj.
EBIT
FY 2016 FY 2015 ∆ OCI Contribution FY ‘16 vs. FY ’15
E&I 3,016 2,795 537
YoY total growth 7.9% 0.0%
YoY organic growth (3.1%) 0.0%
Industrial & Netw. Comp. 1,343 1,499 -
YoY total growth (10.4%) 0.0%
YoY organic growth (4.6%) 0.0%
Other 110 121 -
YoY total growth (8.6%) 0.0%
YoY organic growth (4.4%) 0.0%
ENERGY PRODUCTS 4,469 4,415 537
YoY total growth 1.2% 0.0%
YoY organic growth (3.6%) 0.0%
E&I 154 128 37
% on sales 5.1% 4.6% 0.0%
Industrial & Netw. Comp. 127 122 -
% on sales 9.5% 8.1% 0.0%
Other (1) 2 -
% on sales (0.8%) 1.9% 0.0%
ENERGY PRODUCTS 280 252 37
% on sales 6.3% 5.7% 0.0%
E&I 92 93 10
% on sales 3.0% 3.3% 0.0%
Industrial & Netw. Comp. 108 100 -
% on sales 8.0% 6.7% 0.0%
Other (2) - -
% on sales (1.9%) 0.0%
ENERGY PRODUCTS 198 193 10
% on sales 4.4% 4.4% 0.0%
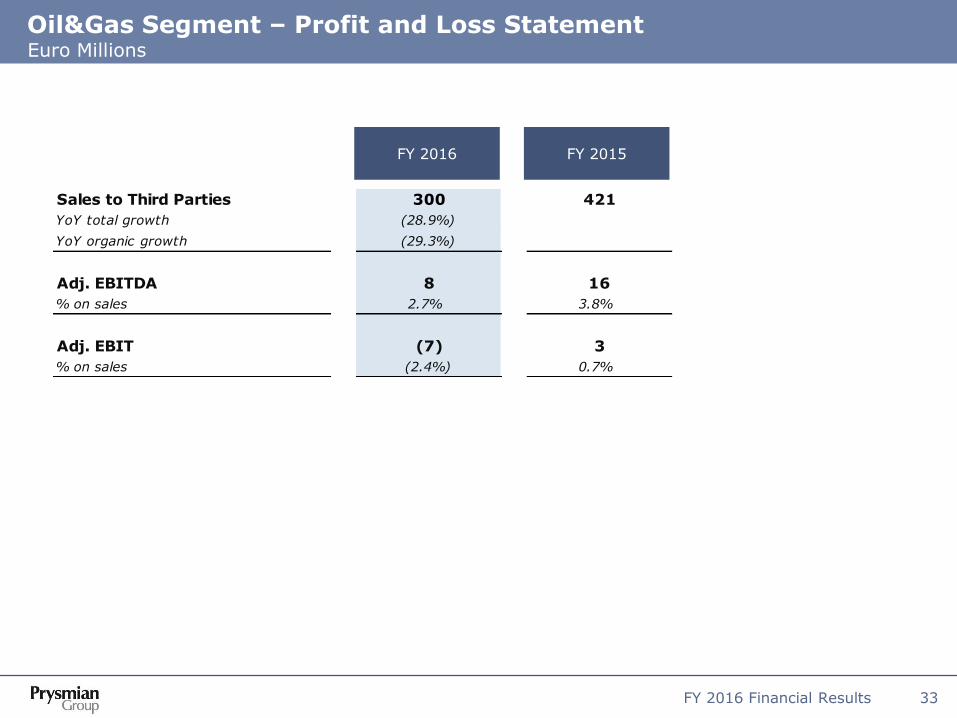
FY 2016 Financial Results 33
Oil&Gas Segment – Profit and Loss Statement Euro Millions
FY 2016 FY 2015
Sales to Third Parties 300 421
YoY total growth (28.9%) 0.0%
YoY organic growth (29.3%) 0.0%
Adj. EBITDA 8 16
% on sales 2.7% 3.8%
Adj. EBIT (7) 3
% on sales (2.4%) 0.7%

FY 2016 Financial Results 34
FY 2016 FY 2015
Telecom Segment – Profit and Loss Statement Euro Millions
Sales to Third Parties 1,164 1,109
YoY total growth 4.9% 11.6%
YoY organic growth 8.5% 9.9%
Adj. EBITDA 163 134
% on sales 14.0% 12.1%
Adj. EBIT 123 90
% on sales 10.6% 8.1%

FY 2016 Financial Results 35
Reference Scenario Commodities & Forex
Based on monthly average data Source: Nasdaq OMX
Brent Copper Aluminium
EUR / USD EUR / GBP EUR / BRL
500
1,000
1,500
2,000
2,500
3,000
3,500
J-08J-09J-10J-11J-12J-13J-14J-15J-16J-17
Aluminium $/ton
Aluminium €/ton
2,000
4,000
6,000
8,000
10,000
12,000
J-08
J-09
J-10
J-11
J-12
J-13
J-14
J-15
J-16
J-17
Copper $/ton
Copper €/ton
25
50
75
100
125
150
J-08
J-09
J-10
J-11
J-12
J-13
J-14
J-15
J-16
J-17
Brent $/bbl
Brent €/bbl
2.00
2.50
3.00
3.50
4.00
4.50
J-08
J-09
J-10
J-11
J-12
J-13
J-14
J-15
J-16
J-17
0.70
0.75
0.80
0.85
0.90
0.95
J-08
J-09
J-10
J-11
J-12
J-13
J-14
J-15
J-16
J-17
1.00
1.10
1.20
1.30
1.40
1.50
1.60
J-08
J-09
J-10
J-11
J-12
J-13
J-14
J-15
J-16
J-17
FY 2016 Financial Results 36
Disclaimer
• The managers responsible for preparing the company's financial reports, A.Bott and C.Soprano, declare, pursuant
to paragraph 2 of Article 154-bis of the Consolidated Financial Act, that the accounting information contained in
this presentation corresponds to the results documented in the books, accounting and other records of the
company.
• Certain information included in this document is forward looking and is subject to important risks and
uncertainties that could cause actual results to differ materially. The Company's businesses include its Energy
Projects, Energy Products and Telecom Operating Segments, and its outlook is predominantly based on its
interpretation of what it considers to be the key economic factors affecting these businesses.
• Any estimates or forward-looking statements contained in this document are referred to the current date and,
therefore, any of the assumptions underlying this document or any of the circumstances or data mentioned in this
document may change. Prysmian S.p.A. expressly disclaims and does not assume any liability in connection with
any inaccuracies in any of these estimates or forward-looking statements or in connection with any use by any
third party of such estimates or forward-looking statements. This document does not represent investment advice
or a recommendation for the purchase or sale of financial products and/or of any kind of financial services. Finally,
this document does not represent an investment solicitation in Italy, pursuant to Section 1, letter (t) of Legislative
Decree no. 58 of February 24, 1998, or in any other country or state.
• In addition to the standard financial reporting formats and indicators required under IFRS, this document contains
a number of reclassified tables and alternative performance indicators. The purpose is to help users better
evaluate the Group's economic and financial performance. However, these tables and indicators should not be
treated as a substitute for the standard ones required by IFRS.


