30
1 12 May 2016 FY 2017 Results presentation 19 September, 2017 28 February, 2018

2
Disclaimer
This presentation (the "Presentation") has been prepared and is issued by, and is the sole responsibility of Telepizza Group, S.A. (“Telepizza" or "the Company"). For the purposes hereof, the Presentation shall
mean and include the slides that follow, any prospective oral presentations of such slides by the Company, as well as any question-and-answer session that may follow that oral presentation and any materials
distributed at, or in connection with, any of the above.
The information contained in the Presentation has not been independently verified and some of the information is in summary form. No representation or warranty, express or implied, is made by the Company
or its affiliates, nor by their directors, officers, employees, representatives or agents as to, and no reliance should be placed on, the fairness, accuracy, completeness or correctness of the information or opinions
expressed herein. None of Telepizza, nor their respective directors, officers, employees, representatives or agents shall have any liability whatsoever (in negligence or otherwise) for any direct or consequential
loss, damages, costs or prejudices whatsoever arising from the use of the Presentation or its contents or otherwise arising in connection with the Presentation, save with respect to any liability for fraud, and
expressly disclaim any and all liability whether direct or indirect, express or implied, contractual, tortious, statutory or otherwise, in connection with the accuracy or completeness of the information or for any of
the opinions contained herein or for any errors, omissions or misstatements contained in the Presentation.
Telepizza cautions that this Presentation contains forward looking statements with respect to the business, financial condition, results of operations, strategy, plans and objectives of the Company. The words
"believe", " expect", " anticipate", "intends", " estimate", "forecast", " project", "will", "may", "should" and similar expressions identify forward-looking statements. Other forward-looking statements can be
identified from the context in which they are made. While these forward looking statements represent our judgment and future expectations concerning the development of our business, a certain number of
risks, uncertainties and other important factors, including those published in our past and future filings and reports, including those with the Spanish Securities and Exchange Commission (“CNMV”) and
available to the public both in Telepizza’s website (www.telepizza.com) and in the CNMV’s website (www.cnmv.es), as well as other risk factors currently unknown or not foreseeable, which may be beyond
Telepizza’s control, could adversely affect our business and financial performance and cause actual developments and results to differ materially from those implied in the forward-looking statements. There can
be no assurance that forward-looking statements will prove to be accurate, as actual results and future events could differ materially from those anticipated in such statements. Accordingly, readers should not
place undue reliance on forward-looking statements due to the inherent uncertainty therein.
The information contained in the Presentation, including but not limited to forward-looking statements, is provided as of the date hereof and is not intended to give any assurances as to future results. No person
is under any obligation to update, complete, revise or keep current the information contained in the Presentation, whether as a result of new information, future events or results or otherwise. The information
contained in the Presentation may be subject to change without notice and must not be relied upon for any purpose.
This Presentation contains financial information derived from Telepizza’s audited consolidated financial statements for the twelve-month periods ended December 31 2016, 2015 and 2014. In addition, the
Presentation contains Telepizza’s unaudited quarterly financial information for 2014, 2015, 2016 and 2017 prepared according to internal Telepizza’s criteria. Financial information by business segments is
prepared according to internal Telepizza’s criteria as a result of which each segment reflects the true nature of its business. These criteria do not follow any particular regulation and can include internal
estimates and subjective valuations which could be subject to substantial change should a different methodology be applied.
In addition, the Presentation contains certain annual and quarterly alternative performance measures which have not been prepared in accordance with International Financial Reporting Standards, as adopted
by the European Union, nor in accordance with any accounting standards, such as “chain sales”, “like-for-like chain sales growth”, “underlying EBITDA” and “digital sales”. These measures have not been
audited or reviewed by our auditors nor by independent experts, should not be considered in isolation, do not represent our revenues, margins, results of operations or cash flows for the periods indicated and
should not be regarded as alternatives to revenues, cash flows or net income as indicators of operational performance or liquidity.
Market and competitive position data in the Presentation have generally been obtained from industry publications and surveys or studies conducted by third-party sources. There are limitations with respect to
the availability, accuracy, completeness and comparability of such data. Telepizza has not independently verified such data and can provide no assurance of its accuracy or completeness. Certain statements in
the Presentation regarding the market and competitive position data are based on the internal analyses of Telepizza, which involve certain assumptions and estimates. These internal analyses have not been
verified by any independent source and there can be no assurance that the assumptions or estimates are accurate. Accordingly, no undue reliance should be placed on any of the industry, market or Telepizza’s
competitive position data contained in the Presentation.
You may wish to seek independent and professional advice and conduct your own independent investigation and analysis of the information contained in this Presentation and of the business, operations,
financial condition, prospects, status and affairs of Telepizza. The Company is not nor can it be held responsible for the use, valuations, opinions, expectations or decisions which might be adopted by third
parties following the publication of this Presentation.
No one should purchase or subscribe for any securities in the Company on the basis of this Presentation. This Presentation does not constitute or form part of, and should not be construed as, (i) an offer,
solicitation or invitation to subscribe for, sell or issue, underwrite or otherwise acquire any securities, nor shall it, or the fact of its communication, form the basis of, or be relied upon in connection with, or act as
any inducement to enter into any contract or commitment whatsoever with respect to any securities; or (ii) any form of financial opinion, recommendation or investment advice with respect to any securities.
The distribution of this Presentation in certain jurisdictions may be restricted by law. Recipients of this Presentation should inform themselves about and observe such restrictions. Telepizza disclaims any liability
for the distribution of this Presentation by any of its recipients.
By receiving or accessing to this Presentation you accept and agree to be bound by the foregoing terms, conditions and restrictions.

3
FY 2017 highlights
Acquisition of leading pizza player in Ireland, Apache Pizza; stores in 5 new geographies in 20174
Record net new stores: +218 (+16% y-o-y), over 1,600 stores reached in 20175
Record year in Core International, chain sales +13.9%33
Chain sales +5.8% in Spain, good recovery in non-delivery due to refurbishments and commercial policy2
+8.6% chain sales growth, +5.5% EBITDA1 growth and 0.38€ EPS2; above guidance1
Notes:
1. Underlying EBITDA adjusted by €0,7 million of extraordinary costs
2. Based on cash taxes and before PPA amortization charges
3. Constant currency, excluding Master Franchises
Proposed payment of 2017 dividend: 20% payout (€6.4m)5
4
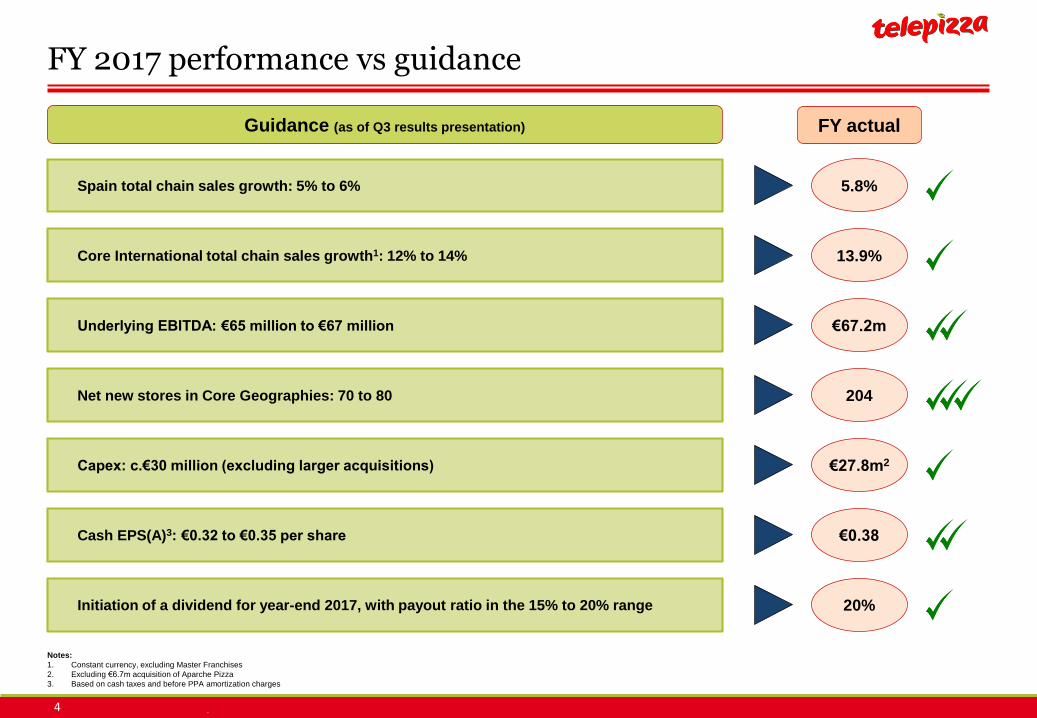
5.8%
13.9%
€67.2m
204
20%
FY actual
Notes:
1. Constant currency, excluding Master Franchises
2. Excluding €6.7m acquisition of Aparche Pizza
3. Based on cash taxes and before PPA amortization charges
Guidance (as of Q3 results presentation)
FY 2017 performance vs guidance
Spain total chain sales growth: 5% to 6%
Core International total chain sales growth1: 12% to 14%
Underlying EBITDA: €65 million to €67 million
Net new stores in Core Geographies: 70 to 80
Capex: c.€30 million (excluding larger acquisitions)
Cash EPS(A)3: €0.32 to €0.35 per share
Initiation of a dividend for year-end 2017, with payout ratio in the 15% to 20% range
€27.8m2
€0.38

5
Solid chain sales growth in 2017 in Spain and International
Record growth in Core International, EBITDA growth above guidance
Notes:
1. Excluding Master Franchises
2. FY 2016 adjusted for €32 million of IPO related costs, FY 2017 adjusted by €0.7 million of corporate deal extraordinary costs
€m (unless otherwise stated) FY 2017 FY 2016 % change
Group chain sales 561.6 517.0 8.6%
Core Geographies1 chain sales 529.3 486.9 8.7%
Core Geographies1 constant currency sales growth (%) 8.3%
Core Geographies1 LFL sales growth (%) 4.1%
Spain chain sales 354.7 335.2 5.8%
LfL sales growth (%) 3.6%
International chain sales 206.9 181.8 13.8%
Core International1 chain sales 174.6 151.7 15.1%
Core International1 constant currency sales growth (%) 13.9%
Core International1 LFL sales growth (%) 5.2%
Revenues 361.0 339.6 6.3%
Constant currency revenue growth (%) 5.9%
Group Underlying EBITDA2 67.2 63.6 5.5%

6
1.4% 7.1%
5.9%
0.7%
6.7%
9.3%
6.5%6.9%
Q1 2017 Q2 2017 Q3 2017 Q4 2017
Q4 LFL performance: 2-year view
Note:
1. Excluding Master Franchises
Core International1 2-year LFL (%)Spain 2-year LFL (%)
(Base 2015)
Base
2016
Base
2016
Base
2016
8.2%
5.3%
4.3% 3.1%
15.5%
11.4%
13.7%
13.2%
Q1 2017 Q2 2017 Q3 2017 Q4 2017
(Base 2015)
Base
2016
Base
2016
Base
2016
-2.8% 1.1% 0.5% -0.8%
2017 year calendar impacts
Spain and Core International LFL impacted in Q4 by high PY comparables, additional impact in Spain due to negative calendar effect
Base
2016
Base
2016

7
Actions in Non-delivery increasing growth y-o-y in Spain in 2017
Delivery vs Non-delivery sales in Spain
9.5%
6.4%
-0.4%
4.6%
5.3%5.8%
1Q 16 2Q 16Delivery sales growth Non-delivery sales growth Total Spain growth
Impact of store refurbishments
and commercial policy
FY 2016 FY 2017

8
5.8% 6.4%
14.6%
35.3%
Spain growth Delivery growth Digital delivery growth Mobile growth
Digital driving growth in the Delivery channel
Double digit digital sales growth in 2017, accounting for 39% of delivery sales in Spain1
Continued growth of the delivery channel in Spain
Telepizza growth by channel in FY 2017
Note:
1. Digital Delivery sales over Delivery sales in Spain

9
Digital in 2017
New app, in constant development
with new features
Implementing
new features
➢ Geolocation
➢ Real time tracker
➢ Payment tokenization
➢ Faster/easier
11.3%
17.8%
17.8%
17.0%
24.4%
Deliveroo.Es
Dominospizza.Es
Glovoapp.Com
Just-Eat.Es
Telepizza.Es
1st Agregator
Delivery Brand
2nd Agregator
Delivery Brand
3rd Agregator
Delivery Brand
2rd Delivery Pizza
Brand
15% 18% 20% 24%
26%32%
37%
41%
59%51%
43%35%
Dec-2014 Dec-2015 Dec-2016 Dec-2017
App Web responsive PC
Telepizza Digital sales by platform
Conversion rates as of Q4 2017
Source: PC and web responsive conversion rates: Netquest data
10
2016 2017
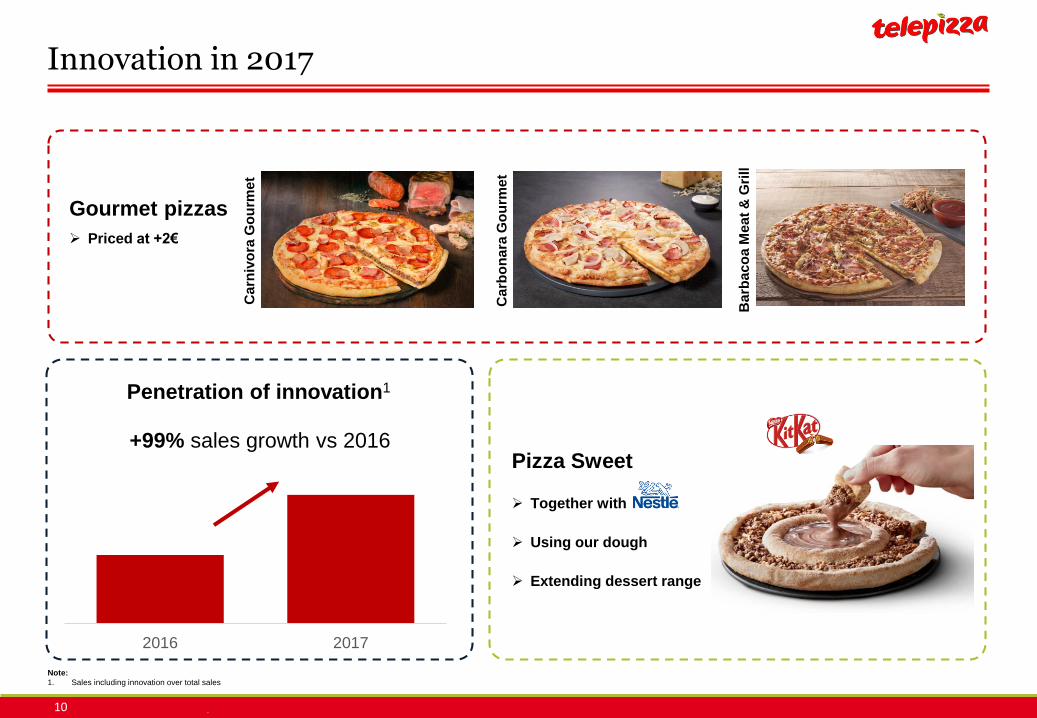
Innovation in 2017
Ca
rniv
ora
Go
urm
et
Gourmet pizzas
➢ Priced at +2€
Ca
rbo
na
ra G
ou
rme
t
Ba
rba
co
a M
ea
t&
Gri
ll
Pizza Sweet
➢ Together with
➢ Using our dough
➢ Extending dessert range
+99% sales growth vs 2016
Penetration of innovation1
Note:
1. Sales including innovation over total sales

11
Core International performance
Core International during FY 2017
Record double digit growth in Core International, underpinned by outstanding performance in H1
Rest of Europe
• Portugal: Consistent double digit LFL growth
• Poland: strong LFL growth in owned stores
• Switzerland & Czech: full conversion to Telepizza brand
Latin America
• Chile: positive performance, outperforming market despite
challenging macro environment in the second half of the year
• Colombia, Peru and Ecuador: double digit growth, driven by
horizontal expansion and positive LFL growth

12
Unit expansion: Over 1,600 stores reached in 2017
+218 net new stores in 2017, stores in 5 new geographies in 2017
Net new stores per region during 2017
Spain
33 new stores
Rest of Europe
147 new stores
Latin America
24 new stores
Master
Franchises
14 new stores
218 total net new stores in 2017
Consolidated Core countries
New Core countries
MFAs 178 stores
1,429 stores
6 stores (Apr-17)
7 stores (Jun-17)
10 stores (Mar-17)
2 store (Mar-17)
Stores added in five
new countries
133 stores (Dec-17)
Total: 1,607 stores
13
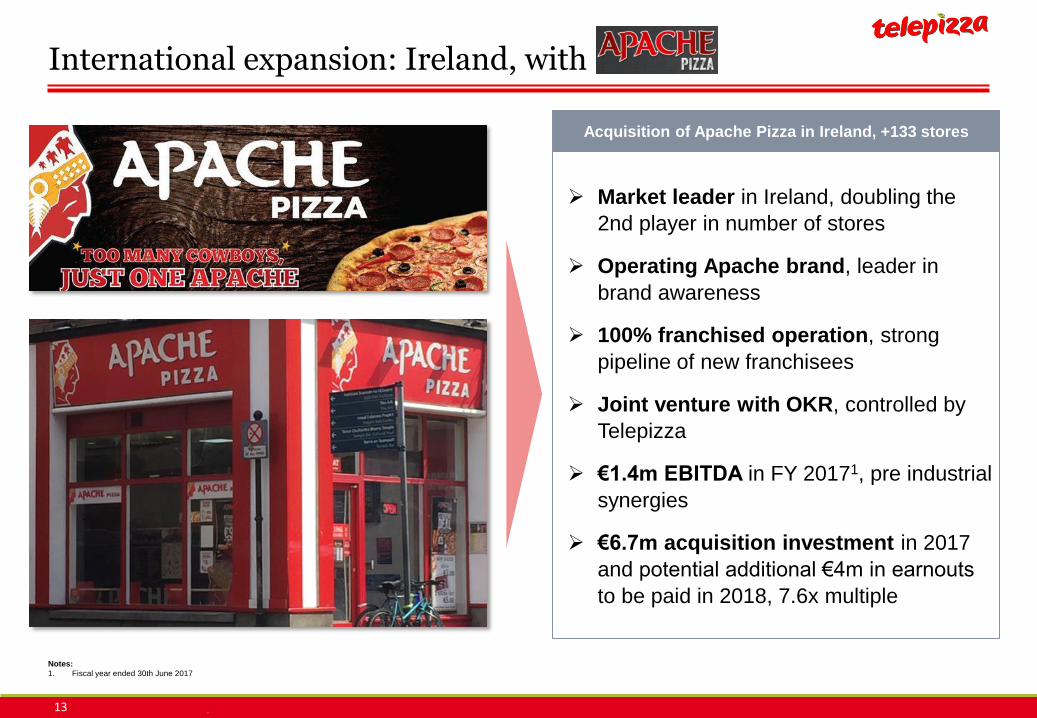
International expansion: Ireland, with
Acquisition of Apache Pizza in Ireland, +133 stores
➢ Market leader in Ireland, doubling the
2nd player in number of stores
➢ Operating Apache brand, leader in
brand awareness
➢ 100% franchised operation, strong
pipeline of new franchisees
➢ Joint venture with OKR, controlled by
Telepizza
➢ €1.4m EBITDA in FY 20171, pre industrial
synergies
➢ €6.7m acquisition investment in 2017
and potential additional €4m in earnouts
to be paid in 2018, 7.6x multiple
Notes:
1. Fiscal year ended 30th June 2017

Financial information

15
Chain sales bridge
Group FY 2017 chain sales growth
International FY 2017 chain sales growthSpain FY 2017 chain sales growth
3.6%
5.8%
2.2%
LFL Horizontal Total growth
5.2%
15.1%
8.8%
1.2%
LFL Horizontal FX Total growthCore International
4.1%
8.6%
4.2%
0.3%
LFL Horizontal FX Total growth
7.3%
13.8%
Master Franchises Total growthInternational

16
196 195
144 166
FY 2016 FY 2017
196 195
291335
30
32
FY 2016 FY 2017
Chain sales and Revenues
Group chain sales and Revenues (€m)
8.6%
Chain sales Revenues
517
562
361
Owned stores sales
Franchised sales
MF sales
Owned stores sales
Supply chain, royalties,
marketing & other income
Continued growth in franchised chain sales, as the franchisee network expands
340
6.3%
+16%
+15%
-1%
-1%
17
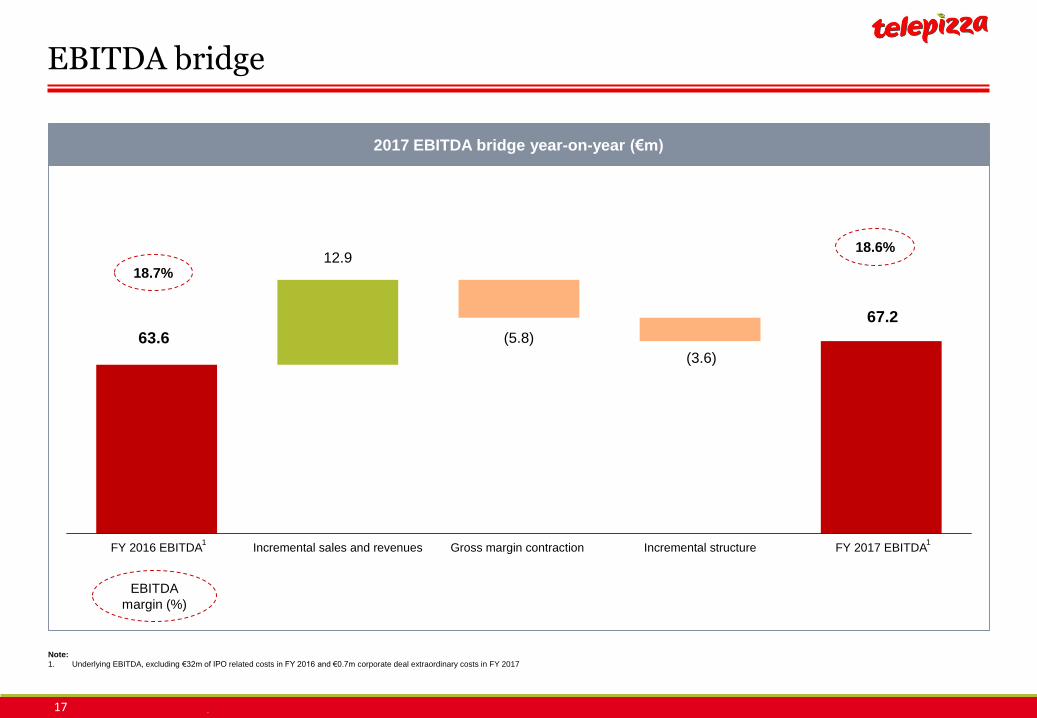
EBITDA bridge
Note:
1. Underlying EBITDA, excluding €32m of IPO related costs in FY 2016 and €0.7m corporate deal extraordinary costs in FY 2017
63.6
67.2
12.9
(5.8)
(3.6)
FY 2016 EBITDA Incremental sales and revenues Gross margin contraction Incremental structure FY 2017 EBITDA
2017 EBITDA bridge year-on-year (€m)
1 1
18.7%
18.6%
EBITDA
margin (%)

18
Income statement
Note:
1. Includes impairments and losses on sale of PP&E
€m (unless otherwise stated) FY 2017 FY 2016 % change
Total revenues 361.0 339.6 6.3%
COGS -100.0 -88.6 12.8%
Gross margin 261.0 251.0 4.0%
% of revenues 72.3% 73.9% -1.6pp
Other Opex -193.8 -187.3 3.5%
Underlying EBITDA 67.2 63.6 5.5%
% of revenues 18.6% 18.7% -0.1pp
Corporate deal extraordinary costs -0.7 - n.m.
IPO costs - -32.0 n.m.
Reported EBITDA 66.4 31.6 110.1%
Depreciation (excl. PPA amortisation) -13.4 -11.6 16.0%
Underlying EBITA 53.8 52.1 3.2%
PPA amortisation -5.5 -5.8 -4.6%
Net financial income / (expense) -8.5 -19.9 -57.3%
Exchange differences -0.9 -1.9 -52.9%
Other1 0.0 -0.7 n.m.
Income tax -6.4 19.0 n.m.
Minority interest 0.2 0.0 n.m.
Results for the period 31.8 10.7 197.8%

19
Capital expenditure
Note:
1. Including IT-related maintenance capex
Total capex in 2016 and 2017 (€m)
Maintenance
Efficiency and supply chain
Digital & IT1
Refurbishments and
relocations
Store buybacks
Store openings
6.7Apache
acquisition in 2017
5.4 4.6
2.22.4
3.8 4.3
3.9
7.9
4.2
1.6
7.66.9
27.0 27.8
FY 2016 FY 2017
Total €34.5m
Refurbishment plan
finalized in 2017

20
Cash Flow bridge
(137.0)
(113.6)
66.44.0
(34.5)
(7.5)(5.2)
Net debt as of31st December 2016
FY 2017 EBITDA Change in workingcapital and other
impacts
Capex Cash interest Cash tax Net debt as of31st December 2017
2017 Cash Flow bridge year-on-year (€m)
Underlying EBITDA
€67.2m
Note:
1. The reported EBITDA figure of €66.4m is being used in the Cash Flow bridge calculation
1
21
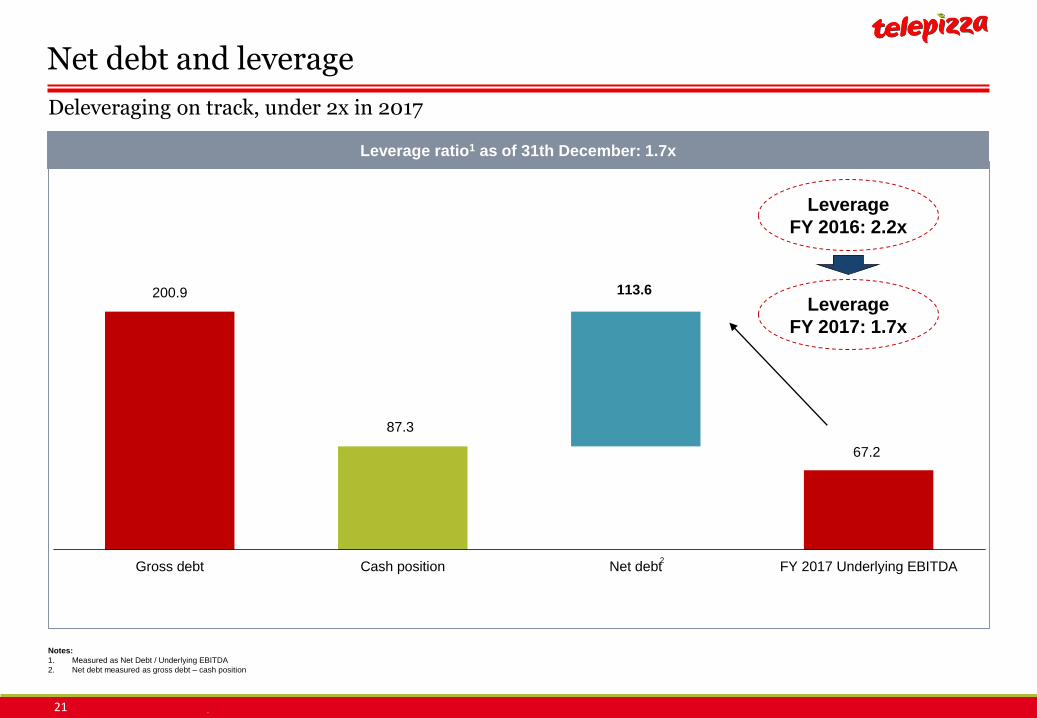
Net debt and leverage
Notes:
1. Measured as Net Debt / Underlying EBITDA
2. Net debt measured as gross debt – cash position
200.9
87.3
67.2
113.6
Gross debt Cash position Net debt FY 2017 Underlying EBITDA
Leverage ratio1 as of 31th December: 1.7x
Leverage
FY 2017: 1.7x
2
Deleveraging on track, under 2x in 2017
Leverage
FY 2016: 2.2x

22
FY 2018 outlook
Spain total chain sales growth: 4% to 5%
Core International total chain sales growth: double digit
Underlying EBITDA growth: Low to mid-single digit
Net new stores in Core Geographies: 60 to 70
Capex: c.€25 million (excluding larger acquisitions)
Cash EPS(A)1: c.€0.40 per share
Dividend for year-end 2018, with payout ratio in the 15% to 20% range
Note:
1. Based on cash taxes and before PPA amortization charges

Q&A

Appendix

25
Store Count
2017 2016 2015
Number of Stores Own storesFranchised
storesTotal stores Own stores
Franchised
storesTotal stores Own stores
Franchised
storesTotal stores
Core Geographies 441 988 1,429 454 771 1,225 461 693 1,154
Spain1 137 571 708 164 511 675 183 461 644
Core International 304 417 721 290 260 550 278 232 510
Rest of Europe 91 296 387 73 167 240 73 153 226
Portugal 43 73 116 41 68 109 44 61 105
Poland 38 81 119 32 88 120 29 92 121
Switzerland 0 9 9 0 11 11 0 0 0
Czech Republic 10 0 10 0 0 0 0 0 0
Ireland 0 133 133 0 0 0 0 0 0
Latin America 213 121 334 217 93 310 205 79 284
Chile 92 68 160 91 52 143 89 49 138
Colombia 45 45 90 61 34 95 64 27 91
Peru 45 4 49 43 4 47 35 1 36
Ecuador 23 4 27 20 3 23 17 2 19
Panama 6 0 6 2 0 2 0 0 0
Paraguay 2 0 2 0 0 0 0 0 0
Master Franchises 0 178 178 0 164 164 0 157 157
Guatemala 0 93 93 0 88 88 0 83 83
El Salvador 0 48 48 0 49 49 0 47 47
Russia 0 14 14 0 13 13 0 14 14
Bolivia 0 7 7 0 5 5 0 4 4
Iran 0 7 7 0 0 0 0 0 0
Angola 0 5 5 0 5 5 0 5 5
UK 0 2 2 0 0 0 0 0 0
Saudi Arabia 0 2 2 0 4 4 0 0 0
Others 0 0 0 0 0 0 0 4 4
Total Group 441 1,166 1,607 454 935 1,389 461 850 1,311Notes:
1. Includes stores in Morocco and France.

26
644675
708
510
550
7211,154
1,225
1,429
Dec-15 Dec-16 Dec-17
Spain Core International
Dec-15 Dec-16 Dec-17
By n
um
ber
of
sto
res
By c
hain
sale
s
Notes:
1. Excluding Master Franchises,
2. Includes stores in Morocco and France.
2
27%
73%
FY 2017
33%
67%
FY 2016
35%
65%
FY 2017
38%
62%
FY 2016
157 164 178(6 closures)
21 openings
(7 closures)
15 openings
Unit expansion
Master Franchised store network
Core Geographies1 network development Franchised vs owned mix y-o-y
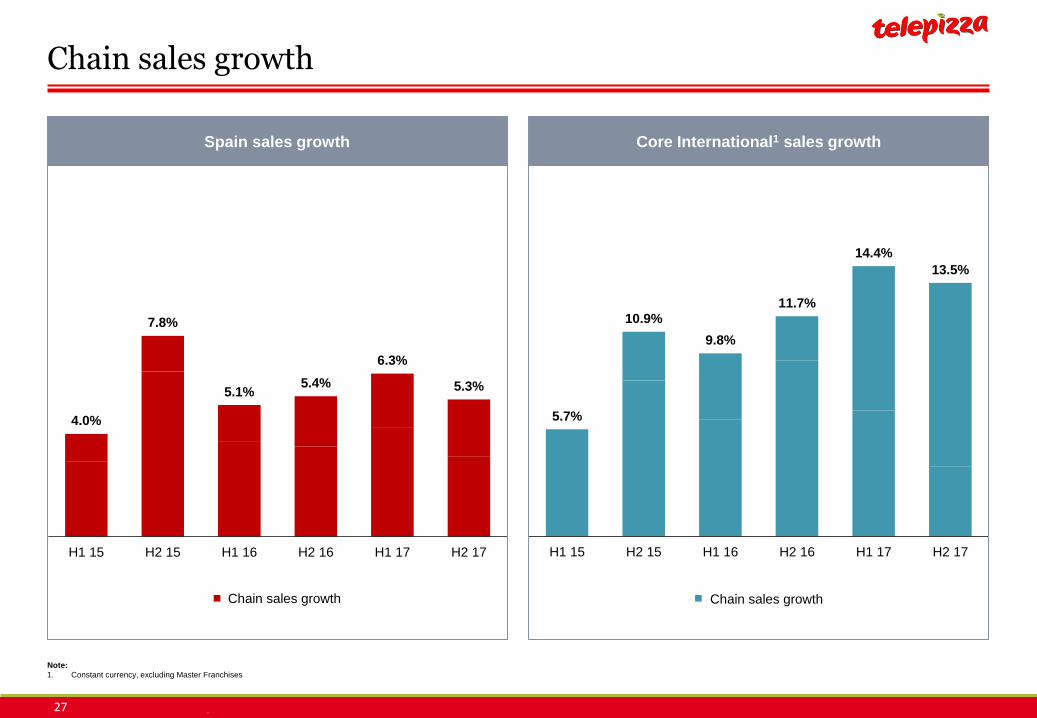
27
Chain sales growth
4.0%
7.8%
5.1%5.4%
6.3%
5.3%
H1 15 H2 15 H1 16 H2 16 H1 17 H2 17
Chain sales growth
5.7%
10.9%
9.8%
11.7%
14.4%
13.5%
H1 15 H2 15 H1 16 H2 16 H1 17 H2 17
Chain sales growth
Core International1 sales growthSpain sales growth
Note:
1. Constant currency, excluding Master Franchises

28
63.667.2
FY 2016 FY 2017
Underlying EBITDA growth above guidance, impacted by gross margin pressure
Underlying EBITDA growth (€m) Operating costs (€m)
Note:
1. FY 2016 adjusted for €32 million of IPO related costs, FY 2017 adjusted by €0,7 million of extraordinary costs
89 100
9295
95
99
FY 2016 FY 2017
276
COGS Personnel expenses Other costs
6.5%
294
5.5%
+13%
+4%
18.7% 18.6%
EBITDA margin
+3%
1
Underlying EBITDA
29
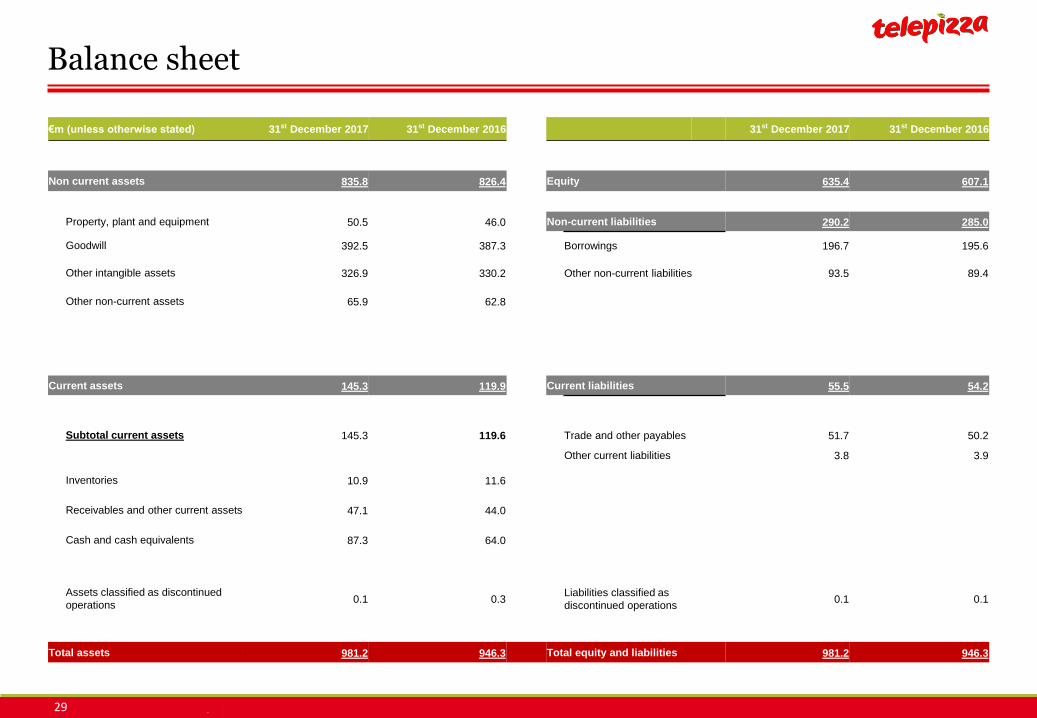
Balance sheet
€m (unless otherwise stated) 31st December 2017 31st December 2016 31st December 2017 31st December 2016
Non current assets 835.8 826.4 Equity 635.4 607.1
Property, plant and equipment 50.5 46.0 Non-current liabilities 290.2 285.0
Goodwill 392.5 387.3 Borrowings 196.7 195.6
Other intangible assets 326.9 330.2 Other non-current liabilities 93.5 89.4
Other non-current assets 65.9 62.8
Current assets 145.3 119.9 Current liabilities 55.5 54.2
Subtotal current assets 145.3 119.6 Trade and other payables 51.7 50.2
Other current liabilities 3.8 3.9
Inventories 10.9 11.6
Receivables and other current assets 47.1 44.0
Cash and cash equivalents 87.3 64.0
Assets classified as discontinued
operations0.1 0.3
Liabilities classified as
discontinued operations0.1 0.1
Total assets 981.2 946.3 Total equity and liabilities 981.2 946.3

30
Glossary
Chain sales: Chain sales are own store sales plus franchised and master franchised store sales as reported to us by the franchisees and master franchisees
LfL chain sales growth: LfL chain sales growth is chain sales growth after adjustment for the effects of changes in scope and the effects of changes in the euro exchange rate as explained below
– Scope adjustment. If a store has been open for the full month, we consider that an “operating month” for the store in question; if not, that month is not an “operating month” for that store. LfL chain sales growth takes into account only variation in a store’s sales for a given month if that month was an “operating month” for the store in both of the periods being compared. The scope adjustment is thepercentage variation between two periods resulting from dividing (i) the variation between the chain sales excluded in each of such periods (“excluded chain sales”) because they were obtained in operating months that were not operating months in the comparableperiod, by (ii) the prior period’s chain sales as adjusted to deduct the excluded chain sales of such period (the “adjusted chain sales”). In this way, we can see the actual changes in chain sales between operating stores, removing the impact of changes between the periods that are due to store openings and closures; and
– Euro exchange rate adjustment. We calculate LfL chain sales growth on a constant currency basis in order to remove the impact ofchanges between the euro and the currencies in certain countries where the Group operates. To make this adjustment, we apply themonthly average euro exchange rate of the operating month in the most recent period to the comparable operating month of the prior period
EBITDA: EBITDA is operating profit plus asset depreciation and amortization
Underlying EBITDA: Underlying EBITDA is EBITDA excluding IPO related costs in FY2016 and the extraordinary corporate deal costs in FY2017.
Digital delivery chain sales: Digital delivery chain sales are the delivery chain sales made through digital channels (PC, web responsive and Telepizza application), expressed in percentage terms. Digital delivery chain sales (both own and franchised) are recorded automatically in the Company’s SAGA store information system when the online order is placed by the customer


