39


MAIN HEADING GOES HERE IN UPPERCASE PLEASE
Put a footer here if you need to. All figures in Australian dollars unless otherwise stated Any discrepancies between totals and sums of components in this publication are due to rounding
FY14 group summary
3
• Operating profit of $72.3m up 4.3% on FY13 with premium revenue up 15.6% to $1.5b1
• Net profit after tax up 3.9% to $69.8m (FY13: $67.2m)• FY14 EPS of 15.9c up 3.9% (FY13: 15.3c). Return on equity 20.8% (FY13: 21.6%)• Group operating profit hampered by weaker arhi performance. While premium revenue was up 10.7%,
arhi’s operating profit result of $57.0 was 3.5% below FY13 with a weak 12.3% gross margin (FY13: 13.2%) and 4.2% net margin (FY13: 5.0%). Corrective measures being taken including 7.99% premium increase and product changes
• All other businesses grew profitability:• International Students Health Insurance (ishi) operating profit of $1.9m (FY13: $(0.1)m)• International Workers Health Insurance (iwhi) operating profit of $9.4m (FY13: $8.4m)• nib New Zealand operating profit of $7.4m2
• Other insurance commissions (non-underwritten) of $2.2m (FY13: $1.9m)• Operating cash flow of $93.7m (average of $84.2m p.a. across 4 years since FY11) • nib New Zealand business transition completed, new management team installed, direct-to-consumer
(DTC) channel launched and no material loss of customer base• New business initiatives included nib Options, “Whitecoat" and partnership with Apia • Full year fully franked ordinary dividend of 11.0cps (interim: 5.25cps, final: 5.75cps) up 10%
(payout ratio 69% of NPAT)• Special dividend (capital management initiative) of 9.0cps (fully franked) equating to a $39.5m
release of capital 1 Premium revenue would have been up 10.9% on FY13 to $1.4b excluding nib New Zealand. Business acquired in November 2012 and FY13 being only a 7 month result, compared to 12 months in FY142 FY13 not comparable to FY14 as only a 7 month result with business acquired November 2012
MAIN HEADING GOES HERE IN UPPERCASE PLEASE
Put a footer here if you need to.
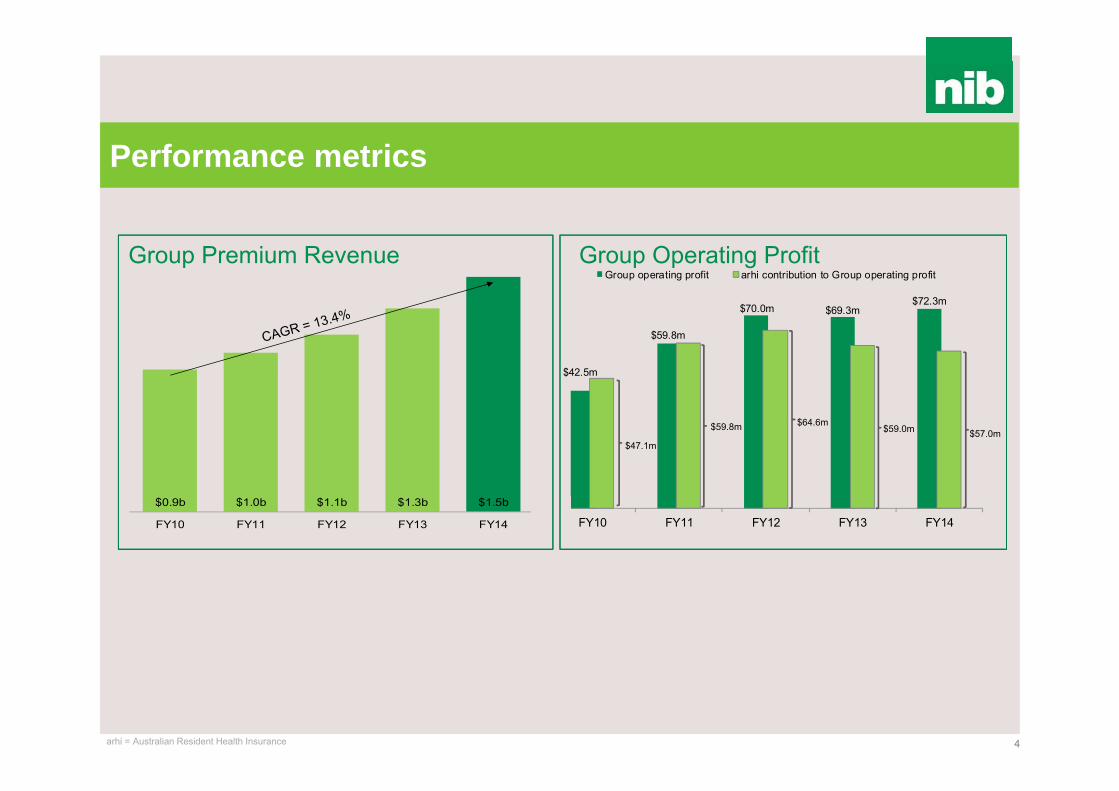
$42.5m
$59.8m
$70.0m $69.3m$72.3m
FY10 FY11 FY12 FY13 FY14
Group operating profit arhi contribution to Group operating profit
Performance metrics
4
$0.9b $1.0b $1.1b $1.3b $1.5b
FY10 FY11 FY12 FY13 FY14
Group Premium Revenue Group Operating Profit
$47.1m
$59.8m $64.6m$59.0m $57.0m
arhi = Australian Resident Health Insurance

MAIN HEADING GOES HERE IN UPPERCASE PLEASE
Put a footer here if you need to.
12.4cps 13.7cps 14.8cps 15.3cps 15.9cps
FY10 FY11 FY12 FY13 FY14
5
Return On Equity Earnings Per Share
16.3% 16.5% 21.7% 21.6% 20.8%
FY10 FY11 FY12 FY13 FY14
Performance metrics

MAIN HEADING GOES HERE IN UPPERCASE PLEASE
Put a footer here if you need to.
7.0cps 8.0cps 9.25cps 10.0cps 11.0cps
5.0cps
9.0cps 16.07cps
FY10 FY11 FY12 FY13 FY14
Ordinary Dividend Special Dividend Capital Return
0
100
200
300
400
500
600
700
Nov-07 Sep-08 Jul-09 May-10 Mar-11 Dec-11 Oct-12 Aug-13 Jun-14
nib S&P/ASX 200 Accumulation Index
6
Dividends & Capital Management* Total Shareholder Return*
475.2%
8.8%
* TSR rebased to 100 (assumes capital returns and dividends re-invested at the payout date)
Performance metrics
* Other capital management initiatives included an on-market share buyback of 10% of issued capital


MAIN HEADING GOES HERE IN UPPERCASE PLEASE
Put a footer here if you need to.
Group income statement
8
($m) FY14 FY13# %*
Group premium revenue1 1,491.6 1,290.4 15.6Claims expense1 (1,040.0) (896.7) 16.0Risk equalisation (190.6) (167.4) 13.8State levies (28.2) (28.8) (2.3)Premium payback liability movement 3.3 3.3 0.8Gross underwriting result 236.2 200.8 17.6
- Gross profit margin 15.8% 15.6% 0.2Acquisition costs (67.9) (52.2) 29.9Claims handling and other underwriting expenses (94.2) (74.8) 26.0Net underwriting profit 74.1 73.8 0.5
- Group underwriting margin 5.0% 5.7% (0.7)Other income 5.7 3.1 82.8Other expenses (7.5) (7.6) (1.2)Operating profit 72.3 69.3 4.3Finance costs (2.7) (1.4) 98.6Net investment income 29.7 28.8 3.0Profit before income tax 99.2 96.7 2.6Income tax expense (29.4) (29.5) (0.4)NPAT 69.8 67.2 3.9Profit is attributable to:Owners of nib holdings limited 69.9 67.2 4.1Non-controlling interests (0.1) - naEPS 15.9cps 15.3cps 3.91 Net of reinsurance # FY13 was only a 7 month result for nib New Zealand with business acquired November 2012* Change is percentage increase or (decrease), FY14 to FY13, where results are a percentage, the change shown is difference between two results

MAIN HEADING GOES HERE IN UPPERCASE PLEASE
Put a footer here if you need to.
Strong arhi growth although lapse is a brake
9
FY14 FY13 %*Total policyholders 486,794 472,264 3.1
- Net policyholder growth 3.1% 4.6% (1.5)Net new policyholders 14,530 20,617 (29.5)Total sales 71,060 66,379 7.1
- Sales rate 15.0% 14.7% 0.3- Sales new to category 49.3% 58.2% (8.9)- Sales under 40 years of age 53.7% 67.1% (13.4)- Sales over 55 years of age 21.9% 11.8% 10.1- Sales online (nib.com.au) 20.8% 23.4% (2.6)- Sales retail broker 31.0% 31.8% (0.8)- Sales outside NSW/ACT 56.1% 51.2% 4.9
Total lapses 56,536 45,762 23.5- Lapse rate 12.0% 10.1% 1.8
* Change is percentage increase or (decrease), FY14 to FY13, where results are a percentage, the change shown is difference between two results
• Sales remain strong up 7.1% on FY13 and API per sale increased 15.4% to $2,343 (FY13: $2,030)• Lower sales new to category reflects successful focus and investment on over 55s sales (including Apia
relationship) which increased 10.1% on FY13• Retail broker sales steady. Sales online lower due to changing marketing mix to optimise cost of
acquisition across channels. Amortisation of deferred acquisition costs currently accounts for 0.6% of the 8.1% MER and future levels are well understood and managed
• Lapse continues to be our greatest challenge in terms of policyholder growth up 23.5% on FY13. Changes to Government Rebate and above industry average 2014 premium increase appear to be drivers of increased lapse
arhi = Australian Resident Health Insurance

MAIN HEADING GOES HERE IN UPPERCASE PLEASE
Put a footer here if you need to.
10
($m) FY14 FY13 %*Premium revenue 1,314.5 1,187.2 10.7
- % of total Group 88.1% 92.0% (3.9)Claims (excluding risk equalisation) (961.7) (862.6) 11.5Risk equalisation (190.6) (167.4) 13.8Gross underwriting result 162.2 157.2 3.1
- Gross margin (%) 12.3% 13.2% (0.9)Management expenses (106.4) (98.2) 8.3
- MER (%) 8.1% 8.3% (0.2)Net underwriting result 55.8 59.0 (5.5)
- Net margin (%) 4.2% 5.0% (0.8)Other income 1.2 - naOperating profit 57.0 59.0 (3.5)
- % of Group 78.9% 85.2% (6.4)* Change is percentage increase or (decrease), FY14 to FY13, where results are a percentage, the change shown is difference between two results
• Premium revenue up 10.7% driven by policyholder growth, higher API per sale and premium increases• Claims expense (excluding risk equalisation) up 11.5% primarily due to policyholder growth, private hospital
inflation (mainly utilisation), public hospital utilisation and product mix (selling higher value products, ie over 55s, and high utilisation on Top Extras 85% product). Refer slide 11 for further analysis
• Number of initiatives underway focussing on reducing level of claims inflation• Management expenses up 8.3% due to increase in employee costs (frontline), increased investment in IT
and retail broker commissions, with MER of 8.1% (FY13: 8.3%) lowest since listing• Net operating profit down 3.5% primarily due to gross margin weakness• $1.2m arhi other income in FY14 associated with one off provider contract sign on fee
arhi claims inflation behind gross margin weakness
arhi = Australian Resident Health Insurance
MAIN HEADING GOES HERE IN UPPERCASE PLEASE
Put a footer here if you need to.
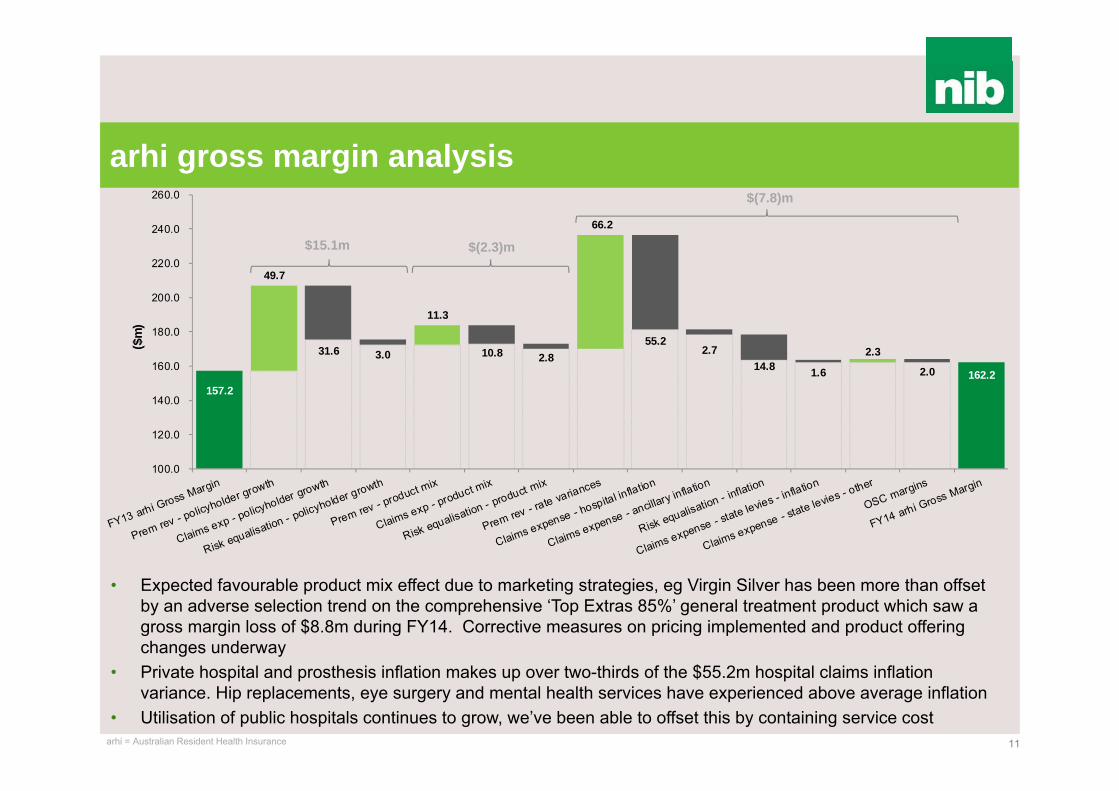
157.2 162.2
31.6 3.0 10.8 2.8 55.2
2.7 14.8 1.6 2.0
49.7
11.3
66.2
2.3
100.0
120.0
140.0
160.0
180.0
200.0
220.0
240.0
260.0
($m
)
arhi gross margin analysis
11
• Expected favourable product mix effect due to marketing strategies, eg Virgin Silver has been more than offset by an adverse selection trend on the comprehensive ‘Top Extras 85%’ general treatment product which saw a gross margin loss of $8.8m during FY14. Corrective measures on pricing implemented and product offering changes underway
• Private hospital and prosthesis inflation makes up over two-thirds of the $55.2m hospital claims inflation variance. Hip replacements, eye surgery and mental health services have experienced above average inflation
• Utilisation of public hospitals continues to grow, we’ve been able to offset this by containing service cost arhi = Australian Resident Health Insurance
$(7.8)m
$15.1m $(2.3)m
MAIN HEADING GOES HERE IN UPPERCASE PLEASE
Put a footer here if you need to.
ishi distribution driving strong top line growth
12
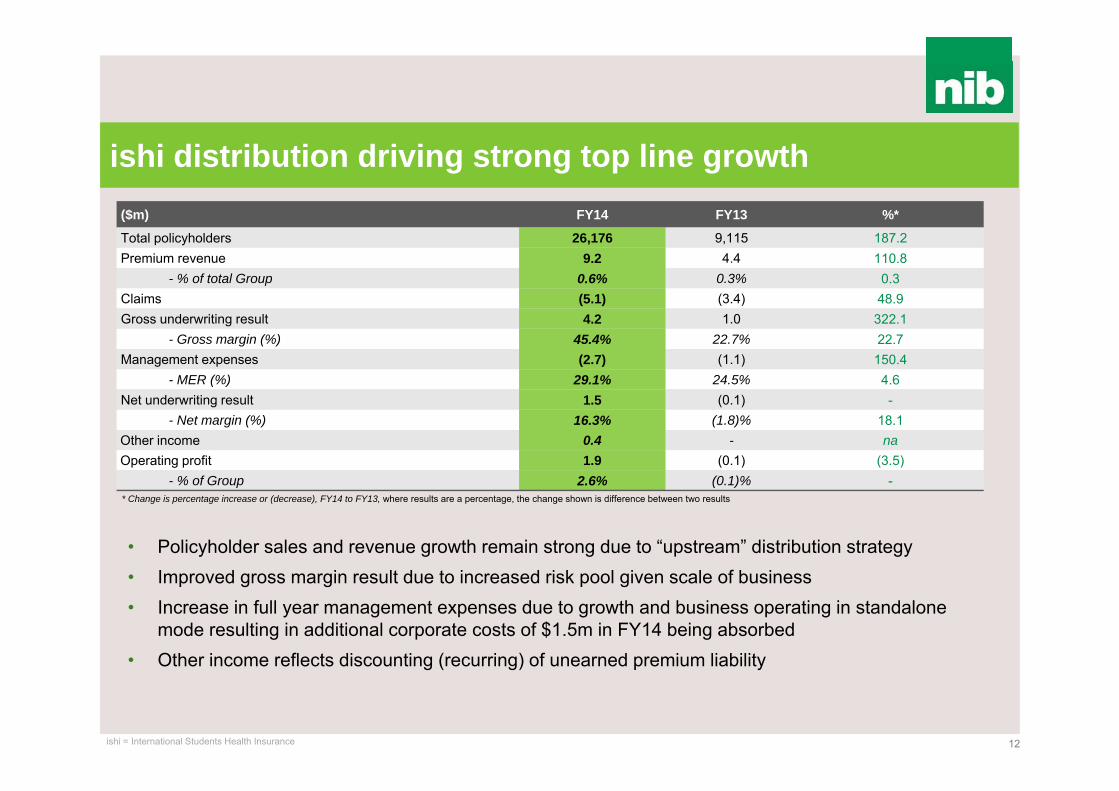
($m) FY14 FY13 %*
Total policyholders 26,176 9,115 187.2Premium revenue 9.2 4.4 110.8
- % of total Group 0.6% 0.3% 0.3Claims (5.1) (3.4) 48.9Gross underwriting result 4.2 1.0 322.1
- Gross margin (%) 45.4% 22.7% 22.7Management expenses (2.7) (1.1) 150.4
- MER (%) 29.1% 24.5% 4.6Net underwriting result 1.5 (0.1) -
- Net margin (%) 16.3% (1.8)% 18.1Other income 0.4 - naOperating profit 1.9 (0.1) (3.5)
- % of Group 2.6% (0.1)% -* Change is percentage increase or (decrease), FY14 to FY13, where results are a percentage, the change shown is difference between two results
• Policyholder sales and revenue growth remain strong due to “upstream” distribution strategy • Improved gross margin result due to increased risk pool given scale of business• Increase in full year management expenses due to growth and business operating in standalone
mode resulting in additional corporate costs of $1.5m in FY14 being absorbed• Other income reflects discounting (recurring) of unearned premium liability
ishi = International Students Health Insurance
MAIN HEADING GOES HERE IN UPPERCASE PLEASE
Put a footer here if you need to.
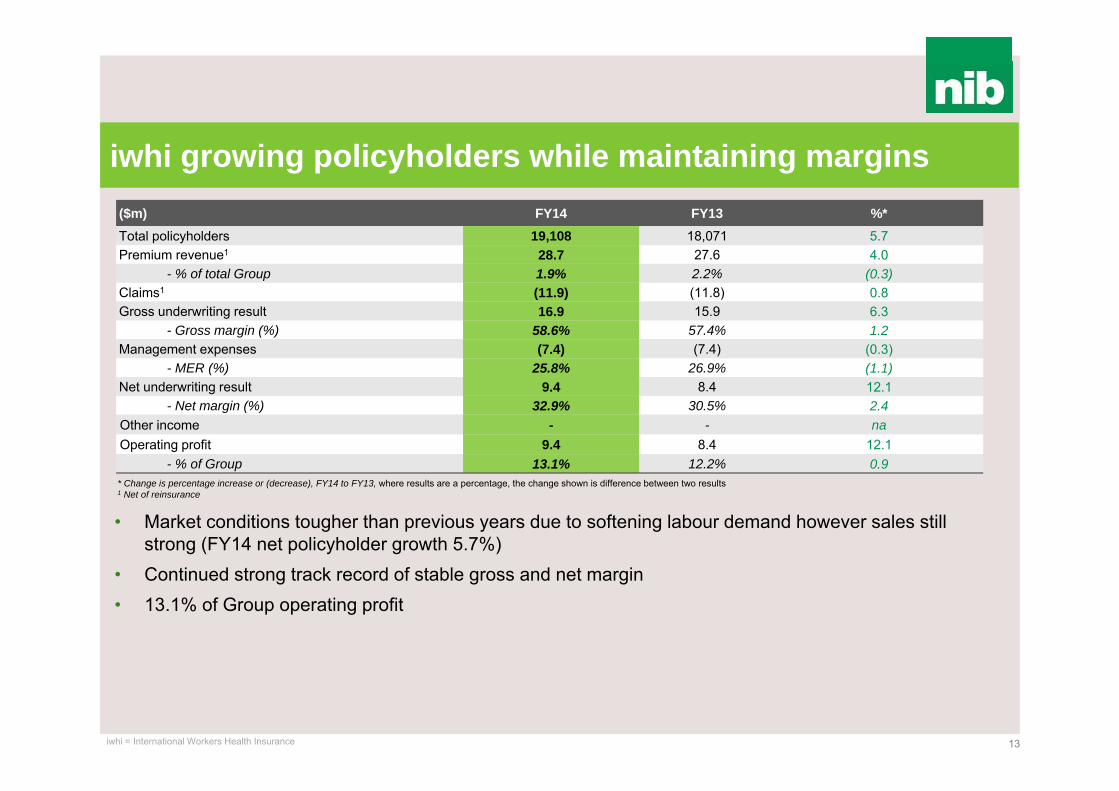
iwhi growing policyholders while maintaining margins
13
($m) FY14 FY13 %*Total policyholders 19,108 18,071 5.7Premium revenue1 28.7 27.6 4.0
- % of total Group 1.9% 2.2% (0.3)Claims1 (11.9) (11.8) 0.8Gross underwriting result 16.9 15.9 6.3
- Gross margin (%) 58.6% 57.4% 1.2Management expenses (7.4) (7.4) (0.3)
- MER (%) 25.8% 26.9% (1.1)Net underwriting result 9.4 8.4 12.1
- Net margin (%) 32.9% 30.5% 2.4Other income - - naOperating profit 9.4 8.4 12.1
- % of Group 13.1% 12.2% 0.9* Change is percentage increase or (decrease), FY14 to FY13, where results are a percentage, the change shown is difference between two results1 Net of reinsurance
• Market conditions tougher than previous years due to softening labour demand however sales still strong (FY14 net policyholder growth 5.7%)
• Continued strong track record of stable gross and net margin • 13.1% of Group operating profit
iwhi = International Workers Health Insurance
MAIN HEADING GOES HERE IN UPPERCASE PLEASE
Put a footer here if you need to.
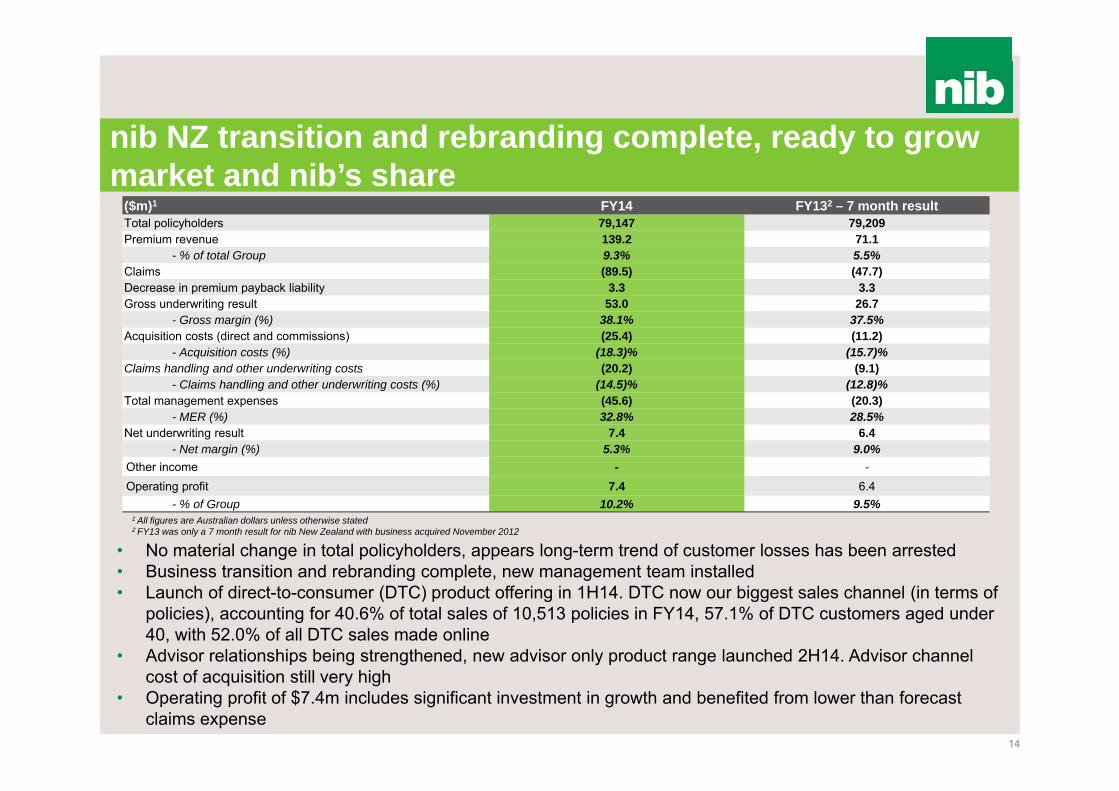
nib NZ transition and rebranding complete, ready to grow market and nib’s share
14
($m)1 FY14 FY132 – 7 month resultTotal policyholders 79,147 79,209Premium revenue 139.2 71.1
- % of total Group 9.3% 5.5%Claims (89.5) (47.7)Decrease in premium payback liability 3.3 3.3Gross underwriting result 53.0 26.7
- Gross margin (%) 38.1% 37.5%Acquisition costs (direct and commissions) (25.4) (11.2)
- Acquisition costs (%) (18.3)% (15.7)%Claims handling and other underwriting costs (20.2) (9.1)
- Claims handling and other underwriting costs (%) (14.5)% (12.8)%Total management expenses (45.6) (20.3)
- MER (%) 32.8% 28.5%Net underwriting result 7.4 6.4
- Net margin (%) 5.3% 9.0%Other income - -Operating profit 7.4 6.4
- % of Group 10.2% 9.5%1 All figures are Australian dollars unless otherwise stated2 FY13 was only a 7 month result for nib New Zealand with business acquired November 2012
• No material change in total policyholders, appears long-term trend of customer losses has been arrested• Business transition and rebranding complete, new management team installed • Launch of direct-to-consumer (DTC) product offering in 1H14. DTC now our biggest sales channel (in terms of
policies), accounting for 40.6% of total sales of 10,513 policies in FY14, 57.1% of DTC customers aged under 40, with 52.0% of all DTC sales made online
• Advisor relationships being strengthened, new advisor only product range launched 2H14. Advisor channel cost of acquisition still very high
• Operating profit of $7.4m includes significant investment in growth and benefited from lower than forecast claims expense
MAIN HEADING GOES HERE IN UPPERCASE PLEASE
Put a footer here if you need to.
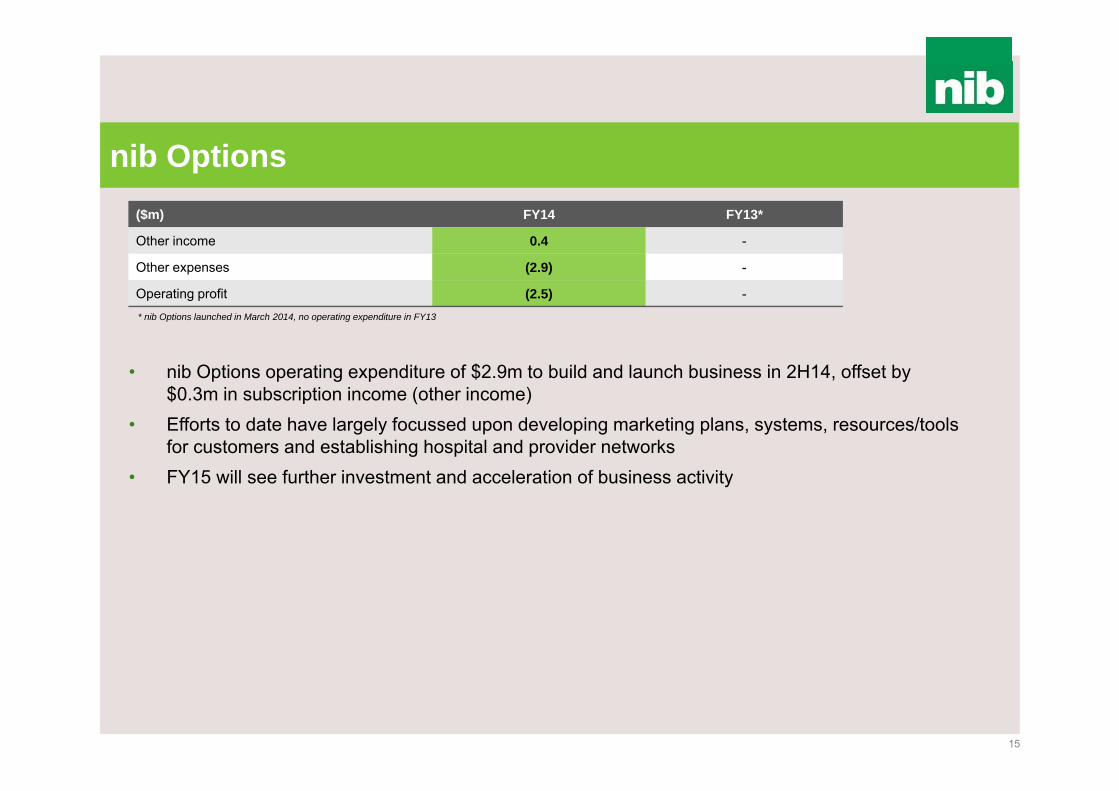
nib Options
15
($m) FY14 FY13*
Other income 0.4 -
Other expenses (2.9) -
Operating profit (2.5) -* nib Options launched in March 2014, no operating expenditure in FY13
• nib Options operating expenditure of $2.9m to build and launch business in 2H14, offset by $0.3m in subscription income (other income)
• Efforts to date have largely focussed upon developing marketing plans, systems, resources/tools for customers and establishing hospital and provider networks
• FY15 will see further investment and acceleration of business activity

MAIN HEADING GOES HERE IN UPPERCASE PLEASE
Put a footer here if you need to.
Other income, expenses (excluding nib Options) & finance costs
16
($m) FY14 FY13 %*Complementary insuranceLife and funeral insurance commission 1.8 1.5 17.0Travel insurance and other commission 0.4 0.4 2.9Total complementary insurance 2.2 1.9 14.1Other income (excluding nib Options and complementary insurance) Agency fee 0.2 0.1 51.0Rental income 0.9 0.8 9.7Sundry income 2.1 0.3 626.4Total other income 3.1 1.2 158.4Other expenses (excluding nib Options)Share registry 1.2 1.7 (28.0)M&A 0.8 3.6 (77.7)Other 2.6 2.4 10.4Total other expenses 4.6 7.6 39.4Finance Costs 2.7 1.4 98.6
* Change is percentage increase or (decrease), FY14 to FY13
• Life and funeral insurance commissions up 17.0% due to upselling and premium increases• Other income includes one off provider contract sign on fee• Other expenses of $4.6m (down 39.4%) include:
• Share registry costs down 28.0% due to campaign in FY13 to encourage retail shareholders to provide direct credit details for dividend payments
• M&A costs reflects ongoing exploration of opportunities • Finance costs relate to nib New Zealand debt facility, with FY13 being a 7 month period
MAIN HEADING GOES HERE IN UPPERCASE PLEASE
Put a footer here if you need to.
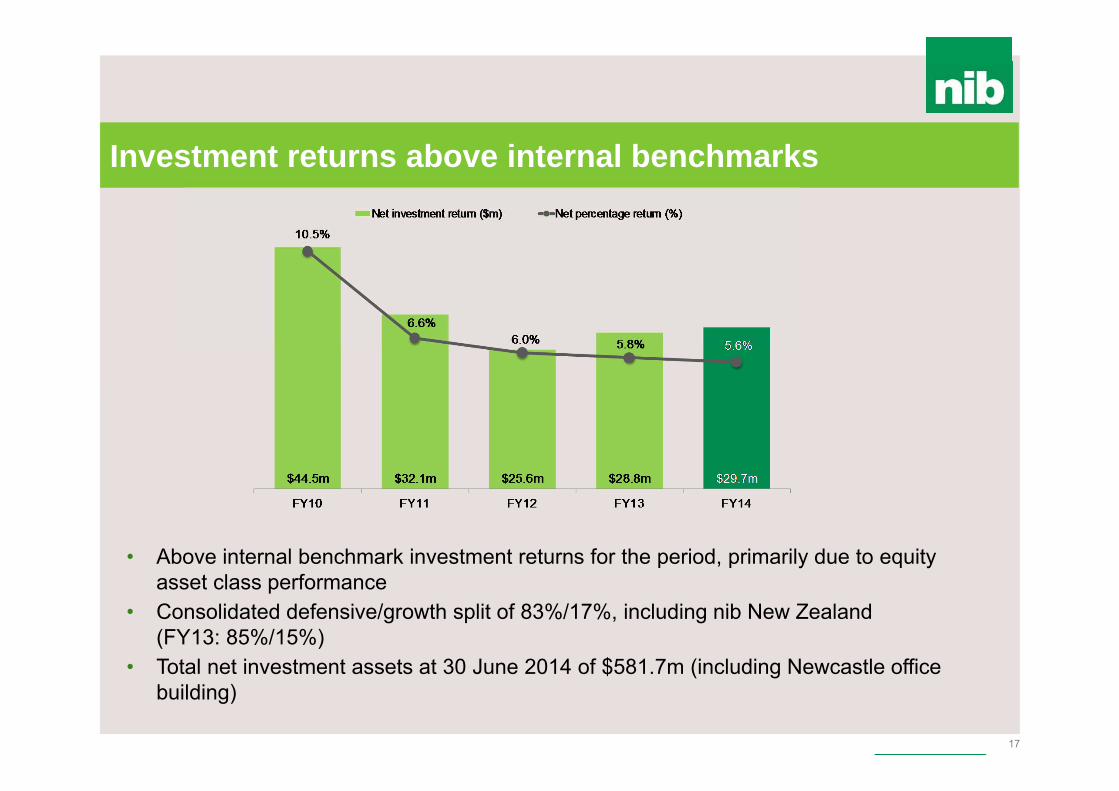
Investment returns above internal benchmarks
17
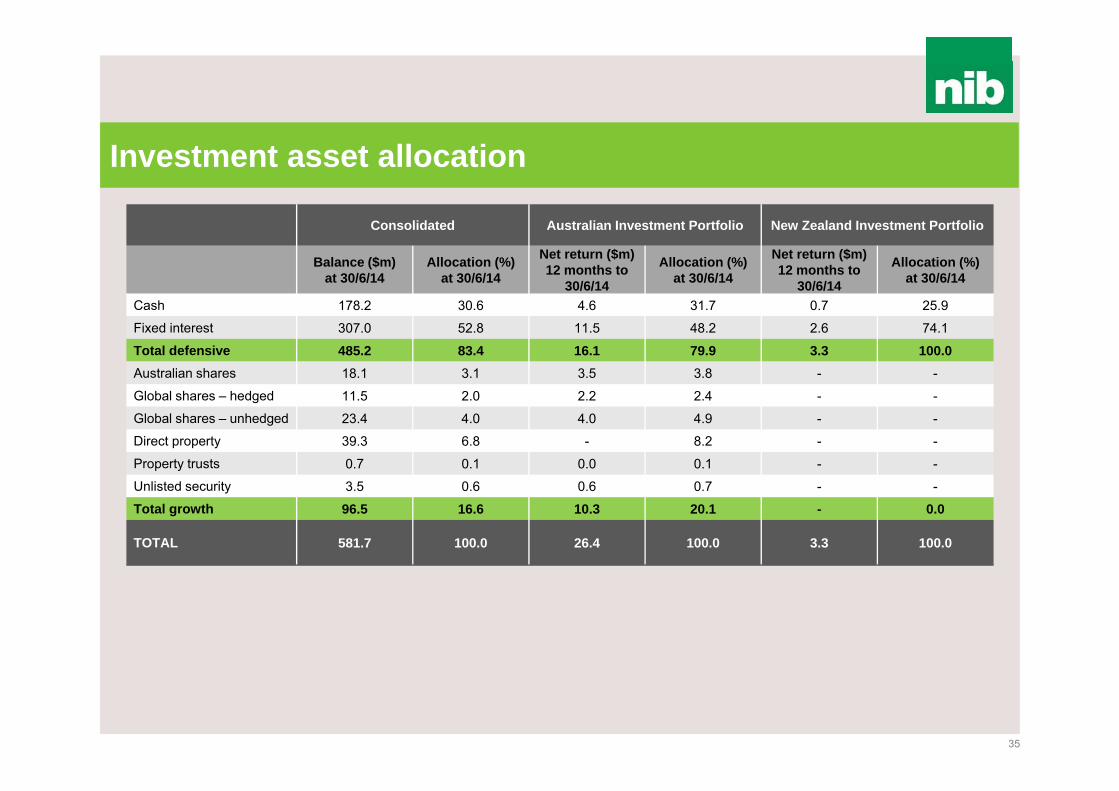
• Above internal benchmark investment returns for the period, primarily due to equity asset class performance
• Consolidated defensive/growth split of 83%/17%, including nib New Zealand (FY13: 85%/15%)
• Total net investment assets at 30 June 2014 of $581.7m (including Newcastle office building)

MAIN HEADING GOES HERE IN UPPERCASE PLEASE
Put a footer here if you need to.
67.2 69.8
8.2 1.6
25.3 1.4
4.9 1.0
3.2
26.3
0.0
0.9 2.6 0.1 0.1
60.0
65.0
70.0
75.0
80.0
85.0
90.0
95.0
100.0
($m
)
NPAT drivers
18
• nib New Zealand variances largely driven by a full 12 month result in FY14 compared to a 7 month result in FY13
arhi = Australian Resident Health Insurance, iwhi = International Workers Health Insurance, ishi = International Students Health Insurance, nib NZ = nib New Zealand

MAIN HEADING GOES HERE IN UPPERCASE PLEASE
Put a footer here if you need to.
Generating strong operating cashflows
19
($m) FY14 FY13 %
Net cash inflow/(outflow) from operating 93.7 20.0 367.6
Net cash inflow/(outflow) from investing (42.0) 24.0 (275.1)
Net cash inflow/(outflow) from financing (46.3) 10.5 (541.5)
Net increase (decrease) in cash and cash equivalents 5.4 54.5 (90.1)* Change is percentage increase or (decrease), FY14 to FY13
• Operating cash inflow lower in FY13 due to prepayment of premiums in FY12 to avoid income testing of Government Rebate
• Investing cash outflow down in FY14 due to reallocation from cash to fixed interest in Australia • Financing cash outflow lower in FY14 due to dividends paid during the year. FY13 dividends paid
were offset by proceeds from borrowings (nib New Zealand)• Average operating cashflow of $84.2m p.a. across 4 years FY11 – FY14

MAIN HEADING GOES HERE IN UPPERCASE PLEASE
Put a footer here if you need to.
Available capital position
20
FY14 ($m) FY13 ($m)
Opening available capital position above internal targets 14.8 13.3
Net profit after tax 69.8 67.2
Movement in foreign currency transaction reserve direct to equity 2.0 1.2
Movement in other reserves direct to equity 3.4 0.1
Changes in debt 5.9 59.1
Changes in New Zealand intangibles and other liabilities (1.4) (37.6)
Changes in other intangibles, other assets and liabilities (1.3) (0.2)
(Increase)/Decrease in capital required nib health funds 49.0 (7.9)
(Increase)/Decrease in capital required nib New Zealand (11.8) (36.6)
Increase in allowance for debt net tangible assets covenant and $5.0m buffer for forecast volatility (23.9) -Interim dividend paid and allowance for final dividend (48.3) (43.9)
Allowance for special dividend (39.5) -
Consolidated available capital position above internal targets 18.7 14.8
• Gearing ratio at 30 June 2014 of 15.8% (debt to debt plus equity)• The $39.5m capital release by way of special dividend would have resulted in a gearing ratio at 30 June
2014 of 17.4% (debt to debt plus equity) being 160 bps higher had capital been released at that date• nib will raise debt up to a level that achieves a long term average gearing ratio of 30%, with a short to
medium term target of 25% based on business as usual with the remaining 5% available for strategic M&A opportunities, noting that for a significant transaction gearing may be above 30% for a short time if necessary to effect the transaction


MAIN HEADING GOES HERE IN UPPERCASE PLEASE
Put a footer here if you need to.
5.9% 6.0%
4.7% 4.6%
3.1%2.9%3.2%
3.7%
3.1%
FY10 FY11 FY12 FY13 FY14 *
nib Industry
nib and industry* annual net policyholder growth
Source: Private Health Insurance Administration Council
Outlook – arhi demand likely to be strong
22
arhi• Total demand for private health insurance
expected to grow circa 3% (net annual policyholder growth) - with nib continuing to do better
• Steps have and are being taken to restore net margin towards target 5.0%-5.5% range, include
• 2014 premium increase• Product changes• Benefits and utilisation management
• Possible favourable regulatory reforms around premium approvals and expanded PHI cover (e.g. GPs)
• Medibank Private IPO not without implications
arhi = Australian Resident Health Insurance
* nib estimated figure (of 2.5%-3% annual industry net policyholder growth in FY14) using company and industry information to 31 March 2014. At the time of finalising this presentation the Private Health Insurance Administration Council (PHIAC) had not published the 2014 June Quarter industry statistics
2.5%
-3%
(est
imat
e)*
MAIN HEADING GOES HERE IN UPPERCASE PLEASE
Put a footer here if you need to.
23
International and adjacent business segments• iwhi and ishi markets forecast to grow with opportunities for nib to increase market
share and profitability• nib New Zealand investment to be maintained especially in relation to direct-to-
consumer channel with short term impact upon profitability• Planned launch of International Private Medical Insurance (IPMI) in New Zealand in
September 2014 with intention to launch into Australia within 18 months• Adjacent insurance lines earnings will continue to increase with possible additional
product lines
nib Options • nib Options in the early stages of development and more concerted marketing effort
planned from October 2014• Not expected to be profitable until FY16
Value creation via diversification
iwhi = International Workers Health Insurance, ishi = International Students Health Insurance

MAIN HEADING GOES HERE IN UPPERCASE PLEASE
Put a footer here if you need to.
24
• Dividend payout ratio of 60%-70% full year NPAT• Capacity to better optimise nib’s capital structure with additional debt• M&A opportunities although not clear, have been provided for in capital planning
Capital management remains in focus
iwhi = International Workers Health Insurance, ishi = International Students Health Insurance

MAIN HEADING GOES HERE IN UPPERCASE PLEASE
Put a footer here if you need to.
FY15 guidance
25
• FY15 consolidated operating profit in the range of $75 million to $82 million• FY15 investment income forecast to be line with relevant internal benchmarks*
* Internal Investment benchmarks• Australian Regulatory capital (80/20 defensive/growth) - target for portfolio UBS bank bill index plus 1%• New Zealand regulatory capital (100% defensive) (1) For core portfolio target is a 6 month bank bill index (2) For premium payback portfolio target is a 3.0 years interest rate swap index • Surplus capital (100% defensive) - UBS bank bill index

MAIN HEADING GOES HERE IN UPPERCASE PLEASE
Put a footer here if you need to.
nib policyholder & other data
28
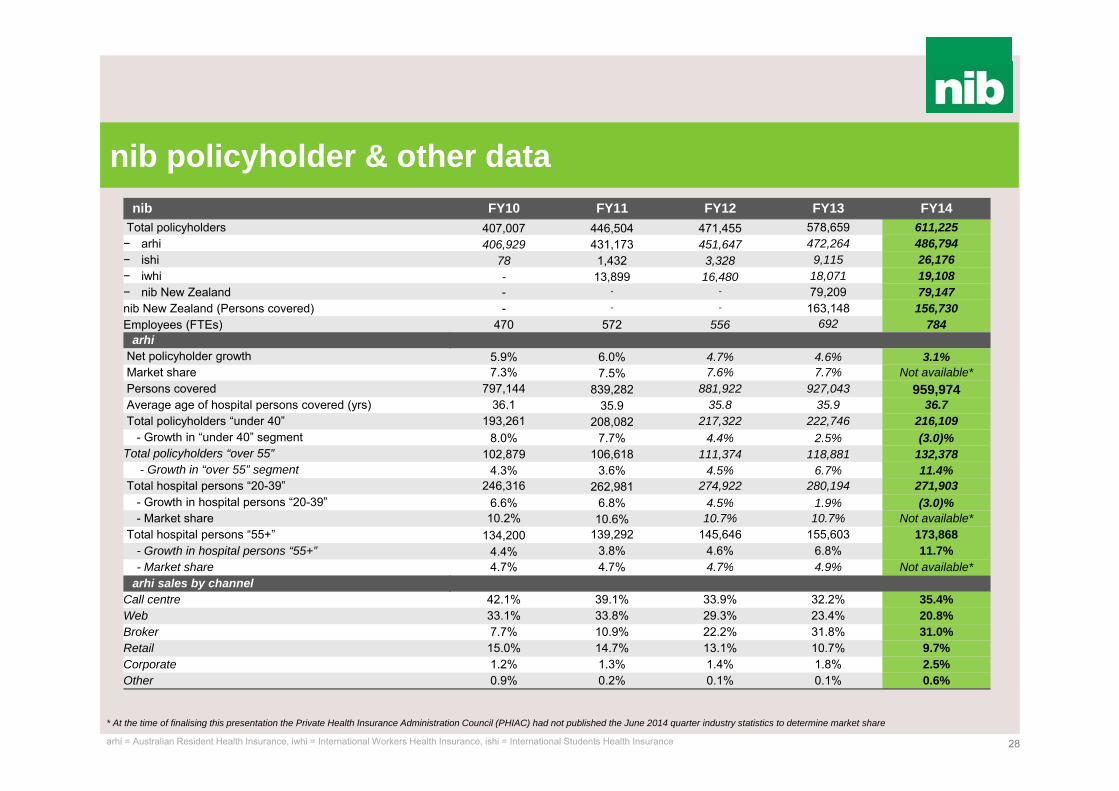
nib FY10 FY11 FY12 FY13 FY14Total policyholders 407,007 446,504 471,455 578,659 611,225− arhi 406,929 431,173 451,647 472,264 486,794− ishi 78 1,432 3,328 9,115 26,176 − iwhi - 13,899 16,480 18,071 19,108 − nib New Zealand - - - 79,209 79,147nib New Zealand (Persons covered) - - - 163,148 156,730 Employees (FTEs) 470 572 556 692 784
arhiNet policyholder growth 5.9% 6.0% 4.7% 4.6% 3.1%Market share 7.3% 7.5% 7.6% 7.7% Not available*Persons covered 797,144 839,282 881,922 927,043 959,974 Average age of hospital persons covered (yrs) 36.1 35.9 35.8 35.9 36.7Total policyholders “under 40” 193,261 208,082 217,322 222,746 216,109
- Growth in “under 40” segment 8.0% 7.7% 4.4% 2.5% (3.0)%Total policyholders “over 55” 102,879 106,618 111,374 118,881 132,378
- Growth in “over 55” segment 4.3% 3.6% 4.5% 6.7% 11.4%Total hospital persons “20-39” 246,316 262,981 274,922 280,194 271,903
- Growth in hospital persons “20-39” 6.6% 6.8% 4.5% 1.9% (3.0)%- Market share 10.2% 10.6% 10.7% 10.7% Not available*
Total hospital persons “55+” 134,200 139,292 145,646 155,603 173,868- Growth in hospital persons “55+” 4.4% 3.8% 4.6% 6.8% 11.7%- Market share 4.7% 4.7% 4.7% 4.9% Not available*
arhi sales by channel Call centre 42.1% 39.1% 33.9% 32.2% 35.4%Web 33.1% 33.8% 29.3% 23.4% 20.8%Broker 7.7% 10.9% 22.2% 31.8% 31.0%Retail 15.0% 14.7% 13.1% 10.7% 9.7%Corporate 1.2% 1.3% 1.4% 1.8% 2.5%Other 0.9% 0.2% 0.1% 0.1% 0.6%
arhi = Australian Resident Health Insurance, iwhi = International Workers Health Insurance, ishi = International Students Health Insurance
* At the time of finalising this presentation the Private Health Insurance Administration Council (PHIAC) had not published the June 2014 quarter industry statistics to determine market share

MAIN HEADING GOES HERE IN UPPERCASE PLEASE
Put a footer here if you need to.
Australian PHI industry data
29
FY10 FY11 FY12 FY13 FY14
Total policyholders 5,549,338 5,727,566 5,936,660 6,118,351
- Policyholder growth 2.9% 3.2% 3.7% 3.1%
Persons covered 11,561,299 11,901,915 12,321,848 12,680,337
Average age of hospital persons (yrs) 40.1 40.2 40.3 40.4
Total hospital persons "20-39" 2,407,852 2,477,256 2,562,382 2,626,727
- Growth in hospital persons "20-39" 2.1% 2.9% 3.4% 2.5%Total hospital persons “55+” 2,859,104 2,969,911 3,086,206 3,197,316
- Growth in hospital persons “55+” 4.1% 3.9% 3.9% 3.6%
Source: Private Health Insurance Administration Council* At the time of finalising this presentation the Private Health Insurance Administration Council (PHIAC) had not published the June 2014 quarter industry statistics
MAIN HEADING GOES HERE IN UPPERCASE PLEASE
Put a footer here if you need to.
Detailed income statement
30
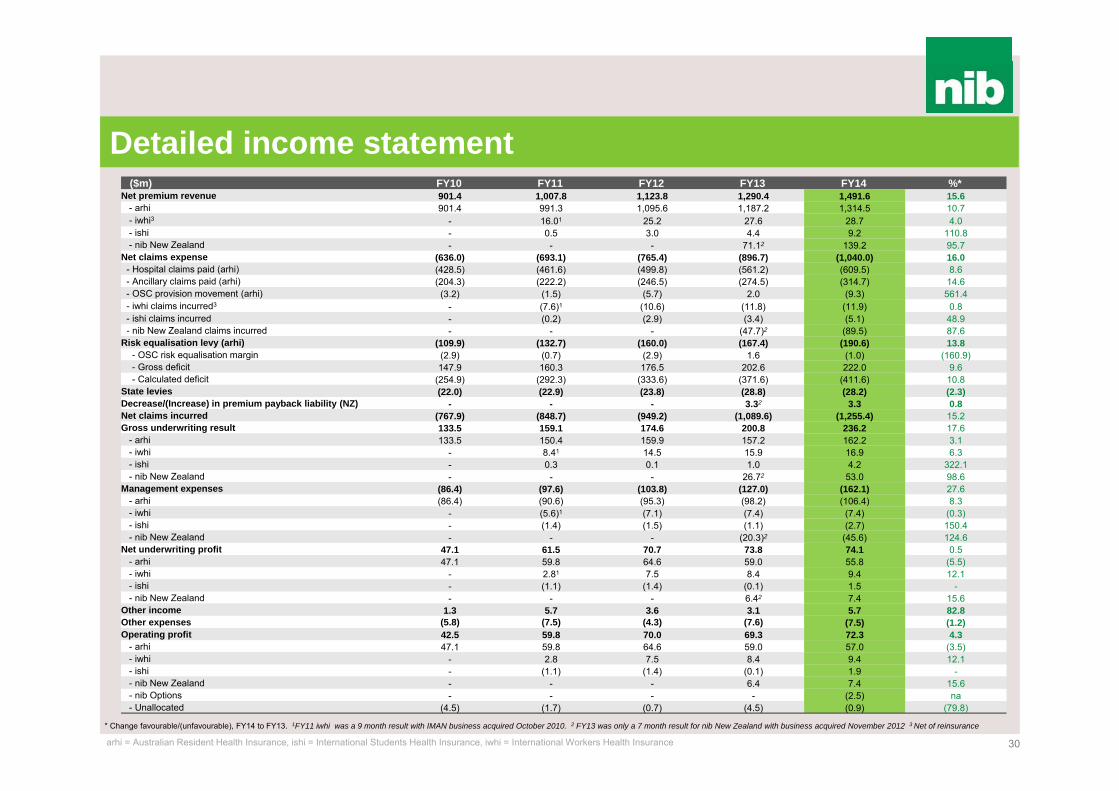
($m) FY10 FY11 FY12 FY13 FY14 %*Net premium revenue 901.4 1,007.8 1,123.8 1,290.4 1,491.6 15.6
- arhi 901.4 991.3 1,095.6 1,187.2 1,314.5 10.7- iwhi3 - 16.01 25.2 27.6 28.7 4.0- ishi - 0.5 3.0 4.4 9.2 110.8- nib New Zealand - - - 71.12 139.2 95.7
Net claims expense (636.0) (693.1) (765.4) (896.7) (1,040.0) 16.0- Hospital claims paid (arhi) (428.5) (461.6) (499.8) (561.2) (609.5) 8.6- Ancillary claims paid (arhi) (204.3) (222.2) (246.5) (274.5) (314.7) 14.6- OSC provision movement (arhi) (3.2) (1.5) (5.7) 2.0 (9.3) 561.4- iwhi claims incurred3 - (7.6)1 (10.6) (11.8) (11.9) 0.8- ishi claims incurred - (0.2) (2.9) (3.4) (5.1) 48.9- nib New Zealand claims incurred - - - (47.7)2 (89.5) 87.6
Risk equalisation levy (arhi) (109.9) (132.7) (160.0) (167.4) (190.6) 13.8- OSC risk equalisation margin (2.9) (0.7) (2.9) 1.6 (1.0) (160.9)- Gross deficit 147.9 160.3 176.5 202.6 222.0 9.6- Calculated deficit (254.9) (292.3) (333.6) (371.6) (411.6) 10.8
State levies (22.0) (22.9) (23.8) (28.8) (28.2) (2.3)Decrease/(Increase) in premium payback liability (NZ) - - - 3.32 3.3 0.8Net claims incurred (767.9) (848.7) (949.2) (1,089.6) (1,255.4) 15.2Gross underwriting result 133.5 159.1 174.6 200.8 236.2 17.6
- arhi 133.5 150.4 159.9 157.2 162.2 3.1- iwhi - 8.41 14.5 15.9 16.9 6.3- ishi - 0.3 0.1 1.0 4.2 322.1- nib New Zealand - - - 26.72 53.0 98.6
Management expenses (86.4) (97.6) (103.8) (127.0) (162.1) 27.6- arhi (86.4) (90.6) (95.3) (98.2) (106.4) 8.3- iwhi - (5.6)1 (7.1) (7.4) (7.4) (0.3)- ishi - (1.4) (1.5) (1.1) (2.7) 150.4- nib New Zealand - - - (20.3)2 (45.6) 124.6
Net underwriting profit 47.1 61.5 70.7 73.8 74.1 0.5- arhi 47.1 59.8 64.6 59.0 55.8 (5.5)- iwhi - 2.81 7.5 8.4 9.4 12.1- ishi - (1.1) (1.4) (0.1) 1.5 -- nib New Zealand - - - 6.42 7.4 15.6
Other income 1.3 5.7 3.6 3.1 5.7 82.8Other expenses (5.8) (7.5) (4.3) (7.6) (7.5) (1.2)Operating profit 42.5 59.8 70.0 69.3 72.3 4.3
- arhi 47.1 59.8 64.6 59.0 57.0 (3.5)- iwhi - 2.8 7.5 8.4 9.4 12.1- ishi - (1.1) (1.4) (0.1) 1.9 -- nib New Zealand - - - 6.4 7.4 15.6- nib Options - - - - (2.5) na- Unallocated (4.5) (1.7) (0.7) (4.5) (0.9) (79.8)
* Change favourable/(unfavourable), FY14 to FY13. 1FY11 iwhi was a 9 month result with IMAN business acquired October 2010. 2 FY13 was only a 7 month result for nib New Zealand with business acquired November 2012 3 Net of reinsurance
arhi = Australian Resident Health Insurance, ishi = International Students Health Insurance, iwhi = International Workers Health Insurance

MAIN HEADING GOES HERE IN UPPERCASE PLEASE
Put a footer here if you need to.
Detailed management expenses
31
($m)E
mpl
oym
ent
Mar
ketin
g (D
irect
)
Mar
ketin
g C
omm
isio
ns
(Pai
d)
Mar
ketin
g C
omm
issi
ons
(def
fere
d)
Mar
ketin
g C
omm
issi
ons
(am
mor
tisat
ion)
IT
Occ
upan
cy
Oth
er
Tota
l M
anag
emen
t E
xpen
ses
Tota
l ME
R (%
)
arhiFY10 37.0 19.4 3.7 - - 6.2 7.7 12.4 86.4 9.6FY11 40.3 21.0 5.3 - - 6.5 3.9 13.6 90.6 9.2FY12 45.4 20.4 10.6 (9.0) 0.7 7.5 5.8 13.8 95.3 8.7FY13 46.3 20.0 15.1 (13.7) 2.7 8.6 6.4 12.8 98.2 8.3FY14 49.8 20.4 17.6 (16.0) 5.4 9.3 5.9 13.9 106.4 8.1iwhiFY111
2.7 0.2 0.0 - - 0.8 0.2 1.7 5.6 35.0FY12 3.4 0.5 0.1 - - 1.1 0.3 1.6 7.0 24.6FY13 3.2 1.6 0.1 - - 1.2 0.2 1.1 7.4 26.9FY14 3.7 1.1 0.1 - - 1.0 0.5 0.9 7.4 25.8ishiFY11 0.9 0.1 0.2 - - 0.0 0.0 0.2 1.4 247.4FY12 0.6 0.1 0.6 - - - - 0.2 1.5 50.8FY13 0.3 0.1 0.7 - - - - 0.1 1.1 24.5FY14 1.7 0.1 1.4 (1.4) 0.4 0.2 0.1 0.2 2.7 29.1nib New ZealandFY132
5.9 0.5 8.2 (4.4) 5.2 0.5 0.3 4.2 20.3 28.5FY14 12.1 5.7 18.2 (9.7) 9.3 2.3 0.8 7.0 45.6 32.8
arhi = Australian Resident Health Insurance, iwhi = International Workers Health Insurance, ishi = International Students Health Insurance,
1FY11 iwhi was a 9 month result with IMAN business acquired October 20102 FY13 was only a 7 month result for nib New Zealand with business acquired November 2012

MAIN HEADING GOES HERE IN UPPERCASE PLEASE
Put a footer here if you need to.
arhi claims
32
-5.0%
0.0%
5.0%
10.0%
15.0%
nib Industry * nib service cost nib utilisation nib annual drawing rate inflation (per SEU) incl. RE
Overall claims inflation* (hospital and ancillary)
All figures exclude ishi, iwhi and nib New Zealand, unless otherwise statedSource: Private Health Insurance Administration Council and nib
* At the time of finalising this presentation the Private Health Insurance Administration Council (PHIAC) had not published the June 2014 quarter industry statistics, the above graph includes industry data to March 2014 quarter

MAIN HEADING GOES HERE IN UPPERCASE PLEASE
Put a footer here if you need to.
arhi claims
33
-10%
-5%
0%
5%
10%
15%
20%
25%
Sep-
01D
ec-0
1M
ar-0
2Ju
n-02
Sep-
02D
ec-0
2M
ar-0
3Ju
n-03
Sep-
03D
ec-0
3M
ar-0
4Ju
n-04
Sep-
04D
ec-0
4M
ar-0
5Ju
n-05
Sep-
05D
ec-0
5M
ar-0
6Ju
n-06
Sep-
06D
ec-0
6M
ar-0
7Ju
n-07
Sep-
07D
ec-0
7M
ar-0
8Ju
n-08
Sep-
08D
ec-0
8M
ar-0
9Ju
n-09
Sep-
09D
ec-0
9M
ar-1
0Ju
n-10
Sep-
10D
ec-1
0M
ar-1
1Ju
n-11
Sep-
11D
ec-1
1M
ar-1
2Ju
n-12
Sep-
12D
ec-1
2M
ar-1
3Ju
n-13
Sep-
13D
ec-1
3M
ar-1
4Ju
n-14
nib Industry * nib service cost nib utilisation nib annual drawing rate inflation (per SEU) incl. RE
-10%
-5%
0%
5%
10%
15%
20%
25%
Sep-
01D
ec-0
1M
ar-0
2Ju
n-02
Sep-
02D
ec-0
2M
ar-0
3Ju
n-03
Sep-
03D
ec-0
3M
ar-0
4Ju
n-04
Sep-
04D
ec-0
4M
ar-0
5Ju
n-05
Sep-
05D
ec-0
5M
ar-0
6Ju
n-06
Sep-
06D
ec-0
6M
ar-0
7Ju
n-07
Sep-
07D
ec-0
7M
ar-0
8Ju
n-08
Sep-
08D
ec-0
8M
ar-0
9Ju
n-09
Sep-
09D
ec-0
9M
ar-1
0Ju
n-10
Sep-
10D
ec-1
0M
ar-1
1Ju
n-11
Sep-
11D
ec-1
1M
ar-1
2Ju
n-12
Sep-
12D
ec-1
2M
ar-1
3Ju
n-13
Sep-
13D
ec-1
3M
ar-1
4Ju
n-14
nib Industry * nib service cost nib utilisationAncillary claims inflation*
Hospital claims inflation*
All figures exclude ishi, iwhi and nib New Zealand, unless otherwise statedSource: Private Health Insurance Administration Council and nib
* At the time of finalising this presentation the Private Health Insurance Administration Council (PHIAC) had not published the June 2014 quarter industry statistics, the above graph includes industry data to March 2014 quarter
MAIN HEADING GOES HERE IN UPPERCASE PLEASE
Put a footer here if you need to.
Premium payback liability (nib New Zealand)
34
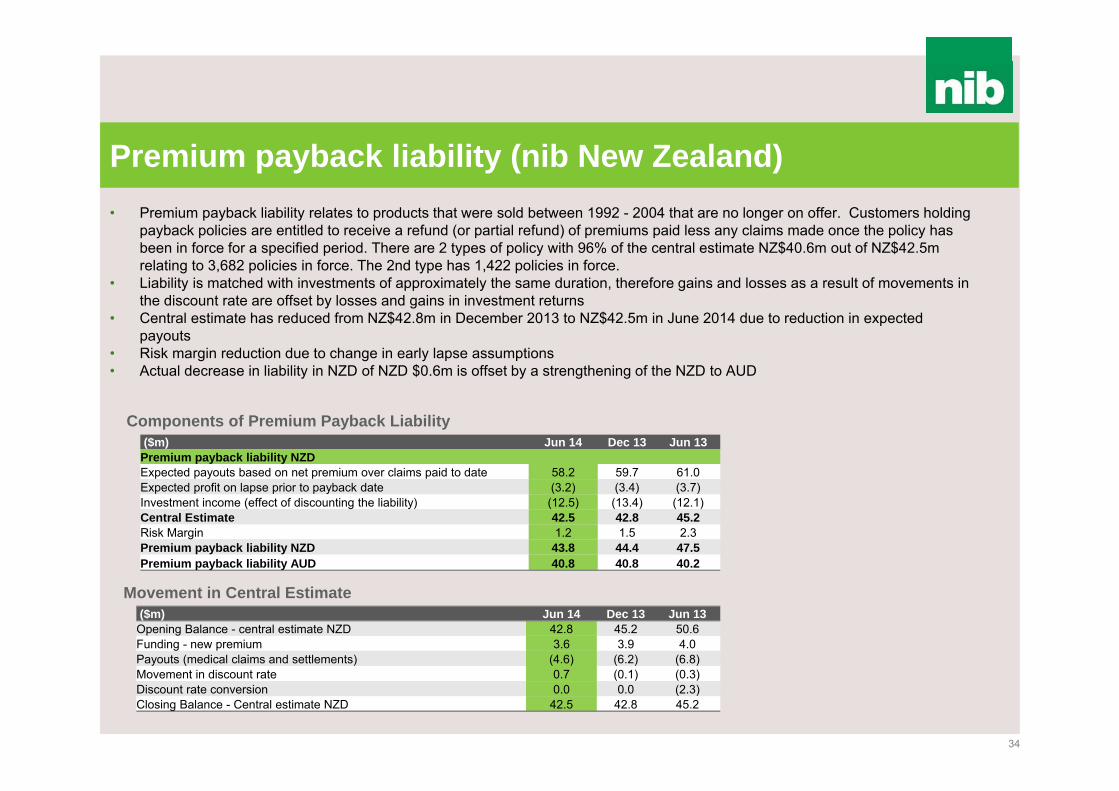
• Premium payback liability relates to products that were sold between 1992 - 2004 that are no longer on offer. Customers holding payback policies are entitled to receive a refund (or partial refund) of premiums paid less any claims made once the policy has been in force for a specified period. There are 2 types of policy with 96% of the central estimate NZ$40.6m out of NZ$42.5m relating to 3,682 policies in force. The 2nd type has 1,422 policies in force.
• Liability is matched with investments of approximately the same duration, therefore gains and losses as a result of movements in the discount rate are offset by losses and gains in investment returns
• Central estimate has reduced from NZ$42.8m in December 2013 to NZ$42.5m in June 2014 due to reduction in expected payouts
• Risk margin reduction due to change in early lapse assumptions• Actual decrease in liability in NZD of NZD $0.6m is offset by a strengthening of the NZD to AUD
($m) Jun 14 Dec 13 Jun 13Premium payback liability NZDExpected payouts based on net premium over claims paid to date 58.2 59.7 61.0Expected profit on lapse prior to payback date (3.2) (3.4) (3.7)Investment income (effect of discounting the liability) (12.5) (13.4) (12.1)Central Estimate 42.5 42.8 45.2Risk Margin 1.2 1.5 2.3Premium payback liability NZD 43.8 44.4 47.5Premium payback liability AUD 40.8 40.8 40.2
($m) Jun 14 Dec 13 Jun 13Opening Balance - central estimate NZD 42.8 45.2 50.6Funding - new premium 3.6 3.9 4.0Payouts (medical claims and settlements) (4.6) (6.2) (6.8)Movement in discount rate 0.7 (0.1) (0.3)Discount rate conversion 0.0 0.0 (2.3)Closing Balance - Central estimate NZD 42.5 42.8 45.2
Components of Premium Payback Liability
Movement in Central Estimate
MAIN HEADING GOES HERE IN UPPERCASE PLEASE
Put a footer here if you need to.
Investment asset allocation
35
Consolidated Australian Investment Portfolio New Zealand Investment Portfolio
Balance ($m)at 30/6/14
Allocation (%) at 30/6/14
Net return ($m)12 months to
30/6/14
Allocation (%)at 30/6/14
Net return ($m)12 months to
30/6/14
Allocation (%)at 30/6/14
Cash 178.2 30.6 4.6 31.7 0.7 25.9
Fixed interest 307.0 52.8 11.5 48.2 2.6 74.1
Total defensive 485.2 83.4 16.1 79.9 3.3 100.0Australian shares 18.1 3.1 3.5 3.8 - -
Global shares – hedged 11.5 2.0 2.2 2.4 - -
Global shares – unhedged 23.4 4.0 4.0 4.9 - -
Direct property 39.3 6.8 - 8.2 - -
Property trusts 0.7 0.1 0.0 0.1 - -
Unlisted security 3.5 0.6 0.6 0.7 - -
Total growth 96.5 16.6 10.3 20.1 - 0.0
TOTAL 581.7 100.0 26.4 100.0 3.3 100.0
MAIN HEADING GOES HERE IN UPPERCASE PLEASE
Put a footer here if you need to.
Balance sheet
36
($m) 30 June 14 30 June 13Change
($m) (%)
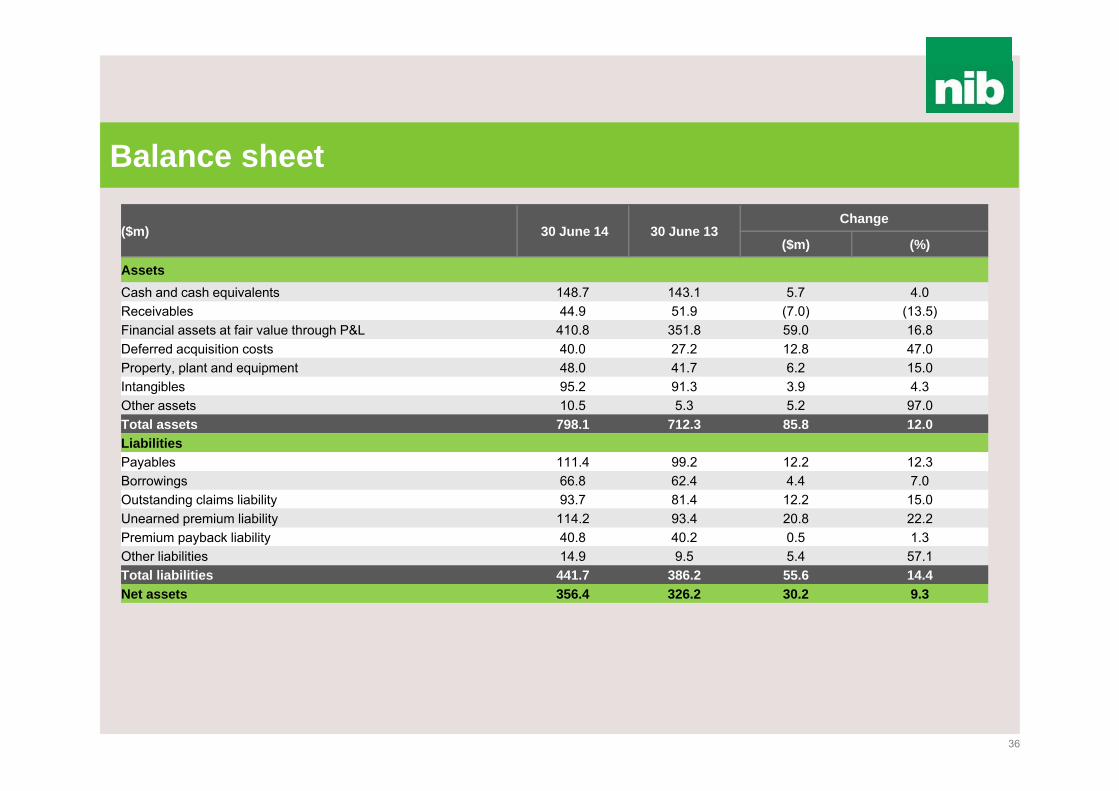
AssetsCash and cash equivalents 148.7 143.1 5.7 4.0Receivables 44.9 51.9 (7.0) (13.5)Financial assets at fair value through P&L 410.8 351.8 59.0 16.8Deferred acquisition costs 40.0 27.2 12.8 47.0Property, plant and equipment 48.0 41.7 6.2 15.0Intangibles 95.2 91.3 3.9 4.3Other assets 10.5 5.3 5.2 97.0Total assets 798.1 712.3 85.8 12.0LiabilitiesPayables 111.4 99.2 12.2 12.3Borrowings 66.8 62.4 4.4 7.0Outstanding claims liability 93.7 81.4 12.2 15.0Unearned premium liability 114.2 93.4 20.8 22.2Premium payback liability 40.8 40.2 0.5 1.3Other liabilities 14.9 9.5 5.4 57.1Total liabilities 441.7 386.2 55.6 14.4Net assets 356.4 326.2 30.2 9.3

MAIN HEADING GOES HERE IN UPPERCASE PLEASE
Put a footer here if you need to.
• As previously reported the introduction of the new PHIAC capital standards has resulted in a new internal capital target for nib health funds limited and has seen an increase in nib holdings limited group (the Group) available capital
• At 30 June 2014 before any release of capital the Group has $58.2m in available capital above internal targets (after allowing for the final dividend payment), with $39.5m to be distributed to shareholders by special dividend, with the balance being available for business investment opportunities (noting capacity to also use debt)
• Available capital determined taking into consideration the following elements:
Available capital
37
($m) FY14 FY13
Net assets 356.4 326.2nib health fund capital required (200.8) (249.8)nib New Zealand limited capital required (48.4) (36.6)nib New Zealand holdings limited group intangibles (42.6) (41.6)International workers intangibles (23.9) (24.2)nib Options intangibles (1.4) -Debt 65.1 59.1Other assets and liabilities 3.7 3.6Allowance for final dividend (25.2) (22.0)Allowance for special dividend (39.5) -
Available capital before debt covenant and forecast volatility 43.4 14.8
Reduction in available capital due to debt covenant (19.7) -Reduction for forecast volatility (5.0) -
Net available capital 18.7 14.8

MAIN HEADING GOES HERE IN UPPERCASE PLEASE
Put a footer here if you need to.
Regulatory capital requirements*
38
Australian fund total assets capital allocation (at 30 June 2014)
New Zealand fund capital allocation (at 30 June 2014)
• $18.7m of available capital across the Group above internal targets after allowing for final dividend, special dividend and holding company funding requirements with $7.3m of available capital held outside of Australian and New Zealand funds
$25.0m
$15.5m
$7.8m
$6.3m
Solvency standard deductions Capital to reach internal target
Minimum solvency capital Available capital
$326.3m
$175.3m
$1.3m$5.1m
Minimum capital requirement Capital to reach internal target
Unclosed business contributions - unearned Available capital
* Refer to Note 30 of Appendix 4E for period ending 30 June 2014 for further detail
MAIN HEADING GOES HERE IN UPPERCASE PLEASE
Put a footer here if you need to.
Disclaimer
39
The material in this presentation is a summary of the results of nib holdings limited (nib) for the 12 months ended 30 June 2014 and an update on nib’s activities and is current at the date of preparation, 25 August 2014. Further details are provided in nib’s full year accounts and results announcement released on 25 August 2014.
This presentation is not a financial product or investment advice or recommendation, offer or invitation by any person or to any person to sell or purchase securities in nib in any jurisdiction. This presentation contains general information only and does not take into account the investment objectives, financial situation and particular needs of individual investors. Investors should make their own independent assessment of the information in this presentation and obtain their own independent advice from a qualified financial adviser having regard to their objectives, financial situation and needs before taking any action.
The distribution of this presentation including in jurisdictions outside Australia, may be restricted by law. Any person who receives this presentation must seek advice on and observe any such restrictions. Nothing in this presentation constitutes an offer or invitation to issue or sell, or a recommendation to subscribe for or acquire securities in any jurisdiction where it is unlawful to do so
An investment in nib securities is subject to investment and other known and unknown risks, some of which are beyond the control of nib. nib does not guarantee any particular rate of return or the performance of nib securities.
No representation or warranty, express or implied, is made as to the fairness, accuracy, reliability, completeness or correctness of information contained in this presentation, including the accuracy, likelihood of achievement or reasonableness, fairness, accuracy, reliability, completeness or correctness of any forecasts, prospects, returns or statements in relation to future matters contained in the presentation (“forward-looking statements”). Whilst the forward-looking statements are based on current views, expectations and beliefs as at the date they are expressed, such forward-looking statements are by their nature subject to significant uncertainties and contingencies and are based on a number of estimates and assumptions that are subject to change (and in many cases are outside the control of nib and its Directors) which may cause the actual results or performance of nib to be materially different from any future results or performance expressed or implied by such forward-looking statements. Accordingly, there can be no assurance or guarantee that these forward-looking statements will be realised.
This presentation provides information in summary form only and is not intended to be complete. It is not intended to be relied upon as advice to investors or potential investors and does not take into account the investment objectives, financial situation or needs of any particular investor.
The financial information disclosed has been prepared on a statutory basis, which is consistent with the financial information provided in the Listing Prospectus. Due care and consideration should be undertaken when considering and analysing nib’s financial performance. All references to dollars are to Australian Dollars unless otherwise stated.
To the maximum extent permitted by law, neither nib nor its related corporations, Directors, officers employees or agents, nor any other person, accepts any liability (direct, indirect or consequential) including, without limitation, any liability arising from fault or negligence, for any loss whatsoever arising from the use of this presentation or its contents or otherwise arising in connection with it (whether foreseeable or not).
This presentation should be read in conjunction with other publicly available material. Further information including historical results and a description of the activities of nib is available on our website, www.nib.com.au/shareholders.


