19
COOK COUNTY PRELIMINARY FORECAST FY 2015 Toni Preckwinkle PRESIDENT Cook County Board of Commissioners
| Date post: | 22-Jul-2016 |
| Category: |
Documents |
| Upload: | zoe-galland |
| View: | 586 times |
| Download: | 1 times |

COOKCOUNTY
PRELIMINARYFORECAST
FY 2015
Toni PreckwinklePRESIDENT
Cook CountyBoard of Commissioners

Overview of Cook County 2015 Preliminary Forecast
Overview
The Department of Budget and Management Services (DBMS) prepared this preliminary forecast
report in accordance with Executive Order 2012-1. The report presents a mid-year projection of
year-end revenues and expenses for 2014, and an initial forecast of fiscal year 2015 revenues and
expenditures.
For FY2015, DBMS anticipates a budget shortfall of $168.9 million in the County’s General and
Health Enterprise Funds. Projected expenditures of $2,961.6 million will exceed projected revenues
of $2,792.69 million. The projected shortfall is driven by an increase in projected expenditures of
$75.2 million and a decrease in expected revenues of $43 million in the General Fund, while the
Health Fund anticipates an increase in expenditures that are $50 million greater than the increase in
revenues.
In the General Fund, projected cost increases driving this gap are an increase in expenditures for
projected wages including public safety overtime expenses ($48.1M), employee health benefit
increases ($20.1M), a reserve for insurance claims ($6.7M), and utilities such as gas, electricity and
water ($2.4M). Revenue declines are driven by lower Property Taxes available to the General Fund
due to rising debt service costs (-$22.2M), the reduction of Motor Fuel Tax revenues funding public
safety activities (-$10.0M) and slower than expected recovery on economically sensitive revenues
such as the Recorder of Deeds fees and Sales Tax.
The impact of CountyCare, the County’s managed care program that began as an early
implementation program of the Affordable Care Act, is a significant driver of changes in the
County’s fiscal outlook from 2014 to 2015. Through CountyCare, the health system is reimbursed
for providing healthcare that was previously uncompensated. The Health Fund anticipates a $384.1
million increase in expenditures along with a $334.0 million increase in revenues primarily due to the
full implementation of CountyCare. Beginning July 1, 2014, CountyCare will become a County
Managed Care Community Network (MCCN) and will expand to include all Medicaid populations,
including Family Health Plans (FHP) and Seniors and Persons with Disabilities (SPD).
The 2014 year-end projections of revenues and expenditures forecast a deficit of $85.9 million. The
primary driver of the deficit ($67.3M) is expenditures outpacing revenues within the Health Fund
due to required repayment of unspent 2013 per member per month (PMPM) reimbursement and
expected reduction in reimbursement rates for the County’s Medicaid Expansion program starting
July 1, 2014. It is estimated that the Cook County Health and Hospital System (CCHHS) will be
required to reimburse Medicaid for costs not incurred during the waiver period that total $33.5
million while the new PMPM reimbursement rate effective July 1, 2014 is expected to reduce year-
end revenue by $29 million.
1

General Fund expenditures are also anticipated to be higher than budgeted by $12.0 million, driven
by increases in public safety hiring and overtime. Revenues in the General Fund are expected to end
the year lower than budgeted by $6.6 million.
The table below summarizes projected 2014 and 2015 revenues and expenditures in the Health and General Funds:
2014 Budget
2014 Year-End Forecast
2015 Forecast
Health Revenues 950,717,064 1,194,321,842 1,284,756,980
Health Expenditures (1,125,717,196) (1,436,591,414) (1,509,820,606)
General Fund Revenues 1,551,531,625 1,544,893,765 1,507,926,735
General Fund Expenditures (1,376,531,493) (1,388,578,526) (1,451,778,556)
Deficit $ - $ (85,954,333) $ (168,915,447)
Public Forum
A public hearing and online forum will be held on the preliminary budget on July 16, 2014 at 6:00
p.m. in the Cook County Board Room to obtain constituent feedback on budget priorities. The
Department of Budget and Management Services will work closely with residents, elected officials,
and County departments to review potential efficiencies and cost savings opportunities that will
allow for the presentation of a balanced budget recommendation to the Board of Commissioners in
October. More information about the Preliminary Forecast can be found at
http://home.cookcountyil.gov/budget/
2
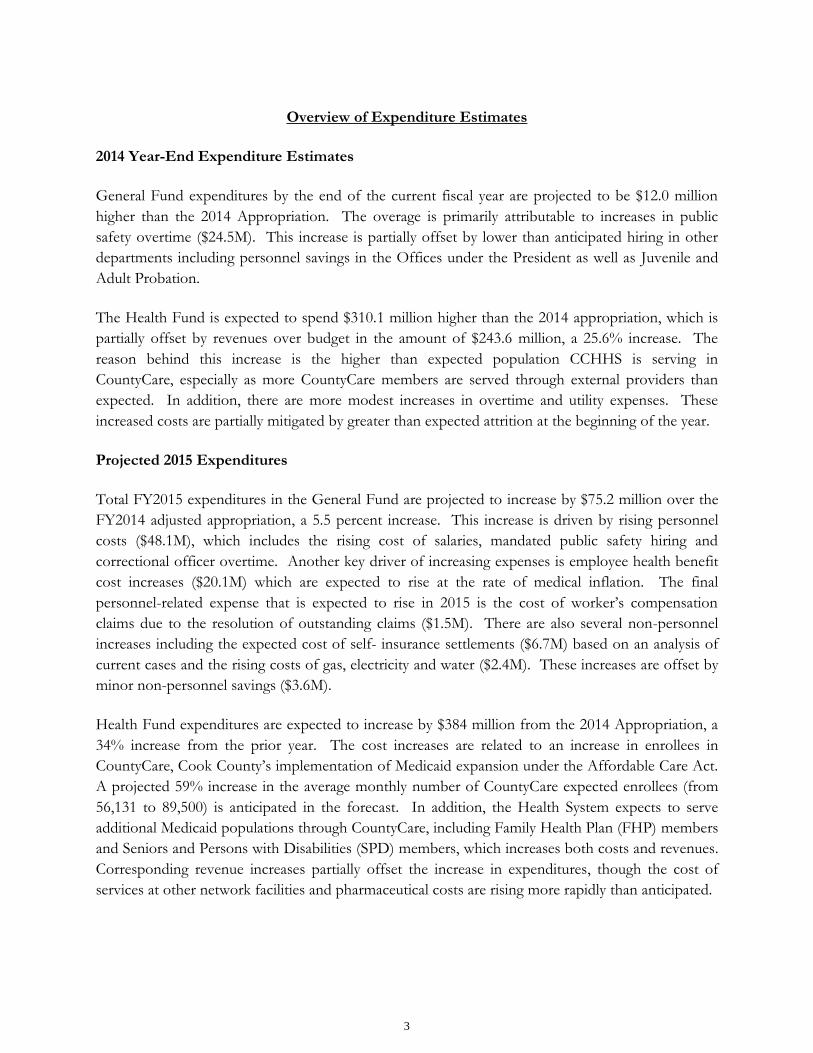
Overview of Expenditure Estimates
2014 Year-End Expenditure Estimates
General Fund expenditures by the end of the current fiscal year are projected to be $12.0 million
higher than the 2014 Appropriation. The overage is primarily attributable to increases in public
safety overtime ($24.5M). This increase is partially offset by lower than anticipated hiring in other
departments including personnel savings in the Offices under the President as well as Juvenile and
Adult Probation.
The Health Fund is expected to spend $310.1 million higher than the 2014 appropriation, which is
partially offset by revenues over budget in the amount of $243.6 million, a 25.6% increase. The
reason behind this increase is the higher than expected population CCHHS is serving in
CountyCare, especially as more CountyCare members are served through external providers than
expected. In addition, there are more modest increases in overtime and utility expenses. These
increased costs are partially mitigated by greater than expected attrition at the beginning of the year.
Projected 2015 Expenditures
Total FY2015 expenditures in the General Fund are projected to increase by $75.2 million over the
FY2014 adjusted appropriation, a 5.5 percent increase. This increase is driven by rising personnel
costs ($48.1M), which includes the rising cost of salaries, mandated public safety hiring and
correctional officer overtime. Another key driver of increasing expenses is employee health benefit
cost increases ($20.1M) which are expected to rise at the rate of medical inflation. The final
personnel-related expense that is expected to rise in 2015 is the cost of worker’s compensation
claims due to the resolution of outstanding claims ($1.5M). There are also several non-personnel
increases including the expected cost of self- insurance settlements ($6.7M) based on an analysis of
current cases and the rising costs of gas, electricity and water ($2.4M). These increases are offset by
minor non-personnel savings ($3.6M).
Health Fund expenditures are expected to increase by $384 million from the 2014 Appropriation, a
34% increase from the prior year. The cost increases are related to an increase in enrollees in
CountyCare, Cook County’s implementation of Medicaid expansion under the Affordable Care Act.
A projected 59% increase in the average monthly number of CountyCare expected enrollees (from
56,131 to 89,500) is anticipated in the forecast. In addition, the Health System expects to serve
additional Medicaid populations through CountyCare, including Family Health Plan (FHP) members
and Seniors and Persons with Disabilities (SPD) members, which increases both costs and revenues.
Corresponding revenue increases partially offset the increase in expenditures, though the cost of
services at other network facilities and pharmaceutical costs are rising more rapidly than anticipated.
3

Overview of Estimated Revenues
Overview
General Fund and Health Enterprise Fund revenues support the County’s general operating fund
and finance the Corporate, Public Safety and Health Enterprise funds and activities. The
preliminary revenue estimate for FY2015 is $2,793 million for the General and Health Enterprise
Funds. This represents an 11.6 percent, or $290.4 million increase from the FY2014 budget. The
total projected revenue for FY2014 year-end is $2,739 million, which represents a 9.5 percent, or
$237 million increase from budgeted revenues.
The County’s General Fund and Health Enterprise Fund revenues are comprised of Property Tax,
Fees, Home Rule Taxes, Intergovernmental Revenues, and miscellaneous Other Revenue sources
such as rental income from leasing space and energy efficiency rebates.
Property Tax
The projected year-end Property Tax collection to the General and Health Enterprise Funds for
FY2014 remains at the budgeted amount of $350.1 million. The preliminary estimate for Property
Tax revenues in FY2015 is $327.9 million, reduced from the prior fiscal year budget by $22.2 million
primarily due to rising debt service obligations.
Fees
The County General Fund receives various fees for certain services that departments within the
Fund perform. The fees charged by various County departments include fees for real estate
transactions, court case filings, permits, and licenses. General Fund fees are anticipated to be $263.5
million for year-end FY2014. This represents a 3.9 percent, or $10.6 million decrease in
comparison to the FY2014 budget. The reduction is due to a decrease in court case filings and real
estate transactions. The preliminary estimate for General Fund fees in FY2015 remains relatively
steady at $260.9 million, a 1.0 percent decrease in comparison to projected year-end FY2014.
The Health Enterprise Fund receives fees from patient fees and supplemental payments for care
provided at County Hospitals. In addition, the Cook County Health and Hospital System (CCHHS)
operates CountyCare, which will become a Managed Care Community Network (MCCN) on July 1,
2014. CountyCare receives a fixed per member per month reimbursement for each of its members.
CCHHS is projected to end FY2014 with fees totaling $1.19 billion, a 25.6 percent, or $243.6 million
increase to the FY2014 budget. These increased fees are, however, offset with higher than
anticipated expenditures for patient care expenses at CCHHS as well as external network providers
and pharmaceutical costs. The increased 2014 revenues are mainly attributed to the increased
number of enrollees into CountyCare. CCHHS had expected full-year membership of 56,131
patients in CountyCare, but over 90,000 members are enrolled as the 1115 Waiver period concludes
at the end of June, 2014. CCHHS preliminary estimate for fees in FY2015 increases 7.6%, or $90.4
million to $1.28 billion compared to year-end FY2014, with some attrition anticipated in the second
half of the year. The continued rise is due to an increase in disproportionate share hospital (DSH)
4

supplemental payments and a projected retention of CountyCare enrollees as additional MCCN
choices for CountyCare patients become available during the second half of 2014 and into FY2015.
Home Rule Taxes
Several of the Home Rule Taxes are on track to meet or exceed the FY2014 budgeted amounts.
The projected year-end revenues of $775.3 million exceed budgeted revenues by $11.1 million, or
1.5 percent. The County Use Tax projected year-end revenue for FY2014 is $69.9 million,
representing a 2.4 percent, or $1.6 million increase from the budget due to improved vehicle sales.
The Gas Tax is projected to reap the benefits of enhanced compliance activities. The Gas Tax is
projected to earn $12.4 million, 14.2 percent more than the budgeted amount. A revenue source
that has underperformed is the Sales Tax as the regional economy continues its slow recovery from
the recession and experienced particularly slow activity during an unusually cold winter. Sales Tax
revenues in FY2014 are projected to be $3.2 million, or 1.0 percent lower than FY2014 budget.
The preliminary estimate for revenues for Home Rule Taxes for FY2015 is $770.7 million, which is
$6.4 million more than prior year budgeted revenues of $764.3 million. The estimated increase in
Home Rule Tax revenues are primarily linked to modestly improved Sales Tax collections as a result
of economic forecasts suggesting a moderate improvement in conditions during FY2015.
Intergovernmental Revenues
The projected year-end Intergovernmental Revenues for FY2014 is $136.8 million, this represents a
$2.1 million, or 1.5% decrease from the budgeted amount. The lower than expected revenues are
due in-part to Off-Track Betting commissions as an increase in gambling alternatives are estimated
to contribute to a decline in expected revenues by $1.0 million. The preliminary estimate for
Intergovernmental Revenues for FY2015 is $129.1 million, which is $9.7 million less than the prior
year budget. This decline is driven predominantly by the planned decrease in Motor Fuel Tax
funding in the amount of $10 million.
Other Revenues
The County is projecting to receive miscellaneous Other Revenues totaling $19.2 million in FY2014;
this represents a $5.1 million decrease from the FY2014 budgeted. The decrease is driven by lower
than expected parking fees. The preliminary estimate for Other Revenues for FY2015 is $19.4
million, which is a minimal increase of $0.2 million compared to FY2014 year-end revenues due
primarily to additional rental income at the George W. Dunne Building.
5

2015
Pre
lim
inary
Reve
nu
e P
roje
cti
on
s
FY
2015
Bu
dg
ete
d F
Y 2
014
Reve
nu
e
Actu
al
Dec -
May*
Est
imate
d
Jun
- N
ov
E s t
Est
imate
d
2014
YE
Pre
lim
inary
Est
imate
Pro
pert
y T
ax
350,0
56,1
1517
5,0
28,0
58
175,0
28,0
57
350,0
56,1
15327,8
72,4
16
Fees
Tre
asure
r70,0
00,0
00
27,7
34,0
00
46,0
37,0
00
73,7
71,0
00
70,0
00,0
00
Co
un
ty C
lerk
10,2
25,0
00
4,7
23,6
86
5,5
01,3
14
10,2
25,0
00
10,3
50,0
00
Rec
ord
er o
f D
eed
s41,5
00,0
00
16,0
36,8
40
17,7
03,7
88
33,7
40,6
28
34,5
31,3
82
Rec
ord
er A
ud
it R
even
ues
1,0
00,0
00
01,0
00,0
00
1,0
00,0
00
1,0
00,0
00
Build
ing
and
Zo
nin
g3,2
00,0
00
1,9
69,0
00
1,4
41,0
00
3,4
10,0
00
3,5
00,0
00
En
vir
on
men
tal C
on
tro
l4,3
61,7
50
1,2
53,3
67
3,1
08,3
83
4,3
61,7
50
4,2
94,7
50
Liq
uo
r L
icen
ses
324,0
00
352,5
00
6,0
00
358,5
00
330,0
00
Cab
le T
elev
isio
n
1,0
00,0
00
629,3
91
630,0
00
1,2
59,3
91
1,2
00,0
00
Cle
rk o
f th
e C
ircu
it C
ourt
96,7
50,0
00
41,0
33,3
64
51,8
25,8
59
92,8
59,2
23
93,5
00,0
00
Sh
erif
f M
un
icip
al D
ivis
ion
24,8
56,1
30
12,4
62,3
00
12,1
50,0
00
24,6
12,3
00
24,2
28,0
00
Pub
lic
Guar
dia
n
2,4
00,0
00
1,2
66,0
00
1,2
25,3
67
2,4
91,3
67
2,4
00,0
00
Sta
tes
Att
orn
ey2,0
00,0
00
985,0
00
995,0
00
1,9
80,0
00
2,0
00,0
00
Co
ntr
act
Co
mp
lian
ce40,0
00
17,8
50
14,0
00
31,8
50
40,0
00
Ad
op
tio
n (
Sup
po
rtiv
e Ser
vic
es)
15,0
00
8,1
25
7,5
00
15,6
25
17,5
00
Pub
lic
Ad
min
istr
ato
r900,0
00
243,1
90
656,8
10
900,0
00
900,0
00
Sh
erif
f C
ourt
Ser
vic
e10,4
24,2
00
5,0
09,5
50
5,4
00,0
00
10,4
09,5
50
10,2
83,0
00
Co
un
ty A
sses
sor
150,0
00
17,0
00
391,0
85
408,0
85
432,0
00
Ass
esso
r T
ax F
raud
1,5
00,0
00
0144,0
00
144,0
00
385,0
00
Hig
hw
ay S
ale
of
Per
mit
s560,0
00
322,3
40
237,6
60
560,0
00
550,0
00
Tax
In
terc
ept
2,0
00,0
00
00
00
Med
ical
Exa
min
er910,0
00
518,5
00
475,0
00
993,5
00
950,0
00
To
tal
Gen
era
l F
un
d F
ees
274,1
16,0
80
114,5
82,0
03
148,9
49,7
66
263,5
31,
769
260,8
91,
632
FY
2014
*M
ay R
even
ues
are
est
imat
ed
6

2015
Pre
lim
inary
Reve
nu
e P
roje
cti
on
s
FY
2015
Bu
dg
ete
d F
Y 2
014
Reve
nu
e
Actu
al
Dec -
May*
Est
imate
d
Jun
- N
ov
E s t
Est
imate
d
2014
YE
Pre
lim
inary
Est
imate
FY
2014
CC
HH
S
Pat
ien
t F
ee (
Med
icar
e, M
edic
aid , P
rivat
e)200,6
99,6
86
134,3
44,8
41
132,3
71,7
11
266,7
16,5
52
156,5
84,1
97
Pat
ien
t F
ee -
Med
icai
d P
lan
BIP
A I
GT
131,2
50,0
00
63,7
50,0
00
37,5
00,0
00
101,2
50,0
00
131,2
50,0
00
Fed
Sta
te M
ed. P
rogr
am F
un
din
g (D
SH
)145,5
00,0
00
81,1
69,1
16
81,1
69,1
16
162,3
38,2
32
162,3
38,2
32
Med
icai
d E
xpan
sio
n468,1
54,2
94
285,6
18,9
12
369,2
52,3
35
654,8
71,2
47
830,3
15,5
51
Mis
cellan
eous
Fee
s -
CC
HH
S1,9
31,2
84
2,6
69,7
04
1,8
15,6
16
4,4
85,3
20
3,3
24,0
00
Pub
lic
Hea
lth
3,1
81,8
00
3,0
07,4
31
1,6
53,0
60
4,6
60,4
91
945,0
00
To
tal
CC
HH
S F
ees
950,7
17,0
64
570,5
60,0
04
623,7
61,
838
1,19
4,3
21,
842
1,284,7
56,9
80
To
tal
Fee R
eve
nu
e1,
224,8
33,1
44
685,1
42,0
07
772,7
11,6
04
1,457,8
53,6
111,
545,6
48,6
12
Ho
me R
ule
Tax
es
Gro
ss C
oun
ty S
ales
Tax
337,4
00,0
00
161,1
77,2
64
173,0
00,0
00
334,1
77,2
64
342,2
00,0
00
Gas
/ D
iese
l F
uel
Tax
87,0
50,0
00
44,6
31,5
17
54,7
78,1
73
99,4
09,6
90
88,0
00,0
00
Cig
aret
te T
ax134,5
00,0
00
62,6
78,4
71
71,9
55,2
00
134,6
33,6
71
130,0
00,0
00
Oth
er T
ob
acco
Pro
duct
s7,6
80,0
00
3,3
44,1
76
4,2
30,0
00
7,5
74,1
76
8,0
00,0
00
Ret
ail Sal
e o
f M
oto
r V
ehic
les
3,0
95,0
00
1,3
26,8
76
1,6
83,3
70
3,0
10,2
46
3,2
00,0
00
Wh
eel T
ax4,1
00,0
00
182,3
77
3,7
93,7
22
3,9
76,0
99
4,1
00,0
00
Alc
oh
olic
Bev
erag
e T
ax36,5
00,0
00
16,8
34,9
48
19,9
76,6
88
36,8
11,6
36
37,2
50,0
00
Co
un
ty U
se T
ax68,3
00,0
00
32,9
49,8
27
36,9
64,5
05
69,9
14,3
32
71,0
00,0
00
No
n R
etai
ler
Tra
nsa
ctio
ns
11,4
60,0
00
4,0
85,7
92
7,2
50,0
00
11,3
35,7
92
11,0
00,0
00
Par
kin
g L
ot
and
Gar
age
Op
erat
ion
s T
ax42,6
00,0
00
20,5
96,7
88
22,1
10,7
34
42,7
07,5
22
44,0
00,0
00
Am
use
men
t T
ax29,4
75,0
00
14,6
80,9
91
14,8
28,4
39
29,5
09,4
30
29,7
50,0
00
Gam
blin
g M
ach
ine
Tax
1,3
50,0
00
57,9
00
1,3
38,0
00
1,3
95,9
00
1,4
00,0
00
Fir
earm
s T
ax750,0
00
508,4
00
379,0
00
887,4
00
800,0
00
To
tal
Ho
me R
ule
Taxes
764,2
60,0
00
363,0
55,3
27
412
,287,8
31
775,3
43,1
58
770,7
00,0
00
*M
ay R
even
ues
are
est
imat
ed
7

2015
Pre
lim
inary
Reve
nu
e P
roje
cti
on
s
FY
2015
Bu
dg
ete
d F
Y 2
014
Reve
nu
e
Actu
al
Dec -
May*
Est
imate
d
Jun
- N
ov
E s t
Est
imate
d
2014
YE
Pre
lim
inary
Est
imate
FY
2014
Inte
rgo
vern
men
tal
Reve
nu
es
Mo
tor
Fuel
Tax
Gra
nt
44,5
00,0
00
22,2
49,9
99
22,2
50,0
01
44,5
00,0
00
44,5
00,0
00
MF
T C
ircu
it C
ourt
Fun
din
g30,0
00,0
00
030,0
00,0
00
30,0
00,0
00
20,0
00,0
00
Ret
aile
r's
Occ
up
atio
ns
Tax
3,2
90,0
00
1,3
66,3
85
1,6
86,0
00
3,0
52,3
85
3,1
10,0
00
Sta
te I
nco
me
Tax
12,3
51,0
00
6,6
39,5
32
5,6
70,8
87
12,3
10,4
19
12,6
50,0
00
Off
Tra
ck B
etti
ng
Co
mm
issi
on
2,4
22,5
00
645,3
88
745,0
00
1,3
90,3
88
1,2
50,0
00
Gam
ing
8,3
00,0
00
4,1
34,4
16
4,2
50,0
00
8,3
84,4
16
8,5
00,0
00
Sta
te C
rim
inal
Alien
Ass
ist.
(SC
AA
P)
1,5
00,0
00
01,5
65,1
52
1,5
65,1
52
1,3
28,8
45
Sta
te -
Pro
bat
ion
Off
icer
s, J
uven
ile
CT
& C
hildre
n
Ho
me
18,1
18,5
47
9,0
42,0
00
9,0
76,5
47
18,1
18,5
47
22,0
00,0
00
Rei
mb
. F
or
Ind
irec
t C
ost
Sp
ecia
l R
even
ues
& G
ran
ts15,3
63,4
22
4,7
39,0
45
9,7
23,9
81
14,4
63,0
26
14,7
57,1
95
Tax
In
crem
enta
l F
inan
cin
g F
un
ds
(TIF
)3,0
00,0
00
03,0
00,0
00
3,0
00,0
00
1,0
00,0
00
To
tal
Inte
rgo
vern
men
tal
Reve
nu
es
138,8
45,4
69
48,8
16,7
65
87,9
67,5
68
136,7
84,3
33
129,0
96,0
40
Oth
er
Reve
nu
es
Lea
ses,
Ren
tals
, Sal
es8,9
65,5
52
2,7
70,0
36
5,3
03,9
06
8,0
73,9
42
8,4
99,7
65
Oth
er R
eim
burs
emen
ts/T
ran
sfer
s11,5
26,7
38
4,0
11,3
34
6,1
48,5
51
10,1
59,8
85
9,9
22,3
19
Par
kin
g F
ees
- JT
DC
, C
ourt
s &
etc
.3,7
61,6
71
472,2
82
472,2
81
944,5
63
944,5
63
To
tal
Oth
er
Reve
nu
e24,2
53,9
61
7,2
53,6
52
11,9
24,7
38
19,1
78,3
90
19,3
66,6
47
Gra
nd
To
tal
2,5
02,2
48,6
89
1,279,2
95,8
09
1,459,9
19,7
99
2,7
39,2
15,6
08
2,7
92,6
83,7
15
*M
ay R
even
ues
are
est
imat
ed
8
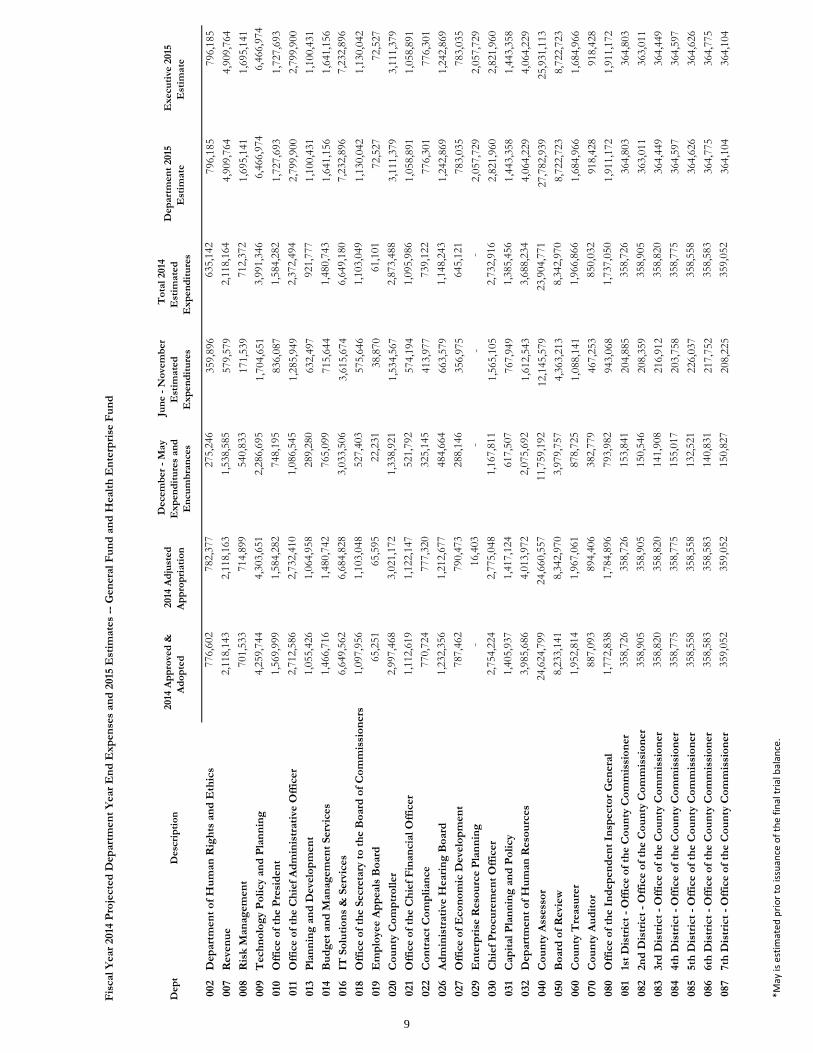
Fis
cal
Year
2014
Pro
jecte
d D
ep
art
men
t Y
ear
En
d E
xp
en
ses
an
d 2
015
Est
imate
s --
Gen
era
l F
un
d a
nd
Healt
h E
nte
rpri
se F
un
d
Dep
tD
esc
rip
tio
n
2014
Ap
pro
ved
&
Ad
op
ted
2014
Ad
just
ed
Ap
pro
pri
ati
on
Decem
ber
- M
ay
Exp
en
dit
ure
s an
d
En
cu
mb
ran
ces
Ju
ne -
No
vem
ber
Est
imate
d
Exp
en
dit
ure
s
T
ota
l 2014
Est
imate
d
Ex
pen
dit
ure
s
Dep
art
men
t 2015
Est
imate
Ex
ecu
tive
2015
Est
imate
002
Dep
art
men
t o
f H
um
an
Rig
hts
an
d E
thic
s776,6
02
782,3
77
275,2
46
359,8
96
635,1
42
796,1
85
796,1
85
007
Reve
nu
e2,1
18,1
43
2,1
18,1
63
1,5
38,5
85
579,5
79
2,1
18,1
64
4,9
09,7
64
4,9
09,7
64
008
Ris
k M
an
ag
em
en
t701,5
33
714,8
99
540,8
33
171,5
39
712,3
72
1,6
95,1
41
1,6
95,1
41
009
Tech
no
log
y P
oli
cy a
nd
Pla
nn
ing
4,2
59,7
44
4,3
03,6
51
2,2
86,6
95
1,7
04,6
51
3,9
91,3
46
6,4
66,9
74
6,4
66,9
74
010
Off
ice o
f th
e P
resi
den
t1,5
69,9
99
1,5
84,2
82
748,1
95
836,0
87
1,5
84,2
82
1,7
27,6
93
1,7
27,6
93
011
Off
ice o
f th
e C
hie
f A
dm
inis
trati
ve O
ffic
er
2,7
12,5
86
2,7
32,4
10
1,0
86,5
45
1,2
85,9
49
2,3
72,4
94
2,7
99,9
00
2,7
99,9
00
013
Pla
nn
ing
an
d D
eve
lop
men
t1,0
55,4
26
1,0
64,9
58
289,2
80
632,4
97
921,7
77
1,1
00,4
31
1,1
00,4
31
014
Bu
dg
et
an
d M
an
ag
em
en
t S
erv
ices
1,4
66,7
16
1,4
80,7
42
765,0
99
715,6
44
1,4
80,7
43
1,6
41,1
56
1,6
41,1
56
016
IT S
olu
tio
ns
& S
erv
ices
6,6
49,5
62
6,6
84,8
28
3,0
33,5
06
3,6
15,6
74
6,6
49,1
80
7,2
32,8
96
7,2
32,8
96
018
Off
ice o
f th
e S
ecre
tary
to
th
e B
oard
of
Co
mm
issi
on
ers
1,0
97,9
56
1,1
03,0
48
527,4
03
575,6
46
1,1
03,0
49
1,1
30,0
42
1,1
30,0
42
019
Em
plo
yee A
pp
eals
Bo
ard
65,2
51
65,5
95
22,2
31
38,8
70
61,1
01
72,5
27
72,5
27
020
Co
un
ty C
om
ptr
oll
er
2,9
97,4
68
3,0
21,1
72
1,3
38,9
21
1,5
34,5
67
2,8
73,4
88
3,1
11,3
79
3,1
11,3
79
021
Off
ice o
f th
e C
hie
f F
inan
cia
l O
ffic
er
1,1
12,6
19
1,1
22,1
47
521,7
92
574,1
94
1,0
95,9
86
1,0
58,8
91
1,0
58,8
91
022
Co
ntr
act
Co
mp
lian
ce
770,7
24
777,3
20
325,1
45
413,9
77
739,1
22
776,3
01
776,3
01
026
Ad
min
istr
ati
ve H
eari
ng
Bo
ard
1,2
32,3
56
1,2
12,6
77
484,6
64
663,5
79
1,1
48,2
43
1,2
42,8
69
1,2
42,8
69
027
Off
ice o
f E
co
no
mic
Deve
lop
men
t787,4
62
790,4
73
288,1
46
356,9
75
645,1
21
783,0
35
783,0
35
029
En
terp
rise
Reso
urc
e P
lan
nin
g-
16,4
03
-
-
-
2,0
57,7
29
2,0
57,7
29
030
Ch
ief
Pro
cu
rem
en
t O
ffic
er
2,7
54,2
24
2,7
75,0
48
1,1
67,8
11
1,5
65,1
05
2,7
32,9
16
2,8
21,9
60
2,8
21,9
60
031
Cap
ital
Pla
nn
ing
an
d P
oli
cy
1,4
05,9
37
1,4
17,1
24
617,5
07
767,9
49
1,3
85,4
56
1,4
43,3
58
1,4
43,3
58
032
Dep
art
men
t o
f H
um
an
Reso
urc
es
3,9
85,6
86
4,0
13,9
72
2,0
75,6
92
1,6
12,5
43
3,6
88,2
34
4,0
64,2
29
4,0
64,2
29
040
Co
un
ty A
ssess
or
24,6
24,7
99
24,6
60,5
57
11,7
59,1
92
12,1
45,5
79
23,9
04,7
71
27,7
82,9
39
25,9
31,1
13
050
Bo
ard
of
Revi
ew
8,2
33,1
41
8,3
42,9
70
3,9
79,7
57
4,3
63,2
13
8,3
42,9
70
8,7
22,7
23
8,7
22,7
23
060
Co
un
ty T
reasu
rer
1,9
52,8
14
1,9
67,0
61
878,7
25
1,0
88,1
41
1,9
66,8
66
1,6
84,9
66
1,6
84,9
66
070
Co
un
ty A
ud
ito
r887,0
93
894,4
06
382,7
79
467,2
53
850,0
32
918,4
28
918,4
28
080
Off
ice o
f th
e I
nd
ep
en
den
t In
specto
r G
en
era
l1,7
72,8
38
1,7
84,8
96
793,9
82
943,0
68
1,7
37,0
50
1,9
11,1
72
1,9
11,1
72
081
1st
Dis
tric
t -
Off
ice o
f th
e C
ou
nty
Co
mm
issi
on
er
358,7
26
358,7
26
153,8
41
204,8
85
358,7
26
364,8
03
364,8
03
082
2n
d D
istr
ict
- O
ffic
e o
f th
e C
ou
nty
Co
mm
issi
on
er
358,9
05
358,9
05
150,5
46
208,3
59
358,9
05
363,0
11
363,0
11
083
3rd
Dis
tric
t -
Off
ice o
f th
e C
ou
nty
Co
mm
issi
on
er
358,8
20
358,8
20
141,9
08
216,9
12
358,8
20
364,4
49
364,4
49
084
4th
Dis
tric
t -
Off
ice o
f th
e C
ou
nty
Co
mm
issi
on
er
358,7
75
358,7
75
155,0
17
203,7
58
358,7
75
364,5
97
364,5
97
085
5th
Dis
tric
t -
Off
ice o
f th
e C
ou
nty
Co
mm
issi
on
er
358,5
58
358,5
58
132,5
21
226,0
37
358,5
58
364,6
26
364,6
26
086
6th
Dis
tric
t -
Off
ice o
f th
e C
ou
nty
Co
mm
issi
on
er
358,5
83
358,5
83
140,8
31
217,7
52
358,5
83
364,7
75
364,7
75
087
7th
Dis
tric
t -
Off
ice o
f th
e C
ou
nty
Co
mm
issi
on
er
359,0
52
359,0
52
150,8
27
208,2
25
359,0
52
364,1
04
364,1
04
*May
is e
stim
ated
pri
or
to is
suan
ce o
f th
e f
inal
tri
al b
alan
ce.
9

Fis
cal
Year
2014
Pro
jecte
d D
ep
art
men
t Y
ear
En
d E
xp
en
ses
an
d 2
015
Est
imate
s --
Gen
era
l F
un
d a
nd
Healt
h E
nte
rpri
se F
un
d
Dep
tD
esc
rip
tio
n
2014
Ap
pro
ved
&
Ad
op
ted
2014
Ad
just
ed
Ap
pro
pri
ati
on
Decem
ber
- M
ay
Exp
en
dit
ure
s an
d
En
cu
mb
ran
ces
Ju
ne -
No
vem
ber
Est
imate
d
Exp
en
dit
ure
s
T
ota
l 2014
Est
imate
d
Ex
pen
dit
ure
s
Dep
art
men
t 2015
Est
imate
Ex
ecu
tive
2015
Est
imate
088
8th
Dis
tric
t -
Off
ice o
f th
e C
ou
nty
Co
mm
issi
on
er
358,8
47
358,8
47
151,0
66
207,7
81
358,8
47
364,3
50
364,3
50
089
9th
Dis
tric
t -
Off
ice o
f th
e C
ou
nty
Co
mm
issi
on
er
358,6
83
358,6
83
166,3
57
192,3
26
358,6
83
365,0
46
365,0
46
090
10th
Dis
tric
t -
Off
ice o
f th
e C
ou
nty
Co
mm
issi
on
er
358,9
03
358,9
03
130,7
82
214,4
07
345,1
89
364,6
98
364,6
98
091
11th
Dis
tric
t -
Off
ice o
f th
e C
ou
nty
Co
mm
issi
on
er
499,5
97
499,5
97
122,5
63
141,5
50
264,1
13
506,6
23
506,6
23
092
12th
Dis
tric
t -
Off
ice o
f th
e C
ou
nty
Co
mm
issi
on
er
358,7
57
358,7
57
167,2
13
188,8
45
356,0
58
364,6
86
364,6
86
093
13th
Dis
tric
t -
Off
ice o
f th
e C
ou
nty
Co
mm
issi
on
er
358,6
92
358,6
92
159,0
68
199,6
24
358,6
92
364,4
95
364,4
95
094
14th
Dis
tric
t -
Off
ice o
f th
e C
ou
nty
Co
mm
issi
on
er
358,7
32
358,7
32
163,3
77
195,3
55
358,7
32
364,8
81
364,8
81
095
15th
Dis
tric
t -
Off
ice o
f th
e C
ou
nty
Co
mm
issi
on
er
358,8
24
358,8
24
158,2
30
200,5
94
358,8
24
364,9
44
364,9
44
096
16th
Dis
tric
t -
Off
ice o
f th
e C
ou
nty
Co
mm
issi
on
er
358,8
35
358,8
35
153,4
06
205,4
29
358,8
35
364,3
94
364,3
94
097
17th
Dis
tric
t -
Off
ice o
f th
e C
ou
nty
Co
mm
issi
on
er
358,8
46
358,8
46
165,5
54
193,2
92
358,8
46
364,4
66
364,4
66
110
Co
un
ty C
lerk
7,6
28,3
20
7,6
79,7
64
3,4
18,2
47
3,9
64,7
07
7,3
82,9
54
7,7
97,2
23
7,7
97,2
23
130
Reco
rder
of
Deed
s5,6
86,1
20
5,7
22,3
75
2,6
29,5
19
2,4
96,8
14
5,1
26,3
33
5,7
89,1
70
5,7
89,1
70
160
Bu
ild
ing
an
d Z
on
ing
3,1
84,2
27
3,2
09,3
23
1,4
44,6
45
1,7
16,2
74
3,1
60,9
19
3,2
67,9
20
3,2
67,9
20
161
Dep
art
men
t o
f E
nvi
ron
men
tal
Co
ntr
ol
1,6
37,7
25
1,6
45,3
63
789,3
19
810,4
76
1,5
99,7
95
1,6
45,4
12
1,6
45,4
12
170
Zo
nin
g B
oard
of
Ap
peals
423,8
17
426,7
96
175,9
60
198,5
77
374,5
37
426,8
87
426,8
87
200
Dep
art
men
t o
f F
acil
itie
s M
an
ag
em
en
t35,1
98,1
74
35,5
64,3
53
17,4
07,7
74
18,2
50,8
68
35,6
58,6
42
46,0
64,8
39
46,0
64,8
39
205
Just
ice A
dvi
sory
Co
un
sel
422,9
48
462,3
03
194,6
88
243,7
98
438,4
86
562,5
07
562,5
07
210
Off
ice o
f th
e S
heri
ff4,8
21,1
03
4,8
29,0
18
2,5
08,6
29
2,4
20,6
03
4,9
29,2
32
5,2
97,3
19
5,1
00,9
71
214
Sh
eri
ff's
Ad
min
istr
ati
on
an
d H
um
an
Reso
urc
es
13,9
70,0
50
14,1
09,0
73
6,7
10,3
49
7,2
57,8
20
13,9
68,1
69
15,2
25,0
56
14,7
77,5
00
217
Sh
eri
ff's
In
form
ati
on
Tech
no
log
y4,3
11,5
41
4,3
15,5
13
1,7
80,6
91
1,7
16,3
06
3,4
96,9
97
6,6
76,5
84
5,2
47,0
20
230
Co
urt
Serv
ices
Div
isio
n85,7
45,3
11
86,5
09,8
78
39,3
50,3
95
45,9
09,5
99
85,2
59,9
94
92,4
74,1
80
88,7
66,6
19
231
Po
lice D
ep
art
men
t48,0
29,1
91
48,4
43,6
46
24,4
36,3
68
25,6
75,6
44
50,1
12,0
12
52,1
30,0
79
52,0
23,5
91
239
Dep
art
men
t o
f C
orr
ecti
on
s303,7
83,2
83
305,6
25,4
61
165,4
33,2
32
169,3
56,3
78
334,7
89,6
10
341,0
92,8
62
330,5
44,5
43
249
Sh
eri
ff's
Meri
t B
oard
1,7
95,3
58
1,8
00,0
22
730,1
02
1,0
43,7
77
1,7
73,8
79
1,8
80,6
89
1,8
61,8
76
250
Sta
te's
Att
orn
ey
93,2
29,5
90
93,9
71,0
15
42,3
77,8
53
52,5
45,5
42
94,9
23,3
95
99,1
54,6
28
99,1
54,6
28
259
Med
ical
Exam
iner
10,4
28,2
62
10,4
42,0
88
4,4
37,4
87
4,8
33,9
06
9,2
71,3
93
10,8
27,0
41
10,8
27,0
41
260
Pu
bli
c D
efe
nd
er
55,2
75,4
50
55,6
85,1
01
23,8
62,9
14
32,4
38,8
32
56,3
01,7
46
60,5
79,5
55
60,5
79,5
55
265
Ho
mela
nd
Secu
rity
an
d E
merg
en
cy M
an
ag
em
en
t1,3
59,3
51
1,3
67,9
40
659,8
96
637,1
85
1,2
97,0
81
1,5
42,6
31
1,3
87,5
00
280
Ad
ult
Pro
bati
on
38,1
54,3
17
38,4
69,4
07
16,9
34,0
62
19,6
89,0
52
36,6
23,1
14
40,2
70,0
77
39,5
76,0
37
300
Jud
icia
ry
10,6
91,9
46
10,6
69,2
01
4,0
51,8
19
6,5
10,6
44
10,5
62,4
63
10,6
60,3
11
10,6
60,3
11
305
Pu
bli
c G
uard
ian
17,4
68,0
75
17,6
04,6
32
7,8
76,0
35
9,7
10,8
98
17,5
86,9
33
17,9
40,7
87
17,9
26,5
87
310
Off
ice o
f th
e C
hie
f Ju
dg
e30,5
16,5
19
30,5
57,6
72
12,7
05,3
23
17,4
26,2
99
30,1
31,6
22
32,4
05,8
64
36,9
59,2
62
*May
is e
stim
ated
pri
or
to is
suan
ce o
f th
e f
inal
tri
al b
alan
ce.
10

Fis
cal
Year
2014
Pro
jecte
d D
ep
art
men
t Y
ear
En
d E
xp
en
ses
an
d 2
015
Est
imate
s --
Gen
era
l F
un
d a
nd
Healt
h E
nte
rpri
se F
un
d
Dep
tD
esc
rip
tio
n
2014
Ap
pro
ved
&
Ad
op
ted
2014
Ad
just
ed
Ap
pro
pri
ati
on
Decem
ber
- M
ay
Exp
en
dit
ure
s an
d
En
cu
mb
ran
ces
Ju
ne -
No
vem
ber
Est
imate
d
Exp
en
dit
ure
s
T
ota
l 2014
Est
imate
d
Ex
pen
dit
ure
s
Dep
art
men
t 2015
Est
imate
Ex
ecu
tive
2015
Est
imate
312
Fo
ren
sic C
lin
ical
Serv
ices
2,5
79,5
62
2,6
01,4
74
920,7
24
1,1
03,8
63
2,0
24,5
87
2,7
20,2
96
2,5
70,2
96
313
So
cia
l S
erv
ice
10,5
05,6
00
10,6
14,8
53
4,7
44,9
59
5,6
94,1
32
10,4
39,0
91
10,9
78,4
50
10,9
78,4
50
326
Juve
nil
e P
rob
ati
on
an
d C
ou
rt S
erv
ices
31,6
60,0
29
31,7
61,8
74
16569013
12,4
60,5
93
29,0
29,6
06
33,9
95,4
62
32,7
33,7
68
335
Cle
rk o
f th
e C
ircu
it C
ou
rt -
Off
ice o
f th
e C
lerk
74,9
29,1
06
75,4
09,2
01
34,7
84,1
69
40,7
70,4
93
75,5
54,6
62
77,9
22,7
57
77,9
22,7
57
390
Pu
bli
c A
dm
inis
trato
r1,0
97,0
74
1,1
02,3
38
464,0
68
595,9
10
1,0
59,9
78
1,1
30,3
11
1,1
30,3
11
440
Juve
nil
e T
em
po
rary
Dete
nti
on
Cen
ter
50,8
42,0
85
50,6
89,7
06
22,7
45,0
38
28,4
12,5
58
51,1
57,5
96
59,1
12,8
25
55,6
31,2
53
451
Off
ice o
f A
do
pti
on
an
d C
hil
d C
ust
od
y A
dvo
cacy
682,1
02
687,3
03
323,6
01
380,8
34
704,4
35
786,4
63
786,4
63
452
Vete
ran
s' A
ssis
tan
ce C
om
mis
sio
n400,0
00
388,1
00
187,2
82
200,8
18
388,1
00
566,2
47
400,0
00
490
Fix
ed
Ch
arg
es/
Sp
ecia
l P
urp
ose
- C
orp
ora
te55,1
39,9
35
54,5
98,4
44
35,6
92,6
83
17,0
92,8
40
52,7
85,5
23
56,6
94,8
40
56,6
94,8
40
499
Fix
ed
Ch
arg
es/
Sp
ecia
l P
urp
ose
- P
ub
lic S
afe
ty287,9
80,6
65
282,1
83,6
20
125,3
58,9
69
150,9
06,2
94
276,2
65,2
63
273,1
05,7
22
273,1
05,7
22
500
Dep
art
men
t o
f T
ran
spo
rtati
on
an
d H
igh
ways
5,7
23,8
43
5,7
13,3
22
2,7
50,4
35
2,9
00,0
52
5,6
50,4
87
6,4
37,8
88
6,4
37,8
88
To
tal
Gen
era
l F
un
d1,
376,5
31,
493
1,376,5
31,
493
662,7
47,0
86
725,8
09,6
91
1,
388,5
56,7
77
1,471,
454,5
17
1,
451,
778,5
56
240
Cerm
ak
Healt
h S
erv
ices
of
Co
ok
Co
un
ty46,6
30,8
43
46,8
04,5
07
18,1
51,9
59
25,0
15,3
59
43,1
67,3
18
47,0
61,2
39
47,0
61,2
39
241
Healt
h S
erv
ices
- JT
DC
3,9
10,3
87
3,9
18,0
50
1,3
79,0
29
1,5
84,8
93
2,9
63,9
22
3,9
79,5
53
3,9
79,5
53
890
Healt
h S
yst
em
Ad
min
istr
ati
on
189,4
71,3
95
186,5
55,5
78
55,2
02,6
35
128,5
34,0
13
183,7
36,6
48
182,1
32,7
08
182,1
32,7
08
891
Pro
vid
en
t H
osp
ital
of
Co
ok
Co
un
ty48,3
57,7
96
47,6
74,0
88
20,5
13,6
55
25,9
24,8
04
46,4
38,4
59
47,4
98,0
99
47,4
98,0
99
893
Am
bu
lato
ry a
nd
Co
mm
un
ity H
ealt
h N
etw
ork
51,4
65,4
67
47,1
49,0
27
18,9
78,0
70
27,7
15,3
03
46,6
93,3
73
51,3
88,4
44
51,3
88,4
44
894
Th
e R
uth
M.
Ro
thst
ein
CO
RE
Cen
ter
11,7
53,0
51
11,6
21,4
15
7,9
07,9
74
3,6
83,9
95
11,5
91,9
69
11,5
81,9
41
11,5
81,9
41
895
Dep
art
men
t o
f P
ub
lic H
ealt
h14,4
50,2
51
14,5
02,5
30
5,4
82,0
88
8,0
40,2
68
13,5
22,3
56
14,4
91,7
93
14,4
91,7
93
896
Man
ag
ed
Care
190,8
04,2
89
203,3
11,4
27
156,9
61,6
89
366,1
11,7
06
523,0
73,3
95
583,6
72,6
15
583,6
72,6
15
897
Joh
n H
. S
tro
ger,
Jr.
Ho
spit
al
of
Co
ok
Co
un
ty445,2
02,5
20
441,0
37,4
48
177,0
67,4
74
271,6
76,4
17
448,7
43,8
91
444,6
81,6
74
444,6
81,6
74
898
Oak
Fo
rest
Reg
ion
al
Ou
tpati
en
t C
en
ter
11,2
16,0
96
11,1
27,3
84
4,2
05,6
76
6,7
32,1
61
10,9
37,8
37
10,9
23,6
57
10,9
23,6
57
899
Fix
ed
Ch
arg
es/
Sp
ecia
l P
urp
ose
- H
ealt
h112,4
55,1
01
112,0
15,7
42
38,1
79,5
79
67,5
42,6
67
105,7
22,2
46
112,4
08,8
81
112,4
08,8
81
To
tal
Healt
h E
nte
rpri
se F
un
d1,
125,7
17,1
96
1,
125,7
17,1
96
504,0
29,8
28
932,5
61,
586
1,
436,5
91,
414
1,
509,8
20,6
06
1,
509,8
20,6
06
To
tal
Gen
era
l an
d H
ealt
h E
nte
rpri
se F
un
ds
2,5
02,2
48,6
89
2,5
02,2
48,6
89
1,16
6,7
76,9
14
1,
658,3
71,
277
2,8
25,1
48,1
91
2,9
81,
275,1
23
2,9
61,
599,1
62
*May
is e
stim
ated
pri
or
to is
suan
ce o
f th
e f
inal
tri
al b
alan
ce.
11

2015 Special Purpose Funds Outlook
The County’s Annual Appropriation Bill contains Special Purpose Funds in addition to the General
Fund. Special Purpose Funds are established for a specific and dedicated purpose, and are
considered to be self-balancing.
MFT Illinois First (1st) – 501
Used to plan, design, construct, maintain and operate highways in Cook County and is paid for out
of proceeds from the State distribution of Motor Fuel Tax. For 2015, Motor Fuel Tax funds are
expected to cover the 2015 budget of $23,234,167.
Animal Control Department – 510
Prevents the transmission of rabies and other diseases from animals to humans. The department
forecasts revenue in 2015 to be $3.4 million, with $4.2 million in expenditures and a $6.7 million
positive fund balance.
County Clerk – Election Division Fund – 524;
Board of Election Commissioners- Election Fund – 525
Funds the cost of elections using property tax revenue. In 2015, the funds’ expenses will decrease
by $19.5 million due to the off year in elections. This increases the amount of property tax revenue
available to other obligations such as the cost of debt service.
County Recorder Document Storage System Fund – 527
Funds the equipment, materials and necessary expenses to implement and maintain the Recorder of
Deeds’ document storage system. Fees are charged for record retrieval and other items. 2015
revenue estimates are $3.3 million, with $4.5 million in expenditures, resulting in a 2015 fund balance
estimated of $2.1 million.
Circuit Court Automation Fund – 528
Maintains the automated systems that support the activities of the Circuit Court, meet the needs of
Court constituents, and provides constant access to both internal and external users. For 2015,
revenues are estimated to be $12 million, with slightly lower expenditures aimed at reducing the
negative fund balance over time. The fund is projecting a negative $6.1 million balance for 2015
year-end.
Clerk of the Circuit Court Document Storage Fund – 529
Manages Circuit Court records. Projected revenues for 2015 are $11 million, with expenditures
estimated to be $9.5 million. The projected 2015 ending fund balance is estimated to be a negative
$3.1 million, which the Clerk of the Court is working to address over several years.
12

Cook County Law Library – 530
Provides legal information resources to legal professionals, judiciary, government officials, litigants
and the residents of Cook County at six locations. In 2015, revenues are estimated to be $6.1
million, with $5.3 million in expenditures. The fund is projecting to be in balance by the end of
2015.
Circuit Court-Illinois Dispute Resolution Fund – 531
Fees from civil filings disbursed to dispute resolution centers. The fund is projected to receive
$190,000 in revenues in 2015, with estimated expenditures at $181,000. Due to a prior year’s fund
balance, the fund is projecting to have a positive balance of $158,886 by the end of 2015.
Adult Probation/Probation Service Fee Fund – 532
Collects fees from certain adult offenders by order of the court, based upon the defendants’ ability
to pay. Revenue estimates for 2014 are projected to be just over $4 million, which is $350,000 lower
than initial revenue projections. 2015 revenues are estimated at $4 million, $3.6 million in
expenditures, and a projected fund balance of $1,018,314 by the end of 2015.
County Clerk Automation Fund – 533
Funds automation of the County Clerk’s Office non-election activities, and is funded by vital
records. 2015 revenue estimates are $1.1 million with expenditures projected at $1.4 million. The
County Clerk Automation fund is projected to have a 2015 surplus of $12,827.
County Treasurer-Tax Sales Automation Fund – 534
Funds automation-related expenses in the Cook County’s Treasurer’s Office. In 2015, there is an
estimated $9.6 million in revenue with estimated expenditures of $10 million. There is a projected
2015 positive ending fund balance of $15.6 million.
Intergovernmental Agreement/ETSB – 535
Provides telephone service to unincorporated Cook County and municipalities who are part of the
Emergency Telephone System Board 911 telephone system. Revenue for 2015 is expected to be
$1.2 million with expenses projected to be $1.3 million. The fund balance will be a negative $3.3
million fund balance, if expenditures are not reduced and a multi-year plan will be required to
correct the current imbalance.
Juvenile Probation-Supplementary Officers – 538
Administrative Office of the Illinois Court funds supports additional Juvenile Probation Officer
positions. Revenue estimates for 2015 are estimated at $3.3, with expenditures equal to revenues.
The Department of Budget and Management Services is working with the Office of the Chief Judge
to stabilize this fund which is projecting a significant negative balance of $15.3 million and will
require a plan to correct the historic imbalance.
13

Social Services/Probation and Court Services Fund – 541
Collects fees from certain adult offenders by order of the court, based upon the defendants’ ability
to pay. Revenue for 2015 is projected to be $2.8 million, with equal expenditures. There is a
projected $2.1 million positive fund balance for this fund by year-end 2015.
Lead Poisoning Prevention Fund – 544
Reduces the dangers of lead-based paint in Cook County dwellings; prevents lead poisoning through
lead abatement and mitigation; educates residents to the dangers of lead based paint; and
disseminates lead-poisoning prevention materials to residents of lead mitigated dwellings. The 2015
projected fund balance is $9.2 million, with $1.2 million in expenditures and no revenue. The Lead
Poisoning Prevention fund is financed by the repeal of Torrens Fund in January 2014, which
represents a one-time transfer to this account.
Geographical Information Systems – 545
Provides maintenance and access to Cook County’s enterprise geographic information system. The
estimated revenue to this fund for 2015 is $8.2 million with expenditures of $14.2 million. There is a
positive fund balance projected to be $12.7 million for year-end 2015.
Sheriff’s Youthful Offender Alcohol & Drug Education – 546
Provides an educational alternative for youthful offenders and their parents to assist the court and
community in decreasing alcohol and other drug use. The preliminary projected revenue for 2014 is
$2,400, equal to expenditures. With a $2,400 revenue estimate for 2015, also equal to expenditures,
the fund balance for 2015 is $14,258.
State’s Attorney Narcotics Forfeiture – 561
Supports work with the State, City and County Agencies on various drug related cases. Revenue is
estimated to be $4.2 million in 2015 with expenditures equal to revenue. There is an estimated fund
balance of $0 for year-end 2015.
State’s Attorney Bad Check Diversion Program – 562
Offers a pre-trial educational diversion program for first time bad check passers, provides restitution
to victims, and helps avoid an increased caseload in the criminal justice system at no cost to the
victims or taxpayers. Projected 2015 revenues are estimated to be $0, and therefore this fund will be
eliminated in 2015. There is a projected negative fund balance of ($1,466).
TB Sanitarium District – 564
Serves to prevent, diagnose, treat, and care for all Cook County residents afflicted with tuberculosis.
In 2015, revenue is projected to be $1.2 million and expend $6.2 million, for a projected FY2015
ending fund balance of $9.7 million. The fund balance originates from a surplus of real estate taxes
from the State, and is required by the State to be used exclusively for the purposes of this fund.
14

Clerk of the Circuit Court Administrative Fund – 567
Utilized for the Clerk’s Office administration to improve information technology, operational
efficiency, improved customer service, employee development and training and financial
accountability. For 2015, estimated revenues are $850,000 with expenditures slightly lower at
$747,652. The projected 2015 year-end fund balance of $13,025 is anticipated to be addressed with
additional cost reductions.
GIS Fee Fund – 570
This special purpose fund provides and maintains a countywide map through a geographic system.
In 2015, the Recorder’s Office revenue estimate is $2 million, with a 2015 expenditure estimate of
$3.5 million. Based off projected revenue and expenditures, the fund is projecting a negative balance
of $1.3 million, a result of decreased real estate revenue, which the fund will work to address prior to
the final recommendation.
Rental Housing Support Fee Fund – 571
The Rental Housing Support Fund was established to assist in addressing the need for rental
housing. A state surcharge funds this program. In 2015, the Recorder’s Office estimates revenue for
this fund at $286,013 and expenditures at $252,000.
Children’s Waiting Room – 572
Court services fees are credited to this fund to operate and administer the children’s waiting rooms
in Cook County. Revenue estimates for 2014 are assumed to be at $2.7 million, $400,000 less than
original projections. With 2015 projected revenue at $2.75 million and $2.2 estimated expenditures,
the 2015 fund balance is projected to be just under $1 million.
Women’s Justice Services Fund – 573
Operates rehabilitation programs provided by the Sheriff’s Department of Women’s Justice Services,
including mental health and substance abuse services. This fund is projected to collect $65,000 in
2014, $10,000 more than original projections. With 2015 projected revenue of $65,000, equal to
projected expenditures, the 2015 projected fund balance is $68,087.
Court Funds: The Mental Health Fund – 574; Peer Court Fund – 575;
Drug Court Fund – 576;
Various court services fees are credited to the appropriate funds to operate and administer court
programs. Combined, these funds are projected to collect $1.8 million in 2014, $390,000 lower than
initial projections. In 2015, the Mental Health Fund is projecting to receive $800,000 in revenue,
equal to expenditures, resulting in a negative balance of $211,806. The Peer Court Fund has 2015
projected revenues of $450,000, equal to expenditures, resulting in a $38,413 negative fund balance.
The Drug Court Fund is projecting to receive $400,000 in revenues, equal to expenditures, in 2015,
resulting in a negative $139,719 fund balance.
15
Vehicle Purchase Fund – 577
Fees from violations of Illinois Vehicle Codes support the acquisition or maintenance of law
enforcement vehicles. Estimated revenue for 2015 is $130,000 with $400,000 in expenditures,
resulting in a positive $588,648 estimated year-end fund balance.
Assessor Special Revenue Fund – 579
Revenues generated by the Assessor’s Office from marketing opportunities used to pay for costs in
the Assessor’s Office. Revenues and expenditures are projected at $368,000 in 2015, with a positive
fund balance projection of $67,493.
Circuit Court Clerk Electronic Citation Fund – 580
Establishes and maintains electronic citations, used to defray the Clerk’s expenses of establishing
and maintaining electronic citations in any traffic, misdemeanor, municipal ordinance, or
conservation case upon a judgment of guilty or grant of supervision. The 2015 revenue projection is
$450,000, with equal expenditures.
State’s Attorney Records Automation – 583
Supports expenditures for hardware, software, research and development costs and personnel
related to Records Automation. Fees are collected by Defendants upon a finding of guilty or
supervision in a court of law. This Special Purpose Fund is projected to collect $158,000 in 2015,
with equal expenditures, and a 2015 projected fund balance of $105,010.
Public Defender Records Automation – 584
Identical to the State’s Attorney Records Automation fund, this fund supports expenditures for
hardware, software, research and development costs and personnel related to Records Automation.
Fees are collected by Defendants upon a finding of guilty or supervision in a court of law. This
Special Purpose Fund is projected to collect $158,000 in 2015, with equal expenditures, and a 2015
projected fund balance of $101,710.
Environmental Control Solid Waste Program Fund - 585
Fund established for the collection of fees associated with Environmental Control’s Solid Waste
Program. The Solid Waste Program improves the quality of the environment for the residents of
Cook County through inspection, compliance and sustainability. 2015 projected revenues are
estimated at $406,000, $385,486 in expenditures, with a projected fund balance of $20,601.
Land Bank Authority - 586
Fund established to reduce and return vacant and abandoned properties back into productive and
sustainable community assets. The Land Bank Authority was established in 2014, and projects $1
million in revenues and $990,000 in expenditures. In 2015, revenues are estimated at $3.45 million,
equal to expenditures, resulting in an ending fund balance of $10,000.
16

Sp
ecia
l P
urp
ose
Fu
nd
s 2015
Pre
lim
inary
Pro
jecti
on
s
Dep
tD
esc
rip
tio
n
FY
13 E
nd
ing
Fu
nd
Bala
nce
FY
14 R
evi
sed
Reve
nu
e
Pro
jecti
on
FY
14 E
stim
ate
d
To
tal
Reso
urc
es
FY
14 P
roje
cte
d
Ex
pen
dit
ure
s
FY
14 P
roje
cte
d
En
din
g F
un
d
Bala
nce
FY
15 R
eve
nu
e
Est
imate
FY
15 T
ota
l
Reso
urc
es
FY
15
Dep
art
men
t
Est
imate
d
Ex
pen
dit
ure
s
FY
15 E
xecu
tive
Est
imate
d
Ex
pen
dit
ure
s
FY
15 E
nd
ing
Fu
nd
Bala
nce
Est
imate
*
501
MF
T I
llin
ois
Fir
st (
1st)
3,476,188
21,056,558
24,532,746
21,056,558
3,476,188
23,234,167
26,710,355
23,234,167
23,234,167
3,476,188
510
An
imal
Co
ntr
ol
Dep
art
men
t7,376,912
3,524,774
10,901,686
3,348,803
7,552,883
3,400,000
10,952,883
4,245,414
4,245,414
6,707,469
524
Co
un
ty C
lerk
-Ele
cti
on
Div
isio
n F
un
d0
24,038,039
24,038,039
24,038,039
019,619,266
19,619,266
19,619,266
19,619,266
0
525
Bo
ard
of
Ele
cti
on
Co
mm
issi
on
ers
-Ele
cti
on
Fu
nd
016,189,445
16,189,445
16,189,445
01,036,461
1,036,461
1,036,461
1,036,461
0
527
Co
un
ty R
eco
rder
Do
cu
men
t S
tora
ge S
yst
em
Fu
nd
3,967,465
3,222,000
7,189,465
3,847,078
3,342,387
3,268,719
6,611,106
4,483,159
4,483,159
2,127,947
528
Cir
cu
it C
ou
rt A
uto
mati
on
Fu
nd
(5,903,825)
10,047,240
4,143,415
10,617,929
(6,474,514)
12,000,000
5,525,486
11,622,954
11,622,954
(6,097,468)
529
Cle
rk o
f th
e C
ircu
it C
ou
rt D
ocu
men
t S
tora
ge F
un
d(3,898,771)
9,159,009
5,260,238
9,842,419
(4,582,181)
11,000,000
6,417,819
9,546,638
9,546,638
(3,128,819)
530
Co
ok
Co
un
ty L
aw
Lib
rary
(1,384,056)
5,913,141
4,529,085
5,321,219
(792,134)
6,100,000
5,307,866
5,307,866
5,307,866
0
531
Cir
cu
it C
ou
rt-I
llin
ois
Dis
pu
te R
eso
luti
on
Fu
nd
151,654
193,743
345,397
195,511
149,886
190,000
339,886
181,000
181,000
158,886
532
Ad
ult
Pro
bati
on
/P
rob
ati
on
Serv
ice F
ee F
un
d851,866
4,019,354
4,871,220
4,281,376
589,844
4,000,000
4,589,844
3,571,530
3,571,530
1,018,314
533
Co
un
ty C
lerk
Au
tom
ati
on
Fu
nd
648,919
1,122,500
1,771,419
1,445,324
326,095
1,131,000
1,457,095
1,444,268
1,444,268
12,827
534
Co
un
ty T
reasu
rer-
Tax
Sale
s A
uto
mati
on
Fu
nd
16,009,048
9,611,908
25,620,956
9,560,718
16,060,238
9,600,000
25,660,238
10,040,703
10,040,703
15,619,535
535
Inte
rgo
vern
men
tal
Ag
reem
en
t/E
TS
B(3,109,743)
1,141,335
(1,968,408)
1,218,670
(3,187,078)
1,222,090
(1,964,988)
1,326,200
1,326,200
(3,291,188)
538
Juve
nil
e P
rob
ati
on
-Su
pp
lem
en
tary
Off
icers
(15,336,195)
3,541,348
(11,794,847)
3,541,348
(15,336,195)
3,260,000
(12,076,195)
3,246,572
3,246,572
(15,322,767)
541
So
cia
l S
erv
ice/
Pro
bati
on
an
d C
ou
rt S
erv
ices
Fu
nd
2,028,931
2,852,042
4,880,973
2,815,037
2,065,936
2,800,000
4,865,936
2,808,085
2,808,085
2,057,851
544
Lead
Po
iso
nin
g P
reve
nti
on
Fu
nd
3,303,072
8,302,138
11,605,210
1,178,850
10,426,360
010,426,360
1,238,050
1,238,050
9,188,310
545
Geo
gra
ph
ical
Info
rmati
on
Syst
em
s22,596,552
8,055,000
30,651,552
11,939,520
18,712,032
8,171,798
26,883,830
14,185,244
14,185,244
12,698,586
546
Sh
eri
ff's
Yo
uth
ful
Off
en
der
Alc
oh
ol
& D
rug
Ed
ucati
on
14,258
2,400
16,658
2,400
14,258
2,400
16,658
2,400
2,400
14,258
561
Sta
te's
Att
orn
ey N
arc
oti
cs
Fo
rfeit
ure
(2,455,132)
6,524,651
4,069,519
4,069,519
04,213,575
4,213,575
4,213,575
4,213,575
0
562
Sta
te's
Att
orn
ey B
ad
Ch
eck
Div
ers
ion
Pro
gra
m41,891
23,643
65,534
67,000
(1,466)
0(1,466)
00
(1,466)
564
TB
San
itari
um
Dis
tric
t18,642,014
1,161,107
19,803,121
5,077,155
14,725,966
1,161,110
15,887,076
6,182,338
6,182,338
9,704,738
567
Cle
rk o
f th
e C
ircu
it C
ou
rt A
dm
inis
trati
ve F
un
d(227,328)
842,324
614,996
730,369
(115,373)
850,000
734,627
747,652
747,652
(13,025)
570
GIS
Fee F
un
d1,040,824
2,013,750
3,054,574
2,882,883
171,691
2,042,949
2,214,640
3,493,043
3,493,043
(1,278,403)
571
Ren
tal
Ho
usi
ng
Su
pp
ort
Fee F
un
d208,994
281,925
490,919
576,867
(85,948)
286,013
200,065
252,000
252,000
(51,935)
572
Ch
ild
ren
's W
ait
ing
Ro
om
636,637
2,704,730
3,341,367
2,937,751
403,616
2,750,000
3,153,616
2,154,805
2,154,805
998,811
573
Wo
men
's J
ust
ice S
erv
ices
Fu
nd
68,087
65,000
133,087
65,000
68,087
65,000
133,087
65,000
65,000
68,087
574
Men
tal
Healt
h F
un
d(242,694)
915,888
673,194
885,000
(211,806)
800,000
588,194
800,000
800,000
(211,806)
575
Peer
Co
urt
Fu
nd
556,396
405,191
961,587
1,000,000
(38,413)
450,000
411,587
450,000
450,000
(38,413)
576
Dru
g C
ou
rt F
un
d(131,108)
451,389
320,281
460,000
(139,719)
400,000
260,281
400,000
400,000
(139,719)
577
Veh
icle
Pu
rch
ase
Fu
nd
728,648
130,000
858,648
0858,648
130,000
988,648
400,000
400,000
588,648
579
Ass
ess
or
Sp
ecia
l R
eve
nu
e F
un
d67,493
706,034
773,527
706,034
67,493
368,000
435,493
368,000
368,000
67,493
580
Cir
cu
it C
ou
rt C
lerk
Ele
ctr
on
ic C
itati
on
Fu
nd
199,542
304,719
504,261
523,237
(18,976)
450,000
431,024
450,000
450,000
(18,976)
583
Sta
te's
Att
orn
ey R
eco
rds
Au
tom
ati
on
104,525
158,485
263,010
158,000
105,010
158,000
263,010
158,000
158,000
105,010
584
Pu
bli
c D
efe
nd
er
Reco
rds
Au
tom
ati
on
104,439
155,271
259,710
158,000
101,710
158,000
259,710
158,000
158,000
101,710
585
En
viro
nm
en
tal
Co
ntr
ol
So
lid
Wast
e P
rog
ram
Fu
nd
0
126,000
126,000
125,913
87
406,000
406,087
385,486
385,486
20,601
586
Lan
d B
an
k A
uth
ori
ty0
1,000,000
1,000,000
990,000
10,000
3,450,000
3,460,000
3,450,000
3,450,000
10,000
* F
Y15
En
din
g F
un
d B
ala
nce E
stim
ate
calc
ula
ted
in
acco
rdan
ce t
o F
Y15
Ex
ecu
tive
Ex
pen
dit
ure
Est
imate
.
17

TONI PRECKWINKLEPRESIDENTCOOK COUNTY BOARDOF COMMISSIONERS
John P. DaleyChairman, Committee on Finance
Jerry ButlerEarlean Collins
John P. DaleyJohn A. Fritchey
Bridget GainerJesus G. Garcia
Elizabeth “Liz” Doody GormanGregg Goslin
Stanley MooreJoan Patricia Murphy
Edwin ReyesTimothy O. Schneider
Peter N. SilvestriDeborah SimsRobert Steele
Larry SuffredinJeffrey R. Tobolski
Ivan SamsteinChief Financial Officer
Andrea GibsonBudget Director


