37
18 AUGUST 2017 FY17 RESULTS PRESENTATION

18 AUGUST 2017
FY17 RESULTS PRESENTATION

2
IMPORTANT NOTICEThis disclaimer applies to this presentation and the information contained in it (the “Presentation”).
By reading this disclaimer you agree to be bound by it.
Important notice and disclaimer: This presentation contains a general summary of the activities of Kogan.com Ltd (Kogan.com), does not purport to be complete and isto be read in conjunction with all other announcements filed with the Australian Securities Exchange (ASX), including Kogan.com’s full year results filed with the ASX on 18 August 2017. Information in this presentation is current as at the date of this presentation 18 August 2017 and remains subject to change without notice. Financial information in this presentation is unaudited. Kogan.com does not warrant the accuracy, adequacy or reliability of the information in this presentation and, to the maximum extent permitted by law, disclaims all liability and responsibility flowing from the use of or reliance on such information by any person.
Not an offer or financial product advice: This presentation is not investment or financial product advice or any recommendation (nor tax, accounting or legal advice) and is not intended to be used as the basis for making an investment decision. In providing this document, Kogan.com has not considered the objectives, financial position or needs of any particular recipients. Each recipient should consult with its professional adviser(s), conduct its own investigation and perform its own analysis in order to satisfy themselves of the accuracy and completeness of the information, statements and opinions contained in this document. This presentation does not constitute an offer to issue or sell securities or other financial products in any jurisdiction. The distribution of this presentation outside Australia may be restricted by law.
Forward looking statements: This presentation contains forward looking statements and comments about future events, which reflect Kogan.com’s intent, belief or expectation as at the date of this presentation. Such forward looking statements may include forecast financial and operating information about Kogan.com, its projects and strategies and statements about the industries and locations in which Kogan.com operates. Forward looking statements can be identified by forward-looking terminology including, without limitation, “expect”, “anticipate”, “likely”, “intend”, “should”, “could”, “may”, “predict”, “plan”, “propose”, “will”, “believe”, “forecast”, “estimate”, “target” and other similar expressions within the meaning of securities laws of applicable jurisdictions. Indications of, and guidance or outlook on, future earnings or financial position or performance are also forward looking statements. Forward looking statements involve inherent known and unknown risks, uncertainties and contingencies, both general and specific, many of which are beyond Kogan.com’s control, and there is a risk that such predictions, forecasts, projections and other forward looking statements will not be achieved. Actual results may be materially different from those expressed or implied. Forward looking statements are provided as a general guide only and should not be relied on as an indication, representation or guarantee of future performance. Undue reliance should not be placed on any forward looking statement. Kogan.com does not undertake to update or review any forward looking statements.
Past performance: Past performance should not be relied upon as (and is not) an indication or guarantee of Kogan.com’s future performance or condition.
Financial data: All financial amounts contained in this Presentation are expressed in Australian currency, unless otherwise stated. Any discrepancies between totals and sums of components in tables and figures contained in this Presentation are due to rounding.
Non-IFRS measures: Throughout this presentation, Kogan.com has included certain non-IFRS financial information, including EBITDA, Pro Forma EBITDA, NPATA, GTV and Gross Sales. Kogan.com believes that these non-IFRS financial and operating measures provide useful information to recipients for measuring the underlying operating performance of Kogan.com’s business. Non-IFRS measures have not been subject to audit.

3
Page 4 - 14
Page 15 - 25
Page 26 - 31
CEO Update
Financial Update
Outlook
Q&A
CONTENTSCONTENTS

4
Ruslan KoganFounder & CEO
CEO Update

5
FY17 was a landmark year for Kogan.com
FY17 HIGHLIGHTS
• Beat prospectus forecast• Three separate earnings upgrades
• People’s Choice Award at the Startrack Online Retail Industry Awards• Canstar Value for Money Award
• Final dividend announced of 3.80 cents per share brings the total fully franked dividend in FY17 to 7.70 cents per share
• 955,000 Active Customers - 36% increase from FY16
• Kogan Mobile going from strength-to-strength• Private Label strategy success• Consolidating Dick Smith integration
• Kogan NBN announced in June 2017• Expanded Kogan Mobile partnership announced in June 2017• Kogan Insurance announced in July 2017
FINANCIAL OUTPERFORMANCE
GROWING BRAND
NEW VERTICALS ANNOUNCED
AWARD WINNING OFFERINGS
DIVIDENDS
STRONG GROWTH FROM KEY INITIATIVES

6
FY17 RESULTSPro Forma EBITDA of $13.2 million exceeded Prospectus forecast by 91.3%.
Pro Forma 1
actual FY16
Prospectus forecast
FY17Pro Forma 1
actual FY17FY17 vs FY16
Variance
FY17 forecast vs
FY17 actual Variance
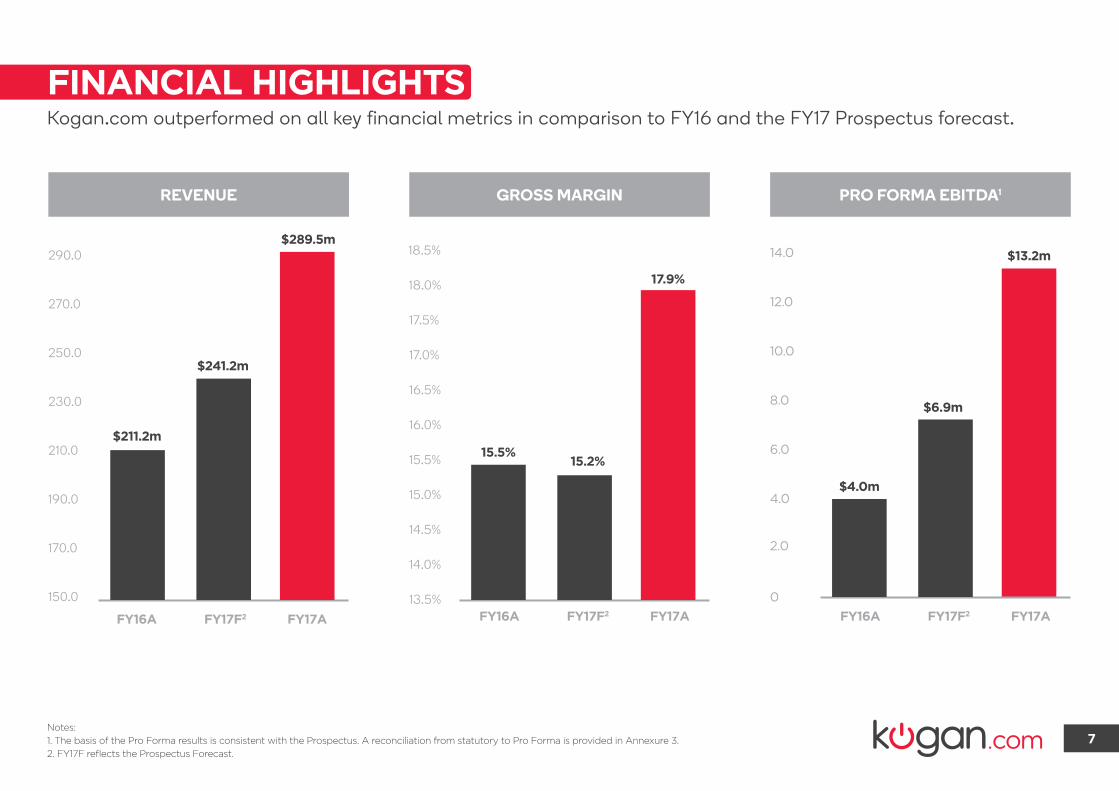
Revenue $m 211.2 241.2 289.5 37.1% 20.0%
Pro Forma EBITDA1 $m 4.0 6.9 13.2 230.0% 91.3%
Gross Margin 15.5% 15.2% 17.9% 2.4pp/15.5% 2.7pp/17.8%
Notes:1. The basis of the Pro Forma results is consistent with the Prospectus. A reconciliation from statutory to Pro Forma is provided in Annexure 3.
LTM REVENUE
MAR-16 JUN-16 SEP-16 DEC-16 MAR-17 JUN-17150
175
200
225
250
275
300
$m
197
211
225
250
271
290
7
FINANCIAL HIGHLIGHTSKogan.com outperformed on all key financial metrics in comparison to FY16 and the FY17 Prospectus forecast.
FY16A
$211.2m15.5%
$4.0m
$6.9m
$13.2m
$241.2m
15.2%
$289.5m
17.9%
FY16A FY16AFY17F2 FY17F2 FY17F2FY17A FY17A FY17A
17.5%
18.0%
18.5%
13.5%150.0 0
14.0%170.0 2.0
14.5%
190.0 4.015.0%
210.0 6.0
8.0
10.0
12.0
14.0
15.5%
230.0
16.0%
250.0
16.5%
270.0
17.0%
290.0
REVENUE GROSS MARGIN PRO FORMA EBITDA1
Notes:1. The basis of the Pro Forma results is consistent with the Prospectus. A reconciliation from statutory to Pro Forma is provided in Annexure 3.2. FY17F reflects the Prospectus Forecast.

8
STRATEGYHow we deliver value to our customers:
INDUSTRY LEADING IT PLATFORM & DATA DRIVEN CULTURE
CUSTOMER-CENTRIC APPROACH
COMPELLING OFFERING
The Kogan brand is renowned for price leadership through digital efficiency. We believe ‘There is always a better way’ and our vision is to harness the power of technology and personalisation to change the way our customers shop online.
We understand our customers, what inspires them and what interests them. We leverage this understanding, driven by data, analytics and long-term investments in systems to continue to reach and inspire our customers in new and exciting ways.
We use technology innovation to stay ahead of our customers’ expectations and ahead of the curve in offering price leading goods and services in Australia.
We are customer obsessed. Understanding and servicing our customers’ needs is central to what we do. Our customers have high expectations and we aim to offer a seamless shopping experience.
Our analytics capability ensures we know what our customers want and when they want it. Our investment in automation has driven faster fulfillment of products and services and happier customers.
Our portfolio of retail and services businesses is focused on making in-demand products and services more affordable and accessible for our customers.
We aim to bring market leading prices to our customers on in-demand products and services across our portfolio of businesses. We achieve this by leveraging our 11 years’ experience in Private Label, extensive Third Party brand offering, and using the strength of the Kogan brand to partner with industry leaders for Kogan Mobile, Kogan Insurance and Kogan NBN.
We are able to pass on savings to customers by streamlining and cutting overheads in our supply chains and marketing.
9
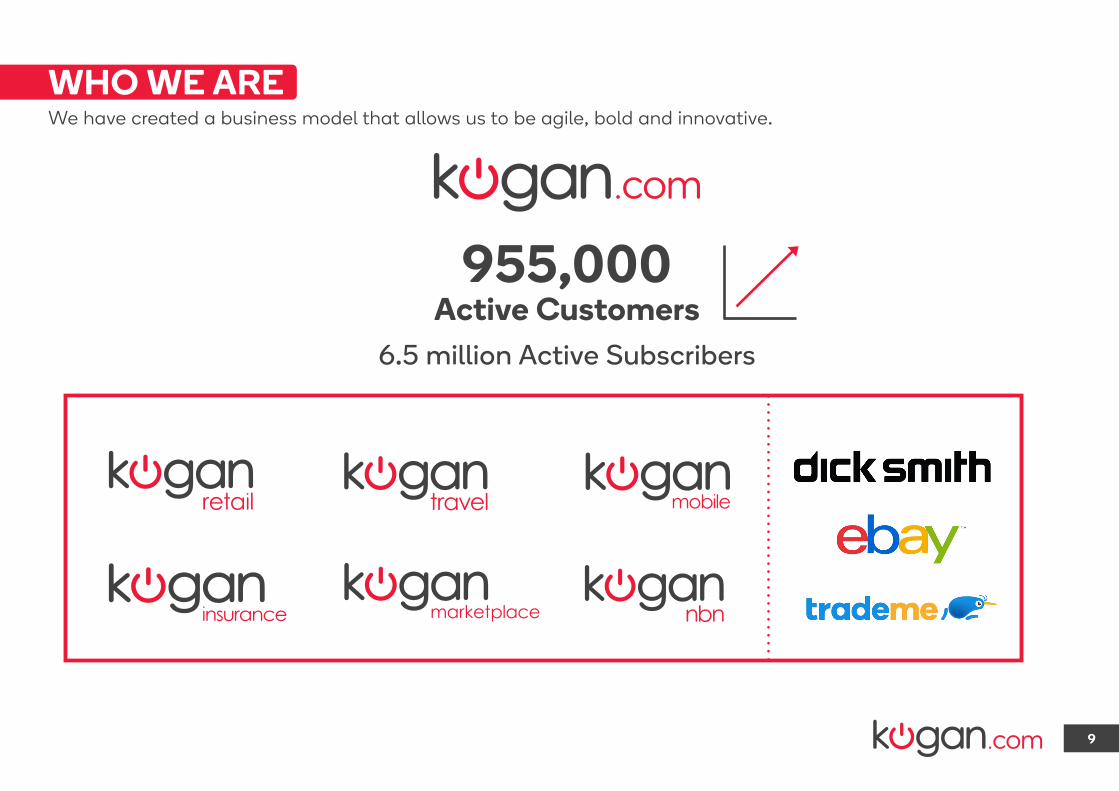
We have created a business model that allows us to be agile, bold and innovative.
WHO WE ARE
955,000Active Customers
6.5 million Active Subscribers

10
Kogan has received various awards and recognition in FY17.
“As a consumer brand, there is no better vote than the vote of our customers.”
- Ruslan Kogan
SOME RECENT AWARDS
Kogan won the People’s Choice Award at the Startrack Online Retail Industry Awards (ORIAS) Kogan TVs won the Canstar Value for Money Award
Chief Technology Officer, Goran Stefkovski, won Consumer
CIO of the year2
#1 Most Mobile ReadyAustralian Brand1
Notes:1. Source: Ansible, 27 February 2017.2. Source: itnews, 21 February 2017.

11
BUILDING THE KOGAN BRANDIn the twelve months to June 2017, the business achieved 36.0% growth in Active Customers.
Jun-16 Dec-16 Jun-17Jun-16 vs Jun-17
Variance
Active Customers 702,000 830,000 955,000 36.0%
Notes:1. Net Promoter Score (NPS) is calculated based on answers to the question, “How likely is it that you would recommend Kogan.com to a friend or colleague?” Kogan.com measures its NPS as the percentage of customers who are “promoters” rating its products and services 9 or 10 out of a possible 10, less the percentage of ”detractors”, rating its products and services 0 to 6 out of a possible 10. The maximum possible NPS is 100, and the minimum possible NPS is -100.
LTM ACTIVE CUSTOMERS NET PROMOTER SCORE1
600
650
700
750
800
850
900
950
1,000
Apr
-16
May
-16
Jun-
16
Jul-1
6
Aug
-16
Sep-
16
Oct
-16
Nov
-16
Dec
-16
Jan-
17
Feb-
17
Mar
-17
Apr
-17
May
-17
Jun-
17
'00
0
Average 60.05

12
BUILDING THE KOGAN BRANDAnnual revenue per customer and gross profit per active customer are increasing.
Notes:1. Revenue per customer is revenue (ex GST) within the prior 365 days/no. of Active Customers within the prior 365 days.2. FY17 gross profit/LTM Active Customers as at 30 June 2017; FY17 marketing costs/sum of quarterly new Active Customers in FY17.3. Conversion rate is defined as the number of transactions divided by unique visitors from Core Website Channels.
CONVERSION RATE3
TRAFFIC - FREE (BRAND DRIVERS) VS PAID MARKETING
ANNUAL REVENUE PER CUSTOMER1
ANNUAL RETURN ON INVESTMENT IN MARKETING2
Free Paid
78%
22%
• Direct website traffic• Direct App traffic• Brand searches• Other organic search queries• Email based marketing• Mobile push notifications• Desktop push notifications
FREE SOURCES

13
PRIVATE LABEL STRATEGYPrivate Label is a pillar of the business and remains a focus area for FY18 and beyond. In FY17 we invested IPO proceeds in replenishing inventory of best sellers. In FY18 our focus is on new products and range expansion.
20.0
25.0
30.0
35.0
40.0
45.0
50.0
2H16 2H17
$m
STRONG YOY GROWTH IN PRIVATE LABEL REVENUE
Our Private Label business benefits from:
• Full control of the end-to-end supply chain;• Strong competitive advantage;• Compelling consumer offering; and• 11 years’ experience.
Inventory levels in 2H17 reflect the investment of IPO proceeds and normal operational momentum of the Private Label business.
43.8%

14
Partnering with select brands and distributors, giving them access to our 955,000 Active Customers, in addition to our marketing and online distribution capability.
KOGAN MARKETPLACE
Over 50,000 products from over 50 brands and distributors already listed. Our curated marketplace works with select brands and distributors who generate incremental sales with exposure on the Kogan.com platform and marketing initiatives to the Kogan Community.
We have sold over 2.5 million products to happy customers across Kogan Retail and Kogan Marketplace in the last 12 months alone.

15
David ShaferCFO/COO
Financial Update

16
PRO FORMA ACTUAL & FORECAST RESULTSHigher than forecast revenue and gross margin drove an outperformance against FY17 Prospectus forecast Pro Forma EBITDA of 91.3%.
$mProspectus
forecast FY17Pro Forma
actual FY17 % Variance
Gross Profit
Variable CostsMarketingPeople CostsOther Expenses
EBIT
Pro Forma EBITDA1
Depreciation & Amortisation
36.7
(9.0)(7.2)(9.0)(4.6)
3.6
6.9
(3.3)
51.7
(10.5)(10.6)(12.2)(5.2)
9.4
13.2
(3.8)
Gross Sales
Revenue
254.8
241.2 289.5
308.8 21.2%
20.0%Cost of Sales (204.5) (237.8)
40.9%
161.1%
91.3%
Gross Margin (%) 15.2% 17.9% 2.7pp/17.8%
Profit Before TaxIncome Tax Expense
NPAT
NPATA3
EBITDA Margin (%)
3.6(1.1)
2.5
3.8
2.9%
9.8(2.6)
7.2
8.6
4.6%
172.2%
188.0%
126.3%
1.7pp/59.2%
Notes:1. The basis of the Pro Forma results is consistent with the Prospectus. A reconciliation from statutory to Pro Forma is provided in Annexure 3.2.The Dick Smith assets were purchased in April 2016 for $2.6 million and are being amortised over 2 years on a straight-line basis. 3. NPATA: this non-IFRS measure was not disclosed in the Prospectus however, management believes NPATA is a meaningful metric in understanding the performance of the business.
Revenue exceeded FY17 Prospectus forecast by $48.3 million, driven by growth in Active Customers, Kogan Mobile and channel growth with the launch of Dick Smith.
Gross profit was 40.9% above Prospectus forecast at $51.7 million. Improved gross margin was driven by precision sourcing, improved efficiencies/automation in processes and Kogan Mobile.
Following better than expected ROI on marketing, spend was increased above Prospectus forecast as a % of revenue.
NPATA refers to NPAT plus the non-cash amortisation of the Dick Smith assets.2
OVERVIEW

17
PRO FORMA FY17 RESULTS COMPARED TO FY16Pro Forma EBITDA increased by 230.0% ($9.2 million) year on year.
$mPro Forma
actual FY16Pro Forma
actual FY17 % Variance
Gross Profit
Variable CostsMarketingPeople CostsOther Expenses
EBIT
Pro Forma EBITDA1
Depreciation & Amortisation
32.7
(9.2)(5.7)(9.2)(4.6)
1.6
4.0
(2.4)
51.7
(10.5)(10.6)(12.2)(5.2)
9.4
13.2
(3.8)
Revenue 211.2 289.5 37.1%Cost of Sales (178.5) (237.8)
58.1%
487.5%
230.0%
Gross Margin (%) 15.5% 17.9% 2.4pp/15.5%
Profit Before TaxIncome Tax Expense
NPAT
NPATA
EBITDA Margin (%)
1.5(0.6)
0.8
1.1
1.9%
9.8(2.6)
7.2
8.6
4.6%
Gross salesGTV
221.3227.0
308.8334.5
39.5%47.4%
553.3%
800.0%
681.8%
2.7pp/142.1%
Notes:1. The basis of the Pro Forma results is consistent with the Prospectus. A reconciliation from statutory to Pro Forma is provided in Annexure 3.
GTV growth of 47.4% versus Revenue growth of 37.1% is driven by Kogan Mobile transaction values, which are not recorded as Revenue. Kogan Mobile revenue reflects the commissions, rather than the gross transaction value.
Gross margin increased by 2.4pp to 17.9%.
Marketing costs in FY16 were low due to cash constraints, which were released on receipt of IPO proceeds in July 2017.
The business also invested heavily in people in FY17. Short-term and long-term incentives are in place to retain key talent in the business and align the interests of key staff with shareholders. As a result of significant outperformance, bonuses paid in FY17, including superannuation and LTIs, were $0.9 million.
The year-on-year increase of $9.2 million in Pro Forma EBITDA was driven by the increase in revenue and gross margin.
OVERVIEW

18
KEY DRIVERS OF KOGAN.COM FY17 FINANCIAL PERFORMANCEThe business is utilising IPO proceeds to deliver on growth strategies, with the benefits beginning to be realised in FY17.
Following the IPO, cash constraints were released and the business was able to implement strategies for investment in: Private Label and Third Party Domestic inventory; and Marketing in order to drive growth in FY17 and beyond. During FY17, the investment in Private Label inventory was focused on replenishing existing best sellers and ranges where stock was below optimal levels. With that complete, from late 4Q17, the business expanded focus to new ranges which will drive growth in FY18 and beyond.
Better than expected ROI on marketing led us to increase marketing spend as a % of revenue versus the Prospectus forecast. Effective, targeted marketing is a key component of delivering growth and reaching more consumers.
The business achieved solid growth in Active Customers in FY17 of 253,000 (36.0%). At the end of FY17, we had 955,000 Active Customers.
The Dick Smith channel launched in May 2016, and was a strong contributor in FY17. The Kogan.com group sales funnel drives new customers to both Core Website Channels.
Kogan Mobile achieved significant growth, outperforming the Prospectus Gross Sales forecast for FY17 by 140.0% and growing by 620.0% compared to FY16.
Through our strong commercial partnership with Vodafone, Kogan Mobile has been able to bring a compelling offering to the market. Due to a strong marketing funnel, Kogan.com has been able to steadily grow the subscriber base. Due to the commission-based business model, Kogan Mobile incurs minimal operating costs, with marketing being the key cost. Consistent with all our marketing, this cost is targeted and variable with ROI metrics.
RELEASE OF CASH CONSTRAINTS
BRAND GROWTH
CHANNEL GROWTH
KOGAN MOBILE

19
KEY DRIVERS OF KOGAN.COM FY17 FINANCIAL PERFORMANCEFocus on efficiencies, automation initiatives, Private Label and Kogan Mobile resulting in improved gross margins.
Improvements in efficiency, automation initiatives, continual improvements to our ERP, expansion in the product offering and Kogan Mobile are positively impacting the gross margin of the business. Kogan Mobile Revenue is 100% gross margin, and represented 7.0% of total gross profit in FY17.
Kogan.com’s multi-channel proprietary world class platform allows personalisation in marketing and scalability of the consumer offering. Combined with the years of work undertaken by the team to optimise the business’s proprietary ERP implementation, it is continuing to deliver efficiencies in time and cost. The business is continuing to achieve further automation across various functions, and is continually improving reporting and business insights that drive rapid decision making across the business.
The business invested heavily in people in FY17. Short-term and long-term incentives are in place to retain key talent in the business and align the interests of key staff with shareholders. As a result of significant outperformance, bonuses paid in FY17, including superannuation and LTIs, were $0.9 million. Excluding these bonuses, People Costs were higher than expected largely due to an increased focus on retention of key staff. The people costs presently within the business are sufficient to support ongoing strong growth in revenue across our portfolio of businesses.
GROSS MARGIN IMPROVEMENT
PROPRIETARY ECOMMERCE PLATFORM AND ERP
INVESTMENT IN PEOPLE

20
FY17 GROSS PROFIT PRODUCT & BUSINESS MIXPrivate Label exclusive brands represent over 50% of Gross Profit. Kogan Mobile increased from 4.2% of gross profit in 1H17 to 7.0% for the full year.
GROSS PROFIT MIX IN FY17
18.8%
Travel 1.3%Mobile 7.0%
Other Income 1.2%
19.5%
52.2%
Third Party Domestic
Third Party International
Private Label
Private Label
Travel
Third Party International
Mobile
Third Party Domestic
Other Income
Private Label accounted for 52.2% of Gross Profit in FY17. The deployment of IPO proceeds into Private Label inventory in FY17 was focused on replenishing ranges, whereas we are now focused on new products and new ranges. As such, management expects Private Label to show further growth in FY18 and beyond.
OVERVIEW

21
NEW VERTICALS
Notes:1. Gross Sales is a non-IFRS measure - refer to the definition in the Glossary at the end of this Presentation. In respect of commission based sales generated under Kogan Mobile and part of Kogan Travel, Gross Sales represents only the commission received by the Company, and not the GTV paid by consumers
Kogan Travel and Kogan Mobile exceeded Prospectus Forecast Gross Sales by 27.8% and 140.0%, respectively.
$mProspectus
forecast FY17 Actual FY17Actual FY16Variance to
forecastVariance
YoY
Kogan Travel 5.4 6.94.8 27.8% 43.8%Kogan Mobile
Total
1.5
6.9
3.60.5
10.55.3
140.0% 620.0%
52.2% 98.1%
Gross sales1
NEW VERTICALS IN FY18

22
FY17 commission of $3.6 million (FY16: $0.5 million) and strong growth in Active Customers.
KOGAN MOBILE
KOGAN MOBILE ACTIVE CUSTOMERS
KOGAN MOBILE QUARTERLY COMMISSION ($000S)
2Q16 3Q16 4Q16 1Q17 2Q17 3Q17 4Q17
-
200
400
600
800
1,000
1,200
1,400
2Q16 3Q16 4Q16 1Q17 2Q17 3Q17 4Q17
Strong commercial relationship with Vodafone translating into growth for Kogan Mobile. The unique model means that Vodafone is responsible for operations, while Kogan is responsible for branding, marketing and customer acquisition. Kogan Mobile Gross Sales are 100% gross margin. The success of Kogan Mobile demonstrates the strength of the Kogan brand in powering new verticals. Enhanced economics for Kogan Mobile to commence in October 2017.

23
0% 0%
2% 2%
4% 4%
6% 6%
8% 8%
12% 12%
10% 10%
14% 14%
PRO FORMA1 OPERATING COSTS BREAKDOWN FY16 - FY17
(as a % of revenue)
PRO FORMA1 OPERATING COSTSBREAKDOWN FY17F - FY17A
(as a % of revenue)
FY17AFY17A FY17F2FY16A
Notes:1. The basis of the Pro Forma results is consistent with the Prospectus. A reconciliation from statutory to Pro Forma is provided in Annexure 3.2. FY17F reflects the Prospectus Forecast.
Operating costs as a % of revenue were 1pp higher than Prospectus Forecast, primarily driven by Marketing and People costs. Investment in marketing has helped to drive the outperformance in revenue versus Prospectus Forecast of 20.0%
12.3%13.6% 13.3% 13.3%
Variable Costs People CostsMarketing Costs Other Expenses
Predominately Fixed
Predominately Fixed
Predominately Volume-Driven
Predominately Volume-Driven
2.2% 1.9%1.8% 1.8%
4.4% 3.7%4.2% 4.2%
2.7% 3.0%3.7% 3.7%
4.3% 3.7%3.6% 3.6%
Following the release of cash constraints in FY17, the business invested in marketing to assist in driving growth and building the Kogan brand. FY16 marketing costs were at a historical low of just 2.7% of revenue due to cash constraints limiting investment at the time. Management believes targeted marketing with strict ROI metrics was a key driver in growth in FY17, and will continue to be a key driver in FY18 and beyond.In addition to marketing, the business has invested in people. Short term and long term incentive plans are in place to retain key talent in the business and align the interests of management with shareholders.
PRO FORMA OPERATING COSTS

24
NET ASSET SUMMARYAt 30 June 2017, cash was $32.0 million following the IPO and repayment of debt in July 2016.
$m 30 Jun 17
CURRENT ASSETS
NON-CURRENT ASSETS
NON-CURRENT LIABILITIES
CURRENT LIABILITIES
Cash & Cash Equivalents 32.0
Property, Plant & Equipment 0.5
Trade & Other Payables 29.7
Total Non-Current Assets 5.9
Provisions 0.5Deferred Income 5.2
Trade & Other Receivables 2.7
Intangible Assets 4.5
Total Liabilities 37.6
Net Assets 42.7
Current Tax Liability 2.2
Total Assets 80.3
Total Current Liabilities 37.6
Inventories 39.7
Deferred Tax Assets 0.9
Loans and Borrowings -
Total Current Assets 74.4
0.1
Strong balance sheet at 30 June 2017 with $32.0 million in cash and an undrawn debt facility of $10.0 million.
Inventory of $39.7 million comprises $30.7 million of inventory on hand and $9.0 million of inventory in transit. The business invested in inventory following the IPO to drive future growth.
The trade and other payables balance of $29.7 million is largely driven by the investment in inventory to support the Private Label and Third Party growth strategies.

25
FY17 STATUTORY OPERATING CASH FLOWThe business achieved Pro Forma operating cash conversion of 81.8% in FY17.
$mStatutory
FY17
Operating cash flow before capital expenditure
Investment in intangibles
10.8
(3.5)
Statutory EBITDA
Transaction costs of share issue in EBITDANon-cash items in EBITDA
Pro Forma EBITDA
Cash flow before financing & taxation
Pro Forma Operating cash flow conversion % 1
Change in net working capital
Purchase of PP&E
9.5
3.00.7
13.2
7.2
81.8%
(2.4)
(0.1)
The business generated operating cash flow before capital expenditure of $10.8 million in FY17, resulting in a Pro Forma operating cash flow conversion ratio of 81.8%
Net working capital increased by $2.4 million, driven predominantly by an increase in inventories, which was partially offset by an increase in payables.
OVERVIEW
Notes:1. Operating cash conversion is calculated as Operating cash flow before capital expenditure/Pro Forma EBITDA.

26
Outlook

27
We expect continued brand growth and to continue to outperform underlying market growth in every portfolio business.
DELIVERING GROWTH IN FY18 & BEYOND
SELECTIVE & OPPORTUNISTIC M&A LAUNCH ADDITIONAL BUSINESS VERTICALS

28
Notes:1. Source: NBN Corporate Plan 2017 and NBN Weekly Progress Report (8 June 2017)2. Fixed-line includes FTTP, FFTN/B, HFC3. RFS refers to homes and businesses passed by the active network and ready for service, including premises activated and those which can’t yet access a service4. 2017 data as at 8 June 2017. All other data to 30 June
• The expanded partnership with Vodafone Hutchison Australia was announced in June 2017 to provide fixed-line NBN plans and mobile broadband plans.
• Enhanced economics from the original Kogan Mobile partnership to commence in October 2017.
• The agreement is in place until 2022 with rolling two-year extensions thereafter, and high barriers to exit.
• Kogan will provide branding, marketing and customer acquisition, leveraging our reputation of price leadership through digital efficiency.
• Vodafone will provide network, operations and customer service support following their significant recent investment in mobile network and NBN infrastructure and capability.
KOGAN NBN
0.8 2.1 4.1 6.4 7.6 0.2 0.5 0.9
2.1
4.4
8.1
10.2 10.9
-
2.0
4.0
6.0
8.0
10.0
12.0
2013 2014 2015 2016 2017 2018f 2019f 2020f
Fixed-line Activated Fixed-line RFS
NBN FIXED-LINE MARKET (PREMISES, MILLIONS)
PRODUCTS
Competitively priced offerings on Vodafone mobile and fixed-line NBN network.
• Fixed-line NBN plans from 2018
• Mobile broadband plans launched in June 2017
• Kogan Mobile plans launched in October 2015 and continually improve
4.8
2.0

29
KOGAN INSURANCE• Kogan Insurance was launched in August 2017 in partnership with Hollard Insurance Company.
• The agreement, which is for an initial period of three years, allows Kogan Insurance to offer home, contents, landlord, car and travel insurance, with a focus on value for money.
• The underwriting of the insurance policies is provided by Hollard, with Kogan earning commission on the sale of all insurance policies.
• Similar to Kogan Mobile and Kogan NBN, Kogan will provide branding, marketing and customer acquisition.
• Hollard operates at the cutting edge of insurance services, insuring close to $100 billion of assets with over one million policy holders, and is part of a global financial services group that operates across 20 countries.
• The Kogan brand is synonymous with value for money and the aim of Kogan Insurance is to bring Aussie consumers premium protection without the premium price tag.
PRODUCTS
2016 GROSS WRITTEN PREMIUMS - AUSTRALIA1
Car Insurance
Contents Insurance
Landlords Insurance
Travel Insurance
Home & Contents Insurance
$30.8 billion
Notes:1. Source: KPMG ‘General Insurance Industry Review 2016

30
FY18 OUTLOOKPositive outlook for FY18 due to trajectory in revenue, gross profit and strong growth in Kogan Mobile.
Following stronger than expected results in FY17, and the acceleration in growth in various parts of our portfolio, the Board will not be providing formal EBITDA guidance for FY18. However, the Board will provide updates on the trading performance of the business around the time of the quarterly cash flow releases (Appendix 4C).
FY18 has started well, with the July 2017 results, which are unaudited, showing year on year revenue growth of 34.9%.
Further growth of Active Customer base
Increased value from investment in SAP and automation
Private Label growth
Continued growth of Third Party Domestic
Further growth in Kogan Mobile
Launch of Kogan Insurance and Kogan NBN
WE EXPECT FY18 TO BENEFIT FROM:

31
Dividend policy for FY18 and beyond
The payment of dividends by Kogan.com is at the discretion of the Board and will be a function of a number of factors, including the general business environment; the operating results and the financial condition of Kogan.com; future funding requirements; capital management initiatives; tax considerations (including the level of franking credits available); any contractual, legal or regulatory restrictions on the payment of dividends by Kogan.com; and any other factors the Directors may consider relevant.
It is the current intention of the Directors to target a payout ratio of 60-80% of Kogan.com’s NPAT from FY18 onward.
No assurances can be given by any person, including the Directors, about the payment of any dividend and the level of franking on any such dividend in future periods. There may be periods in respect of which dividends are not paid.
DIVIDEND
Payment dateRecord dateFranking (%)DPS (cents)
Final dividend 4 September 201725 August 2017100.03.80
As a result of the significant outperformance in FY17, the Board has declared a fully franked final dividend of 3.80 cents per share, with a record date of 25 August 2017 and a payment date of 4 September 2017.

32
Q&A
33
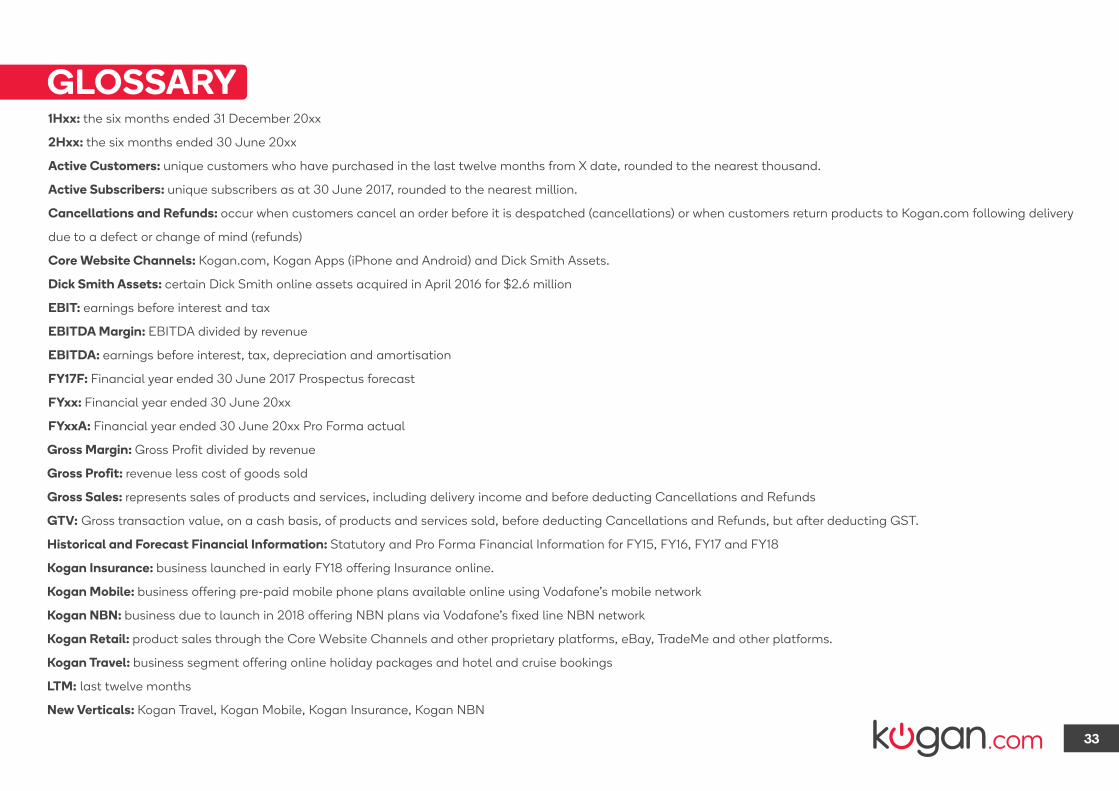
GLOSSARY1Hxx: the six months ended 31 December 20xx
2Hxx: the six months ended 30 June 20xx
Active Customers: unique customers who have purchased in the last twelve months from X date, rounded to the nearest thousand.
Active Subscribers: unique subscribers as at 30 June 2017, rounded to the nearest million.
Cancellations and Refunds: occur when customers cancel an order before it is despatched (cancellations) or when customers return products to Kogan.com following delivery
due to a defect or change of mind (refunds)
Core Website Channels: Kogan.com, Kogan Apps (iPhone and Android) and Dick Smith Assets.
Dick Smith Assets: certain Dick Smith online assets acquired in April 2016 for $2.6 million
EBIT: earnings before interest and tax
EBITDA Margin: EBITDA divided by revenue
EBITDA: earnings before interest, tax, depreciation and amortisation
FY17F: Financial year ended 30 June 2017 Prospectus forecast
FYxx: Financial year ended 30 June 20xx
FYxxA: Financial year ended 30 June 20xx Pro Forma actual
Gross Margin: Gross Profit divided by revenue
Gross Profit: revenue less cost of goods sold
Gross Sales: represents sales of products and services, including delivery income and before deducting Cancellations and Refunds
GTV: Gross transaction value, on a cash basis, of products and services sold, before deducting Cancellations and Refunds, but after deducting GST.
Historical and Forecast Financial Information: Statutory and Pro Forma Financial Information for FY15, FY16, FY17 and FY18
Kogan Insurance: business launched in early FY18 offering Insurance online.
Kogan Mobile: business offering pre-paid mobile phone plans available online using Vodafone’s mobile network
Kogan NBN: business due to launch in 2018 offering NBN plans via Vodafone’s fixed line NBN network
Kogan Retail: product sales through the Core Website Channels and other proprietary platforms, eBay, TradeMe and other platforms.
Kogan Travel: business segment offering online holiday packages and hotel and cruise bookings
LTM: last twelve months
New Verticals: Kogan Travel, Kogan Mobile, Kogan Insurance, Kogan NBN

34
GLOSSARYNPATA: Net profit after tax and amortisation on the Dick Smith Assets.
Private Label: products sold under brands owned by Kogan.com
Pro Forma EBITDA/results: represents the results of the business after Pro Forma adjustments, consistent with Prospectus Pro Forma, and removing unrealised FX gains or
losses.
Prospectus: the replacement Prospectus of Kogan.com Ltd dated 24 June 2016.
Third Party Branded Domestic: brands owned by third parties, for which products are sourced domestically
Third Party Branded International: brands owned by third parties, for which products are sourced internationally
Working Capital: total of trade and other receivables, inventories and prepayments which are included within other assets, less trade and other payables, deferred income,
employee benefits and current provisions

ANNEXURE 1 FY17 RECONCILIATION OF GROSS SALES TO REVENUEAt 30 June 2017, presales were $5.2 million, representing Gross Sales yet to be dispatched.
$m FY17
Refunds and cancellations (17.9)
Gross sales 308.8Change in presales1 (1.4)
Statutory revenue 289.5
Notes:1. Change in presales relates to the movement in deferred income, which is recognised on product sales that are yet to be dispatched, but for which cash has been received.
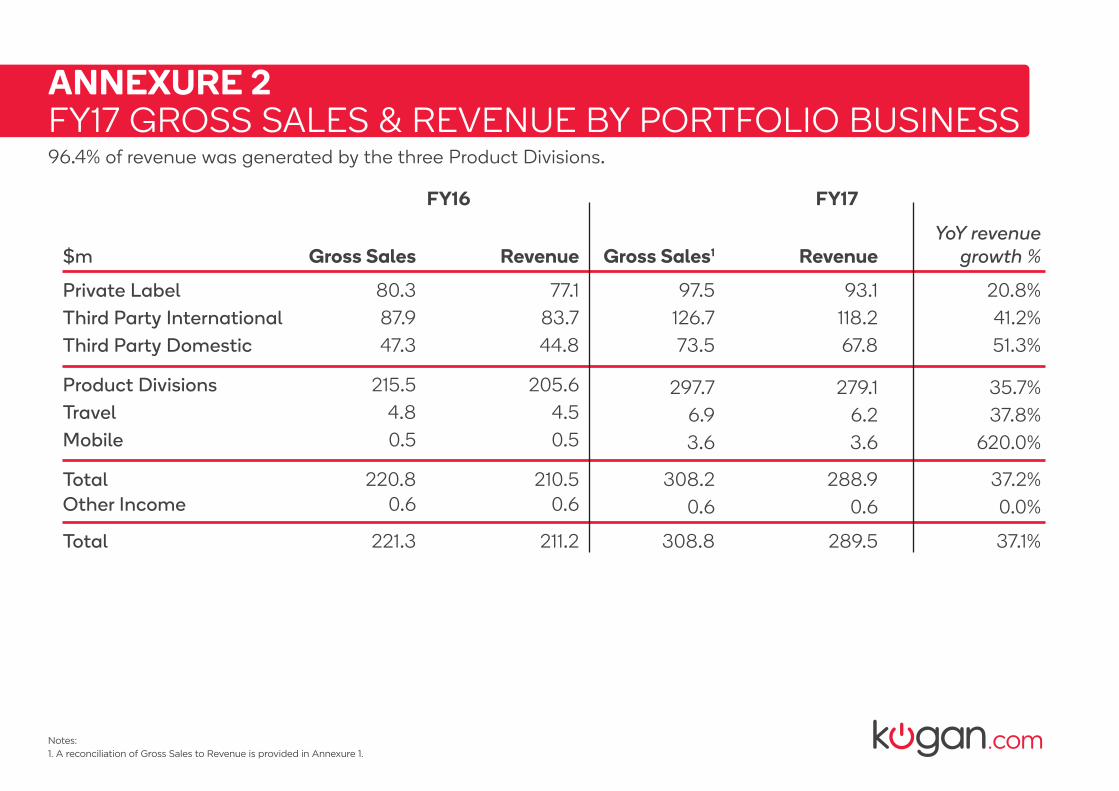
ANNEXURE 2 FY17 GROSS SALES & REVENUE BY PORTFOLIO BUSINESS
Gross Sales Gross Sales1$m Revenue RevenueYoY revenue
growth %
FY16 FY17
Private Label
Product Divisions
Total
Total
Other Income
Third Party International
Travel
Third Party Domestic
Mobile
80.3 97.5
297.7215.5
220.8
221.3
0.6
87.9 126.7
6.9
308.2
4.8
47.3 73.5
3.6
0.6
308.8
0.5
77.1 93.1 20.8%
279.1 35.7%205.6
210.5
211.2
0.6
83.7 118.2 41.2%
6.2 37.8%
288.9 37.2%
4.5
44.8 67.8 51.3%
3.6 620.0%
0.6 0.0%
289.5 37.1%
0.5
Notes:1. A reconciliation of Gross Sales to Revenue is provided in Annexure 1.
96.4% of revenue was generated by the three Product Divisions.

Pro Forma EBITDA of $13.2 million represents 191.3% of the full year Prospectus Forecast Pro Forma EBITDA of $6.9 million.
$mStatutory
FY17Transaction
costs1Pro Forma
actual FY17Unrealised FX
gain or loss2
Revenue
Gross Profit
EBITDA
Unrealised FX gain or loss
EBIT
Variable costs
Depreciation & amortisation
People costs
Total operating costs
Cost of Sales
Gross Margin %
EBITDA margin %
Interest
PBT
Marketing costs
Other expenses
289.5
51.7
9.5
5.7
(10.5)
(3.8)
(0.7) 0.7
0.7
0.7
0.7
0.0
(13.4)
(41.5)
(237.8)
17.9%
3.3%
0.5
6.1
(10.6)
(7.0)
- -
- -
3.0
3.0
- -
-
-
1.2
3.0
- -
- -
-
-
3.0
- -
-
-
--
-
1.8
289.5
51.7
13.2
9.4
(10.5)
(3.8)
(12.2)
(38.5)
(237.8)
17.9%
4.6%
0.5
9.8
(10.6)
(5.2)
Notes:1. Transaction costs: adjustments to remove balances included in the Statutory figures which relate to the IPO.2. Adjustment to remove the impact of the unrealised FX loss on forward exchange contracts at 30 June 2017.
ANNEXURE 3 STATUTORY RECONCILIATION TO PRO FORMA RESULTS


