36
FY2015 Annual Results GROWING BEYOND BOUNDARIES

FY2015 Annual Results
GROWING BEYOND BOUNDARIES
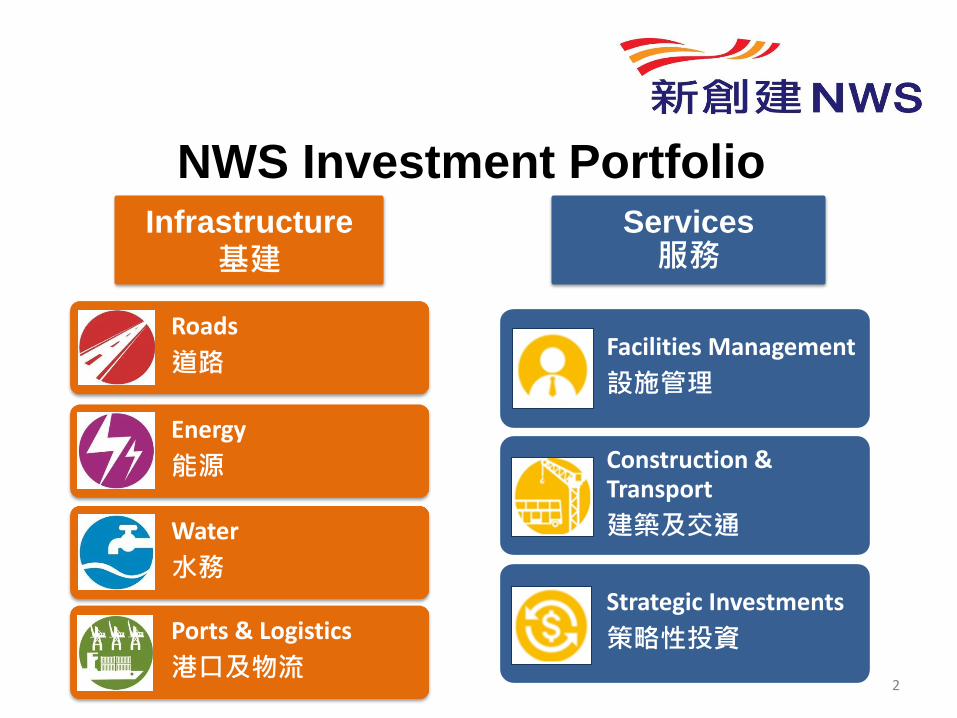
Infrastructure
基建
Roads
道路
Energy
能源
Water
水務
Ports & Logistics
港口及物流
Services 服務
Facilities Management
設施管理
Construction & Transport
建築及交通
Strategic Investments
策略性投資
NWS Investment Portfolio
2

Financial Summary
For the year ended 30 June 2015
(HK$’M)
2014
(HK$’M)
Change %
Fav./(Unfav.)
Revenue 24,491.8 21,443.0 14
Attributable Operating Profit
(AOP) 4,456.6 4,379.0 2
Profit Attributable to
Shareholders (PAT) 4,477.6 4,324.9 4
Basic Earnings per share (HK$) 1.19 1.17 2
Dividend per share (HK$) 0.60 0.58 3
Net Assets 46,187.7 43,043.4 7
3

Financial Position
Total cash and bank balances: HK$10.4 billion
Total debt: HK$16.8 billion
Net debt position: HK$6.4 billion
Net gearing ratio: 14% (23% as at 30 June 2014)
(As at 30 June 2015)
4

2,087 1,901
2,292 2,556
0
500
1,000
1,500
2,000
2,500
3,000
3,500
4,000
4,500
FY2014 FY2015
Hong Kong
Mainland China, Macau & Others
HK$’M
(48%)
(57%) (52%)
1,951 1,832
2,428 2,625
0
500
1,000
1,500
2,000
2,500
3,000
3,500
4,000
4,500
FY2014 FY2015
Infrastructure
Services
(55%)
HK$’M
Attributable Operating Profit
By Segment By Region
(59%)
(41%) (43%) (45%)
4,457 4,379 4,457 4,379
5

Ports & Logistics
Energy Roads
Water
6

Roads
19 Roads and related projects in Guangdong,
Guangxi, Shanxi, Zhejiang and Tianjin
1 Tunnel project in Hong Kong
Energy
3 Power plants in the PRC
1 Coal distributor in Guangzhou
Water
28 Water treatment projects in the PRC and
Macau
1 Incineration plant in Shanghai
2 Sludge treatment projects in the PRC
1 Landfill project in Hong Kong
5 Technical consultancy companies in the
PRC and Hong Kong
2 Strategic investments in Chongqing
Ports &
Logistics
3 Port projects in Xiamen and Tianjin
1 Airport project in Beijing
1 Global aircraft leasing project
2 Logistics centres in Hong Kong
1 Rail container terminals project in the PRC
Total
Projects 71 7
As at 30 June 2015

ROADS ENERGY WATER PORTS &
LOGISTICS
AOP by Segment
For the year ended 30 June
2015
(HK$’M)
2014
(HK$’M)
Change %
Fav./(Unfav.)
Roads 1,201.0 1,126.7 7
Energy 256.2 384.0 (33)
Water 375.2 355.7 5
Ports & Logistics 792.5 561.6 41
Total 2,624.9 2,428.0 8
8

ROADS
27%
FY2015 AOP
1,127 1,201
0
200
400
600
800
1,000
1,200
FY2014 FY2015
(+7%)
25%
FY2014 AOP
AOP – Roads
HK$’M
9

Toll revenue growth from rising traffic and shifting traffic mix on major expressways (“Expy”)
Traffic growth driven by local development, urbanization and road system improvements
ROADS
Hangzhou Ring Road 杭州繞城公路 up 7%
Beijing-Zhuhai Expy (Guangzhou-Zhuhai Section) 京珠高速公路 (廣珠段) up 9%
Tangjin Expy (Tianjin North Section) ("TJE") 唐津高速公路 (天津北段) up 10%
Guangdong projects up 11%; Unitoll System implemented since Jun 2014
TJE up 19%; normal operations resumed in Dec 2014 after expansion works
Guangzhou Dongxin Expy 廣州市東新高速公路 up 35%; new interchange fully
operational in Aug 2015
Highlights – Roads
10

ENERGY
9%
FY2014 AOP
6%
FY2015 AOP
384 256
0
100
200
300
400
FY2014 FY2015
(-33%)
AOP – Energy
HK$’M
11

Macau Power divestment completed in Jul 2014
Challenging operating environment for coal-fired power plants in Mainland China
AOP down 22% after excluding the contribution from Macau Power
Electricity sales volume down 12% amid policy support for hydro-power and
weakening local demand
Unfavourable sales impact partly mitigated by falling fuel costs
Highlights – Energy
ENERGY
12

WATER
8%
FY2015 AOP
8%
FY2014 AOP
356 375
0
100
200
300
400
FY2014 FY2015
(+5%)
AOP – Water
HK$’M
13

Sino French Water 中法水務 delivered healthy growth of 13%
Chongqing Water Group contribution down 12%
Full-year contribution from Jiangsu Water Company
Mainland China projects maintained steady growth in treatment volume
Tariff hikes:
• Nanchang Water Plant up 48% (effective May 2014)
• Shanghai Spark Water Plant up 31% (effective Aug 2014)
• Macau Water Plant up 5.6% (effective Aug 2014)
Waste water tariff down 14.5% (backdated to 2014)
Highlights – Water
WATER
14

PORTS &
LOGISTICS
18%
FY2015 AOP
13%
FY2014 AOP
562 793
0
200
400
600
800
FY2014 FY2015
(+41%)
AOP – Ports & Logistics
HK$’M
15
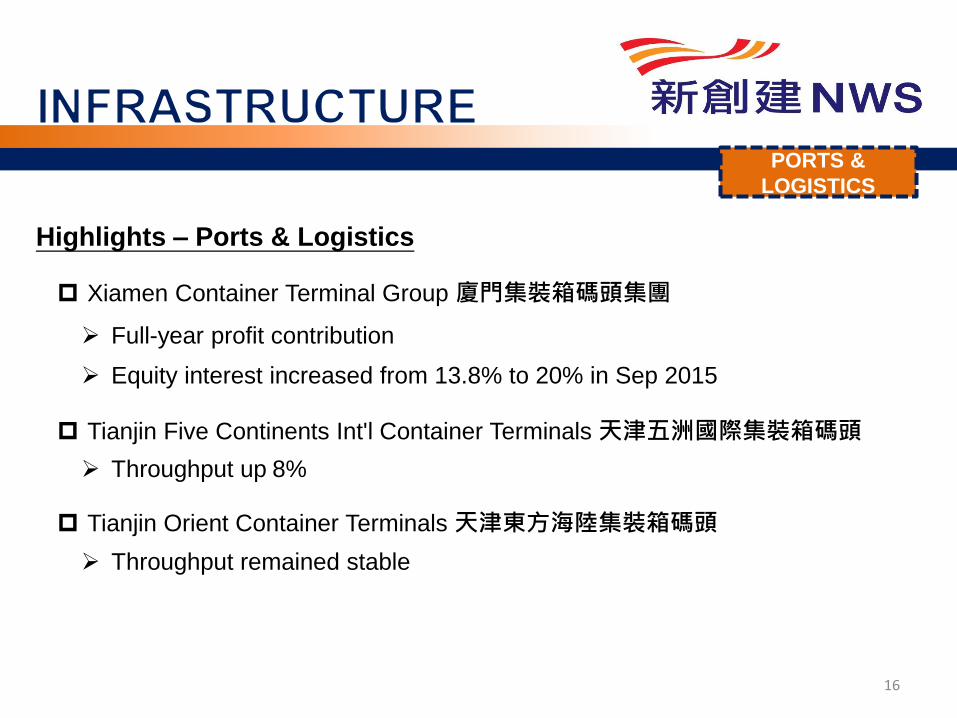
Xiamen Container Terminal Group 廈門集裝箱碼頭集團
Tianjin Five Continents Int'l Container Terminals 天津五洲國際集裝箱碼頭
Tianjin Orient Container Terminals 天津東方海陸集裝箱碼頭
Full-year profit contribution
Equity interest increased from 13.8% to 20% in Sep 2015
Throughput up 8%
Throughput remained stable
Highlights – Ports & Logistics
PORTS &
LOGISTICS
16

Full-year profit contribution
Passengers throughput reached 89M
Promising growth in 1H2015:
• Passenger volumes up 6%
• Non-aeronautical revenue up 21%
Highlights – Ports & Logistics (Cont’d)
PORTS &
LOGISTICS
Beijing Capital International Airport (BCIA)
北京首都國際機場 (首都機場)
BCIA
17

PORTS &
LOGISTICS
Goshawk Aviation Limited (Goshawk)
Highlights – Ports & Logistics (Cont’d)
Acquisition of 40% equity interest in
Feb 2015 (fleet of 27 aircraft)
Fleet size increased to 40 as at 30 Jun 2015
(Target to exceed 50 by the end of 2015)
Immediate cash flow and profit contribution
Performance encouraging
Goshawk
18

PORTS &
LOGISTICS
Goshawk’s portfolio as at 30 Jun 2015
Highlights – Ports & Logistics (Cont’d)
Asia 44%
Europe 38%
Australia 13%
America
5%
A320 52%
B737 33%
A330 5%
Others 10%
Fleet size: 40 aircraft Geographical Spread 19
Asset Under Management: USD1.6 billion

PORTS &
LOGISTICS
ATL Logistics Centre
NWS Kwai Chung Logistics Centre
ATL Logistics Centre
Highlights – Ports & Logistics (Cont’d)
99.5% occupancy rate
Average rental up 17%
100% occupancy rate
20

PORTS &
LOGISTICS
China United Int’l Rail Containers (CUIRC)
Terminals in operation
• Kunming • Chongqing • Chengdu • Zhengzhou
• Qingdao • Wuhan • Xian • Dalian
Terminals under construction
• Tianjin • Urumqi
Highlights – Ports & Logistics (Cont’d)
Throughput up 12%
Regular Euro block-train services from
Chongqing, Chengdu, Zhengzhou and Wuhan
Chongqing terminal expansion to be completed
by the end of 2015
Tianjin and Urumqi terminals operational
by the end of 2016
Will benefit from “One Belt, One Road” initiative
21

Strategic Investments Facilities Management Construction & Transport
22
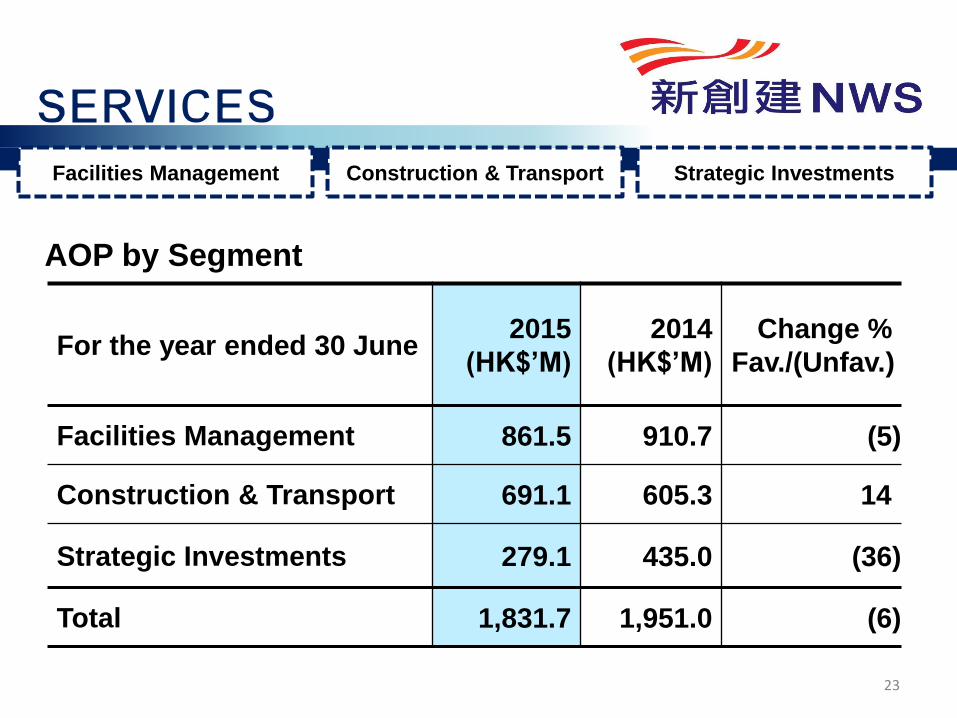
Facilities Management Construction & Transport Strategic Investments
AOP by Segment
For the year ended 30 June 2015
(HK$’M)
2014
(HK$’M)
Change %
Fav./(Unfav.)
Facilities Management 861.5 910.7 (5)
Construction & Transport 691.1 605.3 14
Strategic Investments 279.1 435.0 (36)
Total 1,831.7 1,951.0 (6)
23
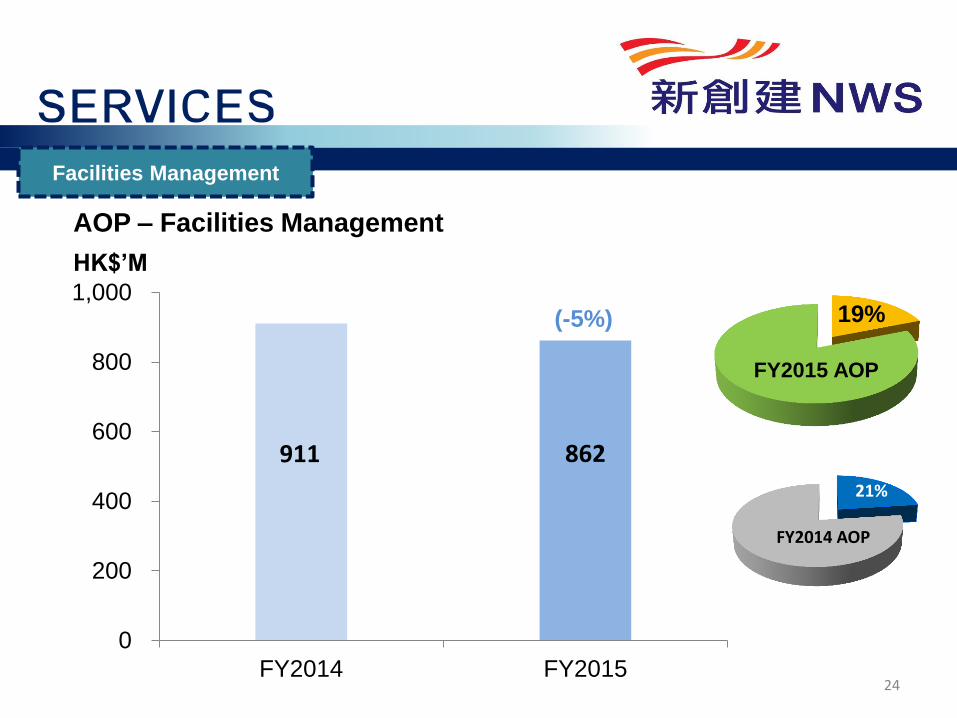
Facilities Management
19%
FY2015 AOP
21%
FY2014 AOP
911 862
0
200
400
600
800
1,000
FY2014 FY2015
(-5%)
AOP – Facilities Management
HK$’M
24

Facilities Management
HKCEC
Revenue up 6%
Patronage up 8%
Over 1,110 events held
Free Duty
Overall performance impacted by rental increase and reduction of
high-spending Mainland visitors
Negative impacts partly mitigated by growth at Lok Ma Chau Station
Highlights – Facilities Management
HKCEC
25

Construction & Transport
16%
FY2015 AOP
14%
FY2014 AOP
605 691
0
100
200
300
400
500
600
700
FY2014 FY2015
(+14%)
AOP – Construction & Transport
HK$’M
26

Construction
Revenue up 18%
Gross contract-on-hand: HK$71.0 billion
Remaining value: HK$50.9 billion
Transport
Passengers down 13% during “Occupy Central Movement”
Passengers down 6% since opening of MTR West Island Line
Earnings contribution down 27%
Highlights – Construction & Transport
Construction & Transport
27
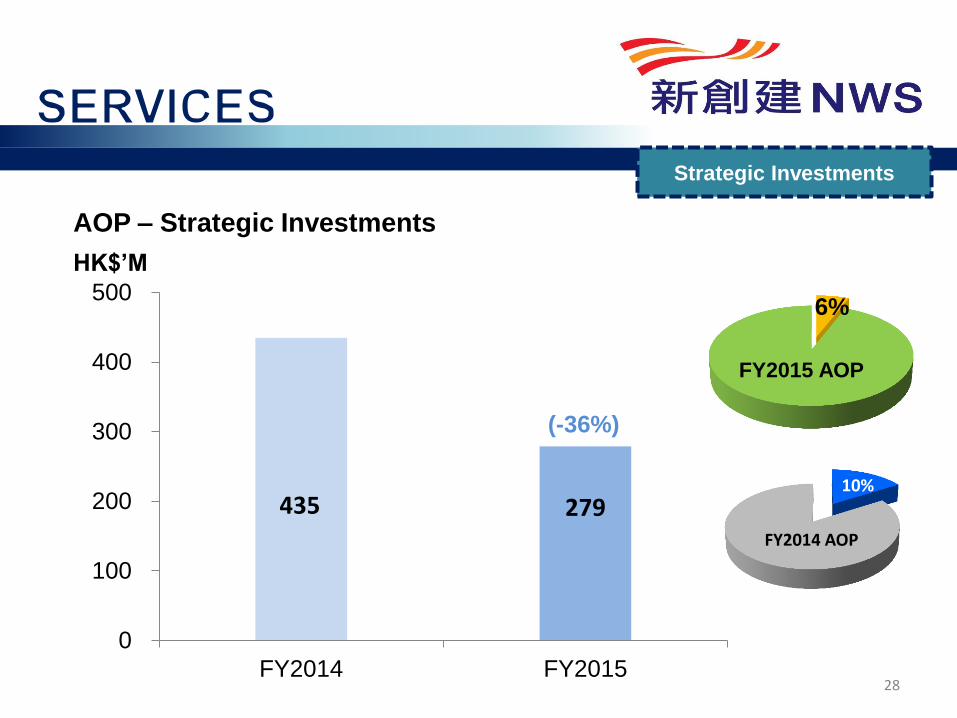
Strategic Investments
6%
FY2015 AOP
10%
FY2014 AOP
435 279
0
100
200
300
400
500
FY2014 FY2015
(-36%)
AOP – Strategic Investments
HK$’M
28

PAT & AOP
0
1
2
3
4
5
6
PAT
AOP
CAGR: 10.2%
CAGR: 8.0% H
K$’ B
illi
on
29

Net Assets
$9.9B
0
5
10
15
20
25
30
35
40
45
50
HK
$’ B
illi
on
CAGR: 15.0%
$46.2B
30

Roads
Ports & Logistics
Growth potentials of Tangjin Expressway (Tianjin North Section)
Full implementation of toll-by-weight in Guangdong Province in Jun 2015
Draft amendment of “Regulation on the Administration of Toll Roads”
to provide clearer directives
Aviation business to benefit from continuous globalization
CUIRC to ride on “One Belt, One Road” concept
Additional 6.2% equity interest in XCTG
Core business – quality growth driven by a combination of organic
and acquisition strategies
31
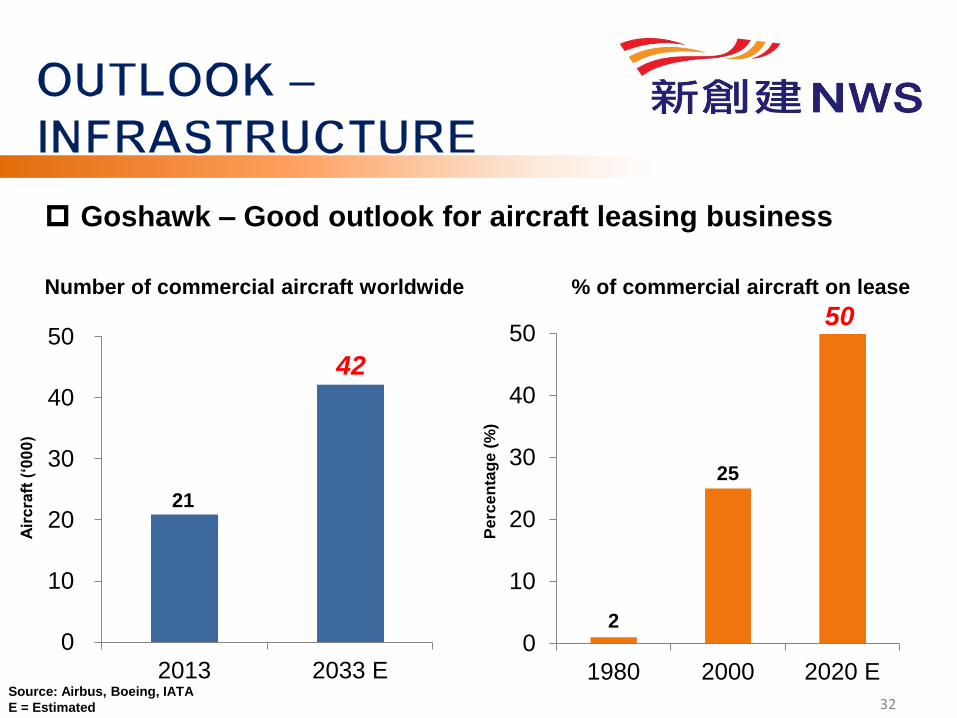
Goshawk – Good outlook for aircraft leasing business
32
21
42
0
10
20
30
40
50
2013 2033 E
(55%)
Number of commercial aircraft worldwide
2
25
50
0
10
20
30
40
50
1980 2000 2020 E
(55%)
% of commercial aircraft on lease
Source: Airbus, Boeing, IATA
E = Estimated
Air
cra
ft (
‘00
0)
Pe
rce
nta
ge (
%)

Free Duty
Construction
Outlook remains challenging despite continuous increase in passenger
throughput at Lok Ma Chau Station
Ferry terminal concessions renewed until 2018
Vibrant construction market for the foreseeable future
Full order book
33

Gleneagles Hong Kong Hospital (港怡醫院)
Superstructure construction underway
Senior management on board
Medical Board formed
Credentialing process for doctors and specialists
established
Target to open in early 2017
Gleneagles Hong Kong Hospital
34

NWS Holdings Limited (“NWS”) makes no representation or warranty of any kind, express,
implied or statutory regarding the accuracy or completeness of the information contained. The
information in this presentation is prepared solely for information purposes only.
Users and readers are cautioned not to place reliance on forward-looking information
contained in this presentation. NWS is under no obligation whatsoever to update or revise any
forward-looking statements to reflect events or circumstances that arise subsequent to the
release of this presentation.
This presentation should not be treated or relied upon to form the basis of any investment
decision. Neither does it constitute or form part of any advice to sell or an invitation to
subscribe for, hold or purchase any securities or any other investments.
NWS and/or its affiliated companies and/or their respective employees or Agents will not
accept any responsibility nor liability for any damages or losses of any kind arising from the
reliance or use of the information contained herein.
35

Q&A Session
36


