49
© 2017 NIPPON STEEL & SUMIKIN BUSSAN CORPORATION All Rights Reserved. FY2016 Earnings Summary and Progress of Mid-term Business Plan 1 May. 23, 2017 President Kenji Hiwatari
| Date post: | 18-Jun-2018 |
| Category: |
Documents |
| Upload: | vuongthien |
| View: | 217 times |
| Download: | 0 times |
© 2017 NIPPON STEEL & SUMIKIN BUSSAN CORPORATION All Rights Reserved.
FY2016 Earnings Summary and
Progress of Mid-term Business Plan
1
May. 23, 2017
President Kenji Hiwatari
© 2017 NIPPON STEEL & SUMIKIN BUSSAN CORPORATION All Rights Reserved.
Agenda
2
1. FY2016 Results & FY2017 Forecast
2. The Commencement of Discussion for the
Partial Acquisition of the Steel Products
Business of the Mitsui & Co. group by
NSSB, and for the Additional Purchase of
NSSB Shares by Mitsui & Co., Ltd.
3. Progress of Mid-term Business Plan 2017
4. Appendix
© 2017 NIPPON STEEL & SUMIKIN BUSSAN CORPORATION All Rights Reserved.
1. FY2016 Results & FY2017 Forecast
3

© 2017 NIPPON STEEL & SUMIKIN BUSSAN CORPORATION All Rights Reserved.
Highlight: FY2016 Results
4
Sales
1,076.9 939.1 978.7
1,027.6
991.7 862.6
2,104.6
1,930.8
FY14 FY15 FY16
17.1
13.6
17.3
13.4
15.4
13.6
30.5 29.0
30.9
FY14 FY15 FY16
Sales declined: Mainly caused by ASP dropped in 1st half of the Steel business.
Profit increased: Due to increased income from the Steel, Textiles and Food Stuff
business, covering the decline in industrial machinery and infrastructure business
1st half
1,841.3
9.0 7.4
9.4
8.3 9.8
8.7
17.4 17.3 18.2
FY14 FY15 FY16
Ordinary
Profit Net Income* ¥ billion
*Profit attribute to owners of parent
¥ billion ¥ billion
1st half 1st half
2nd half 2nd half 2nd half
© 2017 NIPPON STEEL & SUMIKIN BUSSAN CORPORATION All Rights Reserved.
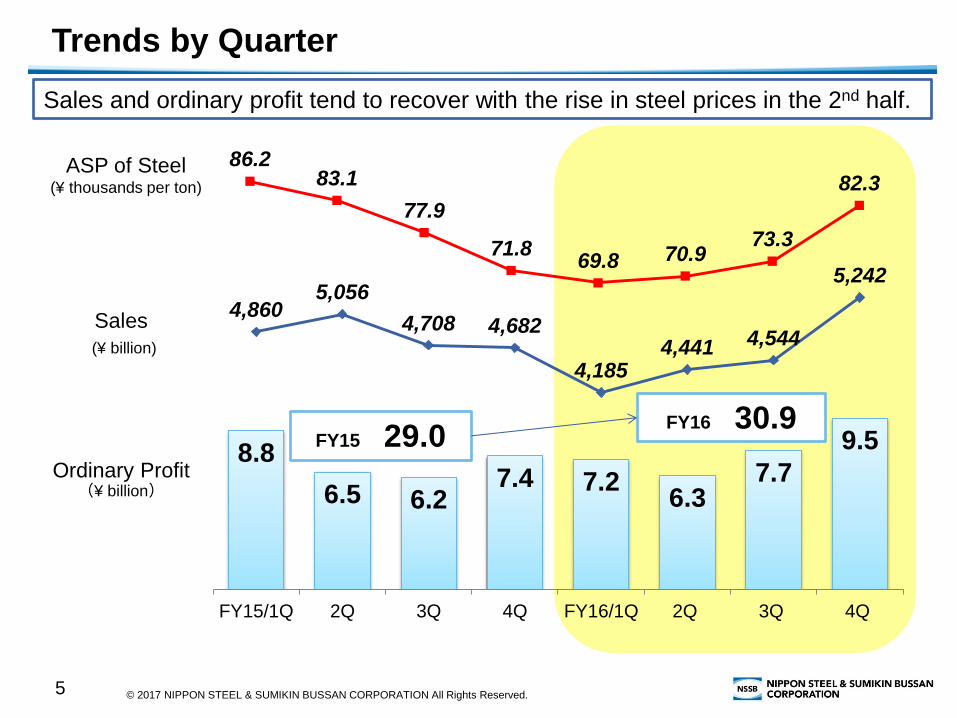
86.2 83.1
77.9
71.8 69.8 70.9
73.3
82.3
Trends by Quarter
5
Sales and ordinary profit tend to recover with the rise in steel prices in the 2nd half.
Sales
(¥ billion)
Ordinary Profit(¥ billion)
ASP of Steel (¥ thousands per ton)
8.8
6.5 6.2 7.4 7.2
6.3 7.7
9.5
4,860 5,056
4,708 4,682
4,185 4,441 4,544
5,242
FY15/1Q 2Q 3Q 4Q FY16/1Q 2Q 3Q 4Q
FY15 29.0 FY16 30.9
© 2017 NIPPON STEEL & SUMIKIN BUSSAN CORPORATION All Rights Reserved.
Segment Results
6
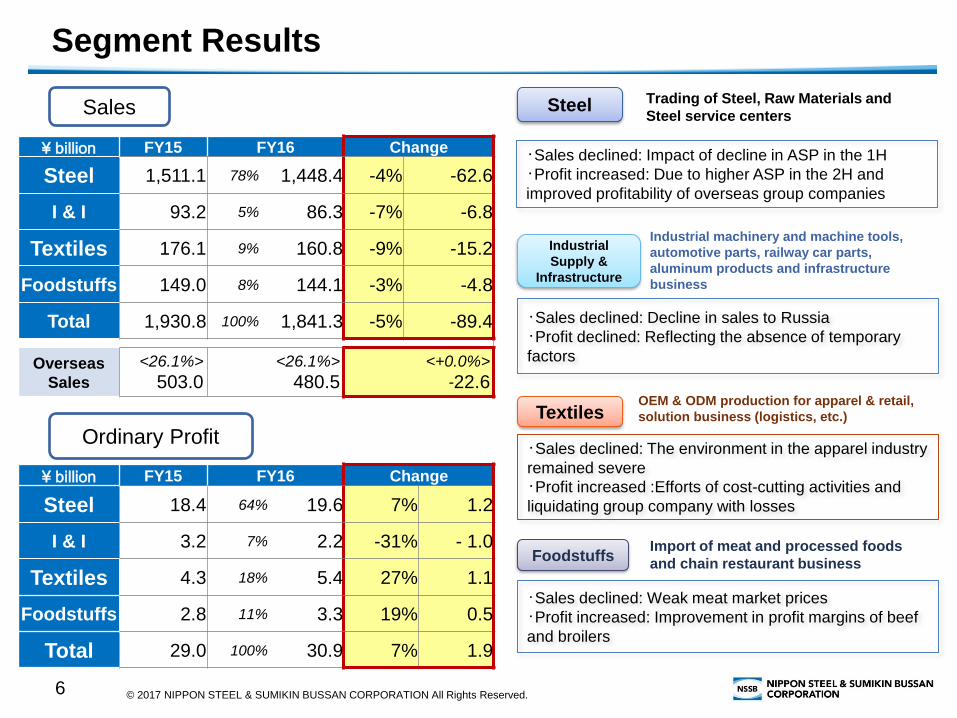
¥ billion FY15 FY16 Change
Steel 1,511.1 78% 1,448.4 -4% -62.6
I & I 93.2 5% 86.3 -7% -6.8
Textiles 176.1 9% 160.8 -9% -15.2
Foodstuffs 149.0 8% 144.1 -3% -4.8
Total 1,930.8 100% 1,841.3 -5% -89.4
Overseas
Sales
<26.1%>
503.0 <26.1%>
480.5 <+0.0%>
-22.6
・Sales declined: The environment in the apparel industry
remained severe
・Profit increased :Efforts of cost-cutting activities and
liquidating group company with losses
・Sales declined: Decline in sales to Russia
・Profit declined: Reflecting the absence of temporary
factors
・Sales declined: Weak meat market prices
・Profit increased: Improvement in profit margins of beef
and broilers
・Sales declined: Impact of decline in ASP in the 1H
・Profit increased: Due to higher ASP in the 2H and
improved profitability of overseas group companies
¥ billion FY15 FY16 Change
Steel 18.4 64% 19.6 7% 1.2
I & I 3.2 7% 2.2 -31% - 1.0
Textiles 4.3 18% 5.4 27% 1.1
Foodstuffs 2.8 11% 3.3 19% 0.5
Total 29.0 100% 30.9 7% 1.9
Sales
Ordinary Profit
Steel Trading of Steel, Raw Materials and
Steel service centers
Industrial
Supply &
Infrastructure
Industrial machinery and machine tools,
automotive parts, railway car parts,
aluminum products and infrastructure
business
Textiles OEM & ODM production for apparel & retail,
solution business (logistics, etc.)
Import of meat and processed foods
and chain restaurant business Foodstuffs
© 2017 NIPPON STEEL & SUMIKIN BUSSAN CORPORATION All Rights Reserved.
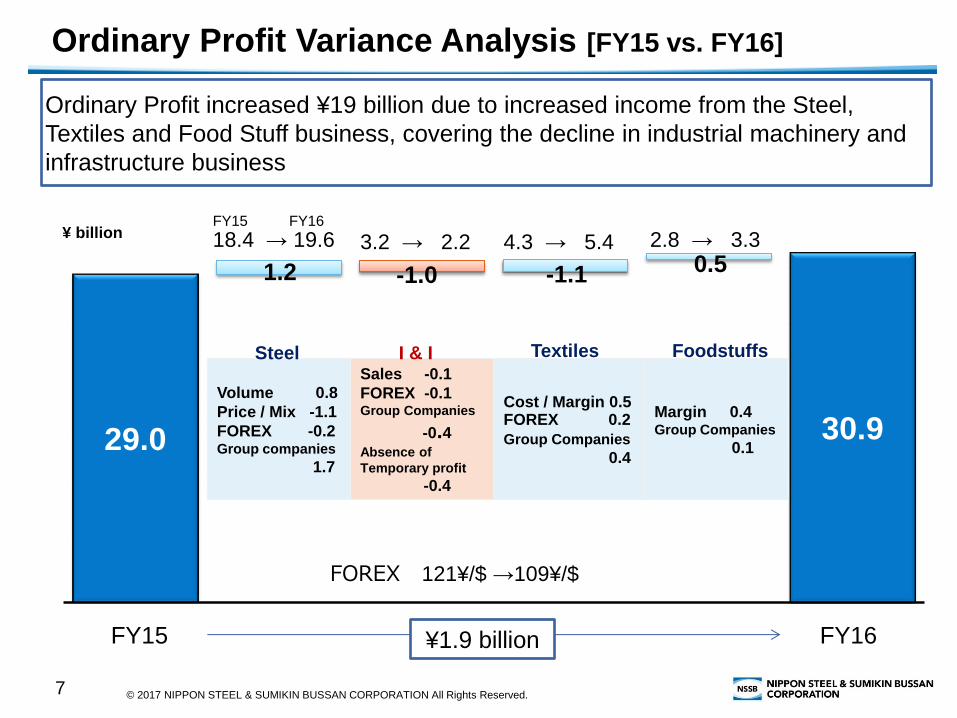
Ordinary Profit Variance Analysis [FY15 vs. FY16]
7
29.0 30.9
1.2 -1.1 0.5 -1.0
FY15 FY16
Ordinary Profit increased ¥19 billion due to increased income from the Steel,
Textiles and Food Stuff business, covering the decline in industrial machinery and
infrastructure business
¥1.9 billion
Volume 0.8
Price / Mix -1.1
FOREX -0.2 Group companies
1.7
Sales -0.1
FOREX -0.1 Group Companies
-0.4 Absence of
Temporary profit
-0.4
Cost / Margin 0.5 FOREX 0.2
Group Companies
0.4
Margin 0.4 Group Companies
0.1
¥ billion 18.4 → 19.6 3.2 → 2.2 4.3 → 5.4 2.8 → 3.3 FY15 FY16
FOREX 121¥/$ →109¥/$
Steel I & I Textiles Foodstuffs
© 2017 NIPPON STEEL & SUMIKIN BUSSAN CORPORATION All Rights Reserved.
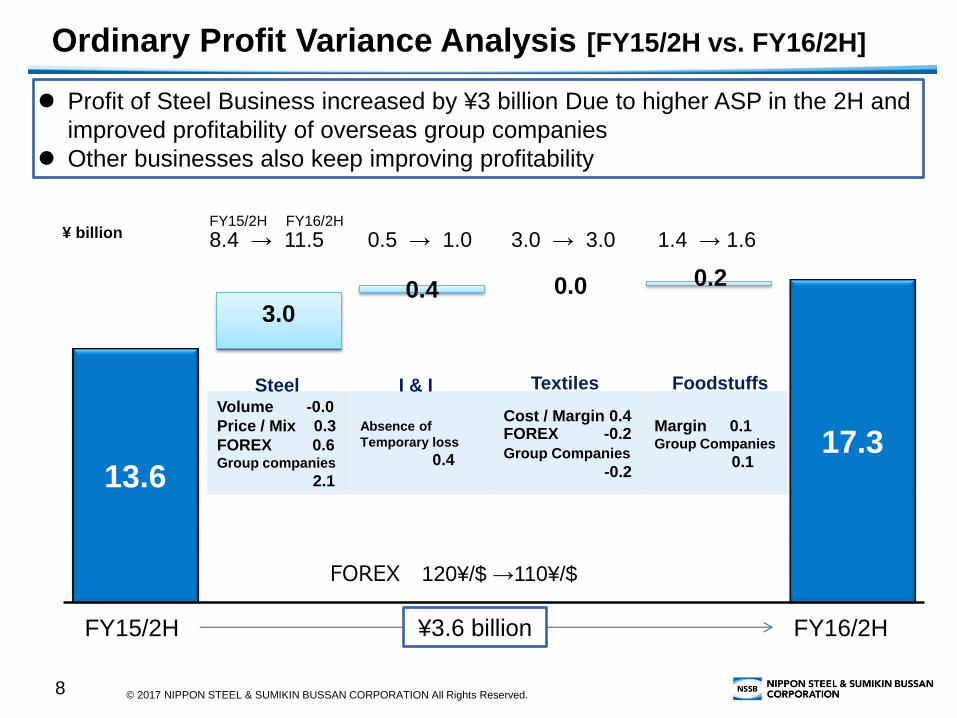
Ordinary Profit Variance Analysis [FY15/2H vs. FY16/2H]
8
13.6 17.3
3.0 0.4 0.0 0.2
FY15/2H FY16/2H
Profit of Steel Business increased by ¥3 billion Due to higher ASP in the 2H and
improved profitability of overseas group companies
Other businesses also keep improving profitability
¥3.6 billion
¥ billion 8.4 → 11.5 0.5 → 1.0 3.0 → 3.0 1.4 → 1.6 FY15/2H FY16/2H
FOREX 120¥/$ →110¥/$
Volume -0.0
Price / Mix 0.3
FOREX 0.6 Group companies
2.1
Absence of
Temporary loss
0.4
Cost / Margin 0.4 FOREX -0.2
Group Companies
-0.2
Margin 0.1 Group Companies
0.1
Steel I & I Textiles Foodstuffs
© 2017 NIPPON STEEL & SUMIKIN BUSSAN CORPORATION All Rights Reserved.
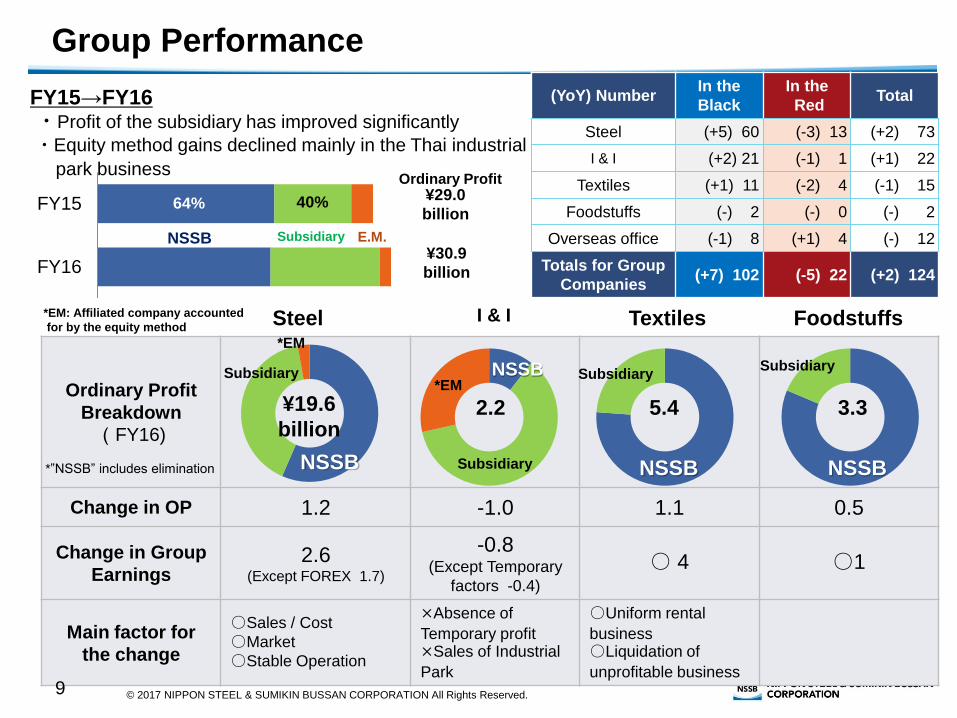
Ordinary Profit
Breakdown
(FY16)
Change in OP 1.2 -1.0 1.1 0.5
Change in Group
Earnings 2.6
(Except FOREX 1.7)
-0.8 (Except Temporary
factors -0.4)
○ 4 ○1
Main factor for
the change
○Sales / Cost
○Market
○Stable Operation
×Absence of
Temporary profit ×Sales of Industrial
Park
○Uniform rental
business ○Liquidation of
unprofitable business
NSSB
Group Performance
9
FY15→FY16 ・Profit of the subsidiary has improved significantly
・Equity method gains declined mainly in the Thai industrial
park business
(YoY) Number In the
Black
In the
Red Total
Steel (+5) 60 (-3) 13 (+2) 73
I & I (+2) 21 (-1) 1 (+1) 22
Textiles (+1) 11 (-2) 4 (-1) 15
Foodstuffs (-) 2 (-) 0 (-) 2
Overseas office (-1) 8 (+1) 4 (-) 12
Totals for Group
Companies (+7) 102 (-5) 22 (+2) 124
NSSB NSSB NSSB
¥19.6
billion 2.2 5.4
3.3
FY16
FY15 64% 40%
E.M. Subsidiary NSSB
¥29.0
billion
¥30.9
billion
Ordinary Profit
Steel I & I Textiles Foodstuffs
*”NSSB” includes elimination
*EM
*EM
Subsidiary
Subsidiary
Subsidiary Subsidiary
*EM: Affiliated company accounted
for by the equity method
© 2017 NIPPON STEEL & SUMIKIN BUSSAN CORPORATION All Rights Reserved.
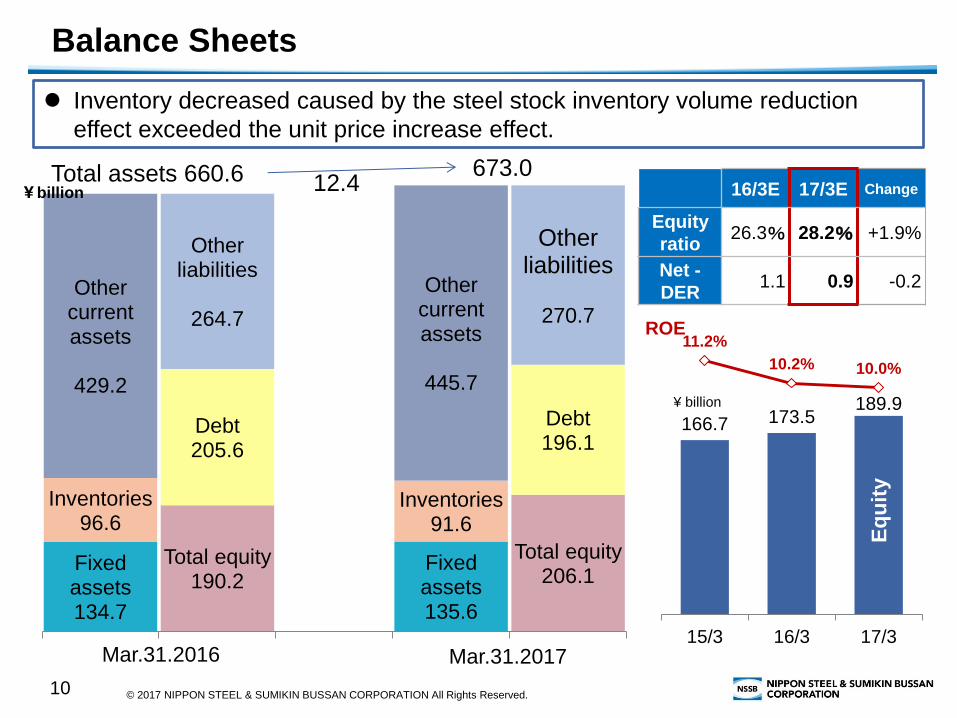
Balance Sheets
10
Total equity 190.2
Total equity 206.1
Debt 205.6
Debt 196.1
Other liabilities
264.7
Other liabilities
270.7
Fixed assets 134.7
Fixed assets 135.6
Inventories 96.6
Inventories 91.6
Other current assets
429.2
Other current assets
445.7
Total assets 660.6 673.0
Mar.31.2016
Inventory decreased caused by the steel stock inventory volume reduction
effect exceeded the unit price increase effect.
16/3E 17/3E Change
Equity
ratio 26.3% 28.2% +1.9%
Net -
DER 1.1 0.9 -0.2
12.4 ¥billion
166.7 173.5 189.9
11.2%
10.2% 10.0%
15/3 16/3 17/3
Eq
uit
y
¥ billion
ROE
Mar.31.2017
© 2017 NIPPON STEEL & SUMIKIN BUSSAN CORPORATION All Rights Reserved.
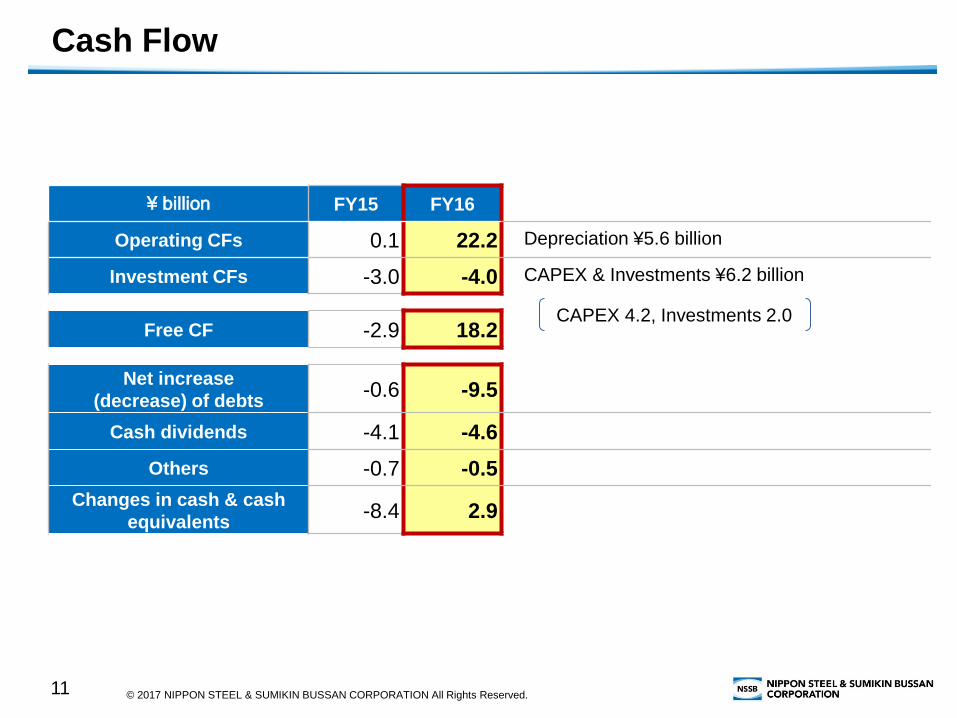
Cash Flow
11
¥ billion FY15 FY16
Operating CFs 0.1 22.2 Depreciation ¥5.6 billion
Investment CFs -3.0 -4.0 CAPEX & Investments ¥6.2 billion
Free CF -2.9 18.2
Net increase
(decrease) of debts -0.6 -9.5
Cash dividends -4.1 -4.6
Others -0.7 -0.5
Changes in cash & cash
equivalents -8.4 2.9
CAPEX 4.2, Investments 2.0
© 2017 NIPPON STEEL & SUMIKIN BUSSAN CORPORATION All Rights Reserved.
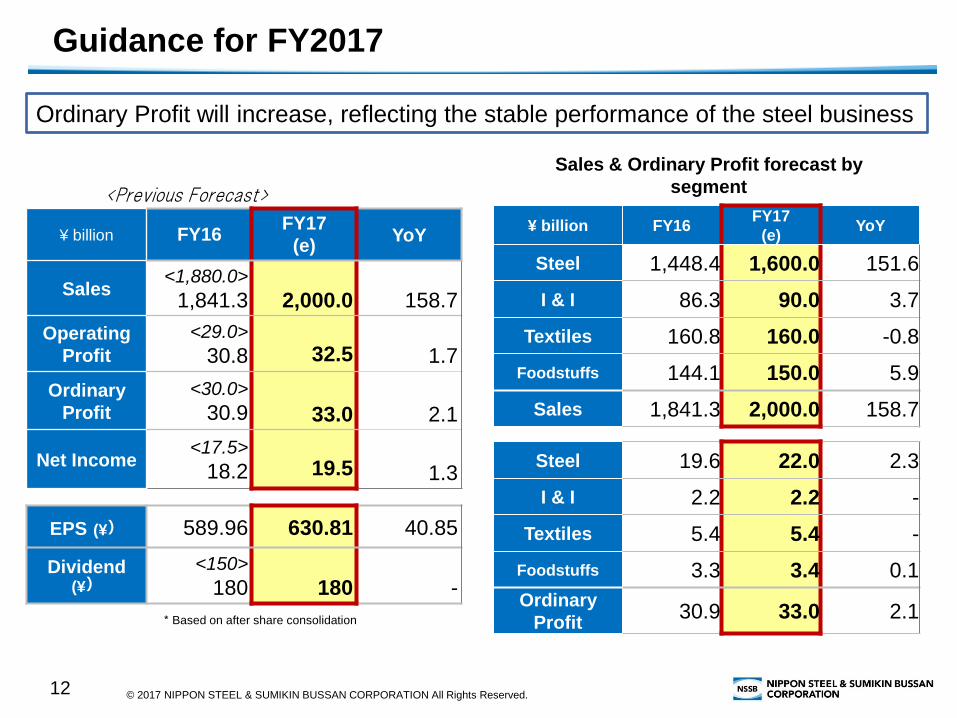
Guidance for FY2017
12
¥ billion FY16 FY17
(e) YoY
Sales <1,880.0>
1,841.3
2,000.0
158.7
Operating
Profit
<29.0>
30.8
32.5
1.7
Ordinary
Profit
<30.0>
30.9
33.0
2.1
Net Income <17.5>
18.2
19.5
1.3
EPS (¥) 589.96 630.81 40.85
Dividend (¥)
<150>
180
180
-
Ordinary Profit will increase, reflecting the stable performance of the steel business
¥ billion FY16 FY17
(e) YoY
Steel 1,448.4 1,600.0 151.6
I & I 86.3 90.0 3.7
Textiles 160.8 160.0 -0.8
Foodstuffs 144.1 150.0 5.9
Sales 1,841.3 2,000.0 158.7
Steel 19.6 22.0 2.3
I & I 2.2 2.2 -
Textiles 5.4 5.4 -
Foodstuffs 3.3 3.4 0.1
Ordinary
Profit 30.9 33.0 2.1
<Previous Forecast>
Sales & Ordinary Profit forecast by
segment
*Based on after share consolidation
© 2017 NIPPON STEEL & SUMIKIN BUSSAN CORPORATION All Rights Reserved.
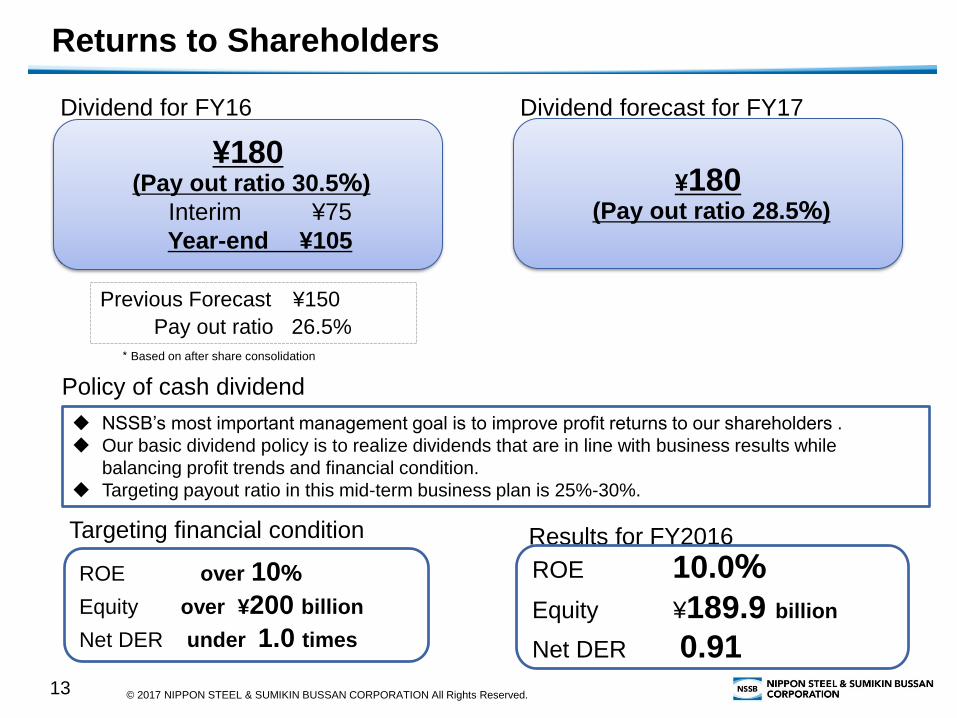
Returns to Shareholders
13
Policy of cash dividend
NSSB’s most important management goal is to improve profit returns to our shareholders .
Our basic dividend policy is to realize dividends that are in line with business results while
balancing profit trends and financial condition.
Targeting payout ratio in this mid-term business plan is 25%-30%.
Results for FY2016
ROE 10.0%
Equity ¥189.9 billion
Net DER 0.91
¥180
(Pay out ratio 30.5%)
Interim ¥75
Year-end ¥105
Dividend for FY16 Dividend forecast for FY17
¥180
(Pay out ratio 28.5%)
Previous Forecast ¥150
Pay out ratio 26.5%
*Based on after share consolidation
Targeting financial condition
ROE over 10%
Equity over ¥200 billion
Net DER under 1.0 times
© 2017 NIPPON STEEL & SUMIKIN BUSSAN CORPORATION All Rights Reserved.
2. The Commencement of Discussion for the Partial
Acquisition of the Steel Products Business of the
Mitsui & Co. group by NSSB, and for the Additional
Purchase of NSSB Shares by Mitsui & Co., Ltd.
14
© 2017 NIPPON STEEL & SUMIKIN BUSSAN CORPORATION All Rights Reserved.
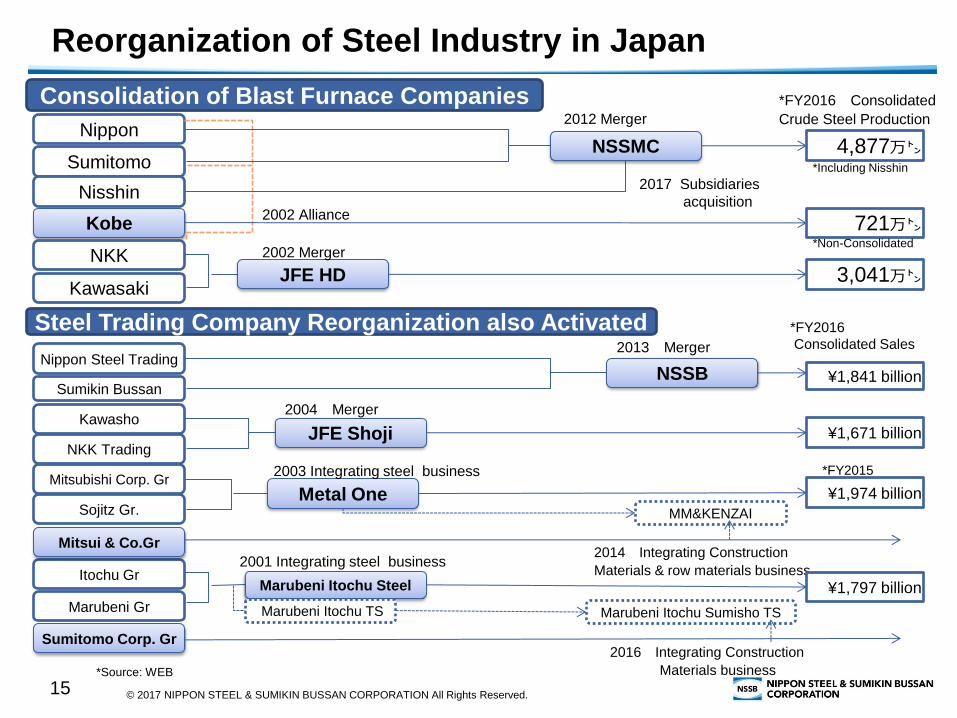
Reorganization of Steel Industry in Japan
15
Consolidation of Blast Furnace Companies
Nippon
Sumitomo
Kobe
Nisshin
NKK
Kawasaki
2002 Alliance
JFE HD
2002 Merger
2012 Merger
2017 Subsidiaries
acquisition
4,877万㌧
3,041万㌧
721万㌧
*FY2016 Consolidated
Crude Steel Production
*Including Nisshin
NSSMC
Steel Trading Company Reorganization also Activated
Nippon Steel Trading
Sumikin Bussan
Kawasho
NKK Trading
Mitsubishi Corp. Gr
Sojitz Gr.
Itochu Gr
Marubeni Gr
Sumitomo Corp. Gr
JFE Shoji
2004 Merger
Mitsui & Co.Gr
NSSB
2013 Merger
Metal One
Marubeni Itochu Steel
Marubeni Itochu Sumisho TS
MM&KENZAI
2014 Integrating Construction
Materials & row materials business
¥1,841 billion
*FY2016
Consolidated Sales
¥1,671 billion
¥1,974 billion
¥1,797 billion
*FY2015
*Source: WEB
Marubeni Itochu TS
*Non-Consolidated
2003 Integrating steel business
2001 Integrating steel business
2016 Integrating Construction
Materials business
© 2017 NIPPON STEEL & SUMIKIN BUSSAN CORPORATION All Rights Reserved.
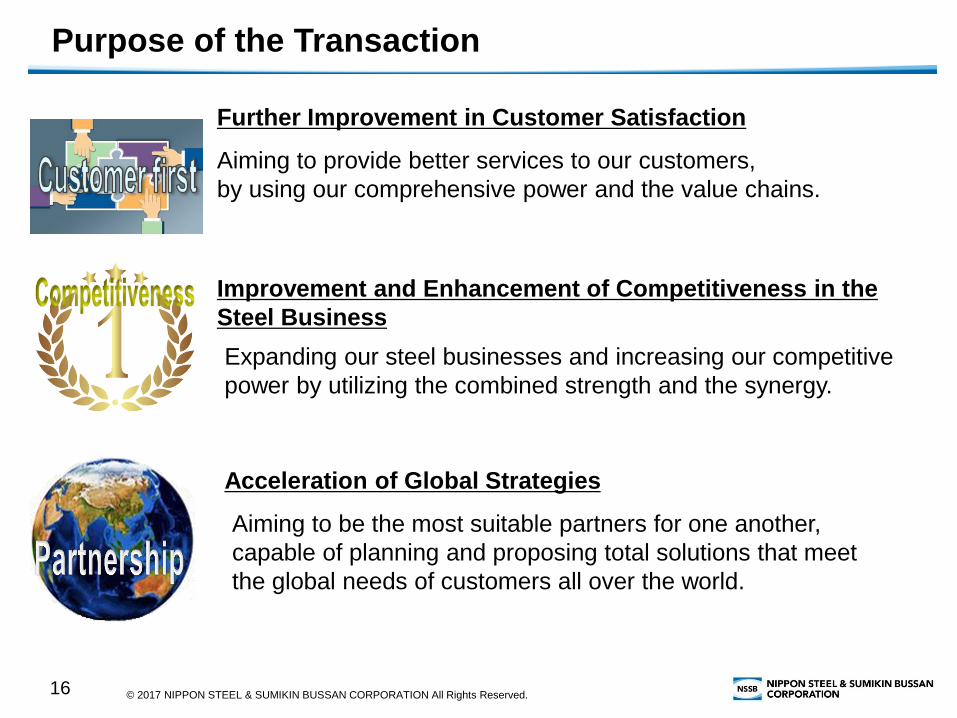
Purpose of the Transaction
16
Further Improvement in Customer Satisfaction
Aiming to provide better services to our customers,
by using our comprehensive power and the value chains.
Improvement and Enhancement of Competitiveness in the
Steel Business
Acceleration of Global Strategies
Aiming to be the most suitable partners for one another,
capable of planning and proposing total solutions that meet
the global needs of customers all over the world.
Expanding our steel businesses and increasing our competitive
power by utilizing the combined strength and the synergy.

© 2017 NIPPON STEEL & SUMIKIN BUSSAN CORPORATION All Rights Reserved.
Overview of the Transaction
17
Partial Acquisition of the Steel Products Business of the Mitsui & Co.
group by NSSB
Schedule
The specific business operations to be acquired,
The acquisition method, The consideration to be provided
Increase ownership ratio to 11% to 20% < to be equity-method investee >
Method: Combine “Acquisition from current shareholders” and
“Allocation of shares< Upper limit of Issued Share: 2,500,000 shares >”
Additional Purchase of NSSB Shares by Mitsui & Co.,
• March 22, 2017 : Execution of the basic agreement for the Discussion
• September 2017 (planned) : Execution of the final agreement for the Business Acquisition • April 2018 (planned) : Effective date of the Business Acquisition
Agenda ;

© 2017 NIPPON STEEL & SUMIKIN BUSSAN CORPORATION All Rights Reserved.
3. Progress of Mid-term Business Plan 2017
18
© 2017 NIPPON STEEL & SUMIKIN BUSSAN CORPORATION All Rights Reserved.
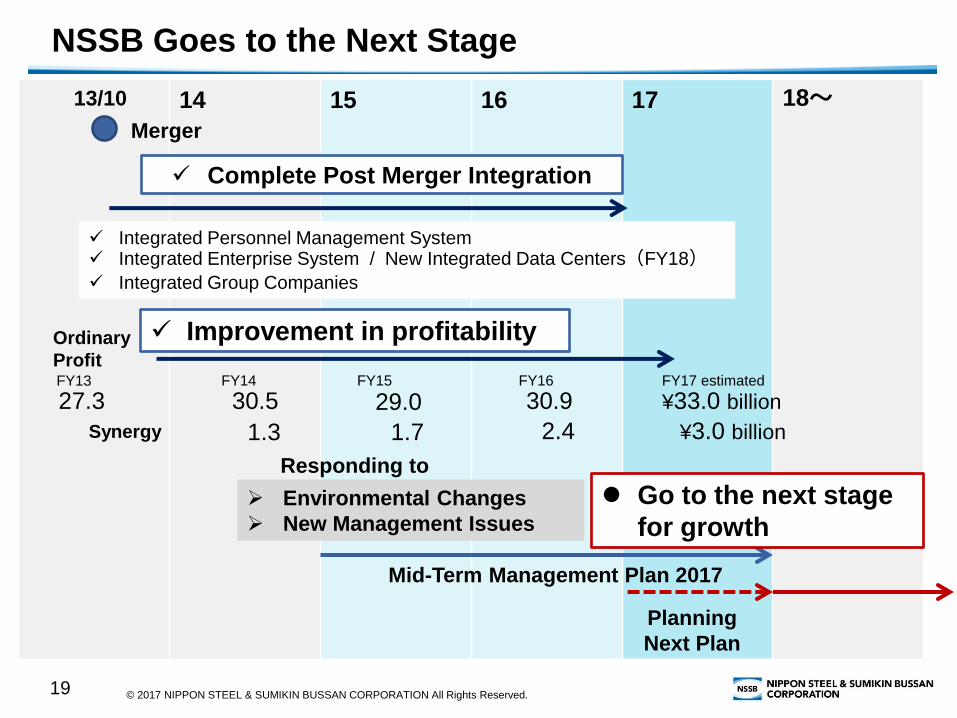
14 15 16 17 18~
NSSB Goes to the Next Stage
19
Merger
13/10
Mid-Term Management Plan 2017
Planning
Next Plan
Complete Post Merger Integration
Integrated Personnel Management System Integrated Enterprise System / New Integrated Data Centers(FY18)
Integrated Group Companies
Improvement in profitability
27.3 30.9
Ordinary
Profit FY13 FY16
Go to the next stage
for growth
Synergy 2.4 1.3 1.7
¥33.0 billion FY17 estimated
¥3.0 billion
Environmental Changes
New Management Issues
30.5 29.0 FY15 FY14
Responding to
© 2017 NIPPON STEEL & SUMIKIN BUSSAN CORPORATION All Rights Reserved.
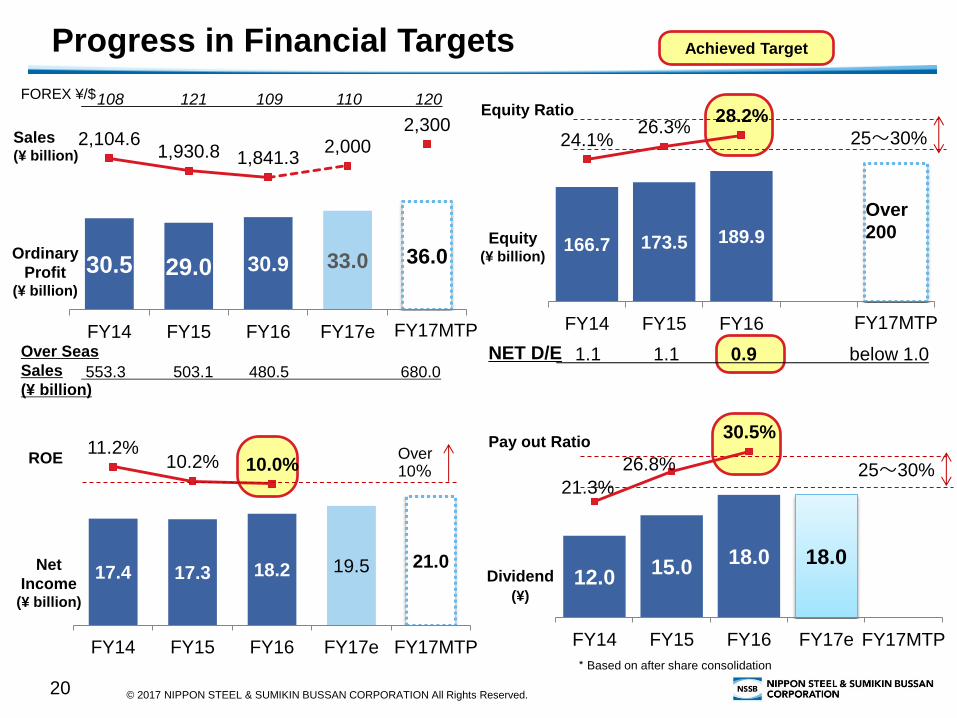
Progress in Financial Targets
20
30.5 29.0 30.9 36.0 33.0
2,104.6 1,930.8 1,841.3
2,000 2,300
FY14 FY15 FY16 FY17e
108 121 109 110 120 FOREX ¥/$
Ordinary
Profit (¥ billion)
Sales (¥ billion)
FY17MTP
17.4 17.3 18.2 21.0 19.5
11.2% 10.2% 10.0%
FY14 FY15 FY16 FY17e
Net
Income (¥ billion)
ROE
FY17MTP
166.7 173.5 189.9
24.1% 26.3%
28.2%
FY14 FY15 FY16
Equity (¥ billion)
Equity Ratio
FY17MTP
25~30%
12.0 15.0
18.0 18.0
21.3%
26.8%
30.5%
FY14 FY15 FY16 FY17e
Dividend (¥)
Pay out Ratio
FY17MTP
1.1 1.1 0.9 below 1.0 NET D/E
Over 10%
Over
200
25~30%
Achieved Target
553.3 503.1 480.5 680.0
Over Seas
Sales
(¥ billion)
*Based on after share consolidation
© 2017 NIPPON STEEL & SUMIKIN BUSSAN CORPORATION All Rights Reserved.
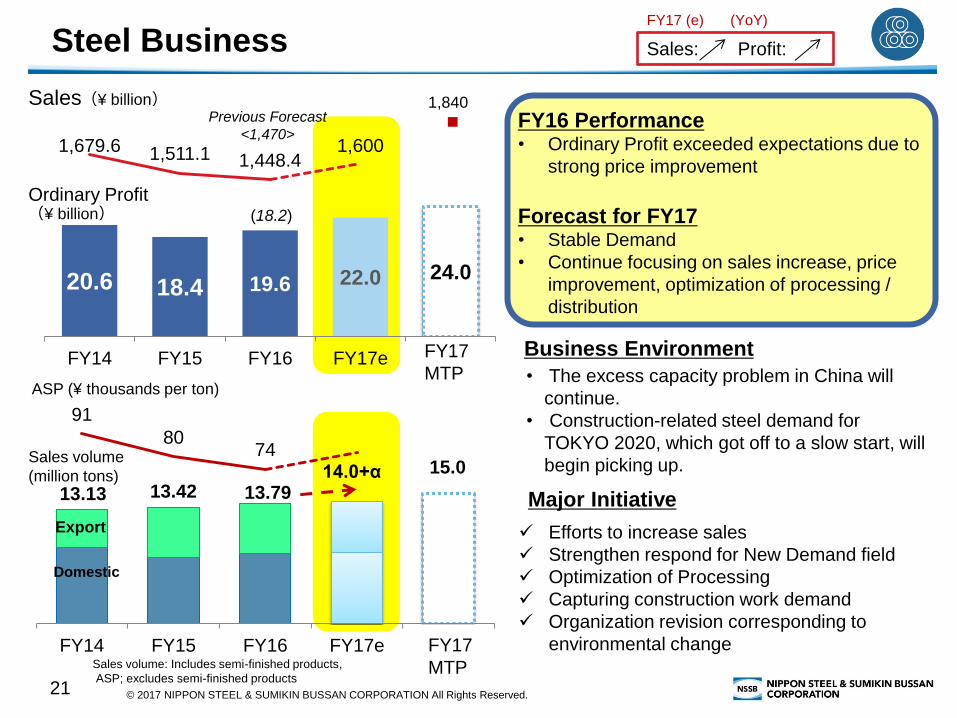
13.13 13.42 13.79
15.0
91
80 74
FY14 FY15 FY16 FY17e
20.6 18.4 19.6 24.0 22.0
1,679.6 1,511.1 1,448.4 1,600
FY14 FY15 FY16 FY17e
Steel Business
21
Sales(¥ billion)
Ordinary Profit (¥ billion)
FY16 Performance • Ordinary Profit exceeded expectations due to
strong price improvement
Forecast for FY17 • Stable Demand
• Continue focusing on sales increase, price
improvement, optimization of processing /
distribution
Major Initiative
Efforts to increase sales
Strengthen respond for New Demand field
Optimization of Processing
Capturing construction work demand
Organization revision corresponding to
environmental change
1,840
FY17
MTP
Sales volume
(million tons)
Domestic
Export
FY17
MTP
ASP (¥ thousands per ton)
Previous Forecast
<1,470>
(18.2)
14.0+α
Sales: Profit:
FY17 (e) (YoY)
Sales volume: Includes semi-finished products,
ASP; excludes semi-finished products
• The excess capacity problem in China will
continue.
• Construction-related steel demand for
TOKYO 2020, which got off to a slow start, will
begin picking up.
Business Environment
© 2017 NIPPON STEEL & SUMIKIN BUSSAN CORPORATION All Rights Reserved.
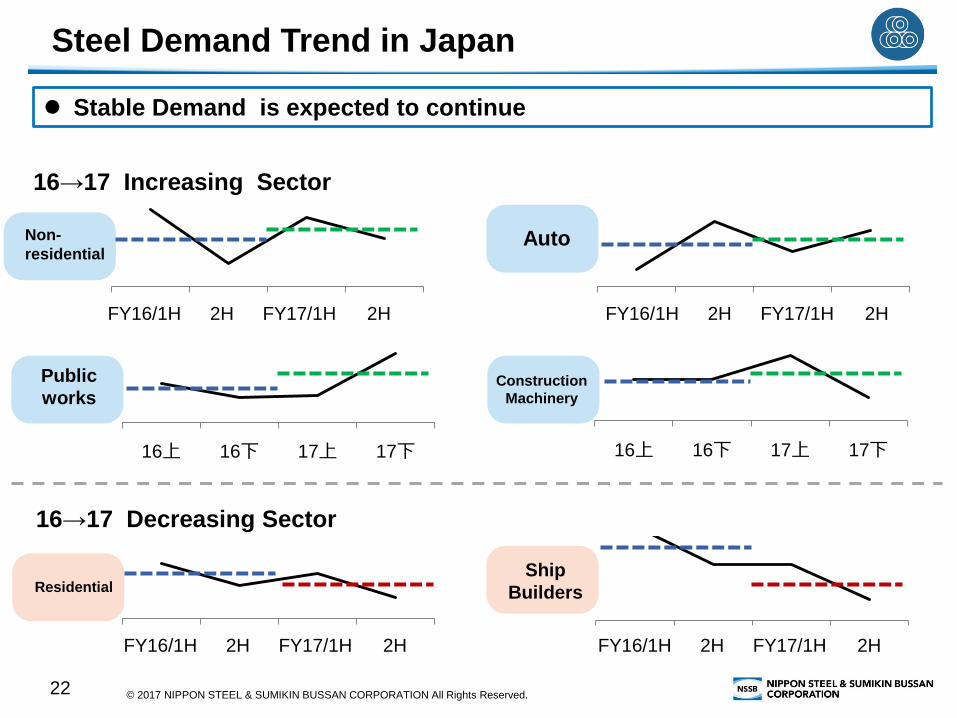
Steel Demand Trend in Japan
22
Residential
16上 16下 17上 17下
Non-
residential
16上 16下 17上 17下
Public
works
16上 16下 17上 17下
Auto
16上 16下 17上 17下
Ship
Builders
16上 16下 17上 17下
Construction
Machinery
16上 16下 17上 17下
16→17 Increasing Sector
16→17 Decreasing Sector
Stable Demand is expected to continue
FY16/1H 2H FY17/1H 2H FY16/1H 2H FY17/1H 2H
FY16/1H 2H FY17/1H 2H FY16/1H 2H FY17/1H 2H
© 2017 NIPPON STEEL & SUMIKIN BUSSAN CORPORATION All Rights Reserved.
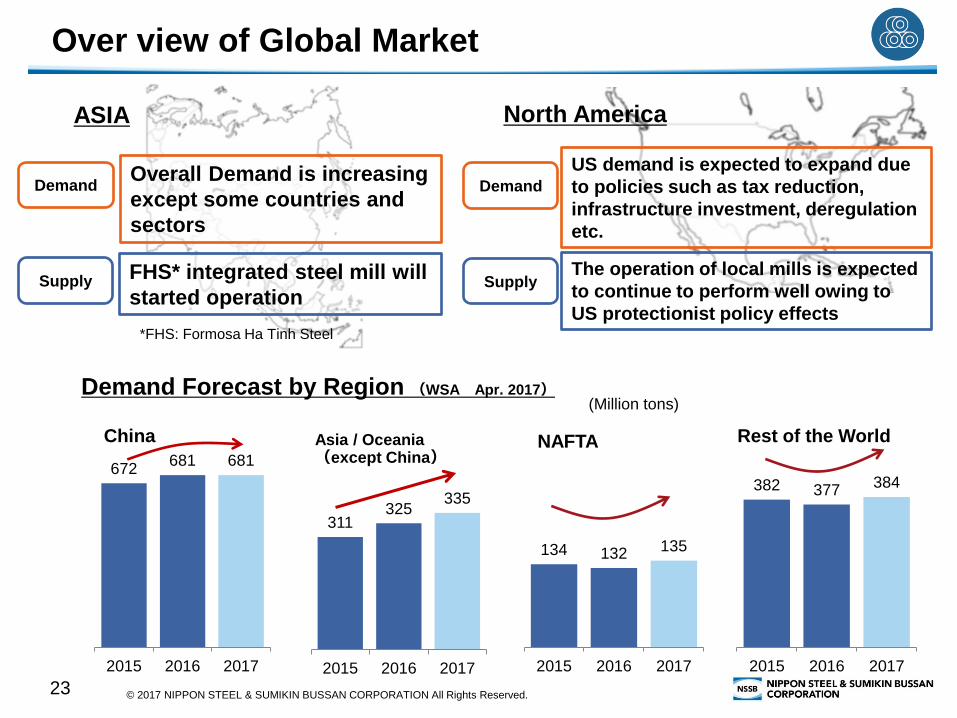
Over view of Global Market
23
Supply FHS* integrated steel mill will
started operation
Demand Overall Demand is increasing
except some countries and
sectors
ASIA North America
The operation of local mills is expected
to continue to perform well owing to
US protectionist policy effects
US demand is expected to expand due
to policies such as tax reduction,
infrastructure investment, deregulation
etc.
672 681 681
2015 2016 2017
311 325
335
2015 2016 2017
134 132 135
2015 2016 2017
382 377 384
2015 2016 2017
China Asia / Oceania (except China)
NAFTA Rest of the World
Demand Forecast by Region (WSA Apr. 2017) (Million tons)
*FHS: Formosa Ha Tinh Steel
Supply
Demand
© 2017 NIPPON STEEL & SUMIKIN BUSSAN CORPORATION All Rights Reserved.
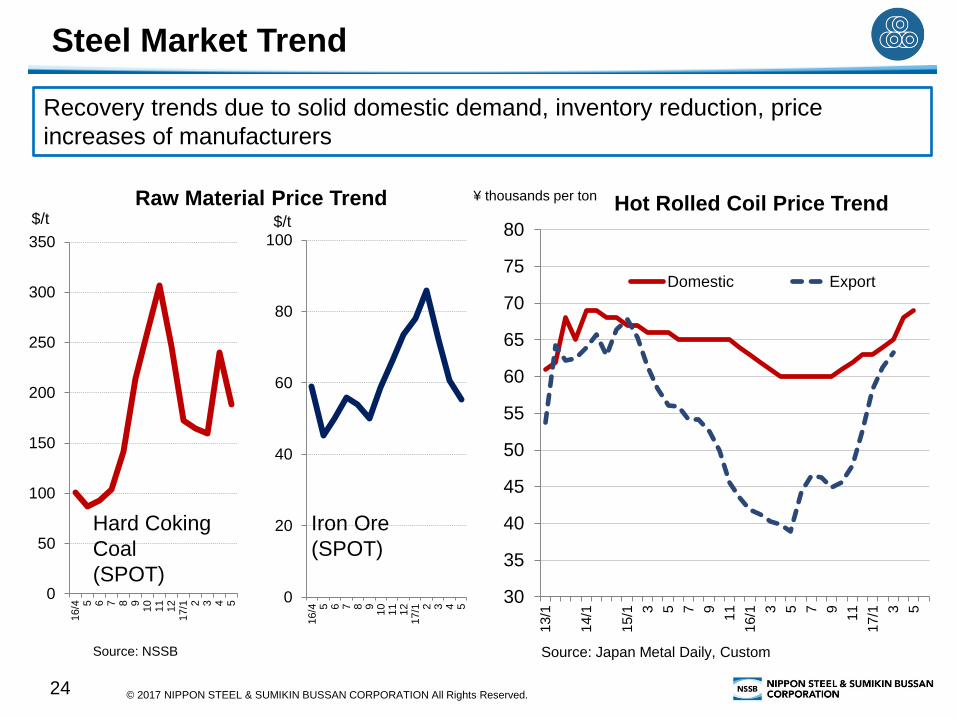
Steel Market Trend
24
Recovery trends due to solid domestic demand, inventory reduction, price
increases of manufacturers
0
50
100
150
200
250
300
350
16/4 5 6 7 8 910
11
12
17/1 2 3 4 5
$/t
Raw Material Price Trend
0
20
40
60
80
100
16/4 5 6 7 8 910
11
12
17/1 2 3 4 5
$/t
30
35
40
45
50
55
60
65
70
75
80
13/1
14/1
15/1 3 5 7 9
11
16/1 3 5 7 9
11
17/1 3 5
Domestic Export
Hot Rolled Coil Price Trend
Hard Coking
Coal
(SPOT)
Iron Ore
(SPOT)
Source: NSSB
¥ thousands per ton
Source: Japan Metal Daily, Custom
© 2017 NIPPON STEEL & SUMIKIN BUSSAN CORPORATION All Rights Reserved.
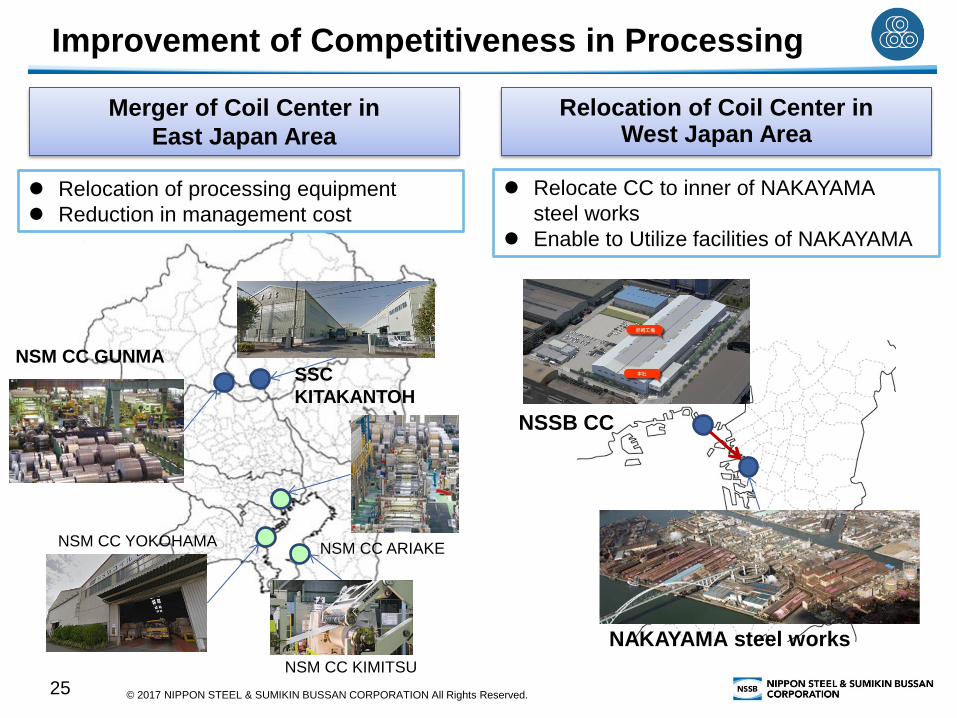
Improvement of Competitiveness in Processing
25
SSC
KITAKANTOH
NSM CC ARIAKE NSM CC YOKOHAMA
NSM CC KIMITSU
NSM CC GUNMA
Merger of Coil Center in
East Japan Area
Relocation of Coil Center in West Japan Area
NAKAYAMA steel works
NSSB CC
Relocate CC to inner of NAKAYAMA
steel works
Enable to Utilize facilities of NAKAYAMA
Relocation of processing equipment
Reduction in management cost

© 2017 NIPPON STEEL & SUMIKIN BUSSAN CORPORATION All Rights Reserved.
Strengthen Respond for Increasing Demand field
26
Capturing construction work demand in Japan
Strengthen planning function for Overseas M&A etc.
Strengthening sales organization for large development projects
Organization change corresponding to reorganization of Steel Industry in
Japan
Integration of distribution
company , Subsidiary of Nippon
Steel & Sumikin Metal Products.
Establishment of subsidiary for
steel framework construction
Organization revision
© 2017 NIPPON STEEL & SUMIKIN BUSSAN CORPORATION All Rights Reserved.
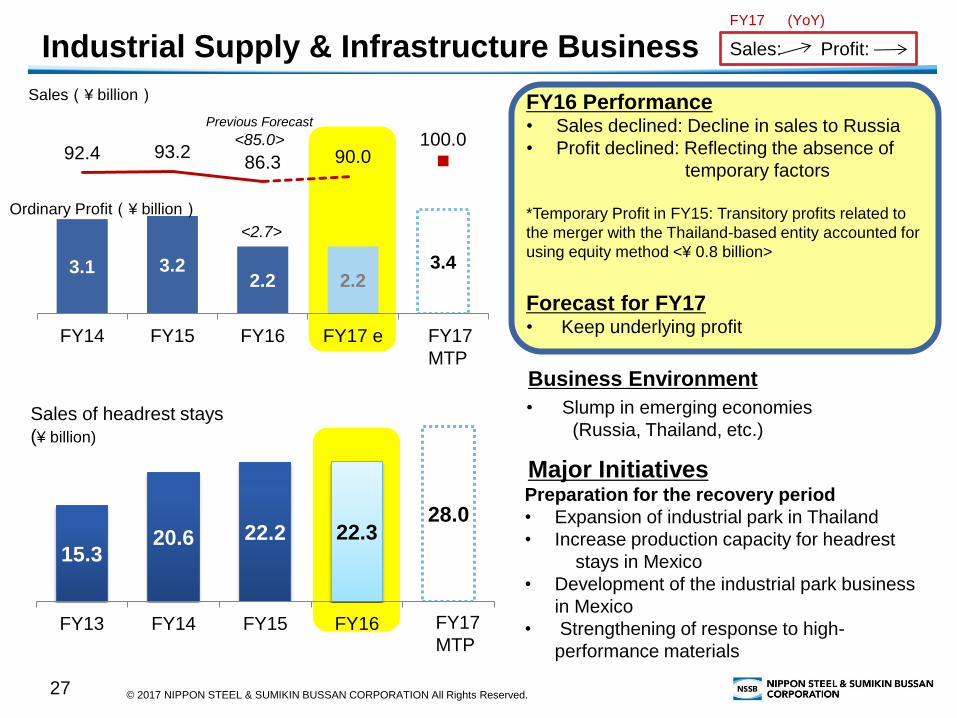
Industrial Supply & Infrastructure Business
27
3.1 3.2 2.2
3.4 2.2
92.4 93.2 86.3 90.0
100.0
FY14 FY15 FY16 FY17 e
15.3 20.6 22.2 22.3
28.0
FY13 FY14 FY15 FY16
FY17
MTP
FY17
MTP
<2.7>
FY16 Performance • Sales declined: Decline in sales to Russia
• Profit declined: Reflecting the absence of
temporary factors
*Temporary Profit in FY15: Transitory profits related to
the merger with the Thailand-based entity accounted for
using equity method <¥ 0.8 billion>
Forecast for FY17 • Keep underlying profit
• Slump in emerging economies
(Russia, Thailand, etc.)
Business Environment
Major Initiatives Preparation for the recovery period
• Expansion of industrial park in Thailand
• Increase production capacity for headrest
stays in Mexico
• Development of the industrial park business
in Mexico
• Strengthening of response to high-
performance materials
Sales(¥ billion)
Ordinary Profit(¥ billion)
Sales of headrest stays
(¥ billion)
Previous Forecast
<85.0>
Sales: Profit:
FY17 (YoY)
© 2017 NIPPON STEEL & SUMIKIN BUSSAN CORPORATION All Rights Reserved.
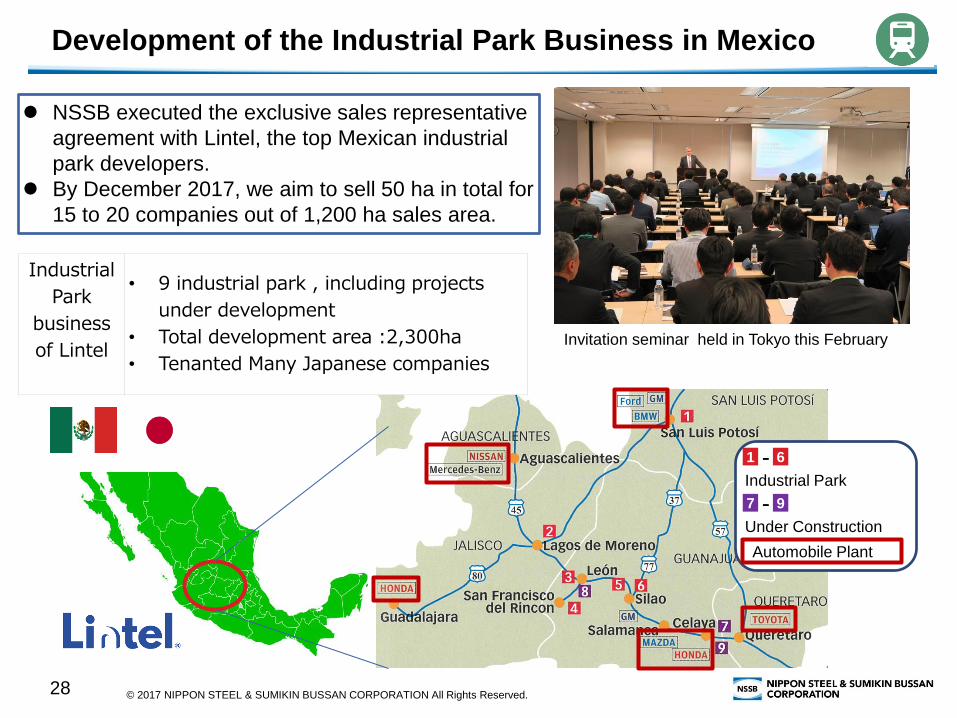
Development of the Industrial Park Business in Mexico
28
NSSB executed the exclusive sales representative
agreement with Lintel, the top Mexican industrial
park developers.
By December 2017, we aim to sell 50 ha in total for
15 to 20 companies out of 1,200 ha sales area.
Industrial
Park
business
of Lintel
• 9 industrial park , including projects
under development
• Total development area :2,300ha
• Tenanted Many Japanese companies
1 6 - Industrial Park
7 9 - Under Construction
Automobile Plant
Invitation seminar held in Tokyo this February
© 2017 NIPPON STEEL & SUMIKIN BUSSAN CORPORATION All Rights Reserved.
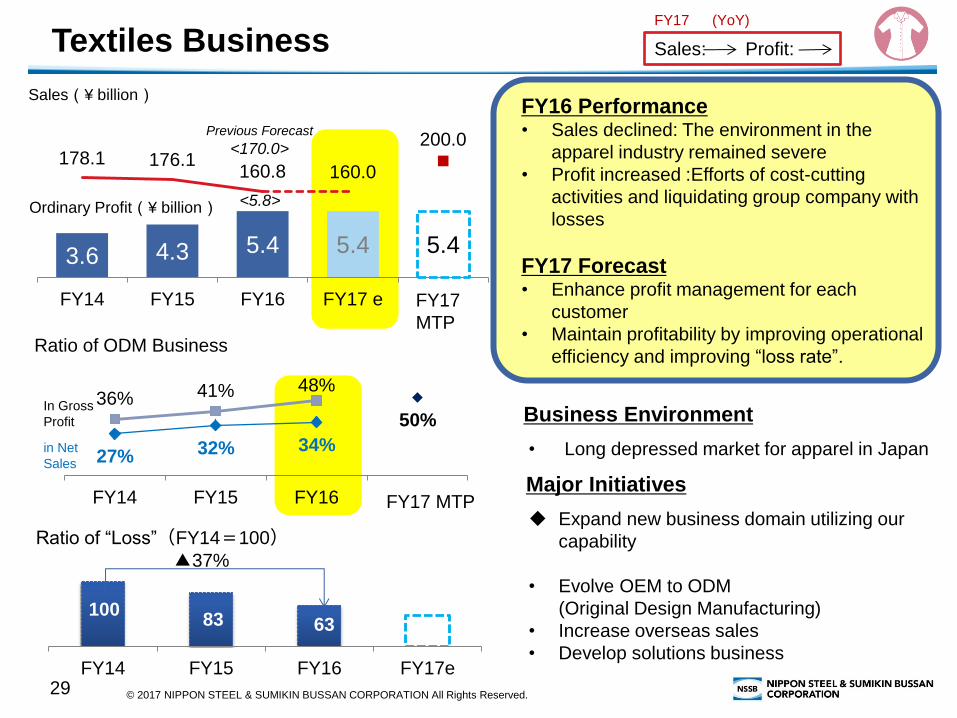
Textiles Business
29
3.6 4.3 5.4 5.4 5.4
178.1 176.1 160.8 160.0
200.0
FY14 FY15 FY16 FY17 e
FY16 Performance • Sales declined: The environment in the
apparel industry remained severe
• Profit increased :Efforts of cost-cutting
activities and liquidating group company with
losses
FY17 Forecast • Enhance profit management for each
customer
• Maintain profitability by improving operational
efficiency and improving “loss rate”.
27% 32% 34%
50% 36% 41% 48%
FY14 FY15 FY16
FY17
MTP
FY17 MTP
<5.8>
FY14 FY15 FY16 FY17e
83 63 100
▲37%
Ratio of “Loss”(FY14=100)
in Net
Sales
In Gross
Profit
Previous Forecast
<170.0>
Sales(¥ billion)
Ordinary Profit(¥ billion)
Ratio of ODM Business
• Long depressed market for apparel in Japan
Business Environment
Major Initiatives
Expand new business domain utilizing our
capability
• Evolve OEM to ODM
(Original Design Manufacturing)
• Increase overseas sales
• Develop solutions business
Sales: Profit:
FY17 (YoY)
© 2017 NIPPON STEEL & SUMIKIN BUSSAN CORPORATION All Rights Reserved.
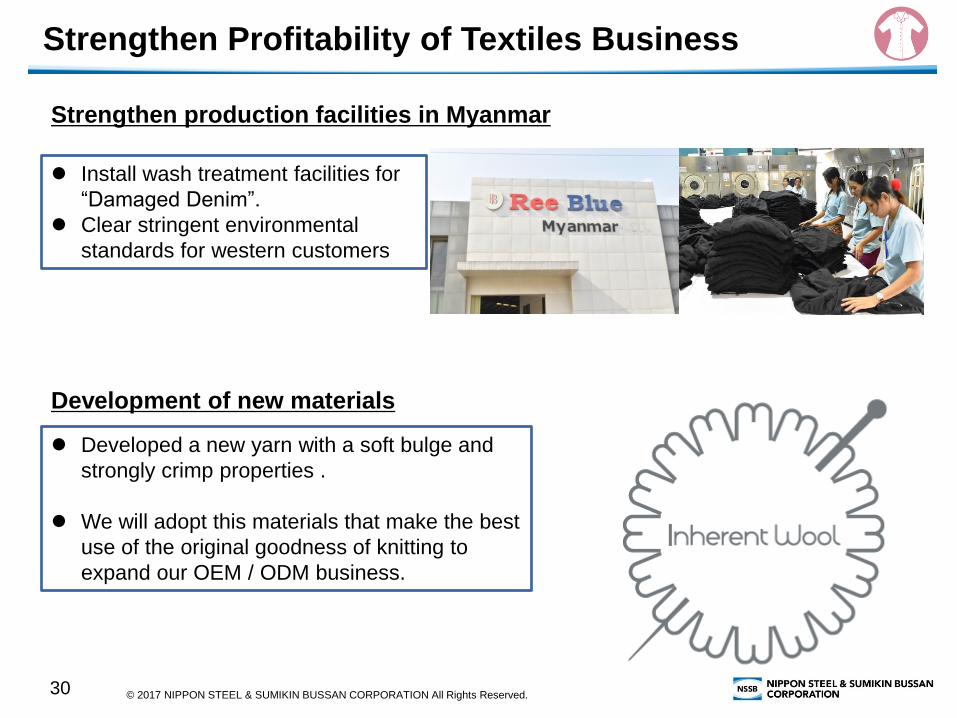
Strengthen Profitability of Textiles Business
30
Strengthen production facilities in Myanmar
Install wash treatment facilities for
“Damaged Denim”.
Clear stringent environmental
standards for western customers
シ… マ… イ…
Development of new materials
Developed a new yarn with a soft bulge and
strongly crimp properties .
We will adopt this materials that make the best
use of the original goodness of knitting to
expand our OEM / ODM business.
© 2017 NIPPON STEEL & SUMIKIN BUSSAN CORPORATION All Rights Reserved.
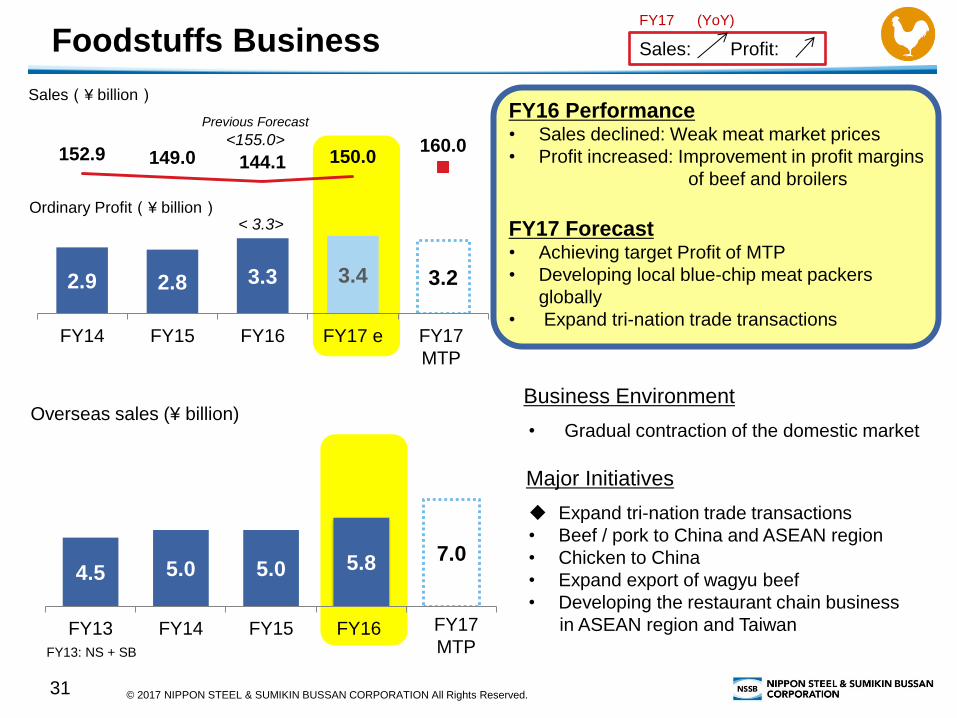
Foodstuffs Business
31
2.9 2.8 3.3 3.2 3.4
152.9 149.0 144.1 150.0 160.0
FY14 FY15 FY16 FY17 e
FY16 Performance • Sales declined: Weak meat market prices
• Profit increased: Improvement in profit margins
of beef and broilers
FY17 Forecast • Achieving target Profit of MTP
• Developing local blue-chip meat packers
globally
• Expand tri-nation trade transactions FY17
MTP
FY17
MTP
4.5 5.0 5.0 5.8 7.0
FY13 FY14 FY15 FY16
< 3.3>
Sales: Profit:
FY17 (YoY)
Previous Forecast
<155.0>
Sales(¥ billion)
Ordinary Profit(¥ billion)
FY13: NS + SB
Overseas sales (¥ billion) • Gradual contraction of the domestic market
Business Environment
Major Initiatives
Expand tri-nation trade transactions
• Beef / pork to China and ASEAN region
• Chicken to China
• Expand export of wagyu beef
• Developing the restaurant chain business
in ASEAN region and Taiwan

© 2017 NIPPON STEEL & SUMIKIN BUSSAN CORPORATION All Rights Reserved.
Developing the Meat Business
32
Live cattle imports from Australia
To compensate for the decrease in domestic
cattle due to the aging of Wagyu feeder , to
secure a stable amount
Started a new business to sell imported Wagyu
raised with highly nurturing skills in Japan for
overseas buyers
Expansion of Wagyu export business
through investment partners
The Kanpai Group operates a restaurant chain in the
yakiniku category which focuses on wagyu (Japanese
beef).
In Dec. 2015, NSSB underwrote an increase in
capitalization of the Kanpai group to raise its share to
about 15% to expand its beef business
By establishing a central kitchen, Kanpai will expand the
number of new store openings and secure supply
capacity for their wholesale business.
© 2017 NIPPON STEEL & SUMIKIN BUSSAN CORPORATION All Rights Reserved.
4.Appendix
33
© 2017 NIPPON STEEL & SUMIKIN BUSSAN CORPORATION All Rights Reserved.
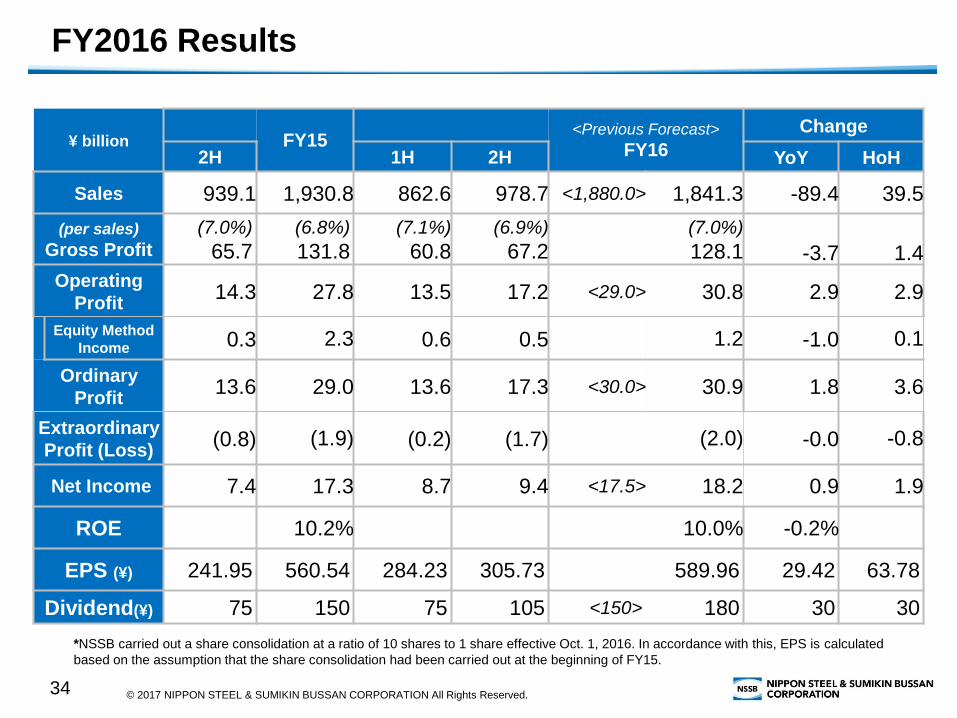
FY2016 Results
34
¥ billion FY15 <Previous Forecast>
FY16
Change
2H 1H 2H YoY HoH
Sales 939.1 1,930.8 862.6 978.7 <1,880.0> 1,841.3 -89.4 39.5
(per sales)
Gross Profit
(7.0%)
65.7
(6.8%)
131.8
(7.1%)
60.8
(6.9%)
67.2
(7.0%)
128.1
-3.7
1.4
Operating
Profit 14.3 27.8 13.5 17.2 <29.0> 30.8 2.9 2.9
Equity Method
Income 0.3 2.3 0.6 0.5 1.2 -1.0 0.1
Ordinary
Profit 13.6 29.0 13.6 17.3 <30.0> 30.9 1.8 3.6
Extraordinary
Profit (Loss) (0.8) (1.9) (0.2) (1.7) (2.0) -0.0 -0.8
Net Income 7.4 17.3 8.7 9.4 <17.5> 18.2 0.9 1.9
ROE 10.2% 10.0% -0.2%
EPS (¥) 241.95 560.54 284.23 305.73 589.96 29.42 63.78
Dividend(¥) 75 150 75 105 <150> 180 30 30
*NSSB carried out a share consolidation at a ratio of 10 shares to 1 share effective Oct. 1, 2016. In accordance with this, EPS is calculated
based on the assumption that the share consolidation had been carried out at the beginning of FY15.
© 2017 NIPPON STEEL & SUMIKIN BUSSAN CORPORATION All Rights Reserved.
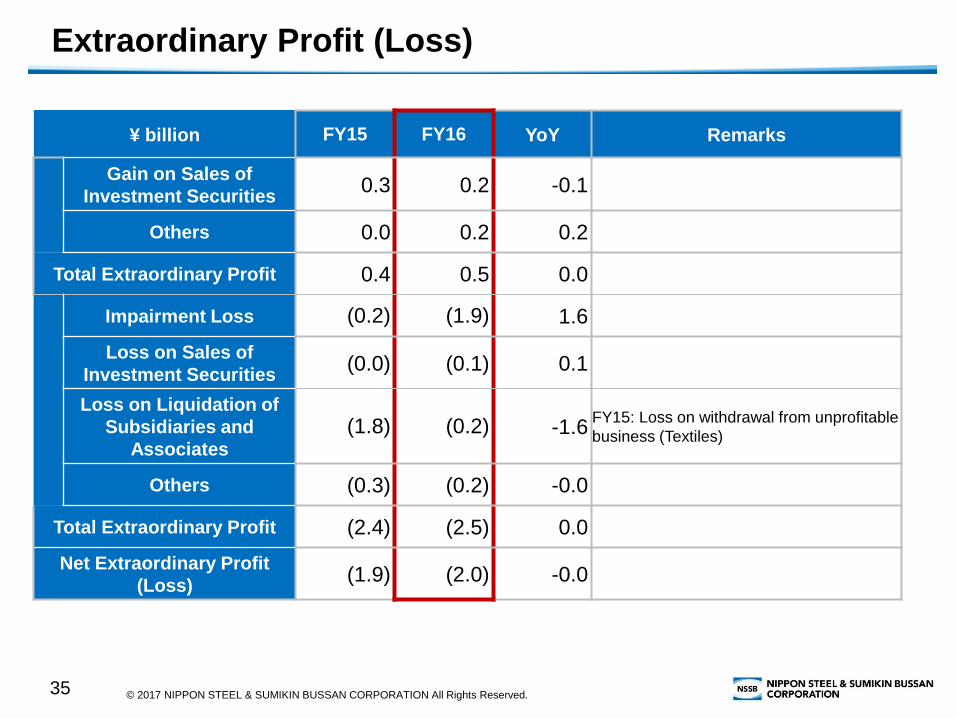
Extraordinary Profit (Loss)
35
¥ billion FY15 FY16 YoY Remarks
Gain on Sales of
Investment Securities 0.3 0.2 -0.1
Others 0.0 0.2 0.2
Total Extraordinary Profit 0.4 0.5 0.0
Impairment Loss (0.2) (1.9) 1.6
Loss on Sales of
Investment Securities (0.0) (0.1) 0.1
Loss on Liquidation of
Subsidiaries and
Associates
(1.8) (0.2) -1.6 FY15: Loss on withdrawal from unprofitable
business (Textiles)
Others (0.3) (0.2) -0.0
Total Extraordinary Profit (2.4) (2.5) 0.0
Net Extraordinary Profit
(Loss) (1.9) (2.0) -0.0
© 2017 NIPPON STEEL & SUMIKIN BUSSAN CORPORATION All Rights Reserved.
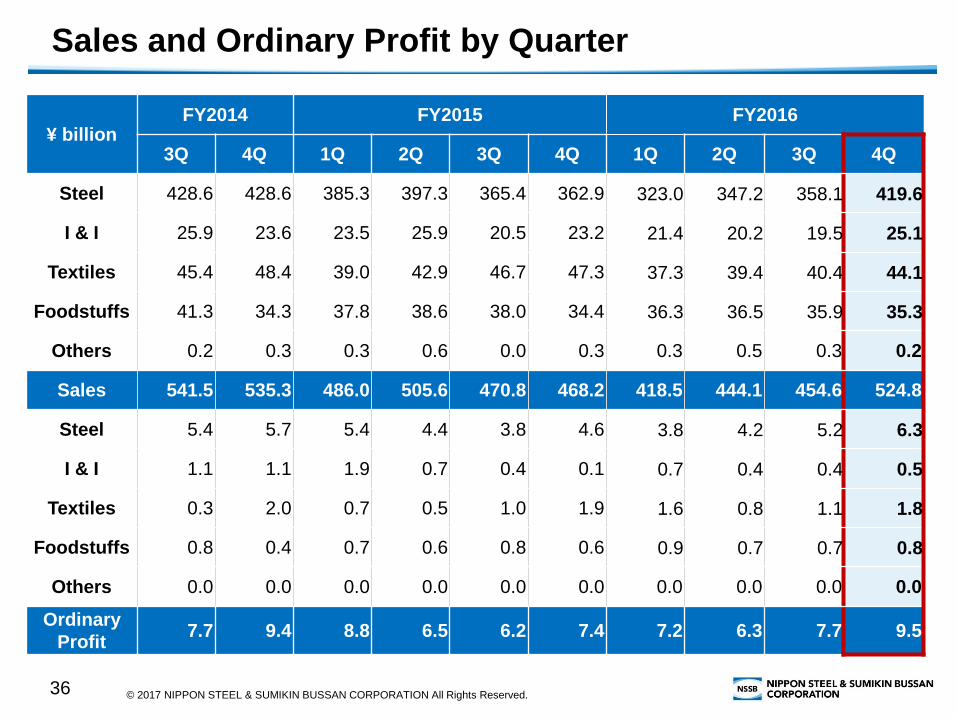
Sales and Ordinary Profit by Quarter
36
¥ billion FY2014 FY2015 FY2016
3Q 4Q 1Q 2Q 3Q 4Q 1Q 2Q 3Q 4Q
Steel 428.6 428.6 385.3 397.3 365.4 362.9 323.0 347.2 358.1 419.6
I & I 25.9 23.6 23.5 25.9 20.5 23.2 21.4 20.2 19.5 25.1
Textiles 45.4 48.4 39.0 42.9 46.7 47.3 37.3 39.4 40.4 44.1
Foodstuffs 41.3 34.3 37.8 38.6 38.0 34.4 36.3 36.5 35.9 35.3
Others 0.2 0.3 0.3 0.6 0.0 0.3 0.3 0.5 0.3 0.2
Sales 541.5 535.3 486.0 505.6 470.8 468.2 418.5 444.1 454.6 524.8
Steel 5.4 5.7 5.4 4.4 3.8 4.6 3.8 4.2 5.2 6.3
I & I 1.1 1.1 1.9 0.7 0.4 0.1 0.7 0.4 0.4 0.5
Textiles 0.3 2.0 0.7 0.5 1.0 1.9 1.6 0.8 1.1 1.8
Foodstuffs 0.8 0.4 0.7 0.6 0.8 0.6 0.9 0.7 0.7 0.8
Others 0.0 0.0 0.0 0.0 0.0 0.0 0.0 0.0 0.0 0.0
Ordinary
Profit 7.7 9.4 8.8 6.5 6.2 7.4 7.2 6.3 7.7 9.5
© 2017 NIPPON STEEL & SUMIKIN BUSSAN CORPORATION All Rights Reserved.
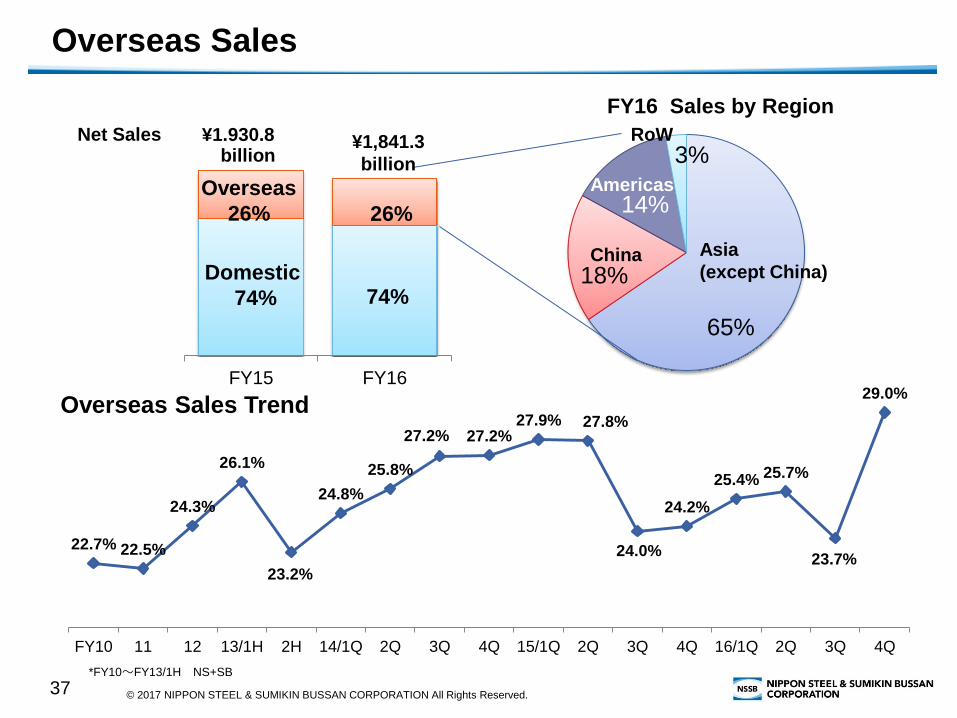
22.7% 22.5%
24.3%
26.1%
23.2%
24.8%
25.8%
27.2% 27.2% 27.9% 27.8%
24.0%
24.2%
25.4% 25.7%
23.7%
29.0%
FY10 11 12 13/1H 2H 14/1Q 2Q 3Q 4Q 15/1Q 2Q 3Q 4Q 16/1Q 2Q 3Q 4Q
Overseas Sales Trend
Overseas Sales
37
65%
18%
14%
3%
FY16 Sales by Region
FY15 FY16
¥1.930.8 billion
Asia
(except China)
¥1,841.3
billion
Overseas
26% 26%
Domestic
74% 74%
China
Americas
RoW
*FY10~FY13/1H NS+SB
Net Sales
© 2017 NIPPON STEEL & SUMIKIN BUSSAN CORPORATION All Rights Reserved.
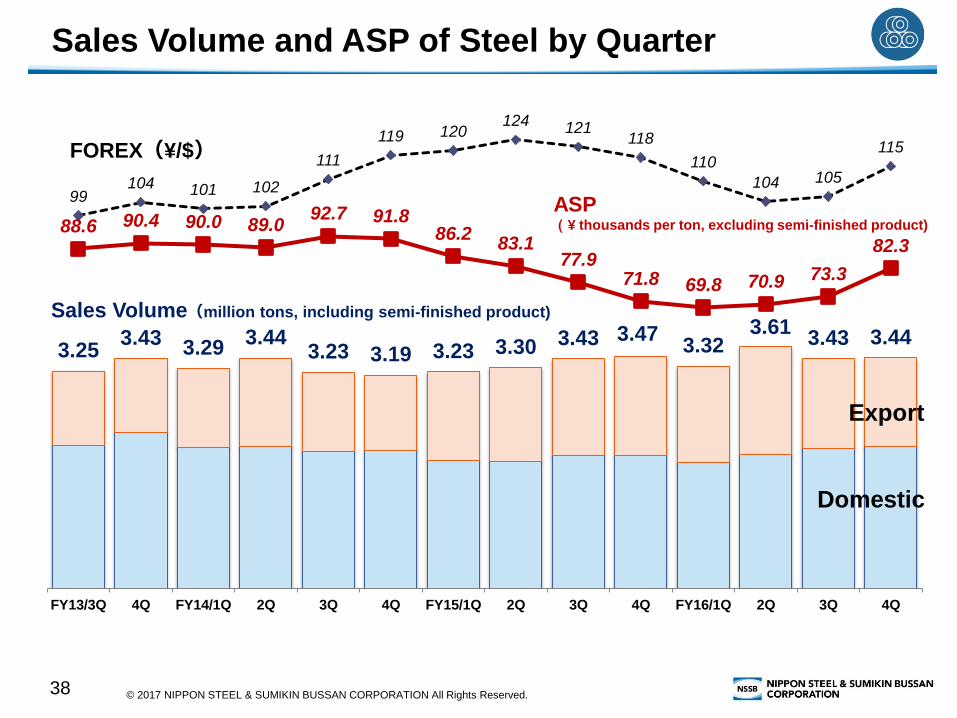
3.25 3.43 3.29
3.44 3.23 3.19 3.23 3.30 3.43 3.47
3.32 3.61
3.43 3.44
88.6 90.4 90.0 89.0 92.7 91.8
86.2 83.1
77.9 71.8 69.8 70.9 73.3
82.3
99 104 101 102
111
119 120 124 121
118
110
104 105
115
FY13/3Q 4Q FY14/1Q 2Q 3Q 4Q FY15/1Q 2Q 3Q 4Q FY16/1Q 2Q 3Q 4Q
Sales Volume and ASP of Steel by Quarter
38
Domestic
Export
Sales Volume(million tons, including semi-finished product)
ASP (¥ thousands per ton, excluding semi-finished product)
FOREX(¥/$)
© 2017 NIPPON STEEL & SUMIKIN BUSSAN CORPORATION All Rights Reserved.
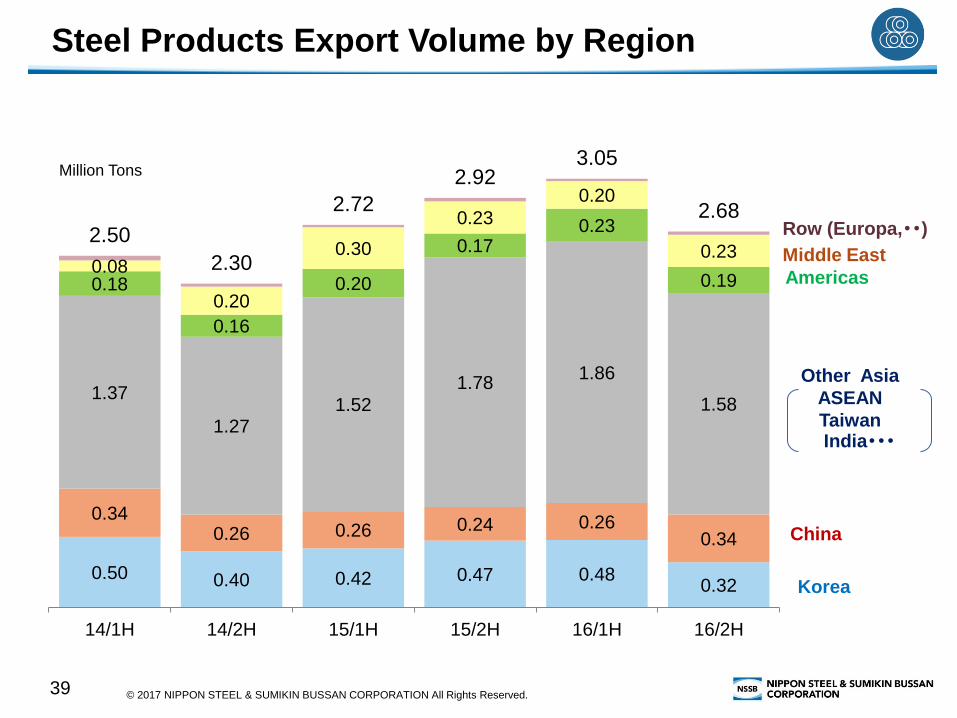
Steel Products Export Volume by Region
39
0.50 0.40 0.42 0.47 0.48 0.32
0.34 0.26 0.26 0.24 0.26
0.34
1.37
1.27 1.52
1.78 1.86
1.58
0.18
0.16
0.20
0.17 0.23
0.19 0.08
0.20
0.30
0.23
0.20
0.23 2.50
2.30
2.72
2.92 3.05
2.68
14/1H 14/2H 15/1H 15/2H 16/1H 16/2H
Americas
Middle East
Other Asia
ASEAN
Taiwan India・・・
Korea
China
Million Tons
Row (Europa,・・)
© 2017 NIPPON STEEL & SUMIKIN BUSSAN CORPORATION All Rights Reserved.
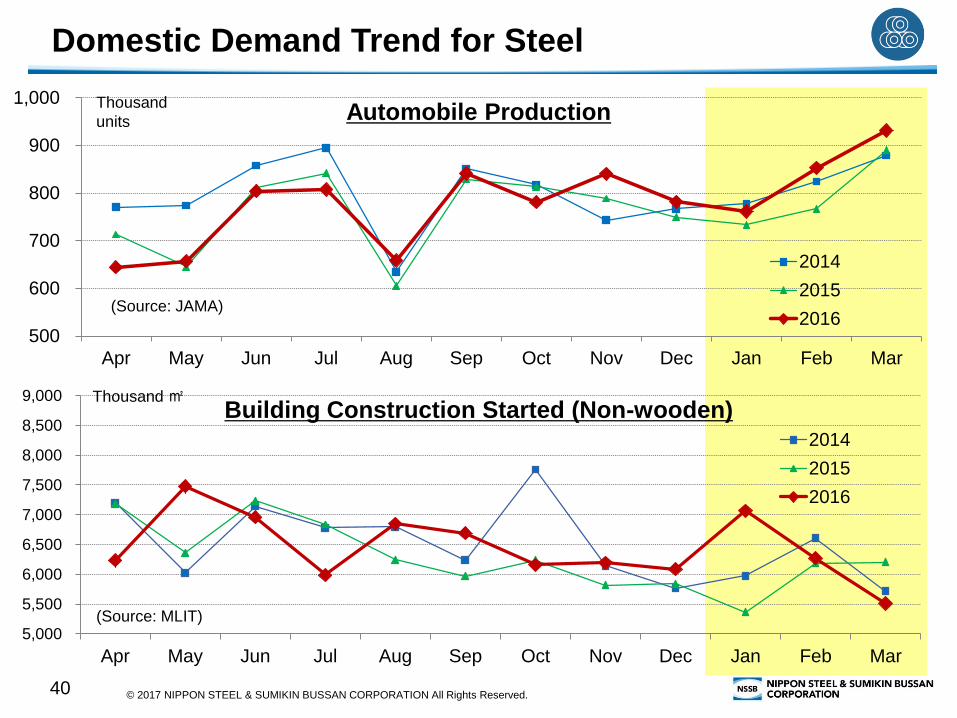
500
600
700
800
900
1,000
Apr May Jun Jul Aug Sep Oct Nov Dec Jan Feb Mar
Automobile Production
2014
2015
2016
Domestic Demand Trend for Steel
40
5,000
5,500
6,000
6,500
7,000
7,500
8,000
8,500
9,000
Apr May Jun Jul Aug Sep Oct Nov Dec Jan Feb Mar
Building Construction Started (Non-wooden) 2014
2015
2016
Thousand
units
(Source: JAMA)
Thousand ㎡
(Source: MLIT)
© 2017 NIPPON STEEL & SUMIKIN BUSSAN CORPORATION All Rights Reserved.
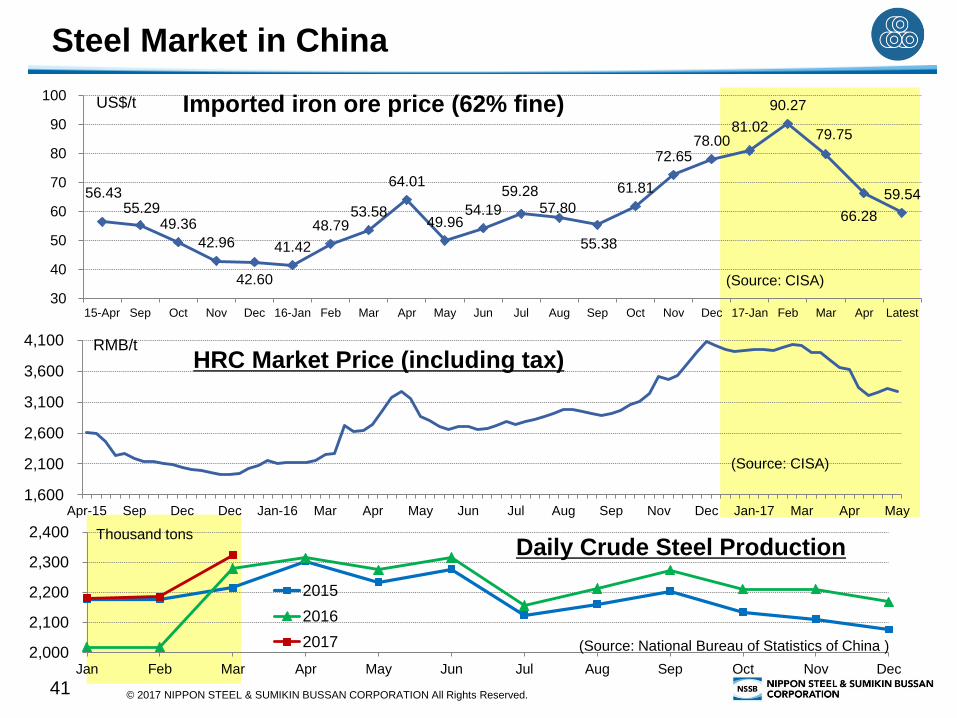
2,000
2,100
2,200
2,300
2,400
Jan Feb Mar Apr May Jun Jul Aug Sep Oct Nov Dec
2015
2016
2017
56.43 55.29
49.36
42.96
42.60
41.42
48.79 53.58
64.01
49.96 54.19
59.28 57.80
55.38
61.81
72.65 78.00
81.02
90.27
79.75
66.28
59.54
30
40
50
60
70
80
90
100
15-Apr Sep Oct Nov Dec 16-Jan Feb Mar Apr May Jun Jul Aug Sep Oct Nov Dec 17-Jan Feb Mar Apr Latest
Imported iron ore price (62% fine)
Steel Market in China
41
US$/t
1,600
2,100
2,600
3,100
3,600
4,100
Apr-15 Sep Dec Dec Jan-16 Mar Apr May Jun Jul Aug Sep Nov Dec Jan-17 Mar Apr May
HRC Market Price (including tax) RMB/t
Daily Crude Steel Production
(Source: CISA)
(Source: CISA)
(Source: National Bureau of Statistics of China )
Thousand tons
© 2017 NIPPON STEEL & SUMIKIN BUSSAN CORPORATION All Rights Reserved.
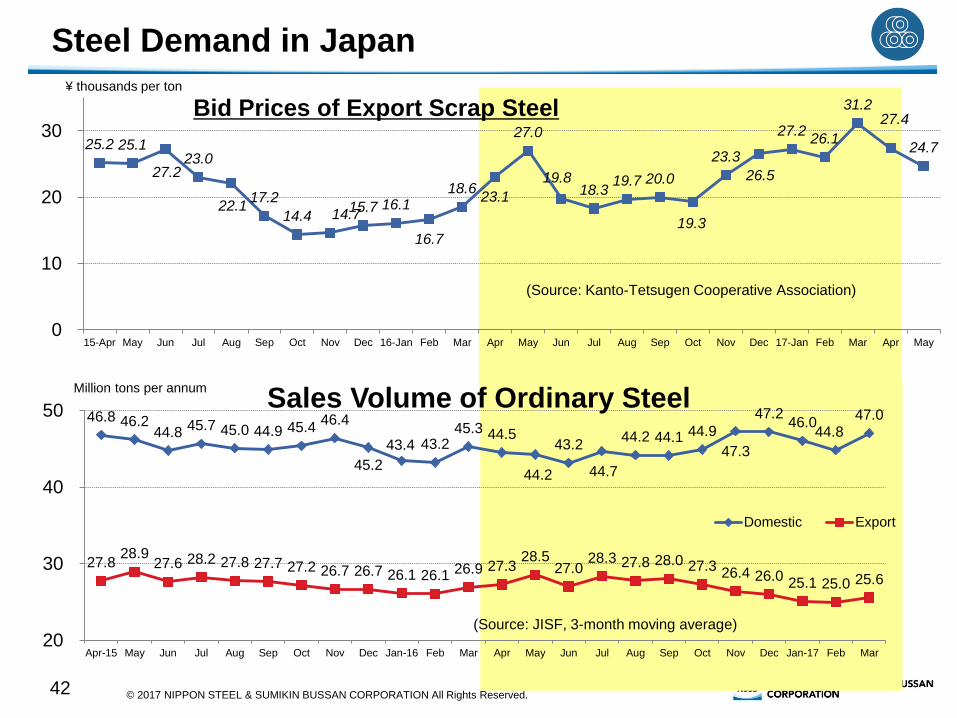
Steel Demand in Japan
42
25.2 25.1
27.2 23.0
22.1 17.2
14.4 14.7 15.7 16.1
16.7
18.6 23.1
27.0
19.8 18.3
19.7 20.0
19.3
23.3
26.5
27.2 26.1
31.2 27.4
24.7
0
10
20
30
15-Apr May Jun Jul Aug Sep Oct Nov Dec 16-Jan Feb Mar Apr May Jun Jul Aug Sep Oct Nov Dec 17-Jan Feb Mar Apr May
Bid Prices of Export Scrap Steel
46.8 46.2 44.8
45.7 45.0 44.9 45.4 46.4
45.2
43.4 43.2 45.3 44.5
44.2
43.2
44.7
44.2 44.1 44.9
47.3
47.2 46.0
44.8 47.0
27.8 28.9
27.6 28.2 27.8 27.7 27.2 26.7 26.7 26.1 26.1 26.9 27.3 28.5
27.0 28.3 27.8 28.0 27.3
26.4 26.0 25.1 25.0 25.6
20
30
40
50
Apr-15 May Jun Jul Aug Sep Oct Nov Dec Jan-16 Feb Mar Apr May Jun Jul Aug Sep Oct Nov Dec Jan-17 Feb Mar
Domestic Export
Sales Volume of Ordinary Steel
¥ thousands per ton
Million tons per annum
(Source: Kanto-Tetsugen Cooperative Association)
(Source: JISF, 3-month moving average)
© 2017 NIPPON STEEL & SUMIKIN BUSSAN CORPORATION All Rights Reserved.
211 218 218 206 207 201 197 198 198 195 189 185 185 192 203 196 198 197 191 187 180 177 173 177 186 200 201 197
79 78 78 77 77 77 77 75 75
73 72 72 72 70 70 70 70 70
68 68 68 68 68 70
72 72 73 75 75
50
55
60
65
70
75
80
0
100
200
300
400
Jan-15
Feb Mar Apr May Jun Jul Aug Sep Oct Nov Dec Jan-16
Feb Mar Apr May Jun Jul Aug Sep Oct Nov Dec Jan-17
Feb Mar Apr May
Inventory (left axis) Market price (right axis)
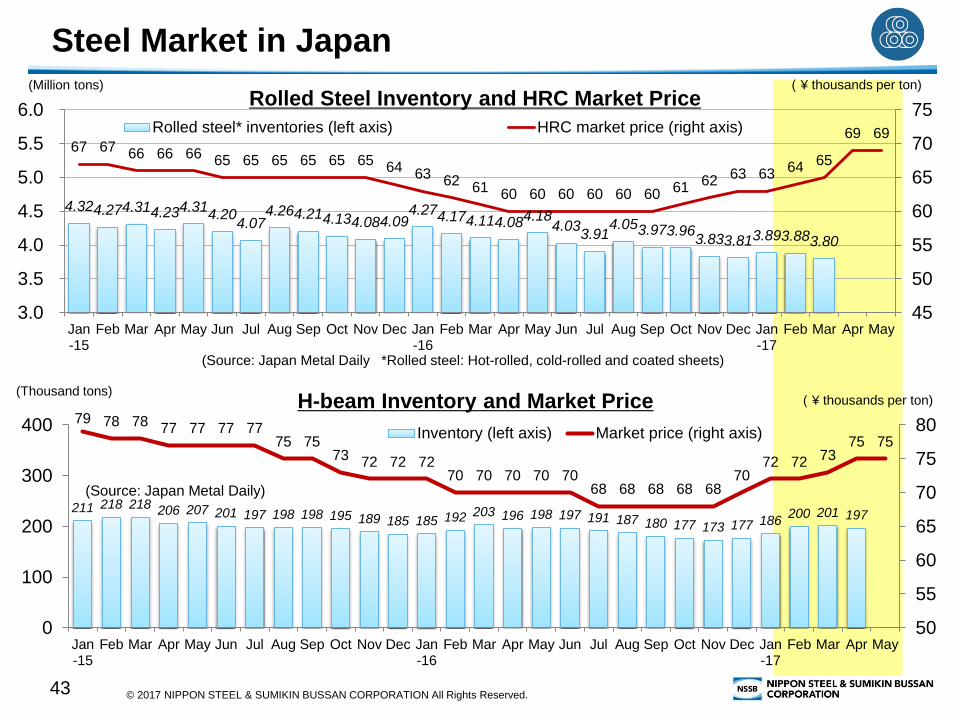
Steel Market in Japan
43
4.32 4.27 4.31 4.23 4.31 4.20
4.07 4.26 4.21 4.13 4.08 4.09
4.27 4.17 4.11 4.08 4.18 4.03
3.91 4.05 3.97 3.96
3.83 3.81 3.89 3.88 3.80
67 67 66 66 66 65 65 65 65 65 65 64 63 62 61 60 60 60 60 60 60 61 62 63 63 64 65
69 69
45
50
55
60
65
70
75
3.0
3.5
4.0
4.5
5.0
5.5
6.0
Jan-15
Feb Mar Apr May Jun Jul Aug Sep Oct Nov Dec Jan-16
Feb Mar Apr May Jun Jul Aug Sep Oct Nov Dec Jan-17
Feb Mar Apr May
Rolled steel* inventories (left axis) HRC market price (right axis)
Rolled Steel Inventory and HRC Market Price
H-beam Inventory and Market Price
(Million tons) (¥ thousands per ton)
(Source: Japan Metal Daily *Rolled steel: Hot-rolled, cold-rolled and coated sheets)
(Thousand tons) (¥ thousands per ton)
(Source: Japan Metal Daily)
© 2017 NIPPON STEEL & SUMIKIN BUSSAN CORPORATION All Rights Reserved.
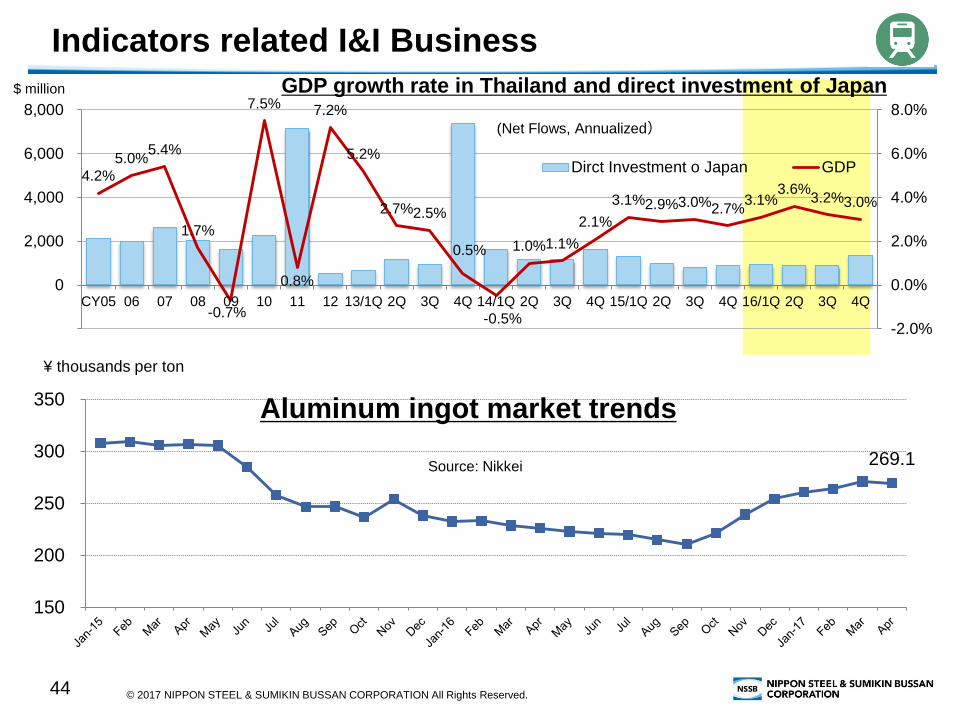
269.1
150
200
250
300
350 Aluminum ingot market trends
Indicators related I&I Business
44
4.2%
5.0% 5.4%
1.7%
-0.7%
7.5%
0.8%
7.2%
5.2%
2.7% 2.5%
0.5%
-0.5%
1.0% 1.1%
2.1%
3.1% 2.9% 3.0% 2.7% 3.1%
3.6% 3.2% 3.0%
-2.0%
0.0%
2.0%
4.0%
6.0%
8.0%
(2,000)
0
2,000
4,000
6,000
8,000
CY05 06 07 08 09 10 11 12 13/1Q 2Q 3Q 4Q 14/1Q 2Q 3Q 4Q 15/1Q 2Q 3Q 4Q 16/1Q 2Q 3Q 4Q
Dirct Investment o Japan GDP
GDP growth rate in Thailand and direct investment of Japan
Source: Nikkei
$ million
(Net Flows, Annualized)
¥ thousands per ton
© 2017 NIPPON STEEL & SUMIKIN BUSSAN CORPORATION All Rights Reserved.
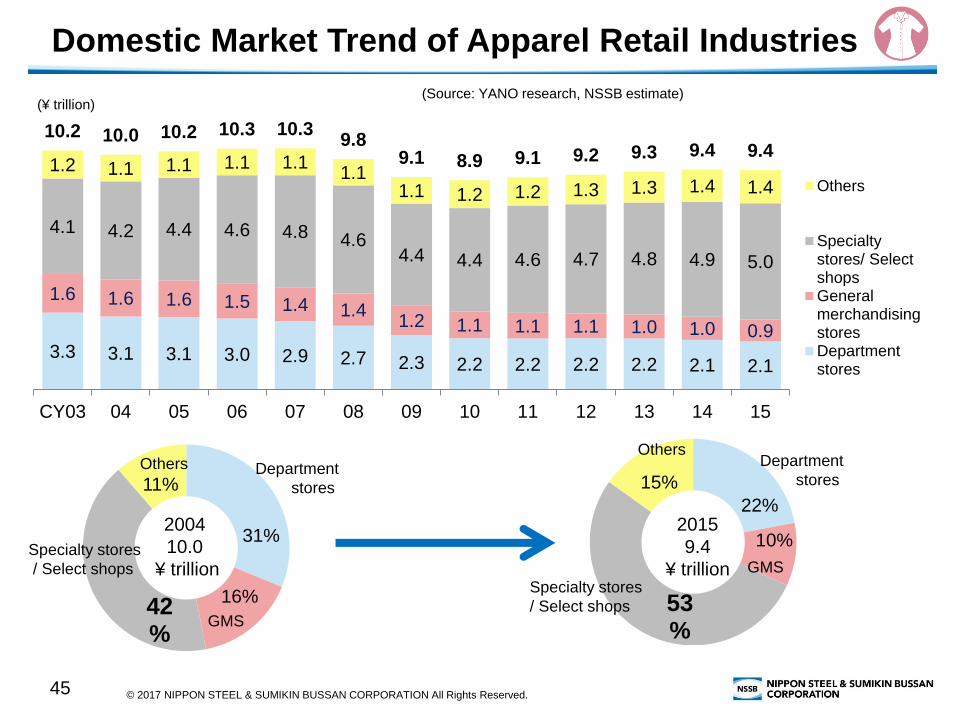
Domestic Market Trend of Apparel Retail Industries
45
3.3 3.1 3.1 3.0 2.9 2.7 2.3 2.2 2.2 2.2 2.2 2.1 2.1
1.6 1.6 1.6 1.5 1.4 1.4 1.2 1.1 1.1 1.1 1.0 1.0 0.9
4.1 4.2 4.4 4.6 4.8 4.6 4.4 4.4 4.6 4.7 4.8 4.9 5.0
1.2 1.1 1.1 1.1 1.1 1.1
1.1 1.2 1.2 1.3 1.3 1.4 1.4
10.2 10.0 10.2 10.3 10.3 9.8
9.1 8.9 9.1 9.2 9.3 9.4 9.4
CY03 04 05 06 07 08 09 10 11 12 13 14 15
Others
Specialtystores/ SelectshopsGeneralmerchandisingstoresDepartmentstores
(¥ trillion)
31%
16% 42%
11% 22%
10%
53%
15%
(Source: YANO research, NSSB estimate)
Department
stores
GMS
Specialty stores
/ Select shops
Others Department
stores
GMS
Specialty stores
/ Select shops
Others
2004
10.0
¥ trillion
2015
9.4
¥ trillion
© 2017 NIPPON STEEL & SUMIKIN BUSSAN CORPORATION All Rights Reserved.
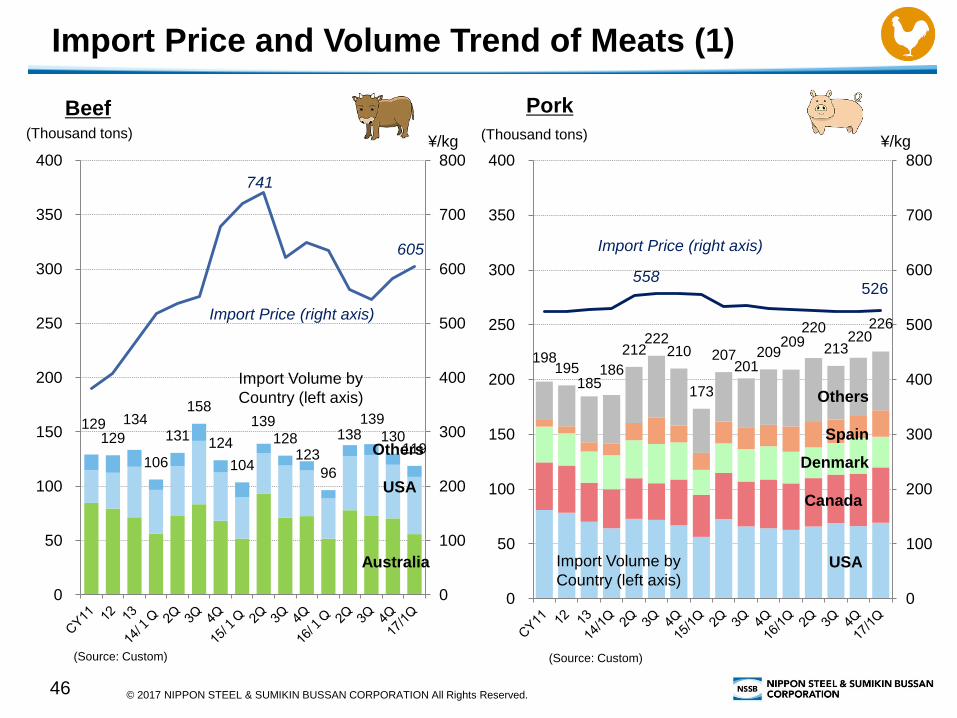
Import Price and Volume Trend of Meats (1)
46
129 129
134
106
131
158
124
104
139 128
123
96
138 139
130 119
741
605
0
100
200
300
400
500
600
700
800
0
50
100
150
200
250
300
350
400
¥/kg
198 195
185 186
212 222
210
173
207 201
209 209
220
213 220
226
558 526
0
100
200
300
400
500
600
700
800
0
50
100
150
200
250
300
350
400
¥/kg
Beef Pork
(Thousand tons)
Australia
USA Canada
USA
Import Price (right axis)
Denmark
Spain
Others Import Volume by
Country (left axis)
(Thousand tons)
Import Price (right axis)
Import Volume by
Country (left axis)
Others
(Source: Custom) (Source: Custom)
© 2017 NIPPON STEEL & SUMIKIN BUSSAN CORPORATION All Rights Reserved.
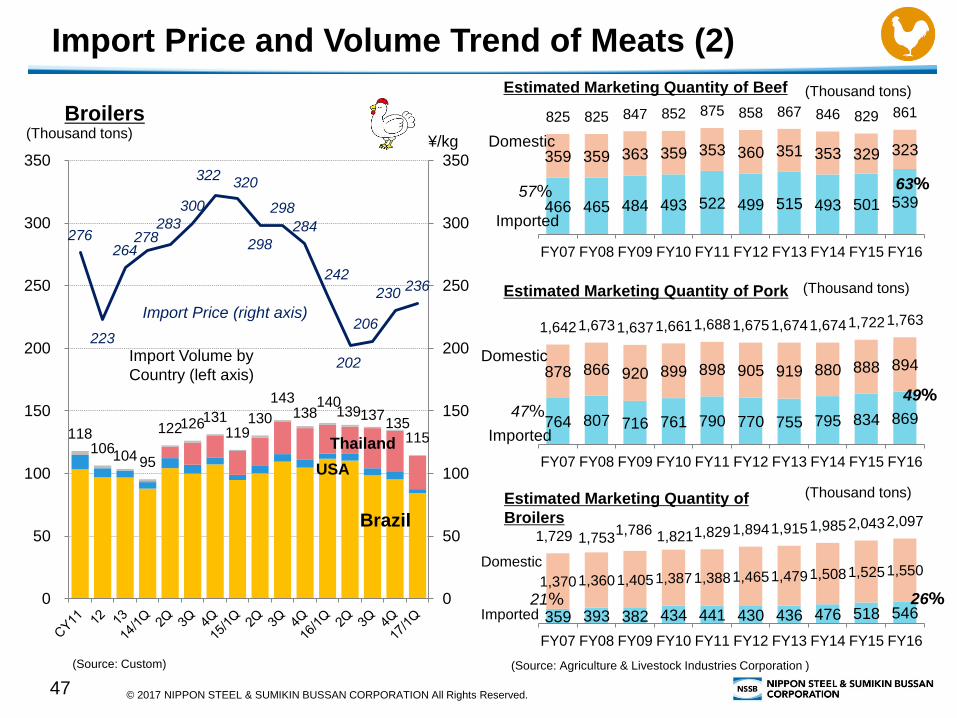
764 807 716 761 790 770 755 795 834 869
878 866 920 899 898 905 919 880 888 894
1,642 1,673 1,637 1,661 1,688 1,675 1,674 1,674 1,722 1,763
FY07 FY08 FY09 FY10 FY11 FY12 FY13 FY14 FY15 FY16
Import Price and Volume Trend of Meats (2)
47
118 106
104 95
122 126 131 119
130
143 138
140 139 137
135 115
276
223
264 278
283
300
322 320
298
298
284
242
202
206
230 236
0
50
100
150
200
250
300
350
0
50
100
150
200
250
300
350
¥/kg
Broilers
466 465 484 493 522 499 515 493 501 539
359 359 363 359 353 360 351 353 329 323
825 825 847 852 875 858 867 846 829 861
FY07 FY08 FY09 FY10 FY11 FY12 FY13 FY14 FY15 FY16
359 393 382 434 441 430 436 476 518 546
1,370 1,360 1,405 1,387 1,388 1,465 1,479 1,508 1,525 1,550
1,729 1,753 1,786 1,821 1,829 1,894 1,915 1,985 2,043 2,097
FY07 FY08 FY09 FY10 FY11 FY12 FY13 FY14 FY15 FY16
63%
49%
26%
57%
47%
21%
Brazil
USA
Thailand
(Thousand tons)
Import Price (right axis)
Import Volume by
Country (left axis)
(Source: Custom)
Imported
Domestic
Estimated Marketing Quantity of Beef
(Source: Agriculture & Livestock Industries Corporation )
Imported
Domestic
(Thousand tons)
(Thousand tons)
(Thousand tons)
Estimated Marketing Quantity of Pork
Estimated Marketing Quantity of
Broilers
Imported
Domestic
© 2017 NIPPON STEEL & SUMIKIN BUSSAN CORPORATION All Rights Reserved.
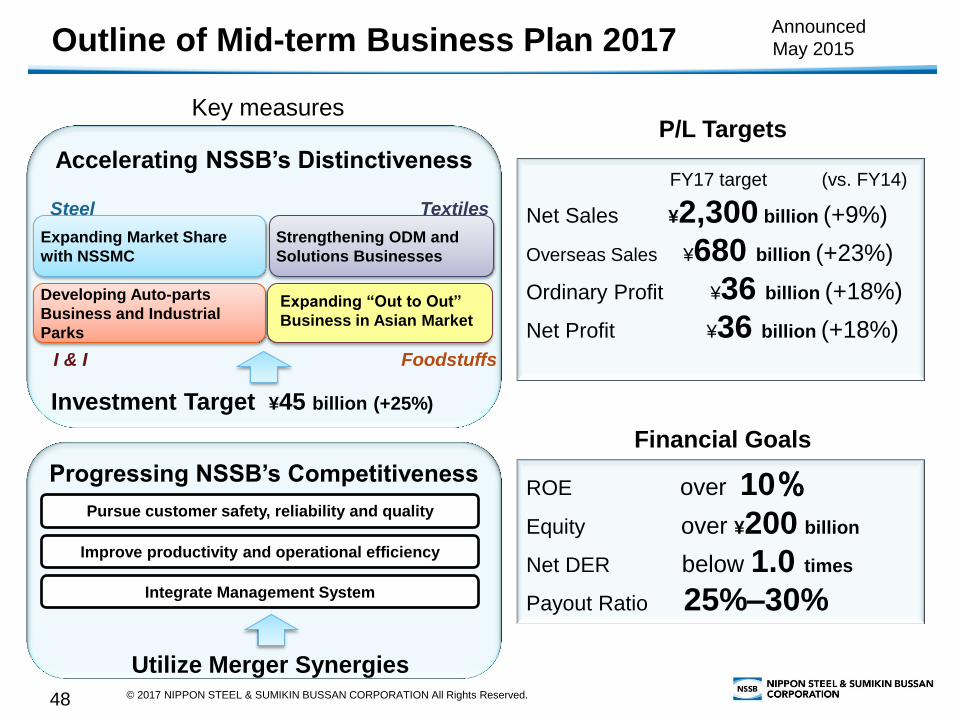
Outline of Mid-term Business Plan 2017
Key measures
48
Announced
May 2015
Progressing NSSB’s Competitiveness
Accelerating NSSB’s Distinctiveness
Pursue customer safety, reliability and quality
Improve productivity and operational efficiency
Developing Auto-parts
Business and Industrial
Parks
Expanding Market Share
with NSSMC
Expanding “Out to Out”
Business in Asian Market
Strengthening ODM and
Solutions Businesses
Investment Target ¥45 billion (+25%)
FY17 target (vs. FY14)
Net Sales ¥2,300 billion (+9%)
Overseas Sales ¥680 billion (+23%)
Ordinary Profit ¥36 billion (+18%)
Net Profit ¥36 billion (+18%)
Utilize Merger Synergies
ROE over 10%
Equity over ¥200 billion
Net DER below 1.0 times
Payout Ratio 25%–30%
P/L Targets
Financial Goals
Steel Textiles
Foodstuffs I & I
Integrate Management System
© 2017 NIPPON STEEL & SUMIKIN BUSSAN CORPORATION All Rights Reserved. 49
Corporate Philosophy
1. Continuing to be a corporate group driven by the aspiration of providing
goods and services that offer new value to the larger society.
2. Putting trust and reliability first, and by doing so developing together with our customers.
3. Aiming to become the kind of organization that increasingly cultivates, utilizes, and values human resources and their talents.
The current material is not subject to the audit procedures based on the Financial Instruments and Exchange Law and it does not
guarantee the accuracy and the completeness of the material.
Forecasts regarding future performance in these materials are based on assumptions judged to be valid and information available to the
Company at the time the materials were created. These materials are not promises by the Company regarding future performance.
Actual performance may differ significantly from these forecasts for a number of reasons. Nothing in this document shall be considered
as an offer to sell or solicitation of an offer to buy any security, commodity or other instrument. No responsibility or liability can be
accepted for errors or omissions or for any losses arising from the use of this information.


