40
White Paper on Local Public Finance, 2018 – I llustrated – FY2016 Settlement

White Paper onLocal Public Finance, 2018
– Illustrated –
FY2016 Set t lement

Contents
The Role of Local Public Finance …………………………………………………… 01
FY2016 Settlement Overview ………………………………………………………… 05
Revenues …………………………………………………………………………………… 071. Revenue Breakdown …………………………………………………………………… 07
2. Revenues in Regular Portion and Great East Japan Earthquake Portion …………………… 08
3. Revenue Trends ………………………………………………………………………… 09
4. Ratio of National Taxes and Local Taxes ………………………………………………… 10
5. Local Taxes (Composition, Trends, Index of Per Capita Tax Revenue) …………………………………………… 10
6. Local Allocation Tax …………………………………………………………………… 13
Expenditures ……………………………………………………………………………… 141. Expenses Classified by Purpose ………………………………………………………… 14
2. Expenditures in Regular Portion and Great East Japan Earthquake Portion (Expenses Classified by Purpose) … 15
3. Breakdown of Expenses Classified by Purpose (Public Welfare Expenses, Educational Expenses, Civil Engineering Work Expenses) … 16
4. Expenses Classified by Type …………………………………………………………… 18
5. Expenditures in Regular Portion and Great East Japan Earthquake Portion (Expenses Classified by Type) … 19
6. Breakdown of Expenses Classified by Type(Social Assistance Expenses, Personnel Expenses, Ordinary Construction Work Expenses, Subsidizing Expenses, Transfers to Other Accounts) …… 20
Flexibility of the Financial Structure ……………………………………………… 241. Ordinary Balance Ratio (Trends and Breakdown) ………………………………………………… 24
2. Real Debt Service Ratio and Debt Service Payment Ratio (Trends) …………………………… 25
Future Financial Burden ………………………………………………………………… 261. Trends in Outstanding Local Government Bonds and Debt Burden ……………………… 26
2. Trends in Outstanding Borrowing Borne by the Ordinary Accounts ……………………… 26
3. Trends in Balance of Funds …………………………………………………………… 27
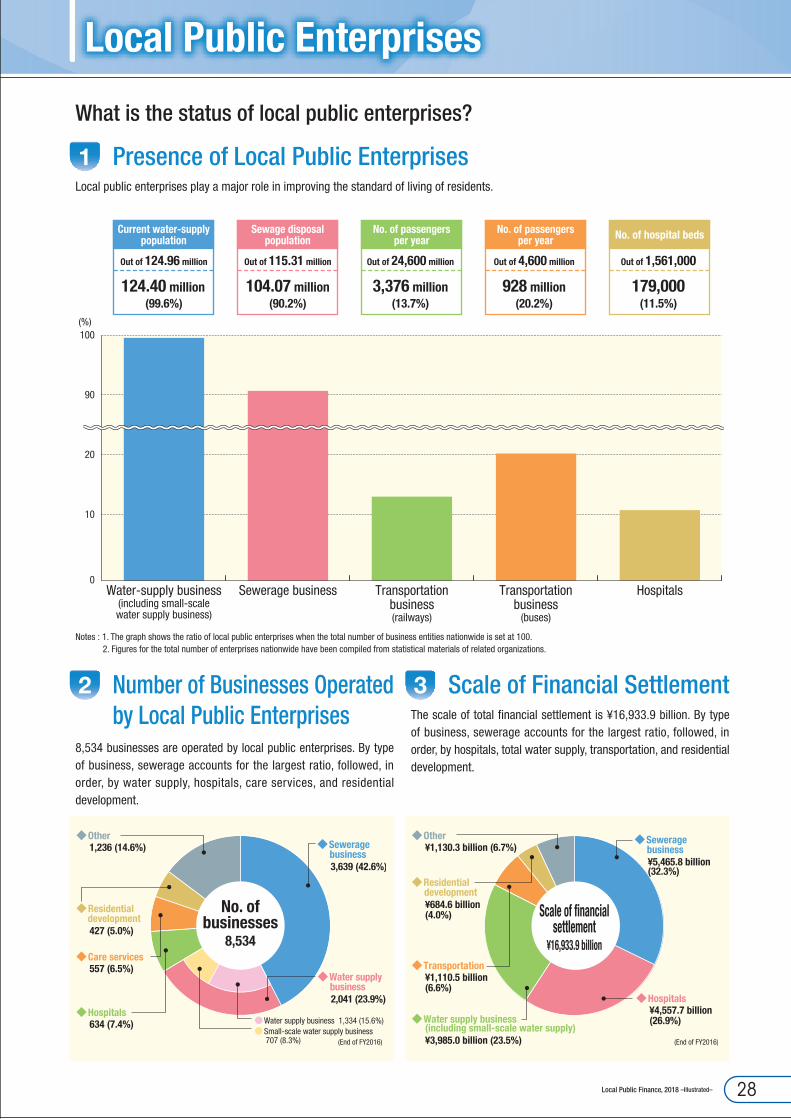
Local Public Enterprises ………………………………………………………………… 281. Presence of Local Public Enterprises …………………………………………………… 28
2. Number of Businesses Operated by Local Public Enterprises …………………………… 28
3. Scale of Financial Settlement …………………………………………………………… 28
4. Financial Status ………………………………………………………………………… 29
Impact of Great East Japan Earthquake ………………………………………… 301. Settlement of Disaster-Struck Organizations (revenues, expenditures classified by purpose, expenditures classified by type) … 30
2. Financial Status of Businesses of Local Public Enterprises of Disaster-Struck Organizations … 32
Promotion of the Soundness of Local Public Finance ………………………… 331. Overview of the Act on Assurance of Sound Financial Status of Local Governments ……… 33
2. Status of the Ratios for Measuring Financial Soundness and Financial Shortfall Ratio …… 34
1 “Net totals of the revenues and expenditures” are the ordinary net account totals of 3,061 organizations (47 prefectures, 1,718 municipalities, 23 special wards, 1,207 partial administrative associations and 113 wide- area local public bodies).
2 Figures for each item that are less than the given unit are rounded off. Therefore, they do not necessarily add up exactly to the total.
3 In FY2011, the revenues and expenditures of ordinary accounts were divided into the regular portion (Overall settlement figures less the Great East Japan Earthquake portion) and the Great East Japan Earthquake portion (Covering the revenues and expenditures related to recovery and reconstruction work and nationwide disaster prevention work).

The Role of Local Public Finance
Etc.
School education Welfare
Roads Fire service
General administrative sector accounts
Ordinary accounts
Other accounts (Public business
accounts)
Public enterprise accounts
● Water supply ● Transportation ● Electrical power ● Gas● Hospitals ● Sewerage systems ● Residential land development Etc.
National health insurance accounts
Latter-stage elderly medical care
accounts
Nursing care insurance accounts
Etc.
Local Government Accounts
Prefectures and municipalities (cities, towns, and villages) are the central actors in various areas of public services, including school education, public welfare and health, police and fire services, and public works such as roads and sewage systems, thereby fulfilling a major role in the lives of the citizens of the nation. This brochure describes the status of local public finance (which comprises collectively the finances of individual local governments), the state of settlements for FY2016, and the initiatives of local governments towards sound public finances (mainly the status of the ratios for measuring their financial soundness), with particular attention given to ordinary accounts (Public enterprises, such as water supply, transportation, and hospitals are described in the section on Local Public Enterprises).
Classification of the Accounts of Local Governments Applied in the Settlement Account StatisticsThe accounts of local governments are divided into the general accounts and the special accounts, but classification of these accounts varies between local governments. Therefore, the accounts are classified in a standardized manner into ordinary accounts, which cover the general administrative sector, and other accounts (public business accounts). This makes it possible to clarify the financial condition of local governments as a whole and to make a statistical comparison between local governments.
White Paper on Local Public Finance, 201801

¥22,039.3 billion
(4.1%)
¥58,531.5 billion
(10.9%)
¥45,333.9 billion
(8.4%)
¥7,258.4 billion
(1.3%)
¥133,163.2 billion
(24.7%)
¥312,221.4 billion
(57.9%)
¥88,567.2 billion
(16.4%)¥5,302.6 billion
(1.0%)
△50
0
50
100
150
200
250
300
350
400
(trillion yen)
¥400,788.6 billion(74.3%)
Private sector Net export of goods and servicesPublic sector
Gross Domestic Product (expenditure, nominal)
¥539,254.3 billion (100%)
Central government Local governments
Public corporationsSocial security funds Household sectorNet export
450
Corporate sector
Gross Domestic Product (Expenditure, nominal) and Local Public Finance (FY2016)
How large is local public finance?The ratio of expenditure by local governments in gross domestic product (nominal) is 10.9%, about 2.7 times that of the central government.
Local Public Finance, 2018 –Illustrated– 02

The Role of Local Public Finance
●Public gross capital formation¥6,325.6 billion (4.8%)
Central government¥22,039.3 billion (16.6%)●Government
�nal consumption expenditure¥15,713.7 billion (11.8%)
●Government �nal consumption expenditure
¥45,199.2 billion (33.9%)
●Public gross capital formation¥13,332.3 billion (10.0%)
●Public gross capital formation¥41.2 billion (0.0%)
●Government �nal consumption expenditure
¥45,292.7 billion (34.0%)
Social security funds¥45,333.9 billion(34.0%)
Local governments¥58,531.5 billion (44.0%)
●Public gross capital formation¥7,258.4 billion (5.5%)
Public corporations¥7,258.4 billion (5.5%)
Publicexpenditures¥133,163.2 billion
(100.0%)
0 20 40 60 80 100
Government �nalconsumption expenditure¥106,205.6 billion
Public gross capitalformation
¥26,957.5 billion
Central government Social security funds Local governments Public corporations
(%)
14.8% 42.6% 42.6%
23.5% 0.2% 49.5% 26.9%
55,432.7 (11.3)
23,168.8 (4.7)
37,489.0 (7.6)
¥123,166.6billion (25.0) (45.0)
58,389.6 (11.3)
22,488.4 (4.3)
43,588.0 (8.4)
¥131,483.5billion (25.4) (44.4)
58,586.7 (11.0)
21,791.8 (4.1)
45,129.6 (8.5)
¥132,823.9billion (24.9) (44.1)
57,404.0 (10.8)
22,808.2 (4.3)
34,000.0 (6.4)
¥120,901.3billion (22.9) (47.5)
56,670.7 (10.7)
22,688.3 (4.3)
35,257.8 (6.6)
¥121,670.9billion (22.9) (46.6)
56,739.5 (11.2)
22,798.0 (4.5)
42,467.3 (8.4)
¥128,782.3billion (25.4) (44.1)
55,931.6 (11.2)
21,368.5 (4.3)
38,914.2 (7.8)
¥122,755.8billion (24.6) (45.6)
56,053.6 (11.3)
21,232.4 (4.3)
40,355.5 (8.2)
¥123,962.7billion (25.1) (45.2)
55,776.0 (11.3)
20,883.7 (4.2)
41,436.6 (8.4)
¥124,775.6billion (25.2) (44.7)
54,777.4 (10.8)
22,667.9 (4.4)
36,009.9 (7.1)
7,076.0 (1.4)
7,017.5 (1.4)
7,315.8 (1.4) 6,689.1
(1.3) 7,054.1 (1.3)
6,777.4 (1.3) 6,541.5
(1.3) 6,321.2 (1.3)
6,679.3 (1.4) 6,972.0
(1.4)
¥120,427.1billion (23.6) (45.5)
●Social security funds
●Publiccorporations
●Central government
●Local governments
Public expenditures
FY2006 FY2007 FY2008 FY2009 FY2010 FY2011 FY2014 FY2015¥133,163.2
billion (24.7%) (44.0%)
FY2016FY2013FY2012 Amount ofpublic expendituresPercentage of publicexpenditures in grossdomestic product(expenditure, nominal)Local share of publicexpenditures
58,531.5(10.9)
22,039.3(4.1)
45,333.9(8.4)
7,258.4(1.3)
Breakdown of public expenditures
Trends in public expenditures
How large is local government expenditure in total public expenditure?Looking at the breakdown of public expenditure classified by final expenditure entity, local government expenditure accounts for 42.6% of Government final consumption expenditure, and 49.5% of Public gross capital formation. As a final expenditure entity, local governments above the central government and play a major role for the national economy.
White Paper on Local Public Finance, 201803
%99% %1%
%87% %13%
%78% %22%
%78% %22%
%36% %64%
%46% %54%
%78% %22%
%44% %56%
3%3% %97%%100%
%100%
%76% %24%
%100%
%74% %26%
%71% %29%
%63% %37%
%62% %38%
Sanitation expenses 3.7%
School education expenses 8.9%
Land development expenses 8.2%
Commercial andindustrial expenses 5.0%
Disaster recovery expenses,etc. 0.6%
Debt services 20.6%
Pension expenses(of public welfare expenses) 6.7%
Defense expenses 3.0%
Other 1.5%
Judicial, police, and�re service expenses 4.0%
Social educationexpenses, etc.
2.9%
Public welfare expenses(excluding pension expenses) 22.4%
Land conservation expenses 1.6%
Agriculture, forestry and�shery expenses 1.7%
Housing expenses, etc. 1.6%
Onkyu pension expenses 0.2%
General administrativeexpenses, etc. 7.4%
Public health centers, garbage disposal, etc.Public health centers, garbage disposal, etc.
Elementary and junior high schools, kindergartens, etc.Elementary and junior high schools, kindergartens, etc.
Community centers, libraries, museums, etc.Community centers, libraries, museums, etc.
Rivers and coastsRivers and coasts
Family register, basic resident register, etc.Family register, basic resident register, etc.
Urban planning, roads and bridges, public housing, etc.Urban planning, roads and bridges, public housing, etc.
Child welfare, elderly care and welfare, public assistance, etc.Child welfare, elderly care and welfare, public assistance, etc.
Local 57.8%Local 57.8% Central 42.2%Central 42.2%
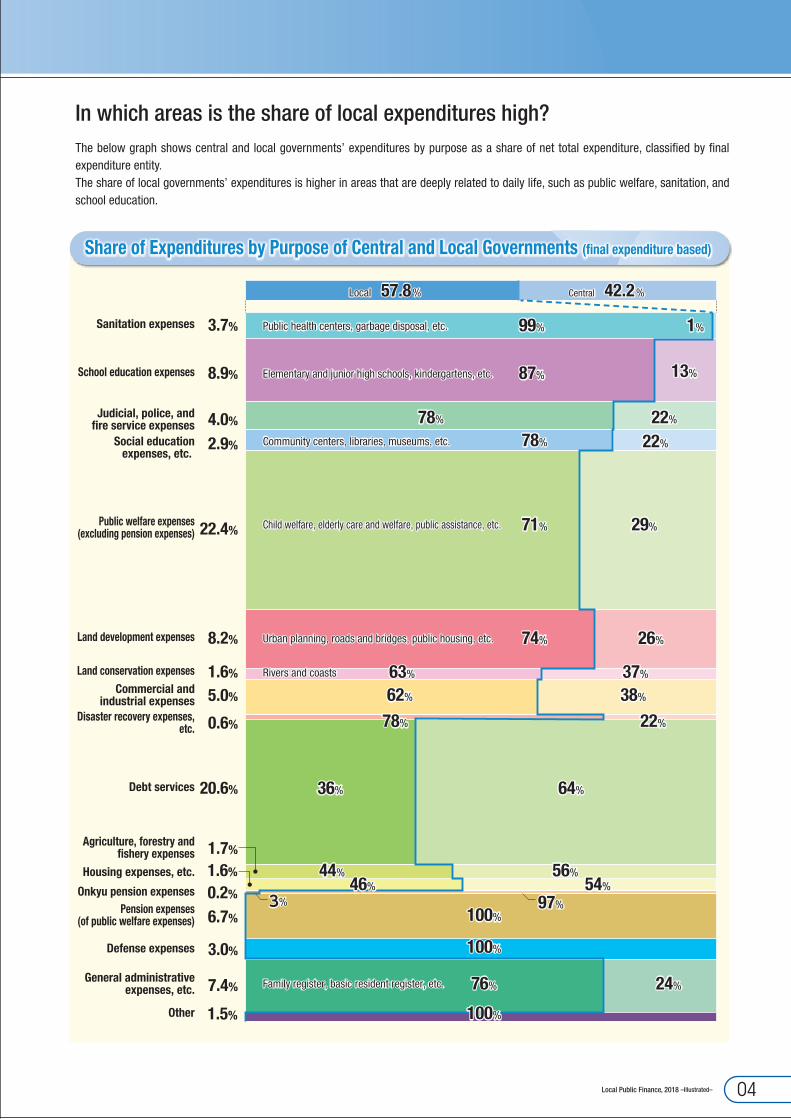
Share of Expenditures by Purpose of Central and Local Governments (final expenditure based)
In which areas is the share of local expenditures high?The below graph shows central and local governments’ expenditures by purpose as a share of net total expenditure, classified by final expenditure entity.The share of local governments’ expenditures is higher in areas that are deeply related to daily life, such as public welfare, sanitation, and school education.
Local Public Finance, 2018 –Illustrated– 04

FY2016 Settlement Overview
1 Revenues¥101,459.8 billion (down ¥457.6 billion, 0.4% year on year)
Regular portion: ¥97,642.2 billion (up ¥131.1 billion, 0.1% year on year)Great East Japan Earthquake portion: ¥3,817.7 billion (down ¥588.8 billion, 13.4% year on year)
The increase of revenues in the regular portion resulted from an increase in National treasury disbursements, etc.The decrease in revenues in the Great East Japan Earthquake portion resulted from a decrease in transfers from other accounts, etc.
2 Expenditures¥98,141.5 billion (down ¥263.8 billion, 0.3% year on year)
Regular portion: ¥94,766.6 billion (up ¥195.8 billion, 0.2% year on year)Great East Japan Earthquake portion: ¥3,374.9 billion (down ¥459.5 billion, 12.0% year on year)
The increases of expenditure in the regular portion resulted from an increase in social assistance expenses, etc. The decrease in expenditures in the Great East Japan Earthquake portion resulted from a decrease in Ordinary construction work expenses, etc.
3 Revenue and Expenditure SettlementThe real balance showed a surplus of ¥1,960.5 billion.
CategoryAccount Settlement No. of local governments with a deficit
FY2016 FY2015 FY2016 FY2015
Real balance ¥1,960.5 billion ¥1,962.4 billion - -
Single year balance ¥2.8 billion ¥125.2 billion 1,702 1,133
Real single year balance ▲¥100.1 billion ¥501.8 billion 1,595 1,055
Notes : Real balance refers to the amount calculated by subtracting the revenue resources that should be carried over to the next fiscal year from the income expenditure balance. Single year balance refers to the amount calculated by subtracting the real balance of the previous fiscal year from the real balance of the relevant fiscal year. Real single year balance refers to the amount calculated by adding reserves and advanced redemption of local loans for the public finance adjustment fund to the single year balance and subtracting public finance adjustment fund reversals.
White Paper on Local Public Finance, 201805
85
0
90
95
100
105
99.8
96.4
93.8
91.1
5.3
6.0
101.1
97.4
96.2 97.5 97.5
4.9
93.2 94.5 94.6
4.2
102.1
98.54.6
4.0
(trillion yen)
FY2013 FY2014 FY2015 FY2016FY2012FY2006
4.44.4
3.83.898.4
101.93.83.8
3.43.4
¥98.1 trillion
¥101.5 trillion
Expenditures (Earthquake portion)Expenditures (Regular portion)
Revenues (Earthquake portion)Revenues (Regular portion)
91.589.2
97.6
94.8
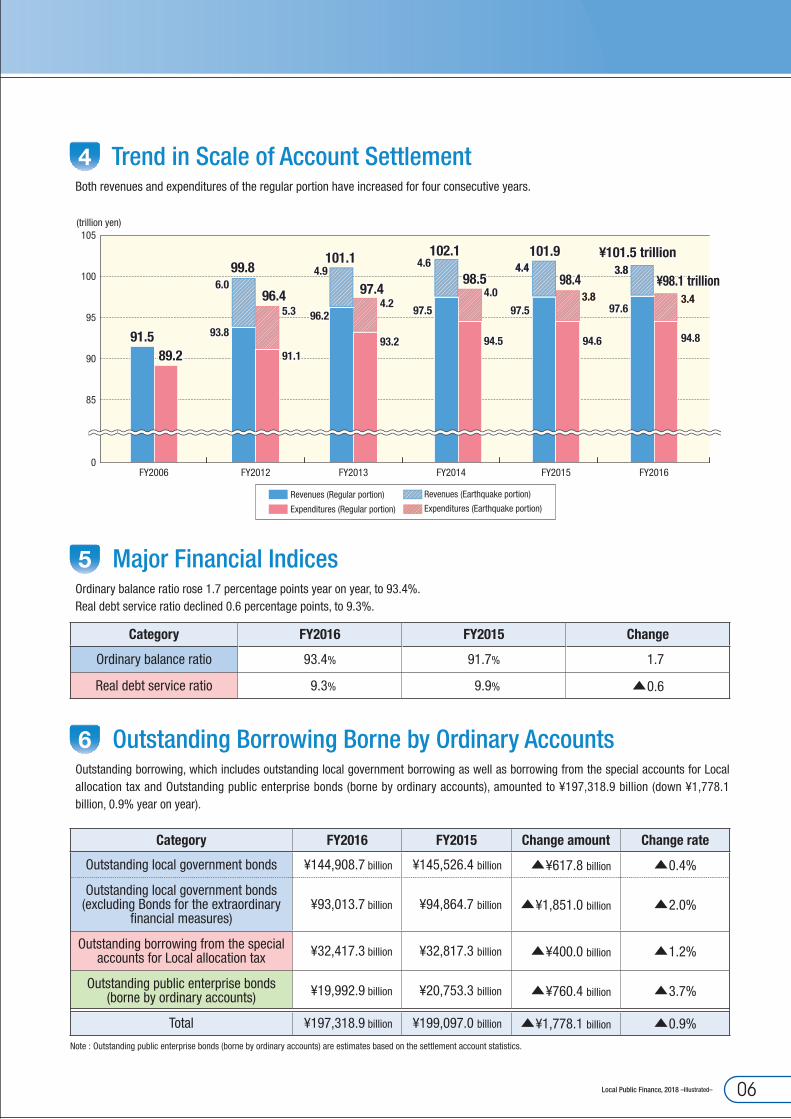
4 Trend in Scale of Account SettlementBoth revenues and expenditures of the regular portion have increased for four consecutive years.
5 Major Financial IndicesOrdinary balance ratio rose 1.7 percentage points year on year, to 93.4%.Real debt service ratio declined 0.6 percentage points, to 9.3%.
Category FY2016 FY2015 Change
Ordinary balance ratio 93.4% 91.7% 1.7
Real debt service ratio 9.3% 9.9% ▲0.6
6 Outstanding Borrowing Borne by Ordinary AccountsOutstanding borrowing, which includes outstanding local government borrowing as well as borrowing from the special accounts for Local allocation tax and Outstanding public enterprise bonds (borne by ordinary accounts), amounted to ¥197,318.9 billion (down ¥1,778.1 billion, 0.9% year on year).
Category FY2016 FY2015 Change amount Change rate
Outstanding local government bonds ¥144,908.7 billion ¥145,526.4 billion ▲¥617.8 billion ▲0.4%
Outstanding local government bonds(excluding Bonds for the extraordinary
financial measures)¥93,013.7 billion ¥94,864.7 billion ▲¥1,851.0 billion ▲2.0%
Outstanding borrowing from the specialaccounts for Local allocation tax ¥32,417.3 billion ¥32,817.3 billion ▲¥400.0 billion ▲1.2%
Outstanding public enterprise bonds(borne by ordinary accounts) ¥19,992.9 billion ¥20,753.3 billion ▲¥760.4 billion ▲3.7%
Total ¥197,318.9 billion ¥199,097.0 billion ▲¥1,778.1 billion ▲0.9%
Note : Outstanding public enterprise bonds (borne by ordinary accounts) are estimates based on the settlement account statistics.
Local Public Finance, 2018 –Illustrated– 06
Revenues
General revenue resources¥59,094.9 billion (58.2%)
Prefecturestotal
¥51,623.1 billion
General revenue resources¥31,276.7 billion (60.6%)
●Local taxes¥20,251.6 billion (39.2%)
●Local transfer tax¥1,924.8 billion (3.7%)
●Special local grants¥49.3 billion (0.1%)
●Local allocation tax¥9,050.0 billion (17.5%)
●Other general revenue resources¥1.0 billion (0.0%)
General revenue resources¥30,487.6 billion (52.2%)
◆Other revenue resources¥9,868.9 billion (16.8%)
◆Prefectural disbursements¥3,954.0 billion (6.8%)
◆Local bonds¥4,889.2 billion (8.4%)●Bonds for the
extraordinary �nancial measures¥1,569.3 billion (2.7%)
◆National treasury disbursements¥9,201.0 billion (15.8%)
●Local taxes¥19,140.7 billion (32.8%)
●Local transfer tax¥415.4 billion (0.7%)
●Special local grants¥74.0 billion (0.1%)
●Local allocation tax¥8,189.0 billion (14.0%)
●Other general revenue resources¥2,668.5 billion (4.6%)
Net total¥101,459.8 billion
◆National treasury disbursements¥15,687.1 billion (15.5%)
◆Local bonds¥10,387.3 billion (10.2%)
◆Other revenue resources¥16,290.5 billion (16.1%)
●Local taxes¥39,392.4 billion (38.8%)
●Bonds for the extraordinary �nancial measures¥3,739.4 billion (3.7%)
●Local transfer tax¥2,340.2 billion (2.3%)
●Special local grants¥123.3 billion (0.1%)
●Local allocation tax¥17,239.0 billion (17.0%)
Municipalities total
¥58,400.7 billion
◆National treasury disbursements¥6,486.1 billion (12.6%)
◆Local bonds¥5,526.1 billion (10.7%)
◆Other revenue resources¥8,334.2 billion (16.1%)
●Bonds for the extraordinary �nancial measures¥2,170.1 billion(4.2%)
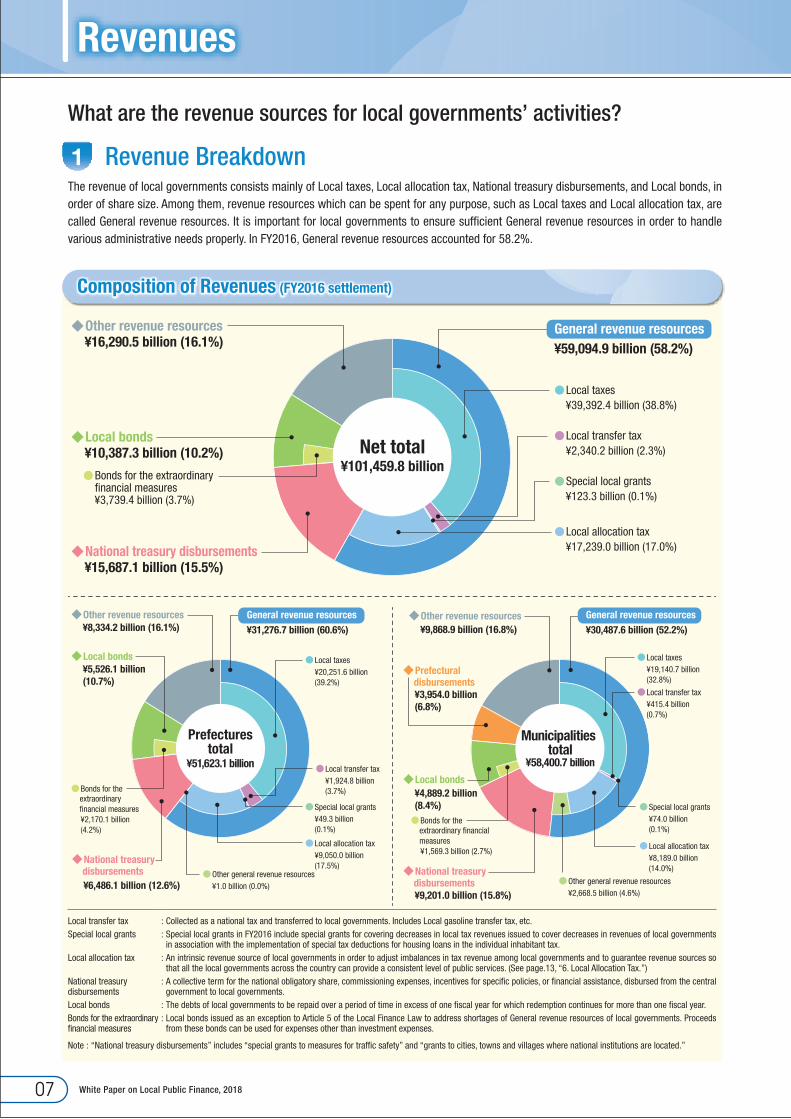
Composition of Revenues (FY2016 settlement)
What are the revenue sources for local governments’ activities?
1 Revenue BreakdownThe revenue of local governments consists mainly of Local taxes, Local allocation tax, National treasury disbursements, and Local bonds, in order of share size. Among them, revenue resources which can be spent for any purpose, such as Local taxes and Local allocation tax, are called General revenue resources. It is important for local governments to ensure sufficient General revenue resources in order to handle various administrative needs properly. In FY2016, General revenue resources accounted for 58.2%.
Local transfer tax : Collected as a national tax and transferred to local governments. Includes Local gasoline transfer tax, etc.Special local grants : Special local grants in FY2016 include special grants for covering decreases in local tax revenues issued to cover decreases in revenues of local governments
in association with the implementation of special tax deductions for housing loans in the individual inhabitant tax.Local allocation tax : An intrinsic revenue source of local governments in order to adjust imbalances in tax revenue among local governments and to guarantee revenue sources so
that all the local governments across the country can provide a consistent level of public services. (See page.13, “6. Local Allocation Tax.”)National treasury disbursements
: A collective term for the national obligatory share, commissioning expenses, incentives for specific policies, or financial assistance, disbursed from the central government to local governments.
Local bonds : The debts of local governments to be repaid over a period of time in excess of one fiscal year for which redemption continues for more than one fiscal year.Bonds for the extraordinary financial measures
: Local bonds issued as an exception to Article 5 of the Local Finance Law to address shortages of General revenue resources of local governments. Proceeds from these bonds can be used for expenses other than investment expenses.
Note : “National treasury disbursements” includes “special grants to measures for traffic safety” and “grants to cities, towns and villages where national institutions are located.”
White Paper on Local Public Finance, 201807
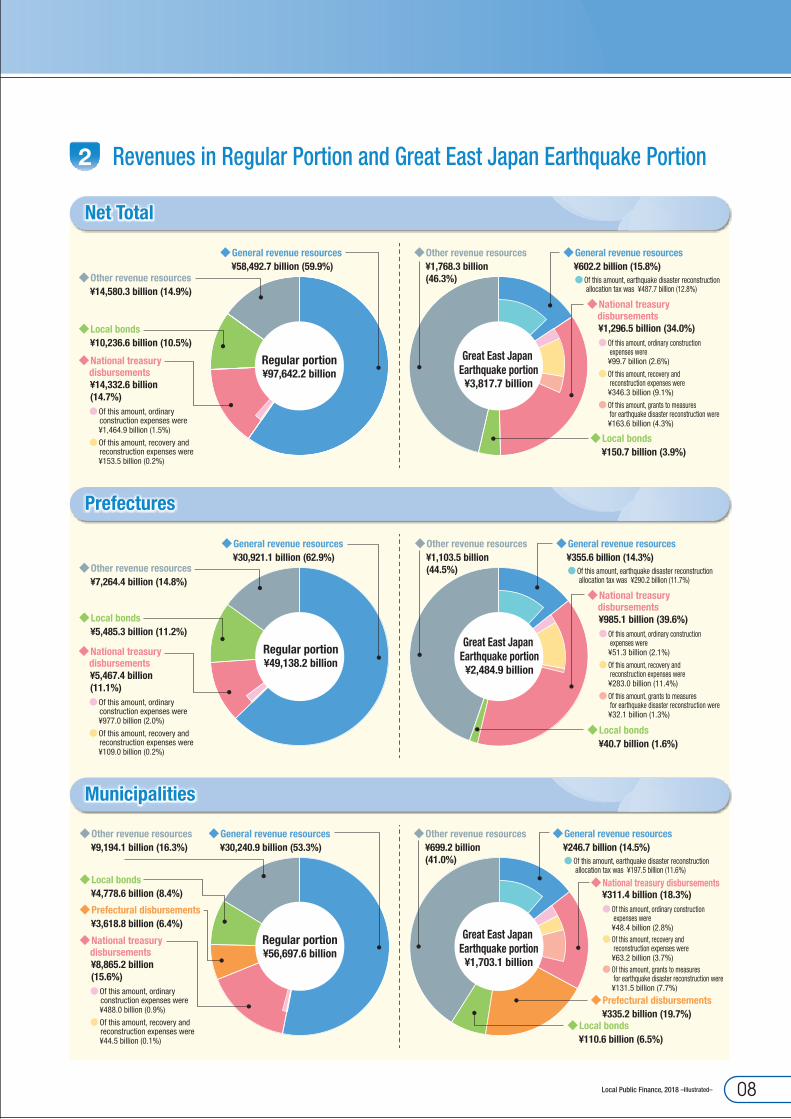
Regular portion¥97,642.2 billion
◆Other revenue resources¥14,580.3 billion (14.9%)
◆Local bonds¥10,236.6 billion (10.5%)
Great East Japan Earthquake portion
¥3,817.7 billion
◆Other revenue resources¥1,768.3 billion (46.3%)
◆General revenue resources¥602.2 billion (15.8%)●Of this amount, earthquake disaster reconstruction
allocation tax was ¥487.7 billion (12.8%)
◆Local bonds¥150.7 billion (3.9%)
◆National treasury disbursements¥14,332.6 billion (14.7%)●Of this amount, ordinary
construction expenses were¥1,464.9 billion (1.5%)
●Of this amount, recovery and reconstruction expenses were¥153.5 billion (0.2%)
◆General revenue resources¥58,492.7 billion (59.9%)
◆National treasury disbursements¥1,296.5 billion (34.0%)●Of this amount, ordinary construction
expenses were¥99.7 billion (2.6%)
●Of this amount, recovery and reconstruction expenses were¥346.3 billion (9.1%)
●Of this amount, grants to measures for earthquake disaster reconstruction were¥163.6 billion (4.3%)
Regular portion¥49,138.2 billion
◆General revenue resources¥30,921.1 billion (62.9%)
◆Other revenue resources¥7,264.4 billion (14.8%)
◆Local bonds¥5,485.3 billion (11.2%)
Great East Japan Earthquake portion
¥2,484.9 billion
◆Other revenue resources¥1,103.5 billion (44.5%)
◆General revenue resources¥355.6 billion (14.3%)●Of this amount, earthquake disaster reconstruction
allocation tax was ¥290.2 billion (11.7%)
◆National treasury disbursements¥985.1 billion (39.6%)●Of this amount, ordinary construction
expenses were¥51.3 billion (2.1%)
●Of this amount, recovery and reconstruction expenses were¥283.0 billion (11.4%)
●Of this amount, grants to measures for earthquake disaster reconstruction were¥32.1 billion (1.3%)
◆Local bonds¥40.7 billion (1.6%)
◆National treasury disbursements¥5,467.4 billion (11.1%)●Of this amount, ordinary
construction expenses were¥977.0 billion (2.0%)
●Of this amount, recovery and reconstruction expenses were¥109.0 billion (0.2%)
◆General revenue resources¥30,240.9 billion (53.3%)
Regular portion¥56,697.6 billion
◆Other revenue resources¥9,194.1 billion (16.3%)
◆Local bonds¥4,778.6 billion (8.4%)
◆Prefectural disbursements¥3,618.8 billion (6.4%)
◆Other revenue resources¥699.2 billion (41.0%)
◆General revenue resources¥246.7 billion (14.5%)●Of this amount, earthquake disaster reconstruction
allocation tax was ¥197.5 billion (11.6%)
◆Local bonds¥110.6 billion (6.5%)
◆Prefectural disbursements¥335.2 billion (19.7%)
◆National treasury disbursements¥8,865.2 billion (15.6%)●Of this amount, ordinary
construction expenses were¥488.0 billion (0.9%)
●Of this amount, recovery and reconstruction expenses were¥44.5 billion (0.1%)
◆National treasury disbursements¥311.4 billion (18.3%)●Of this amount, ordinary construction
expenses were¥48.4 billion (2.8%)
●Of this amount, recovery and reconstruction expenses were¥63.2 billion (3.7%)
●Of this amount, grants to measures for earthquake disaster reconstruction were¥131.5 billion (7.7%)
Great East Japan Earthquake portion
¥1,703.1 billion
Municipalities
Net Total
Prefectures
2 Revenues in Regular Portion and Great East Japan Earthquake Portion
Local Public Finance, 2018 –Illustrated– 08
Revenues
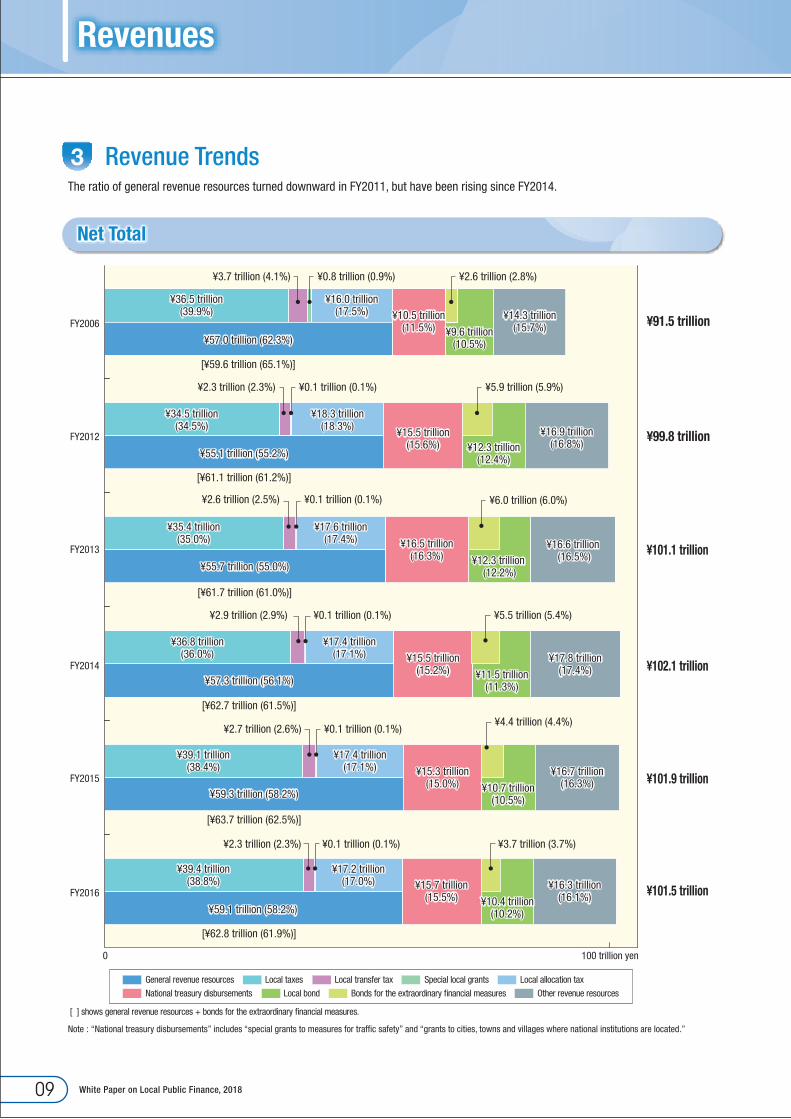
[ ] shows general revenue resources + bonds for the extraordinary �nancial measures.
FY2015
FY2016
FY2012
FY2006
0 100 trillion yen
FY2013
¥16.7 trillion(16.3%)¥10.7 trillion
(10.5%)
¥15.3 trillion(15.0%)
¥59.3 trillion (58.2%)
¥39.1 trillion(38.4%)
¥17.4 trillion(17.1%)
¥2.7 trillion (2.6%) ¥0.1 trillion (0.1%)
[¥63.7 trillion (62.5%)]
¥4.4 trillion (4.4%)
¥101.1 trillion
¥101.9 trillion
¥16.6 trillion (16.5%)¥12.3 trillion
(12.2%)
¥16.5 trillion(16.3%)
¥55.7 trillion (55.0%)
¥35.4 trillion(35.0%)
¥17.6 trillion(17.4%)
¥2.6 trillion (2.5%)
[¥61.7 trillion (61.0%)]
¥0.1 trillion (0.1%) ¥6.0 trillion (6.0%)
¥99.8 trillion¥16.9 trillion(16.8%)¥12.3 trillion
(12.4%)
¥15.5 trillion(15.6%)
¥55.1 trillion (55.2%)
¥34.5 trillion(34.5%)
¥18.3 trillion(18.3%)
¥2.3 trillion (2.3%)
[¥61.1 trillion (61.2%)]
¥0.1 trillion (0.1%) ¥5.9 trillion (5.9%)
Bonds for the extraordinary �nancial measuresLocal bondNational treasury disbursements Other revenue resources
Special local grantsLocal transfer taxLocal taxesGeneral revenue resources Local allocation tax
FY2014¥17.8 trillion
(17.4%)¥11.5 trillion(11.3%)
¥15.5 trillion(15.2%)
¥57.3 trillion (56.1%)
¥36.8 trillion(36.0%)
¥17.4 trillion(17.1%)
¥2.9 trillion (2.9%) ¥0.1 trillion (0.1%)
[¥62.7 trillion (61.5%)]
¥5.5 trillion (5.4%)
¥102.1 trillion
¥91.5 trillion¥14.3 trillion(15.7%)¥9.6 trillion
(10.5%)
¥10.5 trillion(11.5%)
¥57.0 trillion (62.3%)
¥36.5 trillion(39.9%)
¥16.0 trillion(17.5%)
¥3.7 trillion (4.1%) ¥0.8 trillion (0.9%)
[¥59.6 trillion (65.1%)]
¥2.6 trillion (2.8%)
¥101.5 trillion¥16.3 trillion(16.1%)¥10.4 trillion
(10.2%)
¥15.7 trillion(15.5%)
¥59.1 trillion (58.2%)
¥2.3 trillion (2.3%)
¥39.4 trillion(38.8%)
¥17.2 trillion(17.0%)
¥0.1 trillion (0.1%)
[¥62.8 trillion (61.9%)]
¥3.7 trillion (3.7%)
Net Total
3 Revenue TrendsThe ratio of general revenue resources turned downward in FY2011, but have been rising since FY2014.
Note : “National treasury disbursements” includes “special grants to measures for traffic safety” and “grants to cities, towns and villages where national institutions are located.”
White Paper on Local Public Finance, 201809
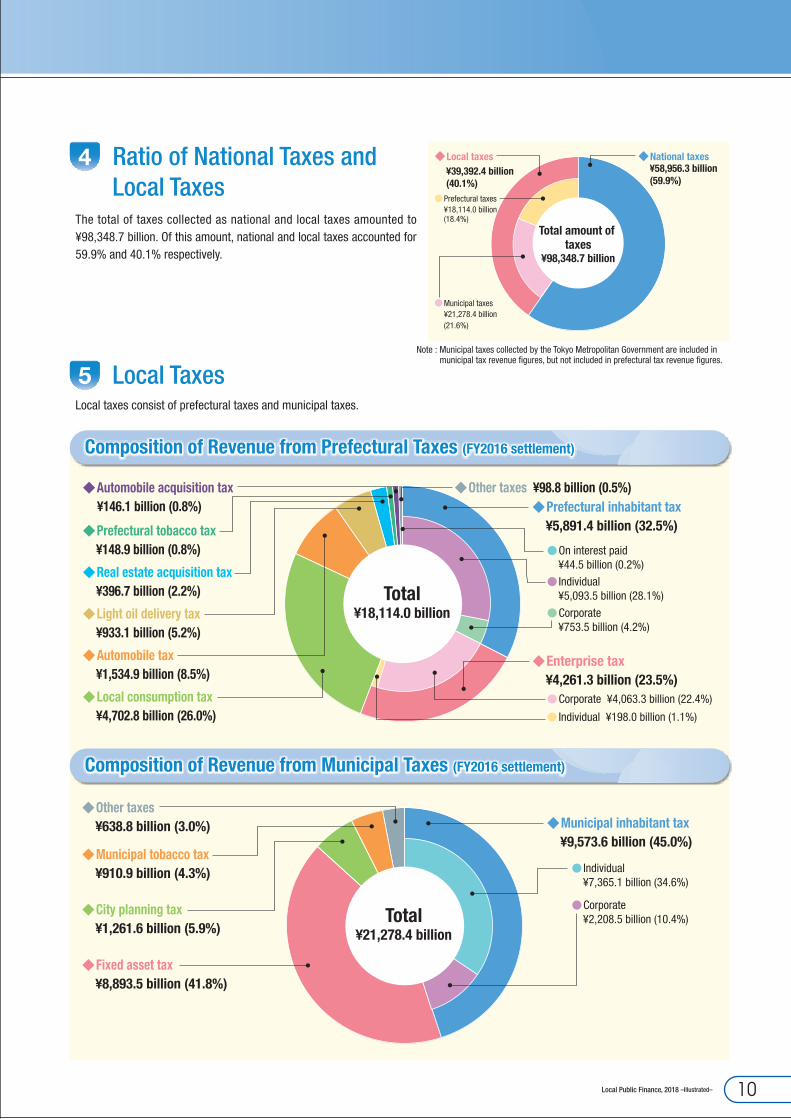
Total¥18,114.0 billion
◆Prefectural inhabitant tax¥5,891.4 billion (32.5%)
◆Enterprise tax¥4,261.3 billion (23.5%)
◆Other taxes ¥98.8 billion (0.5%)◆Automobile acquisition tax ¥146.1 billion (0.8%)
◆Prefectural tobacco tax¥148.9 billion (0.8%)
◆Real estate acquisition tax¥396.7 billion (2.2%)
◆Light oil delivery tax¥933.1 billion (5.2%)
◆Automobile tax¥1,534.9 billion (8.5%)
◆Local consumption tax¥4,702.8 billion (26.0%)
● Individual¥5,093.5 billion (28.1%)
●On interest paid¥44.5 billion (0.2%)
●Corporate¥753.5 billion (4.2%)
●Corporate ¥4,063.3 billion (22.4%)
● Individual ¥198.0 billion (1.1%)
Total¥21,278.4 billion
◆Fixed asset tax¥8,893.5 billion (41.8%)
◆City planning tax¥1,261.6 billion (5.9%)
◆Municipal tobacco tax¥910.9 billion (4.3%)
◆Other taxes ¥638.8 billion (3.0%)
●Corporate¥2,208.5 billion (10.4%)
◆Municipal inhabitant tax¥9,573.6 billion (45.0%)
● Individual¥7,365.1 billion (34.6%)
Total amount of taxes
¥98,348.7 billion
◆National taxes¥58,956.3 billion(59.9%)
●Municipal taxes¥21,278.4 billion (21.6%)
●Prefectural taxes¥18,114.0 billion(18.4%)
◆Local taxes¥39,392.4 billion(40.1%)
Composition of Revenue from Municipal Taxes (FY2016 settlement)
Composition of Revenue from Prefectural Taxes (FY2016 settlement)
4 Ratio of National Taxes and Local Taxes
The total of taxes collected as national and local taxes amounted to ¥98,348.7 billion. Of this amount, national and local taxes accounted for 59.9% and 40.1% respectively.
Note : Municipal taxes collected by the Tokyo Metropolitan Government are included in municipal tax revenue figures, but not included in prefectural tax revenue figures.
5 Local TaxesLocal taxes consist of prefectural taxes and municipal taxes.
Local Public Finance, 2018 –Illustrated– 10

Trends in Prefectural Tax Revenues
Revenues
4.7 5.1
0.8 1.0
0.1
2.43.0
2.6
3.11.6
1.60.9
0.9
5.6
2.5
6.2
3.2
0.1
0.0
14.1
15.7
0.2
0.20.1
0.2
0.3
0.2
0.3
5.0
0.80.1
2.7
2.6
1.6
0.9
5.9
2.9
14.8 0.1
0.2
0.2
0.2
0.40.4
0.1
5.2
0.8
3.5
5.0
1.5
0.9
6.1
3.7
0.10.1
0.2
0.20.4
0.1
FY2015 FY2016FY2012FY2006 FY2013 FY20140
2
4
6
8
10
12
14
16
18
20(trillion yen)
18.0 ¥18.1 trillion
Local consumption tax Other taxesLight oil delivery taxAutomobile acquisition taxAutomobile taxReal estate acquisition tax Prefectural tobacco tax
Prefectural inhabitant tax IndividualCorporateEnterprise taxCorporateOn interest paidIndividual
2.7
1.1
5.4
2.6
1.7
1.1
5.6
4.0
0.2
16.30.1
0.3
0.2
0.5
0.5
5.1
0.8
4.1
4.7
1.5
0.9
5.9
4.3
0.1
0.1
0.2
0.10.4
0.0
Trends in Municipal Tax Revenues
9.1 9.5
6.97.2
2.1 2.3
8.68.8
0.90.91.21.20.50.720.3
9.27.0
2.2
8.7
1.01.20.5
20.6 21.1
9.6
7.1
2.4
8.8
1.01.20.5
21.1
FY2015 FY2016FY2012FY2006 FY2013 FY2014
(trillion yen)
0
2
4
6
8
10
12
14
16
18
20
22
Fixed asset tax Other taxesMunicipal tobacco tax City planning taxCorporateIndividualMunicipal inhabitant tax
9.1
6.2
2.8
8.6
0.91.20.5
20.2
9.67.4
2.2
8.9
0.91.30.6
¥21.3 trillion
Prefectural tax revenues have increased for five consecutive years since FY2012.
Municipal tax revenues remained at almost the same level for the past five years.
Note : Municipal tax revenue figures include municipal taxes collected by the Tokyo Metropolitan Government.
White Paper on Local Public Finance, 201811
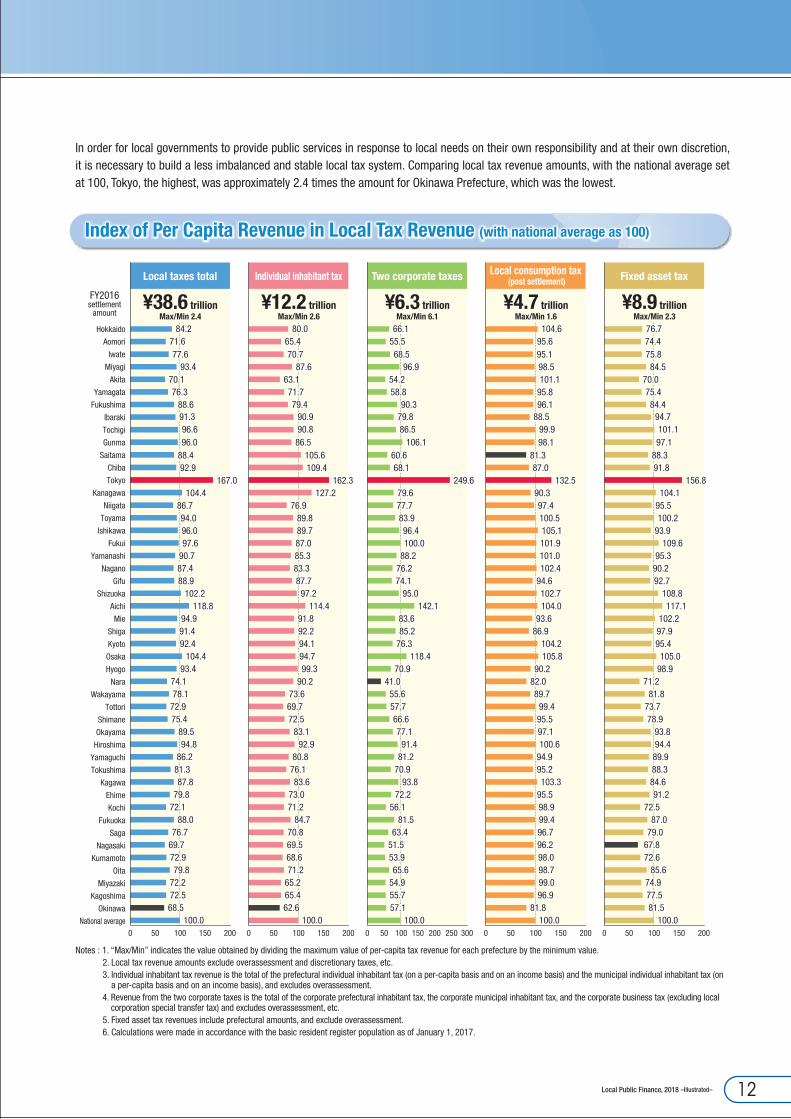
Index of Per Capita Revenue in Local Tax Revenue (with national average as 100)
84.271.677.6
93.470.176.3
88.691.396.696.0
88.492.9
167.0104.4
86.794.096.097.6
90.787.488.9
102.2118.8
94.991.492.4
104.493.4
74.178.1
72.975.4
89.594.8
86.281.387.8
79.872.1
88.076.7
69.772.979.8
72.272.568.5
100.0
80.065.470.7
87.663.171.779.4
90.990.886.5
105.6109.4
162.3127.2
76.989.889.787.085.383.387.7
97.2114.4
91.892.294.194.799.3
90.273.669.772.5
83.192.9
80.876.183.6
73.071.2
84.770.869.568.671.2
65.265.462.6
100.0
70.9
66.155.568.5
96.954.258.8
90.379.886.5
106.160.668.1
249.679.677.783.996.4100.0
88.276.274.1
95.0142.1
83.685.2
76.3118.4
70.941.0
55.657.766.677.1
91.481.2
93.872.2
56.181.5
63.451.553.965.6
54.955.757.1
100.0
104.695.695.198.5101.1
95.896.1
88.599.998.1
81.387.0
132.590.397.4100.5105.1101.9101.0102.4
94.6102.7104.0
93.686.9
104.2105.8
90.282.089.7
99.495.597.1100.6
94.995.2103.3
95.598.999.496.796.298.098.799.096.9
81.8100.0
76.774.475.884.5
70.075.484.4
94.7101.197.1
88.391.8
156.8104.1
95.5100.2
93.9109.6
95.390.292.7
108.8117.1
102.297.995.4
105.098.9
71.281.8
73.778.9
93.894.489.988.384.691.2
72.587.0
79.067.872.6
85.674.977.581.5
100.0
Hokkaido
Aomori
Iwate
Miyagi
Akita
Yamagata
Fukushima
Ibaraki
Tochigi
Gunma
Saitama
Chiba
Tokyo
Kanagawa
Niigata
Toyama
Ishikawa
Fukui
Yamanashi
Nagano
Gifu
Shizuoka
Aichi
Mie
Shiga
Kyoto
Osaka
Hyogo
Nara
Wakayama
Tottori
Shimane
Okayama
Hiroshima
Yamaguchi
Tokushima
Kagawa
Ehime
Kochi
Fukuoka
Saga
Nagasaki
Kumamoto
Oita
Miyazaki
Kagoshima
Okinawa
National average
FY2016settlement
amount
Individual inhabitant tax Two corporate taxes Local consumption tax (post settlement)Local taxes total Fixed asset tax
¥12.2 trillionMax/Min 2.6
¥6.3 trillionMax/Min 6.1
¥4.7 trillionMax/Min 1.6
¥38.6 trillionMax/Min 2.4
¥8.9 trillionMax/Min 2.3
300250200150100500200150100500 200150100500 200150100500 200150100500
In order for local governments to provide public services in response to local needs on their own responsibility and at their own discretion, it is necessary to build a less imbalanced and stable local tax system. Comparing local tax revenue amounts, with the national average set at 100, Tokyo, the highest, was approximately 2.4 times the amount for Okinawa Prefecture, which was the lowest.
Notes : 1. “Max/Min” indicates the value obtained by dividing the maximum value of per-capita tax revenue for each prefecture by the minimum value.2. Local tax revenue amounts exclude overassessment and discretionary taxes, etc.3. Individual inhabitant tax revenue is the total of the prefectural individual inhabitant tax (on a per-capita basis and on an income basis) and the municipal individual inhabitant tax (on
a per-capita basis and on an income basis), and excludes overassessment.4. Revenue from the two corporate taxes is the total of the corporate prefectural inhabitant tax, the corporate municipal inhabitant tax, and the corporate business tax (excluding local
corporation special transfer tax) and excludes overassessment, etc.5. Fixed asset tax revenues include prefectural amounts, and exclude overassessment.6. Calculations were made in accordance with the basic resident register population as of January 1, 2017.
Local Public Finance, 2018 –Illustrated– 12

6 Local Allocation TaxFrom the perspective of local autonomy, it would be the ideal for each local government to ensure the revenue sources necessary for their activities through Local tax revenue collected from their residents. However, there are regional imbalances in tax sources, and many local governments are unable to acquire the necessary tax revenue. Accordingly, the central government collects revenue resources that would essentially be attributable to Local tax revenue and reallocates them as Local allocation tax to local governments that have weaker financial capabilities.
1.Determining the total amount of Local allocation tax
The total amount of the Local allocation tax is determined in accordance with estimates of standard revenue and expenditures in local public finance as a whole, based on a fixed percentage for national taxes (in FY2016 33.1% for Income tax and Corporate tax, 50% for Liquor tax, 22.3% for Consumption tax, and the total amount of Local corporate tax).The total amount of the Local allocation tax in FY2016 was ¥17,239.0 billion, down 0.9% year on year.
2.How regular Local allocation taxes are calculated for each local government
The Regular local allocation tax for each local government is calculated through the following mechanism.
Standard �nancial requirements Standard �nancial revenues Regular allocation tax amount
Unit cost× Measurement unit(national census population, etc.)
× Correction coef�cient(gradated correction, etc.)
Standard �nancial requirements- Standard �nancial revenues
Standard local tax revenue× Calculation rate(75%)+ Local transfer tax, etc.
Notes : 1. Standard financial requirements are figured out based on the rational and appropriate service standards for each local government. For this reason, the local share of the services, such as compulsory education, benefits for livelihood protection, and public works which are subject to national obligatory share, is mandatorily included. Beginning in FY2001, part of the Standard financial requirements is being transferred to special local bonds (bond for temporary substitution for local allocation tax) as an exception to Article 5 of the Local Finance Law.
2. Normal local tax revenue does not include Non-act-based tax or over-taxation that sets tax rates above the standard tax rate stipulated in the Local Tax Act.
3.Function of the Local allocation tax
The function of the Local allocation tax is to adjust imbalances in revenue resources between local governments and to ensure their financial capacity to provide standard public services and basic infrastructure to residents across the country. The adjustment of revenue resources through Local allocation tax makes the ratios of General revenue resources to the total revenues between local governments practically flat regardless of the size of population.
Revenues
0
20
40
60 53.9
38.4
2.9
12.6
55.4
26.1
4.6
24.7
55.0
24.1
4.7
26.2
54.8
11.7
5.5
37.5
(%)
0.2
0.1 0.1
0.0
Small citiesMidsize cities Towns and villages(population of 10,000 or more)
Towns and villages(population of Less than 10,000)
Local taxes Local transfer tax, etc. Special local grants Local allocation tax
Note : A “Midsize city” refers to a city with a population of 100,000 or more excluding Government-ordinance-designated cities, Core cities, and Special cities at the time of the effective date, and a “Small city” refers to a city with a population of less than 100,000.
Ratio of Total Revenue for Municipalities Composed of General Revenue Resources
White Paper on Local Public Finance, 201813
Net total¥98,141.5 billion
◆Public welfare expenses¥26,340.8 billion (26.8%)
◆Educational expenses¥16,745.8 billion (17.1%)
◆Debt service¥12,571.9 billion (12.8%)
◆Other expenses¥7,985.5 billion (15.9%)
◆Agriculture, forestry and �shery expenses¥2,266.0 billion (4.5%)
◆Commerce and industry expenses¥3,472.9 billion(6.9%)
◆Sanitation expenses¥1,709.5 billion(3.4%)
◆General administrative expenses¥2,643.5 billion (5.3%)
◆Civil engineering work expenses¥5,557.3 billion (11.1%)
◆Debt service¥6,915.9 billion(13.8%)
◆Educational expenses¥11,104.9 billion(22.1%)
◆Public welfare expenses¥8,554.8 billion(17.0%)
Prefectures total
¥50,210.3 billion
Prefectures total
¥50,210.3 billion
Municipalities total
¥56,495.1 billion
Municipalities total
¥56,495.1 billion
◆General administrative expenses¥6,818.3 billion (12.1%)
◆Debt service¥5,692.2 billion(10.1%)
◆Educational expenses¥5,750.3 billion(10.2%)
◆Public welfare expenses¥21,012.8 billion(37.2%)
◆Civil engineering work expenses¥12,018.2 billion (12.2%)
◆General administrative expenses¥8,901.6 billion (9.1%)
◆Sanitation expenses¥6,258.4 billion (6.4%)
◆Agriculture, forestry and �shery expenses¥3,171.2 billion (3.2%)
◆Other expenses¥6,938.5 billion (7.1%)
◆Commerce and industry expenses¥5,195.1 billion (5.3%)
◆Sanitation expenses¥4,714.9 billion(8.3%)
◆Commerce and industry expenses¥1,763.6 billion(3.1%)
◆Civil engineering work expenses¥6,653.1 billion (11.8%)
◆Agriculture, forestry and �shery expenses¥1,360.0 billion (2.4%)
◆Other expenses¥2,729.9 billion (4.8%)
Expenditures
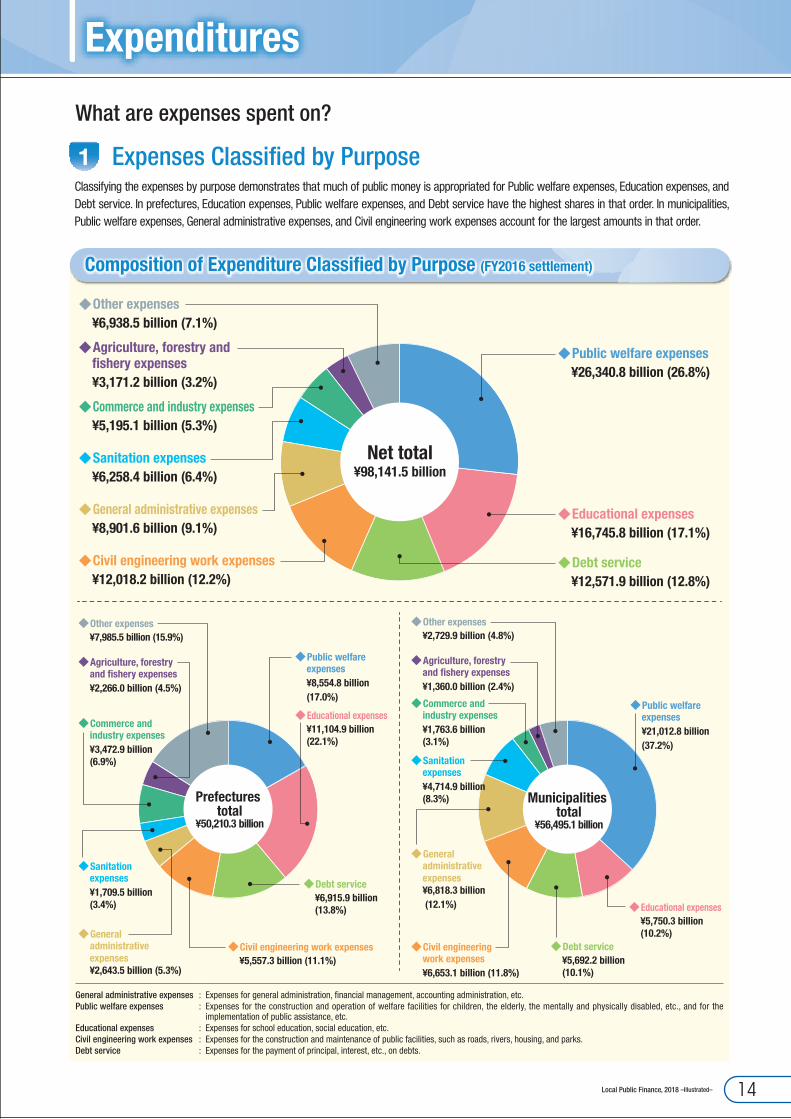
Composition of Expenditure Classified by Purpose (FY2016 settlement)
What are expenses spent on?
1 Expenses Classified by PurposeClassifying the expenses by purpose demonstrates that much of public money is appropriated for Public welfare expenses, Education expenses, and Debt service. In prefectures, Education expenses, Public welfare expenses, and Debt service have the highest shares in that order. In municipalities, Public welfare expenses, General administrative expenses, and Civil engineering work expenses account for the largest amounts in that order.
General administrative expenses : Expenses for general administration, financial management, accounting administration, etc.Public welfare expenses : Expenses for the construction and operation of welfare facilities for children, the elderly, the mentally and physically disabled, etc., and for the
implementation of public assistance, etc.Educational expenses : Expenses for school education, social education, etc.Civil engineering work expenses : Expenses for the construction and maintenance of public facilities, such as roads, rivers, housing, and parks.Debt service : Expenses for the payment of principal, interest, etc., on debts.
Local Public Finance, 2018 –Illustrated– 14

Expenditures
◆Public welfare expenses¥25,598.2 billion (27.0%)●Of this amount,
disaster relief expenses were¥99.3 billion (0.1%)
◆Educational expenses¥16,626.6 billion(17.5%)
◆Debt service¥12,537.7 billion (13.2%)
◆Civil engineering work expenses¥11,078.9 billion (11.7%)
Great East Japan Earthquake portion
¥3,374.9 billion
◆Public welfare expenses¥742.6 billion (22.0%)●Of this amount,
disaster relief expenses were¥722.1 billion (21.4%)
◆Educational expenses¥119.3 billion(3.5%)
◆Debt service¥34.2 billion(1.0%)
◆Civil engineering work expenses¥939.4 billion (27.8%)
◆General administrative expenses¥8,531.6 billion (9.0%)
◆Commerce and industry expenses¥4,873.8 billion (5.1%)
◆Sanitation expenses¥6,164.9 billion(6.5%)
◆Agriculture, forestry and �shery expenses¥2,959.8 billion(3.1%)
◆Disaster recovery expenses¥339.5 billion (0.4%)
◆Other expenses ¥6,055.6 billion (6.5%)
◆General administrative expenses¥370.0 billion (11.0%)
◆Commerce and industry expenses¥321.3 billion (9.5%)
◆Sanitation expenses¥93.5 billion(2.8%)
◆Agriculture, forestry and �shery expenses¥211.4 billion(6.3%)
◆Disaster recovery expenses¥478.9 billion (14.2%)
◆Other expenses ¥64.3 billion (1.9%)
Regular portion¥94,766.6 billion
Great East Japan Earthquake portion
¥2,216.7 billion
◆General administrative expenses¥2,535.9 billion (5.3%)
◆Commerce and industry expenses¥3,180.7 billion (6.6%)
◆Sanitation expenses¥1,646.0 billion(3.4%)
◆Agriculture, forestry and �shery expenses¥2,117.8 billion(4.4%)
◆Disaster recovery expenses¥207.0 billion (0.4%)
◆Other expenses ¥7,409.8 billion (15.6%)
◆Public welfare expenses¥7,796.6 billion (16.2%)●Of this amount,
disaster relief expenses were¥92.1 billion (0.2%)
◆Educational expenses¥11,080.9 billion(23.1%)
◆Debt service¥6,907.7 billion(14.4%)
◆Civil engineering work expenses¥5,111.2 billion (10.6%)
◆Other expenses ¥34.8 billion (1.6%)
◆Disaster recovery expenses¥334.0 billion (15.1%)
◆Public welfare expenses¥758.1 billion (34.1%)●Of this amount,
disaster relief expenses were¥740.0 billion (33.4%)
◆Educational expenses¥24.0 billion(1.1%)
◆Debt service¥8.2 billion(0.4%)
◆Civil engineering work expenses¥446.1 billion (20.0%)
◆General administrative expenses¥107.6 billion (4.9%)
◆Commerce and industry expenses¥292.2 billion (13.2%)
◆Sanitation expenses¥63.5 billion(2.9%)
◆Agriculture, forestry and �shery expenses¥148.2 billion(6.7%)
Regular portion¥47,993.6 billion
◆General administrative expenses¥6,540.2 billion (11.9%)
◆Commerce and industry expenses¥1,733.1 billion (3.2%)
◆Sanitation expenses¥4,675.1 billion(8.5%)
◆Agriculture, forestry and �shery expenses¥1,271.3 billion(2.3%)
◆Disaster recovery expenses¥154.2 billion (0.3%)
◆Other expenses ¥2,393.2 billion (4.3%)
Regular portion¥54,966.8 billion
◆Public welfare expenses¥20,736.1 billion (37.7%)●Of this amount,
disaster relief expenses were¥42.2 billion (0.1%)
◆Educational expenses¥5,650.0 billion(10.3%)
◆Debt service¥5,665.7 billion(10.3%)
Great East Japan Earthquake portion
¥1,528.4 billion
◆Public welfare expenses¥276.7 billion (18.1%)●Of this amount,
disaster relief expenses were¥266.2 billion (17.4%)
◆Educational expenses¥100.3 billion(6.6%)
◆Debt service¥26.5 billion(1.7%)
◆Civil engineering work expenses¥505.2 billion (33.0%)
◆Civil engineering work expenses¥6,147.9 billion (11.2%)
◆General administrative expenses¥278.1 billion (18.2%)
◆Commerce and industry expenses¥30.5 billion (2.0%)
◆Sanitation expenses¥39.8 billion(2.6%)
◆Agriculture, forestry and �shery expenses¥88.7 billion(5.8%)
◆Disaster recovery expenses¥149.4 billion (9.8%)
◆Other expenses ¥33.2 billion (2.2%)
Municipalities
Net total
Prefectures
2 Expenditures in Regular Portion and Great East Japan Earthquake Portion (Expenses Classified by Purpose)
White Paper on Local Public Finance, 201815
0
100
80
60
40
20
5.2
12.0
16.7
12.6
6.9
3.2
8.9
26.3
6.3
5.5
98.498.4
11.7
16.8
12.9
7.1
3.2
9.6
25.3
6.3
98.598.5
5.5
12.1
16.7
13.4
7.1
3.3
9.9
24.5
6.1
97.497.4
5.9
12.1
16.1
13.1
7.2
3.5
10.0
23.5
6.0
96.496.4
6.2
11.2
16.1
13.0
7.5
3.2
10.0
23.2
6.0
97.097.0
6.5
11.3
16.2
13.0
7.6
3.2
9.3
23.2
6.7
94.894.8
6.4
12.0
16.4
13.0
6.6
3.2
10.0
21.3
5.8
96.196.1
6.6
13.3
16.4
12.9
6.9
3.6
10.7
19.8
6.0
89.789.7
5.3
12.9
16.1
13.2
6.8
3.3
8.9
17.8
5.4
89.189.1
4.9
13.4
16.4
13.0
6.6
3.5
8.9
17.0
5.4
89.289.2
4.8
13.9
16.5
13.3
6.7
3.8
8.6
16.3
5.5
FY2015 FY2016FY2006 FY2007 FY2008 FY2009 FY2010 FY2011 FY2012 FY2013 FY2014
(trillion yen)¥ trillion¥98.1 trillion
OtherDebt serviceEducation expensesCivil engineering work expensesCommerce and industry expenses
Agriculture, forestry and �shery expensesSanitation expensesPublic welfare expensesGeneral administrative expense
0.8
4.0
7.2
6.2
8.2
FY2015 FY2016FY2006 FY2007 FY2008 FY2009 FY2010 FY2011 FY2012 FY2013 FY2014
30
23.21.0
3.8
5.3
5.7
7.4
23.20.7
3.9
5.6
5.7
7.3
23.51.0
4.0
5.6
5.7
7.2
19.8
3.3
5.3
5.7
5.6
21.3
3.6
5.1
5.5
7.1
17.8
2.9
4.8
4.8
5.3
17.0
2.9
4.8
4.3
5.1
16.3
2.9
4.4
4.1
4.9
0.00.0
0.0
0.00.0
24.50.6
4.0
6.2
5.9
7.7
0.6
4.0
6.6
6.1
7.9
0
5
10
15
20
2525.3
¥ trillion¥26.3 trillion
(trillion yen)
Disaster reliefPublic assistanceSocial welfare Elderly welfare Child welfare
Trends in Breakdown of Public Welfare Expenses by Purpose
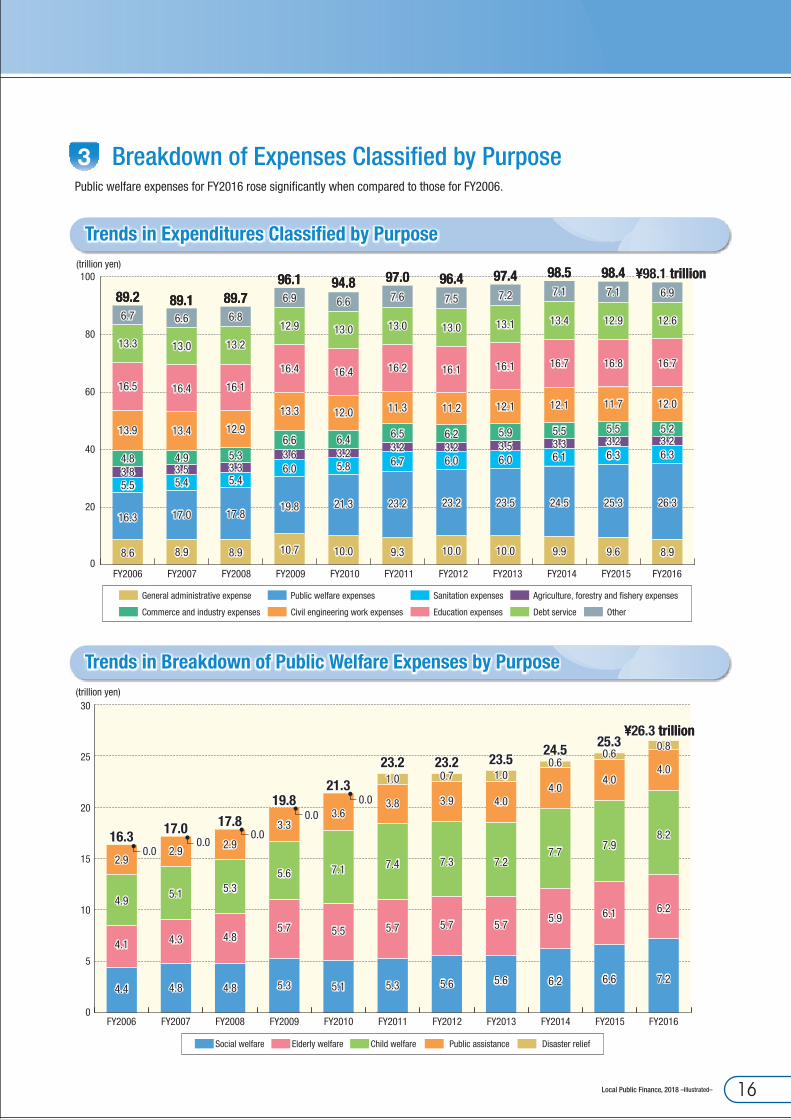
Trends in Expenditures Classified by Purpose
3 Breakdown of Expenses Classified by PurposePublic welfare expenses for FY2016 rose significantly when compared to those for FY2006.
Local Public Finance, 2018 –Illustrated– 16

Expenditures
Net total Prefectures Municipalities
¥26,340.8 billion ¥8,554.8 billion ¥21,012.8 billion
¥5,653.3 billion (26.9%)
¥3,732.8 billion (17.8%)
¥7,533.7 billion (35.9%)
¥3,784.7 billion (18.0%)
¥308.4 billion (1.5%)
¥2,669.4 billion (31.2%)
¥3,134.5 billion (36.6%)
¥1,669.8 billion (19.5%)
¥248.9 billion (2.9%)¥832.1 billion (9.7%)
¥7,153.6 billion (27.2%)
¥6,219.3 billion (23.6%)
¥8,152.6 billion (31.0%)
¥3,993.9 billion (15.2%)
¥821.4 billion (3.1%)
Disaster relief
Public assistance
Social welfare
Elderly welfare
Child welfare
¥1,288.8 billion (22.4%)
¥731.0 billion (12.7%)
¥153.0 billion (2.7%)
¥1,053.8 billion (18.3%)
¥1,298.0 billion (22.6%)
¥876.6 billion (15.2%)
¥349.1 billion (6.1%)
¥3,374.9 billion (30.4%)
¥2,024.8 billion (18.2%)
¥2,132.7 billion (19.2%)
¥192.1 billion (1.7%)¥188.9 billion (1.7%)
¥2,147.1 billion (19.3%)
¥1,044.4 billion (9.5%)
¥4,658.9 billion (27.8%)
¥2,752.0 billion (16.4%)
¥2,271.3 billion (13.6%)
¥1,232.2 billion (7.4%)¥1,474.2 billion (8.8%)
¥2,970.3 billion (17.7%)
¥1,386.9 billion (8.3%)
Net total
¥16,745.8 billion
Prefectures
¥11,104.9 billion
Municipalities
¥5,750.3 billion
Other
Social education
Health andphysical education
Senior high school
Educational generalaffairs
Junior high school
Elementary school
¥1,838.9 billion (27.6%)
¥173.0 billion (2.6%)
¥165.3 billion (2.5%)
¥3,349.6 billion(50.3%)
¥780.4 billion (11.7%)
¥345.9 billion (5.3%)
¥2,397.8 billion (43.1%)
¥1,146.1 billion (20.6%)
¥279.0 billion (5.0%)
¥947.2 billion (17.0%)
¥503.0 billion (9.1%)¥284.2 billion (5.2%)
¥4,197.6 billion (34.9%)
¥1,305.1 billion (10.9%)¥421.9 billion (3.5%)
¥4,233.8 billion (35.2%)
¥1,248.2 billion (10.4%)¥611.6 billion (5.1%)
Net total
¥12,018.2 billion
Prefectures
¥5,557.3 billion
Municipalities
¥6,653.1 billion
Other
Harbors
Housing
Rivers and coasts
Road and bridges
Urban planning
Breakdown of Public Welfare Expenses by Purpose
Breakdown of Educational Expenses by Purpose
Breakdown of Civil Engineering Work Expenses by Purpose
White Paper on Local Public Finance, 201817
●Ordinary construction work expenses¥14,306.9 billion (14.6%)
●Latter-stage elderly healthcare accounts¥1,542.1 billion (1.6%)
◆Subsidizing expenses¥9,842.2 billion (10.0%)
◆Reserves¥3,317.5 billion (3.4%)
◆Transfers to other accounts¥5,447.7 billion (5.6%)
◆Goods expenses¥9,496.8 billion (9.7%)
●National health insurance accounts¥1,355.8 billion (1.4%)
●Elderly nursing care insurance accounts¥1,496.0 billion (1.5%)
Investment expenses¥15,125.2 billion (15.4%)
Net total¥98,141.5 billion
◆Other¥5,888.2 billion (5.9%)
●Debt service¥12,545.5 billion (12.8%)
●Social assistance expenses¥14,009.8 billion (14.3%)
●Personnel expenses¥22,468.6 billion (22.9%)
Mandatory expenses¥49,023.9 billion (50.0%)
Mandatory expenses¥21,697.4 billion(43.2%)
●Personnel expenses¥13,719.8 billion(27.3%)
●Social assistance expenses¥1,082.3 billion(2.2%)
●Debt service¥6,895.3 billion(13.7%)
Prefectures total
¥50,210.3 billion
◆Transfers to other accounts ¥141.4 billion (0.3%)
◆Goods expenses¥1,687.7 billion(3.4%)
◆Other ¥2,169.4 billion (3.9%)
Mandatory expenses¥27,362.7 billion(48.4%)
●Personnel expenses¥8,748.8 billion(15.5%)
Municipalitiestotal
¥56,495.1 billion
●Social assistance expenses¥12,927.5 billion(22.9%)
●Debt service¥5,686.4 billion(10.1%)
◆Transfers to other accounts ¥5,306.3 billion (9.4%)
◆Reserves¥1,742.5 billion(3.1%)
◆Subsidizing expenses¥4,011.0 billion(7.1%)
◆Goods expenses¥7,809.1 billion(13.8%)
●Ordinary construction work expenses¥7,150.4 billion (14.2%)
◆Other ¥3,748.2 billion (7.5%)
◆Subsidizing expenses¥13,669.3 billion(27.2%)
◆Reserves¥1,575.0 billion(3.1%)
Investment expenses¥7,691.3 billion (15.3%)
●Subsidized public works expenses¥7,124.1 billion (7.3%)●Non-subsidized public works expenses
¥6,400.6 billion (6.5%)
●Non-subsidized public works expenses¥2,526.6 billion (5.0%)
●Subsidized public works expenses¥3,909.5 billion (7.8%)
●Ordinary construction work expenses¥7,790.6 billion (13.8%)
Investment expenses¥8,094.1 billion (14.3%)
●Subsidized public works expenses¥3,485.4 billion (6.2%)
●Non-subsidized public works expenses¥4,108.1 billion (7.3%)
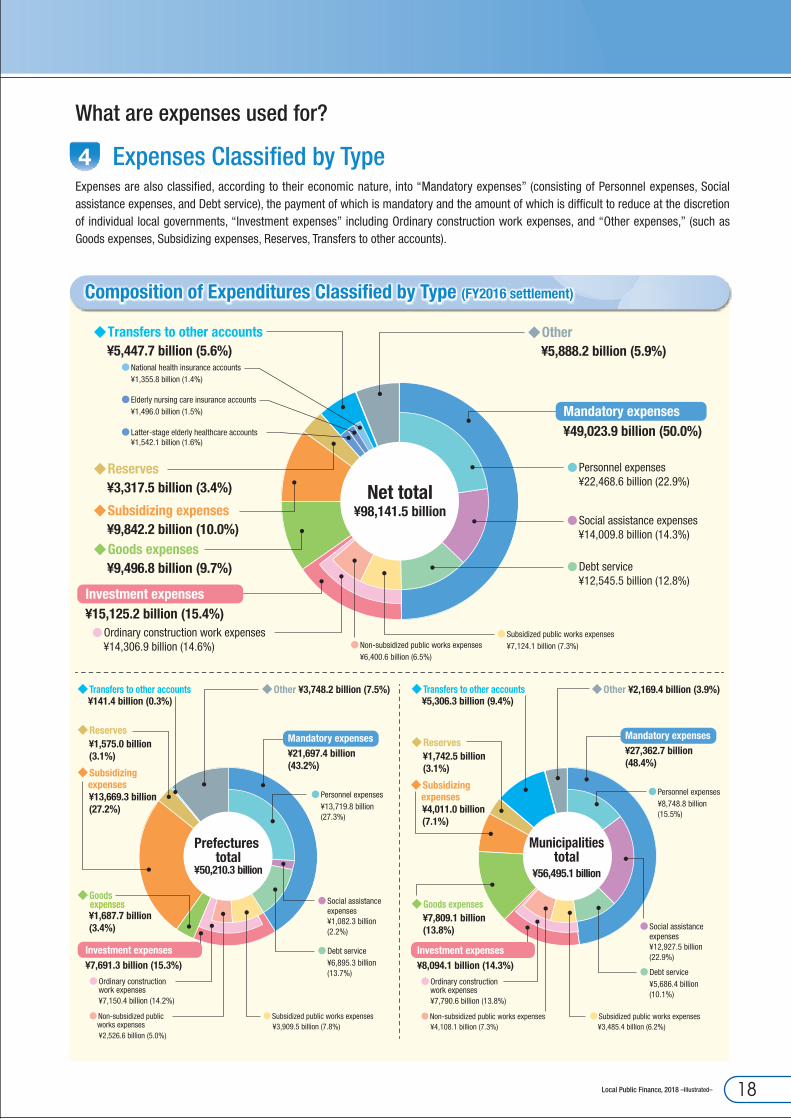
Composition of Expenditures Classified by Type (FY2016 settlement)
What are expenses used for?
4 Expenses Classified by TypeExpenses are also classified, according to their economic nature, into “Mandatory expenses” (consisting of Personnel expenses, Social assistance expenses, and Debt service), the payment of which is mandatory and the amount of which is difficult to reduce at the discretion of individual local governments, “Investment expenses” including Ordinary construction work expenses, and “Other expenses,” (such as Goods expenses, Subsidizing expenses, Reserves, Transfers to other accounts).
Local Public Finance, 2018 –Illustrated– 18
Expenditures
Regular portion¥94,766.6 billion
◆Mandatory expenses¥48,951.9 billion (51.7%)
●Personnel expenses¥22,435.3 billion(23.7%)
●Social assistance expenses¥14,005.3 billion(14.8%)
●Debt service¥12,511.3 billion(13.2%)
●Ordinary construction work expenses ¥12,977.9 billion (13.7%)●Disaster recovery project expenses ¥339.5 billion (0.4%)
◆ Investment expenses¥13,317.5 billion (14.1%)
Great East Japan Earthquake portion
¥3,374.9 billion
◆Other¥279.6 billion (8.3%)
◆Reserves¥738.2 billion(21.9%)
◆Subsidizing expenses¥136.0 billion(4.0%)
◆Goods expenses¥341.4 billion (10.1%)
◆Mandatory expenses¥72.0 billion (2.1%)
◆Other¥11,056.2 billion (11.6%)
◆Reserves¥2,579.4 billion(2.7%)
◆Subsidizing expenses¥9,706.2 billion(10.2%)
◆Goods expenses¥9,155.4 billion (9.7%)
●Ordinary construction work expenses¥1,328.9 billion (39.4%)
●Disaster recovery project expenses¥478.8 billion (14.2%)
●Personnel expenses¥33.3billion (1.0%)
●Social assistance expenses¥4.5 billion (0.1%)●Debt service
¥34.2 billion (1.0%)
◆ Investment expenses¥1,807.7 billion (53.6%)
Regular portion¥47,993.6 billion
Great East Japan Earthquake portion
¥2,216.7 billion
◆Other¥3,646.1 billion (7.6%)
◆Reserves¥1,061.0 billion(2.2%)
◆Subsidizing expenses¥13,249.7 billion(27.6%)
◆Goods expenses¥1,631.6 billion (3.4%)
◆Mandatory expenses¥21,669.6 billion (45.2%)
●Personnel expenses¥13,701.1 billion(28.5%)
●Social assistance expenses¥1,081.4 billion(2.3%)
●Debt service¥6,887.1 billion(14.4%)
●Ordinary construction work expenses ¥6,528.6 billion (13.6%)●Disaster recovery project expenses ¥207.0 billion (0.4%)
◆ Investment expenses¥6,735.6 billion (14.0%)
◆Other¥243.4 billion (11.0%)
◆Reserves¥514.0 billion(23.2%)
◆Subsidizing expenses¥419.6 billion(18.9%)
◆Goods expenses¥56.1 billion (2.5%)
◆Mandatory expenses¥27.8 billion (1.3%)
●Personnel expenses¥18.7 billion (0.8%)
●Social assistance expenses¥0.9 billion (0.0%)●Debt service
¥8.2 billion (0.4%)
●Ordinary construction work expenses¥621.8 billion (28.1%)
●Disaster recovery project expenses¥334.0 billion (15.1%)
◆ Investment expenses¥955.8 billion (43.1%)
◆Other¥7,439.1 billion (13.5%)
◆Reserves¥1,518.4 billion(2.8%)
◆Subsidizing expenses¥3,950.4 billion(7.2%)
◆Goods expenses¥7,523.8 billion (13.7%)
◆Mandatory expenses¥27,317.9 billion (49.7%)
●Personnel expenses¥8,734.2 billion(15.9%)
●Social assistance expenses¥12,924.0 billion(23.5%)
●Debt service¥5,659.8 billion(10.3%)
Regular portion¥54,966.8 billion
●Ordinary construction work expenses ¥7,062.9 billion (12.8%)●Disaster recovery project expenses ¥154.2 billion (0.3%)
◆ Investment expenses¥7,217.2 billion (13.1%)
◆Other¥36.8 billion (2.3%)
◆Reserves¥224.1 billion(14.7%)
◆Subsidizing expenses¥60.6 billion(4.0%)
◆Goods expenses¥285.3 billion (18.7%)
Great East Japan Earthquake portion
¥1,528.4 billion
◆Mandatory expenses¥44.7 billion (2.9%)
●Personnel expenses¥14.6 billion (1.0%)
●Social assistance expenses¥3.6 billion (0.2%)●Debt service
¥26.5 billion (1.7%)
●Ordinary construction work expenses¥727.7 billion (47.6%)
●Disaster recovery project expenses¥149.2 billion (9.8%)
◆ Investment expenses¥876.9 billion (57.4%)
Net total
Municipalities
Prefectures
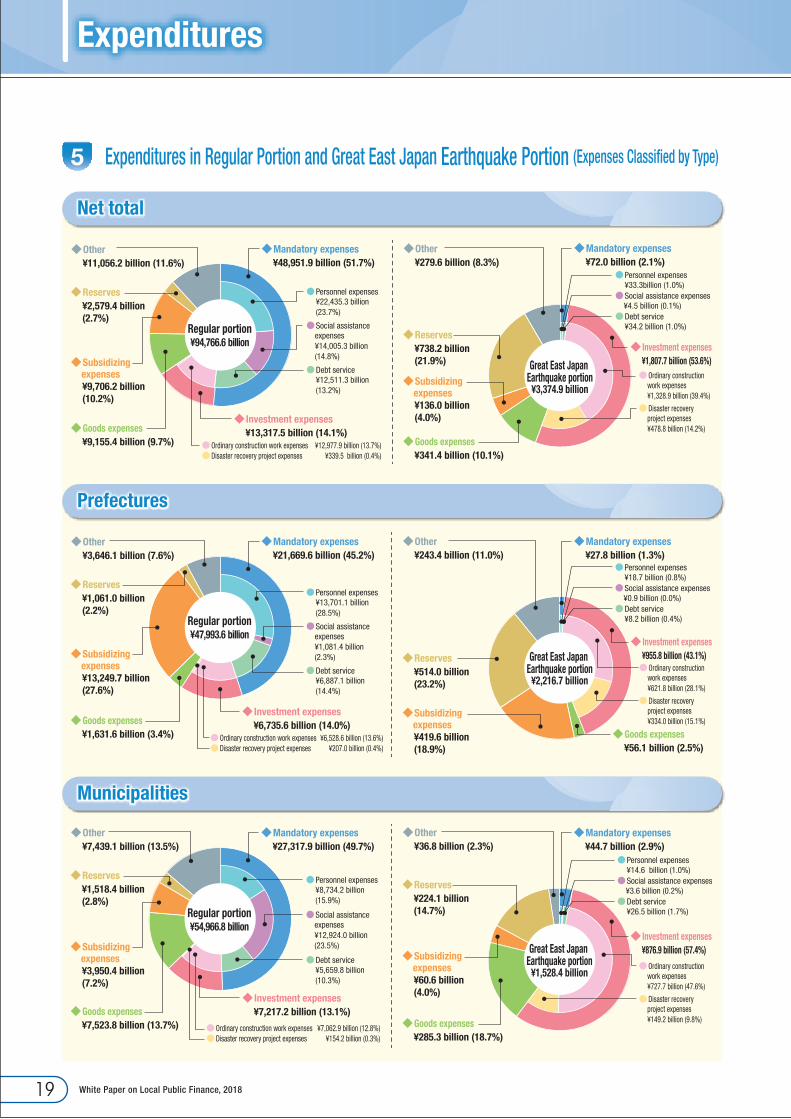
5 Expenditures in Regular Portion and Great East Japan Earthquake Portion (Expenses Classified by Type)
19 White Paper on Local Public Finance, 2018
0
20
40
60
80
100
25.1 25.3 24.6 24.0 23.5 23.4 23.0 22.2 22.5 22.6 22.5
7.8 8.2 8.5 9.1 11.2 12.0 12.0 12.2 12.9 13.3 14.0
13.3 13.0 13.1 12.9 12.9 12.9 13.0 13.1 13.3 12.9 12.5
14.8 13.9 13.2 14.5 13.5 13.3 13.4 15.1 15.5 14.9 15.1
7.5 7.6 7.5 7.9 8.0 8.8 8.7 8.9 9.1 9.3 9.57.4 7.5 8.1
10.7 9.4 8.9 9.2 9.5 9.3 9.9 9.84.6 4.6 4.84.9 5.0 5.1 5.2 5.1 5.4 5.6 5.48.8 9.1 9.912.2 11.1 12.6 11.9 11.3 10.5 9.9 9.289.2 89.1 89.796.1 94.8 97.0 96.4 97.4 98.5 98.4
FY2014 FY2015 FY2016FY2006 FY2007 FY2008 FY2009 FY2010 FY2011 FY2012 FY2013
(trillion yen)¥98.1 trillion
Personnel expenses Social assistance expenses Debt service Investment expenses
Transfers to other accountsGoods expenses Subsidizing expenses Other
1.4 1.6 1.8 2.0 2.1 2.3 2.50.3 0.2 0.2 0.2 0.2 0.2 0.23.0 3.2 3.3 3.3
5.0 5.2 5.0
2.72.7 2.7
3.1
3.43.5 3.6
0.50.5 0.5
0.5
0.50.7 0.6
7.88.2 8.5
9.1
11.212.0 12.0
2.7
0.2
5.0
3.7
0.612.2
3.1
0.2
5.3
3.7
0.612.9
3.6
0.2
5.8
3.7
0.7
3.1
0.2
5.6
3.7
0.713.3
FY2014 FY2015 FY2016FY2006 FY2007 FY2008 FY2009 FY2010 FY2011 FY2012 FY2013
¥ trillion¥14.0 trillion
0
2
4
6
8
10
12
14(trillion yen)
Social welfare Elderly welfare Child welfare OtherPublic assistance
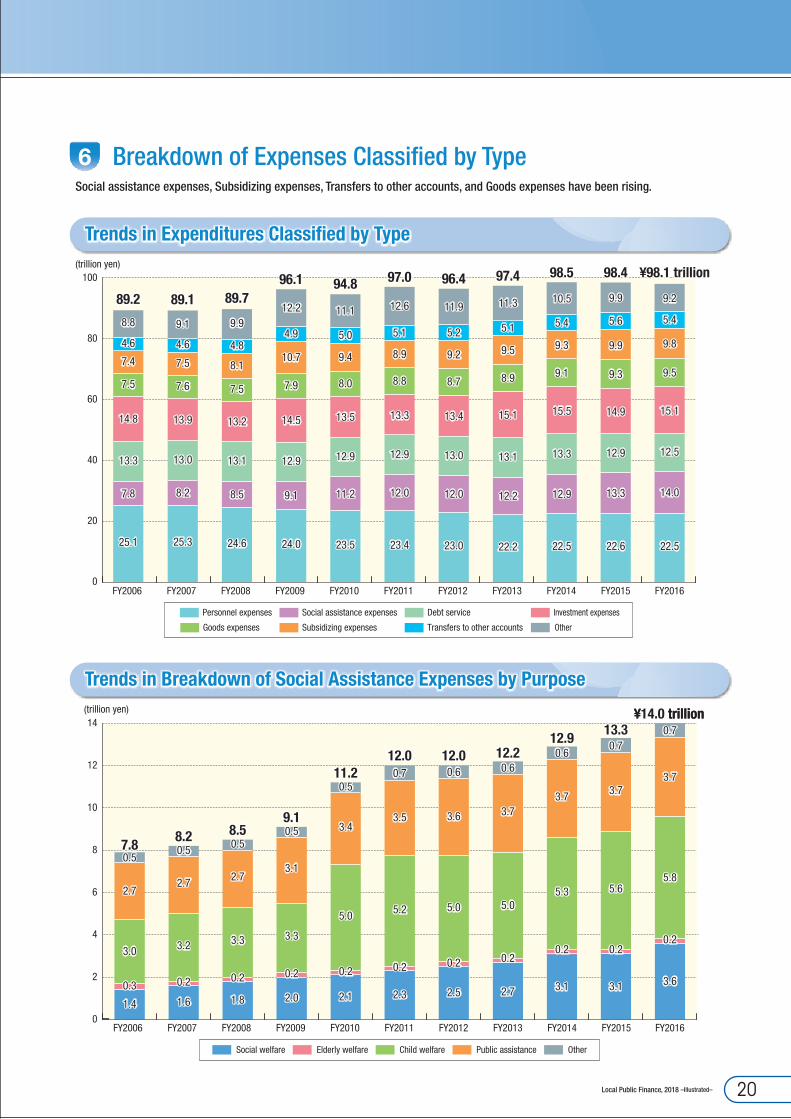
Trends in Expenditures Classified by Type
Trends in Breakdown of Social Assistance Expenses by Purpose
6 Breakdown of Expenses Classified by TypeSocial assistance expenses, Subsidizing expenses, Transfers to other accounts, and Goods expenses have been rising.
20Local Public Finance, 2018 –Illustrated–
Expenditures
22.5
25.1 25.324.6
24.023.5 23.4
23.0
13.6
15.0 15.114.7
14.3 14.1 14.1 13.9
8.9
22.6 22.5
13.7 13.7
8.9 8.7
10.1 10.29.9 9.7
9.4 9.4 9.1
22.2
13.4
8.8
27
26
25
24
23
16
15
11
10
9
14
0FY2014 FY2015 FY2016FY2006 FY2007 FY2008 FY2009 FY2010 FY2011 FY2012 FY2013
Net total Prefectures Municipalities
(trillion yen)
(%)100
0
20
40
60
80
0.0%¥10.5 billion0.0%
Net total
¥22,468.6 billion
Prefectures
¥13,719.8 billion
Municipalities
¥8,748.8 billion
0.0%¥1.2 billion0.0%
0.1%¥9.3 billion0.1%
¥10,472.9 billion46.6%
¥5,402.8 billion24.1%
¥15,886.2 billion70.7%
¥1,299.9 billion 5.8% ¥413.8 billion3.0%
¥2,000.5 billion 8.9%
¥3,282.1 billion 14.6%¥2,058.0 billion 15.0%
¥1,200.6 billion 8.8%
¥886.1 billion 10.2%
¥1,224.1 billion 14.0%
¥799.8 billion 9.1%
¥6,648.6 billion48.5%
¥3,824.3 billion43.7%
¥10,047.4 billion73.2% ¥5,838.8 billion
66.7%
¥3,397.6 billion24.7% ¥2,005.2 billion
22.9%
Employee salariesRetirement allowances Local public servant, mutual-aid associations, etc. Other
Base salaries Other allowances Temporary employee salaries
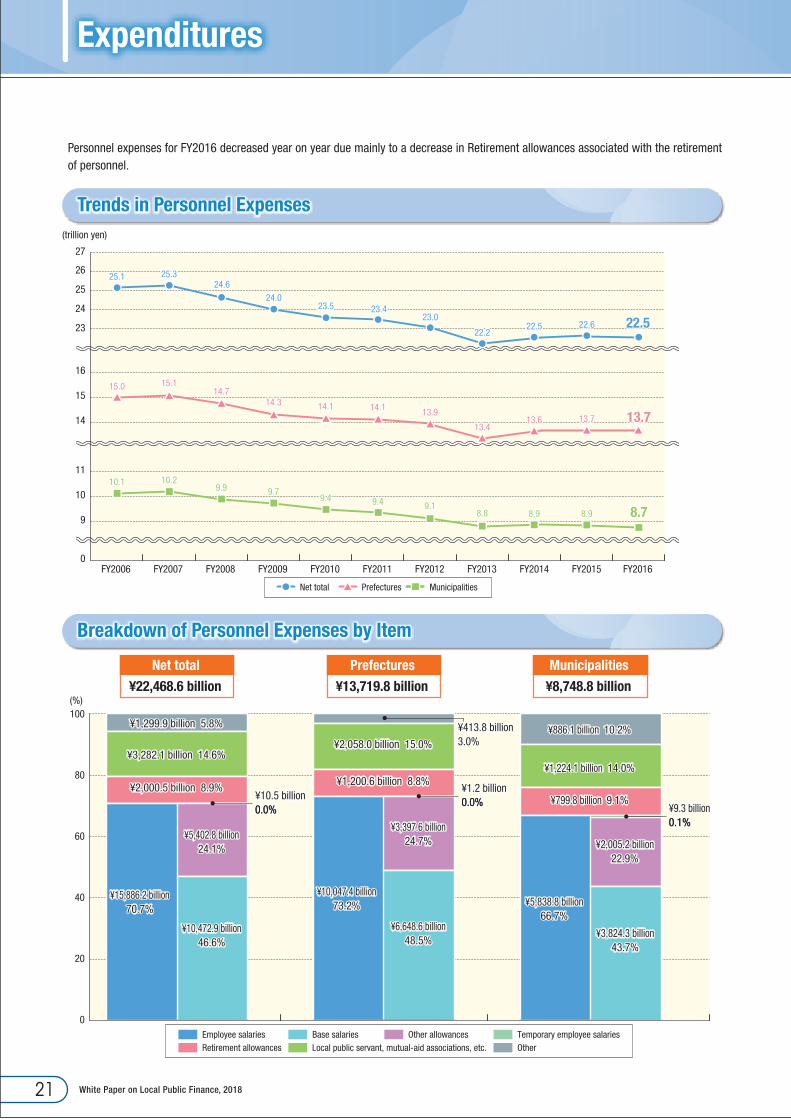
Trends in Personnel Expenses
Breakdown of Personnel Expenses by Item
Personnel expenses for FY2016 decreased year on year due mainly to a decrease in Retirement allowances associated with the retirement of personnel.
21 White Paper on Local Public Finance, 2018

5.8 5.5 5.4 5.9 5.6 6.1 6.17.8 7.7
7.26.8 6.4
7.26.9 5.7 5.4
5.6 6.3
1.31.3
1.2
1.30.8
0.8 0.9
0.80.7
14.313.5
13.0
14.413.3
12.5 12.4
14.214.8
7.2 7.1
6.3 6.4
0.7 0.814.2
0
2
4
6
8
10
12
14
16
18(trillion yen)
FY2014 FY2015 FY2016FY2006 FY2007 FY2008 FY2009 FY2010 FY2011 FY2012 FY2013
¥14.3 trillion
Subsidized public works Non-subsidized public works Obligatory share of public works directly carried out by the national government
¥953.8 billion (6.7%)
¥669.5 billion (4.7%)¥802.7 billion (5.6%)
¥1,547.6 billion (10.8%)
¥7,441.6 billion (52.0%)
¥2,001.6 billion (14.0%)
¥890.1 billion (6.2%)
¥398.2 billion (5.6%)¥213.0 billion (3.0%)¥210.9 billion (2.9%)
¥1,307.6 billion (18.3%)
¥4,208.7 billion (58.9%)
¥410.3 billion (5.7%)
¥401.7 billion (5.6%)
¥650.6 billion (8.4%)
¥532.7 billion (6.8%)
¥642.6 billion (8.2%)
¥483.3 billion (6.2%)
¥3,365.2 billion (43.2%)
¥1,611.0 billion (20.7%)
¥505.2 billion (6.5%)100
0
20
40
60
80
Net total
¥14,306.9 billion
Prefectures
¥7,150.4 billion
Municipalities
¥7,790.6 billion(%)
General administrative expenses Public welfare expenses Sanitation expenses Agriculture, forestry and �shery expensesCivil engineering work expenses Education expenses Other expenses
Trends in Breakdown of Ordinary Construction Work Expenses Classified by Type
Breakdown of Ordinary Construction Work Expenses by Purpose
Ordinary construction work expenses increased year on year due mainly to an increase in Non-subsidized public works. In addition, Civil Engineering Work Expenses account for the largest ratio in the breakdown of Ordinary construction work expenses by purpose.
22Local Public Finance, 2018 –Illustrated–

Trends in Breakdown of Transfers to Other Accounts
Trends in Breakdown of Subsidizing Expenses by Purpose
Expenditures
General administrative expensesCommerce and industry expenses
Public welfare expensesCivil engineering work expenses
Sanitation expensesEducation expenses
Agriculture, forestry and �shery expensesOther
10.7
1
0
3
5
7
9
11
0.9 0.8 1.0
2.8
1.40.7 0.8
2.5 2.73.0
3.3
3.3
3.5 3.6
1.0 0.9
1.0
1.1
1.1
1.11.1
0.3 0.3
0.3
0.3
0.4
0.30.4
0.4 0.4
0.5
0.8
0.5
0.60.6
0.8 0.8
0.8
0.9
0.9
1.01.0
1.1 1.2
1.2
1.2
1.41.4
1.4
0.3 0.3
0.3
0.3
0.30.3
0.3
7.4 7.5
8.1
9.48.9
9.2
1.0
3.6
1.1
0.5
0.6
1.0
1.4
0.39.5
0.7
3.7
1.1
0.40.5
0.9
1.5
0.39.3
0.8
3.9
1.1
0.5
0.7
0.9
1.6
0.39.9
0.3
1.6
1.0
0.6
0.5
1.1
3.9
0.8
(trillion yen)
9.8 trillion¥9.8 trillion
FY2015 FY2016FY2006 FY2007 FY2008 FY2009 FY2010 FY2011 FY2012 FY2013 FY2014
Local public enterprise accounts (Enterprise to which the Local Public Enterprise Law is not applied) National health insurance accountsElderly health care accounts (to FY2010) Latter-stage elderly healthcare accounts Elderly nursing care insurance accounts Fund
1.5 1.4 1.4 1.4 1.3 1.3 1.2
1.2 1.2 1.1 1.1 1.2 1.2 1.2
0.8 0.9
0.1 0.0 0.0
1.1 1.2 1.3 1.3 1.4
1.0 1.01.1 1.1 1.2 1.2 1.30.1 0.10.1
0.0 0.0 0.00.1
4.6 4.64.8 4.9 5.0 5.1
5.2
1.2
1.2
1.4
1.3
0.15.1
1.2
1.3
1.5
1.4
0.0
5.4
1.2
1.4
1.5
1.5
0.15.6
1.0
1.4
1.5
1.5
0.0
(trillion yen)
0
1
2
3
4
5
6
¥5.4 trillion
FY2015 FY2016FY2006 FY2007 FY2008 FY2009 FY2010 FY2011 FY2012 FY2013 FY2014
23 White Paper on Local Public Finance, 2018
It is necessary that local governments have financial resources for not only the Mandatory expenses but also for the expenses for projects to properly address challenges caused by changes in the social economy and administrative needs so that they can adequately meet the needs of their residents. The extent to which the resources for such purposes are secured is called the “flexibility of the financial structure.”
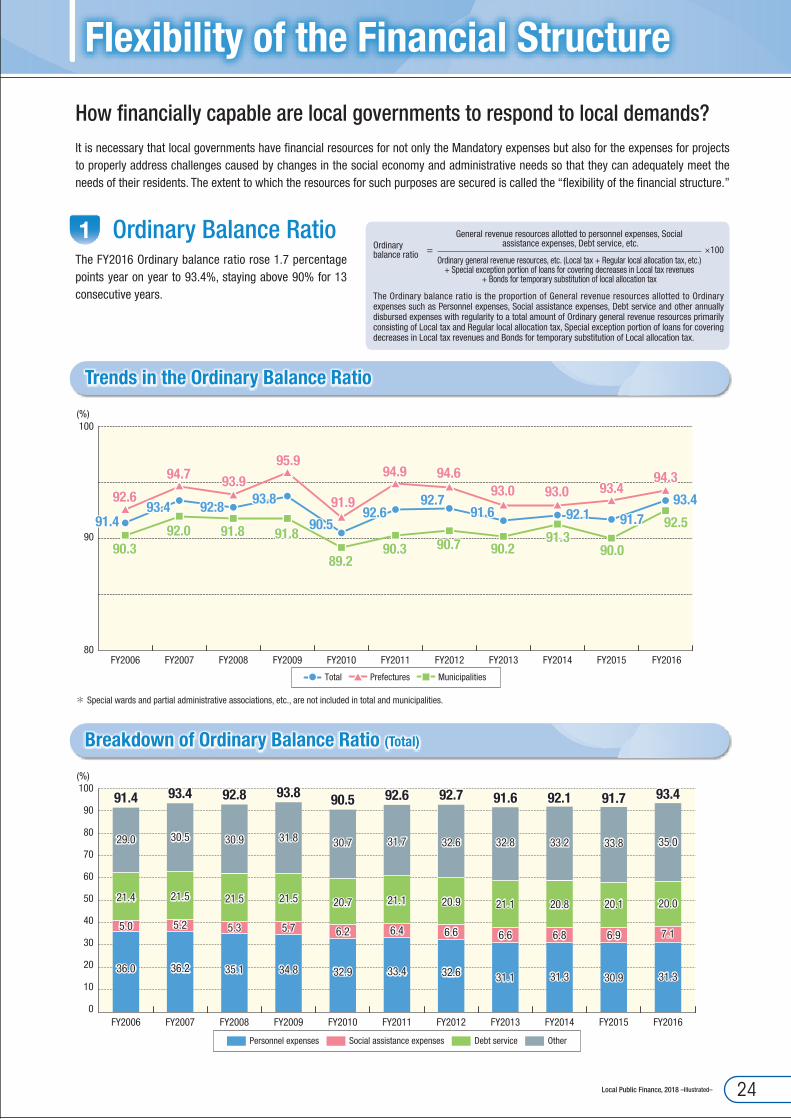
1 Ordinary Balance RatioThe FY2016 Ordinary balance ratio rose 1.7 percentage points year on year to 93.4%, staying above 90% for 13 consecutive years.
Flexibility of the Financial Structure
33.4 31.1
6.4 6.6
21.1 21.1
31.7 32.8
36.0
5.0
21.4
29.0
91.4
36.2
5.2
21.5
30.5
93.4
35.1
5.3
21.5
30.9
92.8
34.8
5.7
21.5
31.8
93.8
32.9
6.2
20.7
30.7
90.5 92.6 91.6
32.6
6.6
20.9
32.6
92.7
31.3
6.8
20.8
33.2
92.1
31.3
7.1
20.0
35.0
93.4
30.9
6.9
20.1
33.8
91.7
(%)
0
10
20
30
40
50
60
70
80
90
100
FY2015 FY2016FY2006 FY2007 FY2008 FY2009 FY2010 FY2011 FY2012 FY2014FY2013
Personnel expenses Social assistance expenses Debt service Other
90.3 90.7 90.290.392.0 91.8 91.8
89.2
92.6
94.7 93.9
95.9
91.9
94.9 94.693.0
91.493.4 92.8 93.8
90.592.6
92.791.6
91.392.5
93.094.3
92.193.4
90.0
93.4
91.7
(%)
90
80
100
FY2015 FY2016FY2006 FY2007 FY2008 FY2009 FY2010 FY2011 FY2014FY2013FY2012
PrefecturesTotal Municipalities
Trends in the Ordinary Balance Ratio
Breakdown of Ordinary Balance Ratio (Total)
How financially capable are local governments to respond to local demands?
Ordinary balance ratio =
General revenue resources allotted to personnel expenses, Social assistance expenses, Debt service, etc.
×100Ordinary general revenue resources, etc. (Local tax + Regular local allocation tax, etc.)
+ Special exception portion of loans for covering decreases in Local tax revenues + Bonds for temporary substitution of local allocation tax
The Ordinary balance ratio is the proportion of General revenue resources allotted to Ordinary expenses such as Personnel expenses, Social assistance expenses, Debt service and other annually disbursed expenses with regularity to a total amount of Ordinary general revenue resources primarily consisting of Local tax and Regular local allocation tax, Special exception portion of loans for covering decreases in Local tax revenues and Bonds for temporary substitution of Local allocation tax.
* Special wards and partial administrative associations, etc., are not included in total and municipalities.
24Local Public Finance, 2018 –Illustrated–

Flexibility of the Financial Structure
11.9
12.713.113.513.713.9
13.513.012.8
13.5
6.97.4
8.08.6
9.29.9
10.511.2
11.812.3
9.39.9
10.410.9
11.311.812.012.112.3
12.8
(%)
Prefectures MunicipalitiesNet total
FY2007 FY2008 FY2009 FY2010 FY2011 FY2013 FY2015 FY2016FY2014FY2012
7
6
8
9
10
11
12
13
15
14
18.418.7
19.519.919.7
19.418.918.8
19.3
18.6
19.4
14.714.715.3
15.716.216.416.5
17.0
17.617.717.5 17.517.7
18.218.518.618.618.418.6
19.2
19.119.3
(%)20
19
18
17
16
14
15
FY2006 FY2015 FY2016FY2007 FY2008 FY2009 FY2010 FY2011 FY2012 FY2014FY2013
Prefectures MunicipalitiesNet total
Trends in the Real Debt Service Ratio
Trends in the Debt Service Payment Ratio
2 Real Debt Service Ratio and Debt Service Payment RatioClose attention should be paid to the trend of the Debt service, which is the expense required to repay the principal and interest of the debts of local governments and has an especially negative impact on financial flexibility. The Real debt service ratio and the Debt service payment ratio are indices that measure the extent of the burden of the Debt service.
*Real debt service ratio : The real debt service ratio is an index of the size of the redemption amount of debts (local bonds) and similar expenditure, and represents the cash-flow level.
*Debt service payment ratio : The Debt service payment ratio indicates the ratio of general revenue resources allocated for debt service (amount of repayment of the principal and interest on local bonds) in the total amount of General revenue resources. This index is used to measure the flexibility of the financial structure by assessing the degree to which Debt service restricts the freedom of use of General revenue resources.
25 White Paper on Local Public Finance, 2018
Future Financial Burden
13.6 13.9 15.3 17.2
17.9 19.7 21.6 25.4
121.1 118.4 115.8 114.4
12.3 11.8 12.5 12.2
137.8 136.0 134.6 134.8
17.9
31.4
110.7
12.3
136.5
19.6
36.1
107.2
13.0
136.7
21.0
40.6
104.1
13.4
137.1
22.4
45.0
101.0
14.5
138.1
22.6
48.5
97.5
15.1
138.5
23.3
50.7
94.9
15.4
137.6
23.6
51.9
93.0
15.6
136.9
30
30
0
60
90
120
180
150
(trillion yen)(trillion yen)
FY2015 FY2016FY2014FY2006 FY2007 FY2008 FY2009 FY2010 FY2011 FY2013FY2012
Reserves on hand
Debt burden Outstanding local government bonds + Debt burden - Reserves on hand
Bonds for the extraordinary �nancial measures Outstanding local government bonds (excluding Bonds for the extraordinary �nancial measures)
27.5
200.2200.2
33.6
26.8
198.6198.6
33.6
26.1
197.1197.1
33.6
25.3
198.7198.7
33.6
24.1
199.8199.8
33.6
23.6
200.4200.4
33.5
22.9
201.0201.0
33.4
22.1
201.4201.4
33.3
20.8
199.1199.1
32.8
21.4
200.5200.5
33.1
17.9
121.1
19.7
118.4
21.6
115.8
25.4
114.4
31.4
110.7
36.1
107.2
40.6
104.1
45.0
101.0
48.5
97.5
50.7
94.9
20.0
32.4
51.9
93.0
250
200
150
100
50
0
(trillion yen)
FY2015 FY2016FY2014FY2006 FY2007 FY2008 FY2009 FY2010 FY2011 FY2013FY2012
Outstanding local government bonds (excluding Bonds for the extraordinary �nancial measures)Bonds for the extraordinary �nancial measures
Outstanding borrowing from special account for local allocation tax and transfer tax grants Outstanding public enterprise bonds (in ordinary accounts)
¥197.3 trillion
What is the status of debt in local public finance?
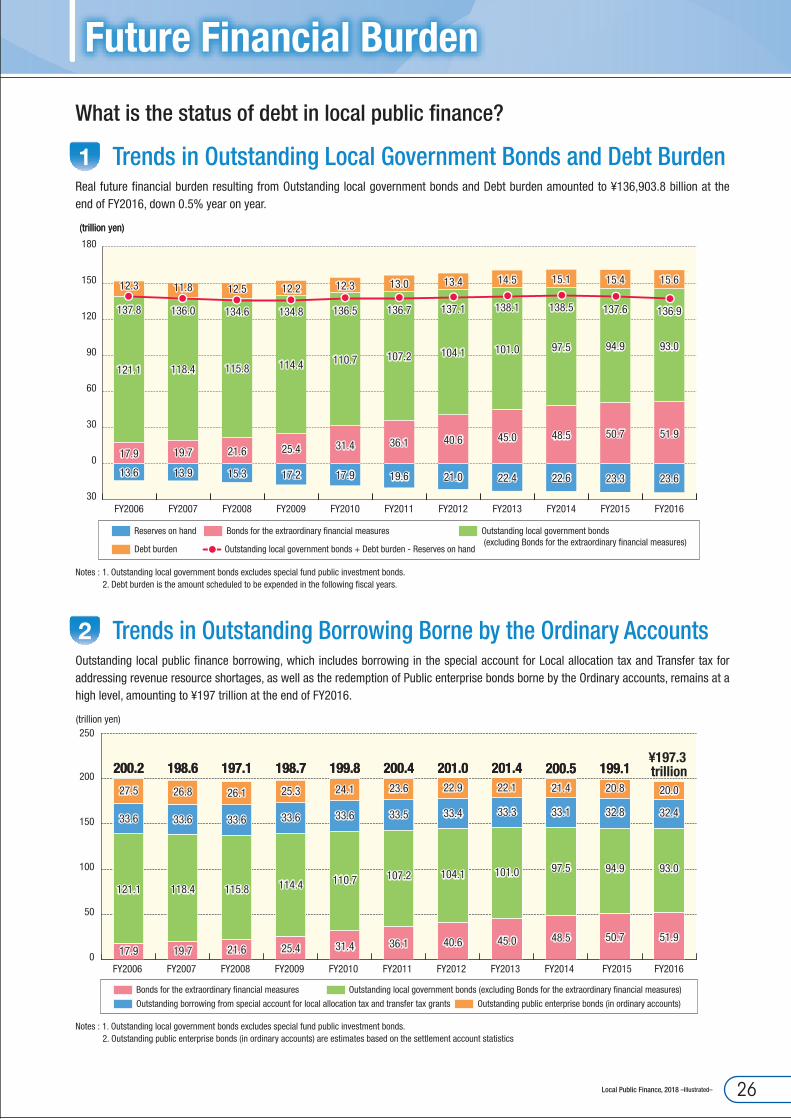
1 Trends in Outstanding Local Government Bonds and Debt BurdenReal future financial burden resulting from Outstanding local government bonds and Debt burden amounted to ¥136,903.8 billion at the end of FY2016, down 0.5% year on year.
Notes : 1. Outstanding local government bonds excludes special fund public investment bonds.2. Debt burden is the amount scheduled to be expended in the following fiscal years.
2 Trends in Outstanding Borrowing Borne by the Ordinary AccountsOutstanding local public finance borrowing, which includes borrowing in the special account for Local allocation tax and Transfer tax for addressing revenue resource shortages, as well as the redemption of Public enterprise bonds borne by the Ordinary accounts, remains at a high level, amounting to ¥197 trillion at the end of FY2016.
Notes : 1. Outstanding local government bonds excludes special fund public investment bonds.2. Outstanding public enterprise bonds (in ordinary accounts) are estimates based on the settlement account statistics
26Local Public Finance, 2018 –Illustrated–

Future Financial Burden
3 Trends in Balance of FundsReserves on hand (excluding the Great East Japan Earthquake portion) at the end of FY2016 was ¥21.5 trillion, an increase of ¥7.9 trillion from the end of FY2006.
0.0
5.0
10.0
15.0
20.0
25.0
13.6 13.915.3
17.217.9
22.623.3 23.6
19.621.0
22.4
Public �nance adjustment fund Sinking fund Special purpose fund Great East Japan Earthquake portion (Special purpose fund, etc., including the 2016 Kumamoto Earthquake portion)
FY2015 FY2016FY2014FY2006 FY2007 FY2008 FY2009 FY2010 FY2011 FY2013FY2012
¥21.5 trillion
(trillion yen)
Notes : 1. The Great East Japan Earthquake portion includes the 2016 Kumamoto Earthquake portion (FY2016: ¥51.8 billion).2. Reserves on hand do not include the amount of reserves for Sinking fund to be appropriated for principal and interest for local government bonds to be redeemed in full on maturity.
The balance of funds increased over the 10 years mainly due to systemic factors such as the central government’s policies and municipal mergers, measures for the aging of public facilities as well as preparations for disaster and various other future events. The funds increased as many organizations set aside reserves while striving to carry out administrative reform and reduce expenses.
(Unit: trillion yen)
Factors in increase Increase amount
Receiving organization
Non-receiving organization
(1) Systemic factors 2.3 2.1 0.1
1. Increase in Special purpose fund based on the central government’s policies*1 0.6 0.5 0.1
2. Increase in funds to prepare for completion of special measures associated with mergers, etc.*2 1.7 1.7 0.0
(2) Other preparations for future decrease in revenues and future increase in expenditures *3 5.7 3.1 2.5
Revenues1. Fluctuations in corporate taxes, etc. resulting from economic trends 0.8 0.5 0.3
2. Decrease in tax revenues due to population decrease 0.3 0.3 0.0
Expenditures
3. Measures for the aging of public and other facilities, etc. 2.0 1.0 1.1
4. Preparations for Disaster 0.9 0.6 0.3
5. Increase in social security-related expenses 0.7 0.3 0.4
6. Other 0.8 0.4 0.4
Total 7.9 5.3 2.7
Note : In some cases, figures in the table do not add up exactly to the total as values less than the given unit are rounded off.*1. Funds established based on the central government’s policies such as the Fund for comprehensively securing regional health and long-term care and the Fund for stabilizing
medical care finance for the latter-stage elderly. *2. Estimated based on survey results and the difference in balance of funds between merged organizations and non-merged organizations.*3. Public finance adjustment fund has been estimated based on the order of reasons for setting aside reserves indicated by survey results, while the Special purpose fund has
been estimated based on the classification of uses indicated by survey results.
Why has the balance of funds increased?
27 White Paper on Local Public Finance, 2018
Local Public Enterprises
◆Hospitals¥4,557.7 billion (26.9%)
◆Transportation¥1,110.5 billion (6.6%)
◆Other¥1,130.3 billion (6.7%)
◆Residential development¥684.6 billion (4.0%) Scale of �nancial
settlement¥16,933.9 billion
◆Sewerage business¥5,465.8 billion (32.3%)
◆Water supply business(including small-scale water supply)¥3,985.0 billion (23.5%) (End of FY2016)
10
0
20
90
100(%)
Water-supply business(including small-scalewater supply business)
Sewerage business Transportationbusiness(railways)
Transportationbusiness
(buses)
Hospitals
124.40 million(99.6%)
Out of 124.96 million
Current water-supplypopulation
104.07 million(90.2%)
Out of 115.31 million
Sewage disposalpopulation
3,376 million(13.7%)
Out of 24,600 million
No. of passengersper year
928 million(20.2%)
Out of 4,600 million
No. of passengersper year
179,000(11.5%)
Out of 1,561,000
No. of hospital beds
◆Hospitals634 (7.4%)
◆Residential development427 (5.0%)
◆Other1,236 (14.6%)
◆Care services557 (6.5%)
◆Water supply business2,041 (23.9%)
●Water supply business 1,334 (15.6%)●Small-scale water supply business
707 (8.3%)
No. ofbusinesses
8,534
(End of FY2016)
◆Sewerage business3,639 (42.6%)
What is the status of local public enterprises?
1 Presence of Local Public EnterprisesLocal public enterprises play a major role in improving the standard of living of residents.
Notes : 1. The graph shows the ratio of local public enterprises when the total number of business entities nationwide is set at 100.2. Figures for the total number of enterprises nationwide have been compiled from statistical materials of related organizations.
3 Scale of Financial SettlementThe scale of total financial settlement is ¥16,933.9 billion. By type of business, sewerage accounts for the largest ratio, followed, in order, by hospitals, total water supply, transportation, and residential development.
2 Number of Businesses Operated by Local Public Enterprises
8,534 businesses are operated by local public enterprises. By type of business, sewerage accounts for the largest ratio, followed, in order, by water supply, hospitals, care services, and residential development.
28Local Public Finance, 2018 –Illustrated–
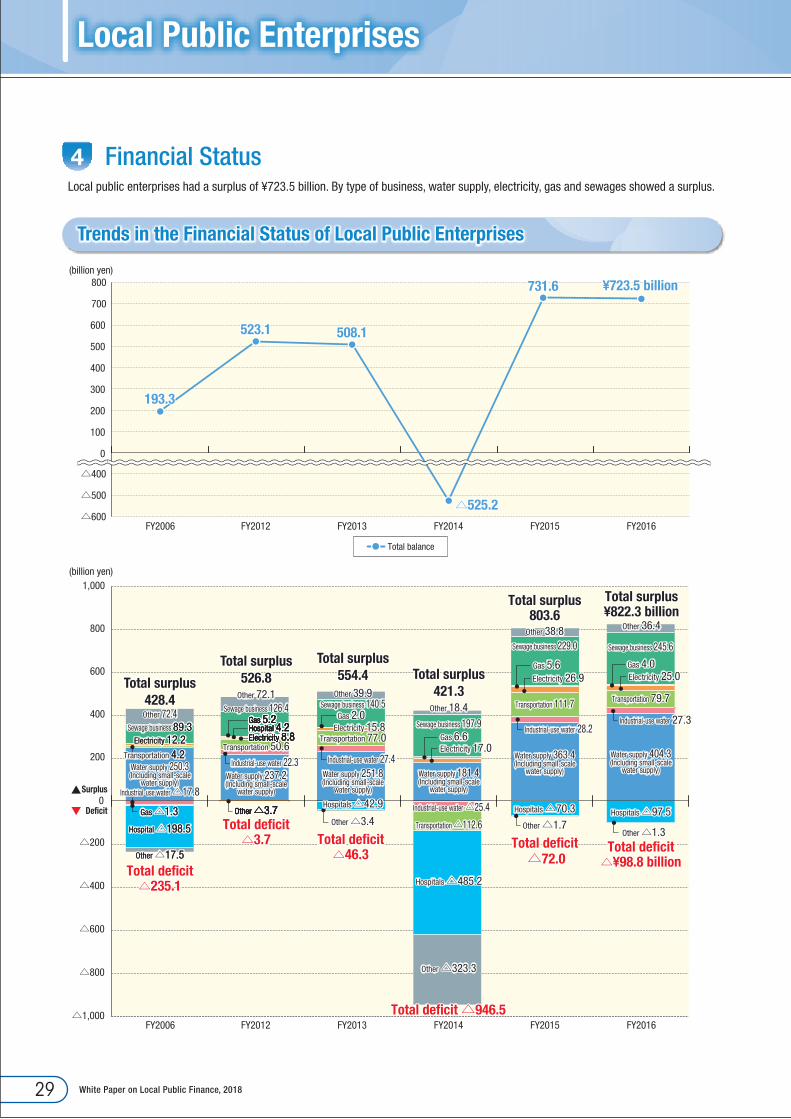
Local Public Enterprises
523.1
193.3
508.1
△525.2
Total de�cit△235.1
Total surplus428.4Other 72.4
89.3Sewage business 89.3Electricity 12.2Electricity 12.2
4.2Transportation 4.2Water supply 250.3
(Including small-scalewater supply)
Hospital 198.5Hospital △198.5
Other 17.5Other △17.5
Gas 1.3Gas △1.3
731.6
Industrial-use water 27.3
Total de�cit△¥98.8 billion
Total surplus¥822.3 billion
Other 36.4
Sewage business 245.6
Electricity 25.0
Transportation 79.7
Water supply 404.3(Including small-scale
water supply)
Hospitals △97.5
Other △1.3
Gas 4.0
Industrial-use water △17.8
FY2015 FY2016FY2012FY2006
FY2016FY2006
FY2014FY2013
FY2015FY2012 FY2014FY2013
Total balance
Total de�cit△3.7
Total surplus526.8
Other 72.1Sewage business 126.4
Transportation 50.6Industrial-use water 22.3
Water supply 237.2(Including small-scale
water supply)
Other △3.7Other △3.7Other △3.7Other △3.7Other △3.7
Electricity 8.8Electricity 8.8Electricity 8.8Electricity 8.8Electricity 8.8Hospital 4.2Hospital 4.2Hospital 4.2Hospital 4.2Hospital 4.2Gas 5.2Gas 5.2Gas 5.2Gas 5.2Gas 5.2
Hospitals △42.9
Total de�cit△46.3
Total surplus554.4
Other 39.9Sewage business 140.5
Electricity 15.8Transportation 77.0
Industrial-use water 27.4Water supply 251.8(Including small-scale
water supply)
Other △3.4
Gas 2.0
Total surplus421.3
Other 18.4Sewage business 197.9
Gas 6.6Electricity 17.0
Industrial-use water △25.4
Transportation △112.6
Hospitals △485.2
Other △323.3
Water supply 181.4(Including small-scale
water supply)
Total de�cit △946.5
Sewage business 229.0
Electricity 26.9Gas 5.6
Industrial-use water 28.2
Water supply 363.4(Including small-scale
water supply)
Transportation 111.7
Hospitals △70.3
Other △1.7
Total de�cit △72.0
Total surplus803.6
Other 38.8
600
800
700
500
400
300
200
100
△400
△500
△600
0
(billion yen)
¥723.5 billion
600
800
1,000
400
200
0
△200
△400
△600
△800
△1,000
(billion yen)
Surplus
De�cit
Trends in the Financial Status of Local Public Enterprises
4 Financial StatusLocal public enterprises had a surplus of ¥723.5 billion. By type of business, water supply, electricity, gas and sewages showed a surplus.
29 White Paper on Local Public Finance, 2018

Impact of Great East Japan Earthquake
¥10,848.3 billionFY2015
FY2016
¥2,952.2 billion (27.2%)
¥2,010.0 billion(18.5%)
¥1,817.3 billion(16.8%)
¥4,068.8 billion(37.5%)
¥307.3 billion (2.8%)
¥10,689.3 billion¥2,935.8 billion (27.5%)
¥2,027.5 billion(19.0%)
¥1,962.7 billion(18.4%)
¥3,763.2 billion(35.1%)
¥288.5 billion (2.7%)
Local taxes Local allocation tax Earthquake disaster reconstruction allocation tax National treasury disbursements Other
¥10,348.0 billion
¥10,227.8 billion
FY2015
FY2016
¥1,833.1 billion(17.7%)
¥359.6 billion (3.5%)
¥384.8 billion (3.8%)
¥7,062.3 billion(68.2%)
¥669.0 billion (6.5%)
¥606.5 billion (5.9%)
¥741.2 billion (7.2%)
¥424.0 billion(4.1%)
¥1,996.3 billion(19.5%)
¥541.2 billion(5.3%)
¥6,914.3 billion(67.6%)
¥391.3 billion(3.8%)
General administrative expenses Public welfare expenses Disaster relief expenses Sanitation expenses Disaster recovery expenses Other
FY2015
FY2016
¥10,348.0 billion¥4,567.3 billion(44.1%)
¥3,923.2 billion(37.9%)
¥1,857.5 billion (18.0%)
¥1,497.9 billion (14.5%) ¥359.6 billion (3.5%) ¥671.6 billion (6.5%)
¥10,227.8 billion¥4,362.9 billion(42.7%)
¥3,899.5 billion(38.1%)
¥1,965.4 billion (19.2%)
¥1,580.6 billion (15.5%) ¥384.8 billion (3.8%) ¥684.8 billion (6.7%)
Mandatory expenses Investment expenses Ordinary construction work expenses Disaster recovery project expenses Other Reserves
Expenditures Classified by Type
Expenditures Classified by Purpose
Revenues
1 Settlement of Disaster-Struck Organizations1.Specified Disaster-Struck Prefectures
In FY2016, the total revenues of the nine specified disaster-struck prefectures amounted to ¥10,689.3 billion, decreasing by ¥159.1 billion year on year, or 1.5% (0.8% national decrease). Total expenditures of the entities amounted to ¥10,227.8 billion, decreasing by ¥120.2 billion year on year, or 1.2% (1.0% national decrease).* Specified disaster-struck prefectures : Prefectures stipulated in Article 2, Paragraph 2 of the Act on Special Public Finance Support and Assistance to Deal with the Great East Japan
Earthquake (Act No. 40 of 2011). These prefectures are Aomori, Iwate, Miyagi, Fukushima, Ibaraki, Tochigi, Chiba, Niigata, and Nagano prefectures.
30Local Public Finance, 2018 –Illustrated–
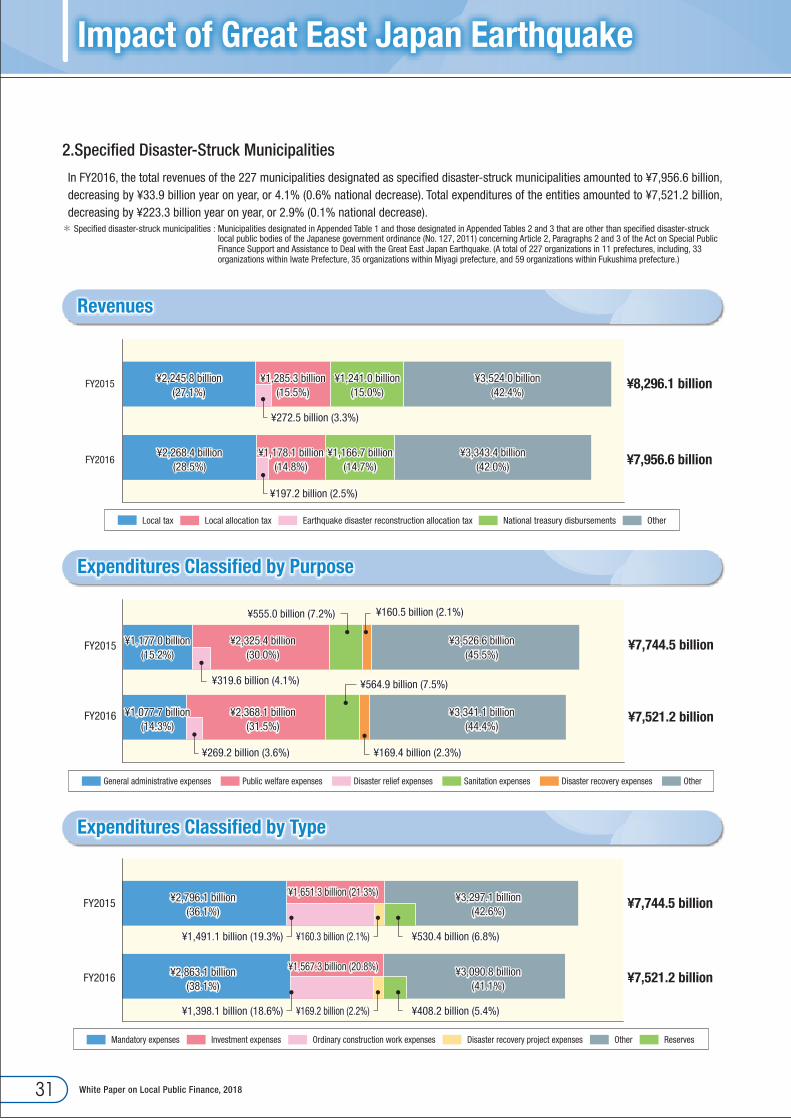
Impact of Great East Japan Earthquake
¥8,296.1 billion¥2,245.8 billion(27.1%)
¥1,285.3 billion(15.5%)
¥1,241.0 billion(15.0%)
¥3,524.0 billion(42.4%)
¥272.5 billion (3.3%)
¥7,956.6 billion¥2,268.4 billion(28.5%)
¥1,178.1 billion(14.8%)
¥1,166.7 billion(14.7%)
¥3,343.4 billion(42.0%)
¥197.2 billion (2.5%)
FY2015
Local tax Local allocation tax Earthquake disaster reconstruction allocation tax National treasury disbursements Other
FY2016
FY2015
FY2016
¥7,744.5 billion¥1,177.0 billion(15.2%)
¥2,325.4 billion(30.0%)
¥319.6 billion (4.1%)
¥555.0 billion (7.2%) ¥160.5 billion (2.1%)
¥3,526.6 billion(45.5%)
¥7,521.2 billion¥1,077.7 billion(14.3%)
¥2,368.1 billion(31.5%)
¥269.2 billion (3.6%) ¥169.4 billion (2.3%)
¥564.9 billion (7.5%)
¥3,341.1 billion(44.4%)
General administrative expenses Public welfare expenses Disaster relief expenses Sanitation expenses Disaster recovery expenses Other
FY2015
FY2016
¥7,744.5 billion¥3,297.1 billion(42.6%)
¥2,796.1 billion(36.1%)
¥1,651.3 billion (21.3%)
¥160.3 billion (2.1%)¥1,491.1 billion (19.3%) ¥530.4 billion (6.8%)
¥7,521.2 billion¥3,090.8 billion(41.1%)
¥2,863.1 billion(38.1%)
¥1,567.3 billion (20.8%)
¥169.2 billion (2.2%)¥1,398.1 billion (18.6%) ¥408.2 billion (5.4%)
Mandatory expenses Investment expenses Ordinary construction work expenses Disaster recovery project expenses Other Reserves
Revenues
Expenditures Classified by Purpose
Expenditures Classified by Type
2.Specified Disaster-Struck Municipalities
In FY2016, the total revenues of the 227 municipalities designated as specified disaster-struck municipalities amounted to ¥7,956.6 billion, decreasing by ¥33.9 billion year on year, or 4.1% (0.6% national decrease). Total expenditures of the entities amounted to ¥7,521.2 billion, decreasing by ¥223.3 billion year on year, or 2.9% (0.1% national decrease).* Specified disaster-struck municipalities : Municipalities designated in Appended Table 1 and those designated in Appended Tables 2 and 3 that are other than specified disaster-struck
local public bodies of the Japanese government ordinance (No. 127, 2011) concerning Article 2, Paragraphs 2 and 3 of the Act on Special Public Finance Support and Assistance to Deal with the Great East Japan Earthquake. (A total of 227 organizations in 11 prefectures, including, 33 organizations within Iwate Prefecture, 35 organizations within Miyagi prefecture, and 59 organizations within Fukushima prefecture.)
31 White Paper on Local Public Finance, 2018

Surplus De�cit No. of businesses with de�citsNo. of businesses with surpluses
FY2015
847
82
△¥28.1 billion
¥131.2 billion
Net amount ¥103.1 billion
FY2016
823
94
△¥46.5 billion
¥129.6 billion
Net amount ¥83.1billion
△50
△75
△100
△125
△150
△25
0
25
50
75
100
125
150(billion yen)
¥7.8 billion¥7.8 billion¥3.7 billion¥3.7 billion¥6.4 billion¥6.4 billion¥1.5 billion¥1.5 billion¥7.5 billion¥7.5 billion
¥26.2 billion
¥50.1 billion
De�cit△¥0.1 billion
Surplus¥103.2 billion
Net amount ¥103.1 billionNet amount ¥103.1 billion
¥25.0 billion
¥56.1 billion
De�cit△¥17.7 billion
Surplus¥100.8 billion
Net amount ¥83.1 billionNet amount ¥83.1 billion
△¥0.1 billion
¥3.6 billion¥3.6 billion
¥2.1 billion¥2.1 billion¥7.2 billion¥7.2 billion¥6.8 billion¥6.8 billion
△¥3.8 billion△¥8.0 billion△¥5.9 billion
FY2015 FY2016
Total water supply (including small-scale water supply)Electricity
Industrial-use waterGas
TransportationOtherHospitals Sewage business
△150
△100
△50
0
50
100
150(billion yen)
Financial Status of Businesses of Local Enterprises of Disaster-Struck Organizations
Settlements by Businesses of Local Enterprises of Disaster-Struck Organizations
2 Financial Status of Businesses of Local Public Enterprises of Disaster-Struck OrganizationsTotal revenues and expenditures of local enterprises of disaster-struck organizations amounted to a surplus of ¥83.1 billion, a decrease of ¥20 billion year on year, or 19.4%. There were 823 businesses with surpluses, or 89.7% of all businesses, while 94 businesses had deficits, or 10.3%.* Local enterprises of disaster-struck organizations : Nine prefectures stipulated in Article 2, Paragraph 2 of the Act on Special Public Finance Support and Assistance to Deal with the Great East Japan Earthquake,
and 178 municipalities stipulated in Appended Table 1 of the Japanese government ordinance concerning Article 2, Paragraphs 2 and 3 of the Act on Special Public Finance Support and Assistance to Deal with the Great East Japan Earthquake (including some labor unions joined by the above bodies).
32Local Public Finance, 2018 –Illustrated–
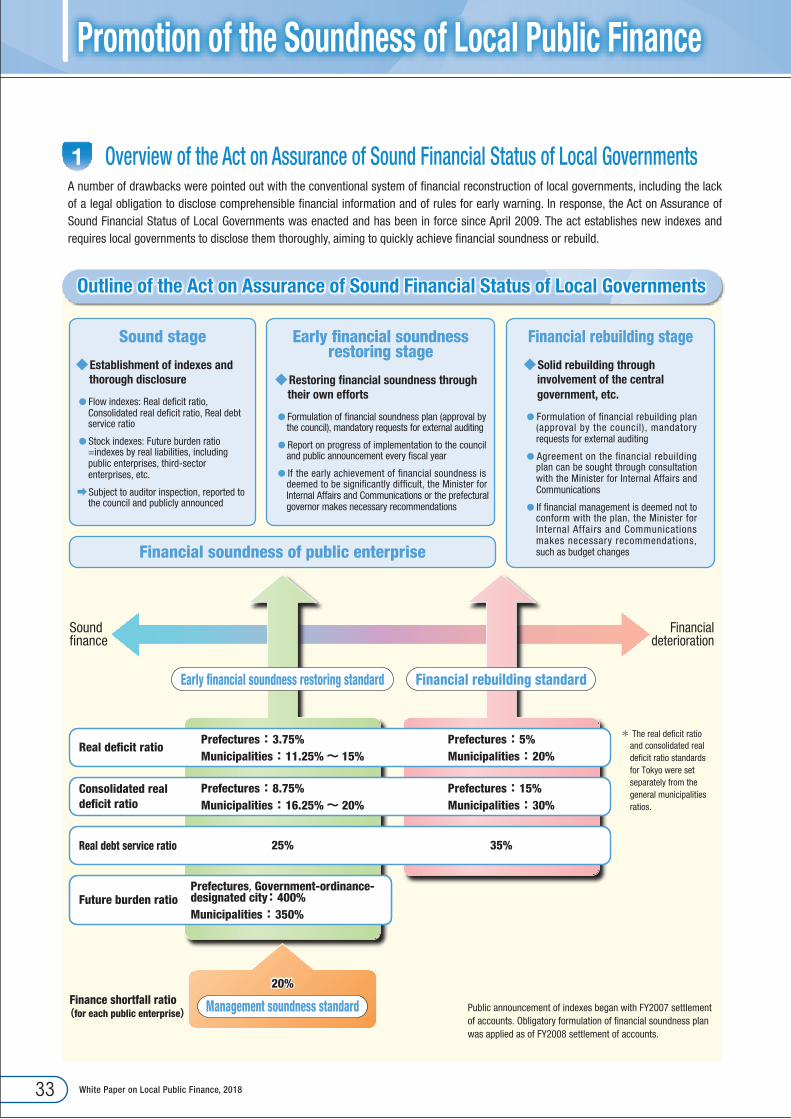
Promotion of the Soundness of Local Public Finance
Sound stage
◆Establishment of indexes and thorough disclosure
● Flow indexes: Real de�cit ratio, Consolidated real de�cit ratio, Real debt service ratio
● Stock indexes: Future burden ratio =indexes by real liabilities, including public enterprises, third-sector enterprises, etc.
➡Subject to auditor inspection, reported to the council and publicly announced
Early �nancial soundness restoring stage
◆Restoring �nancial soundness through their own efforts
● Formulation of �nancial soundness plan (approval by the council), mandatory requests for external auditing
● Report on progress of implementation to the council and public announcement every �scal year
● If the early achievement of �nancial soundness is deemed to be signi�cantly dif�cult, the Minister for Internal Affairs and Communications or the prefectural governor makes necessary recommendations
Financial rebuilding stage
◆Solid rebuilding through involvement of the central government, etc.
● Formulation of �nancial rebuilding plan (approval by the council), mandatory requests for external auditing
● Agreement on the �nancial rebuilding plan can be sought through consultation with the Minister for Internal Affairs and Communications
● If �nancial management is deemed not to conform with the plan, the Minister for Internal Affairs and Communications makes necessary recommendations, such as budget changesFinancial soundness of public enterprise
Real de�cit ratioPrefectures : 3.75%Municipalities : 11.25%~ 15%
Prefectures : 5%Municipalities : 20%
Consolidated realde�cit ratio
Prefectures : 8.75%Municipalities : 16.25%~ 20%
Prefectures : 15%Municipalities : 30%
Real debt service ratio 25% 35%
Future burden ratio
Finance shortfall ratio(for each public enterprise)
Prefectures, Government-ordinance-designated city: 400%Municipalities : 350%
Public announcement of indexes began with FY2007 settlement of accounts. Obligatory formulation of �nancial soundness plan was applied as of FY2008 settlement of accounts.
* The real de�cit ratio and consolidated real de�cit ratio standards for Tokyo were set separately from the general municipalities ratios.
Early �nancial soundness restoring standard Financial rebuilding standard
Sound�nance
Financialdeterioration
20%
Management soundness standard
Outline of the Act on Assurance of Sound Financial Status of Local Governments
1 Overview of the Act on Assurance of Sound Financial Status of Local GovernmentsA number of drawbacks were pointed out with the conventional system of financial reconstruction of local governments, including the lack of a legal obligation to disclose comprehensible financial information and of rules for early warning. In response, the Act on Assurance of Sound Financial Status of Local Governments was enacted and has been in force since April 2009. The act establishes new indexes and requires local governments to disclose them thoroughly, aiming to quickly achieve financial soundness or rebuild.
33 White Paper on Local Public Finance, 2018
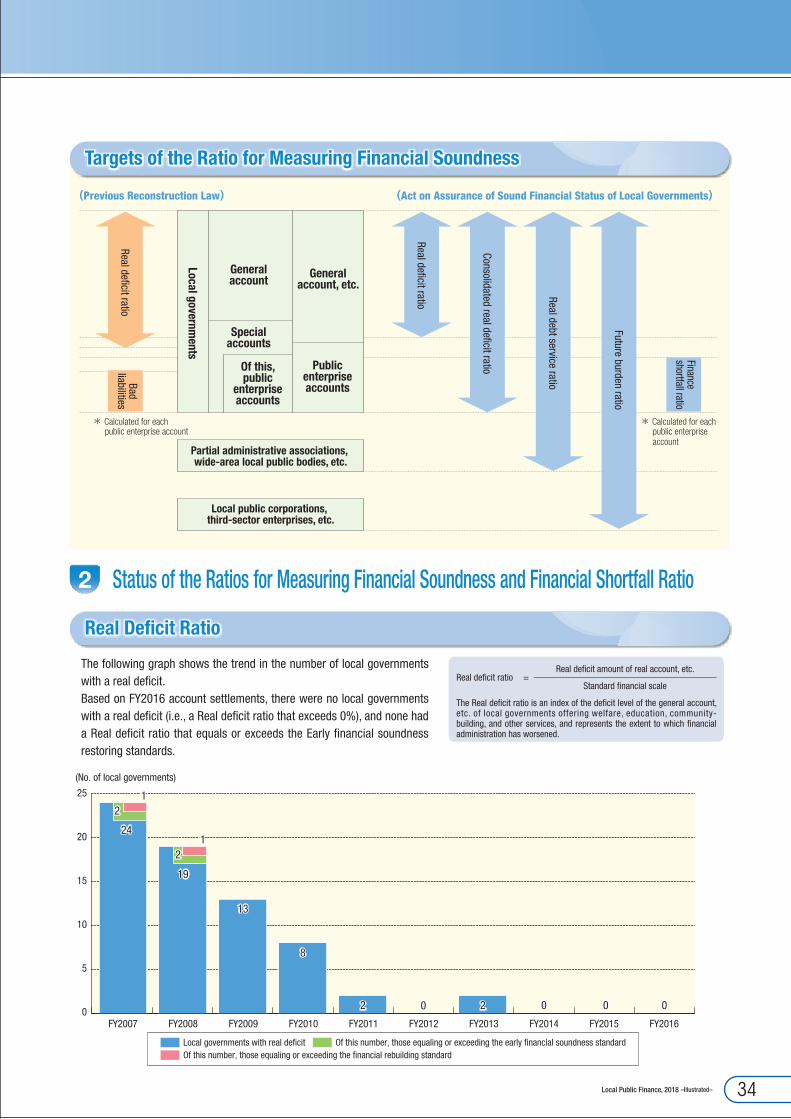
Generalaccount
Generalaccount, etc.
Specialaccounts
Local governments
Real de�cit ratio
Real de�cit ratio
Consolidated real de�cit ratio
Real debt service ratio
Future burden ratio
Badliabilities
(Previous Reconstruction Law)
Partial administrative associations, wide-area local public bodies, etc.
Publicenterpriseaccounts
Of this,public
enterpriseaccounts
Local public corporations, third-sector enterprises, etc.
Financeshortfall ratio
* Calculated for eachpublic enterprise account
* Calculated for eachpublic enterpriseaccount
(Act on Assurance of Sound Financial Status of Local Governments)
0
5
10
15
20
25
24
2
2
1
1
19
13
8
2 0 2 0 0 0
FY2007 FY2008 FY2009 FY2010 FY2011 FY2014 FY2015 FY2016FY2013FY2012
(No. of local governments)
Local governments with real de�cit Of this number, those equaling or exceeding the early �nancial soundness standardOf this number, those equaling or exceeding the �nancial rebuilding standard
Targets of the Ratio for Measuring Financial Soundness
Real Deficit Ratio
2 Status of the Ratios for Measuring Financial Soundness and Financial Shortfall Ratio
The following graph shows the trend in the number of local governments with a real deficit. Based on FY2016 account settlements, there were no local governments with a real deficit (i.e., a Real deficit ratio that exceeds 0%), and none had a Real deficit ratio that equals or exceeds the Early financial soundness restoring standards.
Real deficit ratio =Real deficit amount of real account, etc.
Standard financial scale
The Real deficit ratio is an index of the deficit level of the general account, etc. of local governments offering welfare, education, community-building, and other services, and represents the extent to which financial administration has worsened.
34Local Public Finance, 2018 –Illustrated–
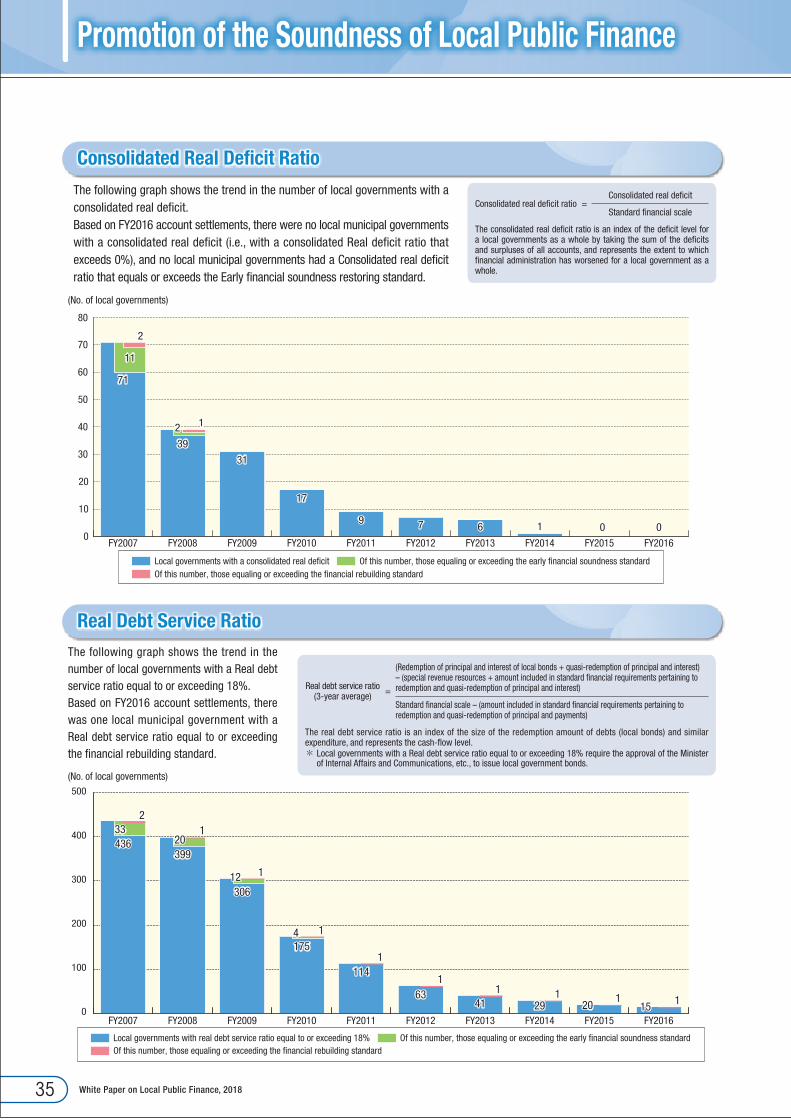
Promotion of the Soundness of Local Public Finance
0
10
20
30
40
50
60
70
80
71
11
2
2
1
39
31
17
9 7 6 1 0 0
(No. of local governments)
FY2007 FY2008 FY2009 FY2010 FY2011 FY2015 FY2016FY2014FY2013FY2012
Local governments with a consolidated real de�cit Of this number, those equaling or exceeding the early �nancial soundness standardOf this number, those equaling or exceeding the �nancial rebuilding standard
43633
2
201
399
12306
4 1175
1114
163 1
411
291
20 115
1
0
100
200
300
400
500
(No. of local governments)
FY2007 FY2008 FY2009 FY2010 FY2011 FY2015 FY2016FY2014FY2013FY2012
Local governments with real debt service ratio equal to or exceeding 18% Of this number, those equaling or exceeding the early �nancial soundness standardOf this number, those equaling or exceeding the �nancial rebuilding standard
Consolidated Real Deficit Ratio
Real Debt Service Ratio
The following graph shows the trend in the number of local governments with a consolidated real deficit.Based on FY2016 account settlements, there were no local municipal governments with a consolidated real deficit (i.e., with a consolidated Real deficit ratio that exceeds 0%), and no local municipal governments had a Consolidated real deficit ratio that equals or exceeds the Early financial soundness restoring standard.
Consolidated real deficit ratio =Consolidated real deficit
Standard financial scale
The consolidated real deficit ratio is an index of the deficit level for a local governments as a whole by taking the sum of the deficits and surpluses of all accounts, and represents the extent to which financial administration has worsened for a local government as a whole.
The following graph shows the trend in the number of local governments with a Real debt service ratio equal to or exceeding 18%.Based on FY2016 account settlements, there was one local municipal government with a Real debt service ratio equal to or exceeding the financial rebuilding standard.
Real debt service ratio (3-year average) =
(Redemption of principal and interest of local bonds + quasi-redemption of principal and interest) – (special revenue resources + amount included in standard financial requirements pertaining to redemption and quasi-redemption of principal and interest)
Standard financial scale – (amount included in standard financial requirements pertaining to redemption and quasi-redemption of principal and payments)
The real debt service ratio is an index of the size of the redemption amount of debts (local bonds) and similar expenditure, and represents the cash-flow level.* Local governments with a Real debt service ratio equal to or exceeding 18% require the approval of the Minister
of Internal Affairs and Communications, etc., to issue local government bonds.
35 White Paper on Local Public Finance, 2018
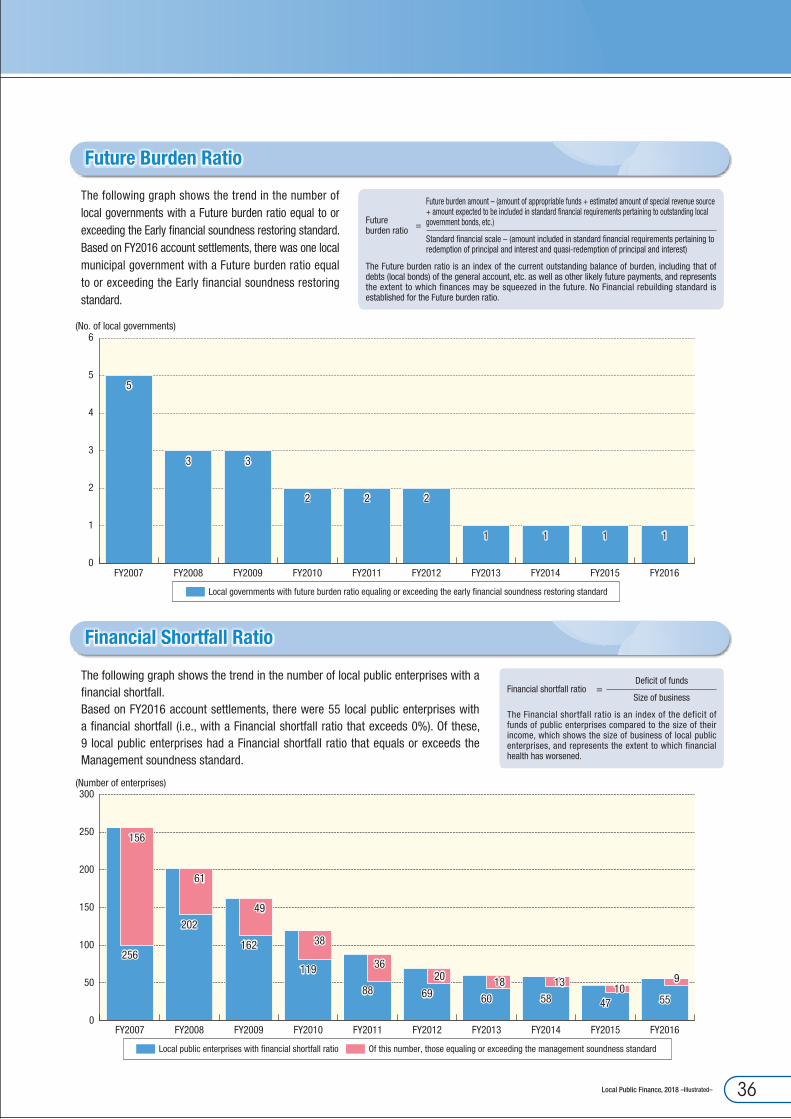
0
1
2
3
4
5
6
5
3 3
2 2 2
1 1 11
FY2007 FY2008 FY2009 FY2010 FY2011 FY2015 FY2016FY2014FY2013FY2012
(No. of local governments)
Local governments with future burden ratio equaling or exceeding the early �nancial soundness restoring standard
0
50
100
150
200
250
300
156
256
61
202
49
162 38
119 36
8820
6918
60
13
5810
47
9
55
FY2007 FY2008 FY2009 FY2010 FY2011 FY2015 FY2016FY2014FY2013FY2012
(Number of enterprises)
Local public enterprises with �nancial shortfall ratio Of this number, those equaling or exceeding the management soundness standard
Future Burden Ratio
Financial Shortfall Ratio
The following graph shows the trend in the number of local governments with a Future burden ratio equal to or exceeding the Early financial soundness restoring standard.Based on FY2016 account settlements, there was one local municipal government with a Future burden ratio equal to or exceeding the Early financial soundness restoring standard.
Future burden ratio =
Future burden amount – (amount of appropriable funds + estimated amount of special revenue source + amount expected to be included in standard financial requirements pertaining to outstanding local government bonds, etc.)
Standard financial scale – (amount included in standard financial requirements pertaining to redemption of principal and interest and quasi-redemption of principal and interest)
The Future burden ratio is an index of the current outstanding balance of burden, including that of debts (local bonds) of the general account, etc. as well as other likely future payments, and represents the extent to which finances may be squeezed in the future. No Financial rebuilding standard is established for the Future burden ratio.
The following graph shows the trend in the number of local public enterprises with a financial shortfall.Based on FY2016 account settlements, there were 55 local public enterprises with a financial shortfall (i.e., with a Financial shortfall ratio that exceeds 0%). Of these, 9 local public enterprises had a Financial shortfall ratio that equals or exceeds the Management soundness standard.
Financial shortfall ratio =Deficit of funds
Size of business
The Financial shortfall ratio is an index of the deficit of funds of public enterprises compared to the size of their income, which shows the size of business of local public enterprises, and represents the extent to which financial health has worsened.
36Local Public Finance, 2018 –Illustrated–
http://www.soumu.go.jp/
Financial Management Division,Local Public Finance Bureau,Ministry of Internal Affairs andCommunications
Address: 2-1-2 Kasumigaseki, Chiyoda-ku,Tokyo 100-8926, JapanTel.: +81-(0)3-5253-5111 (ext. 5649)Fax: +81-(0)3-5253-5650http://www.soumu.go.jpAll Rights Reserved
FY2016 Settlement
White Paper onLocal Public Finance, 2018
– Illustrated –


