1 Date: March 18 th , 2019 Ref.No.: PSS-GS180009-PUB/E For Publication FY2018 Investigation on Infrastructure Development for Acquisition of Joint Credit (Quantification of international contribution and JCM feasibility study) "Feasibility study on CO2 reduction with energy optimization solutions toward the introduction of energy-saving policies and institutions to refineries and process plants in India" Investigation Report March 18, 2019 Yokogawa Electric Corporation
Transcript
1Date: March 18 th, 2019 Ref.No.: PSS-GS180009-PUB/E
For Publication
FY2018Investigation on Infrastructure Development for Acquisition of Joint Credit
(Quantification of international contribution and JCM feasibility study)
"Feasibility study on CO2 reduction with energy optimization solutions toward the introduction of energy-saving policies and institutions to refineries and process plants in
India"
Investigation Report
March 18, 2019Yokogawa Electric Corporation
2Date: March 18 th, 2019 Ref.No.: PSS-GS180009-PUB/E
For Publication
1. Table of ContentsAcronyms / Abbreviations ..................................................................................................................................... 4
1 Outline of this feasibility study...................................................................................................................... 5
1.1 Objectives and background of the feasibility study ............................................................... 5
1.2 Outline of the investigation.................................................................................................. 6
1.2.1 Outline of the target site ...................................................................................................... 6
3.5.14 Simulation, optimization and Delta View ........................................................................... 75
3.5.15 Economic summary and Custom Report ............................................................................ 76
4 Business plan .............................................................................................................................................. 80
4.1 Energy Management Solution of Yokogawa ....................................................................... 80
Reference, website, and interviewee list ............................................................................................................... 98
4Date: March 18 th, 2019 Ref.No.: PSS-GS180009-PUB/E
For Publication
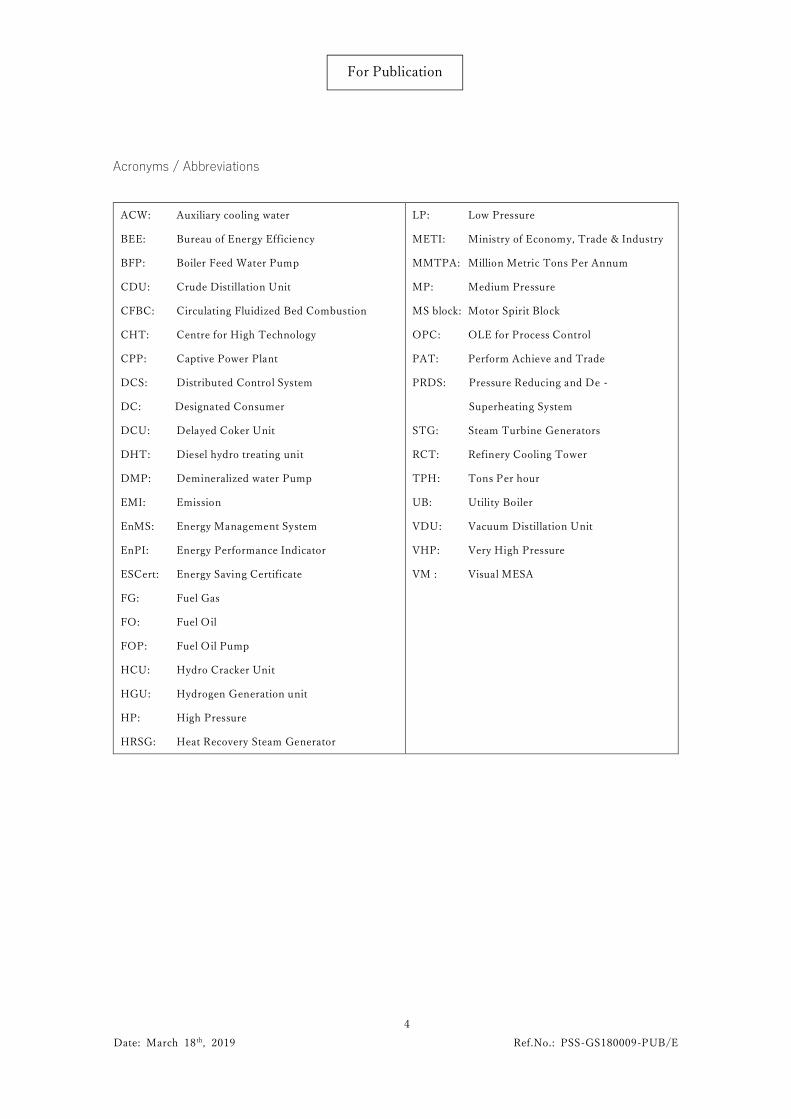
Acronyms / Abbreviations
ACW: Auxiliary cooling water
BEE: Bureau of Energy Efficiency
BFP: Boiler Feed Water Pump
CDU: Crude Distillation Unit
CFBC: Circulating Fluidized Bed Combustion
CHT: Centre for High Technology
CPP: Captive Power Plant
DCS: Distributed Control System
DC: Designated Consumer
DCU: Delayed Coker Unit
DHT: Diesel hydro treating unit
DMP: Demineralized water Pump
EMI: Emission
EnMS: Energy Management System
EnPI: Energy Performance Indicator
ESCert: Energy Saving Certificate
FG: Fuel Gas
FO: Fuel Oil
FOP: Fuel Oil Pump
HCU: Hydro Cracker Unit
HGU: Hydrogen Generation unit
HP: High Pressure
HRSG: Heat Recovery Steam Generator
LP: Low Pressure
METI: Ministry of Economy, Trade & Industry
MMTPA: Million Metric Tons Per Annum
MP: Medium Pressure
MS block: Motor Spirit Block
OPC: OLE for Process Control
PAT: Perform Achieve and Trade
PRDS: Pressure Reducing and De -
Superheating System
STG: Steam Turbine Generators
RCT: Refinery Cooling Tower
TPH: Tons Per hour
UB: Utility Boiler
VDU: Vacuum Distillation Unit
VHP: Very High Pressure
VM : Visual MESA
5Date: March 18 th, 2019 Ref.No.: PSS-GS180009-PUB/E
For Publication
1 Outline of this feasibility study
This chapter describes the outline of this feasibility study.
1.1 Objectives and background of the feasibility study
In November 2016, a new international rule on measures against global warming , "Paris Agreement", went into
effect. For the first time in history, all countries, including developing countries, participated in the convention and
worked on the basis of a common global "long -term goal" and their own contributions or reduction targets
(Nationally Determined Contributions = NDC). Under the Paris agreement, in which all countries participate,
many developing countries are requesting the provision of funds and technologies from deve loped countries as a
prerequisite for NDC implementation.
On the other hand, the "Japan Revitalization Strategy 2016" which was decided by the Cabinet in June of the same
year, quantified the amount of emission reductions achieved through private initiati ves that contribute to the
reduction and absorption of greenhouse gas emissions through the dissemination of technologies, products, systems,
services, infrastructure, etc., and the implementation of mitigation activities in developing countries that are n ot
dependent on government funds, and stipulated that if an agreement is reached by a developing country, in principle,
"Joint Credit Mechanism (JCM)". In order to promote JCM projects led by private sectors, the Government of Japan
will continue to hold consultations with developing countries on project implementation and institution building.
In addition, the Ministry of Economy, Trade and Industry established the "Long-Term Global Warming Prevention
Platform" (Platform) in July 2016, consisting of industry, government, and academia, and examined measures for
long-term greenhouse gas reduction after 2030. In April 2017, a report was compiled and released based on the
results of discussions at the Task Force on Expanding Domestic Investment and the Task F orce on Overseas
Expansion Strategies established under the platform. It was specified that, in addition to JCM, Japan will contribute
to the reduction of greenhouse gas emissions by using Japan's advanced low -carbon technologies through public
financing such as ODA and JBIC. However, only JCM has been quantified as Japan's contribution, and it was
suggested that Japan would make an international contribution that exceeds the emissions of Japan as a whole by
quantifying the amount of reduction in the world as a result of Japan's contribution, and announce them positively.
Under these circumstances, Japan needs to contribute to the reduction of global emissions not only through the
overseas development of JCM but also through the overseas development of outs tanding low-carbon technologies,
products, systems, services, infrastructure, etc. for the reduction of greenhouse gases possessed by Japanese
companies, and also aim to contribute to further economic growth of Japan.
6Date: March 18 th, 2019 Ref.No.: PSS-GS180009-PUB/E
For Publication
This study aims to clarify the usefulness of Japan's advanced low-carbon technologies and products, calculate the
mid- to long-term reduction potential in India, and promote the spread of low-carbon technologies and products in
India. It also aims to contribute to the reduction of greenhouse gas emissions in developing countries by proposing
policies and systems necessary to steadily promote and enhance the promotion of energy conservation at refineries
and process plants in India, as well as business plans related to the dissemination of low -carbon technologies and
products.
1.2 Outline of the investigation
1.2.1 Outline of the target site
The target site is a refinery in India (hereafter called the target refinery).
1.2.2 Organization
This feasibility study has been carried out by 3 business entities: Yokogawa Electric Corporation, KBC Advanced
Technologies Ltd. (KBC), and Yokogawa India Limited (YIL). Both KBC and Yokogawa India Limited are
subsidiaries of Yokogawa Electric Corporation. As a responsible entity, Yokogawa Electric is deeply involved in eac h
survey and business plan item, and is responsible for the management and supervision of the whole study. Yokogawa
India Limited provides support for field research, communication and coordination with the target refinery, and
support related to policy and institution research and business planning. KBC is able to estimate and propose highly
accurate energy saving effect and CO2 reduction amount close to the actual situation by the exclusive energy related
domain consultant of the company joining investigation and analysis. And, the energy optimization analysis software
Visual MESA of Yokogawa is used for the energy saving feasibility study of the target refinery. This allows the target
refinery’s 's utility facilities to find out the optimal (Minimized waste and loss) supply and demand balance for
power, steam, fuel gas, etc., under varying constraints such as process operating conditions and fuel prices. Based
on the results of this optimum balance calculation, the effects of ene rgy conservation on the present state are
quantitatively estimated, and the amount of CO2 reduction is also estimated. This software is characterized by its
ability to perform highly accurate optimization calculations even for equipment with nonlinear char acteristics, and
by its ability to perform optimization calculations that take into account changes in operating conditions, such as
the starting and stopping of equipment and the switching of power. It has already been adopted by more than 90
sites worldwide. KBC will also be in charge of modeling engineering the Visual MESA. In general, in this study, by
actually referring to the design data and operation data of the utility equipment obtained from the target refinery
in the field survey and hearing, and by adding the domain consultant exclusively for KBC to the survey and analysis,
it is possible to estimate and make recommendations on the energy saving effect and CO2 reduction with high
precision close to the actual situation.
7Date: March 18 th, 2019 Ref.No.: PSS-GS180009-PUB/E
For Publication
1.2.3 Schedule
Mid-December 2018: Feasibility Study kickoff meeting with the target refinery
Mid-December: Field survey, plant data collection
Mid-December to early February 2019: Simulation model building work, scenario analysis
Mid-February: Opinion exchange and interviews with Indian companies, institutions and organizations on India's
low-carbon policies and institutions
Mid-February: Presentation of simulation results to the target refinery and exchange of views on low-carbon policies
1.2.4 Investigation items
Energy conservation feasibility evaluation for the target refinery
*The feasibility of energy conservation is evaluated for the target refinery. In this investigation, the energy
optimization analysis software "Visual MESA" of Yokogawa is used to model the actual conditions of the target
refinery plant by incorporating the data into the software. The software keeps up with the various conditions of the
plant and changes in fluid conditions with time, and continues to show energy optimization effects. By modeling, it
is possible not only to present theoretical and empirical inferences about the effects, but also to obta in reliable and
appealing simulation results by continuing to show real values in real time based on actual plant data.
(2)Estimation of the feasibility of energy conservation by introducing this energy optimization solution into all
refineries in India
*Estimate the energy conservation feasibility of introducing an energy optimization solution at all refineries in India
other than the target refinery. This estimation becomes a necessary element for the energy policy and institutional
investigation and the commercialization plan. Since this estimation cannot be modeled based on actual data as in
the case of the target refinery, theoretical and empirical reasoning is based on the results of the investigation with
the target refinery.
(3)Study on energy policy and institution in India and proposal for subsidy system for energy conservation measures
*Research the latest market trends, business environment, and energy polici es and systems in India, and make
recommendations for an energy conservation subsidy system based on the measured the target refinery energy
conservation feasibility as well as the estimated the target refinery for all refineries.
(4)Business plan
*With regard to energy optimization solutions, a business plan will be drawn up in conjunction with the
recommendations of the aforementioned subsidy system for energy conservation measures.
1.2.5 Results
The purpose of the energy saving feasibility study conducted for the target refinery is to evaluate the benefits
obtained by using Visual MESA, an immediate energy efficiency optimization software, in a clear manner. Its main
purpose is to calculate and reduce CO2 emissions. The software can also monitor and optimize e nergy costs. For
this purpose, a utility model for an energy system (Steam, fuel, electricity, condensate, discharge) was constructed.
8Date: March 18 th, 2019 Ref.No.: PSS-GS180009-PUB/E
For Publication
The objective of the optimization is to minimize the energy operating cost. When the utility model proposes a
reduction in fuel consumption, it can also reduce direct CO2 emissions. The main means for deriving the examined
optimization are (1) feed amount of fuel consumption (Pet coke, coal, fuel oil, fuel gas, naphtha) to each operating
boiler, (2) operation amount of private steam turbine generator and purchased steam, (3) steam drop and discharge,
and (4) switching between operation of steam turbine and electric motor. As for CO2 reduction effects, fuel flow
rate, boiler and process heating furnace were considered. As deta iled in the detailed report, the optimum operating
conditions for the actual refinery operating history from January 1, 2019 to January 19 were calculated. And, the
scenario examination was carried out by applying the operating condition analyzed by the KB C consultant. CO2
emissions were calculated for each operational history and case study. In many cases, Visual MESA raised
operational improvements leading to reduced CO2 emissions, and initial analysis results based on typical plant
process configurations showed reduction opportunities ranging from 0.7TPH (0.4%) to 16.8TPH (9.9%).
According to the analysis based on the actual operation history of the refinery, the expected reduction effect was
7.71 TPH (4.5%) on average. This is equivalent to 67,540 tons per year. The energy cost reduction effect was
simulated 63,000Rs/h as average. The CO2 emission reductions which are expected to be achieved by applying
Visual MESA to other refineries and process plants in India are also estimated in the business plan section.
9Date: March 18 th, 2019 Ref.No.: PSS-GS180009-PUB/E
For Publication
2 Current status of low-carbon policies and institutions in India and recommendations for the refinery and petrochemical industries
This chapter describes the current status of the low-carbon policies and institutions in India and then makes
recommendations, particularly to the refinery and petrochemical industries.
2.1 Overview of energy in India
2.1.1 India General Information
Country India
Area 3,287,469 square kilometers
Population 1,210,570,000 (2011 Census)
Capital New Delhi
Independence became independent of the British in 1947
Politics republic
Currency Rupee (INR)
Nominal GDP $2,597,400,000,000 (2017)
Language The official federal language is Hindi, and the other state languages recognized by the
Constitution are 21.
General economic
conditions
India has promoted the import substitution industrialization policy since the
independence, and it converted to the economic liberalization route in the opportunity of
foreign currency crisis in 1991, and it carried out the economic reform polic y mainly on
deregulation, foreign capital positive utilization, etc. As a result, India not only overcame
the economic crisis but also achieved high real growth. In fiscal 2005-2007, India achieved
a growth rate of 9% for 3 consecutive years, maintained a growth rate of 6.7% in fiscal
2008 despite the global economic recession, and recovered to 8.4% in fiscal 2010 and
2011. However, the economy slowed down due to factors such as the European debt crisis
and interest rate hikes to cope with high inflation. In fiscal 2014, the new government of
Prime Minister Narendra Modi, which emphasizes economic importance, was
established. The GDP growth rate in the 2014 fiscal year became 7.2%, 7.9% in the 2015
fiscal year, 7.1% in the 2016 fiscal year, 6.7% in the 2017 fiscal year.
(Source: Prepared based on information from the Ministry of Foreign Affairs website) [1]
2.1.2 Overview of Energy in India
Proven oil reserves 5.7 billion barrels (800 million tons) [2]
10Date: March 18 th, 2019 Ref.No.: PSS-GS180009-PUB/E
For Publication
Import and export of oil Crude oil is a net importer and petroleum products are a net exporter. [2]
Crude oil refining capacity 4.8 million bpd [3]
Number of refineries 24 [4]
Confirmed natural gas
reserves
1.3 trillion m3 [2]
Import and export of
natural gas
Net importer [2]
Coal The confirmed coal reserves are 66.8 billion tons, the 5th largest in the world.
Although Japan is the third largest producer and consumer of coal in the world, it
has become a net importer of coal due to its robust consumption. [2]
According to the Federation of Electric Power Companies of Japan, "India is one of the largest energy consumers
in the world. Primary energy consumption in 2015 was the 3rd largest in the world after China and the United
States, and energy consumption is expected to increase further in the future. (The IEA predicts that energy demand
in India will more than double by 2040, becoming the single largest source of global energy demand expansion.)
[2]). Domestic energy resources include coal, bioenergy, natural gas, and hydropower, but they are insufficient to
meet domestic demand, and imports are increasing (Energy self -sufficiency rate of 65% in 2015). India's primary
energy supply mix in 2015 was 45% from coal, 29% from oil, 23% from biofuels and waste, 5% from natural gas,
1% from hydro, and 1% from nuclear. The government aims to reduce dependence on imports of primary energy
by utilizing domestic resources such as oil, natural gas and coal. In power generation, the development of renewable
energy is promoted. ” [5]
2.1.3 CO2 emission status
Although India's greenhouse gas emissions were on a declining trend ar ound 2010, the CO2 emissions from India
have been on a consistently rising trend, reaching 2,238 million tons of CO2 in 2014. [6]
2.1.4 Medium- and long-term targets for energy conservation
India promises to reduce CO2 emissions per unit of GDP by 33 to 35% compared to 2005. [7]
2.2 Current status of low-carbon policies and institutions in India
2.2.1 Energy Conservation Law
Faced with problems such as security and serious air pollution in association with increased energy demand, the
Indian government has been accelerating its efforts to conserve energy since the 2000s. Based on the energy policy
taken up by the 9th Five-Year Plan, the government established the "Energy Conservation Law 2001" (ECA =
Energy Conservation Act) in 2001. [8]
11Date: March 18 th, 2019 Ref.No.: PSS-GS180009-PUB/E
For Publication
2.2.2 Organization
Based on the Energy Conservation Act, the Bureau of Energy Efficiency (BEE) was established in the Ministry of
Power as an organization to formulate and promote energy conservation policies. A State Designated Agency (SDA)
has been established in each state government to promote energy c onservation in the state based on the policy of
BEE of the central government. [9] As for refineries and petrochemicals, the Centre for High Technology (CHT)
plays an important role in promoting energy conservation in the industry. CHT is a technical cell within the Ministry
of Oil and Gas of India established in 1987. The objective was to scrutinize future technology requirements, acquire,
develop, and adopt technologies in areas such as oil refining processes, petroleum products, and technology
modernization operations. There are still 11 major activities list ed today, the first 3 of which are (1) comparison
and analysis and productivity improvement activities through special surveys at public (PSU = Public Sector
Undertaking) refineries, (2) productivity evaluation and monitoring, and (3) energy efficiency imp rovement. [10]
BEE is developing PAT to refineries and petrochemicals in cooperation with CHT. [11]
2.2.3 Energy-intensive industries and specific consumers
The Energy Conservation Act specified 15 sectors as energy intensive (Aluminum, Fertilizer, Steel, Cement, Pulp
and Paper, Chlor-Alkali, Sugar Manufacturing, Fiber, Chemical Products, Railway Transportation, Port Authority,
Transportation, Petroleum Refining and Petrochemical, Power Stations and Transmiss ion and Distribution
Companies, Commercial Buildings and Facilities). Business establishments in these industrie s that exceeded
defined threshold values (Installation: 500 kW or more or contract demand: 600 kVA or more) were obliged to
submit annual reports, conduct energy audits, and appoint energy managers and supervisors (a person recognized
as a national qualification). Among the specified consumers in these 15 sectors, the Ministry of Power designated
9 industries (Thermal power plants, Fertilizers, Cement, steel, Chlor-Alkali, Aluminum, Railways, Textiles, and
Pulp and Paper) as specified Designated Consumers (DC) in 2007. Specific energy conservation projects in the
industrial sector promoted by BEE are targeted at specific consumers. [9]
2.2.4 BEE Policy Scheme
BEE operates the following six policy schemes. [7]
A. Star Rating of Appliances
B. National Mission for Enhanced Energy Efficiency (NMEEE)
C. Demand Side Management
D. Buildings EE
E. Awareness
F. Institutional Mechanism
A. Star Rating of Appliances: Labeling equipment based on energy efficiency. There are 8 instruments in the
12Date: March 18 th, 2019 Ref.No.: PSS-GS180009-PUB/E
For Publication
mandatory labeling category and 13 instruments in the voluntary labeling category.
B -1. NMEEE-Perform, Achieve & Trade: See the separate section for details.
B -2. NMEEE-Market Transformation for Energy Efficiency (MTEE): Bachat The Lamp Yojana (BLY) program
has promoted the adoption of compact fluorescent lamp (CFL) in the past and now supports the ado ption of LED.
now supports LED deployment. The Super-Efficient Equipment Program (SEEP), which aims to transform the
market into ultra-efficient equipment through financial stimulus measures, selected the ceiling fan as its first device.
(70 W ⇒ 30 W). At present, it is reconsidered in the light of demand aggregation model of LED.
B -3. NMEEE-Framework for Energy Efficient Economic Development (FEEED): This scheme focuses on the
development of financial institutions to promote energy efficient financing support. In this context, the "Partial Risk
Guarantee Fund for Energy Efficiency" Partial Risk Guarantee Fund for Energy Efficiency (PRGFEE) and the
"Venture capital funds for energy efficiency" (VCFEE) were launched.
B -4. NMEEE-Energy Efficiency Financing Platform (EEFP): This EEFP was launched to provide a platform for
communicating with financial institutions and project developers involved in the implementation of energy
efficiency projects. BEE has signed the MoU with financial institutions such as HSB C Bank and Tata Capital.
C -1. Demand Side Management – Municipal DSM: Demand-side management in urban areas. 175 ULBs (Urban
Administrative Organization) and a situation survey were conduc ted. Detailed Project Reports were prepared for
IGEA = Investment Grade Energy Audit. Potential reduction of 120 MW is estimated.
C -2. DSM – Capacity building of DISCOMs: Workshop held for 34 DISCOM and MoU signed.
C -3. DSM-Agricultural DSM: Many agricultural pumps are only 25 – 30% efficient. This can be increased to 40%
to 45% by making this an efficient set of pumps with star labels. 11 Distribution Companies DISCOM in 8 states
and 20,750 agricultural pumps were included in the 11 Phase Plan.
C -4. DSM – Energy Efficiency in SMEs (Small & Medium Enterprises) – activities to promote energy efficiency
by providing technical information and capacity building to SMMEs. Especially in "National programmes for energy
efficiency and technology improvement for SMEs", 5 regions and sectors were selected; Ludhiana (forging), Punjab:
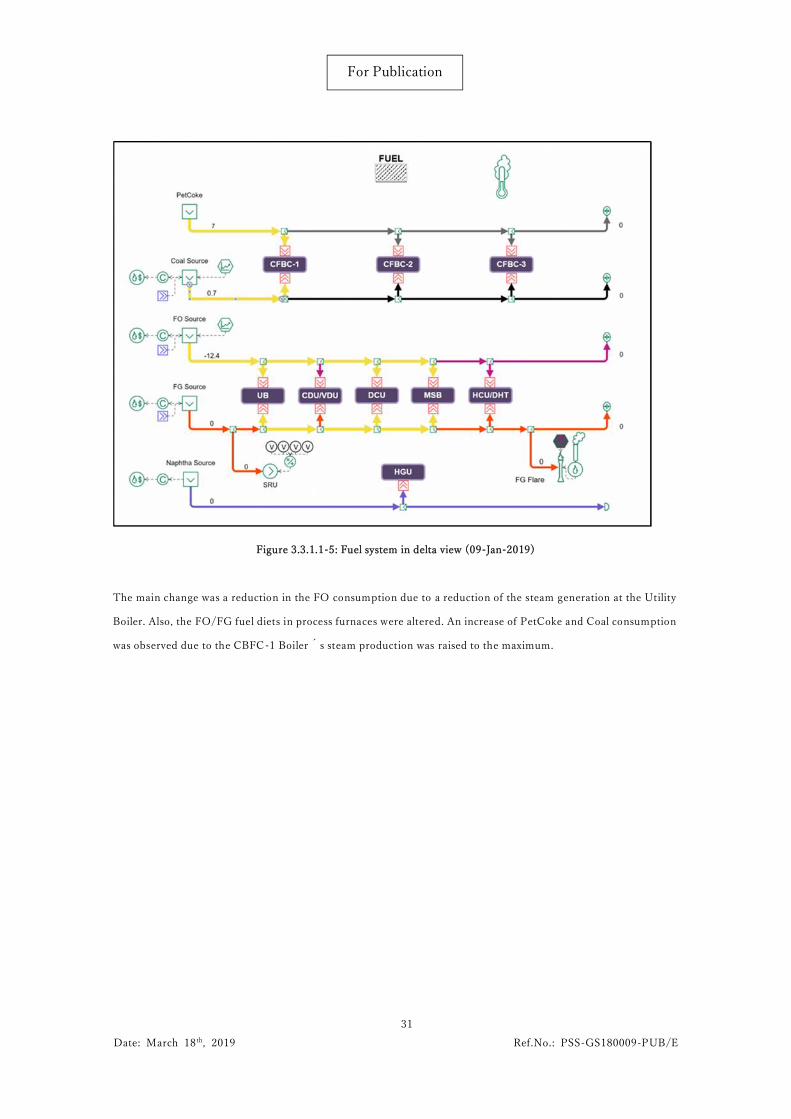
The main source of savings is the reduction by 1.22 TPH (12.4 Gcal/h) in the FO consumption that represents
savings for 47,303.28 Rs/h. In the other hand, the optimi zation suggests an increase of 0.94 TPH in PetCoke
consumption and 0.24 TPH in Coal consumption, that represent an extra cost of 12,606.8 Rs/h. The overall savings
in fuel use are about of 34,696.48 Rs/h (303.9 MMRs/y).
The changes in the fuel system can be seen in the following figure:
31Date: March 18 th, 2019 Ref.No.: PSS-GS180009-PUB/E
For Publication
Figure 3.3.1.1-5: Fuel system in delta view (09-Jan-2019)
The main change was a reduction in the FO consumption due to a reduction of the steam generation at the Utility
Boiler. Also, the FO/FG fuel diets in process furnaces were altered. An increase of PetCoke and Coal consumption
was observed due to the CBFC-1 Boiler´s steam production was raised to the maximum.
32Date: March 18 th, 2019 Ref.No.: PSS-GS180009-PUB/E
For Publication
Figure 3.3.1.1-6: CPP plant in delta view (09-Jan-2019)
Figure 3.3.1.1-7: Utility Boiler Plant in delta view (09-Jan-2019)
33Date: March 18 th, 2019 Ref.No.: PSS-GS180009-PUB/E
For Publication
Figure 3.3.1.1-8: HCU/DHT Process Plant in delta view (09-Jan-2019)
The suggested main changes in the steam network can be seen in the CPP plant, UB plant and HCU/DHT process
plant. The optimization suggested to increase the STG inlet flow and the extractions at HP and MP pressure, and
to reduce LP extraction. In the UB plant, a reduction of the steam generation at the UB Boiler and the lamination
of PRDS system were suggested. Four T/M swaps were suggested, one in the CPP Plant and three in the
HCU/DHT Process Plant.
Figure 3.3.1.1-9: Extract from the Custom Report: Switchable Drivers sheet (09-Jan-2019).
The changes mentioned above were related to an increase in the electric importation by 0.7 MW, representing
3949.68 Rs/h (34.6 MMRs/y) in additional costs.
34Date: March 18 th, 2019 Ref.No.: PSS-GS180009-PUB/E
For Publication
Figure 3.3.1.1-10: Electric system in delta view (09-Jan-2019)
As a result of the suggestions, the CO 2 is reduced by 0.7 TPH (6,132 Tons per year).
Figure 3.3.1.1-11: Emission area in delta view (09-Jan-2019)
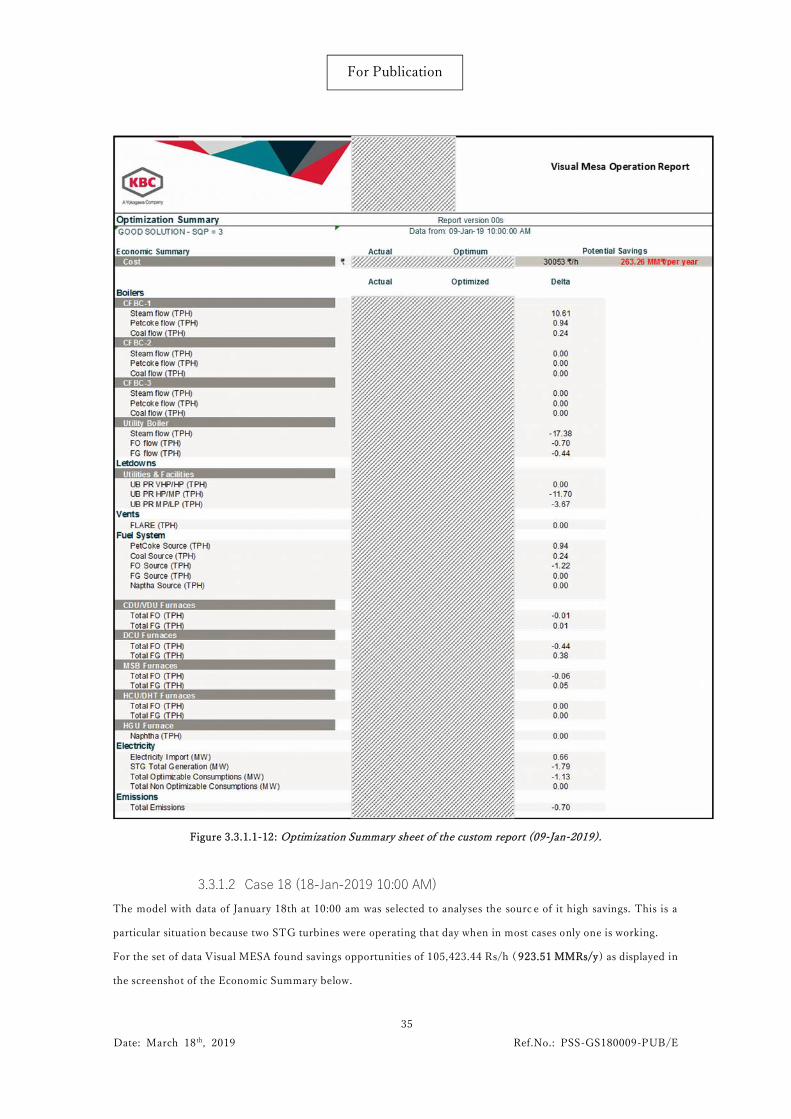
In the following screenshot, the “Optimization Summary” sheet of the custom report can be seen. In this sheet, the
main changes of Visual MESA optimization were shown and presented clearly.
35Date: March 18 th, 2019 Ref.No.: PSS-GS180009-PUB/E
For Publication
Figure 3.3.1.1-12: Optimization Summary sheet of the custom report (09-Jan-2019).
3.3.1.2 Case 18 (18-Jan-2019 10:00 AM)The model with data of January 18th at 10:00 am was selected to analyses the sourc e of it high savings. This is a
particular situation because two STG turbines were operating that day when in most cases only one is working.
For the set of data Visual MESA found savings opportunities of 105,423.44 Rs/h ( 923.51 MMRs/y) as displayed in
the screenshot of the Economic Summary below.
36Date: March 18 th, 2019 Ref.No.: PSS-GS180009-PUB/E
For Publication
Figure 3.3.1.2-1: Economic Summary for the presented solution (18-Jan-2019)
Further information of this solution can be seen in the Power and Fuel details and Other Cost Details sections of
the Economic Summary.
Figure 3.3.1.2-2: Economic Summary: Power and Fuel details (18-Jan-2019)
Figure 3.3.1.2-3: Economic Summary: Other Costs Details. (18-Jan-2019)
37Date: March 18 th, 2019 Ref.No.: PSS-GS180009-PUB/E
For Publication
The main source of savings is the reduction by 4.71 TPH (48.2 Gcal/h) in the FO consumption that represents
183241.2 Rs/h (1605.2 MMRs/y) in potential benefits.
Figure 3.3.1.2-4: Fuel system in delta view (18-Jan-2019)
The major part of this Energy Consumption decrease comes from the less steam production in the Auxiliary Boiler.
Also, the FG consumption reduced in this unit allows a less FO use in the process furnaces.
38Date: March 18 th, 2019 Ref.No.: PSS-GS180009-PUB/E
For Publication
Figure 3.3.1.2-5: Utility Boiler Plant in delta view (18-Jan-2019)
There are two operational changes that the model uses to reduce the Utility Boiler Steam Production and the flow
in the PRDSs. One of them is the increment in the HP, MP and LP extractions in the STGs almost to the maximum.
The other recommendation is the Turbine to Motor swap in the Utility Boiler Plant and the HCU/DHT area.
Figure 3.3.1.2-6: CPP plant in delta view (18-Jan-2019)
39Date: March 18 th, 2019 Ref.No.: PSS-GS180009-PUB/E
For Publication
Figure 3.3.1.2-7: Extract from the Custom Report: Switchable Drivers sheet (18-Jan-2019)
Both changes are related to the increase in the electric importation by 13.0 MW, representing 77895.5 Rs/h (682.4
MMRs/y) in additional costs.
Figure 3.3.1.2-8: Electric system in delta view (18-Jan-2019)
As a consequence of the Visual MESA recommendation, the CO2 is reduced by 15.0 TPH (131,400 Tons per year).
Figure 3.3.1.2-9: Emission area in delta view (18-Jan-2019)
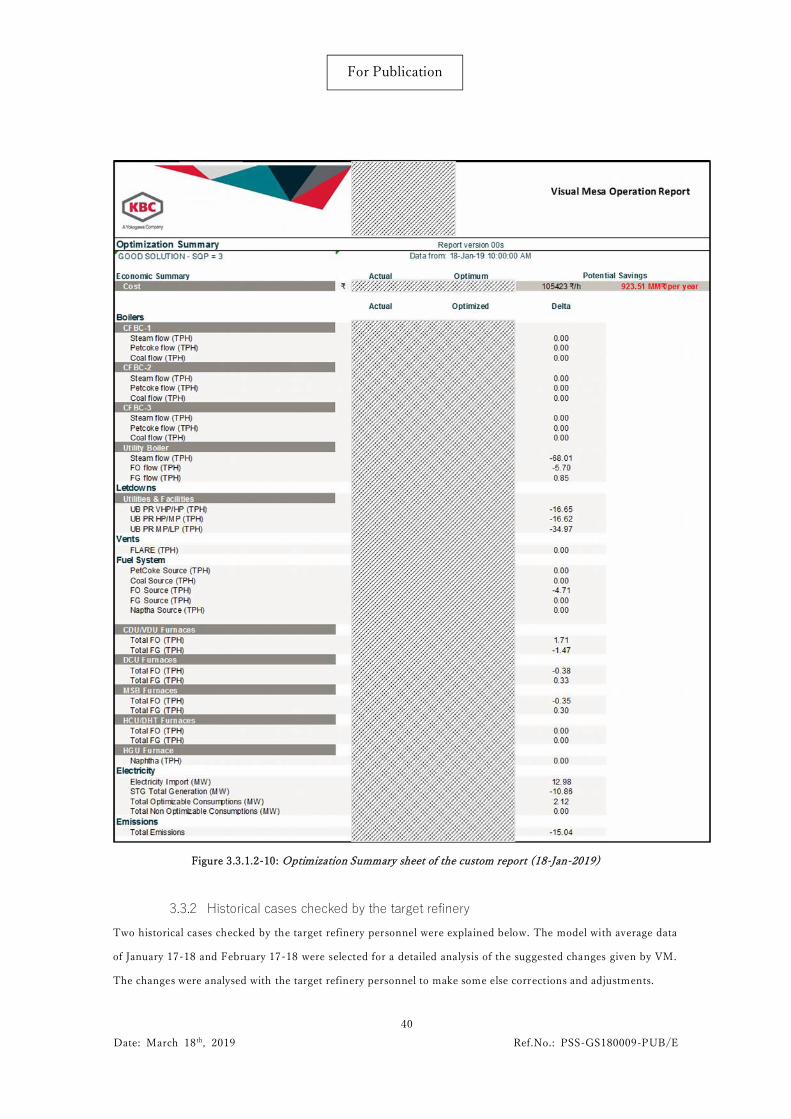
The most important changes could be found in the “Optimization Summary” sheet of the custom report.
40Date: March 18 th, 2019 Ref.No.: PSS-GS180009-PUB/E
For Publication
Figure 3.3.1.2-10: Optimization Summary sheet of the custom report (18-Jan-2019)
3.3.2 Historical cases checked by the target refineryTwo historical cases checked by the target refinery personnel were explained below. The model with average data
of January 17-18 and February 17-18 were selected for a detailed analysis of the suggested changes given by VM.
The changes were analysed with the target refinery personnel to make some else corrections and adjustments.
41Date: March 18 th, 2019 Ref.No.: PSS-GS180009-PUB/E
For Publication
Case 17-18 Jan (From 17-Jan-2019 12:00 AM to 18-Jan-2019 12:00 AM)
The potential savings were of 38,073.29 Rs/h (333.52 MMRs/y). The economic summary can be seen in the
following table:
Figure 3.3.2-1: Economic summary (17-18-Jan-2019 checked by the target refinery)
The model suggested to increase the electricity import and reduced the FO consumptions, as it can be seen in the
fuel and power costs detail. No T/M swaps were suggested.
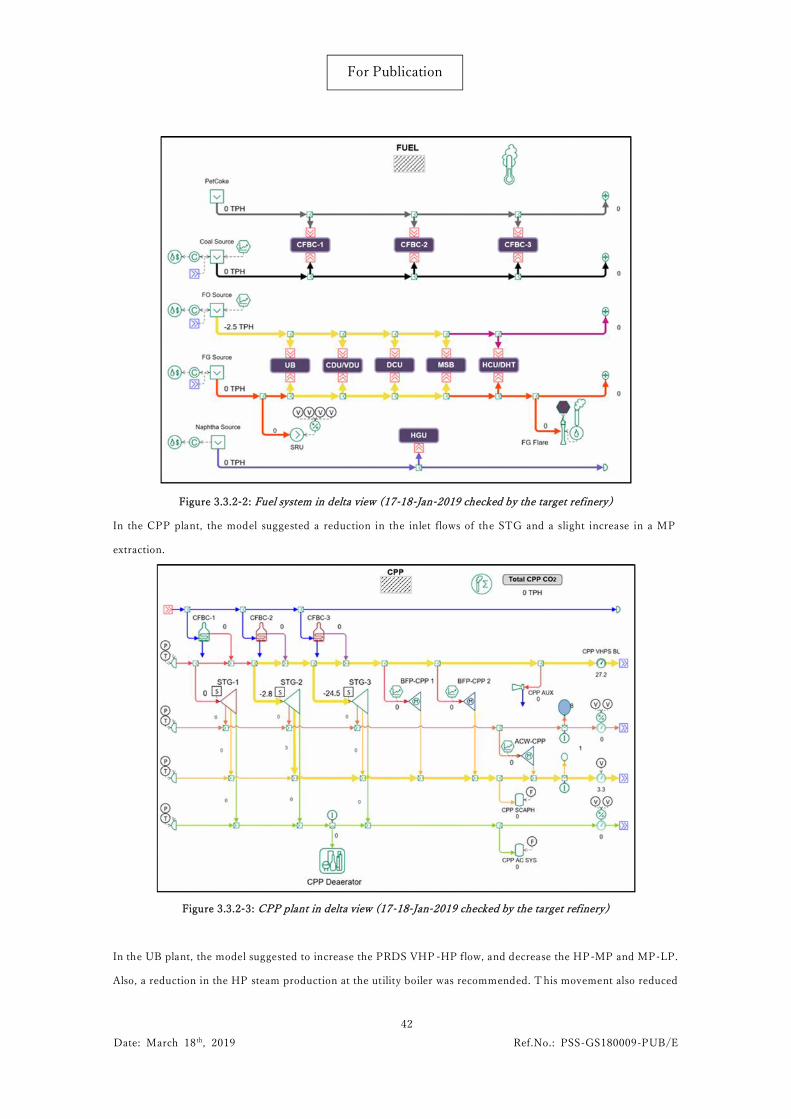
The main source of savings was the reduction by 2.5 TPH (25.4 Gcal/h) in the FO consumption that represents
96,771.2 Rs/h (847.7 MMRs/y) in potential benefits.
42Date: March 18 th, 2019 Ref.No.: PSS-GS180009-PUB/E
For Publication
Figure 3.3.2-2: Fuel system in delta view (17-18-Jan-2019 checked by the target refinery)
In the CPP plant, the model suggested a reduction in the inlet flows of the STG and a slight increase in a MP
extraction.
Figure 3.3.2-3: CPP plant in delta view (17-18-Jan-2019 checked by the target refinery)
In the UB plant, the model suggested to increase the PRDS VHP -HP flow, and decrease the HP-MP and MP-LP.
Also, a reduction in the HP steam production at the utility boiler was recommended. T his movement also reduced
43Date: March 18 th, 2019 Ref.No.: PSS-GS180009-PUB/E
For Publication
the LP steam consumption at the UB Deaereator.
Figure 3.3.2-4: UB plant in delta view (17-18-Jan-2019 checked by the target refinery)
The reduction in the STG flows conduced to a reduction of electricity generation. It was compensated by an increase
in the electricity import of **MW.
Figure 3.3.2-5: Electric system in delta view (17-18-Jan-2019 checked by the target refinery)
As a consequence of the Visual MESA recommendation, the CO 2 is reduced by 7.9 TPH (69,204 Tons per year).
44Date: March 18 th, 2019 Ref.No.: PSS-GS180009-PUB/E
For Publication
Figure 3.3.2-6: Emission area in delta view (17-18-Jan-2019 checked by the target refinery)
Figure 3.3.2-7: Optimization Summary sheet of the report (17-18-Jan-2019 checked by the target refinery)
45Date: March 18 th, 2019 Ref.No.: PSS-GS180009-PUB/E
For Publication
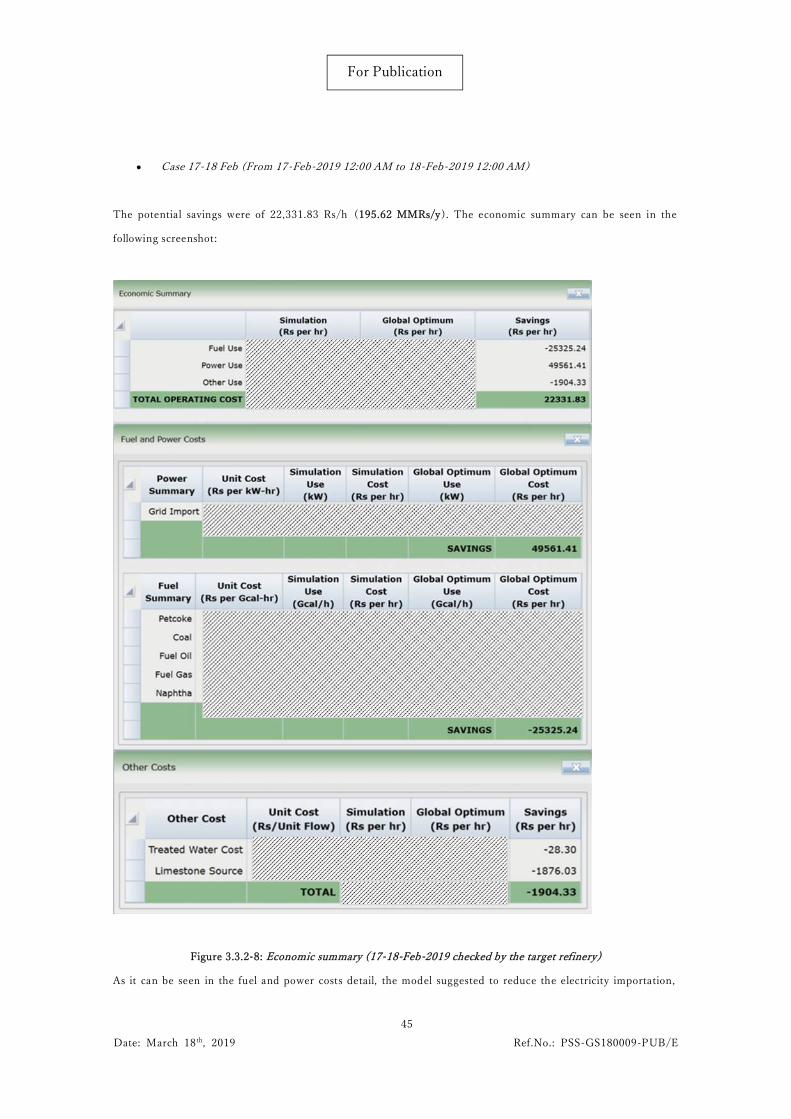
Case 17-18 Feb (From 17-Feb-2019 12:00 AM to 18-Feb-2019 12:00 AM)
The potential savings were of 22,331.83 Rs/h (195.62 MMRs/y). The economic summary can be seen in the
following screenshot:
Figure 3.3.2-8: Economic summary (17-18-Feb-2019 checked by the target refinery)
As it can be seen in the fuel and power costs detail, the model suggested to reduce the electricity importation,
46Date: March 18 th, 2019 Ref.No.: PSS-GS180009-PUB/E
For Publication
increase the PetCoke, Limestone and Coal consumption, and reduce the FO consumption. One T/M swap was
suggested in the CPP Plant. The main source of savings was the reduction by 8.3 MW in the electricity importation
that represents 49,561.4 Rs/h (434.1 MMRs/y) in potential benefits.
The Petcoke and Coal consumption was raised due to the increase in the VHP steam production at CPP Plant. The
FO consumption was reduced slightly. Some movements in the FO/FG diet in the process furnaces were made.
Figure 3.3.2-9: Fuel system in delta view (17-18-Feb-2019 checked by the target refinery).
In the CPP plant, the model suggested to increase in the inlet flows of the STG and its HP and MP extractions.
Also, one T/M swap from motor to turbine was made.
47Date: March 18 th, 2019 Ref.No.: PSS-GS180009-PUB/E
For Publication
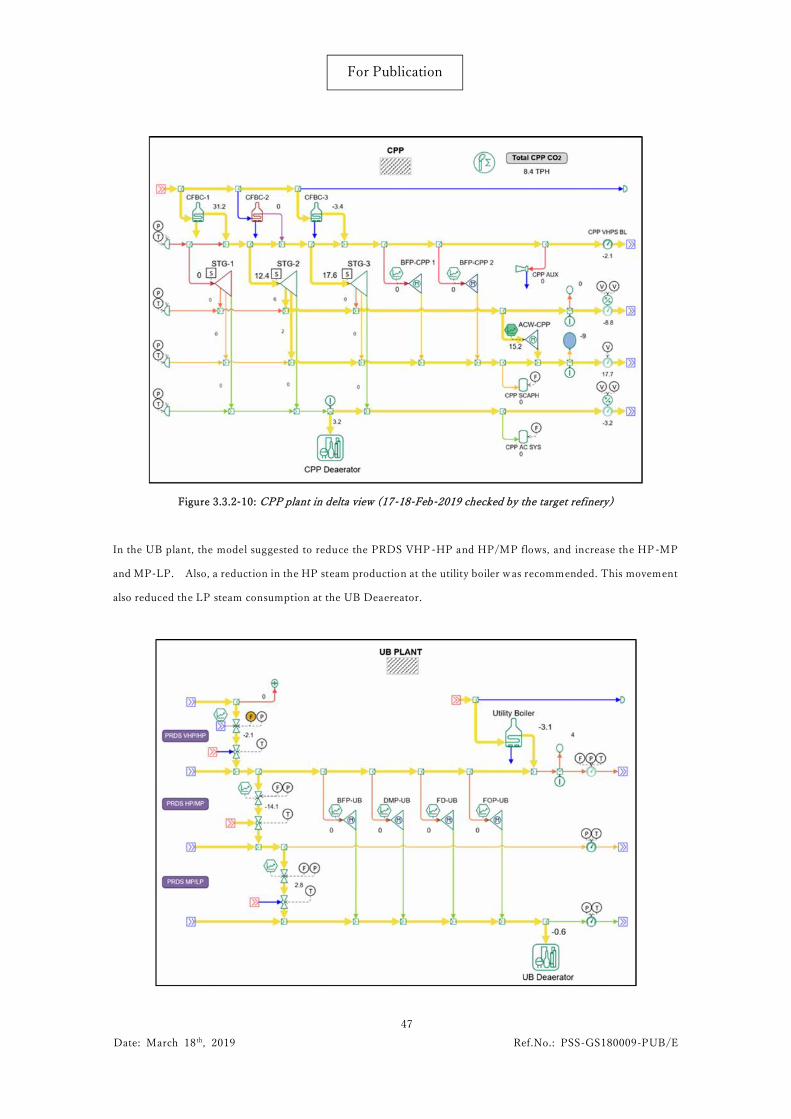
Figure 3.3.2-10: CPP plant in delta view (17-18-Feb-2019 checked by the target refinery)
In the UB plant, the model suggested to reduce the PRDS VHP-HP and HP/MP flows, and increase the HP-MP
and MP-LP. Also, a reduction in the HP steam production at the utility boiler was recommended. This movement
also reduced the LP steam consumption at the UB Deaereator.
48Date: March 18 th, 2019 Ref.No.: PSS-GS180009-PUB/E
For Publication
Figure 3.3.2-11: UB plant in delta view (17-18-Feb-2019 checked by the target refinery)
A decrease in the electricity consumption of 0.8 MW was observed in the CPP Plant due to a T/M swap. As the
raise in the STG flows conduced to a higher electricity generation, the importation was reduced in 8.3 MW.
Figure 3.3.2-12: Electric system in delta view (17-18-Feb-2019 checked by the target refinery)
As a consequence of the Visual MESA recommendation, the CO 2 emissions were increased by 7.7 TPH (67,452
Tons per year).
Figure 3.3.2-13: Emission area in delta view (17-18-Feb-2019 checked by the target refinery)
49Date: March 18 th, 2019 Ref.No.: PSS-GS180009-PUB/E
For Publication
Figure 3.3.2-14: Optimization Summary sheet of the report (17-18-Feb-2019 checked by the target refinery)
3.4 Case of study
Case of study: Variation on the CFBC-1 Steam constraint, set from 170 TPH to 185 TPH. The change was proposed
based on historical data measured from the flow sensor of this boiler, which had operated up to 182.7 TPH. The
case was selected because it had potential savings near to the average. The selected case was Nº14 that corresponds
to 14-Jan-2019 10:00h. First, the original case was presented and then, a case of study relaxing the constraint
50Date: March 18 th, 2019 Ref.No.: PSS-GS180009-PUB/E
For Publication
mentioned above.
The results were presented and explained using graphics and tables.
Original case 14-Jan-2019:
The case Nº14 showed, after optimization, potential savings of 64,510 Rs/h (565.1 MMRs/y). The delta view let to
appreciate the changes suggested by VM to reduce the operating cost.
Figure 3.4-1: Plant overview
In the CPP plant, the VHP steam production at CFBC -1 was raised up to the maximum allowed by the constraint
(170 TPH). The model made a reduction in the inlet flow of STG -3 and use the VHP steam to make a T/M swap
of BF pump.
The reduction in the inlet flow of STG -3 and movements on the extractions conduced to a diminution on the
electricity generation of 10.4 MW. The HP and MP extractions were raised to the maximum level possible.
51Date: March 18 th, 2019 Ref.No.: PSS-GS180009-PUB/E
For Publication
Figure 3.4-2: CPP
Figure 3.4-3: STG-3
In the Utility plant, the model suggested a high reduction in the PRDS VHP-HP and HP-MP, and a slight increase
in the MP-LP.
The Utility boiler HP steam production was reduced in 45.5 TPH, which represented an important reduction in the
FO consumption and emissions. As the steam production of the utility boiler went down, the amount of feed water
and the LP steam consumption at the UB deaerator decreased.
52Date: March 18 th, 2019 Ref.No.: PSS-GS180009-PUB/E
For Publication
Figure 3.4-4: UB Plant
The electricity network showed that the model suggested to increase the import in 8.7 MW, due to the reduction of
STG-3 generation and other T/M swaps.
Figure 3.4-5: Electricity
The fuel network showed a high diminution of the FO consumption, associated to the diminution of steam
generation at the utility boiler. Also, some movements in the FO/FG diet were suggeste d in different furnaces of
the process plants. The PetCoke and Coal consumption were slightly superior due to the increment in the steam
production at CFBC-1.
53Date: March 18 th, 2019 Ref.No.: PSS-GS180009-PUB/E
For Publication
Figure 3.4-6: Fuel
The emissions of the total site were reduced in 8.2 TPH, that represented a 5% of the total emissions and a
diminution of 71,832 tonnes per year.
Figure 3.4-7: CO2 emissions
The most important changes could be found in the “Optimization Summary” sheet of the custom report.
54Date: March 18 th, 2019 Ref.No.: PSS-GS180009-PUB/E
For Publication
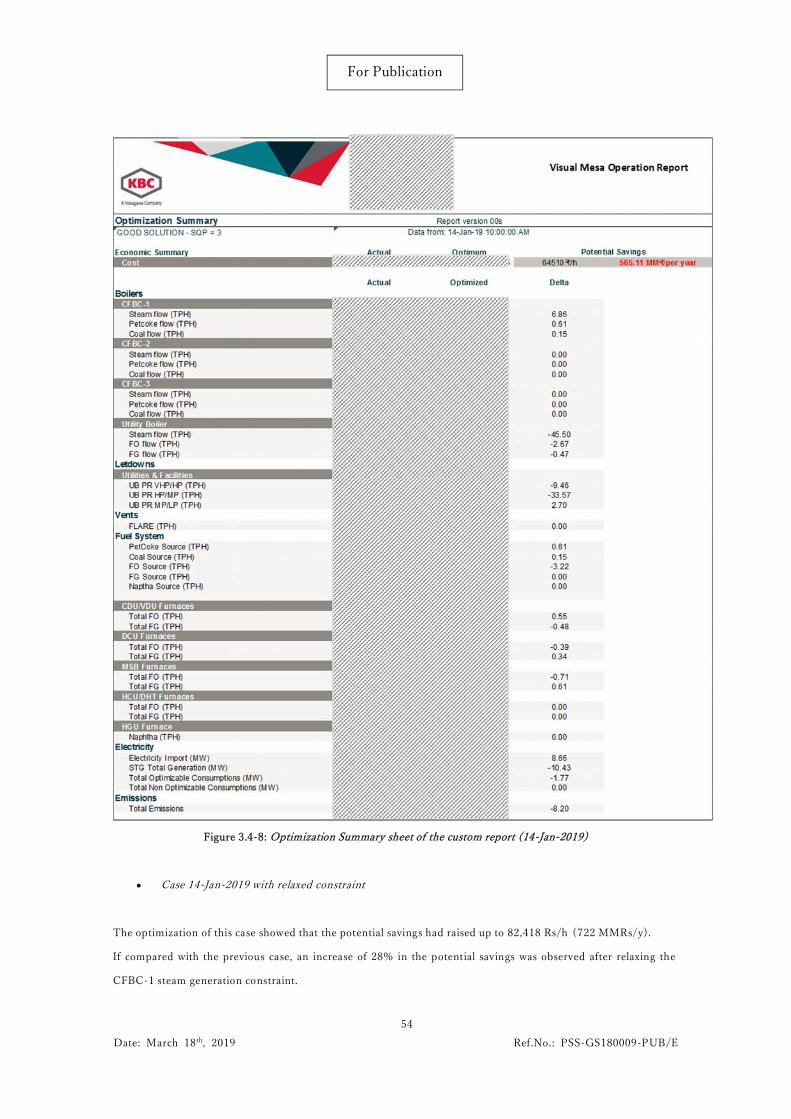
Figure 3.4-8: Optimization Summary sheet of the custom report (14-Jan-2019)
Case 14-Jan-2019 with relaxed constraint
The optimization of this case showed that the potential savings had raised up to 82,418 Rs/h (722 MMRs/y).
If compared with the previous case, an increase of 28% in the potential savings was observed after relaxing the
CFBC-1 steam generation constraint.
55Date: March 18 th, 2019 Ref.No.: PSS-GS180009-PUB/E
For Publication
The screenshot of the CPP Plant showed that the main changes are the increment in the VHP steam production at
CFBC-1 up to the maximum allowed by the constraint. The inlet flow in STG-3 was reduced in 5.5 TPH and a T/M
swap of the BF pump took place to used the extra VHP generated.
Figure 3.4-9: Plant overview
Figure 3.4-10: CPP
The STG-3 generation was reduced in 7.6 MW due to a reduction in the VHP inlet flow, and the increment in the
56Date: March 18 th, 2019 Ref.No.: PSS-GS180009-PUB/E
For Publication
HP and MP extractions.
Figure 3.4-11: STG-3
The utility plant also showed important changes. PRDS flow was reduces in all its stages and the utility boiler HP
steam production was reduced in 52.2 TPH, to operate at the minimum of **TPH. The reduction in the steam
generation of the utility boiler was reflexed also in the reduction of the amount of f eed water and LP steam
consumption at the deaerator.
57Date: March 18 th, 2019 Ref.No.: PSS-GS180009-PUB/E
For Publication
Figure 3.4-12: UB Plant
The electricity network showed that the model suggested an import of 5.6 MW, to compensate the reduction in the
STG-3 generation and the T/M swaps.
Figure 3.4-13: Electricity
The fuel network showed a high diminution of the FO consumption, related to the high decrease of steam generation
at the utility boiler. Also, some movements in the FO/FG diet were suggested in different furnaces of the process
plants. The PetCoke and Coal consumption were superior due to the increment in the steam production at CFBC -
58Date: March 18 th, 2019 Ref.No.: PSS-GS180009-PUB/E
For Publication
1.
Figure 3.4-14: Fuel
The CO2 emissions of the total site were reduced in 5.2 TPH after the optimization, mainly associated to the high
diminution of the utility boiler FO consumption. The reduction of CO 2 emissions represented a 3.16% of total
emissions, and represented a reduction of 45,552 tonnes per year.
59Date: March 18 th, 2019 Ref.No.: PSS-GS180009-PUB/E
For Publication
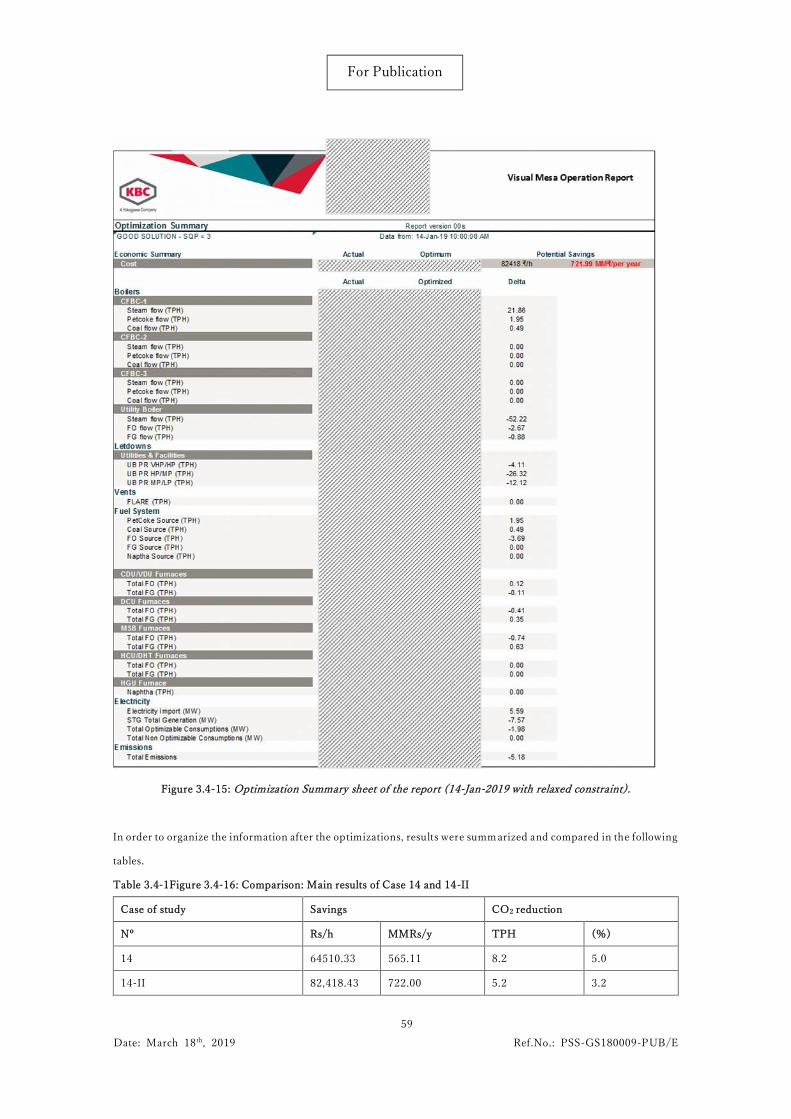
Figure 3.4-15: Optimization Summary sheet of the report (14-Jan-2019 with relaxed constraint).
In order to organize the information after the optimizations, results were summarized and compared in the following
tables.
Table 3.4-1Figure 3.4-16: Comparison: Main results of Case 14 and 14-II
Case of study Savings CO2 reduction
Nº Rs/h MMRs/y TPH (%)
14 64510.33 565.11 8.2 5.0
14-II 82,418.43 722.00 5.2 3.2
60Date: March 18 th, 2019 Ref.No.: PSS-GS180009-PUB/E
For Publication
Case of study Economic summary results (Rs/h) - Savings
Nº Fuel use Power use Other use Total
14 *** *** *** 64510.33
14-II *** *** *** 82,418.43
Case of study Electricity (MW) – Delta
Nº Import Generation Consumption
14 *** *** -1.8
14-II *** *** -2
Case of study Fuel consumption (TPH) – Delta
Nº PetCoke Coal Fuel Oil
14 0.61 0.15 -3.22
14-II 1.95 0.49 -3.69
Case of study Boilers (TPH) – Steam production
Nº VHP SIM VHP OPT VHP Delta HP SIM HP OPT HP Delta
14 *** *** 6.9 *** *** -45.5
14-II *** *** 21.9 *** *** -52.2
Case of studySTGs (TPH) – Streams
Simulation (Delta)
Nº VHP Inlet HP Ext MP Ext LP Ext Condensate
14 *** *** *** *** ***
14-II *** *** *** *** ***
Case of studyPRDSs (TPH) – Streams
Simulation (Delta)
Nº VHP - HP HP - MP MP – LP
14 *** *** ***
14-II *** *** ***
Case of study Switchable drivers (T/M) – Swaps
Nº CPP UB Refinery
61Date: March 18 th, 2019 Ref.No.: PSS-GS180009-PUB/E
For Publication
14 *** *** ***
14-II *** *** ***
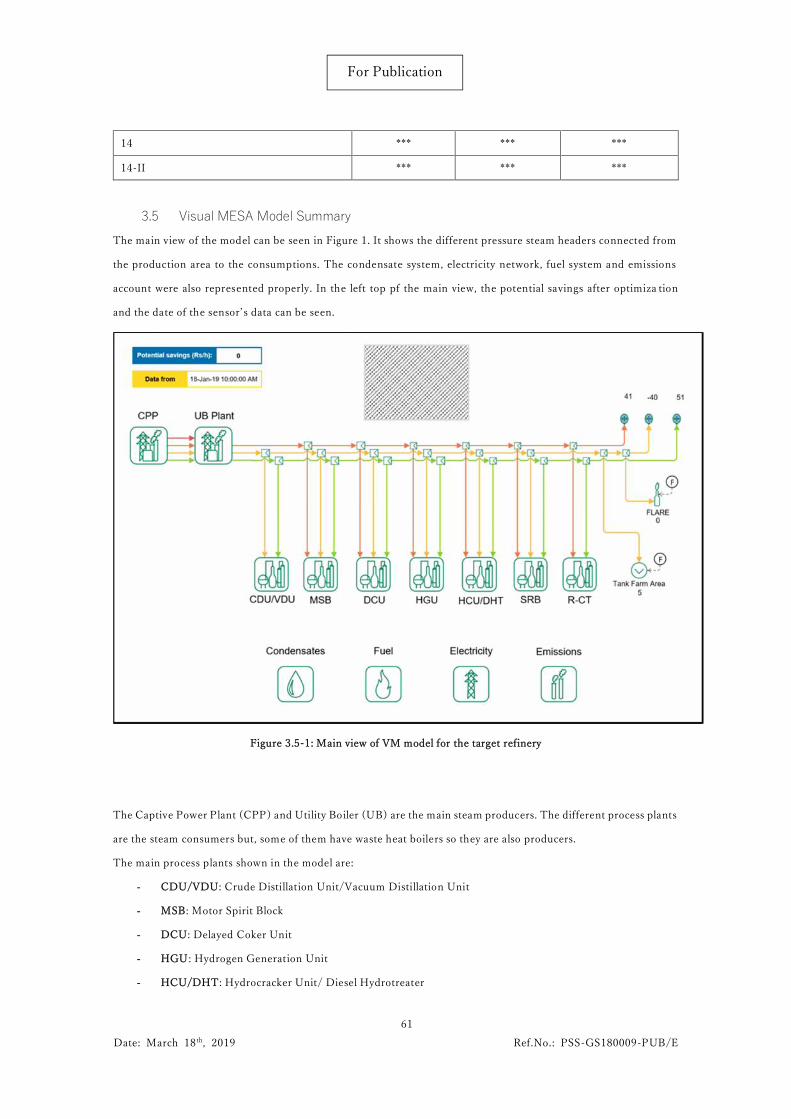
3.5 Visual MESA Model SummaryThe main view of the model can be seen in Figure 1. It shows the different pressure steam headers connected from
the production area to the consumptions. The condensate system, electricity network, fuel system and emissions
account were also represented properly. In the left top pf the main view, the potential savings after optimiza tion
and the date of the sensor’s data can be seen.
Figure 3.5-1: Main view of VM model for the target refinery
The Captive Power Plant (CPP) and Utility Boiler (UB) are the main steam producers. The different process plants
are the steam consumers but, some of them have waste heat boilers so they are also producers.
The main process plants shown in the model are:
- CDU/VDU: Crude Distillation Unit/Vacuum Distillation Unit
- MSB: Motor Spirit Block
- DCU: Delayed Coker Unit
- HGU: Hydrogen Generation Unit
- HCU/DHT: Hydrocracker Unit/ Diesel Hydrotreater
62Date: March 18 th, 2019 Ref.No.: PSS-GS180009-PUB/E
For Publication
- SRB: Sulphur Recovery Block
- R-CT: Cooling Tower and utilities related
- FLARE and Tank Farm Area
3.5.1 Steam NetworkThe steam network of the target refinery has four different steam pressure levels: Very high pressure (VHP), high
pressure (HP), medium pressure (MP) and low pressure (LP). In order to appreciate clearly the pressure level, they
have different colors as it can be seen in the figure below.
Figure 3.5.1-1: Stream coloring of different steam pressure levels.
The pressure and temperature average conditions of the headers are shown in below Table.
Table 3.5.1-1: Pressure and temperature conditions of headers
Header Manometric Pressure (kg.cm -2) Temperature (ºC)
VHP *** ***
HP *** ***
MP *** ***
LP *** ***
*Actual and temporary operation VHP pressure
3.5.2 Captive Power Plant (CPP)As it can be seen in below Figure, the CPP has three Circulating Fluidized Bed Combustion boilers ( CFBC-1,
CFBC-2 and CFBC-3) fed by Petcoke or Coal to produce VHP steam. Inside this plant, there are three Steam
Turbine Generators (STG-1, STG-2 and STG-3) that can produce electricity of up to ** MW each one. At the end
of the headers, there are battery limits (BL) to measure the total amount of incoming or outgoing steam to the plant
for the different steam levels. As it can be seen, the measurements were performed in Tons per hour (TPH). The
63Date: March 18 th, 2019 Ref.No.: PSS-GS180009-PUB/E
For Publication
CPP Deaerator was added and connected to the LP steam header.
Figure 3.5.2-1: Figure 3. Details of CPP plant
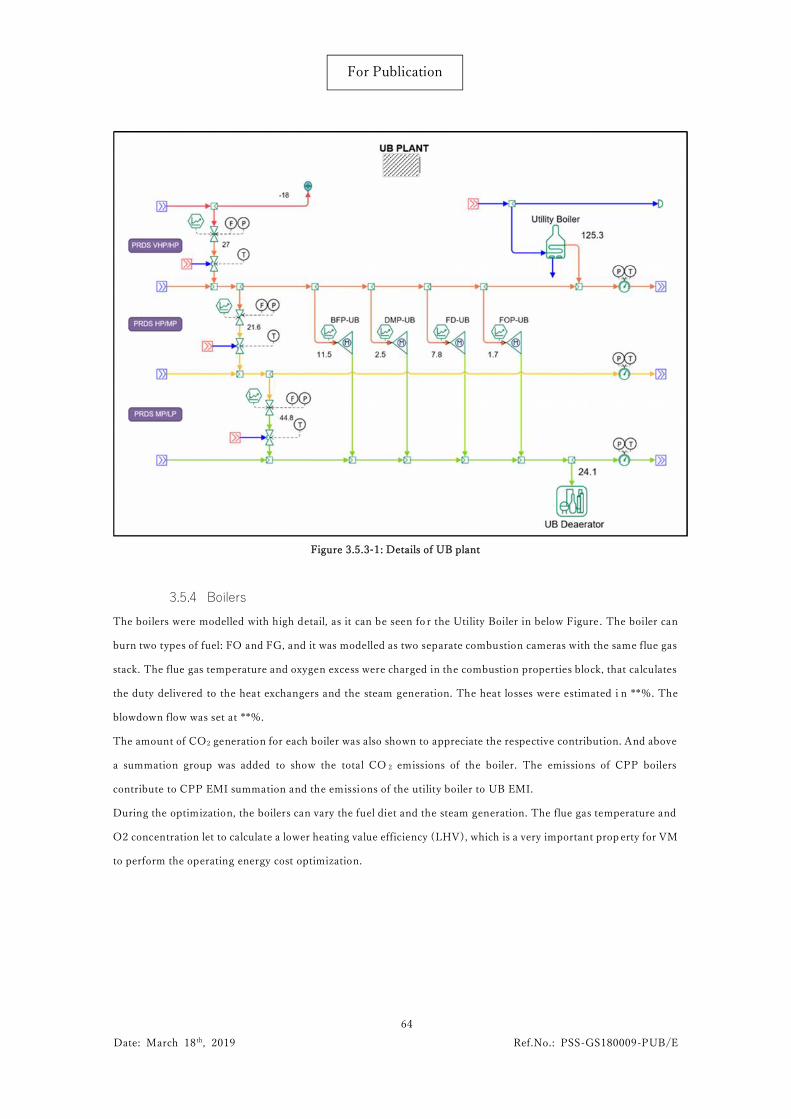
3.5.3 Utility Boiler (UB)Details of the UB are shown. This plant has one Fuel Gas/Fuel Oil Boiler (Utility Boiler) that produces HP steam
to the HP header. Inside this plant, there are also three Pressure Reducing Desuperheater Stations (PRDS VHP/HP,
PRDS HP/MP, PRDS MP/LP) that help to maintain the pressure and temp erature conditions. It also has four
switchable turbine/motor, mainly related to pumps and a forced draft fan. The UB Deaerator was added and
connected to the LP steam header.
64Date: March 18 th, 2019 Ref.No.: PSS-GS180009-PUB/E
For Publication
Figure 3.5.3-1: Details of UB plant
3.5.4 BoilersThe boilers were modelled with high detail, as it can be seen fo r the Utility Boiler in below Figure. The boiler can
burn two types of fuel: FO and FG, and it was modelled as two separate combustion cameras with the same flue gas
stack. The flue gas temperature and oxygen excess were charged in the combustion properties block, that calculates
the duty delivered to the heat exchangers and the steam generation. The heat losses were estimated i n **%. The
blowdown flow was set at **%.
The amount of CO2 generation for each boiler was also shown to appreciate the respective contribution. And above
a summation group was added to show the total CO 2 emissions of the boiler. The emissions of CPP boilers
contribute to CPP EMI summation and the emissions of the utility boiler to UB EMI.
During the optimization, the boilers can vary the fuel diet and the steam generation. The flue gas temperature and
O2 concentration let to calculate a lower heating value efficiency (LHV), which is a very important prop erty for VM
to perform the operating energy cost optimization.
65Date: March 18 th, 2019 Ref.No.: PSS-GS180009-PUB/E
For Publication
Figure 3.5.4-1: Boiler and furnace modelling
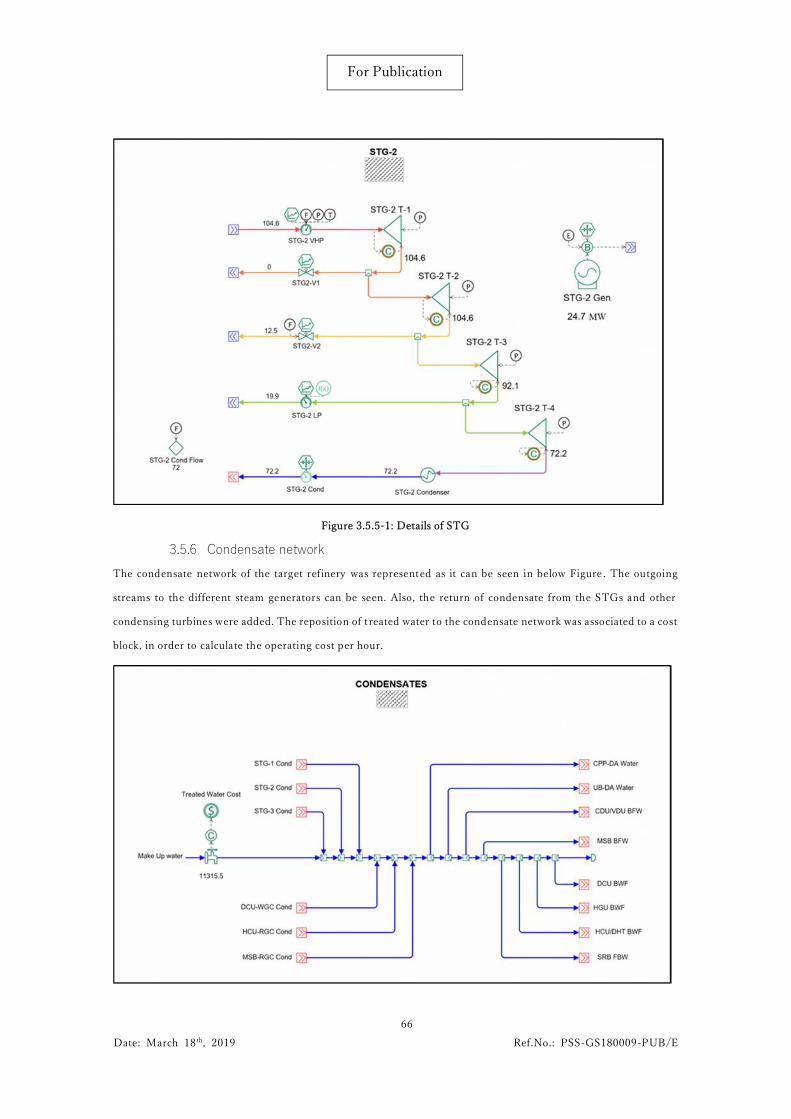
3.5.5 Steam Turbine Generators (STG)The target refinery has three STG with the following specification s: Type: ***, with a maximum output power
generation of **MW each one. Each STG was modelled as it was shown in below Figure. The STG was feed with
VHP steam, and has different extraction levels (HP, MP, LP and condensate). Each stage was modelled as a single
turbine, with its respective efficiency and output power. The sum of power of the four stages was linked to a
generator. The generator was connected to a bias function that makes an additional correction for the calculation
of the electric power at the plant.
66Date: March 18 th, 2019 Ref.No.: PSS-GS180009-PUB/E
For Publication
Figure 3.5.5-1: Details of STG
3.5.6 Condensate networkThe condensate network of the target refinery was represented as it can be seen in below Figure. The outgoing
streams to the different steam generators can be seen. Also, the return of condensate from the STGs and other
condensing turbines were added. The reposition of treated water to the condensate network was associated to a cost
block, in order to calculate the operating cost per hour.
67Date: March 18 th, 2019 Ref.No.: PSS-GS180009-PUB/E
For Publication
Figure 3.5.6-1: Condensate network
There were modelled two deaerators: CPP DA and UB DA. The deaerators were modelled as it can be seen in below
Figure. They were feed with water from the condensate network and with LP steam. The working pressure was set
at the valve. The vent flow at the deaerator was estimated as *TPH.
Figure 3.5.6-2: Detail of CPP Deaerator
3.5.7 Process plantsThe process plants are detailed as it can be seen for HCU/DHT in below Figure. The process plants have steam
consumptions at different pressure levels. The consumption s of the process plants are reboilers and heaters,
stripping columns, ejectors, turbines, among others. The plants have a battery limit meter in each header that
measures the total amount of incoming or outgoing steam to the plant. One balloon was added at the end of each
header, in order to absorb the mass imbalance.
These plants also have waste heat boilers that recover heat from furnaces and produce steam at different pressure
levels.
The process plants with furnaces have a Fuel area. Inside this area, the furnaces are modelled.
68Date: March 18 th, 2019 Ref.No.: PSS-GS180009-PUB/E
For Publication
Figure 3.5.7-1: Details of HCU/DHT plant
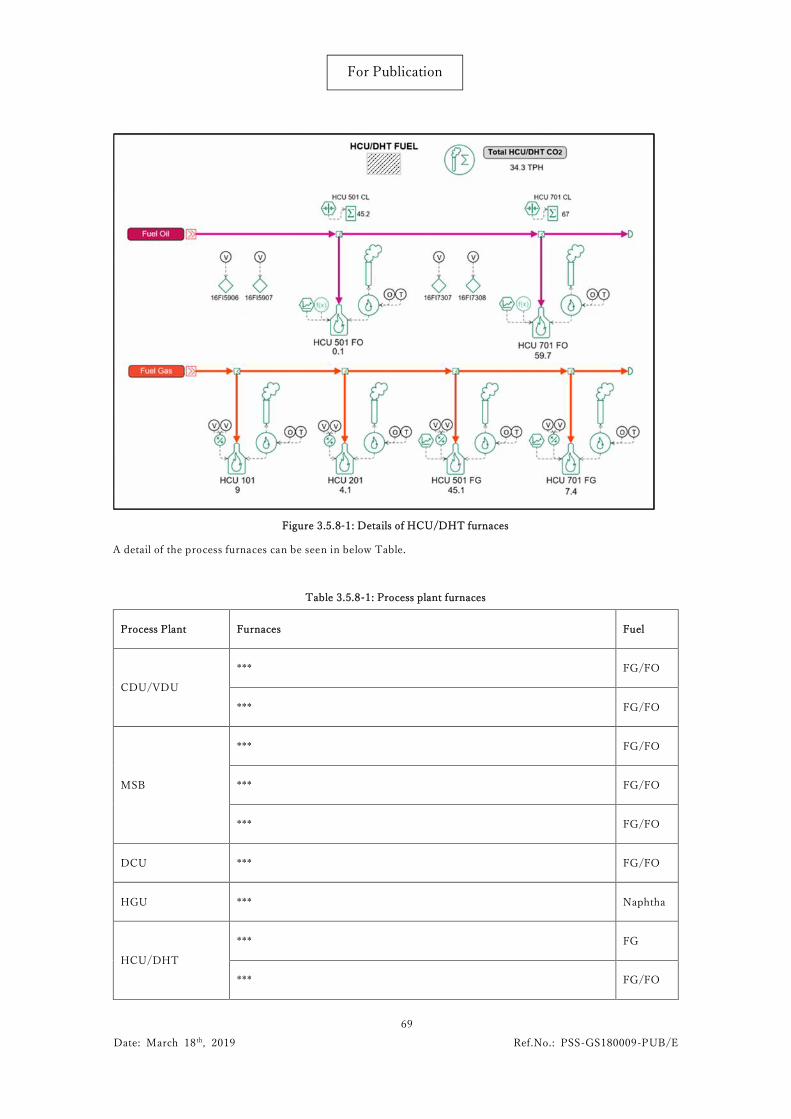
3.5.8 Process FurnacesThe process furnaces are modelled inside the fuel area in the differ ent process plants. In below Figure , the
HCU/DHT furnaces can be seen. This plant has 4 furnaces : FG furnaces HCU 101 and HCU 201, and FG/FO
furnaces HCU 501 and HCU 701.
During the optimization, the furnace can vary the fuel diet, but keeping the total duty as a constant because the
demand comes from the process. So, an equality constraint was included to guarantee delivered duty constant. For
HCU/DHT furnaces, only HCU 501 and HCU 701 are optimizable, and the fuel diet can be varied. The HCU 101
and HCU 201 furnaces burn only FG, so they cannot be optimized.
The CO2 emissions of all furnaces were calculated and shown in each process fuel area. They all contribute to the
Refinery EMI summation.
69Date: March 18 th, 2019 Ref.No.: PSS-GS180009-PUB/E
For Publication
Figure 3.5.8-1: Details of HCU/DHT furnaces
A detail of the process furnaces can be seen in below Table.
Table 3.5.8-1: Process plant furnaces
Process Plant Furnaces Fuel
CDU/VDU*** FG/FO
*** FG/FO
MSB
*** FG/FO
*** FG/FO
*** FG/FO
DCU *** FG/FO
HGU *** Naphtha
HCU/DHT*** FG
*** FG/FO
70Date: March 18 th, 2019 Ref.No.: PSS-GS180009-PUB/E
For Publication
3.5.9 Switchable driversThe target refinery has 11 switchable turbine-motor spares, as it can be seen in below Table.
Table 3.5.9-1: Detail of switchable drivers
The modelling of the switchable drivers was performed as shown in below Figure. The Figure (a) shows the block
characteristic shape of a switchable T/M. As it can be seen in Figure (b), the block has two options for providing
the required power: steam turbine or electric motor. Both of t hem supply the same power and were configured
properly.
In this case, the turbine shown in Figure (b) is the HCU- Frac. Rfx P. In Simulation, the turbine is on (green colour)
and the motor is off (blue colour). To produce the required *** kW of required power, a 13.3 TPH of HP steam
pass throw the turbine and discharge on MP header. The efficiency of the turbine was calculated from historical
data and considered constant, while the motor efficiency was assumed to be of 100%.
S. No. Turbines Block name in VM model Power (kW)
1. *** *** ***
2. *** *** ***
3. *** *** ***
4. *** *** ***
5. *** *** ***
6. *** *** ***
7. *** *** ***
8. *** *** ***
9. *** *** ***
10. *** *** ***
11. *** *** ***
71Date: March 18 th, 2019 Ref.No.: PSS-GS180009-PUB/E
For Publication
(a) (b)
Figure 3.5.9-1: Details of switchable drivers modelling
3.5.10 Fuel System
The fuel system was modelled as it can be seen in below Figure. The different fuel sources were charged with its
respective properties and prices, and connected with the consumptions using Connection out tools. The fuels of the
target refinery are: Petroleum coke (PetCoke), Coal, Fuel Oil (FO), Fuel Gas (FG) and Naphtha. The three CFBC
boilers were feed with Petcoke or Coal; the UB boiler was feed with FO or FG, the furnace of HGU plant was feed
with naphtha and the furnaces of the rest of the process plants were feed with FO or FG.
Inside the fuel system, an air properties block was added. Inside this block, the air average conditions of the refin ery
location were charged: Dry bulb temperature = **C, Relative Humidity = **%.
As the FG was generated internally in different points of the refinery, when the production was higher than the
consumption, it was sent to be burned at the FG Flare. So, a flare was connected to the FG line.
The different sources of fuel were associated to a cost block, to calculate the operating cost per hour.
72Date: March 18 th, 2019 Ref.No.: PSS-GS180009-PUB/E
For Publication
Figure 3.5.10-1: Detail of the Fuel system
3.5.11 Electric SystemThe electric system was modelled as it can be seen in below Figure. The sources of electricity are:
- A supplier company that can provide up to ***MW (Actual average operation import of ***MW)
- 3 STG with a ***MW capacity each one (Actual operation condition: * STG in operation, and * STG out
of service)
- A solar plant with an average generation of ***MW
The electric consumptions were divided in: Captive Power Plant Consumption (CPP Cons), Utility Boiler
Consumption (UB Cons), Refinery Consumption (Refinery Cons ) and other non-optimizable consumptions
estimated in **MW.
The target refinery does not have the possibility of sell electricity to the grid, so no one block related to purchases
was added.
73Date: March 18 th, 2019 Ref.No.: PSS-GS180009-PUB/E
For Publication
Figure 3.5.11-1: Detail of the Electric system
3.5.12 EmissionsThe aim of the project is to quantify and evaluate the direct emissions of the refinery, specially the CO 2 emissions.
For this reason, an emissions summary was created in the model, as it can be seen in below Figure.
74Date: March 18 th, 2019 Ref.No.: PSS-GS180009-PUB/E
For Publication
Figure 3.5.12-1: Emissions summary
Also, the amount of CO2 emissions of each plant was added together the Boiler/Furnace details, as it can be seen in
Figure below. For the CFBC-1 boiler of the CPP Plant.
Figure 3.5.12-2: CO2 Emissions detail of CFBC-1 Boiler
3.5.13 SensorsSensor blocks were added to the model. In Figure below, sensor historical data can be seen for the STG * and *
electricity generation. As it can be seen, the target refinery provided historical data from January 01 st to 20th. In the
period reported, the STG * was on service only from 1st to 3rd and from 16th to 20th. The production was around of
**MW. In the other hand, STG* was out of service from 1st to 3rd, then remained on service. The production was
around of **MW except when the two STG were both on service.
Figure 3.5.13-1: Historical data from STG * and STG * generation
75Date: March 18 th, 2019 Ref.No.: PSS-GS180009-PUB/E
For Publication
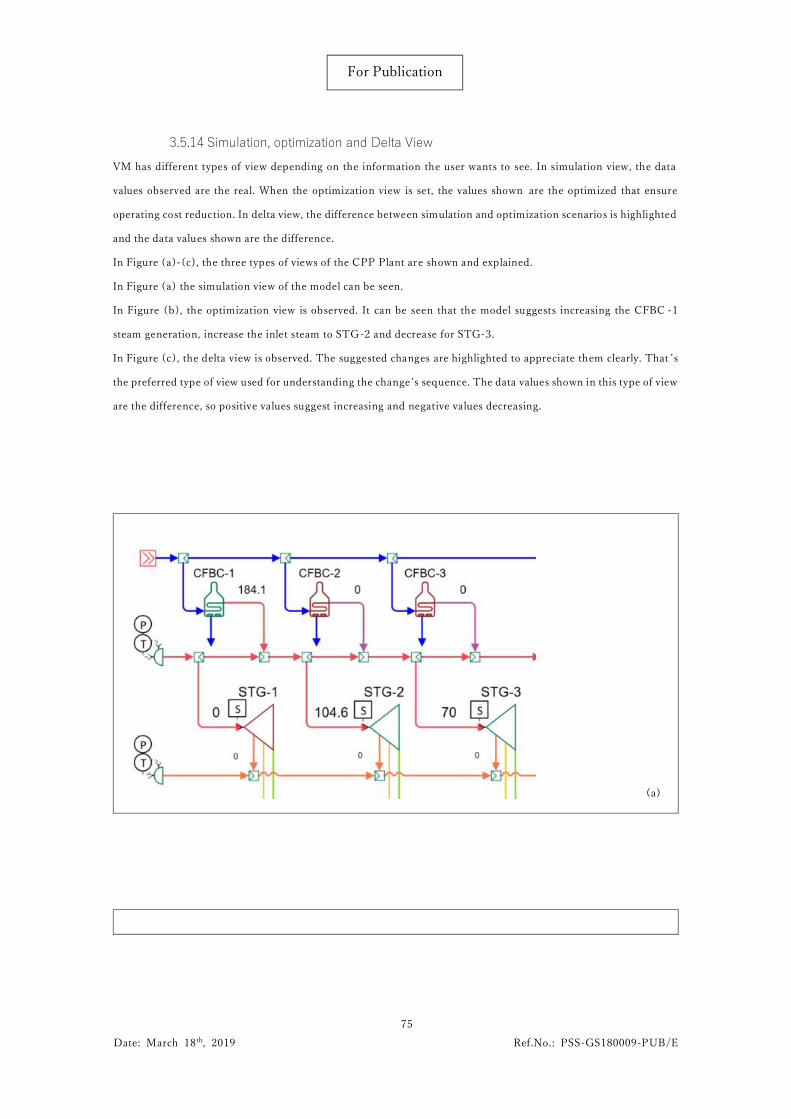
3.5.14 Simulation, optimization and Delta ViewVM has different types of view depending on the information the user wants to see. In simulation view, the data
values observed are the real. When the optimization view is set, the values shown are the optimized that ensure
operating cost reduction. In delta view, the difference between simulation and optimization scenarios is highlighted
and the data values shown are the difference.
In Figure (a)-(c), the three types of views of the CPP Plant are shown and explained.
In Figure (a) the simulation view of the model can be seen.
In Figure (b), the optimization view is observed. It can be seen that the model suggests increasing the CFBC -1
steam generation, increase the inlet steam to STG-2 and decrease for STG-3.
In Figure (c), the delta view is observed. The suggested changes are highlighted to appreciate them clearly. That ’s
the preferred type of view used for understanding the change’s sequence. The data values shown in this type of view
are the difference, so positive values suggest increasing and negative values decreasing.
(a)
76Date: March 18 th, 2019 Ref.No.: PSS-GS180009-PUB/E
For Publication
Figure 3.5.14-1: Different views of the CPP Plant
3.5.15 Economic summary and Custom ReportVM has the possibility to generate different types of reports. The most useful reports are the economic summary
and the custom report. Also, VM could generate report for group of equipment or block.
In Figure 18, the view of the economic summary is presented. In Figure 18.a, the simulation and global optimization
costs are compared, and the potential savings are presented. For example, in this hypothetical case, the optimization
suggests to increase the fuel use and decrease the power use. The costs included in other use also grow slightly. The
potential saving is around of 22,824 Rs, which represent ***% of the total operation cost.
The Figure 18.b and 18.c show a detail of the items included in fuel use, power use and others. In them, it can be
seen if there are any movements in the electricity grid import, fuel sources, water consumption, among others.
(b)
(c)
77Date: March 18 th, 2019 Ref.No.: PSS-GS180009-PUB/E
For Publication
Figure 3.5.15-1: Economic summary report
The custom report is the most detailed report created from VM results. It is usually created as desired by customers,
including main performance data values and information of specia l interest of them. In below Figure, the main view
of the custom report can be seen. The main performance data values se lected to appear in the main view of the
custom report. The results of the economic summary also appear in the custom report, as it can be seen in the top
of the figure. The information included were the steam generation of boilers, vents and letdowns, fue l consumptions
of boilers and furnaces, electric power generation and import, emissions, among others.
78Date: March 18 th, 2019 Ref.No.: PSS-GS180009-PUB/E
For Publication
Figure 3.5.15-2: Main view of the custom report
In another section of the custom report, a major detai l can be found, as it can be seen in below Figure. The other
sections of the custom report are: Furnaces, Electricity, STG, Switchable drivers, Emissions and Costs.
The STG section shows details of inlet flow, extraction flows (HP, MP, LP and condensate) and electricity
generation.
The Switchable drivers sections summarizes the turbine/motor swaps suggested by VM.
79Date: March 18 th, 2019 Ref.No.: PSS-GS180009-PUB/E
For Publication
Figure 3.5.15-3: Sections of the custom report
The Costs section details the electricity, fuels and utilities costs. It also shows the reference prices used for the
calculation. The information provided in this section in similar than the provided by economic summary report.
80Date: March 18 th, 2019 Ref.No.: PSS-GS180009-PUB/E
For Publication
4 Business plan
In this chapter, we describe the business plan of our low-carbon solutions including Visual MESA with the profile
of solutions, surrounding environment and specific business plan.
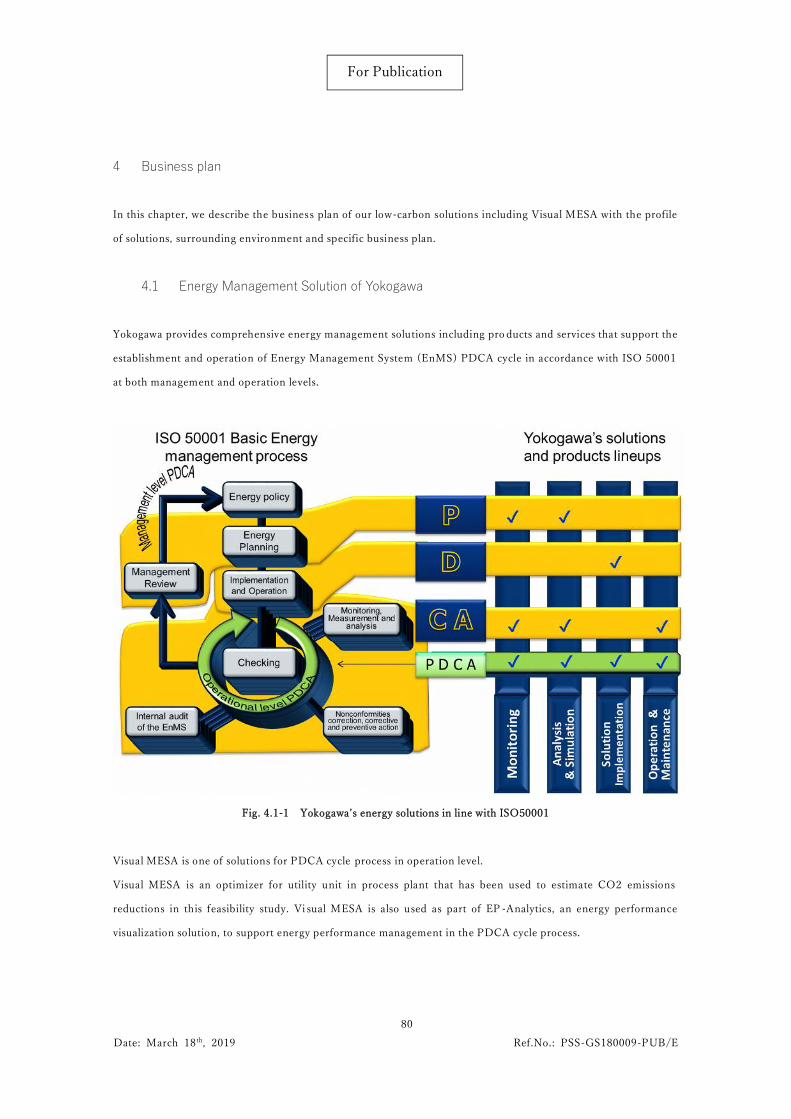
4.1 Energy Management Solution of Yokogawa
Yokogawa provides comprehensive energy management solutions including pro ducts and services that support the
establishment and operation of Energy Management System (EnMS) PDCA cycle in accordance with ISO 50001
at both management and operation levels.
Fig. 4.1-1 Yokogawa’s energy solutions in line with ISO50001
Visual MESA is one of solutions for PDCA cycle process in operation level.
Visual MESA is an optimizer for utility unit in process plant that has been used to estimate CO2 emissions
reductions in this feasibility study. Vi sual MESA is also used as part of EP -Analytics, an energy performance
visualization solution, to support energy performance management in the PDCA cycle process.
81Date: March 18 th, 2019 Ref.No.: PSS-GS180009-PUB/E
For Publication
Fig. 4.1-2 Holistic solution for PDCA cycle in operation level
flowmeter, Process gas chromatograph, Tunable Diode Laser
Spectroscopy (TDLS) Analyzer, etc.
An overview of Visual MESA and EP-Analytics is given hereunder.
4.1.1 Visual MESA [21]
Visual MESA is the solution which covers the area shown in the below figure. It optimizes energy consumption in
utility plant by either open or closed loop with gathering the plant data through OPC server and calculating optimum
operational condition under constraints of emission regulation, power purchase contract and etc.
82Date: March 18 th, 2019 Ref.No.: PSS-GS180009-PUB/E
For Publication
Fig. 4.1.1-1 Visual MESA outline
Visual MESA has library of equipment model for boiler, generator etc. based on delivery record for over 20 years.
Utility plant modeling can be built per client based on the library. Energy flow can be configured by connecting
registered modules of boiler, generator etc. as shown in the figure below. The specification such as function, capacity
and limitation of the equipment can be set by clicking each module.
Fig. 4.1.1-2 Visual MESA window
83Date: March 18 th, 2019 Ref.No.: PSS-GS180009-PUB/E
For Publication
The modeling of heat exchanger, steam turbine for power and so on in process plant can be built concurrently so
that it is possible to optimize energy in both utility and process plant. The features of the solution are;
Optimization
Monitoring
Audit
Case study.
Optimization
Optimum conditions for steam, feed, power and H2 operation are calculated based on the constraints. For example,
maximum utilization of in-house power generation may not be the optimum operation if the power purchase
contract has penalty applied when the power consumption is under contracted amount. Visual MESA can take into
account such constraints. In case of the power purchase contract with fluctu ated price which is updated in every 15
minutes, the optimum operational condition is calculated for every cycle by gathering online data directly.
Monitoring
Energy status of the whole plant can be monitored. For example, required items for monitoring such as CO2
emission, efficiency, SO2 emission, header steam balance of each pressure level o r of feed / power price status of
boiler or heat recovery steam generator (HRSG) can be indicated as KPI.
Audit
Steam leak has big impact for the cost. Visual MESA has the function called “balloon” which adjust imbalance of
steam equilibrium and sudden change of the “balloon” would be caused by some issues. It is one of the “audit”
function to notice “balloon” sudden change to operator. For example, there is the case that field operator found
steam leak from valve after abnormality acknowledgment through “audit” function.
Case study
Visual MESA can be used not only for online real -time optimizer but also for case study at offline by defined
assumptions, such as cost simulation for plant operation change, plant expansion plan, beneficial contract conditio n
for power supply and etc.
Below figure shows the case of CO2 emission calculation from boiler. CO2 emission is calculated based on
combustion stoichiometry by just connecting funnel-shaped modules.
84Date: March 18 th, 2019 Ref.No.: PSS-GS180009-PUB/E
For Publication
Fig. 4.1.1-3 CO2 emission calculation
4.1.2 EP-AnalyticsEP-Analytics is a solution that visualizes plant energy performance and assists smooth Plan, Do, Check and Action
(PDCA) activities of EnMS in accordance with ISO 50001. EP-Analytics consists of Visual MESA and Production
Supervisor VP.
Fig. 4.1.2-1 EP-Analytics
85Date: March 18 th, 2019 Ref.No.: PSS-GS180009-PUB/E
For Publication
The main features of this solution are as follows.
Visualization of energy performance
Accurate energy performance management
Energy performance improvement in real-time
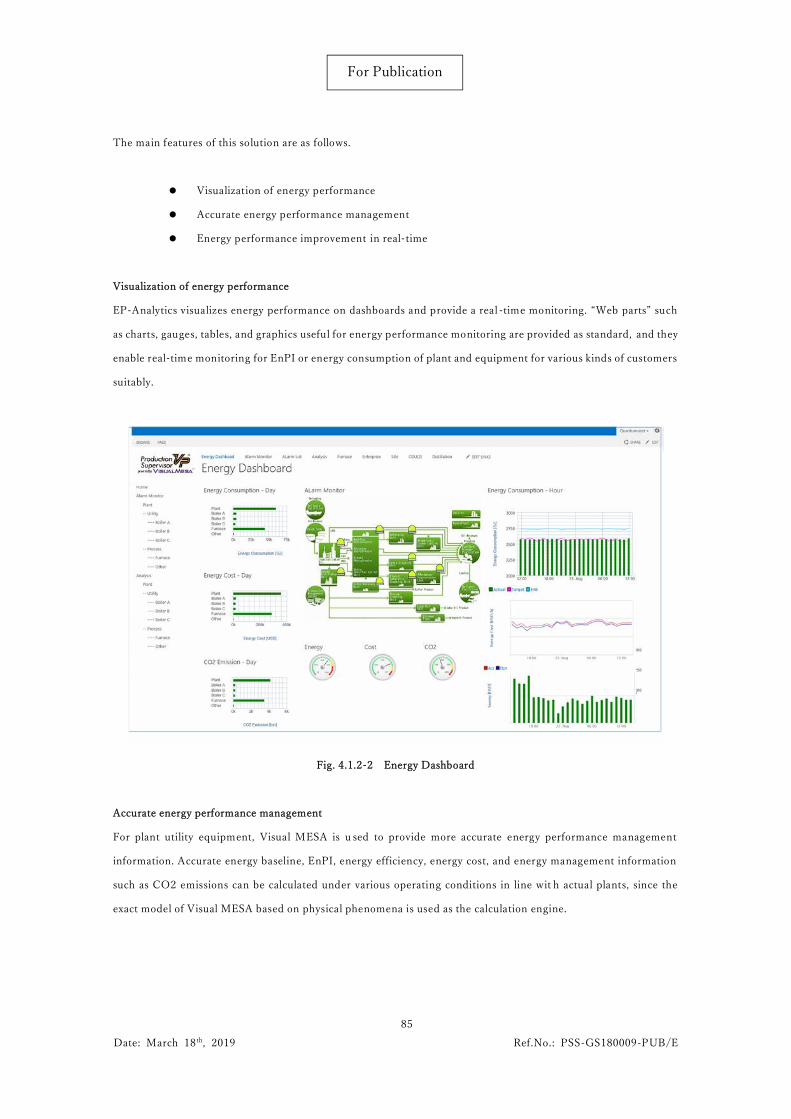
Visualization of energy performance
EP-Analytics visualizes energy performance on dashboards and provide a real -time monitoring. “Web parts” such
as charts, gauges, tables, and graphics useful for energy performance monitoring are provided as standard, and they
enable real-time monitoring for EnPI or energy consumption of plant and equipment for various kinds of customers
suitably.
Fig. 4.1.2-2 Energy Dashboard
Accurate energy performance management
For plant utility equipment, Visual MESA is u sed to provide more accurate energy performance management
information. Accurate energy baseline, EnPI, energy efficiency, energy cost, and energy management information
such as CO2 emissions can be calculated under various operating conditions in line wit h actual plants, since the
exact model of Visual MESA based on physical phenomena is used as the calculation engine.
86Date: March 18 th, 2019 Ref.No.: PSS-GS180009-PUB/E
For Publication
Fig. 4.1.2-3 Visual MESA Utility Model
Energy performance improvement in real-time
When the value of EnPI exceeds the limit value, an alarm notification mail can be automatically transmitted, and
the difference between the target value and High, HH (HighHigh), Low, LL (LowLow) is notified. Since the alarm
is recorded in the internal database, the alarm history is available on demand.
Fig. 4.1.2-4 Alarm monitoring/notification
Drill down from plant level to device level is just a click away and in case of an abnormality it can be easily mitigated
by clicking on the alarm occurrence point.
87Date: March 18 th, 2019 Ref.No.: PSS-GS180009-PUB/E
For Publication
Fig. 4.1.2-5 Drill Down for Graphics
Fig. 4.1.2-6 Drill Down for Graphs/Trends
The BSI Group, one of the ISO 50001 certification bodies worldwide, has confirmed that EP-Analytics is effective
for the establishment and operation of EnMS in accordance with ISO 50001.
88Date: March 18 th, 2019 Ref.No.: PSS-GS180009-PUB/E
For Publication
Fig. 4.1.2-7 (Not used)
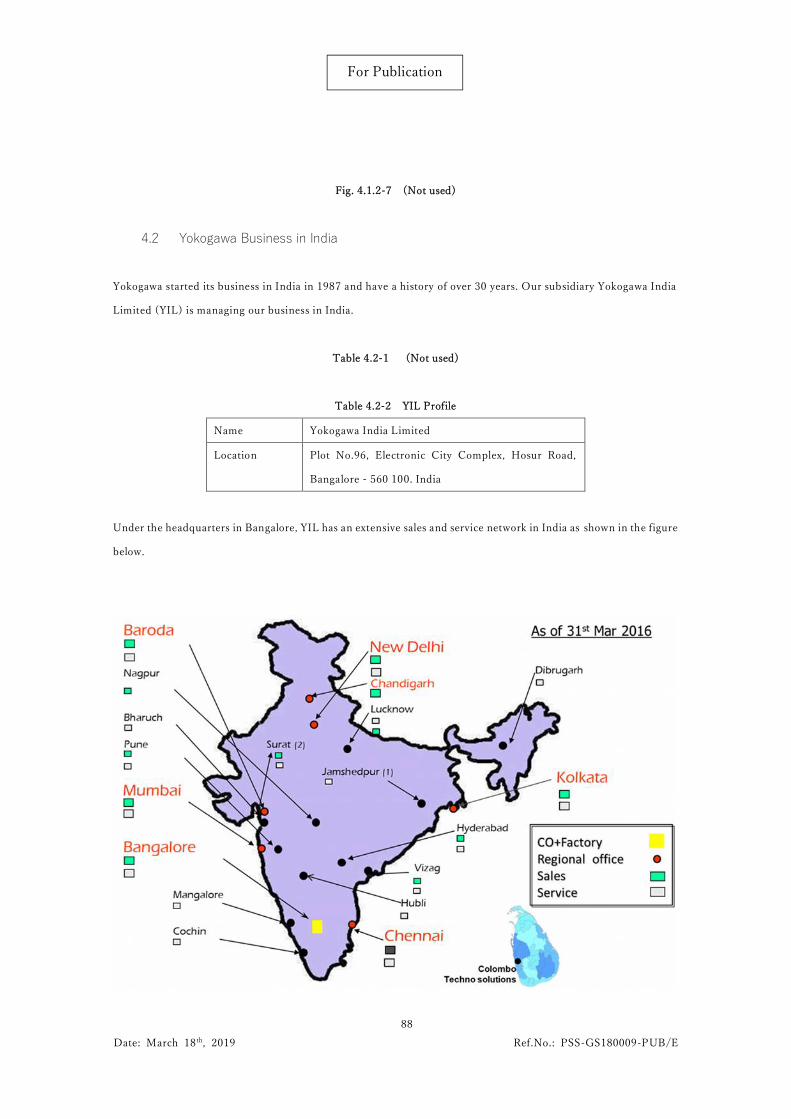
4.2 Yokogawa Business in India
Yokogawa started its business in India in 1987 and have a history of over 30 years. Our subsidiary Yokogawa India
Limited (YIL) is managing our business in India.
Table 4.2-1 (Not used)
Table 4.2-2 YIL Profile
Name Yokogawa India Limited
Location Plot No.96, Electronic City Complex, Hosur Road,
Bangalore - 560 100. India
Under the headquarters in Bangalore, YIL has an extensive sales and service network in India as shown in the figure
below.
89Date: March 18 th, 2019 Ref.No.: PSS-GS180009-PUB/E
For Publication
Fig. 4.2-1 Sales and Service Network in India
4.3 Business PlanIn order to promote EP-Analytics including Visual MESA in the Indian market, the following activities are planned.
Sales promotion in line with recommended policies/institutions
Awareness improvement
4.3.1 Sales promotion in line with recommended policies/institutions
As detailed in Chapter 2, we propose the following policies and institutions to make India a better low -carbon
country.
① Acceleration of CO2 reduction activities
② Enhancement of energy monitoring function for CO2 reduction and energy efficiency
improvement
③ Human performance improvement
These policy and institutional enhancements will be a critical driver for the bu siness growth of Visual MESA/EP-
Analytics in India. We sincerely hope that through ongoing policy dialogues between the Ministry of Economy,
Trade and Industry and the Government of India, the Government of Japan will move toward the realization of such
a vision. We would also like to actively participate in and contribute to opportunities such as joint workshops
between governments, public and private sectors.
We will also actively utilize our own routes.
The Bureau of Energy Efficiency (B.E.E) and the Ce ntre for High Technology (CHT) mentioned in Chapter 2
recognize YIL and KBC due to their long business history. Based on the relationship, we will continue regular
communication and dialogue, and promote Visual MESA and EP -Analytics business. Private-sector companies,
particularly refineries, are using our distributed control systems (DCS) (Ap art from the sites surveyed, some
refineries have already adopted and used Visual MESA.) at many of Indian 24 refineries. We are trusted by these
clients based on the relationship that enables us to introduce and develop Visual MESA/EP-Analytics business. We
will maximize utilization of these own routes.
4.3.2 (Not used)4.3.3 Direction of awareness activities
In order to improve awareness of Visual MESA and EP-Analytics in India, we plan to carry out following activities.
90Date: March 18 th, 2019 Ref.No.: PSS-GS180009-PUB/E
For Publication
Target industries : Main – Refinery, Sub – Petrochemical, Fertilizer
Value proposition : 1)Energy conservation
(Profit improvement due to cost reduction)
2)CO2 emission reduction
3)Energy real-time monitoring with support for EnMS
establishment/operation in line with ISO50001
4)Human performance improvement
Awareness activities : 1)Participation in energy events in India
2)Collaboration for human resource development
program organized by Japanese government agency
For awareness activities, the main target industry sector is refining. This is because the refineries are one of our
important customers, not to mention that the industry that investigated the CO2 reduction potential i n this study
was oil refining. Based on the industries covered by the PAT scheme in India (including planed industries), our
business domain, and the delivery records of Visual MESA and EP -Analytics in the world, other sub-targets are
selected as fertilizer and petrochemical.
We will focus on two way of awareness activities in below.
1) Participation in energy events in India
2) Collaboration for human resource development program organized by Japanese government agency
Table 4.3.3-1, Table 4.3.3-2 (Not used)
4.4 Business growth target after adoption of recommended policies/institutionsYokogawa has set a business growth target in case the adoption of the recommended policies and institutions
heighten the momentum to acquire ISO 50001 certification in India and the awareness of our solution expands.
Targeting is focused on refineries, petrochemicals and fertilizers in line with dir ection of awareness activities.
4.5 Study of applicable CO2 emission reduction methodologies for commercialization and estimation of CO2 emission reductions using the methodologies
4.5.1 Study for CO2 emission reduction methodologyIn order to reduce CO2 emission, the optimal operation for energy of utility units is simulated using Visual MESA,
and the simulation results are reflected in actual operation. In addition, by adding Production Supervisor VP to
Visual MESA and using them as EP-Analytics, the PDCA cycle at the EnMS operation level will be improved, and
91Date: March 18 th, 2019 Ref.No.: PSS-GS180009-PUB/E
For Publication
continuous energy optimization and CO2 emission reduction will be attempted. The activities in each phase of
PDCA and how to use this solution are mentioned in below.
Plan
EnPI (Energy Performance Indicator) and EnB (Energy Baseline) are set along EnMS.
Visual MESA is used for target setting. Energy include CO2 emission reduction potential is simulated by it based
on past utility operation data. Then, targets and utility operation plans are developed based on the simulated results.
Moreover, EnPI is visualized on the dashboard.
Do
The utility unit is operated according to the plan. In parallel, optimal operation is simulated using real -time
operation data by Visual MESA. EnPI is monitored on the dashboard at real-time.
Check
Real-time monitoring of discrepancies between actual EnPI values and target values as well as between simulation
results of optimum operation and planning. If there is a discrepancy, the problem is identified by the alarm history,
drill down analysis on the dashboard, or field check.
Act
Take action on the identified problem. Visual MESA is used to develop operational plan update after the
countermeasures are implemented for further optimization.
4.5.2 Estimation for CO2 emission reductionIf Visual MESA and EP-Analytics are deployed to refinery, petrochemical and fertilizer sectors as we planned, total
CO2 emissions reductions would reach 1.05 MtC/year, and when market growth in 2025 is considered, it could
reach 1.68 MtC/year.
Table 4.5.2-1 CO2 emission reduction by Visual MESA (without market growth)
CO2 排出削減量 (tC/年)
CO2 reduction potential (tC/year)
石油精製 Refinery 835,623
石油化学 Petrochemical 43,122
肥料 Fertilizer 172,849
合計 Total 1,051,593
92Date: March 18 th, 2019 Ref.No.: PSS-GS180009-PUB/E
For Publication
Table 4.5.2-2 CO2 emission reduction by Visual MESA (with market growth)
CO2 排出削減量 (tC/年)
CO2 reduction potential (tC/year)
石油精製 Refinery 1,400,598
石油化学 Petrochemical 71,649
肥料 Fertilizer 206,438
合計 Total 1,678,685
Each estimation method is described below.
Refinery
The expected reduction from the use of Visual MESA at a refinery in India, which cooperated in this survey, was
67,540 tC/year. This is obtained from the following equation.
A
mMMFC
CO COCnna
2%
2 (Equation 1)
Table 4.5.2-3 Parameter in
Am
MMFCCO COCnn
a
2%2
(Equation 1)
Parameter Unit Description
CO2a tC/year Annual CO2 reduction weight
A hour/year Plant availability
m Sample days
C%n wt% Carbonrate in fuel
Fn t/h Fuel reduction weight
MCO2 g/mol CO2 molecular weight
MC g/mol Carbon molecular weight
Prerequisites;
1) Annual availability [hour/year] is 8,760 hours (= 24 hours x 365 days)
2) Carbon components in the fuel shall be completely combusted by the following chemical formula.
93Date: March 18 th, 2019 Ref.No.: PSS-GS180009-PUB/E
For Publication
OHnmCOOnmHC nm 222 2/4/
3) The carbon ratio [%] in the fuel shall be the data provided by a refinery as follow
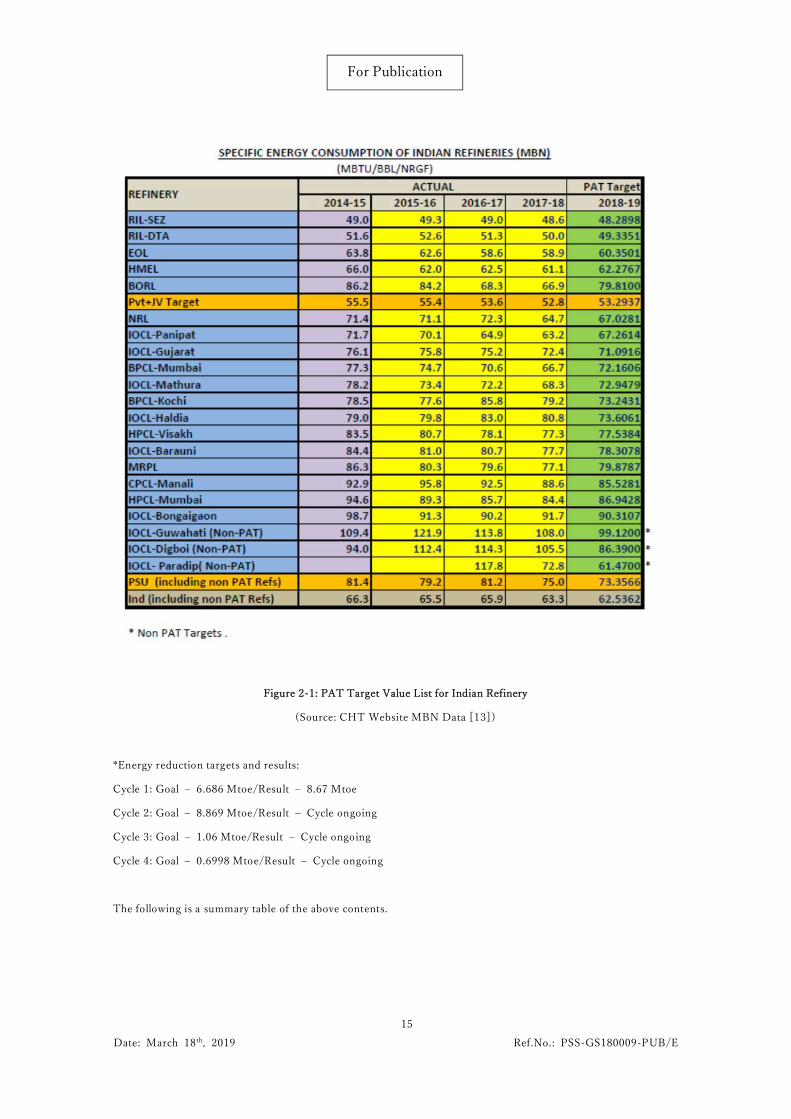
PAT Target Value List for Indian RefineryInstitutional Structure
Title
Secondary use unapproved list
Report name: Feasibility study on CO2reduction with energy optimizationsolution toward the introduction ofenergy-saving policies andinstitutions to refineries and processplants in India
Project name:Investigation oninfrastructure development for acquisitionof Joint Credit (Quantificaiton ofinternational contribution and JCMfeasibility study)