UNITED STATES SECURITIES AND EXCHANGE COMMISSION Washington, DC 20549 Form 10-Q ☑ QUARTERLY REPORT PURSUANT TO SECTION 13 OR 15(d) OF THE SECURITIES EXCHANGE ACT OF 1934 For the quarterly period ended June 30, 2021 OR ☐ TRANSITION REPORT PURSUANT TO SECTION 13 OR 15(d) OF THE SECURITIES EXCHANGE ACT OF 1934 For the transition period from to Commission file number 001-34960 GENERAL MOTORS COMPANY (Exact name of registrant as specified in its charter) Delaware 27-0756180 (State or other jurisdiction of incorporation or organization) (I.R.S. Employer Identification No.) 300 Renaissance Center, Detroit, Michigan 48265 -3000 (Address of principal executive offices) (Zip Code) (313) 667-1500 (Registrant’s telephone number, including area code) Securities registered pursuant to Section 12(b) of the Act: Title of each class Trading Symbol(s) Name of each exchange on which registered Common Stock, $0.01 par value GM New York Stock Exchange Indicate by check mark whether the registrant (1) has filed all reports required to be filed by Section 13 or 15(d) of the Securities Exchange Act of 1934 during the preceding 12 months (or for such shorter period that the registrant was required to file such reports), and (2) has been subject to such filing requirements for the past 90 days. Yes ☑ No ☐ Indicate by check mark whether the registrant has submitted electronically every Interactive Data File required to be submitted pursuant to Rule 405 of Regulation S-T (§232.405 of this chapter) during the preceding 12 months (or for such shorter period that the registrant was required to submit such files). Yes ☑ No ☐ Indicate by check mark whether the registrant is a large accelerated filer, an accelerated filer, a non-accelerated filer, a smaller reporting company, or an emerging growth company. See the definitions of “large accelerated filer,” “accelerated filer,” “smaller reporting company,” and "emerging growth company" in Rule 12b-2 of the Exchange Act. Large accelerated filer ☑ Accelerated filer ☐ Non-accelerated filer ☐ Smaller reporting company ☐ Emerging growth company ☐ If an emerging growth company, indicate by check mark if the registrant has elected not to use the extended transition period for complying with any new or revised financial accounting standards provided pursuant to Section 13(a) of the Exchange Act. ☐ Indicate by check mark whether the registrant is a shell company (as defined in Rule 12b-2 of the Exchange Act). Yes ☐ No ☑ As of July 19, 2021 there were 1,451,723,812 shares of common stock outstanding.
Transcript
UNITED STATES SECURITIES AND EXCHANGE COMMISSIONWashington, DC 20549
Form 10-Q☑ QUARTERLY REPORT PURSUANT TO SECTION 13 OR 15(d) OF THE SECURITIES EXCHANGE ACT
OF 1934
For the quarterly period ended June 30, 2021
OR☐ TRANSITION REPORT PURSUANT TO SECTION 13 OR 15(d) OF THE SECURITIES EXCHANGE ACT
OF 1934
For the transition period from to
Commission file number 001-34960
GENERAL MOTORS COMPANY(Exact name of registrant as specified in its charter)
Delaware 27-0756180(State or other jurisdiction of
incorporation or organization)(I.R.S. Employer
Identification No.)
300 Renaissance Center, Detroit, Michigan 48265 -3000(Address of principal executive offices) (Zip Code)
(313) 667-1500(Registrant’s telephone number, including area code)
Securities registered pursuant to Section 12(b) of the Act:
Title of each class Trading Symbol(s) Name of each exchange on which registeredCommon Stock, $0.01 par value GM New York Stock Exchange
Indicate by check mark whether the registrant (1) has filed all reports required to be filed by Section 13 or 15(d) of the Securities Exchange Act of 1934 duringthe preceding 12 months (or for such shorter period that the registrant was required to file such reports), and (2) has been subject to such filing requirements forthe past 90 days. Yes ☑ No ☐
Indicate by check mark whether the registrant has submitted electronically every Interactive Data File required to be submitted pursuant to Rule 405 ofRegulation S-T (§232.405 of this chapter) during the preceding 12 months (or for such shorter period that the registrant was required to submit suchfiles). Yes ☑ No ☐
Indicate by check mark whether the registrant is a large accelerated filer, an accelerated filer, a non-accelerated filer, a smaller reporting company, or an emerginggrowth company. See the definitions of “large accelerated filer,” “accelerated filer,” “smaller reporting company,” and "emerging growth company" in Rule 12b-2of the Exchange Act.
Large accelerated filer ☑ Accelerated filer ☐ Non-accelerated filer ☐ Smaller reporting company ☐ Emerging growth company ☐
If an emerging growth company, indicate by check mark if the registrant has elected not to use the extended transition period for complying with any new orrevised financial accounting standards provided pursuant to Section 13(a) of the Exchange Act. ☐
Indicate by check mark whether the registrant is a shell company (as defined in Rule 12b-2 of the Exchange Act). Yes ☐ No ☑
As of July 19, 2021 there were 1,451,723,812 shares of common stock outstanding.
INDEX
PagePART I
Item 1. Condensed Consolidated Financial Statements 1Condensed Consolidated Income Statements (Unaudited) 1Condensed Consolidated Statements of Comprehensive Income (Unaudited) 1Condensed Consolidated Balance Sheets (Unaudited) 2Condensed Consolidated Statements of Cash Flows (Unaudited) 3Condensed Consolidated Statements of Equity (Unaudited) 4Notes to Condensed Consolidated Financial Statements 5
Note 1. Nature of Operations and Basis of Presentation 5Note 2. Revenue 5Note 3. Marketable and Other Securities 7Note 4. GM Financial Receivables and Transactions 8Note 5. Inventories 11Note 6. Equipment on Operating Leases 12Note 7. Equity in Net Assets of Nonconsolidated Affiliates 12Note 8. Variable Interest Entities 13Note 9. Debt 14Note 10. Derivative Financial Instruments 15Note 11. Accrued and Other Liabilities 16Note 12. Pensions and Other Postretirement Benefits 17Note 13. Commitments and Contingencies 17Note 14. Income Taxes 20Note 15. Restructuring and Other Initiatives 20Note 16. Stockholders' Equity and Noncontrolling Interests 21Note 17. Earnings Per Share 23Note 18. Segment Reporting 23
Item 2. Management’s Discussion and Analysis of Financial Condition and Results of Operations 27Item 3. Quantitative and Qualitative Disclosures About Market Risk 46Item 4. Controls and Procedures 47
PART IIItem 1. Legal Proceedings 48Item 1A. Risk Factors 48Item 2. Unregistered Sales of Equity Securities and Use of Proceeds 49Item 6. Exhibits 50Signature 51
Table of ContentsGENERAL MOTORS COMPANY AND SUBSIDIARIES
PART IItem 1. Condensed Consolidated Financial Statements
CONDENSED CONSOLIDATED INCOME STATEMENTS(In millions, except per share amounts) (Unaudited)
Three Months Ended Six Months Ended June 30, 2021 June 30, 2020 June 30, 2021 June 30, 2020
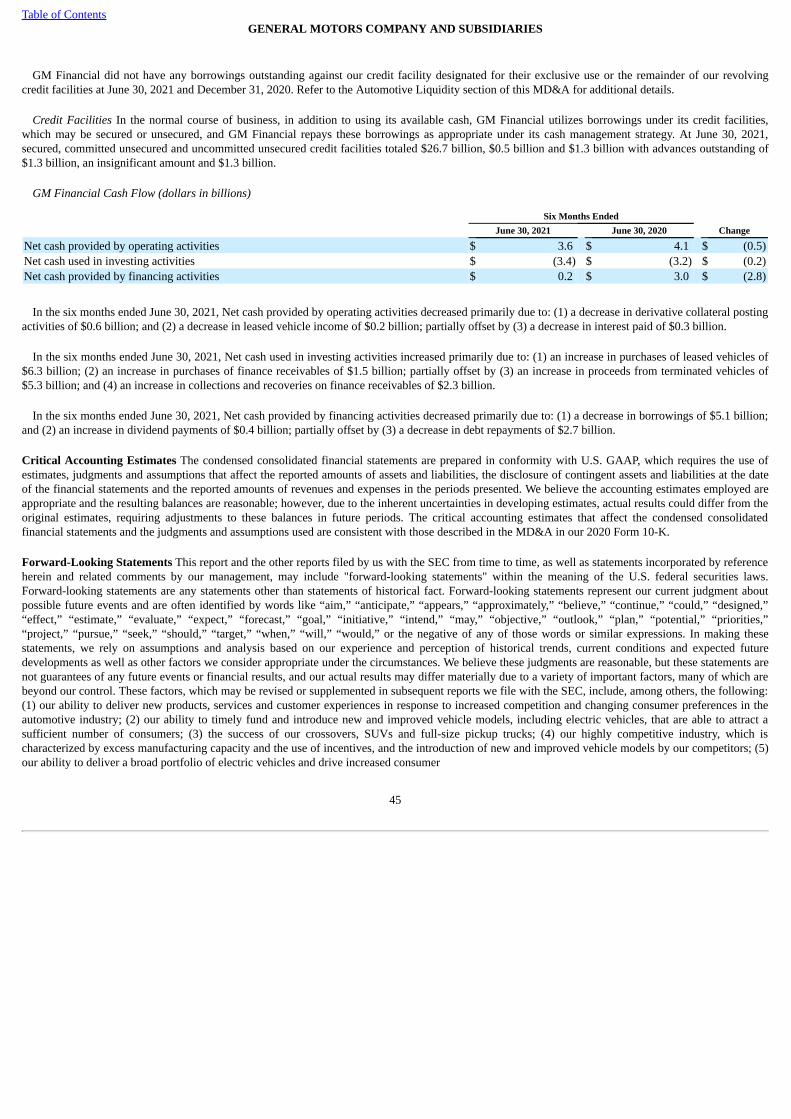
Net sales and revenueAutomotive $ 30,744 $ 13,363 $ 59,811 $ 42,513 GM Financial 3,423 3,415 6,830 6,974 Total net sales and revenue (Note 2) 34,167 16,778 66,641 49,487
Costs and expensesAutomotive and other cost of sales 27,266 13,444 52,381 40,170 GM Financial interest, operating and other expenses 1,894 3,238 4,173 6,594 Automotive and other selling, general and administrative expense 2,125 1,310 3,928 3,280 Total costs and expenses 31,285 17,992 60,482 50,044
Operating income (loss) 2,882 (1,214) 6,159 (557)Automotive interest expense 243 303 493 496 Interest income and other non-operating income, net 784 413 1,583 724 Equity income (Note 7) 327 212 692 80 Income (loss) before income taxes 3,750 (892) 7,941 (249)Income tax expense (benefit) (Note 14) 971 (112) 2,148 245 Net income (loss) 2,779 (780) 5,793 (494)Net loss attributable to noncontrolling interests 57 22 65 30 Net income (loss) attributable to stockholders $ 2,836 $ (758) $ 5,858 $ (464)
Net income (loss) attributable to common stockholders $ 2,790 $ (806) $ 5,767 $ (559)
Earnings (loss) per share (Note 17)Basic earnings (loss) per common share $ 1.92 $ (0.56) $ 3.98 $ (0.39)Weighted-average common shares outstanding – basic 1,451 1,432 1,449 1,432
Diluted earnings (loss) per common share $ 1.90 $ (0.56) $ 3.93 $ (0.39)Weighted-average common shares outstanding – diluted 1,468 1,432 1,466 1,432
Dividends declared per common share $ — $ — $ — $ 0.38
CONDENSED CONSOLIDATED STATEMENTS OF COMPREHENSIVE INCOME(In millions) (Unaudited)
Three Months Ended Six Months Ended June 30, 2021 June 30, 2020 June 30, 2021 June 30, 2020
Net income (loss) $ 2,779 $ (780) $ 5,793 $ (494)Other comprehensive income (loss), net of tax (Note 16)
Foreign currency translation adjustments and other 302 (58) 297 (1,031)Defined benefit plans 28 (39) 188 278
Other comprehensive income (loss), net of tax 330 (97) 485 (753)Comprehensive income (loss) 3,109 (877) 6,278 (1,247)Comprehensive income attributable to noncontrolling interests 57 18 72 38 Comprehensive income (loss) attributable to stockholders $ 3,166 $ (859) $ 6,350 $ (1,209)
Reference should be made to the notes to condensed consolidated financial statements.
1
Table of ContentsGENERAL MOTORS COMPANY AND SUBSIDIARIES
CONDENSED CONSOLIDATED BALANCE SHEETS(In millions, except per share amounts) (Unaudited)
June 30, 2021 December 31, 2020ASSETS
Current AssetsCash and cash equivalents $ 22,920 $ 19,992 Marketable debt securities (Note 3) 6,211 9,046 Accounts and notes receivable, net 8,167 8,035 GM Financial receivables, net (Note 4; Note 8 at VIEs) 24,444 26,209 Inventories (Note 5) 13,102 10,235 Other current assets (Note 3; Note 8 at VIEs) 7,765 7,407 Total current assets 82,609 80,924
Non-current AssetsGM Financial receivables, net (Note 4; Note 8 at VIEs) 35,507 31,783 Equity in net assets of nonconsolidated affiliates (Note 7) 8,882 8,406 Property, net 38,822 37,632 Goodwill and intangible assets, net 5,169 5,230 Equipment on operating leases, net (Note 6; Note 8 at VIEs) 40,596 39,819 Deferred income taxes 22,408 24,136 Other assets (Note 3; Note 8 at VIEs) 7,810 7,264 Total non-current assets 159,194 154,270
Total Assets $ 241,803 $ 235,194
LIABILITIES AND EQUITYCurrent Liabilities
Accounts payable (principally trade) $ 21,431 $ 19,928 Short-term debt and current portion of long-term debt (Note 9) Automotive 896 1,276
GM Financial (Note 8 at VIEs) 33,294 35,637 Accrued liabilities (Note 11) 19,190 23,069 Total current liabilities 74,811 79,910
GM Financial (Note 8 at VIEs) 60,276 56,788 Postretirement benefits other than pensions (Note 12) 6,202 6,277 Pensions (Note 12) 11,564 12,902 Other liabilities (Note 11) 14,652 13,447 Total non-current liabilities 109,116 105,607
Total Liabilities 183,927 185,517 Commitments and contingencies (Note 13)Equity (Note 16)
Common stock, $0.01 par value 15 14 Additional paid-in capital 26,844 26,542 Retained earnings 37,806 31,962 Accumulated other comprehensive loss (12,996) (13,488)Total stockholders’ equity 51,669 45,030 Noncontrolling interests 6,207 4,647
Total Equity 57,876 49,677 Total Liabilities and Equity $ 241,803 $ 235,194
Reference should be made to the notes to condensed consolidated financial statements.
2
Table of ContentsGENERAL MOTORS COMPANY AND SUBSIDIARIES
CONDENSED CONSOLIDATED STATEMENTS OF CASH FLOWS(In millions) (Unaudited)
Six Months EndedJune 30, 2021 June 30, 2020
Cash flows from operating activitiesNet income (loss) $ 5,793 $ (494)Depreciation and impairment of Equipment on operating leases, net 3,218 3,759 Depreciation, amortization and impairment charges on Property, net 2,815 2,814 Foreign currency remeasurement and transaction (gains) (25) (63)Undistributed earnings of nonconsolidated affiliates, net 16 446 Pension contributions and OPEB payments (425) (327)Pension and OPEB income, net (803) (518)Provision (benefit) for deferred taxes 1,813 (24)Change in other operating assets and liabilities (3,974) (6,847)
Net cash provided by (used in) operating activities 8,428 (1,254)Cash flows from investing activities
Expenditures for property (2,451) (2,336)Available-for-sale marketable securities, acquisitions (4,090) (7,656)Available-for-sale marketable securities, liquidations 6,926 3,694 Purchases of finance receivables, net (17,485) (14,929)Principal collections and recoveries on finance receivables 11,946 9,563 Purchases of leased vehicles, net (12,439) (6,054)Proceeds from termination of leased vehicles 10,868 5,537 Other investing activities (285) (155)
Net cash used in investing activities (7,010) (12,336)Cash flows from financing activities
Net increase in short-term debt 2,365 846 Proceeds from issuance of debt (original maturities greater than three months) 25,955 53,465 Payments on debt (original maturities greater than three months) (27,035) (29,512)Proceeds from issuance of subsidiary preferred stock (Note 16) 1,736 — Dividends paid (94) (592)Other financing activities (90) (491)
Net cash provided by financing activities 2,837 23,716 Effect of exchange rate changes on cash, cash equivalents and restricted cash (7) (429)Net increase in cash, cash equivalents and restricted cash 4,248 9,697
Cash, cash equivalents and restricted cash at beginning of period 23,117 22,943 Cash, cash equivalents and restricted cash at end of period $ 27,365 $ 32,640
Reference should be made to the notes to condensed consolidated financial statements.
3
Table of ContentsGENERAL MOTORS COMPANY AND SUBSIDIARIES
CONDENSED CONSOLIDATED STATEMENTS OF EQUITY(In millions) (Unaudited)
Common Stockholders’
NoncontrollingInterests Total Equity
CommonStock
AdditionalPaid-inCapital
RetainedEarnings
Accumulated OtherComprehensive Loss
Balance at January 1, 2020 $ 14 $ 26,074 $ 26,860 $ (11,156) $ 4,165 $ 45,957 Adoption of accounting standards — — (660) — — (660)Net income — — 294 — (8) 286 Other comprehensive loss — — — (644) (12) (656)Issuance of subsidiary preferred stock — — — — 26 26 Purchase of common stock — (57) (33) — — (90)Stock based compensation — (3) (7) — — (10)Cash dividends paid on common stock — — (545) — — (545)Dividends to noncontrolling interests — — — — (4) (4)Other — — (24) — 37 13 Balance at March 31, 2020 14 26,014 25,885 (11,800) 4,204 44,317 Net loss — — (758) — (22) (780)Other comprehensive loss — — — (101) 4 (97)Issuance of subsidiary preferred stock — — — — 26 26 Stock based compensation — 73 — — — 73 Dividends to noncontrolling interests — — — — (39) (39)Other — — (23) — 16 (7)Balance at June 30, 2020 $ 14 $ 26,087 $ 25,104 $ (11,901) $ 4,189 $ 43,493
Balance at January 1, 2021 $ 14 $ 26,542 $ 31,962 $ (13,488) $ 4,647 $ 49,677 Net income — — 3,022 — (8) 3,014 Other comprehensive income — — — 162 (7) 155 Issuance of subsidiary preferred stock (Note 16) — — — — 1,537 1,537 Stock based compensation — 132 — — — 132 Dividends to noncontrolling interests — — — — (61) (61)Other — (7) 4 — (8) (11)Balance at March 31, 2021 14 26,667 34,988 (13,326) 6,100 54,443 Net income — — 2,836 — (57) 2,779 Other comprehensive income — — — 330 — 330 Issuance of subsidiary preferred stock (Note 16) — — — — 199 199 Stock based compensation — 177 (4) — — 173 Dividends to noncontrolling interests — — — — (64) (64)Other 1 — (14) — 29 16 Balance at June 30, 2021 $ 15 $ 26,844 $ 37,806 $ (12,996) $ 6,207 $ 57,876
Reference should be made to the notes to condensed consolidated financial statements.
4
Table of ContentsGENERAL MOTORS COMPANY AND SUBSIDIARIES
NOTES TO CONDENSED CONSOLIDATED FINANCIAL STATEMENTS
Note 1. Nature of Operations and Basis of Presentation
General Motors Company (sometimes referred to in this Quarterly Report on Form 10-Q as we, our, us, ourselves, the Company, General Motors or GM)designs, builds and sells trucks, crossovers, cars and automobile parts worldwide and is investing in and growing an autonomous vehicle business. We alsoprovide automotive financing services through General Motors Financial Company, Inc. (GM Financial). We analyze the results of our operations throughthe following segments: GM North America (GMNA), GM International (GMI), Cruise, and GM Financial. Cruise is our global segment responsible for thedevelopment and commercialization of autonomous vehicle technology. Nonsegment operations are classified as Corporate. Corporate includes certaincentrally recorded income and costs such as interest, income taxes, corporate expenditures and certain nonsegment-specific revenues and expenses.
The condensed consolidated financial statements have been prepared in conformity with U.S. GAAP pursuant to the rules and regulations of theSecurities and Exchange Commission (SEC) for interim financial information. Accordingly, they do not include all of the information and notes required byU.S. GAAP for complete financial statements. The condensed consolidated financial statements include all adjustments, which consist of normal recurringadjustments and transactions or events discretely impacting the interim periods, considered necessary by management to fairly state our results ofoperations, financial position and cash flows. The operating results for interim periods are not necessarily indicative of results that may be expected for anyother interim period or for the full year. These condensed consolidated financial statements should be read in conjunction with the audited consolidatedfinancial statements and notes thereto included in our 2020 Form 10-K. Except for per share amounts or as otherwise specified, amounts presented withintables are stated in millions.
Principles of Consolidation We consolidate entities that we control due to ownership of a majority voting interest and we consolidate variable interestentities (VIEs) when we are the primary beneficiary. All intercompany balances and transactions have been eliminated in consolidation. Our share ofearnings or losses of nonconsolidated affiliates is included in our consolidated operating results using the equity method of accounting when we are able toexercise significant influence over the operating and financial decisions of the affiliate.
GM Financial The amounts presented for GM Financial have been adjusted to reflect the impact on GM Financial's deferred tax positions and provision forincome taxes resulting from the inclusion of GM Financial in our consolidated tax return and to eliminate the effect of transactions between GM Financialand the other members of the consolidated group. Accordingly, the amounts presented will differ from those presented by GM Financial on a stand-alonebasis.
Note 2. Revenue
The following table disaggregates our revenue by major source:
Three Months Ended June 30, 2021
GMNA GMI CorporateTotal
Automotive CruiseGM
Financial Eliminations/Reclassifications TotalVehicle, parts and accessories $ 26,993 $ 2,475 $ 2 $ 29,470 $ — $ — $ — $ 29,470 Used vehicles 137 13 — 150 — — — 150 Services and other 802 304 19 1,125 25 — (26) 1,124
Automotive net sales and revenue 27,932 2,792 21 30,745 25 — (26) 30,744 Leased vehicle income — — — — — 2,304 — 2,304 Finance charge income — — — — — 1,036 — 1,036 Other income — — — — — 86 (3) 83
GM Financial net sales and revenue — — — — — 3,426 (3) 3,423 Net sales and revenue $ 27,932 $ 2,792 $ 21 $ 30,745 $ 25 $ 3,426 $ (29) $ 34,167
5
Table of ContentsGENERAL MOTORS COMPANY AND SUBSIDIARIES
NOTES TO CONDENSED CONSOLIDATED FINANCIAL STATEMENTS —— (Continued)
Three Months Ended June 30, 2020
GMNA GMI CorporateTotal
Automotive CruiseGM
FinancialEliminations/
Reclassifications TotalVehicle, parts and accessories $ 10,850 $ 1,439 $ — $ 12,289 $ — $ — $ — $ 12,289 Used vehicles 122 17 8 147 — — — 147 Services and other 632 221 72 925 28 — (26) 927
Automotive net sales and revenue 11,604 1,677 80 13,361 28 — (26) 13,363 Leased vehicle income — — — — — 2,386 — 2,386 Finance charge income — — — — — 966 — 966 Other income — — — — — 71 (8) 63
GM Financial net sales and revenue — — — — — 3,423 (8) 3,415 Net sales and revenue $ 11,604 $ 1,677 $ 80 $ 13,361 $ 28 $ 3,423 $ (34) $ 16,778
Six Months Ended June 30, 2021
GMNA GMI CorporateTotal
Automotive CruiseGM
Financial Eliminations/Reclassifications TotalVehicle, parts and accessories $ 51,913 $ 5,276 $ 2 $ 57,191 $ — $ — $ — $ 57,191 Used vehicles 365 26 — 391 — — — 391 Services and other 1,611 576 38 2,225 55 — (51) 2,229
Automotive net sales and revenue 53,889 5,878 40 59,807 55 — (51) 59,811 Leased vehicle income — — — — — 4,625 — 4,625 Finance charge income — — — — — 2,052 — 2,052 Other income — — — — — 156 (3) 153
GM Financial net sales and revenue — — — — — 6,833 (3) 6,830 Net sales and revenue $ 53,889 $ 5,878 $ 40 $ 59,807 $ 55 $ 6,833 $ (54) $ 66,641
Six Months Ended June 30, 2020
GMNA GMI CorporateTotal
Automotive CruiseGM
FinancialEliminations/
Reclassifications TotalVehicle, parts and accessories $ 35,426 $ 4,437 $ — $ 39,863 $ — $ — $ — $ 39,863 Used vehicles 498 42 10 550 — — — 550 Services and other 1,511 478 108 2,097 53 — (50) 2,100
Automotive net sales and revenue 37,435 4,957 118 42,510 53 — (50) 42,513 Leased vehicle income — — — — — 4,849 — 4,849 Finance charge income — — — — — 1,972 (1) 1,971 Other income — — — — — 163 (9) 154
GM Financial net sales and revenue — — — — — 6,984 (10) 6,974 Net sales and revenue $ 37,435 $ 4,957 $ 118 $ 42,510 $ 53 $ 6,984 $ (60) $ 49,487
Revenue is measured as the amount of consideration we expect to receive in exchange for transferring goods or providing services. Adjustments to salesincentives for previously recognized sales increased revenue by $350 million and $470 million in the three months ended June 30, 2021 and 2020.
Contract liabilities in our Automotive segments primarily consist of maintenance, extended warranty and other service contracts of $2.5 billion and$2.4 billion at June 30, 2021 and December 31, 2020, which are included in Accrued liabilities and Other liabilities. We recognized revenue of $294 millionand $689 million related to contract liabilities in the three and six months ended June 30, 2021 and $241 million and $627 million in the three and sixmonths ended June 30, 2020. We expect to recognize revenue of $745 million in the six months ending December 31, 2021 and $738 million, $433 millionand $598 million in the years ending December 31, 2022, 2023 and thereafter related to contract liabilities at June 30, 2021.
6
Table of ContentsGENERAL MOTORS COMPANY AND SUBSIDIARIES
NOTES TO CONDENSED CONSOLIDATED FINANCIAL STATEMENTS —— (Continued)
Note 3. Marketable and Other Securities
The following table summarizes the fair value of cash equivalents and marketable debt securities, which approximates cost:
Fair ValueLevel June 30, 2021 December 31, 2020
Cash and cash equivalentsCash and time deposits $ 8,255 $ 8,010 Available-for-sale debt securities
U.S. government and agencies 2 2,029 1,370 Corporate debt 2 5,609 3,476 Sovereign debt 2 4,353 2,051
Total available-for-sale debt securities – cash equivalents 11,991 6,897 Money market funds 1 2,674 5,085 Total cash and cash equivalents(a) $ 22,920 $ 19,992 Marketable debt securities
U.S. government and agencies 2 $ 676 $ 1,771 Corporate debt 2 3,217 3,630 Mortgage and asset-backed 2 567 632 Sovereign debt 2 1,751 3,013
Available-for-sale debt securities included above with contractual maturities(c)Due in one year or less $ 14,692 Due between one and five years 2,904 Total available-for-sale debt securities with contractual maturities $ 17,596
__________(a) Includes $1.8 billion and $761 million in Cruise at June 30, 2021 and December 31, 2020.(b) Includes $2.1 billion and $943 million in Cruise at June 30, 2021 and December 31, 2020.(c) Excludes mortgage and asset-backed securities of $567 million at June 30, 2021 as these securities are not due at a single maturity date.
Proceeds from the sale of available-for-sale debt securities sold prior to maturity were $557 million and $554 million in the three months ended June 30,2021 and 2020 and $1.1 billion and $920 million in the six months ended June 30, 2021 and 2020. Net unrealized gains and losses on available-for-sale debtsecurities were insignificant in the three and six months ended June 30, 2021 and 2020. Cumulative unrealized gains and losses on available-for-sale debtsecurities were insignificant at June 30, 2021 and December 31, 2020.
7
Table of ContentsGENERAL MOTORS COMPANY AND SUBSIDIARIES
NOTES TO CONDENSED CONSOLIDATED FINANCIAL STATEMENTS —— (Continued)
The following table provides a reconciliation of cash, cash equivalents and restricted cash reported within the condensed consolidated balance sheets tothe total shown in the condensed consolidated statement of cash flows:
June 30, 2021
Cash and cash equivalents $ 22,920 Restricted cash included in Other current assets 3,873 Restricted cash included in Other assets 572 Total $ 27,365
Note 4. GM Financial Receivables and Transactions
June 30, 2021 December 31, 2020Retail Commercial(a) Total Retail Commercial(a) Total
Fair value of GM Financial receivables utilizing Level 2inputs $ 5,399 $ 8,619
Fair value of GM Financial receivables utilizing Level 3inputs $ 56,490 $ 51,645
__________(a) Net of dealer cash management balances of $1.1 billion and $1.4 billion at June 30, 2021 and December 31, 2020. Under the cash management program, subject to
certain conditions, a dealer may choose to reduce the amount of interest on its floorplan line by making principal payments to GM Financial in advance.
Three Months Ended Six Months EndedJune 30, 2021 June 30, 2020 June 30, 2021 June 30, 2020
Allowance for loan losses at beginning of period $ 1,835 $ 1,966 $ 1,978 $ 944 Impact of adoption ASU 2016-13 — — — 801 Provision for loan losses 59 327 33 793 Charge-offs (204) (273) (457) (613)Recoveries 146 91 296 247 Effect of foreign currency 14 — — (61)Allowance for loan losses at end of period $ 1,850 $ 2,111 $ 1,850 $ 2,111
The allowance for loan losses decreased by $261 million as of June 30, 2021 compared to June 30, 2020, primarily due to a reduction in the reserve levelsestablished during the six months ended June 30, 2020, as a result of actual credit performance that was better than originally forecasted at the onset of theCOVID-19 pandemic; and favorable expectations for future charge-offs and recoveries, reflecting improved forecast economic conditions; partially offsetby additional reserves recorded in the six months ended June 30, 2021, due to increased loan origination volume.
8
Table of ContentsGENERAL MOTORS COMPANY AND SUBSIDIARIES
NOTES TO CONDENSED CONSOLIDATED FINANCIAL STATEMENTS —— (Continued)
Retail Finance Receivables GM Financial's retail finance receivable portfolio includes loans made to consumers and businesses to finance the purchaseof vehicles for personal and commercial use. The following tables are consolidated summaries of the retail finance receivables by FICO score or itsequivalent, determined at origination, for each vintage of the retail finance receivables portfolio at June 30, 2021 and December 31, 2020:
Year of Origination June 30, 20212021 2020 2019 2018 2017 Prior Total Percent
GM Financial reviews the ongoing credit quality of retail finance receivables based on customer payment activity. A retail account is considereddelinquent if a substantial portion of a scheduled payment has not been received by the date the payment was contractually due. Retail finance receivablesare collateralized by vehicle titles and, subject to local laws, GM Financial generally has the right to repossess the vehicle in the event the customer defaultson the payment terms of the contract. The accrual of finance charge income had been suspended on delinquent retail finance receivables with contractualamounts due of $555 million and $714 million at June 30, 2021 and December 31, 2020. The following tables are consolidated summaries of thedelinquency status of the outstanding amortized cost of retail finance receivables for each vintage of the portfolio at June 30, 2021 and December 31, 2020,as well as summary totals for June 30, 2020:
Year of Origination June 30, 2021 June 30, 20202021 2020 2019 2018 2017 Prior Total Percent Total Percent
The outstanding amortized cost of retail finance receivables that are considered troubled debt restructurings was $2.0 billion at June 30, 2021, including$213 million in nonaccrual loans.
Commercial Finance Receivables GM Financial's commercial finance receivables consist of dealer financings, primarily for inventory purchases.Proprietary models are used to assign a risk rating to each dealer. GM Financial performs periodic credit reviews of each dealership and adjusts thedealership's risk rating, if necessary. There were no commercial finance receivables on nonaccrual status at June 30, 2021.
GM Financial's commercial risk model and risk rating categories are as follows:
Rating DescriptionI Performing accounts with strong to acceptable financial metrics with at least satisfactory capacity to meet financial commitments.II Performing accounts experiencing potential weakness in financial metrics and repayment prospects resulting in increased monitoring.
III Non-Performing accounts with inadequate paying capacity for current obligations and have the distinct possibility of creating a loss ifdeficiencies are not corrected.
IV Non-Performing accounts with inadequate paying capacity for current obligations and inherent weaknesses that make collection ofliquidation in full highly questionable or improbable.
Dealers with III and IV risk ratings are subject to additional monitoring and restrictions on funding, including suspension of lines of credit and liquidationof assets. The following tables summarize the credit risk profile by dealer risk rating of commercial finance receivables at June 30, 2021 and December 31,2020:
Year of Origination(a) June 30, 2021Revolving 2021 2020 2019 2018 2017 Prior Total Percent
__________(a) Floorplan advances comprise 97% of the total revolving balance. Dealer term loans are presented by year of origination.
Transactions with GM Financial The following table shows transactions between our Automotive segments and GM Financial. These amounts arepresented in GM Financial's condensed consolidated balance sheets and statements of income.
June 30, 2021 December 31, 2020Condensed Consolidated Balance Sheets(a)Commercial finance receivables, net due from GM consolidated dealers $ 261 $ 398 Subvention receivable(b) $ 590 $ 642 Commercial loan funding payable $ 30 $ 23
Three Months Ended Six Months EndedJune 30, 2021 June 30, 2020 June 30, 2021 June 30, 2020
__________(a) All balance sheet amounts are eliminated upon consolidation.(b) Our Automotive segments made cash payments to GM Financial for subvention of $1.0 billion and $967 million in the three months ended June 30, 2021 and 2020 and
$2.0 billion in the six months ended June 30, 2021 and 2020.
GM Financial's Board of Directors declared and paid dividends of $600 million and $400 million on its common stock in the three months ended June 31,2021 and 2020 and $1.2 billion and $800 million in the six months ended June 30, 2021 and 2020.
Note 5. Inventories
June 30, 2021 December 31, 2020
Total productive material, supplies and work in process $ 8,124 $ 5,117 Finished product, including service parts 4,978 5,118 Total inventories $ 13,102 $ 10,235
Inventories at June 30, 2021 increased primarily due to certain vehicles being manufactured without final components as a result of the globalsemiconductor supply shortage.
11
Table of ContentsGENERAL MOTORS COMPANY AND SUBSIDIARIES
NOTES TO CONDENSED CONSOLIDATED FINANCIAL STATEMENTS —— (Continued)
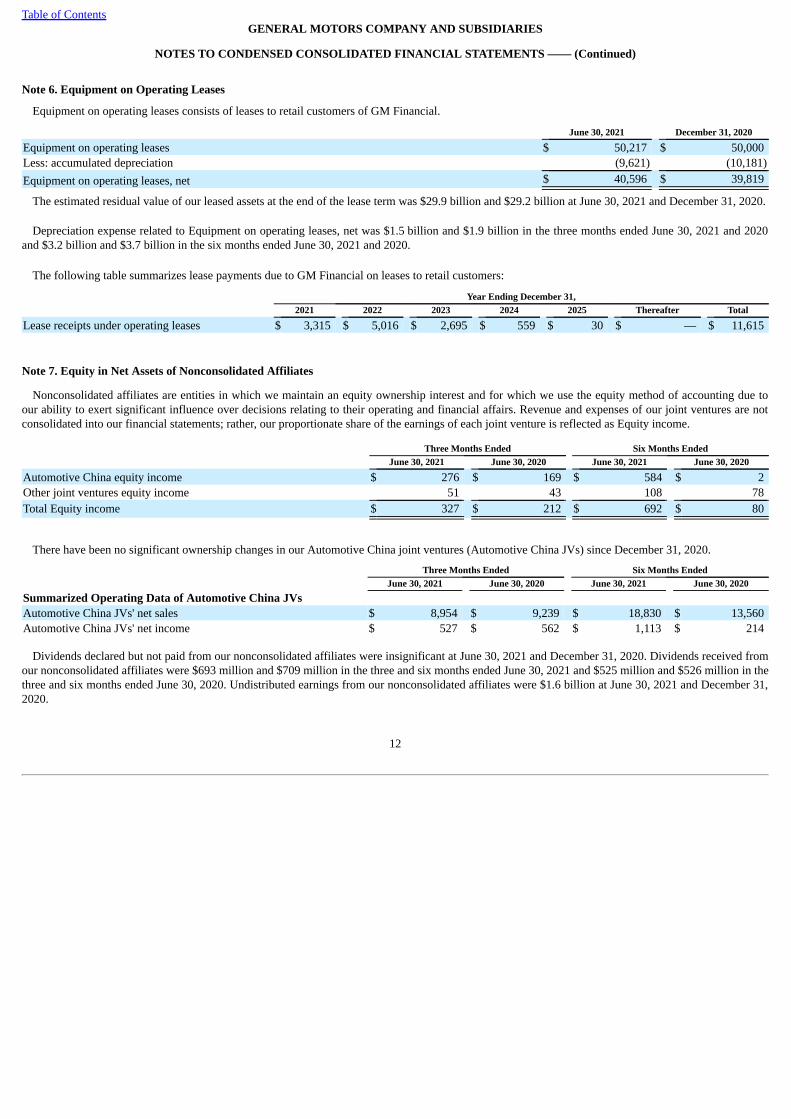
Note 6. Equipment on Operating Leases
Equipment on operating leases consists of leases to retail customers of GM Financial.
June 30, 2021 December 31, 2020
Equipment on operating leases $ 50,217 $ 50,000 Less: accumulated depreciation (9,621) (10,181)Equipment on operating leases, net $ 40,596 $ 39,819
The estimated residual value of our leased assets at the end of the lease term was $29.9 billion and $29.2 billion at June 30, 2021 and December 31, 2020.
Depreciation expense related to Equipment on operating leases, net was $1.5 billion and $1.9 billion in the three months ended June 30, 2021 and 2020and $3.2 billion and $3.7 billion in the six months ended June 30, 2021 and 2020.
The following table summarizes lease payments due to GM Financial on leases to retail customers:
Year Ending December 31,2021 2022 2023 2024 2025 Thereafter Total
Note 7. Equity in Net Assets of Nonconsolidated Affiliates
Nonconsolidated affiliates are entities in which we maintain an equity ownership interest and for which we use the equity method of accounting due toour ability to exert significant influence over decisions relating to their operating and financial affairs. Revenue and expenses of our joint ventures are notconsolidated into our financial statements; rather, our proportionate share of the earnings of each joint venture is reflected as Equity income.
Three Months Ended Six Months EndedJune 30, 2021 June 30, 2020 June 30, 2021 June 30, 2020
Automotive China equity income $ 276 $ 169 $ 584 $ 2 Other joint ventures equity income 51 43 108 78 Total Equity income $ 327 $ 212 $ 692 $ 80
There have been no significant ownership changes in our Automotive China joint ventures (Automotive China JVs) since December 31, 2020.
Three Months Ended Six Months EndedJune 30, 2021 June 30, 2020 June 30, 2021 June 30, 2020
Summarized Operating Data of Automotive China JVsAutomotive China JVs' net sales $ 8,954 $ 9,239 $ 18,830 $ 13,560 Automotive China JVs' net income $ 527 $ 562 $ 1,113 $ 214
Dividends declared but not paid from our nonconsolidated affiliates were insignificant at June 30, 2021 and December 31, 2020. Dividends received fromour nonconsolidated affiliates were $693 million and $709 million in the three and six months ended June 30, 2021 and $525 million and $526 million in thethree and six months ended June 30, 2020. Undistributed earnings from our nonconsolidated affiliates were $1.6 billion at June 30, 2021 and December 31,2020.
12
Table of ContentsGENERAL MOTORS COMPANY AND SUBSIDIARIES
NOTES TO CONDENSED CONSOLIDATED FINANCIAL STATEMENTS —— (Continued)
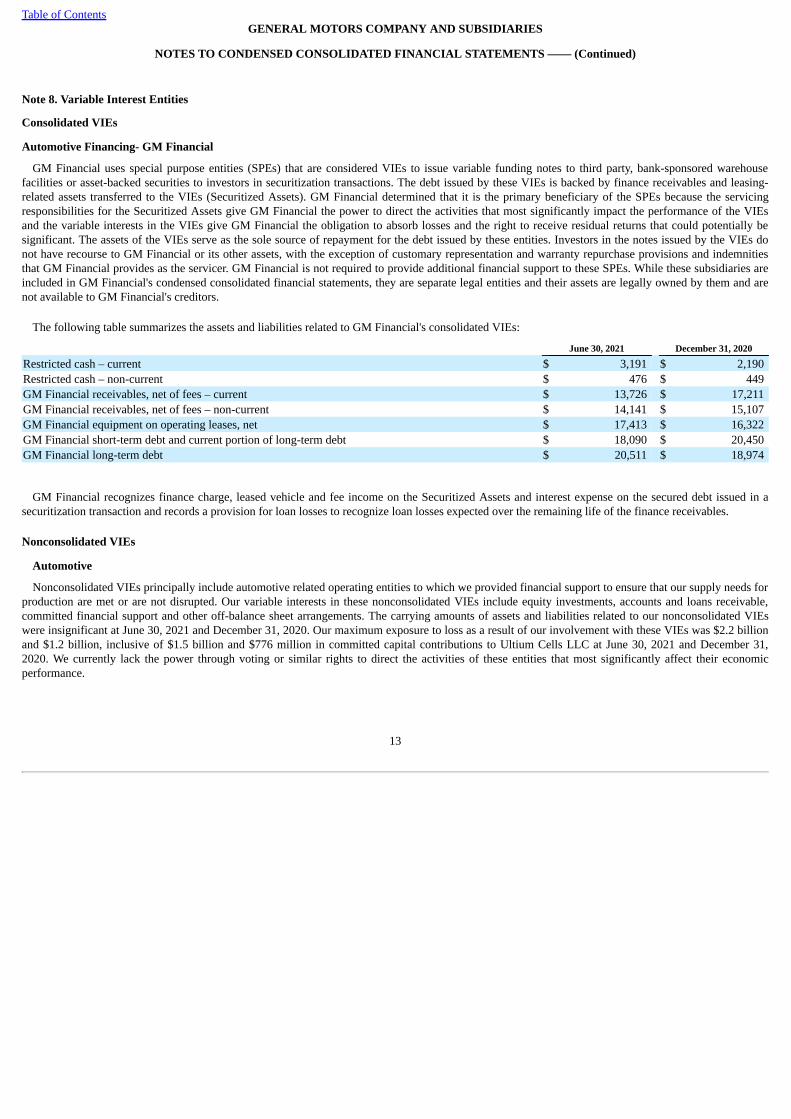
Note 8. Variable Interest Entities
Consolidated VIEs
Automotive Financing- GM Financial
GM Financial uses special purpose entities (SPEs) that are considered VIEs to issue variable funding notes to third party, bank-sponsored warehousefacilities or asset-backed securities to investors in securitization transactions. The debt issued by these VIEs is backed by finance receivables and leasing-related assets transferred to the VIEs (Securitized Assets). GM Financial determined that it is the primary beneficiary of the SPEs because the servicingresponsibilities for the Securitized Assets give GM Financial the power to direct the activities that most significantly impact the performance of the VIEsand the variable interests in the VIEs give GM Financial the obligation to absorb losses and the right to receive residual returns that could potentially besignificant. The assets of the VIEs serve as the sole source of repayment for the debt issued by these entities. Investors in the notes issued by the VIEs donot have recourse to GM Financial or its other assets, with the exception of customary representation and warranty repurchase provisions and indemnitiesthat GM Financial provides as the servicer. GM Financial is not required to provide additional financial support to these SPEs. While these subsidiaries areincluded in GM Financial's condensed consolidated financial statements, they are separate legal entities and their assets are legally owned by them and arenot available to GM Financial's creditors.
The following table summarizes the assets and liabilities related to GM Financial's consolidated VIEs:
June 30, 2021 December 31, 2020
Restricted cash – current $ 3,191 $ 2,190 Restricted cash – non-current $ 476 $ 449 GM Financial receivables, net of fees – current $ 13,726 $ 17,211 GM Financial receivables, net of fees – non-current $ 14,141 $ 15,107 GM Financial equipment on operating leases, net $ 17,413 $ 16,322 GM Financial short-term debt and current portion of long-term debt $ 18,090 $ 20,450 GM Financial long-term debt $ 20,511 $ 18,974
GM Financial recognizes finance charge, leased vehicle and fee income on the Securitized Assets and interest expense on the secured debt issued in asecuritization transaction and records a provision for loan losses to recognize loan losses expected over the remaining life of the finance receivables.
Nonconsolidated VIEs
Automotive
Nonconsolidated VIEs principally include automotive related operating entities to which we provided financial support to ensure that our supply needs forproduction are met or are not disrupted. Our variable interests in these nonconsolidated VIEs include equity investments, accounts and loans receivable,committed financial support and other off-balance sheet arrangements. The carrying amounts of assets and liabilities related to our nonconsolidated VIEswere insignificant at June 30, 2021 and December 31, 2020. Our maximum exposure to loss as a result of our involvement with these VIEs was $2.2 billionand $1.2 billion, inclusive of $1.5 billion and $776 million in committed capital contributions to Ultium Cells LLC at June 30, 2021 and December 31,2020. We currently lack the power through voting or similar rights to direct the activities of these entities that most significantly affect their economicperformance.
13
Table of ContentsGENERAL MOTORS COMPANY AND SUBSIDIARIES
NOTES TO CONDENSED CONSOLIDATED FINANCIAL STATEMENTS —— (Continued)
Note 9. Debt
Automotive The following table presents debt in our automotive operations:
June 30, 2021 December 31, 2020Carrying Amount Fair Value Carrying Amount Fair Value
Fair value utilizing Level 1 inputs $ 19,811 $ 19,826 Fair value utilizing Level 2 inputs $ 1,558 $ 1,750 Available under credit facility agreements(b) $ 17,189 $ 18,222 Weighted-average interest rate on outstanding short-term debt(c) 3.0 % 3.8 %Weighted-average interest rate on outstanding long-term debt(c) 5.7 % 5.6 %
__________(a) Includes net discount and debt issuance costs of $545 million and $540 million at June 30, 2021 and December 31, 2020.(b) Excludes our 364-day, $2.0 billion facility allocated for exclusive use by GM Financial.(c) Includes coupon rates on debt denominated in various foreign currencies and interest free loans.
Unsecured debt primarily consists of senior notes. In April 2021, we increased the total borrowing capacity of our five-year, $10.5 billion facility to$11.2 billion and extended the termination date for a $9.9 billion portion of the five-year facility by three years, now set to mature on April 18, 2026. Thetermination date of April 18, 2023 for the remaining portion of the five-year facility remains unchanged. We also renewed and increased the total borrowingcapacity of our three-year, $4.0 billion facility to $4.3 billion, which now matures on April 7, 2024, and renewed our 364-day, $2.0 billion facility allocatedfor exclusive use by GM Financial, which now matures on April 6, 2022. We also terminated our 364-day, $2.0 billion revolving credit facility, entered intoin May 2020. Additionally, the prior restrictions on share repurchases and dividends on our common shares were removed upon entrance into the renewedthree-year, $4.3 billion facility.
GM Financial The following table presents debt of GM Financial:
June 30, 2021 December 31, 2020Carrying Amount Fair Value Carrying Amount Fair Value
Fair value utilizing Level 2 inputs $ 93,907 $ 92,922 Fair value utilizing Level 3 inputs $ 1,860 $ 2,026
Secured debt consists of revolving credit facilities and securitization notes payable. Most of the secured debt was issued by VIEs and is repayable onlyfrom proceeds related to the underlying pledged assets. Refer to Note 8 to our condensed consolidated financial statements for additional information onGM Financial's involvement with VIEs. In the six months ended June 30, 2021, GM Financial renewed revolving credit facilities with total borrowingcapacity of $18.7 billion and issued $13.4 billion in aggregate principal amount of securitization notes payable with an initial weighted average interest rateof 0.75% and maturity dates ranging from 2022 to 2028.
Unsecured debt consists of senior notes, credit facilities and other unsecured debt. In the six months ended June 30, 2021, GM Financial issued $8.3billion in aggregate principal amount of senior notes with an initial weighted average interest rate of 1.65% and maturity dates ranging from 2024 to 2031.
14
Table of ContentsGENERAL MOTORS COMPANY AND SUBSIDIARIES
NOTES TO CONDENSED CONSOLIDATED FINANCIAL STATEMENTS —— (Continued)
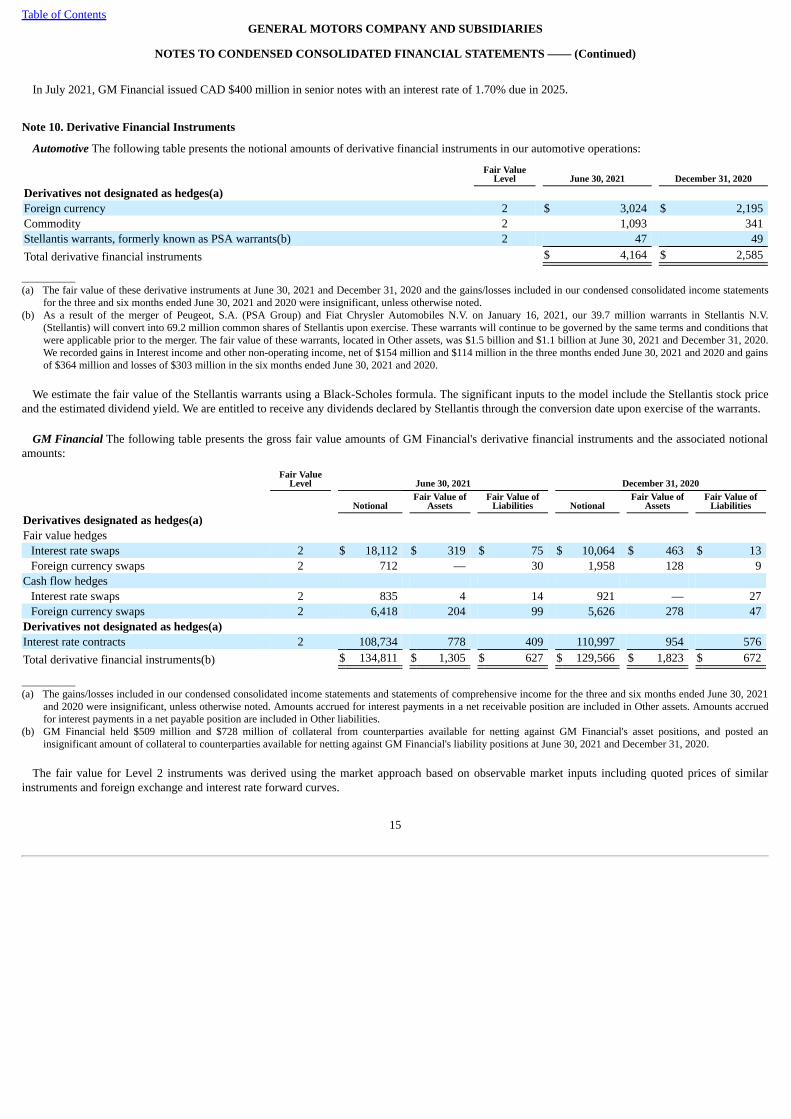
In July 2021, GM Financial issued CAD $400 million in senior notes with an interest rate of 1.70% due in 2025.
Note 10. Derivative Financial Instruments
Automotive The following table presents the notional amounts of derivative financial instruments in our automotive operations:
Fair ValueLevel June 30, 2021 December 31, 2020
Derivatives not designated as hedges(a)Foreign currency 2 $ 3,024 $ 2,195 Commodity 2 1,093 341 Stellantis warrants, formerly known as PSA warrants(b) 2 47 49 Total derivative financial instruments $ 4,164 $ 2,585
__________(a) The fair value of these derivative instruments at June 30, 2021 and December 31, 2020 and the gains/losses included in our condensed consolidated income statements
for the three and six months ended June 30, 2021 and 2020 were insignificant, unless otherwise noted.(b) As a result of the merger of Peugeot, S.A. (PSA Group) and Fiat Chrysler Automobiles N.V. on January 16, 2021, our 39.7 million warrants in Stellantis N.V.
(Stellantis) will convert into 69.2 million common shares of Stellantis upon exercise. These warrants will continue to be governed by the same terms and conditions thatwere applicable prior to the merger. The fair value of these warrants, located in Other assets, was $1.5 billion and $1.1 billion at June 30, 2021 and December 31, 2020.We recorded gains in Interest income and other non-operating income, net of $154 million and $114 million in the three months ended June 30, 2021 and 2020 and gainsof $364 million and losses of $303 million in the six months ended June 30, 2021 and 2020.
We estimate the fair value of the Stellantis warrants using a Black-Scholes formula. The significant inputs to the model include the Stellantis stock priceand the estimated dividend yield. We are entitled to receive any dividends declared by Stellantis through the conversion date upon exercise of the warrants.
GM Financial The following table presents the gross fair value amounts of GM Financial's derivative financial instruments and the associated notionalamounts:
Fair ValueLevel June 30, 2021 December 31, 2020
NotionalFair Value of
AssetsFair Value of
Liabilities NotionalFair Value of
AssetsFair Value of
LiabilitiesDerivatives designated as hedges(a)Fair value hedges
Derivatives not designated as hedges(a)Interest rate contracts 2 108,734 778 409 110,997 954 576 Total derivative financial instruments(b) $ 134,811 $ 1,305 $ 627 $ 129,566 $ 1,823 $ 672
__________(a) The gains/losses included in our condensed consolidated income statements and statements of comprehensive income for the three and six months ended June 30, 2021
and 2020 were insignificant, unless otherwise noted. Amounts accrued for interest payments in a net receivable position are included in Other assets. Amounts accruedfor interest payments in a net payable position are included in Other liabilities.
(b) GM Financial held $509 million and $728 million of collateral from counterparties available for netting against GM Financial's asset positions, and posted aninsignificant amount of collateral to counterparties available for netting against GM Financial's liability positions at June 30, 2021 and December 31, 2020.
The fair value for Level 2 instruments was derived using the market approach based on observable market inputs including quoted prices of similarinstruments and foreign exchange and interest rate forward curves.
15
Table of ContentsGENERAL MOTORS COMPANY AND SUBSIDIARIES
NOTES TO CONDENSED CONSOLIDATED FINANCIAL STATEMENTS —— (Continued)
The following amounts were recorded in the condensed consolidated balance sheets related to items designated and qualifying as hedged items in fairvalue hedging relationships:
June 30, 2021 December 31, 2020Carrying Amount of Hedged
__________(a) Includes $223 million and $200 million of unamortized gains remaining on hedged items for which hedge accounting has been discontinued at June 30, 2021 and
December 31, 2020.
Note 11. Accrued and Other LiabilitiesJune 30, 2021 December 31, 2020
Accrued liabilitiesDealer and customer allowances, claims and discounts $ 4,359 $ 7,300 Deferred revenue 2,660 3,132 Product warranty and related liabilities 3,339 3,048 Payrolls and employee benefits excluding postemployment benefits 1,732 1,864 Other 7,100 7,725 Total accrued liabilities $ 19,190 $ 23,069
Other liabilitiesDeferred revenue $ 3,156 $ 2,715 Product warranty and related liabilities 5,841 5,193 Operating lease liabilities 979 969 Employee benefits excluding postemployment benefits 818 822 Postemployment benefits including facility idling reserves 777 739 Other 3,081 3,009 Total other liabilities $ 14,652 $ 13,447
Three Months Ended Six Months EndedJune 30, 2021 June 30, 2020 June 30, 2021 June 30, 2020
Product Warranty and Related LiabilitiesWarranty balance at beginning of period $ 8,077 $ 7,398 $ 8,242 $ 7,798 Warranties issued and assumed in period – recall campaigns 1,328 41 1,449 158 Warranties issued and assumed in period – product warranty 463 220 905 718 Payments (786) (652) (1,519) (1,533)Adjustments to pre-existing warranties 81 (1) 92 (20)Effect of foreign currency and other 17 34 11 (81)Warranty balance at end of period $ 9,180 $ 7,040 $ 9,180 $ 7,040
In the three months ended June 30, 2021, we recorded warranty recall campaign accruals of $1.3 billion, of which $812 million relates to the ChevroletBolt EV. We estimate our reasonably possible loss in excess of amounts accrued for recall campaigns to be insignificant at June 30, 2021. Refer to Note 13to our condensed consolidated financial statements for more details on the Chevrolet Bolt EV recall and Takata Corporation (Takata) matters.
16
Table of ContentsGENERAL MOTORS COMPANY AND SUBSIDIARIES
NOTES TO CONDENSED CONSOLIDATED FINANCIAL STATEMENTS —— (Continued)
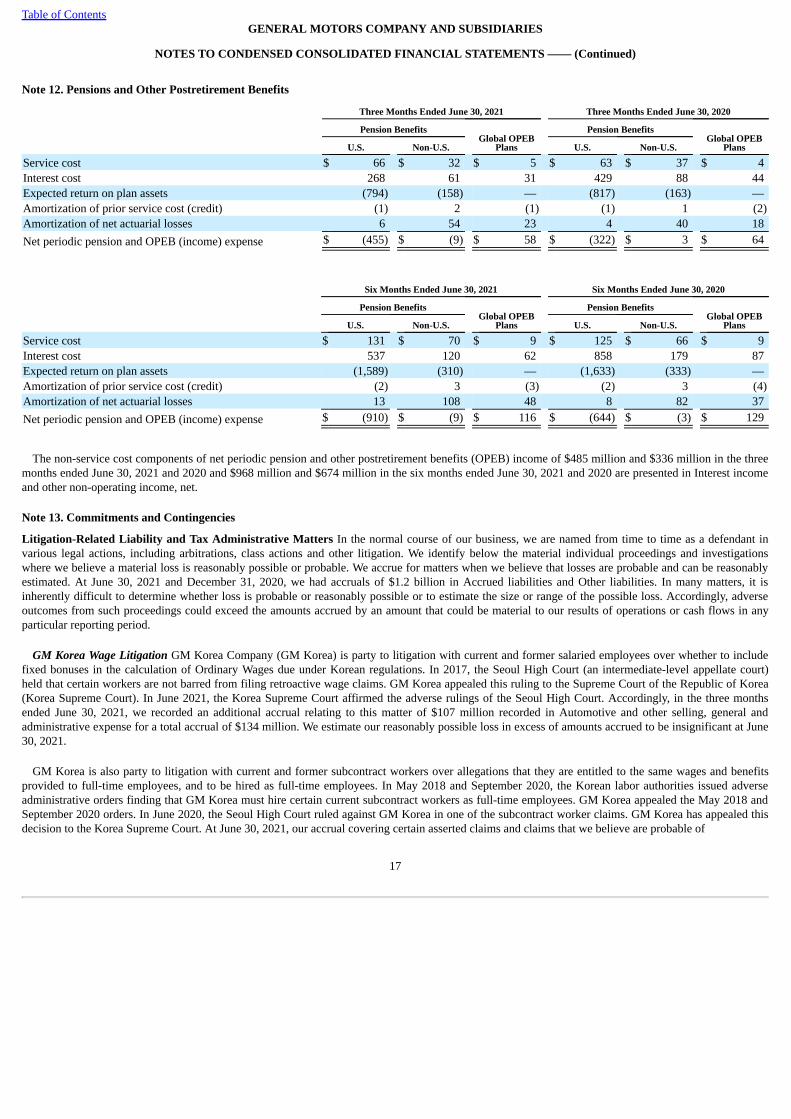
Note 12. Pensions and Other Postretirement Benefits
Three Months Ended June 30, 2021 Three Months Ended June 30, 2020
Pension BenefitsGlobal OPEB
Plans
Pension BenefitsGlobal OPEB
PlansU.S. Non-U.S. U.S. Non-U.S.
Service cost $ 66 $ 32 $ 5 $ 63 $ 37 $ 4 Interest cost 268 61 31 429 88 44 Expected return on plan assets (794) (158) — (817) (163) — Amortization of prior service cost (credit) (1) 2 (1) (1) 1 (2)Amortization of net actuarial losses 6 54 23 4 40 18 Net periodic pension and OPEB (income) expense $ (455) $ (9) $ 58 $ (322) $ 3 $ 64
Six Months Ended June 30, 2021 Six Months Ended June 30, 2020
Pension BenefitsGlobal OPEB
Plans
Pension BenefitsGlobal OPEB
PlansU.S. Non-U.S. U.S. Non-U.S.
Service cost $ 131 $ 70 $ 9 $ 125 $ 66 $ 9 Interest cost 537 120 62 858 179 87 Expected return on plan assets (1,589) (310) — (1,633) (333) — Amortization of prior service cost (credit) (2) 3 (3) (2) 3 (4)Amortization of net actuarial losses 13 108 48 8 82 37 Net periodic pension and OPEB (income) expense $ (910) $ (9) $ 116 $ (644) $ (3) $ 129
The non-service cost components of net periodic pension and other postretirement benefits (OPEB) income of $485 million and $336 million in the threemonths ended June 30, 2021 and 2020 and $968 million and $674 million in the six months ended June 30, 2021 and 2020 are presented in Interest incomeand other non-operating income, net.
Note 13. Commitments and Contingencies
Litigation-Related Liability and Tax Administrative Matters In the normal course of our business, we are named from time to time as a defendant invarious legal actions, including arbitrations, class actions and other litigation. We identify below the material individual proceedings and investigationswhere we believe a material loss is reasonably possible or probable. We accrue for matters when we believe that losses are probable and can be reasonablyestimated. At June 30, 2021 and December 31, 2020, we had accruals of $1.2 billion in Accrued liabilities and Other liabilities. In many matters, it isinherently difficult to determine whether loss is probable or reasonably possible or to estimate the size or range of the possible loss. Accordingly, adverseoutcomes from such proceedings could exceed the amounts accrued by an amount that could be material to our results of operations or cash flows in anyparticular reporting period.
GM Korea Wage Litigation GM Korea Company (GM Korea) is party to litigation with current and former salaried employees over whether to includefixed bonuses in the calculation of Ordinary Wages due under Korean regulations. In 2017, the Seoul High Court (an intermediate-level appellate court)held that certain workers are not barred from filing retroactive wage claims. GM Korea appealed this ruling to the Supreme Court of the Republic of Korea(Korea Supreme Court). In June 2021, the Korea Supreme Court affirmed the adverse rulings of the Seoul High Court. Accordingly, in the three monthsended June 30, 2021, we recorded an additional accrual relating to this matter of $107 million recorded in Automotive and other selling, general andadministrative expense for a total accrual of $134 million. We estimate our reasonably possible loss in excess of amounts accrued to be insignificant at June30, 2021.
GM Korea is also party to litigation with current and former subcontract workers over allegations that they are entitled to the same wages and benefitsprovided to full-time employees, and to be hired as full-time employees. In May 2018 and September 2020, the Korean labor authorities issued adverseadministrative orders finding that GM Korea must hire certain current subcontract workers as full-time employees. GM Korea appealed the May 2018 andSeptember 2020 orders. In June 2020, the Seoul High Court ruled against GM Korea in one of the subcontract worker claims. GM Korea has appealed thisdecision to the Korea Supreme Court. At June 30, 2021, our accrual covering certain asserted claims and claims that we believe are probable of
17
Table of ContentsGENERAL MOTORS COMPANY AND SUBSIDIARIES
NOTES TO CONDENSED CONSOLIDATED FINANCIAL STATEMENTS —— (Continued)
assertion and for which liability is probable was approximately $260 million. We estimate the reasonably possible loss in excess of amounts accrued forother current subcontract workers who may assert similar claims to be approximately $120 million at June 30, 2021. We are currently unable to estimate anypossible loss or range of loss that may result from additional claims that may be asserted by former subcontract workers.
GM Brazil Indirect Tax Claim In 2019, the Superior Court of Brazil rendered favorable decisions on three cases brought by GM Brazil that granted theCompany the right to recover certain tax overpayments collected by the government. As a result, GM Brazil recorded pre-tax recoveries of $1.4 billion inthe year ended December 31, 2019. GM Brazil is currently realizing those recoveries as there are federal tax liabilities eligible for offset. In May 2021, theBrazilian Supreme Court decided a Motion of Clarification filed by the Brazilian IRS in a related case that confirmed GM Brazil's right to recover the taxoverpayments retroactively. It is possible that the Brazilian IRS will file challenges to some of the tax recoveries recognized by GM Brazil. We expect otherthird parties will file claims asserting entitlement to some or all of the tax recoveries awarded and recognized by GM Brazil, and GM intends to defendagainst any such claims.
Other Litigation-Related Liability and Tax Administrative Matters Various other legal actions, including class actions, governmental investigations,claims and proceedings are pending against us or our related companies or joint ventures, including matters arising out of alleged product defects;employment-related matters; product and workplace safety, vehicle emissions and fuel economy regulations; product warranties; financial services; dealer,supplier and other contractual relationships; government regulations relating to competition issues; tax-related matters not subject to the provision ofAccounting Standards Codification 740, "Income Taxes" (indirect tax-related matters); product design, manufacture and performance; consumer protectionlaws; and environmental protection laws, including laws regulating air emissions, water discharges, waste management and environmental remediation fromstationary sources.
There are several putative class actions pending against GM in federal courts in the U.S. and in the Provincial Courts in Canada alleging that variousvehicles sold, including model year 2011-2016 Duramax Diesel Chevrolet Silverado and GMC Sierra vehicles, violate federal, state and foreign emissionstandards. We are unable to estimate any reasonably possible loss or range of loss that may result from these actions. GM has also faced a series ofadditional lawsuits in the U.S. based on these allegations, including putative shareholder class actions claiming violations of federal securities law and ashareholder demand lawsuit. The securities lawsuits have been voluntarily dismissed by the plaintiffs in those actions.
We believe that appropriate accruals have been established for losses that are probable and can be reasonably estimated. It is possible that the resolution ofone or more of these matters could exceed the amounts accrued in an amount that could be material to our results of operations. We also from time to timereceive subpoenas and other inquiries or requests for information from agencies or other representatives of U.S. federal, state and foreign governments on avariety of issues.
Indirect tax-related matters are being litigated globally pertaining to value added taxes, customs, duties, sales, property taxes and other non-income taxrelated tax exposures. The various non-U.S. labor-related matters include claims from current and former employees related to alleged unpaid wage, benefit,severance and other compensation matters. Certain administrative proceedings are indirect tax-related and may require that we deposit funds in escrow orprovide an alternative form of security. Some of the matters may involve compensatory, punitive or other treble damage claims, environmental remediationprograms or sanctions that, if granted, could require us to pay damages or make other expenditures in amounts that could not be reasonably estimated atJune 30, 2021. We believe that appropriate accruals have been established for losses that are probable and can be reasonably estimated. For indirect tax-related matters we estimate our reasonably possible loss in excess of amounts accrued to be up to approximately $900 million at June 30, 2021.
Takata Matters In November 2020, the National Highway Traffic Safety Administration (NHTSA) directed that we replace the airbag inflators in ourGMT900 vehicles, which are full-size pickup trucks and sport utility vehicles (SUVs), and we decided not to contest NHTSA's decision. While we havealready begun the process of executing the recall, given the number of vehicles in this population, the recall will take several years to be completed.Accordingly, in the year ended December 31, 2020, we recorded a warranty accrual of $1.1 billion for the expected costs of complying with the recallremedy, and we believe the currently accrued amount remains reasonable.
GM has recalled certain vehicles sold outside of the U.S. to replace Takata inflators in those vehicles. There are significant differences in vehicle andinflator design between the relevant vehicles sold internationally and those sold in the U.S. We continue to gather and analyze evidence about these inflatorsand to share our findings with regulators. Any additional recalls relating to these inflators could be material to our results of operations and cash flows.
18
Table of ContentsGENERAL MOTORS COMPANY AND SUBSIDIARIES
NOTES TO CONDENSED CONSOLIDATED FINANCIAL STATEMENTS —— (Continued)
There are several putative class actions that have been filed against GM, including in the federal courts in the U.S., in the Provincial Courts in Canada,and in Mexico and Israel, arising out of allegations that airbag inflators manufactured by Takata are defective. At this stage of these proceedings, we areunable to provide an estimate of the amounts or range of possible loss.
Chevrolet Bolt EV Recall In November 2020, GM voluntarily recalled certain 2017-2019 model-year Chevrolet Bolt EVs that were built with high-voltagebatteries that may pose a risk of fire. To mitigate this risk, GM’s original recall remedy involved (a) performing diagnostic procedures to identify andreplace potentially defective battery cell-module assemblies and (b) installing onboard-diagnostic software designed to detect and warn owners regardingpotential issues related to changes in battery-module performance over time. The cost of this initial remedy was not material.
However, based on a recent field incident involving a battery fire in a vehicle that received the recall remedy, we have determined that the simultaneouspresence of two manufacturing defects in the same battery cell can cause battery fires in certain of these Bolt vehicles. As a result, in July 2021, we initiateda new voluntary recall to replace the lithium ion battery modules in the recall population. Accordingly, in the three months ended June 30, 2021, werecorded a warranty accrual of $812 million, which reflects our current best estimate for the cost of the recall remedy. We are pursuing commitments fromour supplier on reimbursement for the financial costs of this field action.
In addition, putative class actions have been filed against GM in federal courts in the U.S. and in the Provincial Courts in Canada alleging that thebatteries contained in the Bolt EVs included in the recall population are defective. At this stage of these proceedings, we are unable to provide an estimateof the amounts or range of possible loss.
Opel/Vauxhall Sale In 2017, we sold the Opel and Vauxhall businesses and certain other assets in Europe (the Opel/Vauxhall Business) to PSA Group (nowStellantis) under a Master Agreement (the Agreement). We also sold the European financing subsidiaries and branches (the Fincos, and together with theOpel/Vauxhall Business, the European Business) to Banque PSA Finance S.A. and BNP Paribas Personal Finance S.A. Although the sale reduced our newvehicle presence in Europe, we may still be impacted by actions taken by regulators related to vehicles sold before the sale. Our wholly owned subsidiary(the Seller) agreed to indemnify Stellantis for certain losses resulting from any inaccuracy of the representations and warranties or breaches of our covenantsincluded in the Agreement and for certain other liabilities, including certain emissions and product liabilities. The Company entered into a guarantee for thebenefit of Stellantis and pursuant to which the Company agreed to guarantee the Seller's obligation to indemnify Stellantis. Certain of these indemnificationobligations are subject to time limitations, thresholds and/or caps as to the amount of required payments.
Product Liability We recorded liabilities of $611 million and $589 million in Accrued liabilities and Other liabilities at June 30, 2021 and December 31,2020 for the expected cost of all known product liability claims, plus an estimate of the expected cost for product liability claims that have already beenincurred and are expected to be filed in the future for which we are self-insured. It is reasonably possible that our accruals for product liability claims mayincrease in future periods in material amounts, although we cannot estimate a reasonable range of incremental loss based on currently available information.We believe that any judgment against us involving our products for actual damages will be adequately covered by our recorded accruals and, whereapplicable, excess liability insurance coverage.
Guarantees We enter into indemnification agreements for liability claims involving products manufactured primarily by certain joint ventures. Theseguarantees terminate in years ranging from 2021 to 2026 or upon the occurrence of specific events or are ongoing. We believe that the related potential costsincurred are adequately covered by our recorded accruals, which are insignificant. The maximum future undiscounted payments mainly based on vehiclessold to date were $3.4 billion and $3.1 billion for these guarantees at June 30, 2021 and December 31, 2020, the majority of which relates to theindemnification agreements.
We provide payment guarantees on commercial loans outstanding with third parties such as dealers. In some instances, certain assets of the party or ourpayables to the party whose debt or performance we have guaranteed may offset, to some degree, the amount of any potential future payments. We are alsoexposed to residual value guarantees associated with certain sales to rental car companies.
We periodically enter into agreements that incorporate indemnification provisions in the normal course of business. It is not possible to estimate ourmaximum exposure under these indemnifications or guarantees due to the conditional nature of these obligations. Insignificant amounts have been recordedfor such obligations as the majority of them are not probable or estimable at this time and the fair value of the guarantees at issuance was insignificant.Refer to the Opel/Vauxhall Sale section of this note for additional information on our indemnification obligations to Stellantis under the Agreement.
19
Table of ContentsGENERAL MOTORS COMPANY AND SUBSIDIARIES
NOTES TO CONDENSED CONSOLIDATED FINANCIAL STATEMENTS —— (Continued)
Note 14. Income Taxes
For interim income tax reporting, we estimate our annual effective tax rate and apply it to our year-to-date ordinary income (loss). Tax jurisdictions with aprojected or year-to-date loss for which a tax benefit cannot be realized are excluded. The tax effects of unusual or infrequently occurring items, includingchanges in judgment about valuation allowances and effects of changes in tax laws or rates, are reported in the interim period in which they occur.
In the three months ended June 30, 2021, Income tax expense of $971 million was primarily due to tax expense attributable to entities included in oureffective tax rate calculation. In the three months ended June 30, 2020, Income tax benefit of $112 million was primarily due to tax benefit attributable toentities included in our effective tax rate calculation.
In the six months ended June 30, 2021, Income tax expense of $2.1 billion was primarily due to tax expense attributable to entities included in oureffective tax rate calculation and the establishment of a valuation allowance against Cruise deferred tax assets that are considered no longer realizable. In thesix months ended June 30, 2020, Income tax expense of $245 million on a pre-tax loss was primarily due to tax expense attributable to entities included inour effective tax rate calculation and the establishment of a valuation allowance against deferred tax assets.
In the six months ended June 30, 2021, Cruise issued new preferred shares to investors. As a result of the issuance in January 2021, Cruise fell below theownership threshold required for inclusion in our U.S. consolidated income tax returns, and we established a valuation allowance of $316 million againstdeferred tax assets. Refer to Note 16 to our condensed consolidated financial statements for additional information regarding the Cruise preferred stockissuance.
At June 30, 2021, we had $21.7 billion of net deferred tax assets consisting of net operating losses and income tax credits, capitalized researchexpenditures and other timing differences that are available to offset future income tax liabilities, partially offset by valuation allowances.
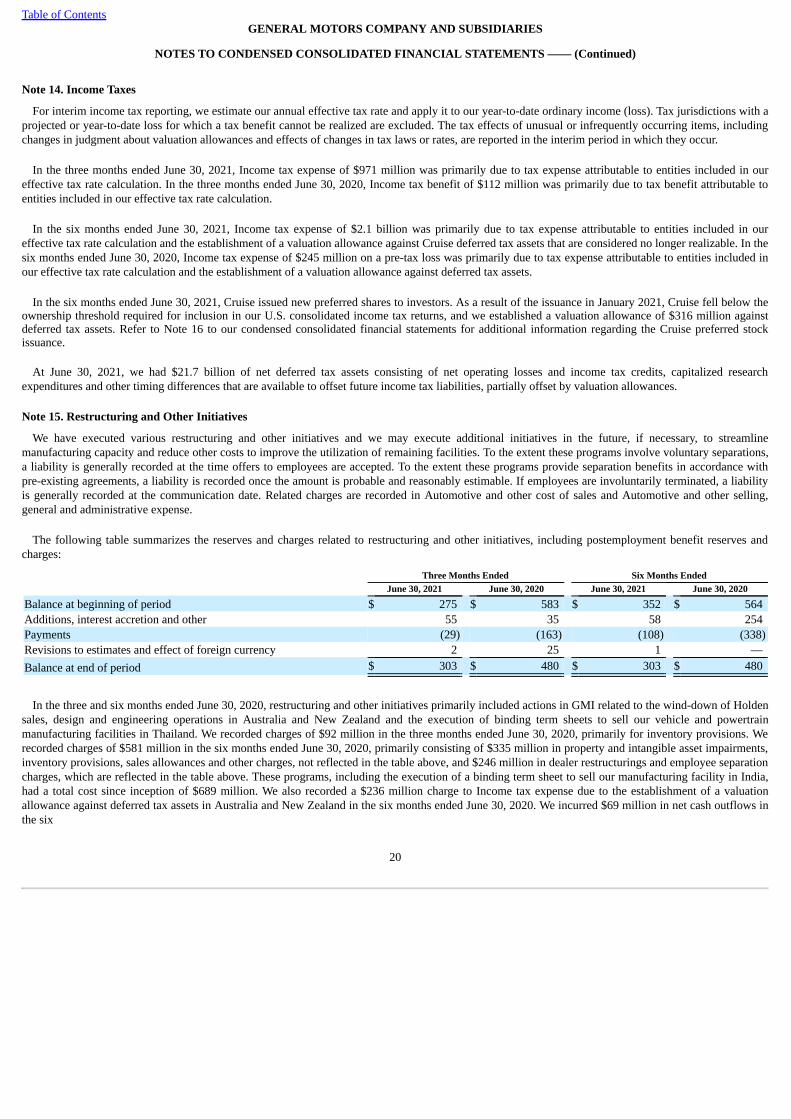
Note 15. Restructuring and Other Initiatives
We have executed various restructuring and other initiatives and we may execute additional initiatives in the future, if necessary, to streamlinemanufacturing capacity and reduce other costs to improve the utilization of remaining facilities. To the extent these programs involve voluntary separations,a liability is generally recorded at the time offers to employees are accepted. To the extent these programs provide separation benefits in accordance withpre-existing agreements, a liability is recorded once the amount is probable and reasonably estimable. If employees are involuntarily terminated, a liabilityis generally recorded at the communication date. Related charges are recorded in Automotive and other cost of sales and Automotive and other selling,general and administrative expense.
The following table summarizes the reserves and charges related to restructuring and other initiatives, including postemployment benefit reserves andcharges:
Three Months Ended Six Months EndedJune 30, 2021 June 30, 2020 June 30, 2021 June 30, 2020
Balance at beginning of period $ 275 $ 583 $ 352 $ 564 Additions, interest accretion and other 55 35 58 254 Payments (29) (163) (108) (338)Revisions to estimates and effect of foreign currency 2 25 1 — Balance at end of period $ 303 $ 480 $ 303 $ 480
In the three and six months ended June 30, 2020, restructuring and other initiatives primarily included actions in GMI related to the wind-down of Holdensales, design and engineering operations in Australia and New Zealand and the execution of binding term sheets to sell our vehicle and powertrainmanufacturing facilities in Thailand. We recorded charges of $92 million in the three months ended June 30, 2020, primarily for inventory provisions. Werecorded charges of $581 million in the six months ended June 30, 2020, primarily consisting of $335 million in property and intangible asset impairments,inventory provisions, sales allowances and other charges, not reflected in the table above, and $246 million in dealer restructurings and employee separationcharges, which are reflected in the table above. These programs, including the execution of a binding term sheet to sell our manufacturing facility in India,had a total cost since inception of $689 million. We also recorded a $236 million charge to Income tax expense due to the establishment of a valuationallowance against deferred tax assets in Australia and New Zealand in the six months ended June 30, 2020. We incurred $69 million in net cash outflows inthe six
20
Table of ContentsGENERAL MOTORS COMPANY AND SUBSIDIARIES
NOTES TO CONDENSED CONSOLIDATED FINANCIAL STATEMENTS —— (Continued)
months ended June 30, 2020 resulting from these restructuring actions, primarily for sales allowances payments and dealer restructuring payments, and$227 million in net cash outflows since program inception, primarily for dealer restructuring payments and employee separation payments, which includesproceeds of $143 million from the sale of our manufacturing facilities in Thailand.
Note 16. Stockholders' Equity and Noncontrolling Interests
We have 2.0 billion shares of preferred stock and 5.0 billion shares of common stock authorized for issuance. We had no shares of preferred stock issuedand outstanding at June 30, 2021 and December 31, 2020. We had 1.5 billion and 1.4 billion shares of common stock issued and outstanding at June 30,2021 and December 31, 2020.
Cruise Preferred Shares In the six months ended June 30, 2021, GM Cruise Holdings LLC (Cruise Holdings) issued $2.7 billion of Class G PreferredShares (Cruise Class G Preferred Shares) to Microsoft Corporation (Microsoft), Walmart Inc. (Walmart) and other investors, including $1.0 billion toGeneral Motors Holdings LLC. All proceeds related to the Cruise Class G Preferred Shares are designated exclusively for working capital and generalcorporate purposes of Cruise Holdings. In addition, we, Cruise Holdings and Microsoft entered into a long-term strategic relationship to accelerate thecommercialization of self-driving vehicles with Microsoft being the preferred public cloud provider.
The Cruise Class G Preferred Shares participate pari passu with holders of Cruise Holdings common stock and Class F Preferred Shares (Cruise Class FPreferred Shares) in any dividends declared. Each Cruise Class G Preferred Share is entitled to one vote per Cruise Class G Preferred Share on all matterssubmitted for vote by or consent of the Cruise Holdings members. The holders of Cruise Class G Preferred Shares are restricted from transferring the CruiseClass G Preferred Shares for four years, without the written consent of both us and Cruise Holdings' Board of Directors. The Cruise Class G PreferredShares convert into the class of shares to be issued to the public in an initial public offering (IPO) at specified exchange ratios. No covenants or other eventsof default exist that can trigger redemption of the Cruise Class G Preferred Shares. The Cruise Class G Preferred Shares are entitled to receive the greater oftheir carrying value or a pro-rata share of any proceeds or distributions upon the occurrence of a merger, sale, liquidation or dissolution of Cruise Holdings,and are classified as noncontrolling interests in our condensed consolidated financial statements.
Consistent with the Cruise Class G Preferred Shares, the Class A-1 Preferred Shares issued to SoftBank in 2018 (Cruise Class A-1 Preferred Shares) andCruise Class F Preferred Shares convert into the class of shares to be issued to the public in an IPO at specified exchange ratios. Beginning on June 28,2025, SoftBank has the option to convert all of the Cruise Class A-1 Preferred Shares into our common stock at a conversion ratio that is indexed to the fairvalue of Cruise Holdings at the time of conversion. In the event SoftBank exercises such option, we have the option to settle the conversion feature with ourcommon shares or cash, and in certain situations with nonredeemable, nonconvertible preferred shares. The Cruise Class A-1 Preferred Shares and CruiseClass F Preferred Shares are entitled to receive the greater of their carrying value or a pro-rata share of any proceeds or distributions upon the occurrence ofa merger, sale, liquidation, or dissolution of Cruise Holdings.
21
Table of ContentsGENERAL MOTORS COMPANY AND SUBSIDIARIES
NOTES TO CONDENSED CONSOLIDATED FINANCIAL STATEMENTS —— (Continued)
The following table summarizes the significant components of Accumulated other comprehensive loss:
Three Months Ended Six Months EndedJune 30, 2021 June 30, 2020 June 30, 2021 June 30, 2020
Foreign Currency Translation AdjustmentsBalance at beginning of period $ (2,759) $ (3,091) $ (2,735) $ (2,277)Other comprehensive income (loss) and noncontrolling interests, net of
reclassification adjustment and tax(a)(b) 314 (101) 290 (915)Balance at end of period $ (2,445) $ (3,192) $ (2,445) $ (3,192)
Defined Benefit PlansBalance at beginning of period $ (10,494) $ (8,540) $ (10,654) $ (8,857)Other comprehensive income (loss) before reclassification adjustment,
net of tax(b) (48) (97) 38 166 Reclassification adjustment, net of tax(b) 76 58 150 112 Other comprehensive income (loss), net of tax(b) 28 (39) 188 278 Balance at end of period(c) $ (10,466) $ (8,579) $ (10,466) $ (8,579)
__________(a) The noncontrolling interests and reclassification adjustment were insignificant in the three and six months ended June 30, 2021 and 2020.(b) The income tax effect was insignificant in the three and six months ended June 30, 2021 and 2020.(c) Primarily consists of unamortized actuarial loss on our defined benefit plans. Refer to Note 2. Significant Accounting Policies of our 2020 Form 10-K for additional
information.
22
Table of ContentsGENERAL MOTORS COMPANY AND SUBSIDIARIES
NOTES TO CONDENSED CONSOLIDATED FINANCIAL STATEMENTS —— (Continued)
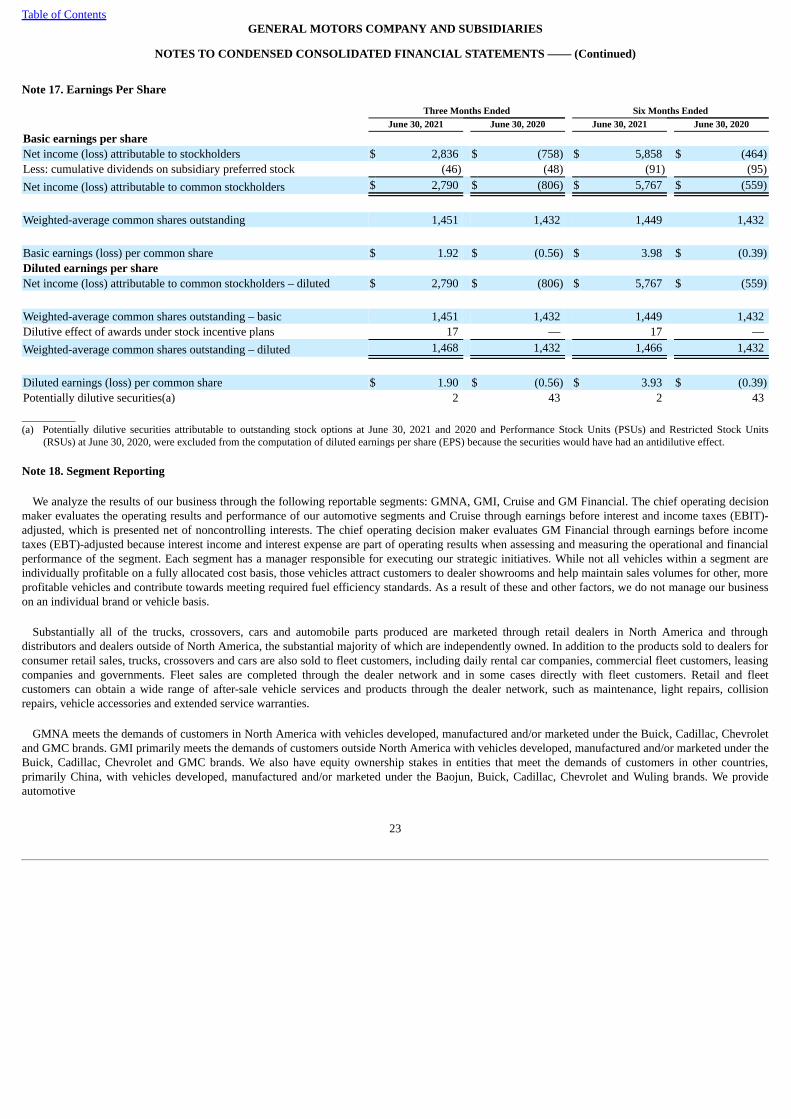
Note 17. Earnings Per Share
Three Months Ended Six Months EndedJune 30, 2021 June 30, 2020 June 30, 2021 June 30, 2020
Basic earnings per shareNet income (loss) attributable to stockholders $ 2,836 $ (758) $ 5,858 $ (464)Less: cumulative dividends on subsidiary preferred stock (46) (48) (91) (95)Net income (loss) attributable to common stockholders $ 2,790 $ (806) $ 5,767 $ (559)
Weighted-average common shares outstanding 1,451 1,432 1,449 1,432
Basic earnings (loss) per common share $ 1.92 $ (0.56) $ 3.98 $ (0.39)Diluted earnings per shareNet income (loss) attributable to common stockholders – diluted $ 2,790 $ (806) $ 5,767 $ (559)
Weighted-average common shares outstanding – basic 1,451 1,432 1,449 1,432 Dilutive effect of awards under stock incentive plans 17 — 17 — Weighted-average common shares outstanding – diluted 1,468 1,432 1,466 1,432
Diluted earnings (loss) per common share $ 1.90 $ (0.56) $ 3.93 $ (0.39)Potentially dilutive securities(a) 2 43 2 43 __________(a) Potentially dilutive securities attributable to outstanding stock options at June 30, 2021 and 2020 and Performance Stock Units (PSUs) and Restricted Stock Units
(RSUs) at June 30, 2020, were excluded from the computation of diluted earnings per share (EPS) because the securities would have had an antidilutive effect.
Note 18. Segment Reporting
We analyze the results of our business through the following reportable segments: GMNA, GMI, Cruise and GM Financial. The chief operating decisionmaker evaluates the operating results and performance of our automotive segments and Cruise through earnings before interest and income taxes (EBIT)-adjusted, which is presented net of noncontrolling interests. The chief operating decision maker evaluates GM Financial through earnings before incometaxes (EBT)-adjusted because interest income and interest expense are part of operating results when assessing and measuring the operational and financialperformance of the segment. Each segment has a manager responsible for executing our strategic initiatives. While not all vehicles within a segment areindividually profitable on a fully allocated cost basis, those vehicles attract customers to dealer showrooms and help maintain sales volumes for other, moreprofitable vehicles and contribute towards meeting required fuel efficiency standards. As a result of these and other factors, we do not manage our businesson an individual brand or vehicle basis.
Substantially all of the trucks, crossovers, cars and automobile parts produced are marketed through retail dealers in North America and throughdistributors and dealers outside of North America, the substantial majority of which are independently owned. In addition to the products sold to dealers forconsumer retail sales, trucks, crossovers and cars are also sold to fleet customers, including daily rental car companies, commercial fleet customers, leasingcompanies and governments. Fleet sales are completed through the dealer network and in some cases directly with fleet customers. Retail and fleetcustomers can obtain a wide range of after-sale vehicle services and products through the dealer network, such as maintenance, light repairs, collisionrepairs, vehicle accessories and extended service warranties.
GMNA meets the demands of customers in North America with vehicles developed, manufactured and/or marketed under the Buick, Cadillac, Chevroletand GMC brands. GMI primarily meets the demands of customers outside North America with vehicles developed, manufactured and/or marketed under theBuick, Cadillac, Chevrolet and GMC brands. We also have equity ownership stakes in entities that meet the demands of customers in other countries,primarily China, with vehicles developed, manufactured and/or marketed under the Baojun, Buick, Cadillac, Chevrolet and Wuling brands. We provideautomotive
23
Table of ContentsGENERAL MOTORS COMPANY AND SUBSIDIARIES
NOTES TO CONDENSED CONSOLIDATED FINANCIAL STATEMENTS —— (Continued)
financing services through GM Financial. Cruise is our global segment responsible for the development and commercialization of autonomous vehicletechnology, and includes autonomous vehicle-related engineering and other costs.
Our automotive interest income and interest expense, legacy costs from the Opel/Vauxhall Business (primarily pension costs), corporate expenditures andcertain nonsegment-specific revenues and expenses are recorded centrally in Corporate. Corporate assets primarily consist of cash and cash equivalents,marketable debt securities, Stellantis warrants and intercompany balances. Retained net underfunded pension liabilities related to the European Business arealso recorded in Corporate. All intersegment balances and transactions have been eliminated in consolidation.
The following tables summarize key financial information by segment:
At and For the Three Months Ended June 30, 2021
GMNA GMI Corporate EliminationsTotal
Automotive CruiseGM
Financial Eliminations/Reclassifications TotalNet sales and revenue $ 27,932 $ 2,792 $ 21 $ 30,745 $ 25 $ 3,426 $ (29) $ 34,167 Earnings (loss) before interest and taxes-
__________(a) Consists of restructuring charges related to Cadillac dealer strategy in GMNA and an adjustment related to unique events associated with recent Korea Supreme Court decisions
related to our salaried workers in GMI.
24
Table of ContentsGENERAL MOTORS COMPANY AND SUBSIDIARIES
NOTES TO CONDENSED CONSOLIDATED FINANCIAL STATEMENTS —— (Continued)
At and For the Three Months Ended June 30, 2020
GMNA GMI Corporate EliminationsTotal
Automotive CruiseGM
Financial Eliminations/Reclassifications TotalNet sales and revenue $ 11,604 $ 1,677 $ 80 $ 13,361 $ 28 $ 3,423 $ (34) $ 16,778 Earnings (loss) before interest and taxes-
__________(a) Consists of restructuring charges related to Cadillac dealer strategy in GMNA and an adjustment related to unique events associated with recent Korea Supreme Court decisions
related to our salaried workers in GMI.
25
Table of ContentsGENERAL MOTORS COMPANY AND SUBSIDIARIES
NOTES TO CONDENSED CONSOLIDATED FINANCIAL STATEMENTS —— (Continued)
At and For the Six Months Ended June 30, 2020
GMNA GMI Corporate EliminationsTotal
Automotive CruiseGM
Financial Eliminations/Reclassifications TotalNet sales and revenue $ 37,435 $ 4,957 $ 118 $ 42,510 $ 53 $ 6,984 $ (60) $ 49,487 Earnings (loss) before interest and taxes-
(a) Consists of restructuring and other charges in Australia, New Zealand and Thailand.
26
Table of ContentsGENERAL MOTORS COMPANY AND SUBSIDIARIES
Item 2. Management’s Discussion and Analysis of Financial Condition and Results of Operations
Basis of Presentation This Management's Discussion and Analysis of Financial Condition and Results of Operations (MD&A) should be read inconjunction with the accompanying condensed consolidated financial statements and the notes thereto, and the audited consolidated financial statements andnotes thereto included in our 2020 Form 10-K.
Forward-looking statements in this MD&A are not guarantees of future performance and may involve risks and uncertainties that could cause actualresults to differ materially from those projected. Refer to the "Forward-Looking Statements" section of this MD&A and Part 1, Item 1A. Risk Factors of our2020 Form 10-K for a discussion of these risks and uncertainties. Except for per share amounts or as otherwise specified, dollar amounts presented withintables are stated in millions.
Non-GAAP Measures Our non-GAAP measures include: EBIT-adjusted, presented net of noncontrolling interests; EBT-adjusted for our GM Financialsegment; EPS-diluted-adjusted; effective tax rate-adjusted (ETR-adjusted); return on invested capital-adjusted (ROIC-adjusted) and adjusted automotivefree cash flow. Our calculation of these non-GAAP measures may not be comparable to similarly titled measures of other companies due to potentialdifferences between companies in the method of calculation. As a result, the use of these non-GAAP measures has limitations and should not be consideredsuperior to, in isolation from, or as a substitute for, related U.S. GAAP measures.
These non-GAAP measures allow management and investors to view operating trends, perform analytical comparisons and benchmark performancebetween periods and among geographic regions to understand operating performance without regard to items we do not consider a component of our coreoperating performance. Furthermore, these non-GAAP measures allow investors the opportunity to measure and monitor our performance against ourexternally communicated targets and evaluate the investment decisions being made by management to improve ROIC-adjusted. Management uses thesemeasures in its financial, investment and operational decision-making processes, for internal reporting and as part of its forecasting and budgetingprocesses. Further, our Board of Directors uses certain of these and other measures as key metrics to determine management performance under ourperformance-based compensation plans. For these reasons, we believe these non-GAAP measures are useful for our investors.
EBIT-adjusted EBIT-adjusted is presented net of noncontrolling interests and is used by management and can be used by investors to review ourconsolidated operating results because it excludes automotive interest income, automotive interest expense and income taxes as well as certain additionaladjustments that are not considered part of our core operations. Examples of adjustments to EBIT include, but are not limited to, impairment charges onlong-lived assets and other exit costs resulting from strategic shifts in our operations or discrete market and business conditions; costs arising from theignition switch recall and related legal matters; and certain currency devaluations associated with hyperinflationary economies. For EBIT-adjusted and ourother non-GAAP measures, once we have made an adjustment in the current period for an item, we will also adjust the related non-GAAP measure in anyfuture periods in which there is an impact from the item. Our corresponding measure for our GM Financial segment is EBT-adjusted because interestincome and interest expense are part of operating results when assessing and measuring the operational and financial performance of the segment.
EPS-diluted-adjusted EPS-diluted-adjusted is used by management and can be used by investors to review our consolidated diluted EPS results on aconsistent basis. EPS-diluted-adjusted is calculated as net income attributable to common stockholders-diluted less adjustments noted above for EBIT-adjusted and certain income tax adjustments divided by weighted-average common shares outstanding-diluted. Examples of income tax adjustments includethe establishment or reversal of significant deferred tax asset valuation allowances.
ETR-adjusted ETR-adjusted is used by management and can be used by investors to review the consolidated effective tax rate for our core operations ona consistent basis. ETR-adjusted is calculated as Income tax expense less the income tax related to the adjustments noted above for EBIT-adjusted and theincome tax adjustments noted above for EPS-diluted-adjusted divided by Income before income taxes less adjustments. When we provide an expectedadjusted effective tax rate, we do not provide an expected effective tax rate because the U.S. GAAP measure may include significant adjustments that aredifficult to predict.
ROIC-adjusted ROIC-adjusted is used by management and can be used by investors to review our investment and capital allocation decisions. We defineROIC-adjusted as EBIT-adjusted for the trailing four quarters divided by ROIC-adjusted average net assets, which is considered to be the average equitybalances adjusted for average automotive debt and interest liabilities, exclusive of finance leases; average automotive net pension and OPEB liabilities; andaverage automotive net income tax assets during the same period.
27
Table of ContentsGENERAL MOTORS COMPANY AND SUBSIDIARIES
Adjusted automotive free cash flow Adjusted automotive free cash flow is used by management and can be used by investors to review the liquidity ofour automotive operations and to measure and monitor our performance against our capital allocation program and evaluate our automotive liquidity againstthe substantial cash requirements of our automotive operations. We measure adjusted automotive free cash flow as automotive operating cash flow fromoperations less capital expenditures adjusted for management actions. Management actions can include voluntary events such as discretionary contributionsto employee benefit plans or nonrecurring specific events such as a closure of a facility that are considered special for EBIT-adjusted purposes. Refer to the"Liquidity and Capital Resources" section of this MD&A for additional information.
The following table reconciles Net income (loss) attributable to stockholders under U.S. GAAP to EBIT (loss)-adjusted:
Three Months EndedJune 30, March 31, December 31, September 30,
_________(a) This adjustment was excluded because of the unique events associated with recent Supreme Court of Korea decisions related to our salaried workers.(b) These adjustments were excluded because they relate to strategic activities to transition certain Cadillac dealers from the network as part of Cadillac's electric vehicle
strategy.(c) These adjustments were excluded because of a strategic decision to rationalize our core operations by exiting or significantly reducing our presence in various
international markets to focus resources on opportunities expected to deliver higher returns. These adjustments primarily consist of inventory provisions in the threemonths ended June 30, 2020, asset impairments, dealer restructurings, employee separation charges and sales allowances in Australia, New Zealand and Thailand in thethree months ended March 31, 2020, employee separation charges in the three months ended December 31, 2020, and supplier claims in the three months endedSeptember 30, 2020.
(d) This adjustment was excluded because of the unique events associated with the ignition switch recall, which included various investigations, inquiries and complaintsfrom constituents.
(e) These adjustments were excluded because of a strategic decision to accelerate our transformation for the future to strengthen our core business, capitalize on the futureof personal mobility and drive significant cost efficiencies. The adjustments primarily consist of accelerated depreciation and employee separation charges in the threemonths ended December 31, 2019, and supplier-related charges and pension curtailment and other charges in the three months ended September 30, 2019.
(f) This adjustment was excluded because we divested our joint venture FAW-GM Light Duty Commercial Vehicle Co., Ltd. (FAW-GM), as a result of a strategic decisionby both shareholders, allowing us to focus our resources on opportunities expected to deliver higher returns.
(g) This adjustment was excluded because of the unique events associated with decisions rendered by the Superior Judicial Court of Brazil resulting in retrospectiverecoveries of indirect taxes.
28
Table of ContentsGENERAL MOTORS COMPANY AND SUBSIDIARIES
The following table reconciles diluted earnings (loss) per common share under U.S. GAAP to EPS-diluted-adjusted:
Three Months Ended Six Months EndedJune 30, 2021 June 30, 2020 June 30, 2021 June 30, 2020
Amount Per Share Amount Per Share Amount Per Share Amount Per Share
________(a) Refer to the reconciliation of Net income (loss) attributable to stockholders under U.S. GAAP to EBIT (loss)-adjusted within this section of MD&A for the details of
each individual adjustment.(b) The tax effect of each adjustment is determined based on the tax laws and valuation allowance status of the jurisdiction to which the adjustment relates.(c) These adjustments consist of tax expense related to the establishment of a valuation allowance against deferred tax assets that are considered no longer realizable for
Cruise in the six months ended June 30, 2021 and for GM in Australia and New Zealand for the six months ended June 30, 2020. These adjustments were excludedbecause significant impacts of valuation allowances are not considered part of our core operations.
The following table reconciles our effective tax rate under U.S. GAAP to ETR-adjusted:
Three Months Ended Six Months EndedJune 30, 2021 June 30, 2020 June 30, 2021 June 30, 2020
________n.m. = not meaningful(a) Refer to the reconciliation of Net income (loss) attributable to stockholders under U.S. GAAP to EBIT (loss)-adjusted within this section of MD&A for adjustment
details. These adjustments include Net income attributable to noncontrolling interests where applicable. The tax effect of each adjustment is determined based on the taxlaws and valuation allowance status of the jurisdiction to which the adjustment relates.
(b) Refer to the reconciliation of diluted earnings per common share under U.S. GAAP to EPS-diluted-adjusted within this section of MD&A for adjustment details.
We define return on equity (ROE) as Net income (loss) attributable to stockholders for the trailing four quarters divided by average equity for the sameperiod. Management uses average equity to provide comparable amounts in the calculation of ROE. The following table summarizes the calculation of ROE(dollars in billions):
Four Quarters EndedJune 30, 2021 June 30, 2020
Net income (loss) attributable to stockholders $ 12.7 $ 1.7 Average equity(a) $ 49.2 $ 42.8 ROE 25.9 % 4.0 %
__________(a) Includes equity of noncontrolling interests where the corresponding earnings (loss) are included in Net income (loss) attributable to stockholders.
29
Table of ContentsGENERAL MOTORS COMPANY AND SUBSIDIARIES
The following table summarizes the calculation of ROIC-adjusted (dollars in billions):
Four Quarters EndedJune 30, 2021 June 30, 2020
EBIT (loss)-adjusted(a) $ 17.5 $ 3.8 Average equity(b) $ 49.2 $ 42.8 Add: Average automotive debt and interest liabilities (excluding finance leases) 20.3 23.6 Add: Average automotive net pension & OPEB liability 17.8 17.1 Less: Average automotive and other net income tax asset (23.2) (23.9)ROIC-adjusted average net assets $ 64.1 $ 59.6 ROIC-adjusted 27.3 % 6.4 %__________(a) Refer to the reconciliation of Net income (loss) attributable to stockholders under U.S. GAAP to EBIT (loss)-adjusted within this section of MD&A.(b) Includes equity of noncontrolling interests where the corresponding earnings (loss) are included in EBIT (loss)-adjusted.
Overview Our vision for the future is a world with zero crashes, zero emissions and zero congestion, which guides our growth-focused investment inelectric and autonomous vehicles, and new products and services. The all-electric future we are building integrates our technology, scale and manufacturingexpertise to drive growth, profitability and deliver world-class customer interactions. Our strategy includes product leadership in electric and autonomousvehicles, continued leadership in trucks and SUVs, and developing and monetizing new software and services. We will execute our strategy with a diverseteam and a steadfast commitment to good citizenship through sustainable operations and a leading health and safety culture.
The automotive industry and GM are currently experiencing a global semiconductor supply shortage. The supply shortage has impacted, and continues toimpact, multiple suppliers that incorporate semiconductors into the parts they supply to us. We expect the semiconductor supply shortage will continue tohave an impact on our business for the foreseeable future. We will continue prioritizing our most popular and in-demand vehicles, including our full-sizetrucks, full-size SUVs, and electric vehicles. We do not expect this shortage to impact our growth and electric vehicle initiatives. In June 2021, weannounced plans to increase our investment in electric and autonomous vehicles from $27.0 billion to $35.0 billion, through 2025, to accelerate battery andelectric vehicle assembly capacity.
We also continue to monitor the impact of the COVID-19 pandemic, and government actions and measures taken to prevent its spread, and the potentialto affect our operations. Refer to Part I, Item 1A. Risk Factors of our 2020 Form 10-K for further discussion of these risks.
For the year ending December 31, 2021, we expect EPS-diluted of between $5.12 and $6.12, EPS-diluted-adjusted of between $5.40 and $6.40, Netincome attributable to stockholders of between $7.7 billion and $9.2 billion and EBIT-adjusted of between $11.5 billion and $13.5 billion. Due to theuncertainty of the semiconductor supply shortage, our cash flow from operations could be impacted by year end work-in-process inventory related tovehicles produced without modules. The value of the vehicles manufactured without modules held in inventory was $1.4 billion at June 30, 2021. We do notconsider the potential impact of future adjustments on our expected financial results.
The following table reconciles expected Net income attributable to stockholders under U.S. GAAP to expected EBIT-adjusted (dollars in billions):Year Ending December 31, 2021
Net income attributable to stockholders $ 7.7-9.2Income tax expense 2.8-3.3Automotive interest expense, net 0.9Adjustments(a) 0.1EBIT-adjusted(b) $ 11.5-13.5
________(a) Refer to the reconciliation of Net income (loss) attributable to stockholders under U.S. GAAP to EBIT (loss)-adjusted within the MD&A for the details of each
individual adjustment.(b) We do not consider the potential future impact of adjustments on our expected financial results.
30
Table of ContentsGENERAL MOTORS COMPANY AND SUBSIDIARIES
The following table reconciles expected EPS-diluted under U.S. GAAP to expected EPS-diluted-adjusted:
Year Ending December 31, 2021
Diluted earnings per common share $ 5.12-6.12Adjustments(a) 0.28EPS-diluted-adjusted(b) $ 5.40-6.40
________(a) Refer to the reconciliation of diluted earnings (loss) per common share under U.S. GAAP to EPS-diluted-adjusted for within the MD&A for the details of each
individual adjustment.(b) We do not consider the potential future impact of adjustments on our expected financial results.
We also face continuing market, operating and regulatory challenges in several countries across the globe due to, among other factors, weak economicconditions, competitive pressures, our product portfolio offerings, heightened emissions standards, labor disruptions, foreign exchange volatility, risingmaterial prices, evolving trade policy and political uncertainty. Refer to Part I, Item 1A. Risk Factors of our 2020 Form 10-K for a discussion of thesechallenges.
As we continue to assess our performance and the needs of our evolving business, additional restructuring and rationalization actions could be required.These actions could give rise to future asset impairments or other charges, which may have a material impact on our operating results.
GMNA Industry sales in North America were 10.1 million units in the six months ended June 30, 2021, representing an increase of 29.5% compared tothe corresponding period in 2020. U.S. industry sales were 8.5 million units in the six months ended June 30, 2021, representing an increase of 29.5%compared to the corresponding period in 2020.
Our total vehicle sales in the U.S., our largest market in North America, were 1.3 million units for market share of 15.6% in the six months ended June30, 2021, representing a decrease of 1.3 percentage points compared to the corresponding period in 2020.
We expect to sustain relatively strong EBIT-adjusted margins in 2021 on the continued strength of favorable vehicle pricing and strong U.S. industry lightvehicle sales, partially offset by higher costs associated with commodities and raw materials. Our outlook is dependent on the economic impact of theCOVID-19 pandemic and the global shortage of semiconductors, both of which continue to evolve. As a result of the shortage of semiconductors, we haveexperienced interruptions to our planned production schedules and temporarily suspended certain manufacturing sites to prioritize production of our mostpopular and in-demand products, including our full-size trucks and full-size SUVs. Additionally, we have been manufacturing vehicles, without theimpacted components, representing an inventory carrying value of approximately $1.4 billion at June 30, 2021. We expect to hold these vehicles in ourinventory until they are completed and sold to our dealers.
GMI Industry sales in China were 13.3 million units in the six months ended June 30, 2021, representing an increase of 29.1% compared to thecorresponding period in 2020, which was adversely impacted by the COVID-19 pandemic. Our total vehicle sales in China were 1.5 million units for marketshare of 11.5% in the six months ended June 30, 2021, representing an increase of 0.1 percentage points compared to the corresponding period in 2020. Theongoing global semiconductor supply shortage, macro-economic impact of COVID-19 and geopolitical tensions may place pressure on China's automotiveindustry. Our Automotive China JVs generated equity income of $0.6 billion in the six months ended June 30, 2021. Although price competition, highercosts associated with commodities and raw materials, and a more challenging regulatory environment related to emissions, fuel consumption and newenergy vehicles will place pressure on our operations in China, we will continue to build upon our strong brands, network, and partnerships in China as wellas drive improvements in vehicle mix and cost.
Outside of China, industry sales were 11.7 million units in the six months ended June 30, 2021, representing an increase of 25.5% compared to thecorresponding period in 2020. Our total vehicle sales outside of China were 0.4 million units for a market share of 3.7% in the six months ended June 30,2021, representing a decrease of 1.3 percentage points compared to the corresponding period in 2020.
Cruise Cruise is actively testing autonomous vehicles in the United States. Gated by safety and regulation, Cruise continues to make significant progresstowards commercialization of a network of on-demand autonomous vehicles in the United States and globally.
31
Table of ContentsGENERAL MOTORS COMPANY AND SUBSIDIARIES
In the six months ended June 30, 2021, Cruise Holdings issued Cruise Class G Preferred Shares in exchange for $2.7 billion from Microsoft, Walmart andother investors, including $1.0 billion from General Motors Holdings LLC. All proceeds related to the Cruise Class G Preferred Shares are designatedexclusively for working capital and general corporate purposes of Cruise Holdings. In addition, we, Cruise Holdings and Microsoft entered into a long-termstrategic relationship to accelerate the commercialization of self-driving vehicles with Microsoft being the preferred public cloud provider. Refer to Note 16to our condensed consolidated financial statements for further details.
Vehicle Sales The principal factors that determine consumer vehicle preferences in the markets in which we operate include overall vehicle design, price,quality, available options, safety, reliability, fuel economy and functionality. Market leadership in individual countries in which we compete varies widely.
We present both wholesale and total vehicle sales data to assist in the analysis of our revenue and our market share. Wholesale vehicle sales data consistsof sales to GM's dealers and distributors as well as sales to the U.S. Government and excludes vehicles sold by our joint ventures. Wholesale vehicle salesdata correlates to our revenue recognized from the sale of vehicles, which is the largest component of Automotive net sales and revenue. In the six monthsended June 30, 2021, 28.1% of our wholesale vehicle sales volume was generated outside the U.S. The following table summarizes wholesale vehicle salesby automotive segment (vehicles in thousands):
Three Months Ended Six Months EndedJune 30, 2021 June 30, 2020 June 30, 2021 June 30, 2020
Total vehicle sales data represents: (1) retail sales (i.e., sales to consumers who purchase new vehicles from dealers or distributors); (2) fleet sales (i.e.,sales to large and small businesses, governments, and daily rental car companies); and (3) vehicles used by dealers in their businesses, including courtesytransportation vehicles. Total vehicle sales data includes all sales by joint ventures on a total vehicle basis, not based on our percentage ownership interest inthe joint venture. Certain joint venture agreements in China allow for the contractual right to report vehicle sales of non-GM trademarked vehicles by thosejoint ventures, which are included in the total vehicle sales we report for China. While total vehicle sales data does not correlate directly to the revenue werecognize during a particular period, we believe it is indicative of the underlying demand for our vehicles. Total vehicle sales data represents management'sgood faith estimate based on sales reported by GM's dealers, distributors, and joint ventures, commercially available data sources such as registration andinsurance data, and internal estimates and forecasts when other data is not available.
32
Table of ContentsGENERAL MOTORS COMPANY AND SUBSIDIARIES
The following table summarizes industry and GM total vehicle sales and our related competitive position by geographic region (vehicles in thousands):
Three Months Ended Six Months Ended June 30, 2021 June 30, 2020 June 30, 2021 June 30, 2020
__________(a) Includes sales by the Automotive China JVs: SAIC General Motors Sales Co., Ltd. (SGMS) and SAIC GM Wuling Automobile Co., Ltd. (SGMW).(b) Cuba, Iran, North Korea, Sudan and Syria are subject to broad economic sanctions. Accordingly, these countries are excluded from industry sales data and
corresponding calculation of market share.
In the six months ended June 30, 2021, we estimate we were the market share leader in North America.
As discussed above, total vehicle sales and market share data provided in the table above includes fleet vehicles. Certain fleet transactions, particularlysales to daily rental car companies, are generally less profitable than retail sales to end customers. The following table summarizes estimated fleet sales andthose sales as a percentage of total vehicle sales (vehicles in thousands):
Three Months Ended Six Months EndedJune 30, 2021 June 30, 2020 June 30, 2021 June 30, 2020
Fleet sales as a percentage of total vehicle sales 10.9 % 8.0 % 11.0 % 13.5 %
33
Table of ContentsGENERAL MOTORS COMPANY AND SUBSIDIARIES
GM Financial We believe that offering a comprehensive suite of financing products will generate incremental sales of our vehicles, drive incrementalGM Financial earnings and help support our sales throughout various economic cycles. GM Financial's leasing program is exposed to residual values, whichare heavily dependent on used vehicle prices. Due to high used vehicle prices, for the three and six months ended June 30, 2021 compared to the sameperiods in 2020, prices on leased vehicles at termination generally exceeded their contractual residual values, which resulted in increased lessee orgrounding dealer purchases of the leased vehicles upon lease termination. The high used vehicle prices were driven by continued low new vehicle inventory,compounded by the global semiconductor supply shortage impacting automotive production, and strong demand for new and used vehicles driven byeconomic recovery and government stimulus. For the full year 2021, GM Financial expects used vehicle prices to be higher than 2020 levels, primarily dueto sustained low new vehicle inventory and an economic recovery driving continued strong demand for new and used vehicles. The increase in used vehicleprices resulted in gains on terminations of leased vehicles of $0.8 billion and $1.2 billion in GM Financial interest, operating and other expenses for thethree and six months ended June 30, 2021, compared to gains of $0.1 billion and $0.2 billion in the corresponding periods in 2020. The following tablesummarizes the estimated residual value based on GM Financial's most recent estimates and the number of units included in GM Financial Equipment onoperating leases, net by vehicle type (units in thousands):
June 30, 2021 December 31, 2020Residual Value Units Percentage Residual Value Units Percentage
GM Financial's penetration of our retail sales in the U.S. was 43% in the six months ended June 30, 2021 and 49% in the corresponding period in 2020.Penetration levels vary depending on incentive financing programs available and competing third-party financing products in the market. GM Financial'sprime loan originations as a percentage of total loan originations in North America decreased to 71% in the six months ended June 30, 2021 from 74% inthe six months ended June 30, 2020. In the six months ended June 30, 2021, GM Financial's revenue consisted of leased vehicle income of 68%, retailfinance charge income of 28% and commercial finance charge income of 2%.
Consolidated Results We review changes in our results of operations under five categories: volume, mix, price, cost and other. Volume measures the impactof changes in wholesale vehicle volumes driven by industry volume, market share and changes in dealer stock levels. Mix measures the impact of changesto the regional portfolio due to product, model, trim, country and option penetration in current year wholesale vehicle volumes. Price measures the impact ofchanges related to Manufacturer’s Suggested Retail Price and various sales allowances. Cost primarily includes: (1) material and freight; (2) manufacturing,engineering, advertising, administrative and selling and warranty expense; and (3) non-vehicle related activity. Other primarily includes foreign exchangeand non-vehicle related automotive revenues as well as equity income or loss from our nonconsolidated affiliates. Refer to the regional sections of thisMD&A for additional information.
34
Table of ContentsGENERAL MOTORS COMPANY AND SUBSIDIARIES
Total Net Sales and Revenue
Three Months Ended Favorable/(Unfavorable) %
Variance Due ToJune 30, 2021 June 30, 2020 Volume Mix Price Other
In the three months ended June 30, 2021, increased Cost was primarily due to: (1) an increase in campaigns and other warranty-related costs of $1.3billion; (2) increased material and freight costs of $1.1 billion; (3) increased engineering costs of $0.9 billion primarily related to accelerating our electricvehicle portfolio and the suspension of production and austerity measures in 2020 due to the COVID-19 pandemic; (4) increased costs of $0.6 billionprimarily related to parts and accessories sales; and (5) increased manufacturing costs of $0.6 billion primarily related to the suspension of production andausterity measures in 2020 due to the COVID-19 pandemic. In the three months ended June 30, 2021, unfavorable Other was primarily due to the foreigncurrency effect resulting from the strengthening of various currencies against the U.S. Dollar.
In the six months ended June 30, 2021, increased Cost was primarily due to: (1) increased material and freight costs of $2.1 billion; (2) an increase incampaigns and other warranty-related costs of $1.3 billion; (3) increased engineering costs of $1.2 billion primarily related to accelerating our electricvehicle portfolio and the suspension of production and austerity measures in 2020 due to the COVID-19 pandemic; (4) increased costs of $0.6 billionprimarily related to parts and accessories sales; (5) increased manufacturing costs of $0.5 billion primarily related to the suspension of production andausterity measures in 2020 due to the COVID-19 pandemic; partially offset by (6) charges of $0.5 billion primarily related to dealer restructuring charges,property and intangible asset impairments and inventory provisions in Australia, New Zealand, and Thailand in 2020.
Refer to the regional sections of this MD&A for additional information on volume and mix.
36
Table of ContentsGENERAL MOTORS COMPANY AND SUBSIDIARIES
Automotive and other selling, general and administrative expense
Three Months EndedFavorable/
(Unfavorable)
Six Months EndedFavorable/
(Unfavorable)June 30, 2021 June 30, 2020 % June 30, 2021 June 30, 2020 %
Automotive and other selling,general and administrativeexpense $ 2,125 $ 1,310 $ (815) (62.2)% $ 3,928 $ 3,280 $ (648) (19.8)%
In the three months ended June 30, 2021, Automotive and other selling, general and administrative expense increased primarily due to increasedadvertising of $0.5 billion and several insignificant items primarily related to the suspension of production and austerity measures in 2020 due to theCOVID-19 pandemic.
In the six months ended June 30, 2021, Automotive and other selling, general and administrative expense increased primarily due to increased advertisingof $0.4 billion and several insignificant items primarily related to the suspension of production and austerity measures in 2020 due to the COVID-19pandemic.
Interest Income and Other Non-operating Income, net
Three Months EndedFavorable/
(Unfavorable)
Six Months EndedFavorable/
(Unfavorable)June 30, 2021 June 30, 2020 % June 30, 2021 June 30, 2020 %Interest income and other non-
In the three months ended June 30, 2021, Interest Income and other non-operating income, net increased due to several insignificant items.
In the six months ended June 30, 2021, Interest Income and other non-operating income, net increased primarily due to: (1) gains of $0.4 billion in the sixmonths ended June 30, 2021 compared to losses of $0.3 billion in the six months ended June 30, 2020 related to Stellantis warrants; and (2) $0.3 billionincrease in non-service pension income.
In the three and six months ended June 30, 2021, Income tax expense increased primarily due to an increase in pre-tax income.
For the three and six months ended June 30, 2021, our ETR-adjusted was 25.2% and 22.8%. We expect our adjusted effective tax rate to be approximately24% for the year ending December 31, 2021.
Refer to Note 14 to our condensed consolidated financial statements for additional information related to Income tax expense.
37
Table of ContentsGENERAL MOTORS COMPANY AND SUBSIDIARIES
GM North America
Three Months Ended
Favorable /(Unfavorable) %
Variance Due To
June 30, 2021 June 30, 2020 Volume Mix Price Cost Other(Dollars in billions)
(Vehicles in thousands)Wholesale vehicle sales 1,306 1,106 200 18.1 %
__________n.m. = not meaningful
GMNA Total Net Sales and Revenue In the three months ended June 30, 2021, Total net sales and revenue increased primarily due to: (1) increased netwholesale volumes due to an increase in sales of full-size pickup trucks, crossover vehicles and full-size SUVs, as a result of suspending production in 2020due to the COVID-19 pandemic, partially offset by a decrease in sales of passenger cars; (2) favorable mix associated with increased sales of full-sizepickup trucks and full-size SUVs, decreased sales of passenger cars as a result of prioritizing semiconductor chips for our most popular and in demandvehicles, and improved mix associated with crossover vehicles; (3) favorable price primarily due to lower incentives as a result of low dealer inventorylevels; and (4) favorable Other due to increased sales of parts and accessories and the foreign currency effect resulting from the strengthening of theCanadian Dollar against the U.S. Dollar.
In the six months ended June 30, 2021, Total net sales and revenue increased primarily due to (1) favorable mix associated with increased sales of full-size pickup trucks and full-size SUVs, decreased sales of passenger cars as a result of prioritizing semiconductor chips for our most popular and in-demandvehicles, and improved mix of crossover vehicles; (2) increased net wholesale volumes due to an increase in sales of full-size pickup trucks, full-size SUVsand crossover vehicles as a result of suspending production in 2020 due to the COVID-19 pandemic, partially offset by a decrease in sales of passenger cars;(3) favorable price primarily due to lower incentives as a result of low dealer inventory levels and the launch of our new full-size SUVs; (4) favorable Otherdue to increased sales of parts and accessories and the foreign currency effect resulting from the strengthening of the Canadian Dollar against the U.S.Dollar.
GMNA EBIT-Adjusted In the three months ended June 30, 2021, EBIT-adjusted increased primarily due to: (1) favorable mix; (2) increased netwholesale volumes; (3) favorable price; and (4) favorable Other due to the foreign currency effect resulting from the strengthening of the Canadian Dollaragainst the U.S. Dollar; partially offset by (5) unfavorable Cost due to increased campaigns and other warranty-related cost of $1.1 billion, increasedmaterial and freight cost of $1.0 billion, increased engineering cost of $0.7 billion including accelerating our electric vehicle portfolio, and increasedmanufacturing and advertising costs primarily related to the suspension of production and austerity measures in response to the COVID-19 pandemic in2020.
In the six months ended June 30, 2021, EBIT- adjusted increased primarily due to: (1) favorable price; (2) favorable mix; (3) increased net wholesalevolumes; and (4) favorable Other due to the foreign currency effect resulting from the strengthening of
38
Table of ContentsGENERAL MOTORS COMPANY AND SUBSIDIARIES
the Canadian Dollar against the U.S. Dollar; partially offset by (5) unfavorable Cost due to increased material and freight cost of $2.0 billion, increasedcampaigns and other warranty-related cost of $1.2 billion, increased engineering cost of $0.9 billion including accelerating our electric vehicle portfolio, andincreased manufacturing and advertising costs primarily related to the suspension of production and austerity measures in response to the COVID-19pandemic in 2020.
GM International
Three Months Ended
Favorable /(Unfavorable)
Variance Due To
June 30, 2021 June 30, 2020 % Volume Mix Price Cost Other(Dollars in billions)
excluding Equity income $ (261) $ (823) $ 562 68.3 %(Vehicles in thousands)
Wholesale vehicle sales 275 281 (6) (2.1)%
__________n.m. = not meaningful
The vehicle sales of our Automotive China JVs are not recorded in Total net sales and revenue. The results of our joint ventures are recorded in Equityincome, which is included in EBIT (loss)-adjusted above.
GMI Total Net Sales and Revenue In the three months ended June 30, 2021, Total net sales and revenue increased primarily due to: (1) increasedwholesale volumes primarily in South America and the Middle East, partially offset by lower volumes in Asia/Pacific inclusive of the wind-down of ourvehicle sales operations in Australia, New Zealand and Thailand; (2) favorable mix in the Middle East and South America; (3) favorable pricing acrossmultiple vehicle lines in Brazil and Argentina; and (4) favorable Other primarily due to increased components, parts and accessories sales and the foreigncurrency effect resulting from the strengthening of the Korean Won against the U.S. Dollar.
In the six months ended June 30, 2021, Total net sales and revenue increased primarily due to: (1) favorable mix in South America and the Middle East;(2) favorable pricing in Brazil, Argentina and the Middle East; partially offset by (3) decreased wholesale volumes primarily due to the semiconductorsupply shortage and the wind-down of our vehicle sales operations in Australia, New Zealand and Thailand.
GMI EBIT (Loss)-Adjusted In the three months ended June 30, 2021, EBIT-adjusted increased primarily due to: (1) favorable mix; (2) favorable price;and (3) favorable Other primarily due to increased equity income; partially offset by (4) unfavorable Cost primarily due to increased material and warrantyrecall campaign costs.
39
Table of ContentsGENERAL MOTORS COMPANY AND SUBSIDIARIES
In the six months ended June 30, 2021, EBIT-adjusted increased primarily due to: (1) favorable mix in South America, Australia and the Middle East; (2)favorable price; and (3) favorable Other primarily due to increased equity income; partially offset by (4) unfavorable Cost primarily due to increasedmaterial and warranty recall campaign costs, partially offset by favorable fixed costs.
We view the Chinese market as important to our global growth strategy and are employing a multi-brand strategy. In the coming years we plan to leverageour global architectures to increase the number of product offerings under the Buick, Chevrolet and Cadillac brands in China and continue to grow ourbusiness under the local Baojun and Wuling brands. We operate in the Chinese market through a number of joint ventures and maintaining strongrelationships with our joint venture partners is an important part of our China growth strategy.
The following table summarizes certain key operational and financial data for the Automotive China JVs (vehicles in thousands):
Three Months Ended Six Months EndedJune 30, 2021 June 30, 2020 June 30, 2021 June 30, 2020
Wholesale vehicle sales, including vehicles exported to markets outsideof China 620 733 1,295 1,075
Total net sales and revenue $ 8,954 $ 9,239 $ 18,830 $ 13,560 Net income $ 527 $ 562 $ 1,113 $ 214
Cruise
Three Months EndedFavorable /
(Unfavorable) %
Six Months EndedFavorable /
(Unfavorable) %June 30, 2021 June 30, 2020 June 30, 2021 June 30, 2020Total net sales and
__________(a) Primarily reclassified to Interest income and other non-operating income, net in our condensed consolidated income statements in the three and six months ended June
GM Financial Revenue In the three months ended June 30, 2021, total revenue increased by an insignificant amount.
In the six months ended June 30, 2021, total revenue decreased primarily due to decreased leased vehicle income of $0.2 billion primarily due to a declinein the average balance of the leased vehicles portfolio.
GM Financial EBT-Adjusted In the three months ended June 30, 2021, EBT-adjusted increased primarily due to: (1) increased leased vehicle income netof leased vehicle expenses of $0.9 billion primarily due to increased lease termination gains, due to the increase in used vehicle prices for the three monthsended June 30, 2021 compared to the same period in 2020,
40
Table of ContentsGENERAL MOTORS COMPANY AND SUBSIDIARIES
as well as a decrease in depreciation on leased vehicles resulting from increased residual value estimates; (2) decreased provision for loan losses of $0.3billion primarily due to a reduction in the reserve levels established during the three months ended June 30, 2020, following the onset of the COVID-19pandemic, as a result of actual credit performance that was better than forecast and favorable expectations for future charge-offs and recoveries, reflectingimproved forecast economic conditions; and (3) decreased interest expense of $0.2 billion due to decreased credit spreads on GM Financial debt.
In the six months ended June 30, 2021, EBT-adjusted increased primarily due to (1) increased leased vehicle income net of leased vehicle expenses of$1.2 billion primarily due to increased lease termination gains, due to the increase in used vehicle prices for the six months ended June 30, 2021 comparedto the same period in 2020, as well as a decrease in depreciation on leased vehicles resulting from increased residual value estimates and a decrease in thesize of the portfolio; (2) decreased provision for loan losses of $0.8 billion primarily due to a reduction in the reserve levels established during the sixmonths ended June 30, 2020, following the onset of the COVID-19 pandemic, as a result of actual credit performance that was better than forecast andfavorable expectations for future charge-offs and recoveries, reflecting improved forecast economic conditions; and (3) decreased interest expense of $0.3billion due to decreased credit spreads on GM Financial debt.
Liquidity and Capital Resources We believe our current levels of cash, cash equivalents, marketable debt securities, available borrowing capacity underour revolving credit facilities and other liquidity actions currently available to us are sufficient to meet our liquidity requirements. We also maintain accessto the capital markets and may issue debt or equity securities, which may provide an additional source of liquidity. We have substantial cash requirementsgoing forward, which we plan to fund through our total available liquidity, cash flows from operating activities and additional liquidity measures, ifdetermined to be necessary.
Our known current material uses of cash include, among other possible demands: (1) capital expenditures of approximately $9.0 billion to $10.0 billion in2021 in addition to payments for engineering and product development activities; (2) payments associated with previously announced vehicle recalls andany other recall-related contingencies; and (3) payments to service debt and other long-term obligations, including discretionary and mandatorycontributions to our pension plans. Our material future uses of cash, which may vary from time to time based on market conditions and other factors, arefocused on the three objectives of our capital allocation program: (1) grow our business at an average target ROIC-adjusted rate of 20% or greater; (2)maintain a strong investment-grade balance sheet, including a target average automotive cash balance of $18 billion; and (3) after the first two objectives aremet, return available cash to shareholders. Our senior management evaluates our capital allocation program on an ongoing basis and recommends anymodifications to the program to our Board of Directors, not less than once annually.
Our liquidity plans are subject to a number of risks and uncertainties, including those described in the "Forward-Looking Statements" section of thisMD&A and Part I, Item 1A. Risk Factors of our 2020 Form 10-K, some of which are outside of our control.
We continue to monitor and evaluate opportunities to strengthen our competitive position over the long term while maintaining a strong investment-gradebalance sheet. These actions may include opportunistic payments to reduce our long-term obligations as well as the possibility of acquisitions, dispositionsand investments with joint venture partners as well as strategic alliances that we believe would generate significant advantages and substantially strengthenour business.
Cash flows occur amongst our Automotive, Cruise and GM Financial operations that are eliminated when we consolidate our cash flows. Sucheliminations include, among other things, collections by Automotive on wholesale accounts receivables financed by dealers through GM Financial,payments between Automotive and GM Financial for accounts receivables transferred by Automotive to GM Financial, loans to Automotive from GMFinancial, dividends issued by GM Financial to Automotive, tax payments by GM Financial to Automotive and Automotive cash injections in Cruise. Thepresentation of Automotive liquidity, Cruise liquidity and GM Financial liquidity presented below includes the impact of cash transactions amongst thesectors that are ultimately eliminated in consolidation.
Automotive Liquidity Total available liquidity includes cash, cash equivalents, marketable debt securities and funds available under credit facilities. Theamount of available liquidity is subject to seasonal fluctuations and includes balances held by various business units and subsidiaries worldwide that areneeded to fund their operations. We have not significantly changed the management of our liquidity, including our allocation of available liquidity, ourportfolio composition and our investment guidelines since December 31, 2020. Refer to Part II, Item 7. MD&A of our 2020 Form 10-K.
We use credit facilities as a mechanism to provide additional flexibility in managing our global liquidity. Our Automotive borrowing capacity under creditfacilities totaled $17.5 billion at June 30, 2021 and $18.5 billion at December 31, 2020. Total Automotive borrowing capacity under our credit facilities doesnot include our 364-day, $2.0 billion facility allocated for
41
Table of ContentsGENERAL MOTORS COMPANY AND SUBSIDIARIES
exclusive use by GM Financial. We did not have any borrowings against our primary facilities, but had letters of credit outstanding under our sub-facility of$0.3 billion at June 30, 2021 and December 31, 2020.
In April 2021, we increased the total borrowing capacity of our five-year, $10.5 billion facility to $11.2 billion and extended the termination date for a$9.9 billion portion of the five-year facility by three years, now set to mature on April 18, 2026. The termination date of April 18, 2023 for the remainingportion of the five-year facility remains unchanged. We also renewed and increased the total borrowing capacity of our three-year, $4.0 billion facility to$4.3 billion, which now matures on April 7, 2024, and renewed our 364-day, $2.0 billion facility allocated for exclusive use by GM Financial, which nowmatures on April 6, 2022. We also terminated our 364-day, $2.0 billion revolving credit facility, entered into in May 2020. Additionally, the prior restrictionson share repurchases and dividends on our common shares were removed upon entrance into the renewed three-year, $4.3 billion facility.
If available capacity permits, GM Financial continues to have access to our automotive credit facilities, except for the three-year, $2.0 billiontransformation facility. GM Financial did not have borrowings outstanding against any of these facilities at June 30, 2021 and December 31, 2020. We hadintercompany loans from GM Financial of $0.3 billion and $0.4 billion at June 30, 2021 and December 31, 2020, which primarily consisted of commercialloans to dealers we consolidate. We did not have intercompany loans to GM Financial at June 30, 2021 and December 31, 2020. Refer to Note 4 to ourcondensed consolidated financial statements for additional information.
GM Financial's Board of Directors declared and paid dividends of $0.6 billion and $1.2 billion on its common stock in the three and six months endedJune 30, 2021 and $0.4 billion and $0.8 billion in the three and six months ended June 30, 2020. Current dividend levels are reflective of record GMFinancial earnings supported by strong residual values, favorable credit performance and improved economic conditions. Future dividends from GMFinancial will depend on several factors including business and economic conditions, its financial condition, earnings, liquidity requirements and leverageratio.
Several of our loan facilities, including our revolving credit facilities, require compliance with certain financial and operational covenants as well asregular reporting to lenders. We have reviewed our covenants in effect as of June 30, 2021 and determined we are in compliance and expect to remain incompliance in the future.
The following table summarizes our available liquidity (dollars in billions):
June 30, 2021 December 31, 2020
Automotive cash and cash equivalents $ 16.8 $ 14.2 Marketable debt securities 4.1 8.1 Automotive cash, cash equivalents and marketable debt securities 20.9 22.3 Cruise cash and cash equivalents(a) 1.8 0.8 Cruise marketable debt securities(a) 2.1 0.9 Available liquidity 24.8 24.0 Available under credit facilities 17.2 18.2 Total available liquidity $ 42.0 $ 42.2
__________(a) Amounts are designated exclusively for the use of Cruise.
The following table summarizes the changes in our Automotive available liquidity (excluding Cruise, dollars in billions):
Six Months Ended June30, 2021
Operating cash flow $ 2.9 Capital expenditures (2.4)GM investment in Cruise (1.0)Decrease in available credit facilities (1.0)Other non-operating (0.9)Total change in automotive available liquidity $ (2.4)
42
Table of ContentsGENERAL MOTORS COMPANY AND SUBSIDIARIES
Automotive Cash Flow (dollars in billions)
Six Months Ended
ChangeJune 30, 2021 June 30, 2020Operating ActivitiesNet income (loss) $ 4.7 $ (0.5) $ 5.2 Depreciation, amortization and impairment charges 2.8 2.8 — Pension and OPEB activities (1.2) (0.8) (0.4)Working capital (3.2) (5.8) 2.6 Accrued and other liabilities and income taxes (1.2) (4.9) 3.7 Other 1.0 1.5 (0.5)Net automotive cash provided by (used in) operating activities $ 2.9 $ (7.7) $ 10.6
In the six months ended June 30, 2021, the increase in Net automotive cash provided by (used in) operating activities was primarily due to: (1) favorablepre-tax earnings of $6.1 billion; (2) favorable working capital primarily due to favorable accounts payable of $4.5 billion, partially offset by unfavorableinventory of $2.4 billion; (3) lower sales incentive payments of $0.7 billion; (4) higher dividends received from GM Financial of $0.4 billion; and (5)several other insignificant items.
Six Months Ended
ChangeJune 30, 2021 June 30, 2020Investing ActivitiesCapital expenditures $ (2.4) $ (2.3) $ (0.1)Acquisitions and liquidations of marketable securities, net(a) 4.0 (3.3) 7.3 GM investment in Cruise (1.0) — (1.0)Other (0.3) — (0.3)Net automotive cash provided by (used in) investing activities $ 0.3 $ (5.6) $ 5.9
__________(a) Amount includes $0.6 billion of proceeds from the sale of our remaining shares in Lyft in the six months ended June 30, 2020.
In the six months ended June 30, 2021, cash provided by acquisitions and liquidations of marketable securities, net increased due to liquidations ofsecurities to fund operating activities and investments, compared to net acquisitions of securities from revolver proceeds during the six months ended June30, 2020.
Six Months Ended
ChangeJune 30, 2021 June 30, 2020Financing ActivitiesBorrowings against credit facilities $ — $ 15.9 $ (15.9)Net proceeds (payments) from short-term debt(a) (0.5) 1.6 (2.1)Issuance of senior unsecured notes — 4.0 (4.0)Dividends paid and payments to purchase common stock — (0.6) 0.6 Other 0.1 (0.3) 0.4 Net automotive cash (used in) provided by financing activities $ (0.4) $ 20.6 $ (21.0)
__________(a) Amount includes $0.9 billion intercompany loans from GM Financial for subvention owed in the six months ended June 30, 2020.
Adjusted Automotive Free Cash Flow We measure adjusted automotive free cash flow as automotive operating cash flow from operations less capitalexpenditures adjusted for management actions. In the six months ended June 30, 2021, net automotive cash provided by operating activities under U.S.GAAP was $2.9 billion, capital expenditures were $2.4 billion, and adjustments for management actions were insignificant.
In the six months ended June 30, 2020, net automotive cash used in operating activities under U.S. GAAP was $7.7 billion, capital expenditures were $2.3billion, and adjustments for management actions were insignificant.
43
Table of ContentsGENERAL MOTORS COMPANY AND SUBSIDIARIES
Status of Credit Ratings We receive ratings from four independent credit rating agencies: DBRS Limited (DBRS), Fitch Ratings, Moody's InvestorService and Standard & Poor's. All four credit rating agencies currently rate our corporate credit at investment grade. In March 2021, Moody’s InvestorServices affirmed our investment-grade credit ratings and raised our ratings outlook to stable. In June 2021, DBRS affirmed our investment-grade creditrating and raised our ratings outlook to positive. As of July 19, 2021, all other credit ratings remained unchanged since December 31, 2020.
Cruise Liquidity In the six months ended June 30, 2021, Cruise Holdings issued Cruise Class G Preferred Shares in exchange for $2.7 billion fromMicrosoft, Walmart and other investors, including $1.0 billion from General Motors Holdings LLC. Refer to Note 16 to our condensed consolidatedfinancial statements for additional information. When Cruise's autonomous vehicles are ready for commercial deployment, Softbank Vision Fund (AIVM2), L.P. is obligated to purchase additional Cruise convertible preferred shares for $1.35 billion.
The following table summarizes the changes in our Cruise available liquidity (dollars in billions):Six Months Ended June 30,
2021
Operating cash flow $ (0.5)Issuance of Cruise Preferred Shares 1.7 GM investment in Cruise 1.0 Total change in Cruise available liquidity(a) $ 2.2
__________(a) Excludes a multi-year credit agreement between Cruise and GM Financial whereby Cruise can request to borrow, over time, up to an aggregate of $5.2 billion, through
2024, to fund exclusively the purchase of autonomous vehicles from GM.
Cruise Cash Flow (dollars in billions)
Six Months EndedChangeJune 30, 2021 June 30, 2020
Net cash used in operating activities $ (0.5) $ (0.4) $ (0.1)Net cash used in investing activities $ (1.2) $ (0.7) $ (0.5)Net cash provided by financing activities $ 2.7 $ — $ 2.7
In the six months ended June 30, 2021, cash used in investing activities increased due to higher net acquisitions of marketable securities resulting from theissuance of Cruise Preferred Shares.
Automotive Financing – GM Financial Liquidity GM Financial's primary sources of cash are finance charge income, leasing income and proceeds fromthe sale of terminated leased vehicles, net distributions from credit facilities, securitizations, secured and unsecured borrowings and collections andrecoveries on finance receivables. GM Financial's primary uses of cash are purchases and funding of finance receivables and leased vehicles, repayment orrepurchases of secured and unsecured debt, funding credit enhancement requirements in connection with securitizations and secured credit facilities, interestcosts, operating expenses, income taxes and dividend payments. GM Financial continues to monitor and evaluate opportunities to optimize its liquidityposition and the mix of its debt between secured and unsecured debt. The following table summarizes GM Financial's available liquidity (dollars inbillions):
June 30, 2021 December 31, 2020
Cash and cash equivalents $ 4.4 $ 5.1 Borrowing capacity on unpledged eligible assets 21.1 19.0 Borrowing capacity on committed unsecured lines of credit 0.5 0.5 Borrowing capacity on revolving credit facility, exclusive to GM Financial 2.0 2.0 Total GM Financial available liquidity $ 28.0 $ 26.6
At June 30, 2021, GM Financial's available liquidity increased from December 31, 2020 due to increased available borrowing capacity on unpledgedeligible assets, resulting from the issuance of securitization transactions and unsecured debt, partially offset by a decrease in cash and cash equivalents. GMFinancial structures liquidity to support at least six months of GM Financial's expected net cash flows, including new originations, without access to newdebt financing transactions or other capital markets activity.
44
Table of ContentsGENERAL MOTORS COMPANY AND SUBSIDIARIES
GM Financial did not have any borrowings outstanding against our credit facility designated for their exclusive use or the remainder of our revolvingcredit facilities at June 30, 2021 and December 31, 2020. Refer to the Automotive Liquidity section of this MD&A for additional details.
Credit Facilities In the normal course of business, in addition to using its available cash, GM Financial utilizes borrowings under its credit facilities,which may be secured or unsecured, and GM Financial repays these borrowings as appropriate under its cash management strategy. At June 30, 2021,secured, committed unsecured and uncommitted unsecured credit facilities totaled $26.7 billion, $0.5 billion and $1.3 billion with advances outstanding of$1.3 billion, an insignificant amount and $1.3 billion.
GM Financial Cash Flow (dollars in billions)
Six Months EndedChangeJune 30, 2021 June 30, 2020
Net cash provided by operating activities $ 3.6 $ 4.1 $ (0.5)Net cash used in investing activities $ (3.4) $ (3.2) $ (0.2)Net cash provided by financing activities $ 0.2 $ 3.0 $ (2.8)
In the six months ended June 30, 2021, Net cash provided by operating activities decreased primarily due to: (1) a decrease in derivative collateral postingactivities of $0.6 billion; and (2) a decrease in leased vehicle income of $0.2 billion; partially offset by (3) a decrease in interest paid of $0.3 billion.
In the six months ended June 30, 2021, Net cash used in investing activities increased primarily due to: (1) an increase in purchases of leased vehicles of$6.3 billion; (2) an increase in purchases of finance receivables of $1.5 billion; partially offset by (3) an increase in proceeds from terminated vehicles of$5.3 billion; and (4) an increase in collections and recoveries on finance receivables of $2.3 billion.
In the six months ended June 30, 2021, Net cash provided by financing activities decreased primarily due to: (1) a decrease in borrowings of $5.1 billion;and (2) an increase in dividend payments of $0.4 billion; partially offset by (3) a decrease in debt repayments of $2.7 billion.
Critical Accounting Estimates The condensed consolidated financial statements are prepared in conformity with U.S. GAAP, which requires the use ofestimates, judgments and assumptions that affect the reported amounts of assets and liabilities, the disclosure of contingent assets and liabilities at the dateof the financial statements and the reported amounts of revenues and expenses in the periods presented. We believe the accounting estimates employed areappropriate and the resulting balances are reasonable; however, due to the inherent uncertainties in developing estimates, actual results could differ from theoriginal estimates, requiring adjustments to these balances in future periods. The critical accounting estimates that affect the condensed consolidatedfinancial statements and the judgments and assumptions used are consistent with those described in the MD&A in our 2020 Form 10-K.
Forward-Looking Statements This report and the other reports filed by us with the SEC from time to time, as well as statements incorporated by referenceherein and related comments by our management, may include "forward-looking statements" within the meaning of the U.S. federal securities laws.Forward-looking statements are any statements other than statements of historical fact. Forward-looking statements represent our current judgment aboutpossible future events and are often identified by words like “aim,” “anticipate,” “appears,” “approximately,” “believe,” “continue,” “could,” “designed,”“effect,” “estimate,” “evaluate,” “expect,” “forecast,” “goal,” “initiative,” “intend,” “may,” “objective,” “outlook,” “plan,” “potential,” “priorities,”“project,” “pursue,” “seek,” “should,” “target,” “when,” “will,” “would,” or the negative of any of those words or similar expressions. In making thesestatements, we rely on assumptions and analysis based on our experience and perception of historical trends, current conditions and expected futuredevelopments as well as other factors we consider appropriate under the circumstances. We believe these judgments are reasonable, but these statements arenot guarantees of any future events or financial results, and our actual results may differ materially due to a variety of important factors, many of which arebeyond our control. These factors, which may be revised or supplemented in subsequent reports we file with the SEC, include, among others, the following:(1) our ability to deliver new products, services and customer experiences in response to increased competition and changing consumer preferences in theautomotive industry; (2) our ability to timely fund and introduce new and improved vehicle models, including electric vehicles, that are able to attract asufficient number of consumers; (3) the success of our crossovers, SUVs and full-size pickup trucks; (4) our highly competitive industry, which ischaracterized by excess manufacturing capacity and the use of incentives, and the introduction of new and improved vehicle models by our competitors; (5)our ability to deliver a broad portfolio of electric vehicles and drive increased consumer
45
Table of ContentsGENERAL MOTORS COMPANY AND SUBSIDIARIES
adoption; (6) the unique technological, operational, regulatory and competitive risks related to the timing and commercialization of autonomous vehicles;(7) the ongoing COVID-19 pandemic; (8) global automobile market sales volume, which can be volatile; (9) our significant business in China, which issubject to unique operational, competitive, regulatory and economic risks; (10) our joint ventures, which we cannot operate solely for our benefit and overwhich we may have limited control; (11) the international scale and footprint of our operations, which exposes us to a variety of unique political, economic,competitive and regulatory risks, including the risk of changes in government leadership and laws (including labor, tax and other laws), political instabilityand economic tensions between governments and changes in international trade policies, new barriers to entry and changes to or withdrawals from free tradeagreements, public health crises, including the occurrence of a contagious disease or illness, such as the COVID-19 pandemic, changes in foreign exchangerates and interest rates, economic downturns in the countries in which we operate, differing local product preferences and product requirements, changes toand compliance with U.S. and foreign countries' export controls and economic sanctions, differing labor regulations, requirements and union relationships,differing dealer and franchise regulations and relationships, and difficulties in obtaining financing in foreign countries; (12) any significant disruption,including any work stoppages, at any of our manufacturing facilities; (13) the ability of our suppliers to deliver parts, systems and components withoutdisruption and at such times to allow us to meet production schedules; (14) prices of raw materials used by us and our suppliers; (15) our ability tosuccessfully and cost-effectively restructure our operations in the U.S. and various other countries and initiate additional cost reduction actions withminimal disruption; (16) the possibility that competitors may independently develop products and services similar to ours, or that our intellectual propertyrights are not sufficient to prevent competitors from developing or selling those products or services; (17) our ability to manage risks related to securitybreaches and other disruptions to our information technology systems and networked products, including connected vehicles and in-vehicle systems; (18)our ability to comply with increasingly complex, restrictive and punitive regulations relating to our enterprise data practices, including the collection, use,sharing and security of the Personal Identifiable Information of our customers, employees, or suppliers; (19) our ability to comply with extensive laws,regulations and policies applicable to our operations and products, including those relating to fuel economy and emissions and autonomous vehicles; (20)costs and risks associated with litigation and government investigations; (21) the costs and effect on our reputation of product safety recalls and allegeddefects in products and services; (22) any additional tax expense or exposure; (23) our continued ability to develop captive financing capability through GMFinancial; and (24) any significant increase in our pension funding requirements. A further list and description of these risks, uncertainties and other factorscan be found in our 2020 Form 10-K and our subsequent filings with the SEC.
We caution readers not to place undue reliance on forward-looking statements. Forward-looking statements speak only as of the date they are made, andwe undertake no obligation to update publicly or otherwise revise any forward-looking statements, whether as a result of new information, future events orother factors, except where we are expressly required to do so by law.
* * * * * * *
Item 3. Quantitative and Qualitative Disclosures About Market Risk
There have been no significant changes in our exposure to market risk since December 31, 2020. For further discussion on market risk, refer to Part II,Item 7A. of our 2020 Form 10-K.
* * * * * * *
46
Table of ContentsGENERAL MOTORS COMPANY AND SUBSIDIARIES
Item 4. Controls and Procedures
Disclosure Controls and Procedures We maintain disclosure controls and procedures designed to provide reasonable assurance that information requiredto be disclosed in reports filed under the Securities Exchange Act of 1934, as amended (Exchange Act), is recorded, processed, summarized and reportedwithin the specified time periods and accumulated and communicated to our management, including our principal executive officer and principal financialofficer, as appropriate, to allow timely decisions regarding required disclosures.
Our management, with the participation of our CEO and CFO, evaluated the effectiveness of our disclosure controls and procedures (as defined in Rules13a-15(e) or 15d-15(e) promulgated under the Exchange Act) as of June 30, 2021 as required by paragraph (b) of Rules 13a-15 or 15d-15. Based on thisevaluation, our CEO and CFO concluded that our disclosure controls and procedures were effective as of June 30, 2021.
Changes in Internal Control over Financial Reporting There have not been any changes in our internal control over financial reporting during thethree months ended June 30, 2021 that have materially affected, or are reasonably likely to materially affect, our internal control over financial reporting.However, due to the COVID-19 pandemic, we are monitoring our control environment with increased vigilance to ensure changes as a result of physicaldistancing are addressed and all increased risks are mitigated. For additional information refer to Part I, Item 1A. Risk Factors of our 2020 Form 10-K.
* * * * * * *
47
Table of ContentsGENERAL MOTORS COMPANY AND SUBSIDIARIES
PART IIItem 1. Legal Proceedings
The discussion under "Litigation-Related Liability and Tax Administrative Matters" in Note 13 to our condensed consolidated financial statements isincorporated by reference into this Part II, Item 1.
* * * * * * *
Item 1A. Risk Factors
We face a number of significant risks and uncertainties in connection with our operations. Our business and the results of our operations and financialcondition could be materially adversely affected by these risk factors. There have been no material changes to the Risk Factors disclosed in our 2020 Form10-K.
* * * * * * *
48
Table of ContentsGENERAL MOTORS COMPANY AND SUBSIDIARIES
Item 2. Unregistered Sales of Equity Securities and Use of Proceeds
Purchases of Equity Securities The following table summarizes our purchases of common stock in the three months ended June 30, 2021:
Total Number ofShares Purchased(a)
(b)
WeightedAverage Price
Paid perShare
Total Number of SharesPurchased Under
AnnouncedPrograms(b)
Approximate Dollar Value ofShares That
May Yet be Purchased UnderAnnounced Programs
April 1, 2021 through April 30, 2021 182,497 $ 57.80 — $3.3 billionMay 1, 2021 through May 31, 2021 18,254 $ 57.41 — $3.3 billionJune 1, 2021 through June 30, 2021 — $ — — $3.3 billionTotal 200,751 $ 57.76 —
_______(a) Shares purchased consist of shares delivered by employees or directors to us for the payment of taxes resulting from the issuance of common stock upon the vesting of
RSUs and PSUs relating to compensation plans. Refer to our 2020 Form 10-K for additional details on employee stock incentive plans.(b) In January 2017, we announced that our Board of Directors had authorized the purchase of up to $5.0 billion of our common stock with no expiration date.
* * * * * * *
49
Table of ContentsGENERAL MOTORS COMPANY AND SUBSIDIARIES
Item 6. Exhibits
Exhibit Number Exhibit Name
3.1 Restated Certificate of Incorporation of General Motors Company dated December 7, 2010, incorporated hereinby reference to Exhibit 3.2 to the Current Report on Form 8-K of General Motors Company filed December 13,2010
Incorporated byReference
3.2 General Motors Company Amended and Restated Bylaws, as amended August 14, 2018, incorporated byreference to Exhibit 3.1 to the Current Report on Form 8-K of General Motors Company filed on August 20,2018
Incorporated byReference
10.1† Fourth Amended and Restated 3-Year Revolving Credit Agreement among General Motors Company, GeneralMotors Financial Company, Inc., General Motors do Brasil Ltda., the subsidiary borrowers from time to timeparties thereto, the several lenders from time to time parties thereto, JPMorgan Chase Bank, N.A., asadministrative agent, and Citibank, N.A., as syndication agent, incorporated by reference to Exhibit 10.1 to theCurrent Report on Form 8-K of General Motors Company filed April 7, 2021
Incorporated byReference
10.2† Third Amended and Restated 364-Day Revolving Credit Agreement among General Motors Company, GeneralMotors Financial Company, Inc., the subsidiary borrowers from time to time parties thereto, the several lendersfrom time to time parties thereto, JPMorgan Chase Bank, N.A., as administrative agent, and Citibank, N.A., assyndication agent, incorporated by reference to Exhibit 10.2 to the Current Report on Form 8-K of GeneralMotors Company filed April 7, 2021
Incorporated byReference
10.3† Amendment No. 1 to Third Amended and Restated 5-Year Revolving Credit Agreement, dated as of April 18,2018, among General Motors Company, General Motors Financial Company, Inc., GM Global Treasury Centre,General Motors do Brasil Ltda., the subsidiary borrowers from time to time parties thereto, the several lendersfrom time to time party thereto, JPMorgan Chase Bank, N.A., as administrative agent, and Citibank, N.A., assyndication agent, incorporated by reference to Exhibit 10.3 to the Current Report on Form 8-K of GeneralMotors Company filed April 7, 2021
Incorporated byReference
31.1 Section 302 Certification of the Chief Executive Officer Filed Herewith31.2 Section 302 Certification of the Chief Financial Officer Filed Herewith32 Certification Pursuant to 18 U.S.C. Section 1350, As Adopted Pursuant to Section 906 of the Sarbanes-Oxley
Act of 2002Furnished with thisReport
101 The following financial information from the Company’s Quarterly Report on Form 10-Q for the quarter endedJune 30, 2021, formatted in Inline Extensible Business Reporting Language (iXBRL) includes: (i) theCondensed Consolidated Income Statements, (ii) the Condensed Consolidated Statements of ComprehensiveIncome, (iii) the Condensed Consolidated Balance Sheets, (iv) the Condensed Consolidated Statements of CashFlows, (v) the Condensed Consolidated Statements of Equity and (vi) Notes to the Condensed ConsolidatedFinancial Statements
Filed Herewith
104 The cover page from the Company's Quarterly Report on Form 10-Q for the quarter ended June 30, 2021,formatted as Inline XBRL and contained in Exhibit 101
Filed Herewith
_________† Portions of this exhibit have been omitted pursuant to Rule 601(b)(10) of Regulation S-K. The omitted information is not material and would likely
cause competitive harm to the registrant if publicly disclosed.
Table of ContentsGENERAL MOTORS COMPANY AND SUBSIDIARIES
SIGNATURE
Pursuant to the requirements of the Securities Exchange Act of 1934, the registrant has duly caused this report to be signed on its behalf by theundersigned thereunto duly authorized.
GENERAL MOTORS COMPANY (Registrant)
By: /s/ CHRISTOPHER T. HATTOChristopher T. Hatto, Vice President, Global Business Solutionsand Chief Accounting Officer
Date: August 4, 2021
51
GENERAL MOTORS COMPANY AND SUBSIDIARIES
Exhibit 31.1
CERTIFICATION
I, Mary T. Barra, certify that:
1. I have reviewed this quarterly report on Form 10-Q of General Motors Company;
2. Based on my knowledge, this report does not contain any untrue statement of a material fact or omit to state a material fact necessary to make thestatements made, in light of the circumstances under which such statements were made, not misleading with respect to the period covered by this report;
3. Based on my knowledge, the financial statements, and other financial information included in this report, fairly present in all material respects thefinancial condition, results of operations and cash flows of the registrant as of, and for, the periods presented in this report;
4. The registrant's other certifying officer and I are responsible for establishing and maintaining disclosure controls and procedures (as defined inExchange Act Rules 13a-15(e) and 15d-15(e)) and internal control over financial reporting (as defined in Exchange Act Rules 13a-15(f) and 15d-15(f)) forthe registrant and have:
a) Designed such disclosure controls and procedures, or caused such disclosure controls and procedures to be designed under our supervision, toensure that material information relating to the registrant, including its consolidated subsidiaries, is made known to us by others within those entities,particularly during the period in which this report is being prepared;
b) Designed such internal control over financial reporting, or caused such internal control over financial reporting to be designed under oursupervision, to provide reasonable assurance regarding the reliability of financial reporting and the preparation of financial statements for externalpurposes in accordance with generally accepted accounting principles;
c) Evaluated the effectiveness of the registrant's disclosure controls and procedures and presented in this report our conclusions about theeffectiveness of the disclosure controls and procedures, as of the end of the period covered by this report based on such evaluation; and
d) Disclosed in this report any change in the registrant's internal control over financial reporting that occurred during the registrant's most recentfiscal quarter (the registrant's fourth fiscal quarter in the case of an annual report) that has materially affected, or is reasonably likely to materiallyaffect, the registrant's internal control over financial reporting; and
5. The registrant's other certifying officer and I have disclosed, based on our most recent evaluation of internal control over financial reporting, to theregistrant's auditors and the Audit Committee of the registrant's Board of Directors (or persons performing the equivalent functions):
a) All significant deficiencies and material weaknesses in the design or operation of internal control over financial reporting which are reasonablylikely to adversely affect the registrant's ability to record, process, summarize and report financial information; and
b) Any fraud, whether or not material, that involves management or other employees who have a significant role in the registrant's internal controlover financial reporting.
/s/ MARY T. BARRAMary T. BarraChair and Chief Executive Officer
Date: August 4, 2021
GENERAL MOTORS COMPANY AND SUBSIDIARIES
Exhibit 31.2
CERTIFICATION
I, Paul A. Jacobson, certify that:
1. I have reviewed this quarterly report on Form 10-Q of General Motors Company;
2. Based on my knowledge, this report does not contain any untrue statement of a material fact or omit to state a material fact necessary to make thestatements made, in light of the circumstances under which such statements were made, not misleading with respect to the period covered by this report;
3. Based on my knowledge, the financial statements, and other financial information included in this report, fairly present in all material respects thefinancial condition, results of operations and cash flows of the registrant as of, and for, the periods presented in this report;
4. The registrant's other certifying officer and I are responsible for establishing and maintaining disclosure controls and procedures (as defined inExchange Act Rules 13a-15(e) and 15d-15(e)) and internal control over financial reporting (as defined in Exchange Act Rules 13a-15(f) and 15d-15(f)) forthe registrant and have:
a) Designed such disclosure controls and procedures, or caused such disclosure controls and procedures to be designed under our supervision, toensure that material information relating to the registrant, including its consolidated subsidiaries, is made known to us by others within those entities,particularly during the period in which this report is being prepared;
b) Designed such internal control over financial reporting, or caused such internal control over financial reporting to be designed under oursupervision, to provide reasonable assurance regarding the reliability of financial reporting and the preparation of financial statements for externalpurposes in accordance with generally accepted accounting principles;
c) Evaluated the effectiveness of the registrant's disclosure controls and procedures and presented in this report our conclusions about theeffectiveness of the disclosure controls and procedures, as of the end of the period covered by this report based on such evaluation; and
d) Disclosed in this report any change in the registrant's internal control over financial reporting that occurred during the registrant's most recentfiscal quarter (the registrant's fourth fiscal quarter in the case of an annual report) that has materially affected, or is reasonably likely to materiallyaffect, the registrant's internal control over financial reporting; and
5. The registrant's other certifying officer and I have disclosed, based on our most recent evaluation of internal control over financial reporting, to theregistrant's auditors and the Audit Committee of the registrant's Board of Directors (or persons performing the equivalent functions):
a) All significant deficiencies and material weaknesses in the design or operation of internal control over financial reporting which are reasonablylikely to adversely affect the registrant's ability to record, process, summarize and report financial information; and
b) Any fraud, whether or not material, that involves management or other employees who have a significant role in the registrant's internal controlover financial reporting.
/s/ PAUL A. JACOBSONPaul A. JacobsonExecutive Vice President and Chief Financial Officer
Date: August 4, 2021
GENERAL MOTORS COMPANY AND SUBSIDIARIES
Exhibit 32
CERTIFICATION PURSUANT TO18 U.S.C. SECTION 1350,
AS ADOPTED PURSUANT TOSECTION 906 OF THE SARBANES-OXLEY ACT OF 2002
In connection with the Quarterly Report of General Motors Company (the “Company”) on Form 10-Q for the period ended June 30, 2021 as filed withthe Securities and Exchange Commission on the date hereof (the “Report”), each of the undersigned officers of the Company, certify, pursuant to 18 U.S.C.§ 1350, as adopted pursuant to § 906 of the Sarbanes-Oxley Act of 2002, that to the best of such officer's knowledge:
1. The Report fully complies with the requirements of section 13(a) or 15(d) of the Securities Exchange Act of 1934; and
2. The information contained in the Report fairly presents, in all material respects, the financial condition and results of operations of the Company.
/s/ MARY T. BARRAMary T. BarraChair and Chief Executive Officer
/s/ PAUL A. JACOBSONPaul A. JacobsonExecutive Vice President and Chief Financial Officer