25
Hi Hi E E (h) out in (h) P [ |E (h) - E (h)| >ǫ ] ≤ 2e -2ǫ 2 N g h 1 ,h 2 , ··· ,h M |E (g ) - E (g )| >ǫ |E (h 1 ) - E (h 1 )| >ǫ |E (h 2 ) - E (h 2 )| >ǫ ··· |E (h M ) - E (h M )| >ǫ M
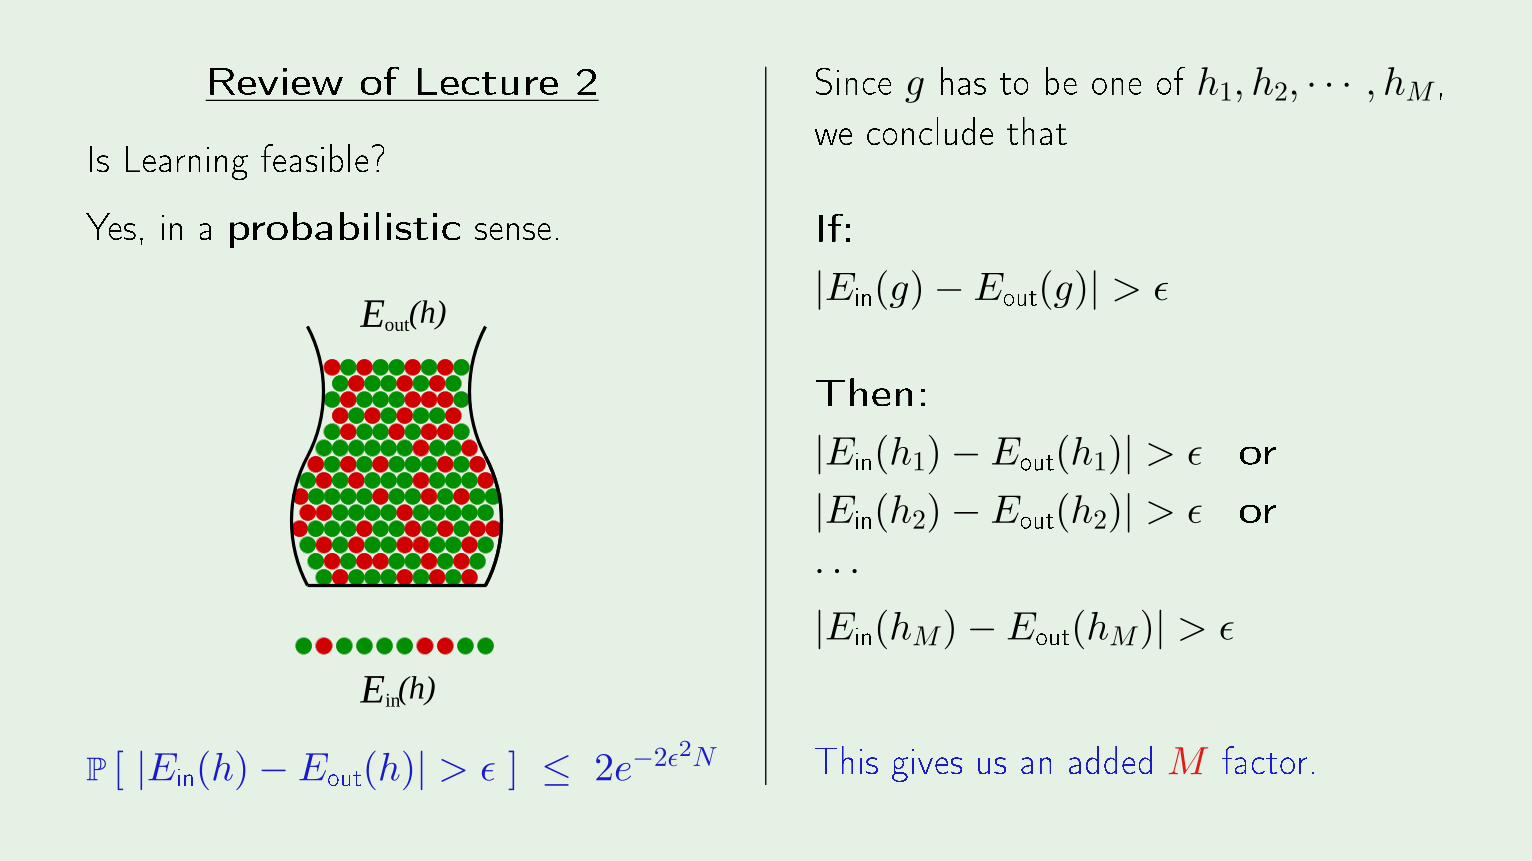
Review of Le ture 2Is Learning feasible?Yes, in a probabilisti sense.Hi
Hi
E
E
(h)out
in(h)
P [ |Ein(h) − Eout(h)| > ǫ ] ≤ 2e−2ǫ2N
Sin e g has to be one of h1, h2, · · · , hM ,we on lude thatIf:|Ein(g) − Eout(g)| > ǫ
Then:|Ein(h1) − Eout(h1)| > ǫ or|Ein(h2) − Eout(h2)| > ǫ or· · ·
|Ein(hM) − Eout(hM)| > ǫ
This gives us an added M fa tor.

Learning From DataYaser S. Abu-MostafaCalifornia Institute of Te hnologyLe ture 3: Linear Models I
Sponsored by Calte h's Provost O� e, E&AS Division, and IST • Tuesday, April 10, 2012

Outline• Input representation• Linear Classi� ation• Linear Regression• Nonlinear Transformation
© AML Creator: Yaser Abu-Mostafa - LFD Le ture 3 2/23
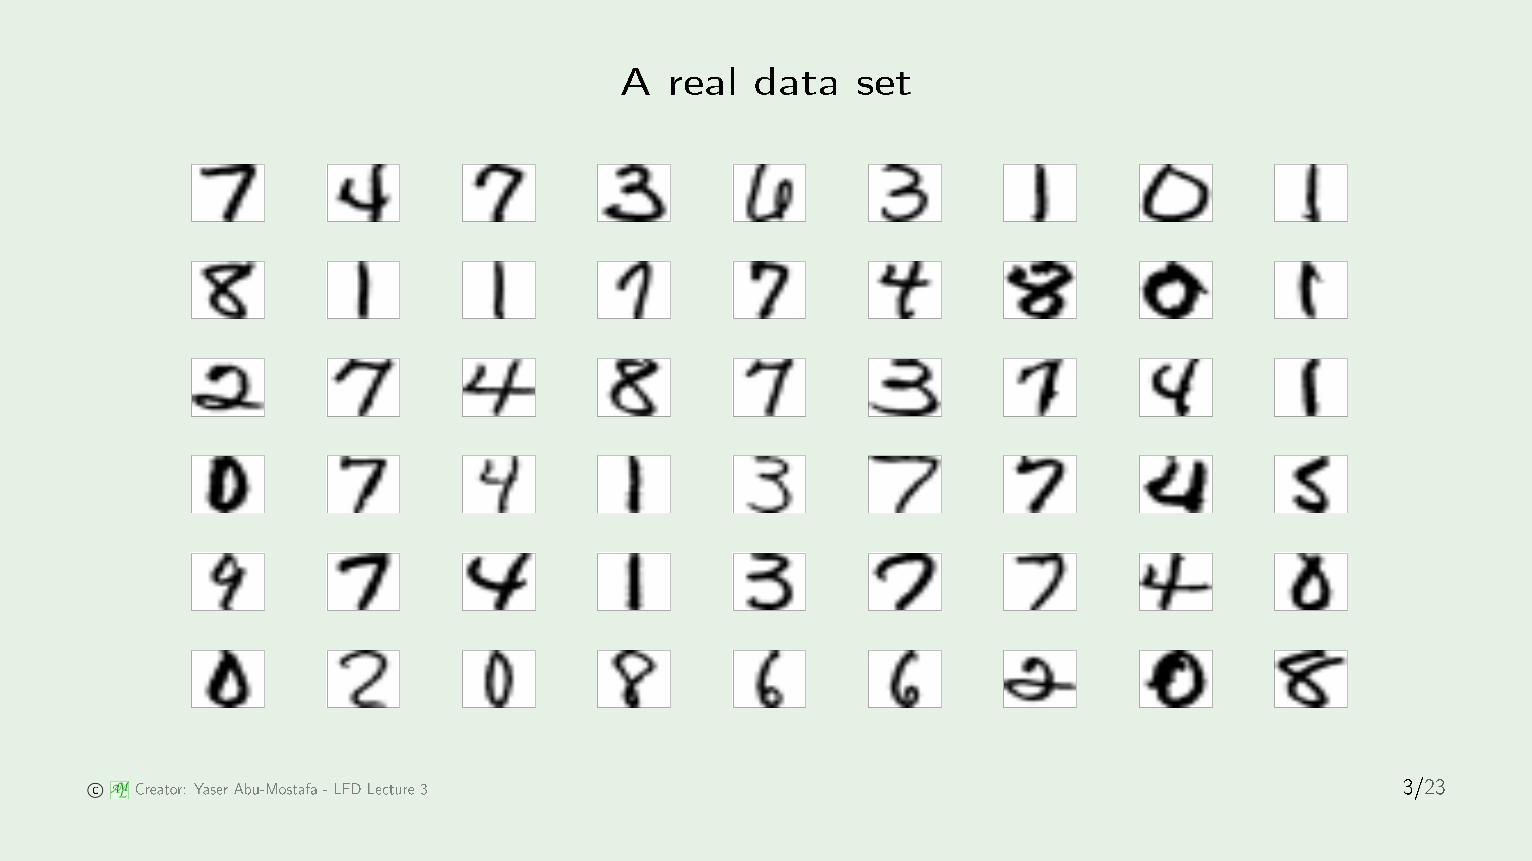
A real data set
© AML Creator: Yaser Abu-Mostafa - LFD Le ture 3 3/23

Input representation`raw' input x = (x0,x1, x2, · · · , x256)
linear model: (w0, w1, w2, · · · , w256)
Features: Extra t useful information, e.g.,intensity and symmetry x = (x0,x1, x2)
linear model: (w0, w1, w2)
© AML Creator: Yaser Abu-Mostafa - LFD Le ture 3 4/23

Illustration of featuresx = (x0,x1, x2) x1: intensity x2: symmetry
PSfrag repla ements024681012141618024681012141618024681012141618510155101551015
PSfrag repla ements00.10.20.30.40.50.60.70.80.9100.10.20.30.40.50.60.70.80.9100.10.20.30.40.50.60.70.80.91-8-7-6-5-4-3-2-10
PSfrag repla ements024681012141618024681012141618024681012141618510155101551015 © AML Creator: Yaser Abu-Mostafa - LFD Le ture 3 5/23
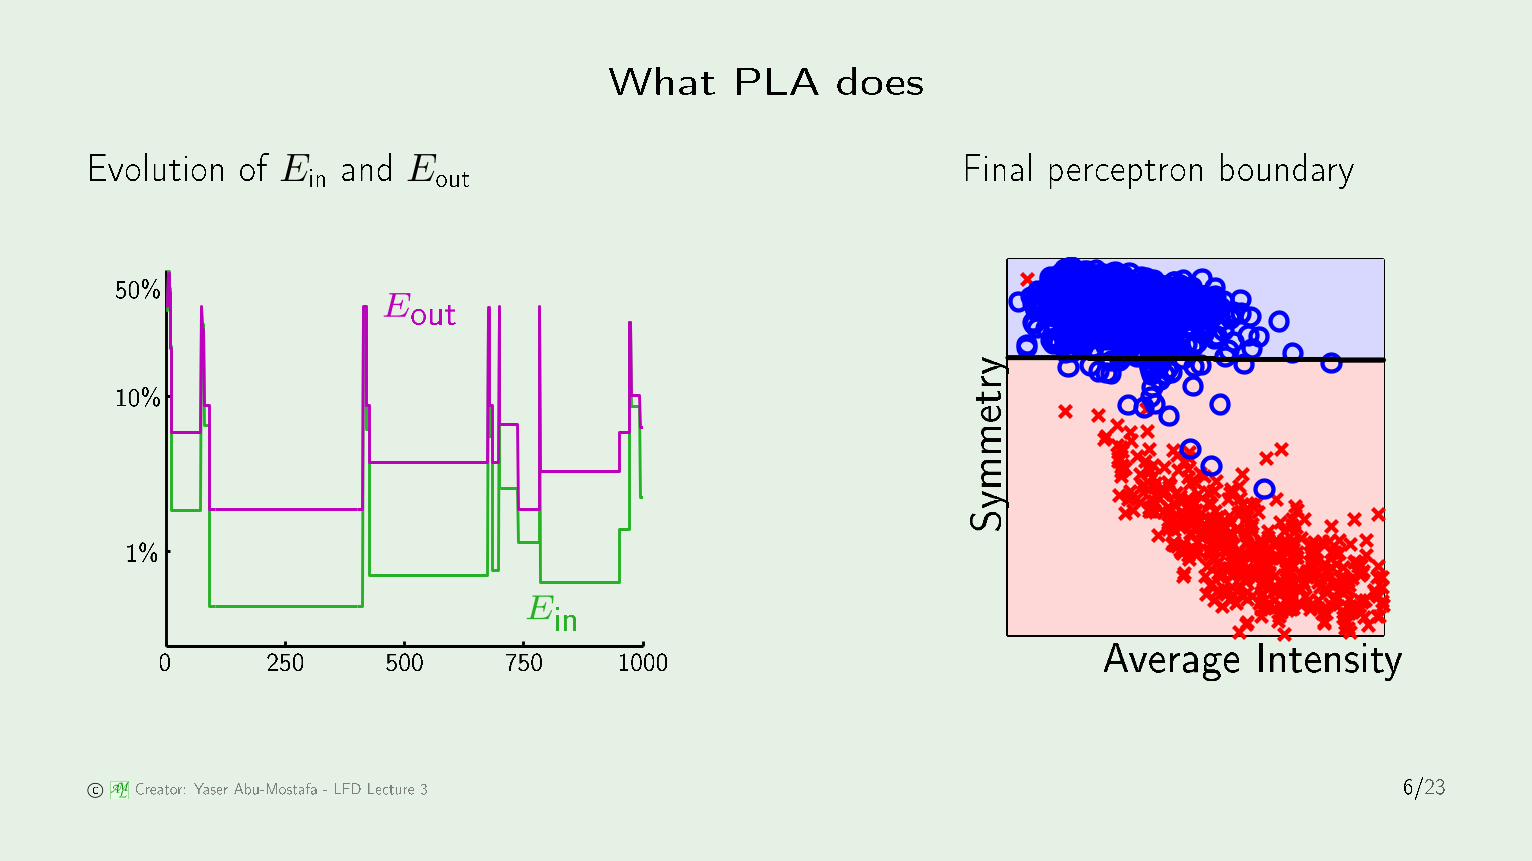
What PLA doesEvolution of Ein and Eout Final per eptron boundary
PSfrag repla ements EoutEin0 250 500 750 10001%
10%50%PSfrag repla ements
Average IntensitySymmetry0.050.10.150.20.250.30.350.4-8-7-6-5-4-3-2-101
© AML Creator: Yaser Abu-Mostafa - LFD Le ture 3 6/23

The `po ket' algorithmPLA: Po ket:
PSfrag repla ementsEout
Ein0 250 500 750 10001%10%50% PSfrag repla ements
EoutEin0 250 500 750 10001%
10%50%
© AML Creator: Yaser Abu-Mostafa - LFD Le ture 3 7/23
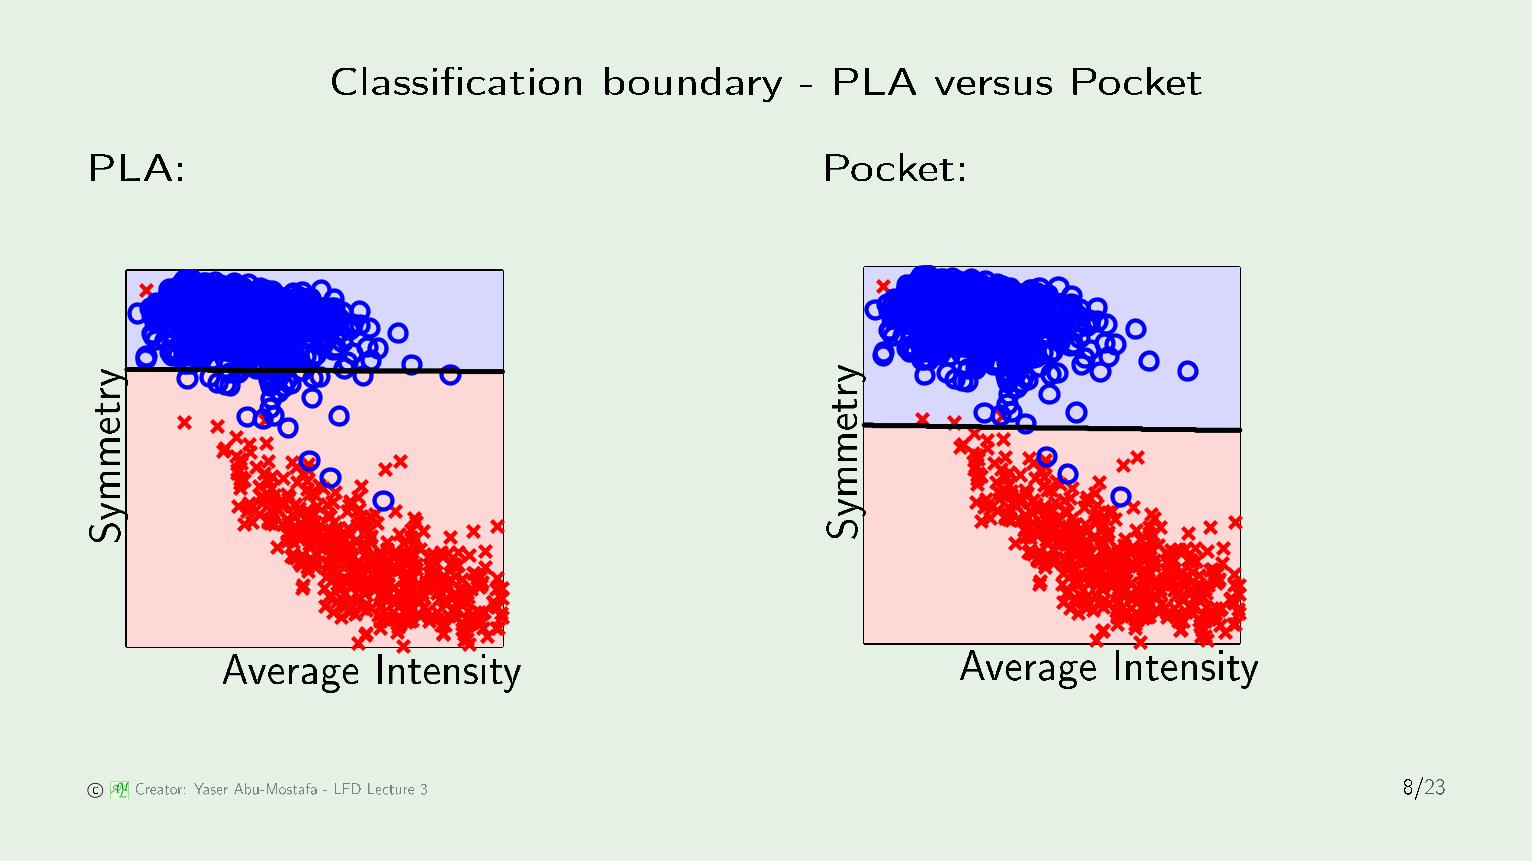
Classi� ation boundary - PLA versus Po ketPLA: Po ket:
PSfrag repla ements
Average IntensitySymmetry0.050.10.150.20.250.30.350.4-8-7-6-5-4-3-2-101
PSfrag repla ements
Average IntensitySymmetry0.050.10.150.20.250.30.350.4-8-7-6-5-4-3-2-101
© AML Creator: Yaser Abu-Mostafa - LFD Le ture 3 8/23

Outline• Input representation• Linear Classi� ation• Linear Regression regression ≡ real-valued output• Nonlinear Transformation
© AML Creator: Yaser Abu-Mostafa - LFD Le ture 3 9/23

Credit againClassi� ation: Credit approval (yes/no)Regression: Credit line (dollar amount)Input: x =
age 23 yearsannual salary $30,000years in residen e 1 yearyears in job 1 year urrent debt $15,000· · · · · ·
Linear regression output: h(x) =
d∑
i=0
wi xi = wTx © AM
L Creator: Yaser Abu-Mostafa - LFD Le ture 3 10/23

The data setCredit o� ers de ide on redit lines:
(x1, y1), (x2, y2), · · · , (xN , yN)
yn ∈ R is the redit line for ustomer xn.Linear regression tries to repli ate that. © AM
L Creator: Yaser Abu-Mostafa - LFD Le ture 3 11/23

How to measure the errorHow well does h(x) = wTx approximate f(x)?In linear regression, we use squared error (h(x) − f(x))2
in-sample error: Ein(h) =1
N
N∑
n=1
(h(xn) − yn)2
© AML Creator: Yaser Abu-Mostafa - LFD Le ture 3 12/23

Illustration of linear regression
PSfrag repla ements
x
y
00.10.20.30.40.50.60.70.80.9100.10.20.30.40.50.60.70.80.91
PSfrag repla ements
x1 x2
y
00.5100.20.40.60.8100.10.20.30.40.50.60.70.80.91
PSfrag repla ements
x1 x2
y
00.5100.20.40.60.8100.10.20.30.40.50.60.70.80.91 © AM
L Creator: Yaser Abu-Mostafa - LFD Le ture 3 13/23
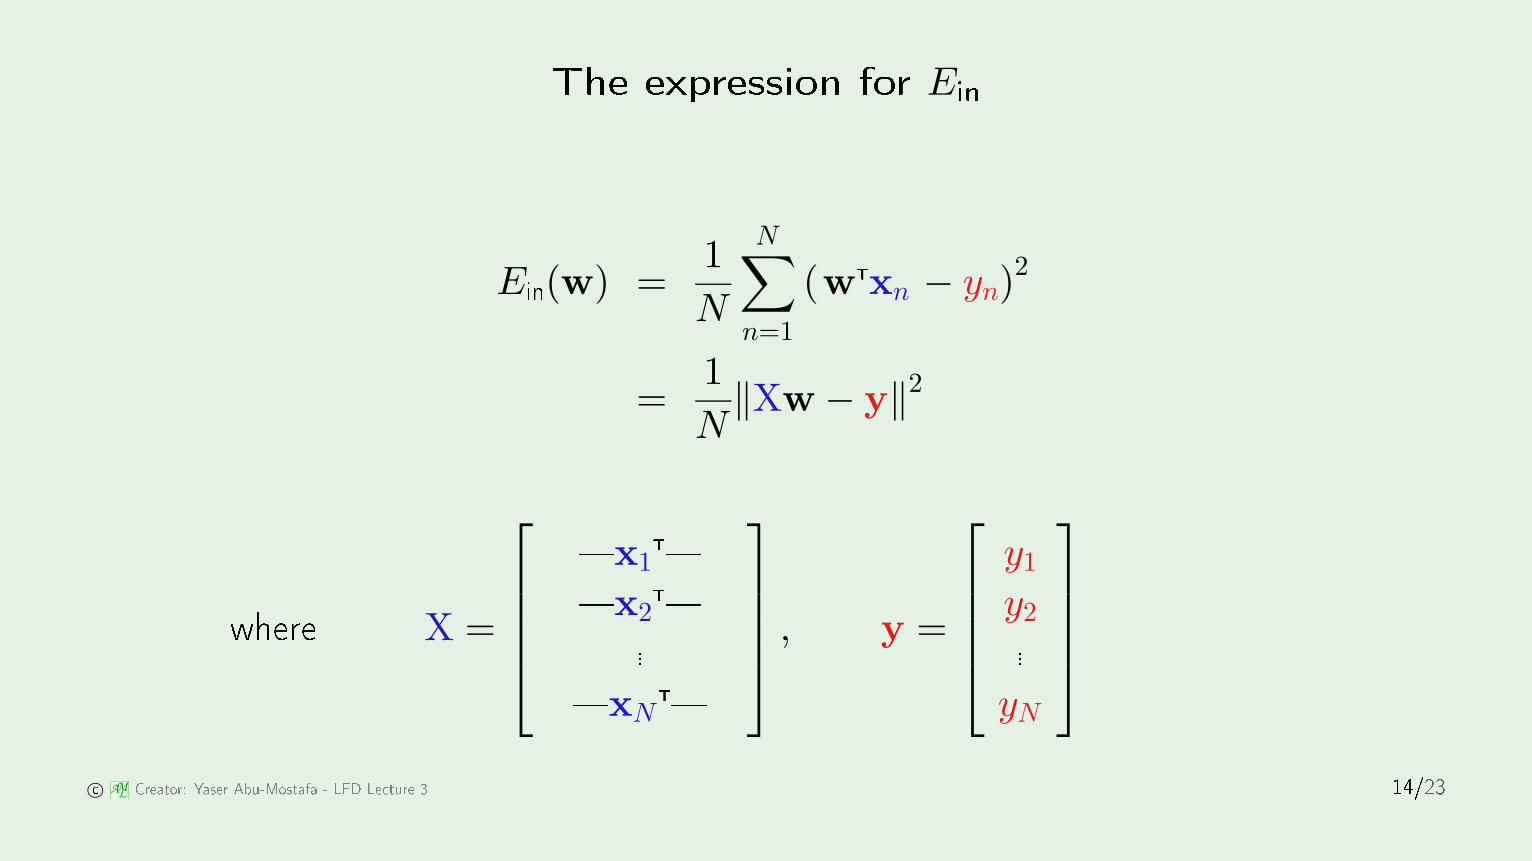
The expression for EinEin(w) =
1
N
N∑
n=1
(wTxn − yn)2
=1
N‖Xw − y‖2
where X =
�x1T��x2T�...�xNT�
, y =
y1
y2...yN
© AML Creator: Yaser Abu-Mostafa - LFD Le ture 3 14/23

Minimizing EinEin(w) = 1
N‖Xw − y‖2
∇Ein(w) = 2N
XT(Xw − y) = 0
XTXw = XTyw = X†y where X† = (XTX)−1XTX† is the `pseudo-inverse' of X
© AML Creator: Yaser Abu-Mostafa - LFD Le ture 3 15/23

The pseudo-inverseX† = (XTX)−1XT
[ ]
︸ ︷︷ ︸d+1× N
︸ ︷︷ ︸N × d+1
−1
[ ]
︸ ︷︷ ︸d+1 × N
︸ ︷︷ ︸d+1 × N
[ ]
︸ ︷︷ ︸d+1 × d+1
© AML Creator: Yaser Abu-Mostafa - LFD Le ture 3 16/23

The linear regression algorithm1: Constru t the matrix X and the ve tor y from the data set
(x1, y1), · · · , (xN , yN) as followsX =
�xT1��xT2�...�xTN�
︸ ︷︷ ︸input data matrix, y =
y1
y2...yN
︸ ︷︷ ︸target ve tor.
2: Compute the pseudo-inverse X† = (XTX)−1XT.3: Return w = X†y. © AM
L Creator: Yaser Abu-Mostafa - LFD Le ture 3 17/23

Linear regression for lassi� ationLinear regression learns a real-valued fun tion y = f(x) ∈ R
Binary-valued fun tions are also real-valued! ±1 ∈ R
Use linear regression to get w where wTxn ≈ yn = ±1
In this ase, sign(wTxn) is likely to agree with yn = ±1
Good initial weights for lassi� ation © AM
L Creator: Yaser Abu-Mostafa - LFD Le ture 3 18/23

Linear regression boundary
PSfrag repla ements
Average IntensitySymmetry
0.050.10.150.20.250.30.350.40.450.50.55-8-7-6-5-4-3-2-10 © AML Creator: Yaser Abu-Mostafa - LFD Le ture 3 18/23

Outline• Input representation• Linear Classi� ation• Linear Regression• Nonlinear Transformation
© AML Creator: Yaser Abu-Mostafa - LFD Le ture 3 19/23

Linear is limitedData: Hypothesis:
PSfrag repla ements−1 0 1
−1
0
1
PSfrag repla ements−1 0 1
−1
0
1
© AML Creator: Yaser Abu-Mostafa - LFD Le ture 3 20/23

Another exampleCredit line is a�e ted by `years in residen e'but not in a linear way!Nonlinear [[xi < 1]] and [[xi > 5]] are better.Can we do that with linear models? © AM
L Creator: Yaser Abu-Mostafa - LFD Le ture 3 21/23

Linear in what?Linear regression implements
d∑
i=0
wi xi
Linear lassi� ation implementssign( d∑
i=0
wi xi
)
Algorithms work be ause of linearity in the weights © AM
L Creator: Yaser Abu-Mostafa - LFD Le ture 3 22/23

Transform the data nonlinearly(x1, x2)
Φ−→ (x21, x
22)
PSfrag repla ements−1 0 1
−1
0
1
PSfrag repla ements0 0.5 1
0
0.5
1
© AML Creator: Yaser Abu-Mostafa - LFD Le ture 3 23/23


![?dgZYd ÕfYf[aYd k]jna[]k ljYfkY[lagf · PDF file* ?dgZYd ÔfYf[aYd k]jna[]k ljYfkY[lagf egfalgj C]q Õf\af_k H1 2010 H2 2010 H1 2011 H2 2011 H1 2012 H2 2012 H1 2013 1,181 1,230 1,160](https://static.documents.pub/doc/80x56/5a70d9597f8b9a98538c5df5/dgzyd-fyfayd-kjnak-ljyfkylagf-egfalgjwwweycompublicationvwluassetseyglobalfinancialservicespdf.jpg)


