Table of Contents UNITED STATES SECURITIES AND EXCHANGE COMMISSION Washington, D.C. 20549 FORM 10-Q ☒ QUARTERLY REPORT PURSUANT TO SECTION 13 OR 15(d) OF THE SECURITIES EXCHANGE ACT OF 1934 For the quarterly period ended September 30, 2020 OR ☐ TRANSITION REPORT PURSUANT TO SECTION 13 OR 15(d) OF THE SECURITIES EXCHANGE ACT OF 1934 For the transition period from to Commission File Number 0-22462 GIBRALTAR INDUSTRIES, INC. (Exact name of Registrant as specified in its charter) Delaware 16-1445150 (State or incorporation ) (I.R.S. Employer Identification No.) 3556 Lake Shore Road P.O. Box 2028 Buffalo New York 14219-0228 (Address of principal executive offices) (Zip Code) Registrant’s telephone number, including area code: (716) 826-6500 Securities registered pursuant to Section 12(b) of the Act: Title of each class Trading Symbol Name of each exchange on which registered Common Stock, $0.01 par value per share ROCK NASDAQ Stock Market Indicate by check mark whether the Registrant (1) has filed all reports required to be filed by Section 13 or 15(d) of the Securities Exchange Act of 1934 during the preceding 12 months (or for such shorter period that the Registrant was required to file such reports), and (2) has been subject to such filing requirements for the past 90 days. Yes ☒ No ☐ Indicate by check mark whether the registrant has submitted electronically every Interactive Data File required to be submitted pursuant to Rule 405 of Regulation S-T (§232.405 of this chapter) during the preceding 12 months (or for such shorter period that the registrant was required to submit such files). Yes ☒ No ☐ Indicate by check mark whether the Registrant is a large accelerated filer, an accelerated filer, a non-accelerated filer, a smaller reporting company, or an emerging growth company. See definitions of “large accelerated filer,” “accelerated filer,” “smaller reporting company,” and "emerging growth company" in Rule 12b-2 of the Exchange Act. (Check one): Large accelerated filer ☒ Accelerated filer ☐ Non-accelerated filer ☐ Smaller reporting company ☐ Emerging growth company ☐ If an emerging growth company, indicate by check mark if the registrant has elected not to use the extended transition period for complying with any new or revised financial accounting standards provided pursuant to Section 13(a) of the Exchange Act. ☐ Indicated by check mark whether the registrant is a shell company (as defined in Rule 12b-2 of the Exchange Act). Yes ☐ No ☒ As of October 26, 2020, the number of common shares outstanding was: 32,522,138.
Transcript
Table of Contents
UNITED STATESSECURITIES AND EXCHANGE COMMISSION
Washington, D.C. 20549
FORM 10-Q
☒ QUARTERLY REPORT PURSUANT TO SECTION 13 OR 15(d) OF THE SECURITIES EXCHANGE ACT OF 1934
For the quarterly period ended September 30, 2020
OR
☐ TRANSITION REPORT PURSUANT TO SECTION 13 OR 15(d) OF THE SECURITIES EXCHANGE ACT OF 1934
For the transition period from to
Commission File Number 0-22462
GIBRALTAR INDUSTRIES, INC.(Exact name of Registrant as specified in its charter)
Delaware 16-1445150(State or incorporation ) (I.R.S. Employer Identification No.)
3556 Lake Shore Road P.O. Box 2028 Buffalo New York 14219-0228(Address of principal executive offices) (Zip Code)
Registrant’s telephone number, including area code: (716) 826-6500
Securities registered pursuant to Section 12(b) of the Act:
Title of each class Trading Symbol Name of each exchange on which registeredCommon Stock, $0.01 par value per share ROCK NASDAQ Stock Market
Indicate by check mark whether the Registrant (1) has filed all reports required to be filed by Section 13 or 15(d) of the Securities Exchange Act of 1934during the preceding 12 months (or for such shorter period that the Registrant was required to file such reports), and (2) has been subject to such filingrequirements for the past 90 days. Yes ☒ No ☐
Indicate by check mark whether the registrant has submitted electronically every Interactive Data File required to be submitted pursuant to Rule 405 ofRegulation S-T (§232.405 of this chapter) during the preceding 12 months (or for such shorter period that the registrant was required to submit suchfiles). Yes ☒ No ☐
Indicate by check mark whether the Registrant is a large accelerated filer, an accelerated filer, a non-accelerated filer, a smaller reporting company, or anemerging growth company. See definitions of “large accelerated filer,” “accelerated filer,” “smaller reporting company,” and "emerging growth company" inRule 12b-2 of the Exchange Act. (Check one):
If an emerging growth company, indicate by check mark if the registrant has elected not to use the extended transition period for complying with any new orrevised financial accounting standards provided pursuant to Section 13(a) of the Exchange Act. ☐
Indicated by check mark whether the registrant is a shell company (as defined in Rule 12b-2 of the Exchange Act). Yes ☐ No ☒
As of October 26, 2020, the number of common shares outstanding was: 32,522,138.
Table of Contents
GIBRALTAR INDUSTRIES, INC.
INDEX
PAGE NUMBER
PART I. FINANCIAL INFORMATIONItem 1. Financial Statements
Consolidated Statements of Income for the Three and Nine Months Ended September 30, 2020 and 2019 (unaudited) 3Consolidated Statements of Comprehensive Income for the Three and Nine Months Ended September 30, 2020 and 2019
(unaudited) 4
Consolidated Balance Sheets as of September 30, 2020 (unaudited) and December 31, 2019 5Consolidated Statements of Cash Flows for the Nine Months Ended September 30, 2020 and 2019 (unaudited) 6Consolidated Statement of Shareholders’ Equity for the Nine Months Ended September 30, 2020 and 2019 (unaudited) 7Notes to Consolidated Financial Statements (unaudited) 9
Item 2. Management’s Discussion and Analysis of Financial Condition and Results of Operations 24Item 3. Quantitative and Qualitative Disclosures About Market Risk 33Item 4. Controls and Procedures 34PART II. OTHER INFORMATIONItem 1. Legal Proceedings 34Item 1A. Risk Factors 34Item 2. Unregistered Sales of Equity Securities and Use of Proceeds 34Item 3. Defaults Upon Senior Securities 34Item 4. Mine Safety Disclosures 35Item 5. Other Information 35Item 6. Exhibits 36
SIGNATURES 37
2
Table of Contents
PART I. FINANCIAL INFORMATION
Item 1. Financial Statements
GIBRALTAR INDUSTRIES, INC.CONSOLIDATED STATEMENTS OF INCOME
See accompanying notes to consolidated financial statements.
3
Table of Contents
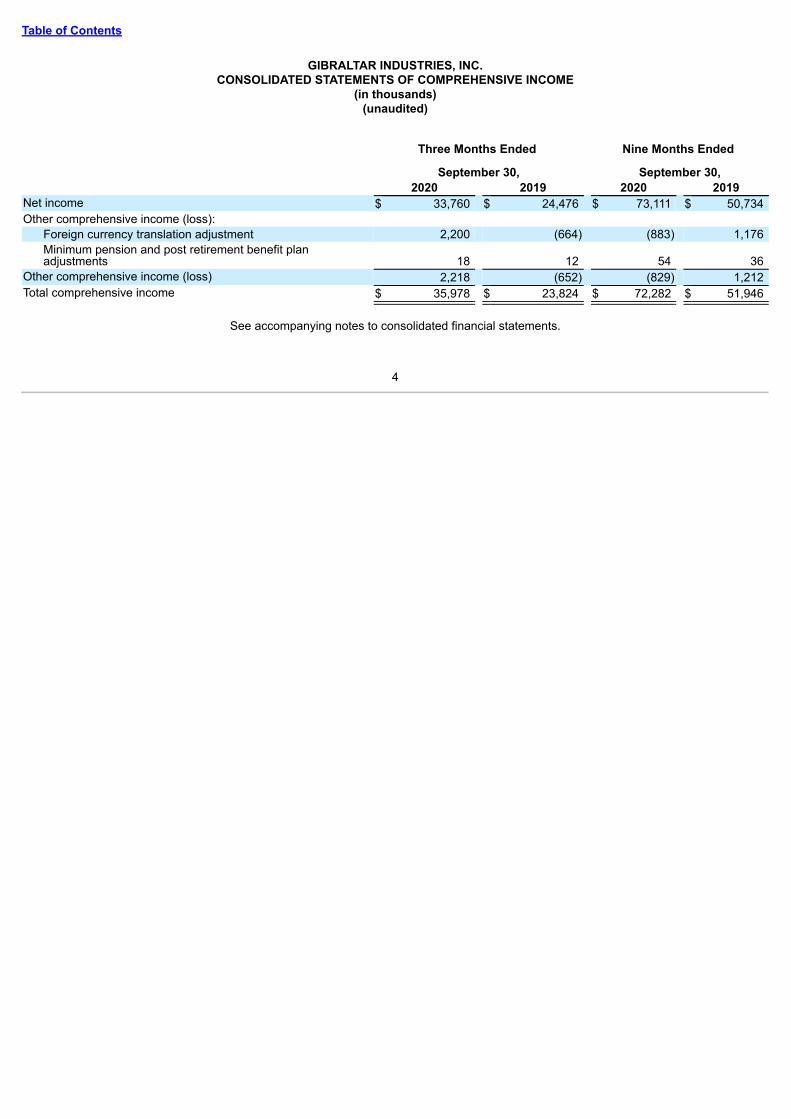
GIBRALTAR INDUSTRIES, INC.CONSOLIDATED STATEMENTS OF COMPREHENSIVE INCOME
(in thousands)(unaudited)
Three Months Ended
September 30,
Nine Months Ended
September 30, 2020 2019 2020 2019Net income $ 33,760 $ 24,476 $ 73,111 $ 50,734 Other comprehensive income (loss):
Foreign currency translation adjustment 2,200 (664) (883) 1,176 Minimum pension and post retirement benefit planadjustments 18 12 54 36
Other comprehensive income (loss) 2,218 (652) (829) 1,212 Total comprehensive income $ 35,978 $ 23,824 $ 72,282 $ 51,946
See accompanying notes to consolidated financial statements.
4
Table of Contents
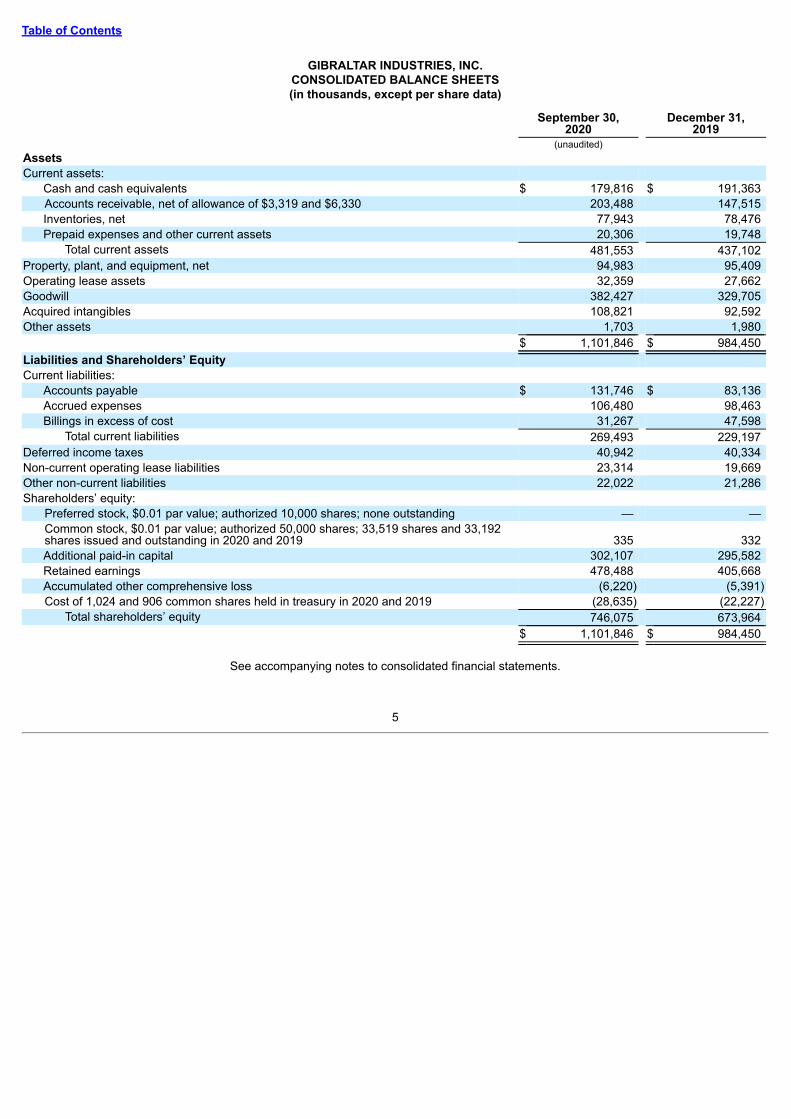
GIBRALTAR INDUSTRIES, INC.CONSOLIDATED BALANCE SHEETS(in thousands, except per share data)
September 30,2020
December 31,2019
(unaudited)AssetsCurrent assets:
Cash and cash equivalents $ 179,816 $ 191,363 Accounts receivable, net of allowance of $3,319 and $6,330 203,488 147,515 Inventories, net 77,943 78,476 Prepaid expenses and other current assets 20,306 19,748
Total current assets 481,553 437,102 Property, plant, and equipment, net 94,983 95,409 Operating lease assets 32,359 27,662 Goodwill 382,427 329,705 Acquired intangibles 108,821 92,592 Other assets 1,703 1,980
$ 1,101,846 $ 984,450 Liabilities and Shareholders’ EquityCurrent liabilities:
Accounts payable $ 131,746 $ 83,136 Accrued expenses 106,480 98,463 Billings in excess of cost 31,267 47,598
Total current liabilities 269,493 229,197 Deferred income taxes 40,942 40,334 Non-current operating lease liabilities 23,314 19,669 Other non-current liabilities 22,022 21,286 Shareholders’ equity:
Preferred stock, $0.01 par value; authorized 10,000 shares; none outstanding — — Common stock, $0.01 par value; authorized 50,000 shares; 33,519 shares and 33,192shares issued and outstanding in 2020 and 2019 335 332 Additional paid-in capital 302,107 295,582 Retained earnings 478,488 405,668 Accumulated other comprehensive loss (6,220) (5,391)Cost of 1,024 and 906 common shares held in treasury in 2020 and 2019 (28,635) (22,227)
Total shareholders’ equity 746,075 673,964 $ 1,101,846 $ 984,450
See accompanying notes to consolidated financial statements.
5
Table of Contents
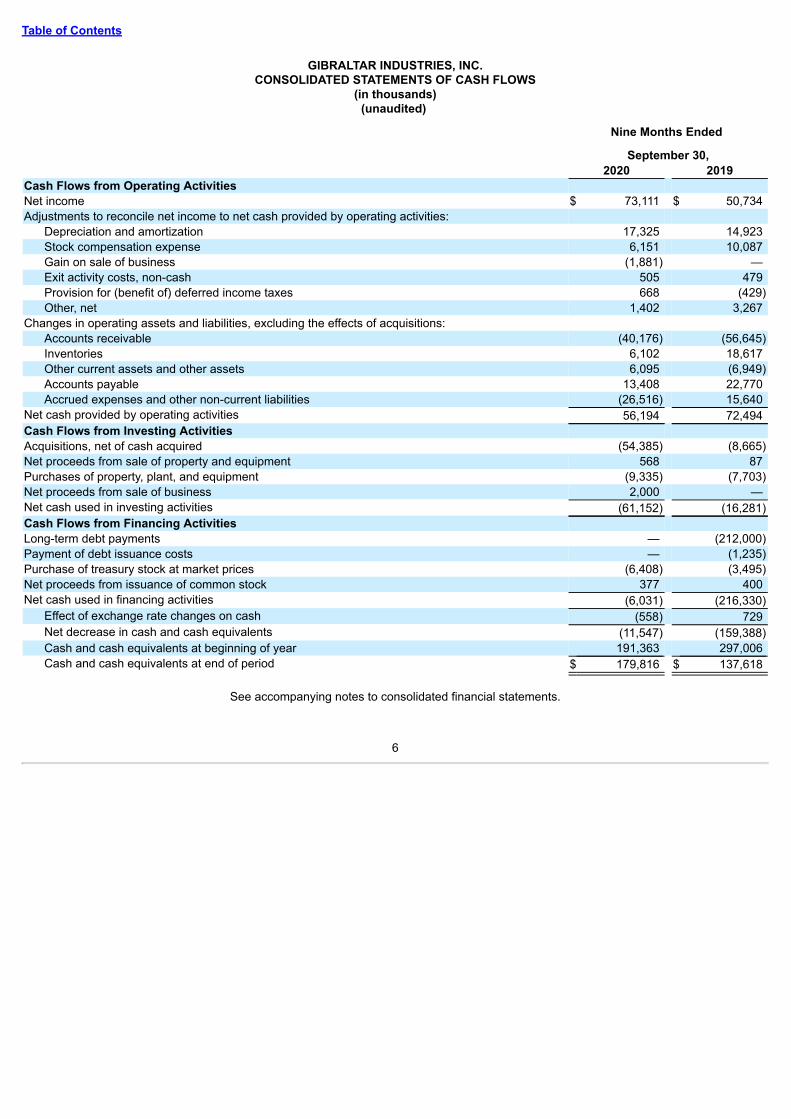
GIBRALTAR INDUSTRIES, INC.CONSOLIDATED STATEMENTS OF CASH FLOWS
(in thousands)(unaudited)
Nine Months Ended
September 30, 2020 2019Cash Flows from Operating ActivitiesNet income $ 73,111 $ 50,734 Adjustments to reconcile net income to net cash provided by operating activities:
Depreciation and amortization 17,325 14,923 Stock compensation expense 6,151 10,087 Gain on sale of business (1,881) — Exit activity costs, non-cash 505 479 Provision for (benefit of) deferred income taxes 668 (429)Other, net 1,402 3,267
Changes in operating assets and liabilities, excluding the effects of acquisitions:Accounts receivable (40,176) (56,645)Inventories 6,102 18,617 Other current assets and other assets 6,095 (6,949)Accounts payable 13,408 22,770 Accrued expenses and other non-current liabilities (26,516) 15,640
Net cash provided by operating activities 56,194 72,494 Cash Flows from Investing ActivitiesAcquisitions, net of cash acquired (54,385) (8,665)Net proceeds from sale of property and equipment 568 87 Purchases of property, plant, and equipment (9,335) (7,703)Net proceeds from sale of business 2,000 — Net cash used in investing activities (61,152) (16,281)Cash Flows from Financing ActivitiesLong-term debt payments — (212,000)Payment of debt issuance costs — (1,235)Purchase of treasury stock at market prices (6,408) (3,495)Net proceeds from issuance of common stock 377 400 Net cash used in financing activities (6,031) (216,330)
Effect of exchange rate changes on cash (558) 729 Net decrease in cash and cash equivalents (11,547) (159,388)Cash and cash equivalents at beginning of year 191,363 297,006 Cash and cash equivalents at end of period $ 179,816 $ 137,618
See accompanying notes to consolidated financial statements.
6
Table of Contents
GIBRALTAR INDUSTRIES, INC.CONSOLIDATED STATEMENT OF SHAREHOLDERS’ EQUITY
(in thousands)(unaudited)
Common StockAdditional
Paid-In CapitalRetainedEarnings
AccumulatedOther
ComprehensiveLoss
Treasury Stock TotalShareholders’
Equity Shares Amount Shares AmountBalance at December 31, 2019 33,192 $ 332 $ 295,582 $ 405,668 $ (5,391) 906 $ (22,227) $ 673,964 Net income — — — 12,059 — — — 12,059 Foreign currency translationadjustment — — — — (5,898) — — (5,898)Minimum pension and postretirement benefit plan adjustments,net of taxes of $7 — — — — 18 — — 18 Stock compensation expense — — 1,665 — — — — 1,665 Cumulative effect of accounting
change (See Note 2) — — — (291) — — — (291)Stock options exercised 3 — 24 — — — — 24 Net settlement of restricted stock
units 193 2 (2) — — 80 (4,184) (4,184)Balance at March 31, 2020 33,388 $ 334 $ 297,269 $ 417,436 $ (11,271) 986 $ (26,411) $ 677,357 Net income — — — 27,292 — — — 27,292 Foreign currency translationadjustment — — — — 2,815 — — 2,815 Minimum pension and postretirement benefit plan adjustments,net of taxes of $6 — — — — 18 — — 18 Stock compensation expense — — 2,506 — — — — 2,506 Stock options exercised 6 — 54 — — — — 54 Awards of common shares 4 — — — — — — — Net settlement of restricted stock
units 15 — — — — 7 (278) (278)Balance at June 30, 2020 33,413 $ 334 $ 299,829 $ 444,728 $ (8,438) 993 $ (26,689) $ 709,764 Net income — — — 33,760 — — — 33,760 Foreign currency translationadjustment — — — — 2,200 — — 2,200 Minimum pension and postretirement benefit plan adjustments,net of taxes of $7 — — — — 18 — — 18 Stock compensation expense — — 1,980 — — — — 1,980 Stock options exercised 31 — 299 — — — — 299 Net settlement of restricted stock
units 75 1 (1) — — 31 (1,946) (1,946)Balance at September 30, 2020 33,519 $ 335 $ 302,107 $ 478,488 $ (6,220) 1,024 $ (28,635) $ 746,075
See accompanying notes to consolidated financial statements.
7
Table of Contents
GIBRALTAR INDUSTRIES, INC.CONSOLIDATED STATEMENT OF SHAREHOLDERS’ EQUITY
(in thousands)(unaudited)
Common Stock
AdditionalPaid-In Capital
RetainedEarnings
AccumulatedOther
ComprehensiveLoss
Treasury StockTotal
Shareholders’EquityShares Amount Shares Amount
Balance at December 31, 2018 32,887 $ 329 $ 282,525 $ 338,995 $ (7,234) 796 $ (17,922) $ 596,693 Net income — — — 6,345 — — — 6,345 Foreign currency translationadjustment — — — — 842 — — 842 Minimum pension and postretirement benefit planadjustments, net of taxes of $4 — — — — 12 — — 12 Stock compensation expense — — 2,371 — — — — 2,371 Cumulative effect of accounting
units 127 1 (1) — — 59 (2,151) (2,151)Balance at March 31, 2019 33,026 $ 330 $ 285,034 $ 346,922 $ (6,380) 855 $ (20,073) $ 605,833 Net income — — — 19,913 — — — 19,913 Foreign currency translationadjustment — — — — 998 — — 998 Minimum pension and postretirement benefit planadjustments, net of taxes of $5 — — — — 12 — — 12 Stock compensation expense — — 3,720 — — — — 3,720 Stock options exercised 5 — 69 — — — — 69 Awards of common shares 8 — — — — — — —
Net settlement of restrictedstock units 62 1 (1) — — 25 (998) (998)
Balance at June 30, 2019 33,101 $ 331 $ 288,822 $ 366,835 $ (5,370) 880 $ (21,071) $ 629,547 Net income — — — 24,476 — — — 24,476 Foreign currency translationadjustment — — — — (664) — — (664)Minimum pension and postretirement benefit planadjustments, net of taxes of $4 — — — — 12 — — 12 Stock compensation expense — — 3,996 — — — — 3,996 Stock options exercised 16 — 192 — — — — 192
Net settlement of restrictedstock units 28 1 (1) — — 8 (346) (346)
Balance at September 30, 2019 33,145 $ 332 $ 293,009 $ 391,311 $ (6,022) 888 $ (21,417) $ 657,213
See accompanying notes to consolidated financial statements.
8
Table of Contents
GIBRALTAR INDUSTRIES, INC.NOTES TO CONSOLIDATED FINANCIAL STATEMENTS
(unaudited)
(1) CONSOLIDATED FINANCIAL STATEMENTS
The accompanying unaudited consolidated financial statements of Gibraltar Industries, Inc. (the "Company") have been prepared bymanagement in accordance with U.S. generally accepted accounting principles for interim financial information and with the instructions toForm 10-Q and Article 10 of Regulation S-X. In the opinion of management, all adjustments consisting of normal recurring adjustmentsconsidered necessary for the fair presentation of results for the interim period have been included. The Company's operations are seasonal;for this and other reasons, such as the impact of the COVID-19 pandemic, financial results for any interim period are not necessarilyindicative of the results expected for any subsequent interim period or for the full year. The accompanying unaudited consolidated financialstatements should be read in conjunction with the financial statements and notes thereto included in our annual Form 10-K for the yearended December 31, 2019.
The balance sheet at December 31, 2019 has been derived from the audited financial statements at that date, but does not include all of theinformation and footnotes required by U.S. generally accepted accounting principles for complete financial statements.
9
Table of Contents
(2) RECENT ACCOUNTING PRONOUNCEMENTS
Recent Accounting Pronouncements Adopted
Standard DescriptionFinancial Statement Effect or Other SignificantMatters
The objective of this standard is to provide financialstatement users with more decision-usefulinformation about the expected credit losses onfinancial instruments and other commitments toextend credit, including trade receivables, held byan entity at each reporting date. The amendmentsin this update replace the incurred loss impairmentmethodology in current GAAP with a methodologythat reflects expected credit losses and requiresconsideration of a broader range of reasonable andsupportable information to inform credit lossestimates.
The standard is effective for the Company as ofJanuary 1, 2020. The Company adopted theamendments in this update using the modifiedretrospective approach through a cumulative-effectadjustment to retained earnings of $291,000, net of$96,000 of income taxes, on the openingconsolidated balance sheet as of January 1, 2020.The Company's financial assets that are in thescope of the standard are contract assets andaccounts receivables which are short-term in nature.Additionally, the Company has identified andimplemented appropriate changes to the Company'sbusiness processes, policies and internal controls tosupport reporting and disclosures.
Date of adoption: Q1 2020
ASU 2018-15Intangibles - Goodwill andOther - Internal-Use Software(Subtopic 350-40), Customer'sAccounting for ImplementationCosts Incurred in a CloudComputing Arrangement ThatIs a Service Contract
The amendments in this update require an entity toapply the same requirements for capitalizingimplementation costs incurred in a hostingarrangement that is a service contract as the entitywould for implementation costs incurred to developor obtain internal-use software. The accounting forthe service element is not affected by theamendments in this update.
The standard is effective for the Company as ofJanuary 1, 2020. The Company adopted theamendments in this update using the prospectivemethod of adoption, and the adoption did not have amaterial impact to the Company's financialstatements.
Date of adoption: Q1 2020
Recent Accounting Pronouncements Not Yet Adopted
Standard DescriptionFinancial Statement Effect or Other SignificantMatters
ASU No. 2019-12Income Taxes (Topic 740),Simplifying the Accounting forIncome Taxes
The amendments in this update simplify theaccounting for income taxes by removing certainexceptions to the general principles in Topic 740and improve consistent application by clarifyingand amending existing guidance. The amendmentsof this standard are effective for fiscal yearsbeginning after December 15, 2020, includinginterim periods within those fiscal years. Earlyadoption is permitted, including adoption in anyinterim period for which financial statements havenot been issued, with the amendments to beapplied on a respective, modified retrospective orprospective basis, depending on the specificamendment.
The Company is currently evaluating therequirements of this standard. The standard is notexpected to have a material impact on theCompany's financial statements.
Date of adoption: Q1 2021
10
Table of Contents
(3) ACCOUNTS RECEIVABLE AND ALLOWANCE FOR DOUBTFUL ACCOUNTS
Accounts receivable consists of the following (in thousands):
September 30, 2020 December 31, 2019Trade accounts receivable $ 171,375 $ 133,238 Costs in excess of billings 35,432 20,607 Total accounts receivables 206,807 153,845 Less allowance for doubtful accounts and contract assets (3,319) (6,330)Accounts receivable $ 203,488 $ 147,515
Refer to Note 4 "Revenue" concerning the Company's costs in excess of billings.
The Company is exposed to credit losses through sales of products and services. The Company’s expected loss allowance methodology foraccounts receivable and costs in excess of billings (collectively "accounts receivable") is developed using historical collection experience,current and future economic and market conditions, and a review of the current status of customers' accounts receivables. Due to the short-term nature of such accounts receivable, the estimated amount of accounts receivable that may not be collected is based on aging of theaccounts receivable balances. Additionally, specific allowance amounts are established to record the appropriate provision for customers thatno longer share risk characteristics similar with other accounts receivable. The Company’s monitoring activities include timely accountreconciliation, dispute resolution, payment confirmation, consideration of customers' financial condition and macroeconomic conditions.Balances are written off when determined to be uncollectible. The Company considered the current and expected future economic andmarket conditions surrounding the COVID-19 pandemic and determined that the estimate of credit losses was not significantly impacted as ofSeptember 30, 2020.
Estimates are used to determine the allowance. It is based on assessment of anticipated payment and all other historical, current and futureinformation that is reasonably available.
The following table provides a roll-forward of the allowance for credit losses that is deducted from the amortized cost basis of accountsreceivable to present the net amount expected to be collected.
Beginning balance as of January 1, 2020 $ 6,330 Adoption of ASU 2016-13, cumulative-effect adjustment to retained earnings 387 Bad debt expense, net of recoveries 780 Write-off charged against the allowance and other adjustments (4,178)Ending balance as of September 30, 2020 $ 3,319
(4) REVENUE
Sales includes revenue from contracts with customers for designing, engineering, manufacturing and installation of solar racking systemsand greenhouse structures; extraction systems; roof and foundation ventilation products; centralized mail systems and electronic packagesolutions; rain dispersion products and roofing accessories; expanded and perforated metal; perimeter security solutions; expansion jointsand structural bearings.
Refer to Note 14 "Segment Information" for additional information related to revenue recognized by timing of transfer of control by reportablesegment.
As of September 30, 2020, the Company's remaining performance obligations are part of contracts that have an original expected duration ofone year or less.
Contract assets consist of costs in excess of billings. Contract liabilities consist of billings in excess of cost and unearned revenue. Thefollowing table presents the beginning and ending balances of costs in excess of billings, billings in excess of cost and unearned revenue asof September 30, 2020 and December 31, 2019, respectively,
11
Table of Contents
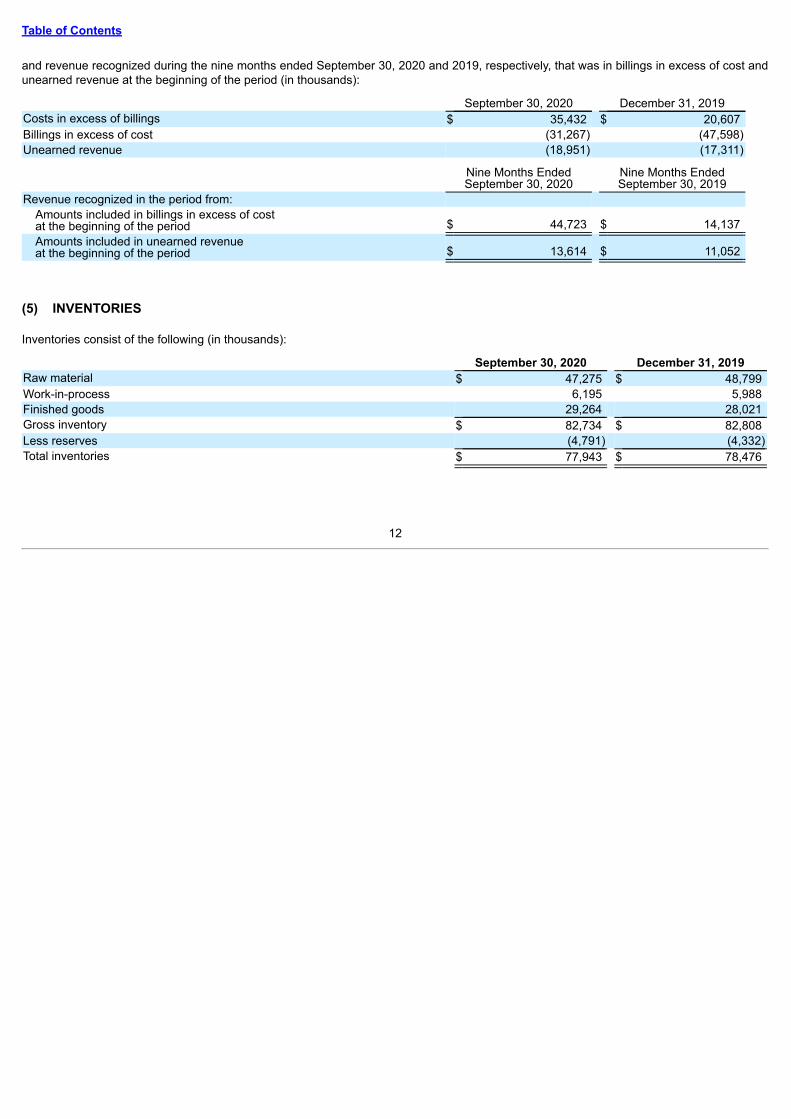
and revenue recognized during the nine months ended September 30, 2020 and 2019, respectively, that was in billings in excess of cost andunearned revenue at the beginning of the period (in thousands):
September 30, 2020 December 31, 2019Costs in excess of billings $ 35,432 $ 20,607 Billings in excess of cost (31,267) (47,598)Unearned revenue (18,951) (17,311)
Nine Months EndedSeptember 30, 2020
Nine Months EndedSeptember 30, 2019
Revenue recognized in the period from:Amounts included in billings in excess of costat the beginning of the period $ 44,723 $ 14,137 Amounts included in unearned revenueat the beginning of the period $ 13,614 $ 11,052
(5) INVENTORIES
Inventories consist of the following (in thousands):
September 30, 2020 December 31, 2019Raw material $ 47,275 $ 48,799 Work-in-process 6,195 5,988 Finished goods 29,264 28,021 Gross inventory $ 82,734 $ 82,808 Less reserves (4,791) (4,332)Total inventories $ 77,943 $ 78,476
12
Table of Contents
(6) ACQUISITIONS
2020 Acquisitions
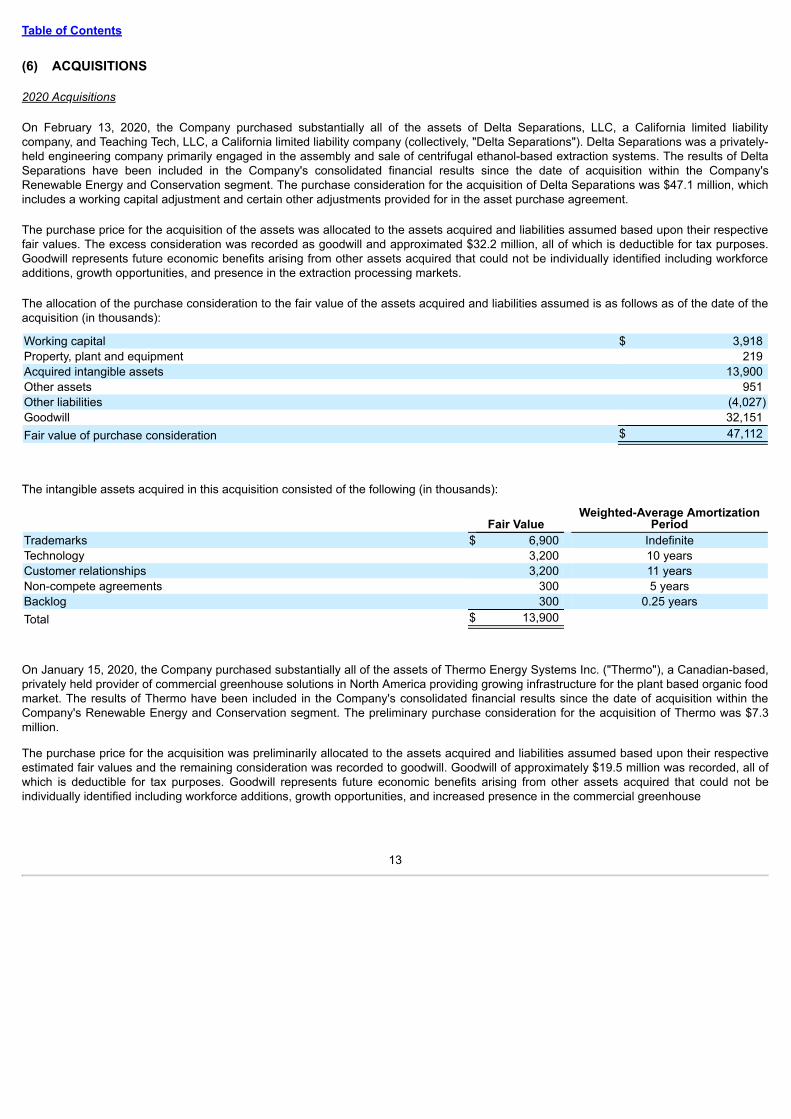
On February 13, 2020, the Company purchased substantially all of the assets of Delta Separations, LLC, a California limited liabilitycompany, and Teaching Tech, LLC, a California limited liability company (collectively, "Delta Separations"). Delta Separations was a privately-held engineering company primarily engaged in the assembly and sale of centrifugal ethanol-based extraction systems. The results of DeltaSeparations have been included in the Company's consolidated financial results since the date of acquisition within the Company'sRenewable Energy and Conservation segment. The purchase consideration for the acquisition of Delta Separations was $47.1 million, whichincludes a working capital adjustment and certain other adjustments provided for in the asset purchase agreement.
The purchase price for the acquisition of the assets was allocated to the assets acquired and liabilities assumed based upon their respectivefair values. The excess consideration was recorded as goodwill and approximated $32.2 million, all of which is deductible for tax purposes.Goodwill represents future economic benefits arising from other assets acquired that could not be individually identified including workforceadditions, growth opportunities, and presence in the extraction processing markets.
The allocation of the purchase consideration to the fair value of the assets acquired and liabilities assumed is as follows as of the date of theacquisition (in thousands):
Working capital $ 3,918 Property, plant and equipment 219 Acquired intangible assets 13,900 Other assets 951 Other liabilities (4,027)Goodwill 32,151 Fair value of purchase consideration $ 47,112
The intangible assets acquired in this acquisition consisted of the following (in thousands):
On January 15, 2020, the Company purchased substantially all of the assets of Thermo Energy Systems Inc. ("Thermo"), a Canadian-based,privately held provider of commercial greenhouse solutions in North America providing growing infrastructure for the plant based organic foodmarket. The results of Thermo have been included in the Company's consolidated financial results since the date of acquisition within theCompany's Renewable Energy and Conservation segment. The preliminary purchase consideration for the acquisition of Thermo was $7.3million.
The purchase price for the acquisition was preliminarily allocated to the assets acquired and liabilities assumed based upon their respectiveestimated fair values and the remaining consideration was recorded to goodwill. Goodwill of approximately $19.5 million was recorded, all ofwhich is deductible for tax purposes. Goodwill represents future economic benefits arising from other assets acquired that could not beindividually identified including workforce additions, growth opportunities, and increased presence in the commercial greenhouse
13
Table of Contents
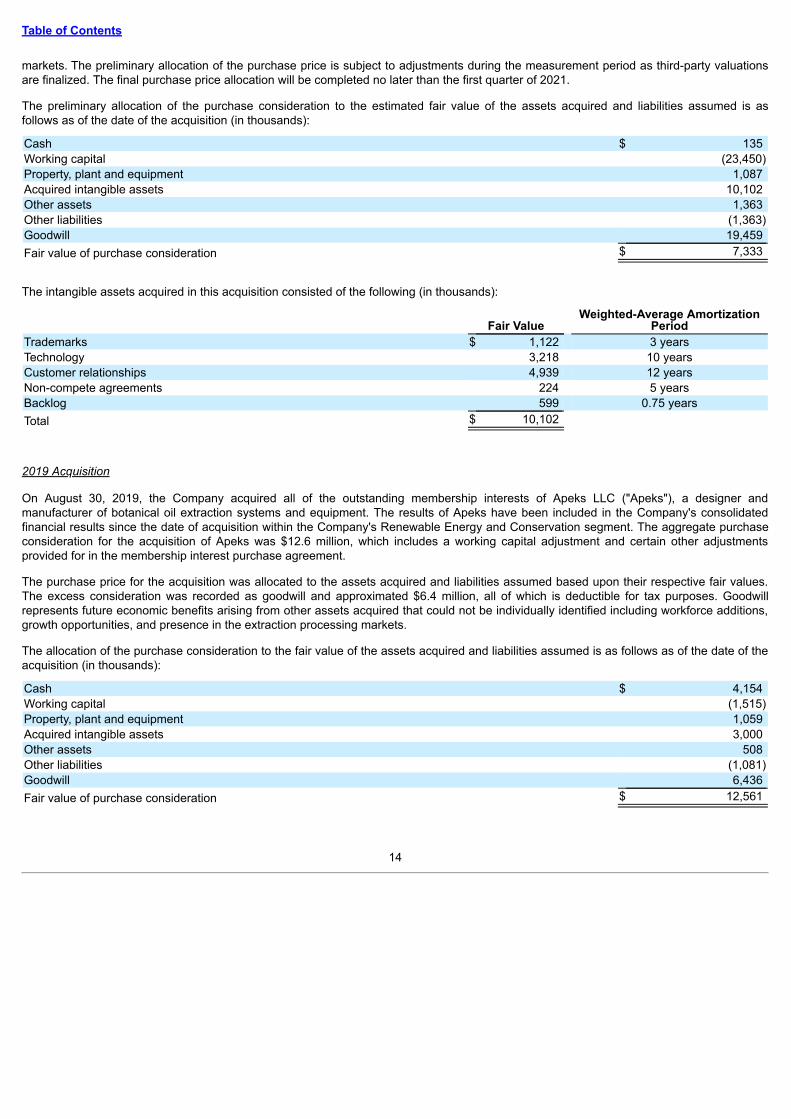
markets. The preliminary allocation of the purchase price is subject to adjustments during the measurement period as third-party valuationsare finalized. The final purchase price allocation will be completed no later than the first quarter of 2021.
The preliminary allocation of the purchase consideration to the estimated fair value of the assets acquired and liabilities assumed is asfollows as of the date of the acquisition (in thousands):
Cash $ 135 Working capital (23,450)Property, plant and equipment 1,087 Acquired intangible assets 10,102 Other assets 1,363 Other liabilities (1,363)Goodwill 19,459 Fair value of purchase consideration $ 7,333
The intangible assets acquired in this acquisition consisted of the following (in thousands):
On August 30, 2019, the Company acquired all of the outstanding membership interests of Apeks LLC ("Apeks"), a designer andmanufacturer of botanical oil extraction systems and equipment. The results of Apeks have been included in the Company's consolidatedfinancial results since the date of acquisition within the Company's Renewable Energy and Conservation segment. The aggregate purchaseconsideration for the acquisition of Apeks was $12.6 million, which includes a working capital adjustment and certain other adjustmentsprovided for in the membership interest purchase agreement.
The purchase price for the acquisition was allocated to the assets acquired and liabilities assumed based upon their respective fair values.The excess consideration was recorded as goodwill and approximated $6.4 million, all of which is deductible for tax purposes. Goodwillrepresents future economic benefits arising from other assets acquired that could not be individually identified including workforce additions,growth opportunities, and presence in the extraction processing markets.
The allocation of the purchase consideration to the fair value of the assets acquired and liabilities assumed is as follows as of the date of theacquisition (in thousands):
Cash $ 4,154 Working capital (1,515)Property, plant and equipment 1,059 Acquired intangible assets 3,000 Other assets 508 Other liabilities (1,081)Goodwill 6,436 Fair value of purchase consideration $ 12,561
14
Table of Contents
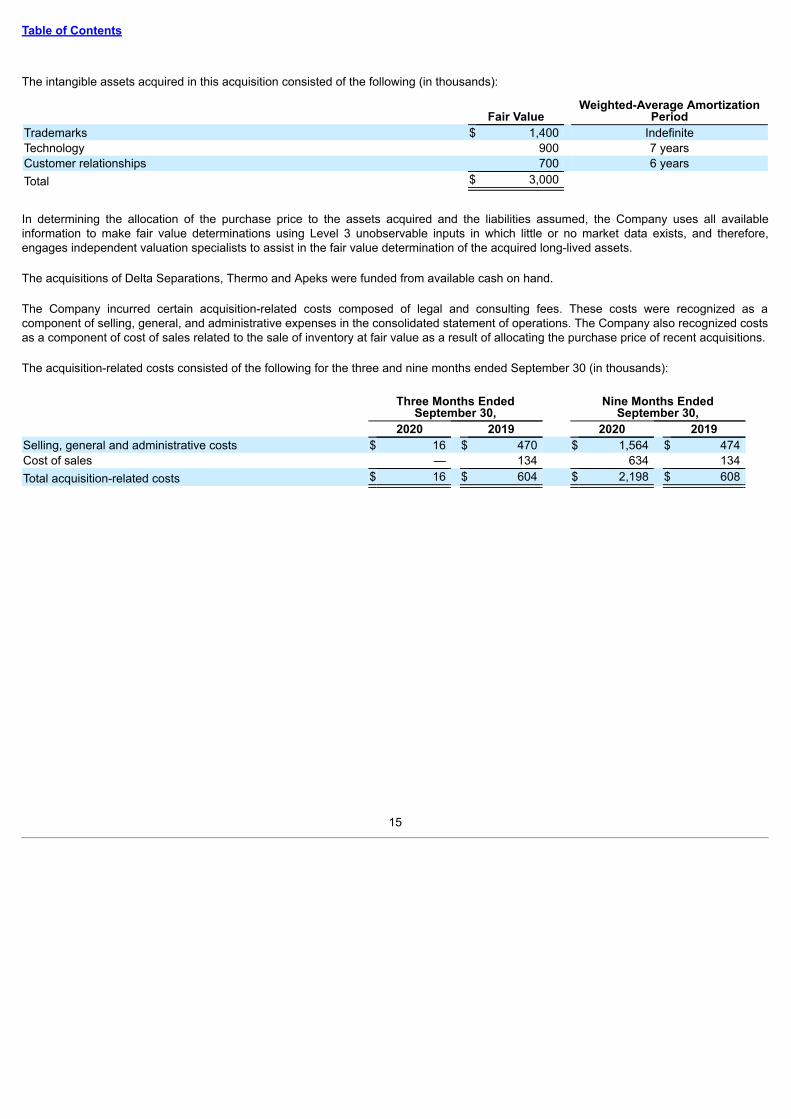
The intangible assets acquired in this acquisition consisted of the following (in thousands):
In determining the allocation of the purchase price to the assets acquired and the liabilities assumed, the Company uses all availableinformation to make fair value determinations using Level 3 unobservable inputs in which little or no market data exists, and therefore,engages independent valuation specialists to assist in the fair value determination of the acquired long-lived assets.
The acquisitions of Delta Separations, Thermo and Apeks were funded from available cash on hand.
The Company incurred certain acquisition-related costs composed of legal and consulting fees. These costs were recognized as acomponent of selling, general, and administrative expenses in the consolidated statement of operations. The Company also recognized costsas a component of cost of sales related to the sale of inventory at fair value as a result of allocating the purchase price of recent acquisitions.
The acquisition-related costs consisted of the following for the three and nine months ended September 30 (in thousands):
Three Months EndedSeptember 30,
Nine Months EndedSeptember 30,
2020 2019 2020 2019Selling, general and administrative costs $ 16 $ 470 $ 1,564 $ 474 Cost of sales — 134 634 134 Total acquisition-related costs $ 16 $ 604 $ 2,198 $ 608
15
Table of Contents
(7) GOODWILL AND RELATED INTANGIBLE ASSETS
Goodwill
The changes in the carrying amount of goodwill for the nine months ended September 30, 2020 are as follows (in thousands):
RenewableEnergy &
ConservationResidentialProducts
Industrial andInfrastructure
Products TotalBalance at December 31, 2019 $ 77,602 $ 198,075 $ 54,028 $ 329,705 Acquired goodwill 51,629 — — 51,629 Adjustments to prior year acquisitions 579 — — 579 Foreign currency translation 664 — (150) 514 Balance at September 30, 2020 $ 130,474 $ 198,075 $ 53,878 $ 382,427
The Company conducts its annual goodwill impairment test as of October 31 each year. All of the Company’s ten reporting units had fairvalues exceeding their carrying values as of October 31, 2019. In addition to the annual impairment test, the Company is required to regularlyassess whether a triggering event has occurred which would require interim impairment testing. The Company considered the current andfuture macroeconomic and market conditions, along with its current market capitalization, projected cash flows and internal and externalforecasts, and projections relating to the impact of the COVID-19 pandemic on each of its reporting units. The Company determined that atriggering event has not occurred which would require an interim impairment test to be performed.
Acquired Intangible Assets
Acquired intangible assets consist of the following (in thousands):
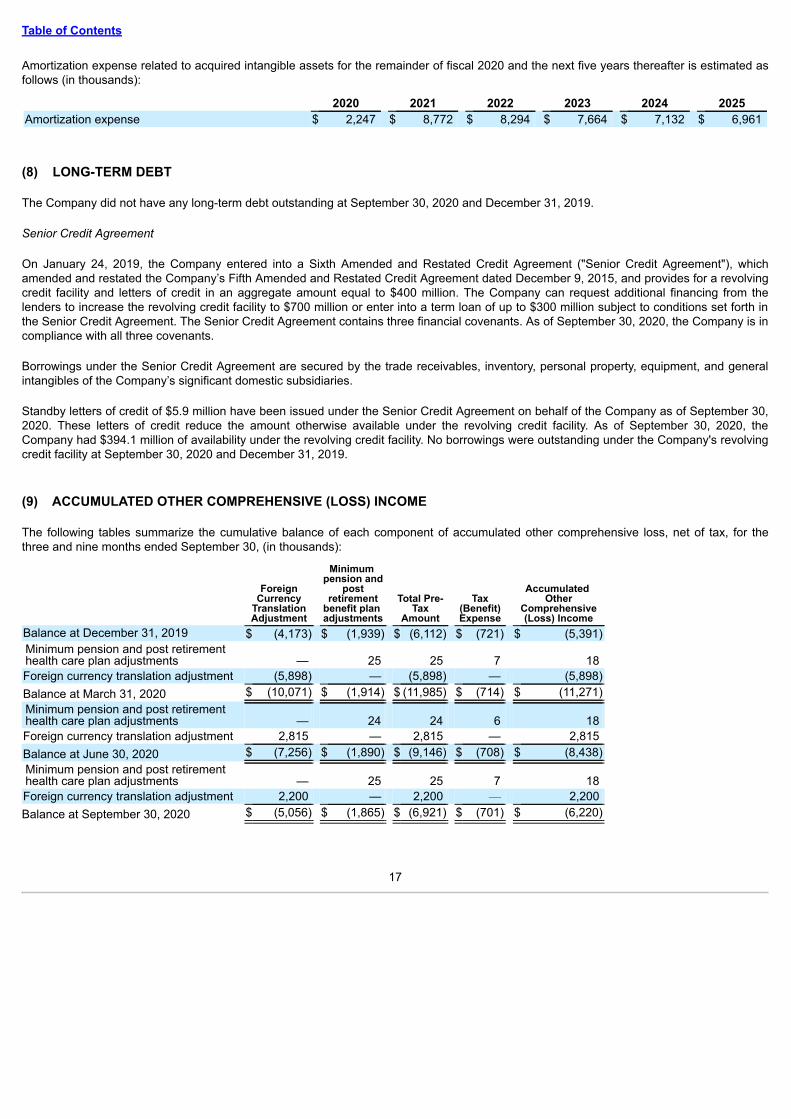
Amortization expense related to acquired intangible assets for the remainder of fiscal 2020 and the next five years thereafter is estimated asfollows (in thousands):
The Company did not have any long-term debt outstanding at September 30, 2020 and December 31, 2019.
Senior Credit Agreement
On January 24, 2019, the Company entered into a Sixth Amended and Restated Credit Agreement ("Senior Credit Agreement"), whichamended and restated the Company’s Fifth Amended and Restated Credit Agreement dated December 9, 2015, and provides for a revolvingcredit facility and letters of credit in an aggregate amount equal to $400 million. The Company can request additional financing from thelenders to increase the revolving credit facility to $700 million or enter into a term loan of up to $300 million subject to conditions set forth inthe Senior Credit Agreement. The Senior Credit Agreement contains three financial covenants. As of September 30, 2020, the Company is incompliance with all three covenants.
Borrowings under the Senior Credit Agreement are secured by the trade receivables, inventory, personal property, equipment, and generalintangibles of the Company’s significant domestic subsidiaries.
Standby letters of credit of $5.9 million have been issued under the Senior Credit Agreement on behalf of the Company as of September 30,2020. These letters of credit reduce the amount otherwise available under the revolving credit facility. As of September 30, 2020, theCompany had $394.1 million of availability under the revolving credit facility. No borrowings were outstanding under the Company's revolvingcredit facility at September 30, 2020 and December 31, 2019.
(9) ACCUMULATED OTHER COMPREHENSIVE (LOSS) INCOME
The following tables summarize the cumulative balance of each component of accumulated other comprehensive loss, net of tax, for thethree and nine months ended September 30, (in thousands):
ForeignCurrency
TranslationAdjustment
Minimum pension and
postretirement
benefit plan adjustments
Total Pre-Tax
Amount
Tax(Benefit)Expense
Accumulated Other
Comprehensive(Loss) Income
Balance at December 31, 2019 $ (4,173) $ (1,939) $ (6,112) $ (721) $ (5,391)Minimum pension and post retirementhealth care plan adjustments — 25 25 7 18 Foreign currency translation adjustment (5,898) — (5,898) — (5,898)Balance at March 31, 2020 $ (10,071) $ (1,914) $ (11,985) $ (714) $ (11,271)Minimum pension and post retirementhealth care plan adjustments — 24 24 6 18 Foreign currency translation adjustment 2,815 — 2,815 — 2,815 Balance at June 30, 2020 $ (7,256) $ (1,890) $ (9,146) $ (708) $ (8,438)Minimum pension and post retirementhealth care plan adjustments — 25 25 7 18 Foreign currency translation adjustment 2,200 — 2,200 — 2,200 Balance at September 30, 2020 $ (5,056) $ (1,865) $ (6,921) $ (701) $ (6,220)
17
Table of Contents
Foreign CurrencyTranslationAdjustment
Minimum pension and
post retirementbenefit plan adjustments
Total Pre-TaxAmount
Tax (Benefit)Expense
Accumulated OtherComprehensive(Loss) Income
Balance at December 31, 2018 $ (5,939) $ (2,040) $ (7,979) $ (745) $ (7,234)Minimum pension and post retirement health careplan adjustments — 16 16 4 12 Foreign currency translation adjustment 842 — 842 — 842
Balance at March 31, 2019 $ (5,097) $ (2,024) $ (7,121) $ (741) $ (6,380)Minimum pension and post retirement health careplan adjustments — 17 17 5 12 Foreign currency translation adjustment 998 — 998 — 998 Balance at June 30, 2019 $ (4,099) $ (2,007) $ (6,106) $ (736) $ (5,370)Minimum pension and post retirement health careplan adjustments — 16 16 4 12 Foreign currency translation adjustment (664) — (664) — (664)Balance at September 30, 2019 $ (4,763) $ (1,991) $ (6,754) $ (732) $ (6,022)
The realized adjustments relating to the Company’s minimum pension liability and post retirement health care costs were reclassified fromaccumulated other comprehensive loss and included in other expense in the consolidated statements of income.
(10) EQUITY-BASED COMPENSATION
On May 4, 2018, the shareholders of the Company approved the adoption of the Gibraltar Industries, Inc. 2018 Equity Incentive Plan (the"2018 Plan"). The 2018 Plan provides for the issuance of up to 1,000,000 shares of common stock and supplements the remaining sharesavailable for issuance under the existing Gibraltar Industries, Inc. 2015 Equity Incentive Plan (the "2015 Plan"). Both the 2018 Plan and the2015 Plan allow the Company to grant equity-based incentive compensation awards, in the form of non-qualified options, restricted shares,restricted stock units, performance shares, performance stock units, and stock rights to eligible participants.
In 2016, the shareholders of the Company approved the adoption of the Gibraltar Industries, Inc. 2016 Stock Plan for Non-EmployeeDirectors ("Non-Employee Directors Plan") which allows the Company to grant awards of shares of the Company's common stock to non-employee Directors of the Company and permits the Directors to defer receipt of such shares pursuant to the terms of the Non-EmployeeDirectors Plan.
Equity Based Awards - Settled in Stock
The following table sets forth the number of equity-based awards granted during the nine months ended September 30, which will convert toshares upon vesting, along with the weighted average grant date fair values:
2020 2019
AwardsNumber of
Awards
WeightedAverage
Grant DateFair Value
Number ofAwards (2)
WeightedAverage
Grant DateFair Value
Performance stock units (1) 129,513 $ 53.30 183,908 $ 40.49 Restricted stock units 74,247 $ 56.24 144,172 $ 39.43 Deferred stock units 12,402 $ 45.98 7,509 $ 37.95 Common shares 4,134 $ 45.98 7,509 $ 37.95
(1) The Company’s performance stock units (“PSUs”) represent shares granted for which the final number of shares earned dependson financial performance or market conditions. The number of shares to be issued may vary between 0% and 200% of the number ofperformance stock units granted depending on the relative achievement to targeted thresholds. The Company's PSUs with afinancial performance
18
Table of Contents
condition are based on either the Company’s return on invested capital (“ROIC”) over a one-year performance period or revenue,gross profit and operating profit thresholds over a two or three-year performance period. The Company's PSUs with a marketcondition are based on the ranking of the Company’s total shareholder return (“TSR”) performance, on a percentile basis, over athree year performance period compared to the S&P Small Cap Industrial sector, over the same three year performance period.
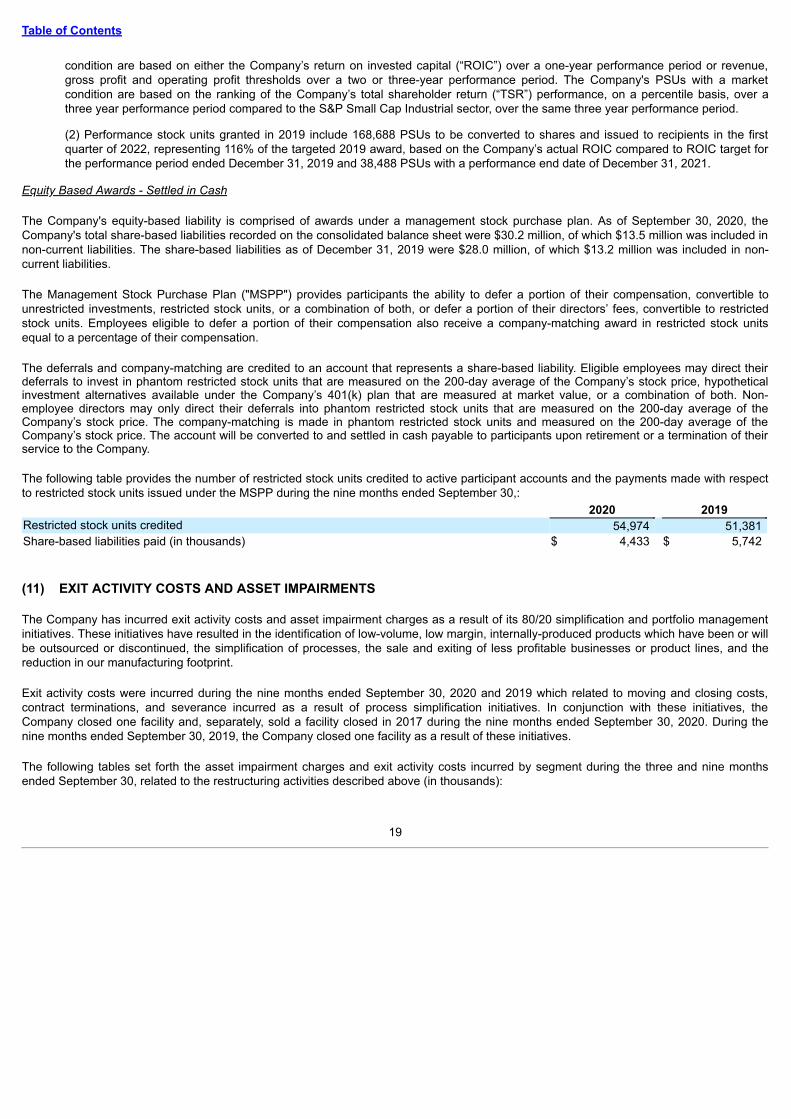
(2) Performance stock units granted in 2019 include 168,688 PSUs to be converted to shares and issued to recipients in the firstquarter of 2022, representing 116% of the targeted 2019 award, based on the Company’s actual ROIC compared to ROIC target forthe performance period ended December 31, 2019 and 38,488 PSUs with a performance end date of December 31, 2021.
Equity Based Awards - Settled in Cash
The Company's equity-based liability is comprised of awards under a management stock purchase plan. As of September 30, 2020, theCompany's total share-based liabilities recorded on the consolidated balance sheet were $30.2 million, of which $13.5 million was included innon-current liabilities. The share-based liabilities as of December 31, 2019 were $28.0 million, of which $13.2 million was included in non-current liabilities.
The Management Stock Purchase Plan ("MSPP") provides participants the ability to defer a portion of their compensation, convertible tounrestricted investments, restricted stock units, or a combination of both, or defer a portion of their directors’ fees, convertible to restrictedstock units. Employees eligible to defer a portion of their compensation also receive a company-matching award in restricted stock unitsequal to a percentage of their compensation.
The deferrals and company-matching are credited to an account that represents a share-based liability. Eligible employees may direct theirdeferrals to invest in phantom restricted stock units that are measured on the 200-day average of the Company’s stock price, hypotheticalinvestment alternatives available under the Company’s 401(k) plan that are measured at market value, or a combination of both. Non-employee directors may only direct their deferrals into phantom restricted stock units that are measured on the 200-day average of theCompany’s stock price. The company-matching is made in phantom restricted stock units and measured on the 200-day average of theCompany’s stock price. The account will be converted to and settled in cash payable to participants upon retirement or a termination of theirservice to the Company.
The following table provides the number of restricted stock units credited to active participant accounts and the payments made with respectto restricted stock units issued under the MSPP during the nine months ended September 30,:
2020 2019Restricted stock units credited 54,974 51,381 Share-based liabilities paid (in thousands) $ 4,433 $ 5,742
(11) EXIT ACTIVITY COSTS AND ASSET IMPAIRMENTS
The Company has incurred exit activity costs and asset impairment charges as a result of its 80/20 simplification and portfolio managementinitiatives. These initiatives have resulted in the identification of low-volume, low margin, internally-produced products which have been or willbe outsourced or discontinued, the simplification of processes, the sale and exiting of less profitable businesses or product lines, and thereduction in our manufacturing footprint.
Exit activity costs were incurred during the nine months ended September 30, 2020 and 2019 which related to moving and closing costs,contract terminations, and severance incurred as a result of process simplification initiatives. In conjunction with these initiatives, theCompany closed one facility and, separately, sold a facility closed in 2017 during the nine months ended September 30, 2020. During thenine months ended September 30, 2019, the Company closed one facility as a result of these initiatives.
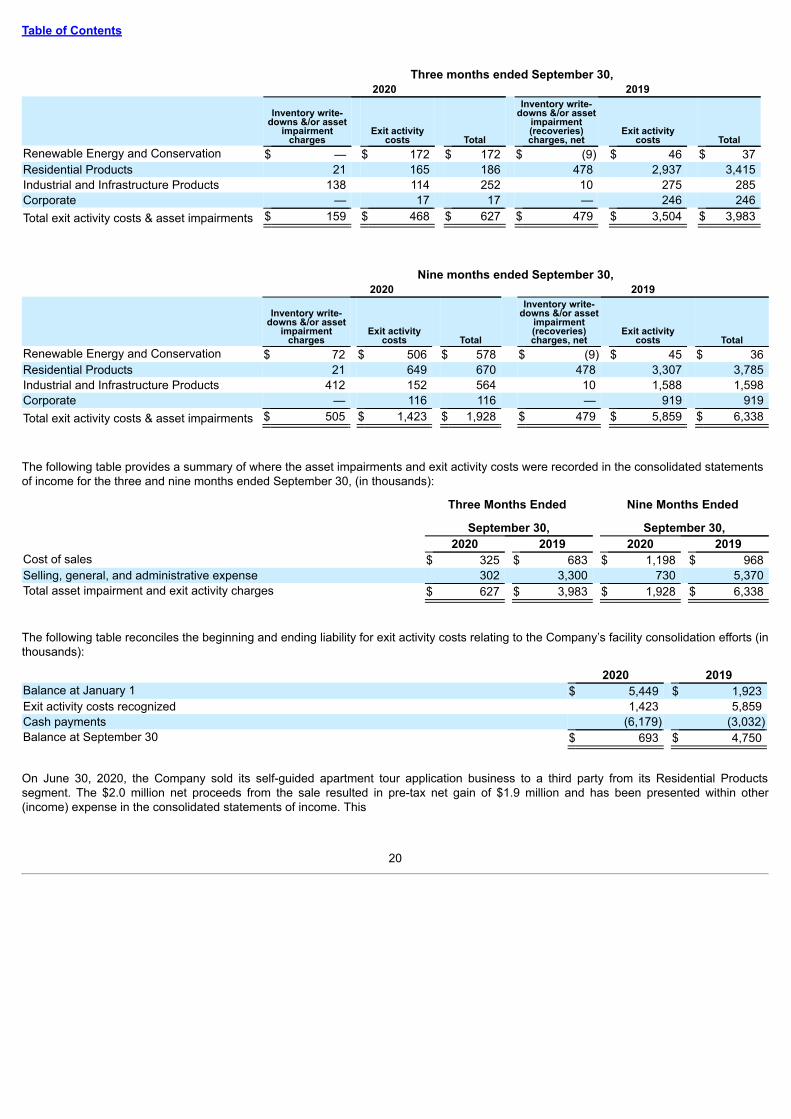
The following tables set forth the asset impairment charges and exit activity costs incurred by segment during the three and nine monthsended September 30, related to the restructuring activities described above (in thousands):
The following table provides a summary of where the asset impairments and exit activity costs were recorded in the consolidated statementsof income for the three and nine months ended September 30, (in thousands):
Three Months Ended
September 30,
Nine Months Ended
September 30,2020 2019 2020 2019
Cost of sales $ 325 $ 683 $ 1,198 $ 968 Selling, general, and administrative expense 302 3,300 730 5,370 Total asset impairment and exit activity charges $ 627 $ 3,983 $ 1,928 $ 6,338
The following table reconciles the beginning and ending liability for exit activity costs relating to the Company’s facility consolidation efforts (inthousands):
2020 2019Balance at January 1 $ 5,449 $ 1,923 Exit activity costs recognized 1,423 5,859 Cash payments (6,179) (3,032)Balance at September 30 $ 693 $ 4,750
On June 30, 2020, the Company sold its self-guided apartment tour application business to a third party from its Residential Productssegment. The $2.0 million net proceeds from the sale resulted in pre-tax net gain of $1.9 million and has been presented within other(income) expense in the consolidated statements of income. This
20
Table of Contents
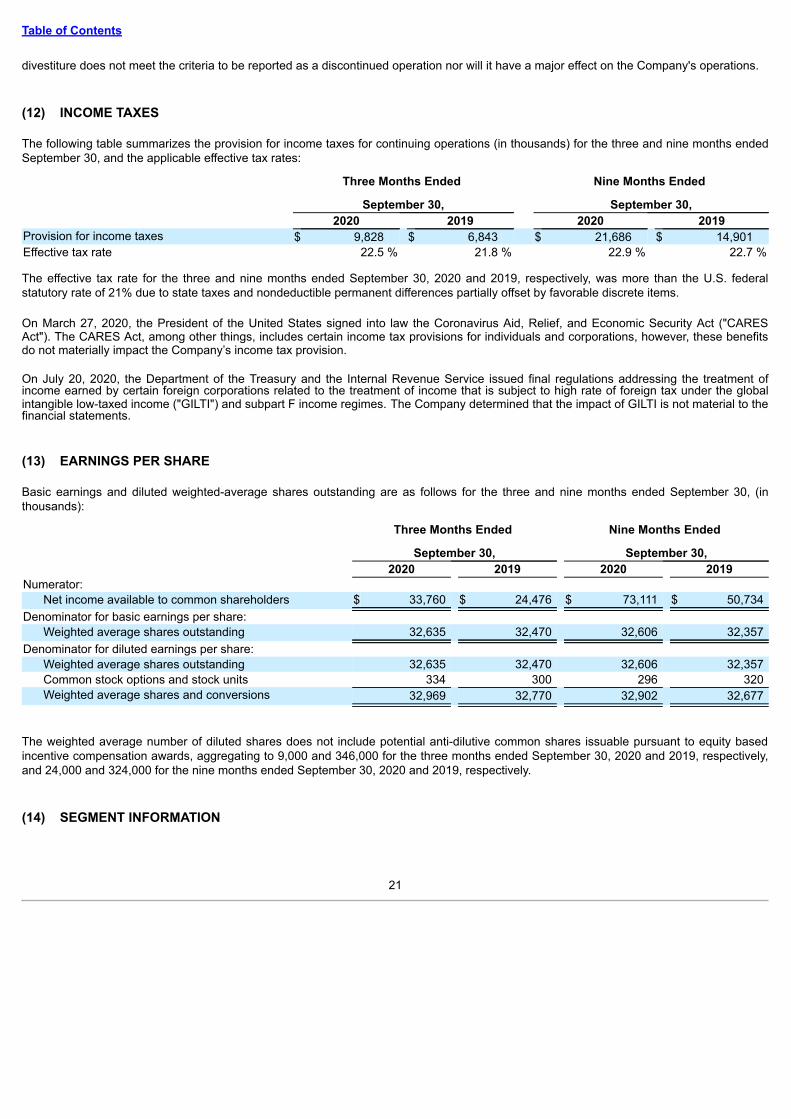
divestiture does not meet the criteria to be reported as a discontinued operation nor will it have a major effect on the Company's operations.
(12) INCOME TAXES
The following table summarizes the provision for income taxes for continuing operations (in thousands) for the three and nine months endedSeptember 30, and the applicable effective tax rates:
The effective tax rate for the three and nine months ended September 30, 2020 and 2019, respectively, was more than the U.S. federalstatutory rate of 21% due to state taxes and nondeductible permanent differences partially offset by favorable discrete items.
On March 27, 2020, the President of the United States signed into law the Coronavirus Aid, Relief, and Economic Security Act ("CARESAct"). The CARES Act, among other things, includes certain income tax provisions for individuals and corporations, however, these benefitsdo not materially impact the Company’s income tax provision.
On July 20, 2020, the Department of the Treasury and the Internal Revenue Service issued final regulations addressing the treatment ofincome earned by certain foreign corporations related to the treatment of income that is subject to high rate of foreign tax under the globalintangible low-taxed income ("GILTI") and subpart F income regimes. The Company determined that the impact of GILTI is not material to thefinancial statements.
(13) EARNINGS PER SHARE
Basic earnings and diluted weighted-average shares outstanding are as follows for the three and nine months ended September 30, (inthousands):
Three Months Ended
September 30,
Nine Months Ended
September 30,2020 2019 2020 2019
Numerator:Net income available to common shareholders $ 33,760 $ 24,476 $ 73,111 $ 50,734
Denominator for basic earnings per share:Weighted average shares outstanding 32,635 32,470 32,606 32,357
Denominator for diluted earnings per share:Weighted average shares outstanding 32,635 32,470 32,606 32,357 Common stock options and stock units 334 300 296 320 Weighted average shares and conversions 32,969 32,770 32,902 32,677
The weighted average number of diluted shares does not include potential anti-dilutive common shares issuable pursuant to equity basedincentive compensation awards, aggregating to 9,000 and 346,000 for the three months ended September 30, 2020 and 2019, respectively,and 24,000 and 324,000 for the nine months ended September 30, 2020 and 2019, respectively.
(14) SEGMENT INFORMATION
21
Table of Contents
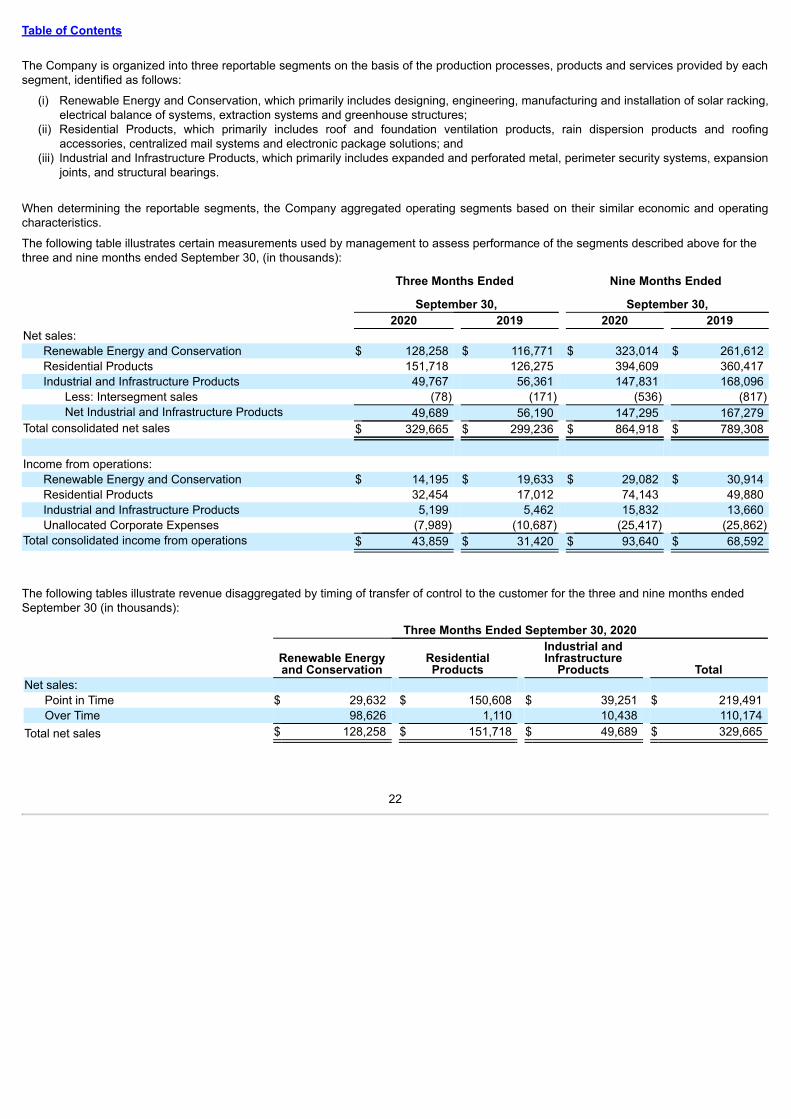
The Company is organized into three reportable segments on the basis of the production processes, products and services provided by eachsegment, identified as follows:
(i) Renewable Energy and Conservation, which primarily includes designing, engineering, manufacturing and installation of solar racking,electrical balance of systems, extraction systems and greenhouse structures;
(ii) Residential Products, which primarily includes roof and foundation ventilation products, rain dispersion products and roofingaccessories, centralized mail systems and electronic package solutions; and
(iii) Industrial and Infrastructure Products, which primarily includes expanded and perforated metal, perimeter security systems, expansionjoints, and structural bearings.
When determining the reportable segments, the Company aggregated operating segments based on their similar economic and operatingcharacteristics.
The following table illustrates certain measurements used by management to assess performance of the segments described above for thethree and nine months ended September 30, (in thousands):
Three Months Ended
September 30,
Nine Months Ended
September 30,2020 2019 2020 2019
Net sales:Renewable Energy and Conservation $ 128,258 $ 116,771 $ 323,014 $ 261,612 Residential Products 151,718 126,275 394,609 360,417 Industrial and Infrastructure Products 49,767 56,361 147,831 168,096
Total consolidated net sales $ 329,665 $ 299,236 $ 864,918 $ 789,308
Income from operations:Renewable Energy and Conservation $ 14,195 $ 19,633 $ 29,082 $ 30,914 Residential Products 32,454 17,012 74,143 49,880 Industrial and Infrastructure Products 5,199 5,462 15,832 13,660 Unallocated Corporate Expenses (7,989) (10,687) (25,417) (25,862)
Total consolidated income from operations $ 43,859 $ 31,420 $ 93,640 $ 68,592
The following tables illustrate revenue disaggregated by timing of transfer of control to the customer for the three and nine months endedSeptember 30 (in thousands):
Three Months Ended September 30, 2020
Renewable Energyand Conservation
ResidentialProducts
Industrial andInfrastructure
Products TotalNet sales:
Point in Time $ 29,632 $ 150,608 $ 39,251 $ 219,491 Over Time 98,626 1,110 10,438 110,174
Total net sales $ 128,258 $ 151,718 $ 49,689 $ 329,665
22
Table of Contents
Three Months Ended September 30, 2019
Renewable Energyand Conservation
ResidentialProducts
Industrial andInfrastructure
Products TotalNet sales:
Point in Time $ 12,682 $ 125,350 $ 46,781 $ 184,813 Over Time 104,089 925 9,409 114,423
Total net sales $ 116,771 $ 126,275 $ 56,190 $ 299,236
Nine Months Ended September 30, 2020
Renewable Energyand Conservation
ResidentialProducts
Industrial andInfrastructure
Products TotalNet sales:
Point in Time $ 56,636 $ 391,227 $ 115,925 $ 563,788 Over Time 266,378 3,382 31,370 301,130
Total net sales $ 323,014 $ 394,609 $ 147,295 $ 864,918
Nine Months Ended September 30, 2019
Renewable Energyand Conservation
ResidentialProducts
Industrial andInfrastructure
Products TotalNet sales:
Point in Time $ 28,441 $ 357,808 $ 138,383 $ 524,632 Over Time 233,171 2,609 28,896 264,676
Total net sales $ 261,612 $ 360,417 $ 167,279 $ 789,308
(15) SUBSEQUENT EVENTS
On October 15, 2020, the Company acquired substantially all of the assets of Architectural Mailboxes, LLC ("Architectural Mailboxes") in anall cash transaction for approximately $27 million. Architectural Mailboxes was a privately-held company in the business of designing,developing, and selling decorative residential mailboxes and related products. A preliminary purchase price allocation for the ArchitecturalMailboxes business has not yet been determined. Architectural Mailboxes will be reported as a part of our Residential Products segment.
23
Table of Contents
Item 2. Management’s Discussion and Analysis of Financial Condition and Results of Operations
Certain information set forth herein includes statements that express our opinions, expectations, beliefs, plans, objectives, assumptions orprojections regarding future events or future results and, therefore are, or may be deemed to be, “forward-looking statements.” Theseforward-looking statements can generally be identified by the use of forward-looking terminology, including the terms “believes,” “anticipates,”"aspires," “expects,” “estimates,” “seeks,” “projects,” “intends,” “plans,” “may,” “will” or “should” or, in each case, their negative or othervariations or comparable terminology. These forward-looking statements include all matters that are not historical facts. They includestatements regarding our intentions, beliefs or current expectations concerning, among other things, our results of operations, financialcondition, liquidity, prospects, growth, competition, strategies and the industries in which we operate. By their nature, forward-lookingstatements involve risks and uncertainties because they relate to events and depend on circumstances that may or may not occur in thefuture. We believe that these risks and uncertainties include, but are not limited to, those described in the “Risk Factors” disclosed in ourAnnual Report on Form 10-K along with Item 1A of this Form 10-Q. Although we base these forward-looking statements on assumptions thatwe believe are reasonable when made, we caution you that forward-looking statements are not guarantees of future performance and thatour actual results of operations, financial condition, liquidity and the development of the industries in which we operate may differ materiallyfrom those made in or suggested by the forward-looking statements contained herein. In addition, even if our results of operations, financialcondition, liquidity, and the development of the industries in which we operate are consistent with the forward-looking statements contained inthis quarterly report, those results or developments may not be indicative of results or developments in subsequent periods. Given theserisks and uncertainties, you are cautioned not to place undue reliance on these forward-looking statements. Any forward-looking statementsthat we make herein speak only as of the date of those statements, and we undertake no obligation to update those statements or to publiclyannounce the results of any revisions to any of those statements to reflect future events or developments. Comparisons of results for currentand any prior periods are not intended to express any future trends or indications of future performance, unless expressed as such, andshould only be viewed as historical data.
We use certain operating performance measures, specifically consolidated gross margin, operating margin by segment and consolidatedoperating margin, to manage our businesses, set operational goals, and establish performance targets for incentive compensation for ouremployees. We define consolidated gross margin as a percentage of total consolidated gross profit to total consolidated net sales. We defineoperating margin by segment as a percentage of total income from operations by segment to total net sales by segment and consolidatedoperating margin as a percentage of total consolidated income from operations to total consolidated net sales. We believe consolidated grossmargin and operating margin may be useful to investors in evaluating the profitability of our segments and Company on a consolidated basis.
Overview
Gibraltar Industries, Inc. (the "Company") is a leading manufacturer and provider of products and services for the renewable energy,conservation, residential, industrial and infrastructure markets.
The Company operates and reports its results in the following three reporting segments:• Renewable Energy and Conservation;• Residential Products; and• Industrial and Infrastructure Products.
The Company serves customers primarily in North America including renewable energy (solar) developers, institutional and commercialgrowers of food and plants, home improvement retailers, wholesalers, distributors, and contractors. As of September 30, 2020, we operated45 facilities, which include 32 manufacturing facilities and five distribution centers, in 19 states, Canada, China and Japan. Our operationalinfrastructure provides the necessary scale to support local, regional, and national customers in each of our markets.
COVID-19 Update
While the Company continues to encounter challenges and uncertainty associated with COVID-19, the pandemic did not have a materialadverse effect on our reported results for the three and nine months ended September 30, 2020. While most of our operations have beenconsidered essential businesses and have remained open during the pandemic, the decision to keep our team intact despite some pandemicrelated softness in demand in certain businesses enabled us to deliver revenue and earnings growth during this period. Our top prioritiescontinue to be
24
Table of Contents
focused on our organization, keeping the team and their families as safe as possible, our supply chain operating well, and providing a highlevel of responsiveness to customer needs. We will continue to actively monitor the impact of the COVID-19 outbreak on operations for theremainder of 2020 and beyond, and make adjustments to our operating protocols as necessary. The extent to which our operations will beimpacted by the outbreak will largely depend on future developments, which are highly uncertain and cannot be accurately predicted,including new information which may emerge concerning the severity, or resurgence, of the outbreak and actions by government authoritiesto contain the outbreak or respond to its impact, among other things. Refer to the Company's Outlook section in this management discussionand analysis for consideration relative to future periods.
Business Strategy
The Company’s mission is to create compounding and sustainable value with strong leadership positions in higher growth and profitable endmarkets. The Company's operational foundation employs a Three-Pillar strategy focusing on three core tenets: Business Systems, PortfolioManagement, and Organizational Development.
1. Business Systems - operational excellence and product innovation supported by an execution review of the Company's monthlybusiness performance, implementation of key investments, information technology operating and digital systems performance, andnew product and services innovation.
2. Portfolio Management - acquisitions and portfolio management is focused on optimizing the Company’s business portfolio andensuring our human and financial capital are invested to provide sustainable, profitable growth while expanding our relevance tocustomers and shaping our markets. The acquisitions of Apeks, LLC ("Apeks") in August 2019, Thermo Energy Systems Inc.("Thermo") in January 2020, Delta Separations LLC and Teaching Tech LLC (collectively, “Delta Separations”) in February 2020 and,most recently, the acquisition of Architectural Mailboxes, LLC ("Architectural Mailboxes") in October 2020, were the direct result ofexecuting our Portfolio Management strategy.
3. Organizational Development - execution of the Business Systems and Portfolio Management pillars of our strategy requires a strongorganization that must continuously develop and improve. The Company aspires to make our workplace the "Best Place to Work", byfocusing on creating the best development and learning environment for our people, proactively operating businesses that mitigateenvironmental and climate related impacts, and engaging with and supporting the communities in which we are located. We believedoing so helps us attract and retain the best people, enhancing our ability to execute our business plans.
As a part of our on-going Three-Pillar strategy, the Company:• implemented new management tools to complement our core 80/20 toolkit and drive improvements in our operating margins;• increased the percentage of our sales that are direct to end customers, allowing us to have a more meaningful connection with our
end customers, providing the opportunity to better understand the challenges our customers face, and developing solutions to thesechallenges; and
• continued to shift the focus of our portfolio to take advantage of rising tides in the renewable energy and conservation markets.
We believe the key elements of our strategy have, and will continue to, enable us to respond timely to changes in the end markets we serve,including evolving changes due to the outbreak of COVID-19. We have and expect to continue to examine the need for restructuring of ouroperations, including consolidation of facilities, reducing overhead costs, curtailing investments in inventory, and managing our business togenerate incremental cash. We believe our enhanced strategy has enabled us to better react to volatility in commodity costs and fluctuationsin customer demand, along with helping to improve margins. We have used the improved cash flows generated by these initiatives to paydown debt, improve our liquidity position, and invest in growth initiatives. Overall, we continue to strive to achieve stronger financial results,make more efficient use of capital, and deliver higher shareholder returns.
Recent Developments
On October 15, 2020, the Company acquired substantially all of the assets of Architectural Mailboxes, a privately-held company in thebusiness of designing, developing, and selling decorative residential mailboxes and related products in an all cash transaction forapproximately $27 million. The results of operations for Architectural
25
Table of Contents
Mailboxes will be reported as a part of our Residential Products segment and are expected to contribute annual revenues of approximately$26 million.
On February 13, 2020, the Company acquired the assets of California-based Delta Separations, a privately held ethanol-based extractionsystems manufacturer and training and laboratory design and operations consultative partner for $50 million in an all cash transaction.
On January 15, 2020, the Company acquired the assets of Canadian-based Thermo, a privately held provider of commercial greenhousesolutions in North America providing growing infrastructure for the plant based organic food market, in an all cash transaction forapproximately $7 million. The Company also expects to invest approximately $42 million into Thermo to provide an appropriate level ofworking capital.
On August 30, 2019, the Company acquired all of the outstanding membership interests of Apeks, a designer and manufacturer of botanicaloil extraction systems utilizing subcritical and supercritical carbon dioxide. The acquisition was financed through cash on hand of $12 million.
The financial results from the acquisitions of Thermo, Delta, and Apeks have been reported as a part of our Renewables Energy andConservation segment since their respective dates of acquisition.
26
Table of Contents
Results of Operations
Three Months Ended September 30, 2020 Compared to the Three Months Ended September 30, 2019
The following table sets forth selected results of operations data and its percentage of net sales for the three months ended September 30 (inthousands):
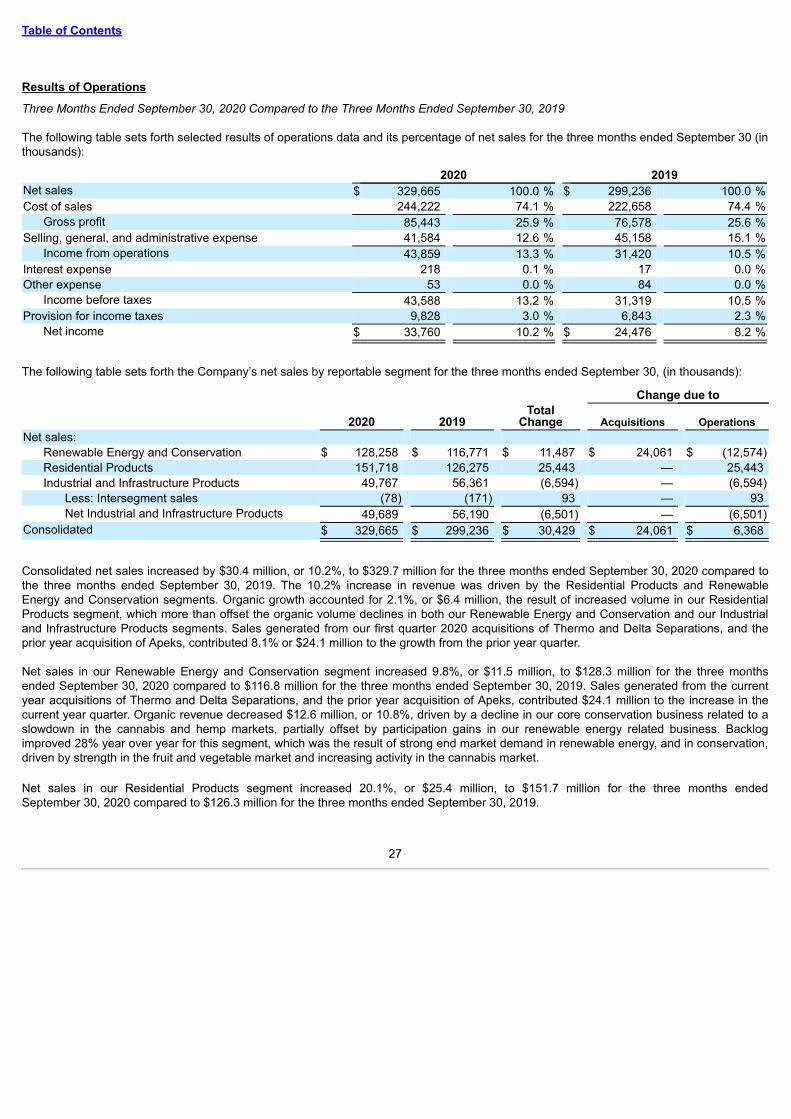
Consolidated net sales increased by $30.4 million, or 10.2%, to $329.7 million for the three months ended September 30, 2020 compared tothe three months ended September 30, 2019. The 10.2% increase in revenue was driven by the Residential Products and RenewableEnergy and Conservation segments. Organic growth accounted for 2.1%, or $6.4 million, the result of increased volume in our ResidentialProducts segment, which more than offset the organic volume declines in both our Renewable Energy and Conservation and our Industrialand Infrastructure Products segments. Sales generated from our first quarter 2020 acquisitions of Thermo and Delta Separations, and theprior year acquisition of Apeks, contributed 8.1% or $24.1 million to the growth from the prior year quarter.
Net sales in our Renewable Energy and Conservation segment increased 9.8%, or $11.5 million, to $128.3 million for the three monthsended September 30, 2020 compared to $116.8 million for the three months ended September 30, 2019. Sales generated from the currentyear acquisitions of Thermo and Delta Separations, and the prior year acquisition of Apeks, contributed $24.1 million to the increase in thecurrent year quarter. Organic revenue decreased $12.6 million, or 10.8%, driven by a decline in our core conservation business related to aslowdown in the cannabis and hemp markets, partially offset by participation gains in our renewable energy related business. Backlogimproved 28% year over year for this segment, which was the result of strong end market demand in renewable energy, and in conservation,driven by strength in the fruit and vegetable market and increasing activity in the cannabis market.
Net sales in our Residential Products segment increased 20.1%, or $25.4 million, to $151.7 million for the three months endedSeptember 30, 2020 compared to $126.3 million for the three months ended September 30, 2019.
27
Table of Contents
The increase from the prior year quarter was largely due to continued solid activity in the repair and remodel market, along with participationgains across our various distribution channels.
Net sales in our Industrial and Infrastructure Products segment decreased 11.6%, or $6.5 million, to $49.7 million for the three months endedSeptember 30, 2020 compared to $56.2 million for the three months ended September 30, 2019. Lower demand for its core industrialproducts resulted in a decrease in revenue in the Industrial businesses. While revenue in the Infrastructure business was down modestly, asthe pandemic affected spending on infrastructure projects in certain end markets, infrastructure backlog grew slightly compared to the prioryear quarter.
Our consolidated gross margin increased to 25.9% for the three months ended September 30, 2020 compared to 25.6% for the three monthsended September 30, 2019. This modest increase was the result of improved operating execution in all our core businesses compared to theprior year quarter, effective price and material cost management, and benefits from our 80/20 simplification initiatives. Partially offsetting theabove improvements were expected lower gross margins generated from our recent acquisitions as we continue to integrate themoperationally.
Selling, general, and administrative ("SG&A") expenses decreased by $3.6 million, or 7.9%, to $41.6 million for the three months endedSeptember 30, 2020 from $45.2 million for the three months ended September 30, 2019. The $3.6 million decrease was largely the result ofa decrease in costs of approximately $7.2 million related to exit activities, senior leadership transition and completing acquisitions, partiallyoffset by $3.8 million in incremental SG&A expenses recorded quarter over quarter for our recent acquisitions. SG&A expenses as apercentage of net sales decreased to 12.6% for the three months ended September 30, 2020 compared to 15.1% for the three monthsended September 30, 2019.
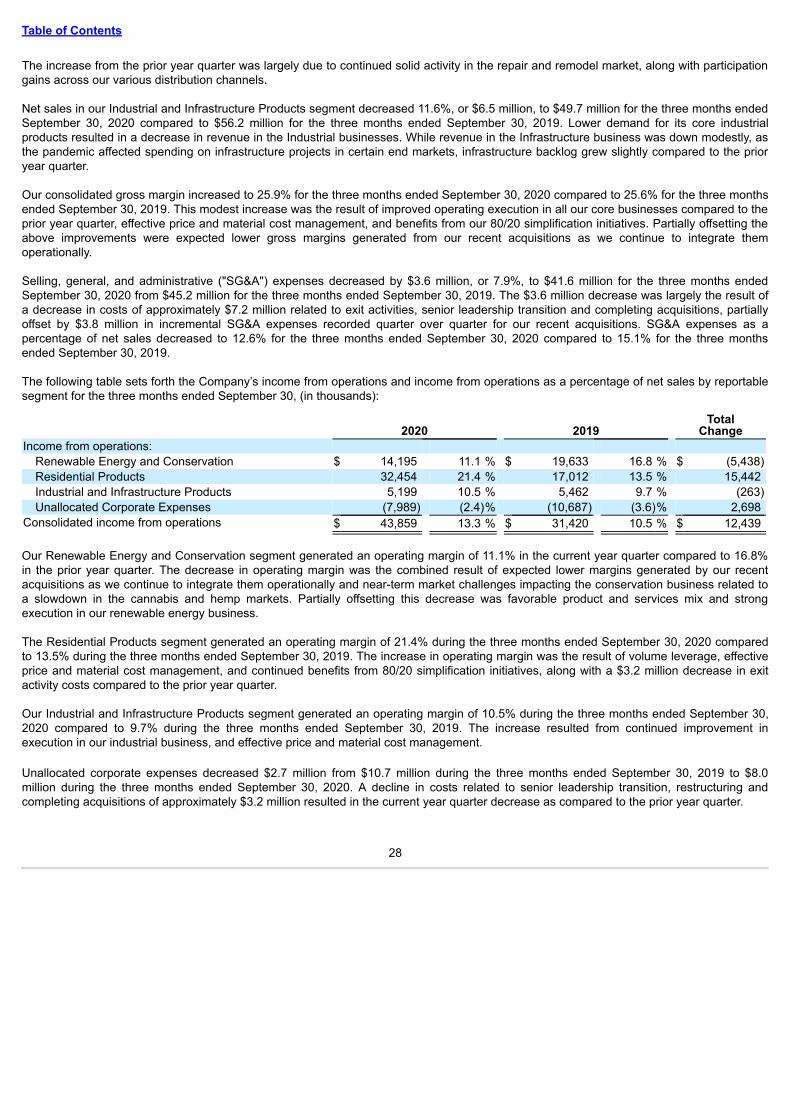
The following table sets forth the Company’s income from operations and income from operations as a percentage of net sales by reportablesegment for the three months ended September 30, (in thousands):
Consolidated income from operations $ 43,859 13.3 % $ 31,420 10.5 % $ 12,439
Our Renewable Energy and Conservation segment generated an operating margin of 11.1% in the current year quarter compared to 16.8%in the prior year quarter. The decrease in operating margin was the combined result of expected lower margins generated by our recentacquisitions as we continue to integrate them operationally and near-term market challenges impacting the conservation business related toa slowdown in the cannabis and hemp markets. Partially offsetting this decrease was favorable product and services mix and strongexecution in our renewable energy business.
The Residential Products segment generated an operating margin of 21.4% during the three months ended September 30, 2020 comparedto 13.5% during the three months ended September 30, 2019. The increase in operating margin was the result of volume leverage, effectiveprice and material cost management, and continued benefits from 80/20 simplification initiatives, along with a $3.2 million decrease in exitactivity costs compared to the prior year quarter.
Our Industrial and Infrastructure Products segment generated an operating margin of 10.5% during the three months ended September 30,2020 compared to 9.7% during the three months ended September 30, 2019. The increase resulted from continued improvement inexecution in our industrial business, and effective price and material cost management.
Unallocated corporate expenses decreased $2.7 million from $10.7 million during the three months ended September 30, 2019 to $8.0million during the three months ended September 30, 2020. A decline in costs related to senior leadership transition, restructuring andcompleting acquisitions of approximately $3.2 million resulted in the current year quarter decrease as compared to the prior year quarter.
28
Table of Contents
Interest expense was negligible for both the three months ended September 30, 2020 and September 30, 2019. No amounts wereoutstanding under our revolving credit facility during the three months ended September 30, 2020 and 2019.
We recognized a provision for income taxes of $9.8 million and $6.8 million, with effective tax rates of 22.5% and 21.8% for the three monthsended September 30, 2020, and 2019, respectively. The effective tax rates for the three months ended September 30, 2020 and 2019,respectively, were greater than the U.S. federal statutory rate of 21% due to state taxes and nondeductible permanent differences partiallyoffset by favorable discrete items.
Nine Months Ended September 30, 2020 Compared to the Nine Months Ended September 30, 2019
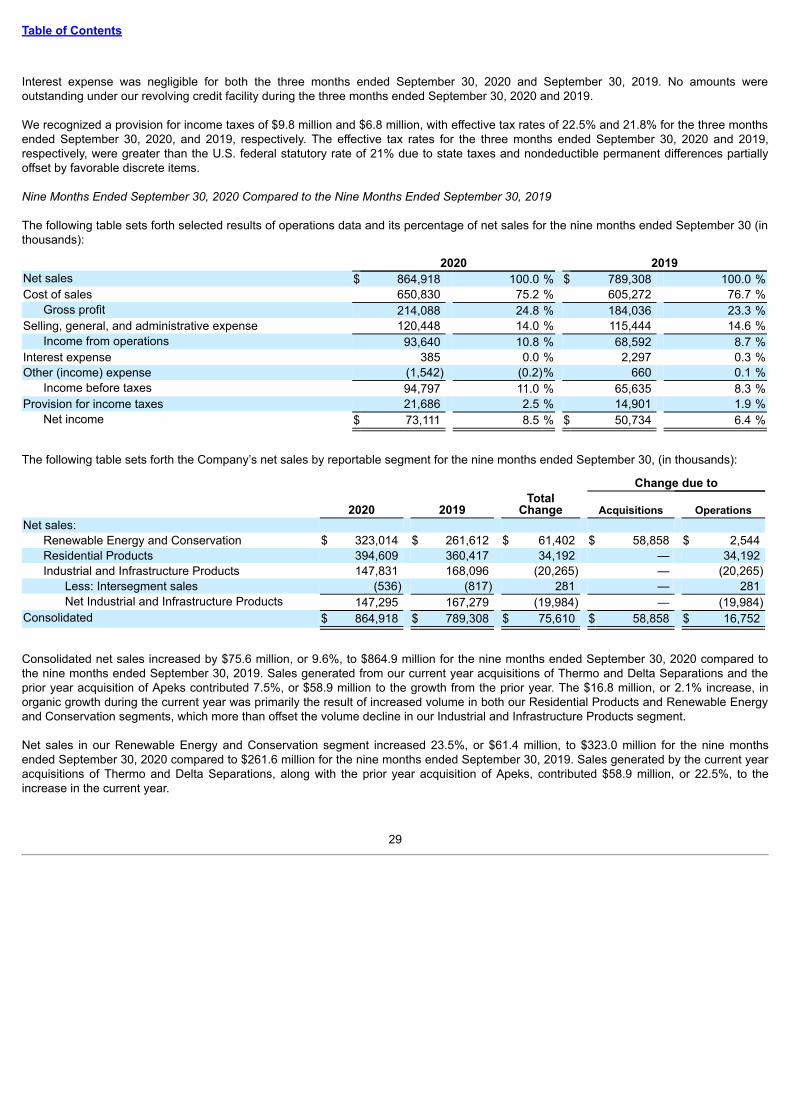
The following table sets forth selected results of operations data and its percentage of net sales for the nine months ended September 30 (inthousands):
Consolidated net sales increased by $75.6 million, or 9.6%, to $864.9 million for the nine months ended September 30, 2020 compared tothe nine months ended September 30, 2019. Sales generated from our current year acquisitions of Thermo and Delta Separations and theprior year acquisition of Apeks contributed 7.5%, or $58.9 million to the growth from the prior year. The $16.8 million, or 2.1% increase, inorganic growth during the current year was primarily the result of increased volume in both our Residential Products and Renewable Energyand Conservation segments, which more than offset the volume decline in our Industrial and Infrastructure Products segment.
Net sales in our Renewable Energy and Conservation segment increased 23.5%, or $61.4 million, to $323.0 million for the nine monthsended September 30, 2020 compared to $261.6 million for the nine months ended September 30, 2019. Sales generated by the current yearacquisitions of Thermo and Delta Separations, along with the prior year acquisition of Apeks, contributed $58.9 million, or 22.5%, to theincrease in the current year.
29
Table of Contents
Organic growth of $2.5 million, or 1.0%, was driven by participation gains in our renewable energy related businesses, partially offset by adecline in our core conservation business related to a slowdown in the cannabis and hemp markets. Backlog improved 28% year over yearfor this segment, which was the result of strong end market demand in renewable energy, and in conservation, driven by strength in the fruitand vegetable market and increasing activity in the cannabis market.
Net sales in our Residential Products segment increased 9.5%, or $34.2 million, to $394.6 million for the nine months ended September 30,2020 compared to $360.4 million for the nine months ended September 30, 2019. The increase from the prior year was largely due tocontinued solid activity in the repair and remodel market, along with participation gains across our various distribution channels.
Net sales in our Industrial and Infrastructure Products segment decreased 12.0%, or $20.0 million, to $147.3 million for the nine monthsended September 30, 2020 compared to $167.3 million for the nine months ended September 30, 2019. Lower demand and lower steelprices impacting its core industrial products resulted in a decrease in revenue in the Industrial businesses. Revenue in the Infrastructurebusiness was essentially flat year over year, while its ending backlog improved slightly from the prior year.
Our consolidated gross margin increased to 24.8% for the nine months ended September 30, 2020 compared to 23.3% for the nine monthsended September 30, 2019. This increase was due to improved operating execution in all of our core businesses compared to the prior yearperiod that included incremental costs for design refinement and field improvements for our solar tracking solution, effective price andmaterial cost management and benefits from our 80/20 simplification initiatives. Partially offsetting the above improvements were lower grossmargins generated from our recent acquisitions.
SG&A expenses increased by $5.0 million, or 4.3%, to $120.4 million for the nine months ended September 30, 2020 from $115.4 million forthe nine months ended September 30, 2019. The $5.0 million increase was largely the result of $11.0 million of incremental SG&A expensesrecorded year over year for our recent acquisitions and costs to complete those acquisitions closed during the year, along with investments inthe development of our organization and safety of our team by reallocating SG&A spending. Partially offsetting these increases wasdecreased spending for exit activity costs of approximately $4.6 million. SG&A expenses as a percentage of net sales decreased to 14.0%for the nine months ended September 30, 2020 compared to 14.6% for the nine months ended September 30, 2019.
The following table sets forth the Company’s income from operations and income from operations as a percentage of net sales by reportablesegment for the nine months ended September 30, (in thousands):
Consolidated income from operations $ 93,640 10.8 % $ 68,592 8.7 % $ 25,048
Our Renewable Energy and Conservation segment generated an operating margin of 9.0% during the nine months ended September 30,2020 compared to 11.8% during the nine months ended September 30, 2019. The decrease in operating margin was the net result of theexpected lower margins generated from our recent acquisitions, as we continue to integrate them operationally, largely offset by favorableproduct and services mix and strong execution in our renewable energy businesses, as well as, the absence of incremental costs incurredduring the prior year for design refinement and field improvements for our solar tracking solution.
Our Residential Products segment generated an operating margin of 18.8% during the nine months ended September 30, 2020 compared to13.8% during the nine months ended September 30, 2019. The increase in operating margin was largely the result of volume leverage,effective price and material cost management and continued benefits from 80/20 simplification initiatives, along with a $3.1 million decreasein exit activity costs compared to the prior year.
30
Table of Contents
The Industrial and Infrastructure Products segment generated an operating margin of 10.7% during the nine months ended September 30,2020 compared to 8.2% during the nine months ended September 30, 2019. The increase in operating margin was the result of continuedimprovement in execution in our industrial business, effective price and material cost management and ongoing benefit from the Company's80/20 initiatives.
Unallocated corporate expenses decreased $0.4 million from $25.9 million during the nine months ended September 30, 2019 to $25.4million during the nine months ended September 30, 2020. The slight decrease was primarily due to lower performance based compensationexpense.
Interest expense decreased by $1.9 million to $0.4 million for the nine months ended September 30, 2020 compared to $2.3 million for thenine months ended September 30, 2019. The decrease in expense resulted from the redemption of the Company's outstanding $210 millionof 6.25% Senior Subordinated Notes during the first quarter of 2019. No amounts were outstanding under our revolving credit facility duringthe nine months ended September 30, 2020 and 2019.
The Company recorded other income of $1.5 million for the nine months ended September 30, 2020 and other expense of $0.7 million for thenine months ended September 30, 2019. The change from the prior year was the result of the $1.9 million pre-tax gain on the sale of theCompany's self-guided apartment tour application business within the Residential Products segment.
We recognized a provision for income taxes of $21.7 million and $14.9 million, with effective tax rates of 22.9% and 22.7%, for the ninemonths ended September 30, 2020, and 2019, respectively. The effective tax rates for the nine months ended September 30, 2020 and2019, respectively, exceeded the U.S. federal statutory rate of 21% due to state taxes and nondeductible permanent differences partiallyoffset by favorable discrete items.
Outlook
The Company delivered solid revenue and growth in earnings per share to date in 2020, and expects fourth quarter performance to surpass2019 results. Given the ongoing level of uncertainty related to the pandemic and the economy Gibraltar is maintaining the practice ofproviding qualitative guidance.
Our momentum and end market trends continue to be positive, and we continue to monitor the pandemic's impact on our businesses andpotential impact on the U.S. and global economy. We remain focused on executing our operating protocols, maintaining a safe environmentfor our people, and meeting our customers’ needs every day. We will also continue with key organic and inorganic investments to strengthenour business platforms for the markets we serve.
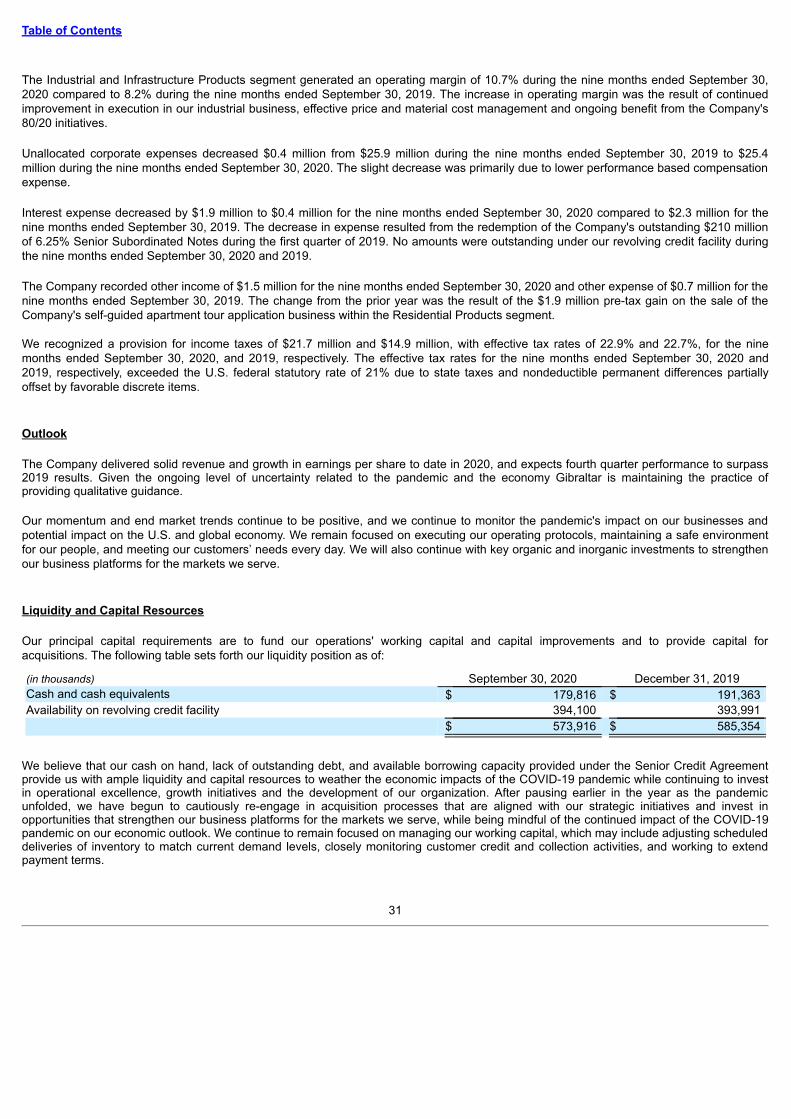
Liquidity and Capital Resources
Our principal capital requirements are to fund our operations' working capital and capital improvements and to provide capital foracquisitions. The following table sets forth our liquidity position as of:
(in thousands) September 30, 2020 December 31, 2019Cash and cash equivalents $ 179,816 $ 191,363 Availability on revolving credit facility 394,100 393,991
$ 573,916 $ 585,354
We believe that our cash on hand, lack of outstanding debt, and available borrowing capacity provided under the Senior Credit Agreementprovide us with ample liquidity and capital resources to weather the economic impacts of the COVID-19 pandemic while continuing to investin operational excellence, growth initiatives and the development of our organization. After pausing earlier in the year as the pandemicunfolded, we have begun to cautiously re-engage in acquisition processes that are aligned with our strategic initiatives and invest inopportunities that strengthen our business platforms for the markets we serve, while being mindful of the continued impact of the COVID-19pandemic on our economic outlook. We continue to remain focused on managing our working capital, which may include adjusting scheduleddeliveries of inventory to match current demand levels, closely monitoring customer credit and collection activities, and working to extendpayment terms.
31
Table of Contents
Our Senior Credit Agreement provides us with liquidity and capital resources for use by our U.S. operations. Historically, our foreignoperations have generated cash flow from operations sufficient to invest in working capital and fund their capital improvements. As ofSeptember 30, 2020, our foreign subsidiaries held $38.8 million of cash in U.S. dollars.
We are taking advantage of the option to defer remittance of the employer portion of Social Security tax as provided in the Coronavirus, Aid,Relief and Economic Security Act ("CARES Act"), and estimate that this deferral will allow us to retain approximately $4 million in cash during2020 that would have otherwise been remitted to the federal government. The deferred tax payments will be repaid equally in 2021 and2022. The CARES Act, along with other foreign government initiatives, also provides for job retention programs, which have allowed some ofour businesses to receive payroll tax credits or subsidies during 2020.
Over the long-term, we expect that future investments, including strategic business opportunities such as acquisitions, may be financedthrough a number of sources, including internally available cash, availability under our revolving credit facility, new debt financing, theissuance of equity securities, or any combination of the above. All potential acquisitions are evaluated based on our acquisition strategy,which includes the enhancement of our existing products, operations, or capabilities, expanding our access to new products, markets, andcustomers, with the goal of creating compounding and sustainable shareholder value.
These expectations are forward-looking statements based upon currently available plans and information and may change if conditions in thecredit and equity markets deteriorate or other circumstances change. To the extent that operating cash flows are lower than current orexpected levels, or sources of financing are not available or not available at acceptable terms, our future liquidity may be adversely affected.
Cash Flows
The following table sets forth selected cash flow data for the nine months ended September 30, (in thousands):
2020 2019Cash provided by (used in):
Operating activities of operations $ 56,194 $ 72,494 Investing activities of operations (61,152) (16,281)Financing activities of operations (6,031) (216,330)Effect of foreign exchange rate changes (558) 729
Net decrease in cash and cash equivalents $ (11,547) $ (159,388)
Operating Activities
Net cash provided by operating activities for the nine months ended September 30, 2020 of $56.2 million consisted of net income of $73.1million and non-cash net charges totaling $24.2 million, which include depreciation, amortization, stock compensation, and other non-cashcharges, offset by a $41.1 million investment in working capital and other net assets. The investment in net working capital and other netassets was driven by the investment in net working capital and other net assets was largely driven by an investment of $42.4 million inThermo, one of our recent acquisitions, which was undercapitalized at purchase, along with an increase in accounts receivable due to strongdemand in our Residential Products segment and a decrease in accrued expenses and other non-current liabilities correlated to the timing ofcustomer billings and payments.
Net cash provided by operating activities of $72.5 million during the nine months ended September 30, 2019 consisted of net income of$50.7 million and $28.3 million of non-cash charges including depreciation, amortization, stock compensation, exit activity and other charges,offset by an investment in working capital and other net assets of $6.6 million.
Investing Activities
Net cash used in investing activities for the nine months ended September 30, 2020 of $61.2 million primarily consisted of net cash paid forthe acquisitions of Delta Separations of $47.1 million and Thermo of $7.3 million and
32
Table of Contents
capital expenditures of $9.3 million, offset by $2.0 million in proceeds from the sale of a business within the Residential Products segmentand $0.6 million in proceeds from the sale of property and equipment.
Net cash used in investing activities for the nine months ended September 30, 2019 of $16.3 million consisted of $8.7 million net cash paidfor the acquisition of Apeks and capital expenditures of $7.7 million.
Financing Activities
Net cash used in financing activities for the nine months ended September 30, 2020 of $6.0 million was primarily the result of $6.4 million ofpurchases of treasury stock related to the net settlement of tax obligations for participants in the Company's equity incentive plans, offset by$0.4 million in proceeds from the issuance of common stock from stock option exercises during the period.
Net cash used in financing activities for the nine months ended September 30, 2019 of $216.3 million consisted of the repayment of $210.0million of 6.25% Senior Subordinated Notes along with $2.0 million in other debt repayments, purchases of treasury stock of $3.5 millionrelated to the net settlement of tax obligations for participants in the Company's equity incentive plans, and the payment of debt issuancecosts of $1.2 million, partially offset by proceeds received from the issuance of common stock of $0.4 million from stock options exercised.
See Note 8 to the Company's consolidated financial statements in Part I, Item 1, Financial Statements, of this Form 10-Q for furtherinformation on the Company’s Senior Credit Agreement.
Off Balance Sheet Financing Arrangements
We have no off-balance sheet arrangements that have or are reasonably likely to have a current or future effect on our financial condition,changes in financial condition, revenues or expenses, results of operations, liquidity, capital expenditures, or capital resources that is materialto investors.
Contractual Obligations
Our contractual obligations have not changed materially from the disclosures included in Item 7 of the Company’s Annual Report on Form10-K for the year ended December 31, 2019.
Critical Accounting EstimatesIn the current year, there have been no changes to our critical accounting estimates from those disclosed in the consolidated financialstatements and accompanying notes contained in the Company's Annual Report on Form 10-K for the year ended December 31, 2019.
Recent Accounting PronouncementsSee Note 2 to the Company's consolidated financial statements in Part I, Item 1 of this Form 10-Q for further information on recentaccounting pronouncements.
Item 3. Qualitative and Quantitative Disclosures About Market Risk
In the ordinary course of business, the Company is exposed to various market risk factors, including changes in general economicconditions, competition, foreign exchange rates, and raw materials pricing and availability. In addition, the Company is exposed to otherfinancial market risks, primarily related to its foreign operations. Refer to Item 7A in the Company's Form 10-K for the year endedDecember 31, 2019 for more information about the Company's exposure to market risk.
33
Table of Contents
Item 4. Controls and Procedures
(a) Evaluation of Disclosure Controls and Procedures
The Company maintains a system of disclosure controls and procedures (as defined in Rule 13a-15(e) and 15d-15(e) under the SecuritiesExchange Act of 1934). The Company’s Chief Executive Officer and the Chief Financial Officer evaluated the effectiveness of the Company’sdisclosure controls as of the end of the period covered in this report. Based upon that evaluation and the definition of disclosure controls andprocedures contained in Rule 13a-15(e) and 15d-15(e) under the Securities Exchange Act of 1934, the Company’s Chief Executive Officerand Chief Financial Officer have concluded that as of the end of such period the Company’s disclosure controls and procedures wereeffective. (b) Changes in Internal Control over Financial Reporting
There have been no changes in the Company’s internal control over financial reporting (as defined by Rule 13a-15(f) or 15d-15(f)) thatoccurred during the period covered by this Quarterly Report on Form 10-Q that have materially affected the Company’s internal control overfinancial reporting.
PART II. OTHER INFORMATION
Item 1. Legal Proceedings
Not applicable.
Item 1A. Risk Factors
In addition to the other information set forth in this report, you should carefully consider the risks discussed in “Part I, Item 1A. Risk Factors”in our Annual Report on Form 10-K for the fiscal year ended December 31, 2019. These risks and uncertainties have the potential tomaterially affect our business, financial condition, results of operation, cash flows, and future prospects. Additional risks and uncertainties notcurrently known to us or that we currently deem immaterial may materially adversely impact our business, financial condition, or operatingresults. We believe there have been no material changes from the risk factors previously disclosed in our Form 10-K. During the nine monthsended September 30, 2020, there have been no material changes to the risk factors previously disclosed under Part I, Item 1A. “RiskFactors” in our 2019 Annual Report, other than the addition of the risk factor set forth below, which was included in Part II, Item 1A of ourForm 10-Q reports for the quarters ended March 31, 2020 and June 30, 2020. The COVID-19 pandemic has significantly impacted worldwide economic conditions and could have a material adverse effect onour business, results of operations, financial condition, and cash flows.
The COVID-19 pandemic began to impact our operations late in the first quarter of 2020 and is likely to continue to affect our business asgovernment authorities impose mandatory closures, work-from-home orders and social distancing protocols, seek voluntary facility closuresor impose other restrictions to help control the spread of COVID-19. Although we cannot predict the duration or scope of the COVID-19pandemic, current actions to control the spread of COVID-19 may adversely impact our business, including limiting our ability to implementour strategic growth initiatives, causing delays in our receipt of raw materials and other product components due to disruptions in our supplychain, limiting access to our distribution channels, reducing the availability of our workforce and subcontractors and increased threats ofcyber attacks on our information technology infrastructure. The instability in global financial markets and unpredictable changes in our supplychain or our production capacity and customer demand resulting from the COVID-19 pandemic may pose material risk to our results ofoperations, financial condition, and cash flows. We are continuously monitoring the impact to our business and operations and taking actionto mitigate the risks involved. However, prolonged disruption to the economy and the end markets we serve may have a material adverseimpact our business, results of operations, financial condition, and cash flows.
Item 2. Unregistered Sales of Equity Securities and Use of Proceeds
Not applicable.
Item 3. Defaults Upon Senior Securities
Not applicable.
34
Table of Contents
Item 4. Mine Safety Disclosures
Not applicable.
Item 5. Other Information
Not applicable.
35
Table of Contents
Item 6. Exhibits
(a) Exhibits
31.1 Certification of President and Chief Executive Officer pursuant to Section 302 of the Sarbanes–Oxley Act of 2002.31.2 Certification of Senior Vice President and Chief Financial Officer pursuant to Section 302 of the Sarbanes–Oxley Act of
2002.32.1 Certification of the President and Chief Executive Officer pursuant to Title 18, United States Code, Section 1350, as
adopted pursuant to Section 906 of the Sarbanes–Oxley Act of 2002.32.2 Certification of the Senior Vice President and Chief Financial Officer pursuant to Title 18, United States Code,
* Submitted electronically with this Quarterly Report on Form 10-Q.
36
Table of Contents
SIGNATURES
Pursuant to the requirements of the Securities Exchange Act of 1934, the Registrant has duly caused this report to be signed on its behalf bythe undersigned, thereunto duly authorized.
GIBRALTAR INDUSTRIES, INC.(Registrant)
/s/ William T. BoswayWilliam T. BoswayPresident and Chief Executive Officer
/s/ Timothy F. MurphyTimothy F. MurphySenior Vice President andChief Financial Officer
Date: October 29, 2020
37
EXHIBIT 31.1CERTIFICATIONS
I, William T. Bosway, certify that:
1. I have reviewed this report on Form 10-Q of Gibraltar Industries, Inc.;
2. Based on my knowledge, this report does not contain any untrue statement of a material fact or omit to state a material factnecessary to make the statements made, in light of the circumstances under which such statements were made, not misleadingwith respect to the period covered by this report;
3. Based on my knowledge, the financial statements, and other financial information included in this report, fairly present in allmaterial respects the financial condition, results of operations and cash flows of the registrant as of, and for, the periods presentedin this report;
4. The registrant’s other certifying officer and I are responsible for establishing and maintaining disclosure controls and procedures(as defined in Exchange Act Rules 13a-15(e) or 15d-15(e)) and internal control over financial reporting (as defined in Exchange ActRules 13a-15(f) or 15d-15(f)) for the registrant and have:
a) designed such disclosure controls and procedures, or caused such disclosure controls and procedures to be designedunder our supervision, to ensure that material information relating to the registrant, including its consolidatedsubsidiaries, is made known to us by others within those entities, particularly during the period in which this report isbeing prepared;
b) designed such internal control over financial reporting, or caused such internal control over financial reporting to bedesigned under our supervision, to provide reasonable assurance regarding the reliability of financial reporting and thepreparation of financial statements for external purposes in accordance with generally accepted accounting principles;
c) evaluated the effectiveness of the registrant’s disclosure controls and procedures and presented in this report ourconclusions about the effectiveness of the disclosure controls and procedures, as of the end of the period covered bythis report based on such evaluation; and
d) disclosed in this report any change in the registrant’s internal control over financial reporting that occurred during theregistrant’s most recent fiscal quarter (the registrant’s fourth fiscal quarter in the case of an annual report) that hasmaterially affected, or is reasonably likely to materially affect, the registrant’s internal control over financial reporting; and
5. The registrant’s other certifying officer and I have disclosed, based on our most recent evaluation of internal control over financialreporting, to the registrant’s auditors and the audit committee of the registrant’s board of directors (or persons performing theequivalent functions):
a) all significant deficiencies and material weaknesses in the design or operation of internal control over financial reportingwhich are reasonably likely to adversely affect the registrant’s ability to record, process, summarize and report financialinformation; and
b) any fraud, whether or not material, that involves management or other employees who have a significant role in theregistrant’s internal control over financial reporting.
Date: October 29, 2020 /s/ William T. Bosway William T. Bosway President and Chief Executive Officer
EXHIBIT 31.2CERTIFICATIONS
I, Timothy F. Murphy, certify that:
1. I have reviewed this report on Form 10-Q of Gibraltar Industries, Inc.;
2. Based on my knowledge, this report does not contain any untrue statement of a material fact or omit to state a material factnecessary to make the statements made, in light of the circumstances under which such statements were made, not misleadingwith respect to the period covered by this report;
3. Based on my knowledge, the financial statements, and other financial information included in this report, fairly present in allmaterial respects the financial condition, results of operations and cash flows of the registrant as of, and for, the periods presentedin this report;
4. The registrant’s other certifying officer and I are responsible for establishing and maintaining disclosure controls and procedures(as defined in Exchange Act Rules 13a-15(e) or 15d-15(e)) and internal control over financial reporting (as defined in Exchange ActRules 13a-15(f) or 15d-15(f)) for the registrant and have:
a) designed such disclosure controls and procedures, or caused such disclosure controls and procedures to be designedunder our supervision, to ensure that material information relating to the registrant, including its consolidatedsubsidiaries, is made known to us by others within those entities, particularly during the period in which this report isbeing prepared;
b) designed such internal control over financial reporting, or caused such internal control over financial reporting to bedesigned under our supervision, to provide reasonable assurance regarding the reliability of financial reporting and thepreparation of financial statements for external purposes in accordance with generally accepted accounting principles;
c) evaluated the effectiveness of the registrant’s disclosure controls and procedures and presented in this report ourconclusions about the effectiveness of the disclosure controls and procedures, as of the end of the period covered bythis report based on such evaluation; and
d) disclosed in this report any change in the registrant’s internal control over financial reporting that occurred during theregistrant’s most recent fiscal quarter (the registrant’s fourth fiscal quarter in the case of an annual report) that hasmaterially affected, or is reasonably likely to materially affect, the registrant’s internal control over financial reporting; and
5. The registrant’s other certifying officer and I have disclosed, based on our most recent evaluation of internal control over financialreporting, to the registrant’s auditors and the audit committee of the registrant’s board of directors (or persons performing theequivalent functions):
a) all significant deficiencies and material weaknesses in the design or operation of internal control over financial reportingwhich are reasonably likely to adversely affect the registrant’s ability to record, process, summarize and report financialinformation; and
b) any fraud, whether or not material, that involves management or other employees who have a significant role in theregistrant’s internal control over financial reporting.
Date: October 29, 2020 /s/ Timothy F. Murphy Timothy F. Murphy
Senior Vice President andChief Financial Officer
EXHIBIT 32.1
CERTIFICATION OF PRESIDENT AND CHIEF EXECUTIVE OFFICERPURSUANT TO TITLE 18, UNITED STATES CODE, SECTION 1350, AS ADOPTED PURSUANT TO
SECTION 906 OF THE SARBANES-OXLEY ACT OF 2002
I, William T. Bosway, President and Chief Executive Officer, of Gibraltar Industries, Inc. (the “Company”), certify, pursuant to Section 906 ofthe Sarbanes-Oxley Act of 2002, 18 U.S.C. Section 1350, that:
The Quarterly Report on Form 10-Q of the Company for the quarter ended September 30, 2020 (the “Report”) fully complies with therequirements of Section 13(a) or 15(d) of the Securities Exchange Act of 1934 (15 U.S.C. 78m); and
The information contained in the Report fairly presents, in all material respects, the financial condition and results of operations of theCompany.
/s/ William T. BoswayWilliam T. BoswayPresident and Chief Executive Officer
October 29, 2020
A signed original of this written statement required by Section 906 has been provided to the Company and will be retained by the Companyand furnished to the Securities and Exchange Commission or its staff upon request.
EXHIBIT 32.2
CERTIFICATION OF SENIOR VICE PRESIDENT AND CHIEF FINANCIAL OFFICERPURSUANT TO TITLE 18, UNITED STATES CODE, SECTION 1350, AS ADOPTED PURSUANT TO
SECTION 906 OF THE SARBANES-OXLEY ACT OF 2002
I, Timothy F. Murphy, Senior Vice President and Chief Financial Officer, of Gibraltar Industries, Inc. (the “Company”), certify, pursuant toSection 906 of the Sarbanes-Oxley Act of 2002, 18 U.S.C. Section 1350, that:
The Quarterly Report on Form 10-Q of the Company for the quarter ended September 30, 2020 (the “Report”) fully complies with therequirements of Section 13(a) or 15(d) of the Securities Exchange Act of 1934 (15 U.S.C. 78m); and
The information contained in the Report fairly presents, in all material respects, the financial condition and results of operations of theCompany.
/s/ Timothy F. MurphyTimothy F. MurphySenior Vice President and Chief Financial Officer
October 29, 2020
A signed original of this written statement required by Section 906 has been provided to the Company and will be retained by the Companyand furnished to the Securities and Exchange Commission or its staff upon request.