17
G20 global displacement and migration trends report 2017
1
G20 global displacement
and migration trends
report 2017

2
Outline
Executive Summary ........................................................................................ 3
Introduction ..................................................................................................... 5
Recent trends in migration flows and integration and evolution of stocks 5
Recent trends in the international mobility of foreign students ................. 9
Diaspora and highly skilled emigration to the G20 ................................... 10
Recent trends in asylum seekers and refugees in G20 countries .............. 13
Recent trends in remittances ........................................................................ 15
Conclusion ...................................................................................................... 16
G20 GLOBAL DISPLACEMENT AND MIGRATION TRENDS REPORT 2017 © OECD 2017
This work is published under the responsibility of the Secretary-General of the OECD. The opinions expressed and arguments employed herein do not necessarily reflect the official views of OECD member countries.
This document and any map included herein are without prejudice to the status of or sovereignty over any territory, to the delimitation of international frontiers and boundaries and to the name of any territory, city or area.
3
Executive Summary
G20 countries are at the centre of global migration, and many of them have recently experienced a
significant rise in migration. The G20 has an important role to play in addressing the challenges
associated to migration to make the most out of it for origin, transit and destination countries as well as
for the migrants themselves.
This report provides a review of recent migration trends to and from G20 countries and the EU28. It shows
that about 157 million international migrants, or almost two third of all international migrants, live in the
G20 countries. Foreign born people represent about 3.3% of the total G20 population and on average,
every second migrant is a woman. Net migration also added about 10 million people to total population in
G20 countries between 2010 and 2015.
The report also indicates that almost 3.5 million international students were enrolled in tertiary education
in the G20 in 2015, representing close to 95% of all registered International students. Almost two-thirds of
international students in the G20 are coming from another G20 country. Looking more generally at
international mobility of highly skilled workers, the report shows that more than one in four migrants in
the G20 has a tertiary level of education, with about one in five tertiary educated migrants coming from
India, China or the Philippines. The emigration of highly educated women to the G20 has been increasing
particularly rapidly in recent years.
G20 members have also received very large inflows of asylum seekers in the last quarter of 2015 and
2016. The inflow of asylum seekers declined significantly in the first half of 2017, but G20 countries
currently host 6 million recognised refugees (27% of the world total), up from 2.4 million in 2010. Host
countries are now facing the challenges of promoting integration of those who are going to stay. Turkey
alone is providing temporary protection to another 3 million Syrians, and Germany has received almost
1.2 million asylum applications in the past two years.
Finally, migrant remittances from G20 accounted for 72% of the global remittance outflow in 2015, an
estimated 218 US$ billion (in PPP). Some G20 countries are however also among the top recipients of
remittances.
There is ample evidence that regular migration can have positive demographic, economic and fiscal
impacts for host countries. Migrants accounted for about half of the increase in the workforce in the
United States and 70% in Europe over the past decade. They add human capital to host societies, but also
bring new skills with them when they return or contribute as investors or entrepreneurs to the economy of
their origin country. Available evidence also shows that in most countries migrants pay more in tax and
social contribution than they receive in individual benefits. The magnitude of migrants’ contribution
however depends on the recognition and use of their skills in the labour market and more broadly on their
labour market integration. Better integration outcomes are also a precondition for capitalising on the
migration-development nexus as there cannot be a positive impact of migration on origin countries unless
immigrants are safe and making a decent living where they live. It is also conditioned on the capacity of
the international community to fulfil its commitments in terms of reducing migration and remittances
G20 GLOBAL DISPLACEMENT AND MIGRATION TRENDS REPORT 2017 © OECD 2017
4
costs. The G20 Labour and Employment Minister’s declaration paves the way for better policies and better
integration outcomes for migrants. Going forward it will remain important to evaluate, and report back
on, the economic impact of these policy changes.
The report concludes by highlighting the importance for the G20 countries to have access to up-to-date,
comparable information on most important migration-related trends in order to support national and
international policy developments to promote safe, orderly and regular migration.
G20 GLOBAL DISPLACEMENT AND MIGRATION TRENDS REPORT 2017 © OECD 2017
5
Introduction
People have always moved across communities, states and continents, but over the past decades migration
flows have been rising fast and are expected to increase further in the future. In 2015, about 244 million
people were living outside their country of birth – more than half of them in G20 countries. G20 countries
are indeed at the centre of global migration and many of them have seen a significant recent rise in
migration.
Over the past few years, the increase in legal flows has been overshadowed by the mass inflows of asylum
seekers and refugees. G20 countries received more than 3.5 million formal asylum applications in 2015
and 2016, the highest numbers since World War II, and Turkey alone is providing temporary protection to
another 3 million Syrians, while Lebanon and Jordan host more than 1 million and at least 660 thousands
Syrians respectively. Germany also registered more than 1.2 million asylum applications in 2015 and 2016.
At the same time, legal migration, notably highly skilled migration, and international mobility of students
has also gained momentum in the G20.
This report proposes a first monitoring of recent migration and remittances trends to and from G20
countries and the EU28.1 It is organised in 5 sections focusing respectively on migrants’ flows and stocks,
international mobility of foreign students, emigration by countries of origin, recent changes in refugee and
asylum seekers flows and remittances. The last section concludes.
Recent trends in migration flows and integration and evolution of stocks
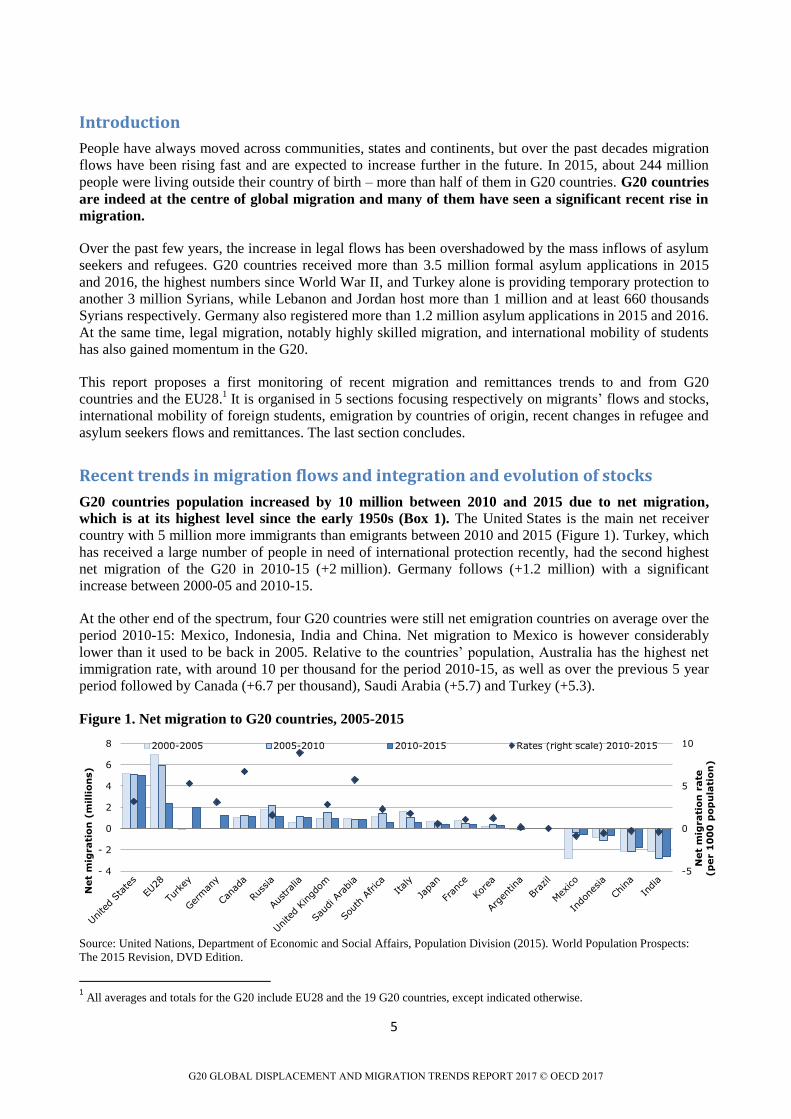
G20 countries population increased by 10 million between 2010 and 2015 due to net migration,
which is at its highest level since the early 1950s (Box 1). The United States is the main net receiver
country with 5 million more immigrants than emigrants between 2010 and 2015 (Figure 1). Turkey, which
has received a large number of people in need of international protection recently, had the second highest
net migration of the G20 in 2010-15 (+2 million). Germany follows (+1.2 million) with a significant
increase between 2000-05 and 2010-15.
At the other end of the spectrum, four G20 countries were still net emigration countries on average over the
period 2010-15: Mexico, Indonesia, India and China. Net migration to Mexico is however considerably
lower than it used to be back in 2005. Relative to the countries’ population, Australia has the highest net
immigration rate, with around 10 per thousand for the period 2010-15, as well as over the previous 5 year
period followed by Canada (+6.7 per thousand), Saudi Arabia (+5.7) and Turkey (+5.3).
Figure 1. Net migration to G20 countries, 2005-2015
Source: United Nations, Department of Economic and Social Affairs, Population Division (2015). World Population Prospects:
The 2015 Revision, DVD Edition.
1 All averages and totals for the G20 include EU28 and the 19 G20 countries, except indicated otherwise.
-5
0
5
10
- 4
- 2
0
2
4
6
8
Net
mig
rati
on
rate
(p
er 1
00
0 p
op
ula
tio
n)
Net
mig
rati
on
(m
illi
on
s)
2000-2005 2005-2010 2010-2015 Rates (right scale) 2010-2015
G20 GLOBAL DISPLACEMENT AND MIGRATION TRENDS REPORT 2017 © OECD 2017

6
Box 1: an historical perspective on migration
in the G20
Net migration to the G20 has always been positive
since 1950, except for the period 1960-65, the only
period where the US was not the G20 top net
migration country (France was). Since the beginning
of the ‘90s, G20 population has increased by around
2 million people per year due to net immigration.
The peak observed in 2005-10 is mostly due to a
sharp decrease in net emigration from Mexico. The
decline in the most recent period is the result of the
turnaround in Spain and other European countries
hard hit by the economic crisis, which was not fully
compensated by the large increases in net
immigration driven by the refugee crisis, notably in
Turkey and Germany.
Figure 2. Net migration to the G20
1950-2015 (5-year periods)
Available data on migration inflows are not available for all G20 countries and are not always fully
comparable. Table 1 compiles many different sources, notably based on OECD regional monitoring
systems. The United States appears as the main immigration country in the G20 with 2.5 million new
permanent and temporary migrants in 2015. Germany follows with a 2 million people inflow, while
1.5 million Asian migrant workers went to Saudi Arabia in 2015. Three other G20 countries received more
than half a million new migrants: Australia (760 000), the United Kingdom (550 000) and Canada
(513 000). Relative to the population, the ranking changes and Saudi Arabia comes first with all
deployment of workers from Asia representing 5% of the total population (Saudis and non-Saudis).
Australia ranks second with around 3% ahead of Germany (2.5%).
Table 1. Recent migration flows to selected G20 countries, 2010-2015
Sources: National sources; OECD International Migration Database, OECD-OAS (2015) International migration in the Americas -
SICREMI, OECD-ILO-ADBI (2017) Safeguarding the rights of Asian migrant workers from home to the workplace.
Note: Sources, definitions and coverage of data used vary significantly across countries. This does not allows for aggregations and
direct comparisons, but order of magnitude and trends can be described. Data are generally based on national sources, and most
often include temporary workers and students. N/A means that information is not available
- 5
0
5
10
15
1950-55 1970-75 1990-95 2010-15
Mil
lio
ns
G20
2010 2011 2012 2013 2014 2015 Permanent Temporary Students Definition Source
Argentina 178 259 292 279 203 Ministry of Interior
Australia 574 593 689 757 765 759 Department of Immigration
and Border Protection
Brazil 96 117 122 128 110 Ministry of Justice
Canada 504 489 526 540 518 513 IRCC
France 197 193 193 205 211 212 Non-EU citizens only Ministry of Interior
Germany 684 842 966 1 108 1 343 2 016
Registration of foreigners
intending to stay at least one
week in the country
Destatis
Indonesia 65 77 72 69 69 Registered migrant workers ILO
Italy 424 354 321 279 248 250 N/A Istat
Japan 287 267 304 307 337 391
Foreigners who entered the
country, excluding temporary
visitors and re-entries
Ministry of Justice
Mexico 92 91 79 118 109 103 Permanent resident cards +
temp
SEGOB - Unidad de política
migratoria
Korea 293 307 300 360 407 373 Long-term inflows (more
than 90 days)Ministry of Justice
Russia 199 215 291 351 443 425 Federal Migration Service
Saudi Arabia 1 128 1 116 1 277 1 245 1 272 1 492 Worker deployments from Asia Sending countries
South Africa 55 Department of Home Affairs
Spain 330 336 272 248 264 291 N/A N/ANational Institute of
Statistics
United Kingdom 498 488 418 449 551 548 Long-Term International
Migration Office for National Statistics
United States 2 047 2 127 2 141 2 220 2 388 2 537
Department of Homeland
Security/ Department of
State
G20 GLOBAL DISPLACEMENT AND MIGRATION TRENDS REPORT 2017 © OECD 2017
7
In 2015, three G20 countries saw inflows rise sharply compared to 2014: Germany, where 2015 the inflow
level is 50% higher than in 2014, but also Saudi Arabia (+17%) and Japan (+16%). In most other G20
countries, the number of new migrants remained relatively stable, even if a 6% increase was registered in
the United States, and a 5% drop in Mexico.
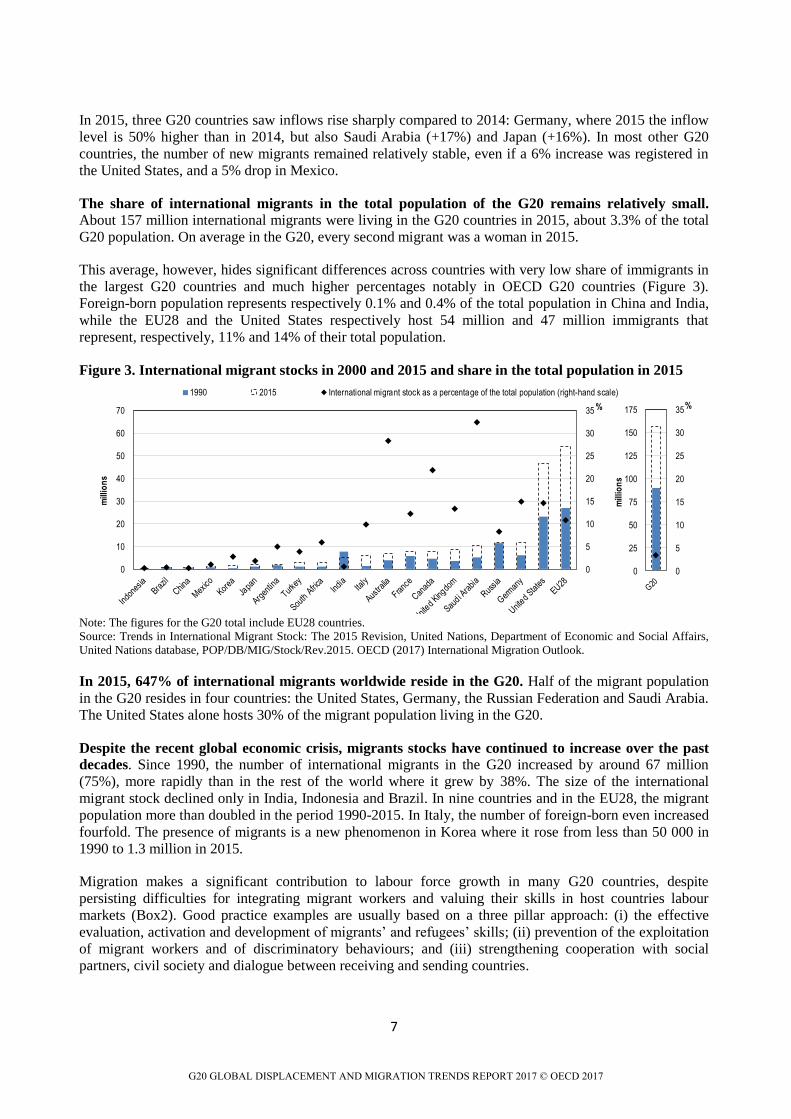
The share of international migrants in the total population of the G20 remains relatively small. About 157 million international migrants were living in the G20 countries in 2015, about 3.3% of the total
G20 population. On average in the G20, every second migrant was a woman in 2015.
This average, however, hides significant differences across countries with very low share of immigrants in
the largest G20 countries and much higher percentages notably in OECD G20 countries (Figure 3).
Foreign-born population represents respectively 0.1% and 0.4% of the total population in China and India,
while the EU28 and the United States respectively host 54 million and 47 million immigrants that
represent, respectively, 11% and 14% of their total population.
Figure 3. International migrant stocks in 2000 and 2015 and share in the total population in 2015
Note: The figures for the G20 total include EU28 countries.
Source: Trends in International Migrant Stock: The 2015 Revision, United Nations, Department of Economic and Social Affairs,
United Nations database, POP/DB/MIG/Stock/Rev.2015. OECD (2017) International Migration Outlook.
In 2015, 647% of international migrants worldwide reside in the G20. Half of the migrant population
in the G20 resides in four countries: the United States, Germany, the Russian Federation and Saudi Arabia.
The United States alone hosts 30% of the migrant population living in the G20.
Despite the recent global economic crisis, migrants stocks have continued to increase over the past
decades. Since 1990, the number of international migrants in the G20 increased by around 67 million
(75%), more rapidly than in the rest of the world where it grew by 38%. The size of the international
migrant stock declined only in India, Indonesia and Brazil. In nine countries and in the EU28, the migrant
population more than doubled in the period 1990-2015. In Italy, the number of foreign-born even increased
fourfold. The presence of migrants is a new phenomenon in Korea where it rose from less than 50 000 in
1990 to 1.3 million in 2015.
Migration makes a significant contribution to labour force growth in many G20 countries, despite
persisting difficulties for integrating migrant workers and valuing their skills in host countries labour
markets (Box2). Good practice examples are usually based on a three pillar approach: (i) the effective
evaluation, activation and development of migrants’ and refugees’ skills; (ii) prevention of the exploitation
of migrant workers and of discriminatory behaviours; and (iii) strengthening cooperation with social
partners, civil society and dialogue between receiving and sending countries.
0
5
10
15
20
25
30
35
0
10
20
30
40
50
60
70 %
mill
ion
s
1990 2015 International migrant stock as a percentage of the total population (right-hand scale)
0
5
10
15
20
25
30
35
0
25
50
75
100
125
150
175 %
mill
ion
s
G20 GLOBAL DISPLACEMENT AND MIGRATION TRENDS REPORT 2017 © OECD 2017
8
Box2 Labour market outcomes of migrants in G20 countries: key findings from the joint OECD,
ILO, World Bank and IMF paper for the 2017 G20 Labour and Employment Ministerial Meeting
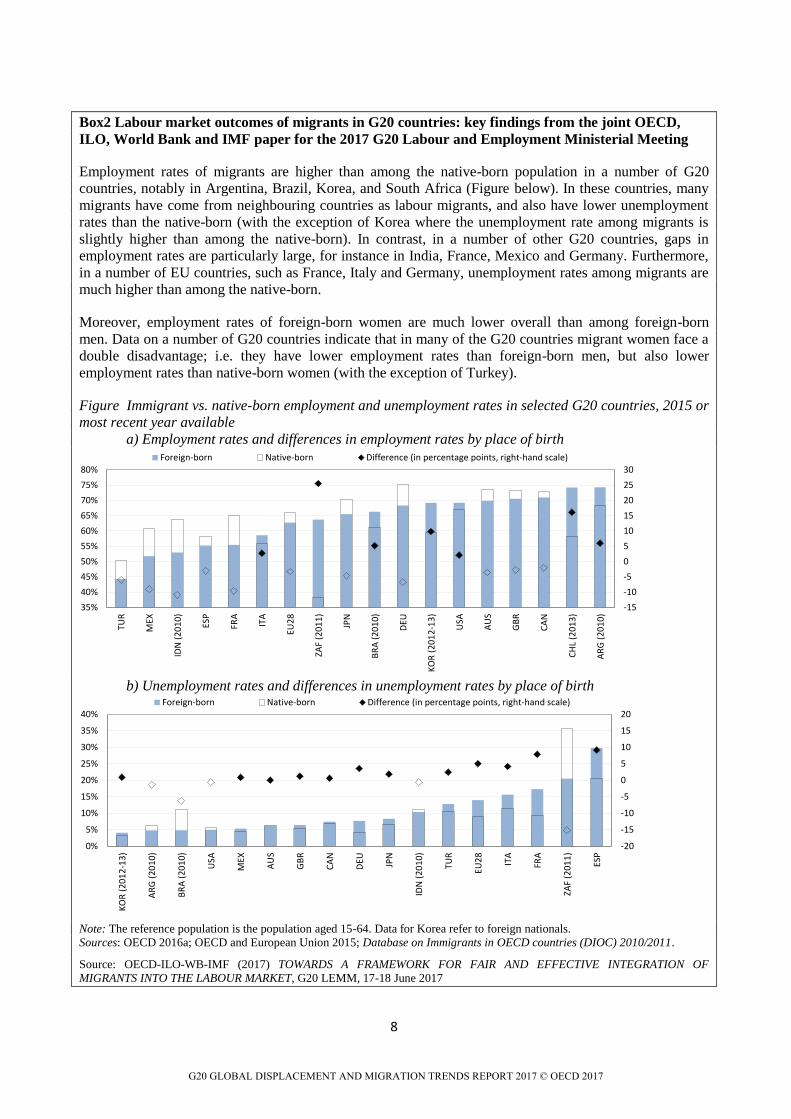
Employment rates of migrants are higher than among the native-born population in a number of G20
countries, notably in Argentina, Brazil, Korea, and South Africa (Figure below). In these countries, many
migrants have come from neighbouring countries as labour migrants, and also have lower unemployment
rates than the native-born (with the exception of Korea where the unemployment rate among migrants is
slightly higher than among the native-born). In contrast, in a number of other G20 countries, gaps in
employment rates are particularly large, for instance in India, France, Mexico and Germany. Furthermore,
in a number of EU countries, such as France, Italy and Germany, unemployment rates among migrants are
much higher than among the native-born.
Moreover, employment rates of foreign-born women are much lower overall than among foreign-born
men. Data on a number of G20 countries indicate that in many of the G20 countries migrant women face a
double disadvantage; i.e. they have lower employment rates than foreign-born men, but also lower
employment rates than native-born women (with the exception of Turkey).
Figure Immigrant vs. native-born employment and unemployment rates in selected G20 countries, 2015 or
most recent year available
a) Employment rates and differences in employment rates by place of birth
b) Unemployment rates and differences in unemployment rates by place of birth
Note: The reference population is the population aged 15-64. Data for Korea refer to foreign nationals.
Sources: OECD 2016a; OECD and European Union 2015; Database on Immigrants in OECD countries (DIOC) 2010/2011.
Source: OECD-ILO-WB-IMF (2017) TOWARDS A FRAMEWORK FOR FAIR AND EFFECTIVE INTEGRATION OF
MIGRANTS INTO THE LABOUR MARKET, G20 LEMM, 17-18 June 2017
-15
-10
-5
0
5
10
15
20
25
30
35%
40%
45%
50%
55%
60%
65%
70%
75%
80%
TUR
MEX
IDN
(2
01
0)
ESP
FRA
ITA
EU2
8
ZAF
(20
11
)
JPN
BR
A (
20
10
)
DEU
KO
R (
20
12
-13
)
USA
AU
S
GB
R
CA
N
CH
L (2
01
3)
AR
G (
20
10
)
Foreign-born Native-born Difference (in percentage points, right-hand scale)
-20
-15
-10
-5
0
5
10
15
20
0%
5%
10%
15%
20%
25%
30%
35%
40%
KO
R (
20
12
-13
)
AR
G (
20
10
)
BR
A (
20
10
)
USA
MEX
AU
S
GB
R
CA
N
DEU JP
N
IDN
(2
01
0)
TUR
EU2
8
ITA
FRA
ZAF
(20
11
)
ESP
Foreign-born Native-born Difference (in percentage points, right-hand scale)
G20 GLOBAL DISPLACEMENT AND MIGRATION TRENDS REPORT 2017 © OECD 2017

9
Recent trends in the international mobility of foreign students
In 2014, almost three and half million international students were enrolled in tertiary education in the
G20 (Table 2). Almost all foreign students worldwide are enrolled in the G20 (94%). The United States
accounts for 25% of all enrolled international students in G20 countries (840 000) and EU member
countries 40% (1.5 million). After the United States, other main destinations include the United Kingdom
(430 000), Australia (260 000), France (235 000), the Russian Federation (210 000) and
Germany (210 000). In addition, over 130 000 international students were enrolled in Japan and Canada,
and almost 100 000 in China in 2014.
The number of international students enrolled has increased significantly in the last 15 years in all G20
countries, except in Argentina. It has doubled in Australia, Indonesia, Japan, Turkey and the United
Kingdom. It has especially skyrocketed in countries which used to receive few international students at the
beginning of the century, such as Mexico and Italy (three times higher), the Russian Federation (five
times), Saudi Arabia (six times), and Brazil and Korea (15 times).
Table 2. International students enrolled in G20 countries, 2014
Note: Date refer to the year 2013/14. Data for Argentina, Indonesia, Italy, Japan, Korea, Saudi Arabia and Turkey refer to foreign students instead of international students. Data for Canada, China, Mexico and South Africa refer to 2013 instead of 2014 and data for Argentina, Indonesia and Saudi Arabia refer to 2012. Source: Education at a glance database, OECD.
Almost two-thirds of international students in the G20 are coming from another G20 country. This share
is especially high in English-speaking countries, as well as in some Asian G20 countries. In the European
Union, three in every five international students is coming from G20 countries, most students coming from
Total
(thousands)
Of which:
From G20
countries
(%)
Of which:
Women
(%)
% change
2000-14
Total
tertiary
education
Master’s
or
equivalent
level
Doctoral
or equivalent
level
Argentina 3 8 .. - 20% .. .. ..
Australia 266 62 47 + 152% 18 40 34
Brazil 19 31 46 +1 415% 0 1 2
Canada 135 59 45 + 43% 10 14 27
China 96 .. 45 .. 0 1 3
France 235 38 52 + 72% 10 13 40
Germany 211 58 49 + 13% 7 12 7
Indonesia 7 11 .. + 139% .. .. ..
Italy 88 45 59 + 251% 5 4 13
Japan 136 84 48 + 104% 3 8 19
Korea 52 77 52 +1 455% 2 6 8
Mexico 8 .. .. + 230% 0 1 3
Russian Federation 213 7 .. + 418% 3 6 5
Saudi Arabia 47 8 .. + 522% .. .. ..
South Africa 42 7 43 .. .. .. ..
Turkey 48 13 31 + 173% 1 3 5
United Kingdom 429 67 51 + 92% 18 37 42
United States 842 77 45 + 77% 4 9 35
European Union 1459 59 51 + 84% 8 13 22
G20 total 3367 61 49 + 103% 3 7 19
G20 average .. 41 47 .. 6 11 17
International tertiary studentsShare of international students by level
of education (%)
G20 GLOBAL DISPLACEMENT AND MIGRATION TRENDS REPORT 2017 © OECD 2017

10
other parts of Europe or from Africa. Overall, in the G20 area, half of all international students come from
Asia (mainly China, India and Korea), a third from Europe (mainly from Germany and France), 9% from
Africa and 9% from the Americas.
Whereas slightly more female than male international students are enrolled in the European Union,
male students represent the majority in most non-European countries where data by gender are available.
There are more female than male among international students enrolled in Italy (59%) in France (52%),
Korea (52%) and the United Kingdom (51 %). Conversely, the share of female among international
students is at most 45% in the United States, China, Canada, and South Africa. In Turkey, two thirds of
international students are men.
International students account for an average of 3% of the G20 tertiary-level student population and 8%
in the European Union. This proportion reaches 18% in Australia and the United Kingdom and 10% in
France and Canada. The share of international students in the total student population tends however to be
low in most Asian and Latin American G20 countries.
The proportion of international students increases with the level of education. On average in the G20,
international students account for 11% of students enrolled in Master’s programmes, and 17% in PhD
programmes. In several countries (United Kingdom, and France notably), more than a third of
PhD students and international students.
Diaspora and highly skilled emigration to the G20
The top ten origin countries represented more than a third of migrants in the G20.2 Mexico is the top
origin country, with more than 11 million in 2010/11 mainly to the United States, an increase of 34% from
2000/01 (Figure 4). The growth of migrants from China and India has been spectacular over the last ten
years. These two countries, with 3.7 and 3.5 million emigrants respectively in 2010/11, have become the
third and fourth top countries with the largest diasporas living in the G20, representing a 76% and 78%
increase respectively since 2000/01. European countries with traditionally large diasporas such as the
United Kingdom and Germany have moved down the list of the top countries of origin.
The composition of migrants in terms of their education level has also changed significantly. Overall, 27%
of migrants in the G20 had a high level of education (tertiary) in 2010/11, versus 23% in 2000/01. This
corresponds to a 60% increase or an additional 12 million tertiary educated immigrants. Three countries,
the United States, Canada and the United Kingdom, host two thirds of highly educated migrants living in
G20 countries. The number of highly-educated migrants in these countries increased by 77% between
2000/01 and 2010/11, reaching close to 20 million. The growth has been particularly sharp in the United
Kingdom during this period.
Close to one in five highly-educated migrants in G20 countries comes from India, China or the
Philippines. India has by far the biggest community of highly-educated emigrants in G20 countries. The
size of the highly educated Indian diaspora more than doubled in ten years, reaching 2.2 million in
2010/11. China and the Philippines, with 1.7 million and 1.4 million respectively, have the second and
third largest diasporas of highly educated emigrants. Their highly-educated diasporas grew by 115% and
64% respectively in ten years. Yet, the largest increase among these top origin countries was recorded by
Romania (about 492 000 persons in 2010/11).
2 The information in this section refers to all G20 countries as destination countries, except China, India, Saudi Arabia as data by
country of origin and education level are not available for these countries in 2000/01 and/or 2010/11.
G20 GLOBAL DISPLACEMENT AND MIGRATION TRENDS REPORT 2017 © OECD 2017

11
Figure 4. Stock of emigrants and highly educated emigrants in G20 countries for ten main origin and
G20 members, in 2000/01 and 2010/11
Panel A. Ten main origin countries
Panel B. other G20 members
Note: The ten countries presented in this figure (on the left) are the top ten origin countries of foreign-born persons living in G20
countries in 2010/11, while those presented on the right are the remaining G20 countries as countries of origin. Numbers do not
include migrants in China, India, and Saudi Arabia for which data are not available in 2000/01 and/or 2010/11. Highly educated
emigrants are tertiary educated. More than 450 thousand people (about a third are tertiary educated) declare to be born in the
former Soviet Union without specifying in which part. There are therefore not included in any country total.
Source: Database on Immigrants in OECD and non-OECD Countries (DIOC and DIOC-E), 2000/01 and 2010/11.Among the top
origin countries of highly educated migrants in the G20, the emigration rate of the highly educated is particularly large for
Kazakhstan (35%) and to a lesser extent for Romania (23%), Poland (20%) and the United Kingdom (11%). For the more populous
Asian countries (India and China), the risk of brain drain is much lower (4% or less). Overall, brain drain is a serious concern in a
limited number of countries, notably small countries and island states in the Pacific and the Caribbean. For many regions and
countries in the world, the rising educational attainment of their populations has mitigated the negative effects of the increasing
numbers of their high-skilled emigrants, as these can be captured by the emigration rate of the highly educated.
Among the top origin countries of highly educated migrants in the G20, the emigration rate3 of the highly
educated is particularly large for Kazakhstan (35%) and to a lesser extent for Romania (23%), Poland
(20%) and the United Kingdom (11%). For the more populous Asian countries (India and China), the risk
of brain drain is much lower (4% or less). Overall, brain drain is a serious concern in a limited number of
countries, notably small countries and island states in the Pacific and the Caribbean. For many regions and
3 The emigration rate of highly educated is defined as the number of highly educated migrants from one country as a share of the
all highly educated persons living in that specific country, including emigrants from the country.
0
500000
1000000
1500000
2000000
2500000
3000000
3500000
4000000
4500000
5000000
2000 2010 2000 2010 2000 2010 2000 2010 2000 2010 2000 2010 2000 2010 2000 2010 2000 2010 2000 2010
Mexico Ukraine China India Kazakhstan United Kingdom Poland Germany Philippines Romania
Highly educated Total
11124650
8328872
0
500000
1000000
1500000
2000000
2500000
3000000
3500000
4000000
4500000
5000000
2000 2010 2000 2010 2000 2010 2000 2010 2000 2010 2000 2010 2000 2010 2000 2010 2000 2010 2000 2010 2000 2010 2000 2010 2000 2010
UE28 Turkey RussianFederation
Italy France United States Canada Brazil Argentina Japan South Africa Indonesia Australia
Highly educated Total
10211608
11574321
G20 GLOBAL DISPLACEMENT AND MIGRATION TRENDS REPORT 2017 © OECD 2017

12
countries in the world, the rising educational attainment of their populations has mitigated the negative
effects of the increasing numbers of their high-skilled emigrants, as these can be captured by the
emigration rate of the highly educated.
The emigration of highly educated women is a growing phenomenon worldwide. In 2010/11, 52% of all
highly educated migrants in the G20 were women up from 49% in 2000/01. Their number increased by
68% versus just 52% for highly educated men. Those percentages translate into rises from 9.8 million to
nearly 16.6 million highly educated women and from more than 10.1 million to 15.4 million highly
educated men. This trend applies to most countries of origin. The feminisation of migration, especially
among the highly educated, is a growing phenomenon in most countries, but is especially prevalent in a
number of key origin countries. For instance, emigration from the Philippines has been traditionally more
important among women. In 2010/11, 61% of migrants from this country were women and female
migrants represented 64% of all highly educated migrants (Figure 5). Women represent 61% or more of
highly educated migrants from Russia, Japan and Brazil. For a number of countries of origin (China, India,
Poland, Romania), the number of highly educated female migrants at least doubled between 2000/01 and
2010/11 whereas the increase has been lower for men. The number of highly educated female migrants
from Saudi Arabia to the G20 was multiplied by 3.5 over the same period, while that of men was
multiplied by 2.7.
Figure 5. Highly educated women in G20 countries for ten main origin and G20 members
In percentages
Note: The ten countries presented in this figure (on the left) are the top ten origin countries of foreign-born persons living in G20
countries in 2010/11, while those presented on the right are the remaining G20 countries as countries of origin. Numbers do not
include migrants in China, India and Saudi Arabia, for which data are not available in 2000/01 and/or 2010/11. Highly educated
emigrants are tertiary educated.
Source: Database on Immigrants in OECD and non-OECD Countries (DIOC and DIOC-E), 2000/01 and 2010/11.
0%
50%
100%
150%
200%
250%
300%
350%
400%
30%
35%
40%
45%
50%
55%
60%
65%
70% Share of women (2010/11) Growth (2000/01-2010/11) (right axis)
Other G20 members
G20 GLOBAL DISPLACEMENT AND MIGRATION TRENDS REPORT 2017 © OECD 2017
13
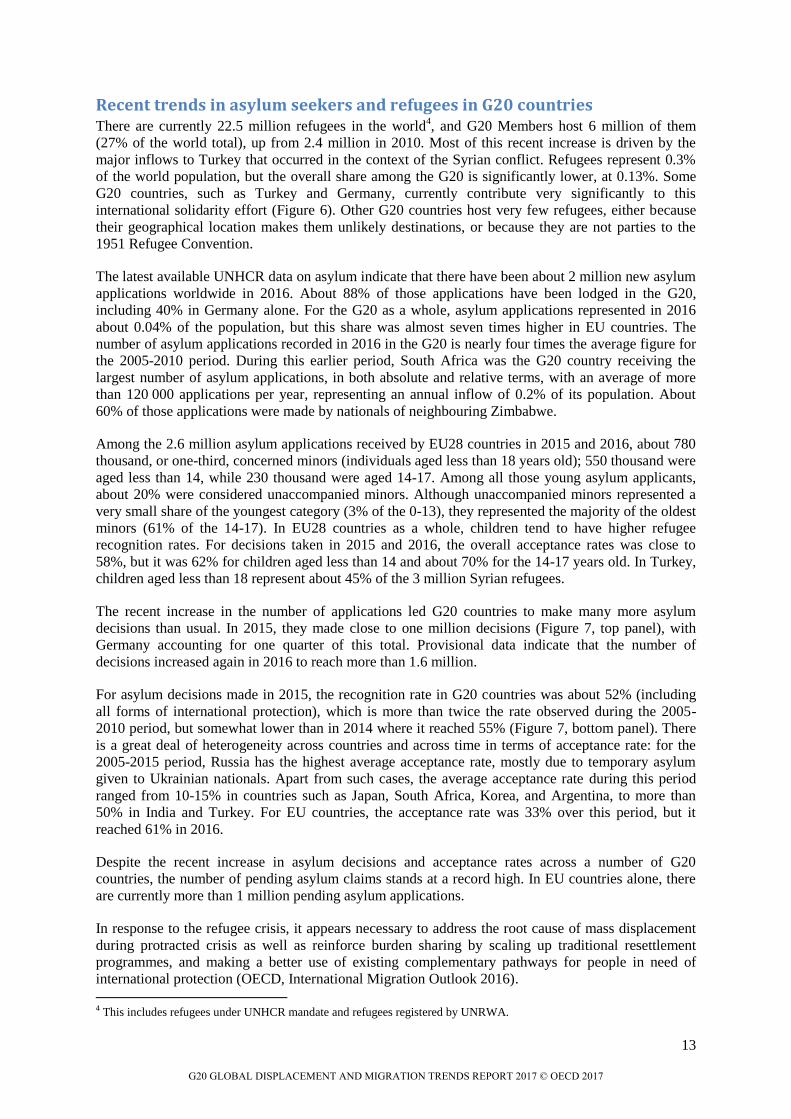
Recent trends in asylum seekers and refugees in G20 countries There are currently 22.5 million refugees in the world
4, and G20 Members host 6 million of them
(27% of the world total), up from 2.4 million in 2010. Most of this recent increase is driven by the
major inflows to Turkey that occurred in the context of the Syrian conflict. Refugees represent 0.3%
of the world population, but the overall share among the G20 is significantly lower, at 0.13%. Some
G20 countries, such as Turkey and Germany, currently contribute very significantly to this
international solidarity effort (Figure 6). Other G20 countries host very few refugees, either because
their geographical location makes them unlikely destinations, or because they are not parties to the
1951 Refugee Convention.
The latest available UNHCR data on asylum indicate that there have been about 2 million new asylum
applications worldwide in 2016. About 88% of those applications have been lodged in the G20,
including 40% in Germany alone. For the G20 as a whole, asylum applications represented in 2016
about 0.04% of the population, but this share was almost seven times higher in EU countries. The
number of asylum applications recorded in 2016 in the G20 is nearly four times the average figure for
the 2005-2010 period. During this earlier period, South Africa was the G20 country receiving the
largest number of asylum applications, in both absolute and relative terms, with an average of more
than 120 000 applications per year, representing an annual inflow of 0.2% of its population. About
60% of those applications were made by nationals of neighbouring Zimbabwe.
Among the 2.6 million asylum applications received by EU28 countries in 2015 and 2016, about 780
thousand, or one-third, concerned minors (individuals aged less than 18 years old); 550 thousand were
aged less than 14, while 230 thousand were aged 14-17. Among all those young asylum applicants,
about 20% were considered unaccompanied minors. Although unaccompanied minors represented a
very small share of the youngest category (3% of the 0-13), they represented the majority of the oldest
minors (61% of the 14-17). In EU28 countries as a whole, children tend to have higher refugee
recognition rates. For decisions taken in 2015 and 2016, the overall acceptance rates was close to
58%, but it was 62% for children aged less than 14 and about 70% for the 14-17 years old. In Turkey,
children aged less than 18 represent about 45% of the 3 million Syrian refugees.
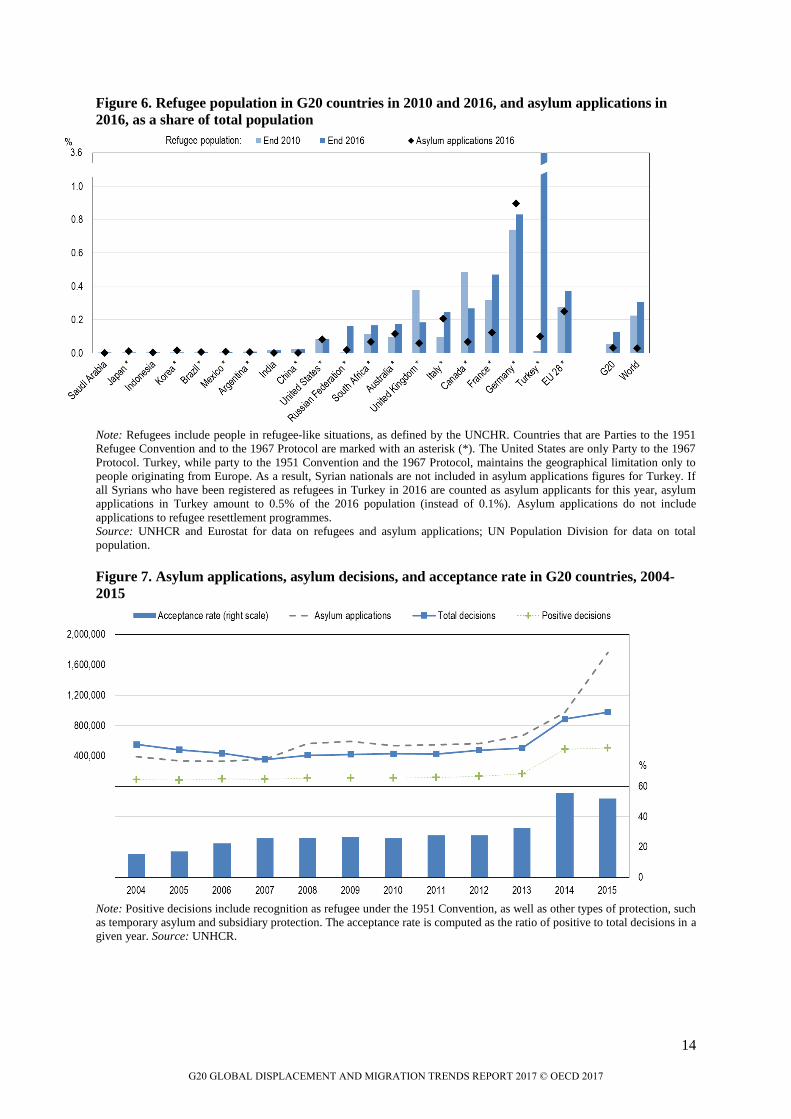
The recent increase in the number of applications led G20 countries to make many more asylum
decisions than usual. In 2015, they made close to one million decisions (Figure 7, top panel), with
Germany accounting for one quarter of this total. Provisional data indicate that the number of
decisions increased again in 2016 to reach more than 1.6 million.
For asylum decisions made in 2015, the recognition rate in G20 countries was about 52% (including
all forms of international protection), which is more than twice the rate observed during the 2005-
2010 period, but somewhat lower than in 2014 where it reached 55% (Figure 7, bottom panel). There
is a great deal of heterogeneity across countries and across time in terms of acceptance rate: for the
2005-2015 period, Russia has the highest average acceptance rate, mostly due to temporary asylum
given to Ukrainian nationals. Apart from such cases, the average acceptance rate during this period
ranged from 10-15% in countries such as Japan, South Africa, Korea, and Argentina, to more than
50% in India and Turkey. For EU countries, the acceptance rate was 33% over this period, but it
reached 61% in 2016.
Despite the recent increase in asylum decisions and acceptance rates across a number of G20
countries, the number of pending asylum claims stands at a record high. In EU countries alone, there
are currently more than 1 million pending asylum applications.
In response to the refugee crisis, it appears necessary to address the root cause of mass displacement
during protracted crisis as well as reinforce burden sharing by scaling up traditional resettlement
programmes, and making a better use of existing complementary pathways for people in need of
international protection (OECD, International Migration Outlook 2016).
4 This includes refugees under UNHCR mandate and refugees registered by UNRWA.
G20 GLOBAL DISPLACEMENT AND MIGRATION TRENDS REPORT 2017 © OECD 2017
14
Figure 6. Refugee population in G20 countries in 2010 and 2016, and asylum applications in
2016, as a share of total population
Note: Refugees include people in refugee-like situations, as defined by the UNCHR. Countries that are Parties to the 1951
Refugee Convention and to the 1967 Protocol are marked with an asterisk (*). The United States are only Party to the 1967
Protocol. Turkey, while party to the 1951 Convention and the 1967 Protocol, maintains the geographical limitation only to
people originating from Europe. As a result, Syrian nationals are not included in asylum applications figures for Turkey. If
all Syrians who have been registered as refugees in Turkey in 2016 are counted as asylum applicants for this year, asylum
applications in Turkey amount to 0.5% of the 2016 population (instead of 0.1%). Asylum applications do not include
applications to refugee resettlement programmes.
Source: UNHCR and Eurostat for data on refugees and asylum applications; UN Population Division for data on total
population.
Figure 7. Asylum applications, asylum decisions, and acceptance rate in G20 countries, 2004-
2015
Note: Positive decisions include recognition as refugee under the 1951 Convention, as well as other types of protection, such
as temporary asylum and subsidiary protection. The acceptance rate is computed as the ratio of positive to total decisions in a
given year. Source: UNHCR.
G20 GLOBAL DISPLACEMENT AND MIGRATION TRENDS REPORT 2017 © OECD 2017
15
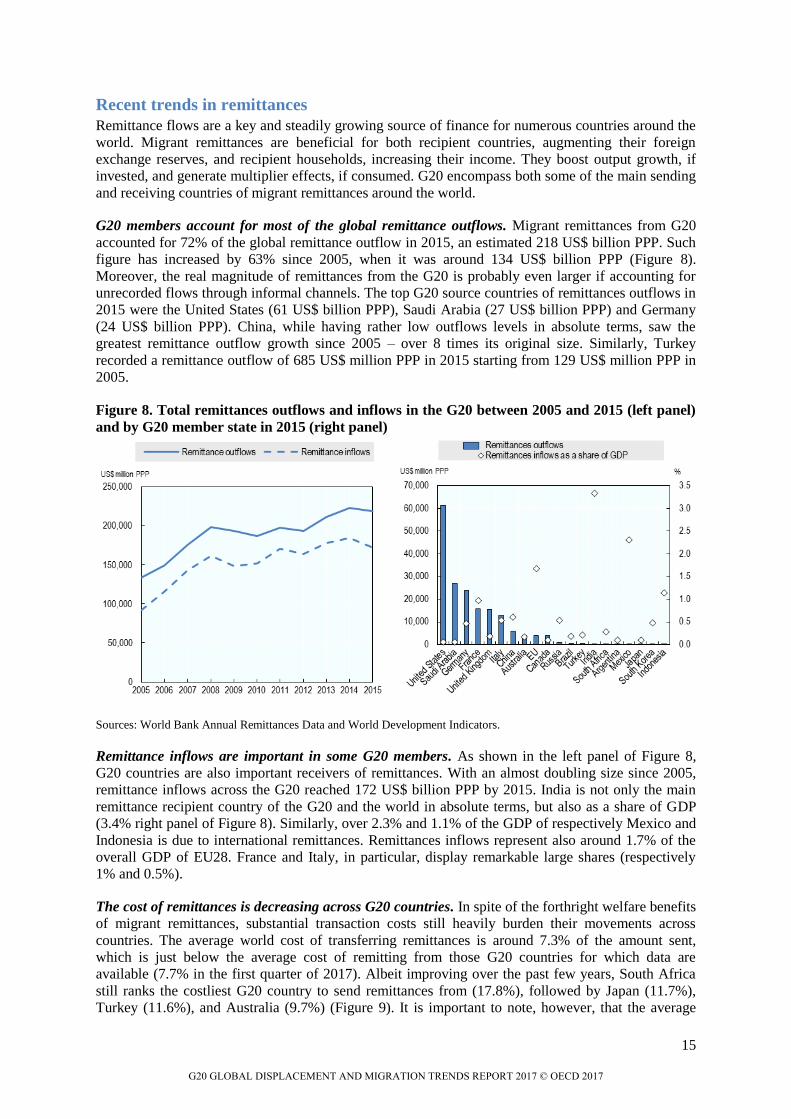
Recent trends in remittances
Remittance flows are a key and steadily growing source of finance for numerous countries around the
world. Migrant remittances are beneficial for both recipient countries, augmenting their foreign
exchange reserves, and recipient households, increasing their income. They boost output growth, if
invested, and generate multiplier effects, if consumed. G20 encompass both some of the main sending
and receiving countries of migrant remittances around the world.
G20 members account for most of the global remittance outflows. Migrant remittances from G20
accounted for 72% of the global remittance outflow in 2015, an estimated 218 US$ billion PPP. Such
figure has increased by 63% since 2005, when it was around 134 US$ billion PPP (Figure 8).
Moreover, the real magnitude of remittances from the G20 is probably even larger if accounting for
unrecorded flows through informal channels. The top G20 source countries of remittances outflows in
2015 were the United States (61 US$ billion PPP), Saudi Arabia (27 US$ billion PPP) and Germany
(24 US$ billion PPP). China, while having rather low outflows levels in absolute terms, saw the
greatest remittance outflow growth since 2005 – over 8 times its original size. Similarly, Turkey
recorded a remittance outflow of 685 US$ million PPP in 2015 starting from 129 US$ million PPP in
2005.
Figure 8. Total remittances outflows and inflows in the G20 between 2005 and 2015 (left panel)
and by G20 member state in 2015 (right panel)
Sources: World Bank Annual Remittances Data and World Development Indicators.
Remittance inflows are important in some G20 members. As shown in the left panel of Figure 8,
G20 countries are also important receivers of remittances. With an almost doubling size since 2005,
remittance inflows across the G20 reached 172 US$ billion PPP by 2015. India is not only the main
remittance recipient country of the G20 and the world in absolute terms, but also as a share of GDP
(3.4% right panel of Figure 8). Similarly, over 2.3% and 1.1% of the GDP of respectively Mexico and
Indonesia is due to international remittances. Remittances inflows represent also around 1.7% of the
overall GDP of EU28. France and Italy, in particular, display remarkable large shares (respectively
1% and 0.5%).
The cost of remittances is decreasing across G20 countries. In spite of the forthright welfare benefits
of migrant remittances, substantial transaction costs still heavily burden their movements across
countries. The average world cost of transferring remittances is around 7.3% of the amount sent,
which is just below the average cost of remitting from those G20 countries for which data are
available (7.7% in the first quarter of 2017). Albeit improving over the past few years, South Africa
still ranks the costliest G20 country to send remittances from (17.8%), followed by Japan (11.7%),
Turkey (11.6%), and Australia (9.7%) (Figure 9). It is important to note, however, that the average
G20 GLOBAL DISPLACEMENT AND MIGRATION TRENDS REPORT 2017 © OECD 2017
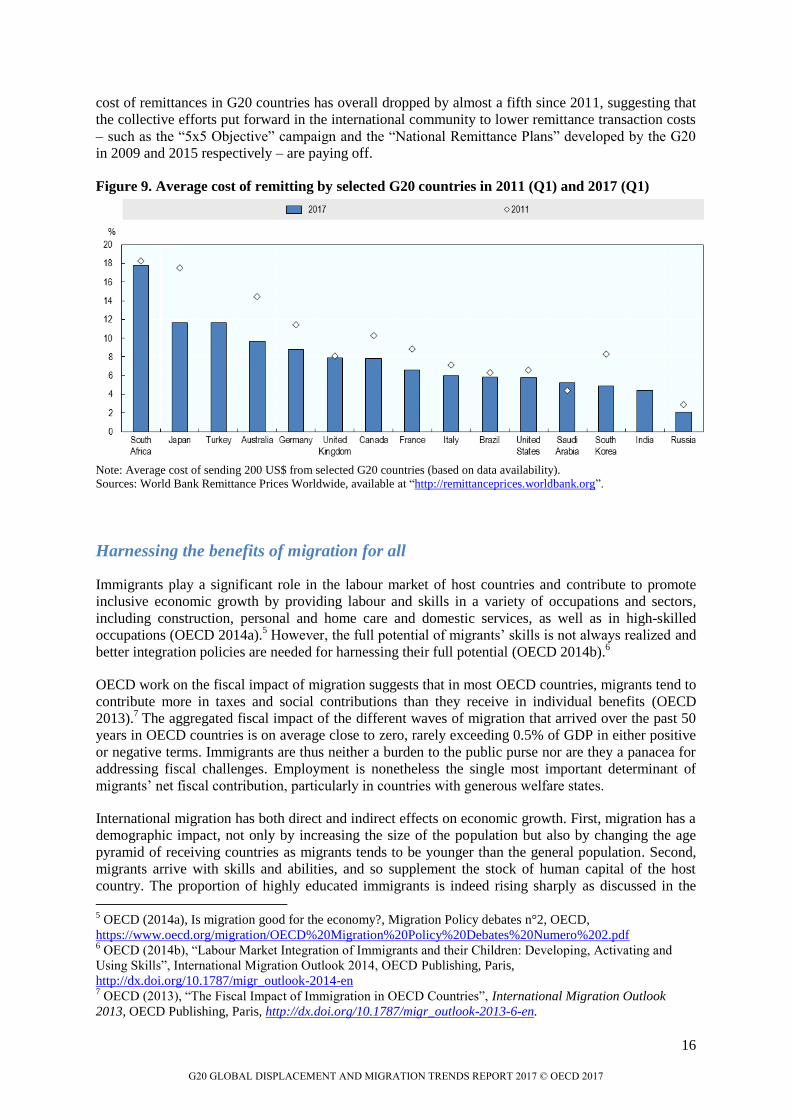
16
cost of remittances in G20 countries has overall dropped by almost a fifth since 2011, suggesting that
the collective efforts put forward in the international community to lower remittance transaction costs
– such as the “5x5 Objective” campaign and the “National Remittance Plans” developed by the G20
in 2009 and 2015 respectively – are paying off.
Figure 9. Average cost of remitting by selected G20 countries in 2011 (Q1) and 2017 (Q1)
Note: Average cost of sending 200 US$ from selected G20 countries (based on data availability).
Sources: World Bank Remittance Prices Worldwide, available at “http://remittanceprices.worldbank.org”.
Harnessing the benefits of migration for all
Immigrants play a significant role in the labour market of host countries and contribute to promote
inclusive economic growth by providing labour and skills in a variety of occupations and sectors,
including construction, personal and home care and domestic services, as well as in high-skilled
occupations (OECD 2014a).5 However, the full potential of migrants’ skills is not always realized and
better integration policies are needed for harnessing their full potential (OECD 2014b).6
OECD work on the fiscal impact of migration suggests that in most OECD countries, migrants tend to
contribute more in taxes and social contributions than they receive in individual benefits (OECD
2013).7 The aggregated fiscal impact of the different waves of migration that arrived over the past 50
years in OECD countries is on average close to zero, rarely exceeding 0.5% of GDP in either positive
or negative terms. Immigrants are thus neither a burden to the public purse nor are they a panacea for
addressing fiscal challenges. Employment is nonetheless the single most important determinant of
migrants’ net fiscal contribution, particularly in countries with generous welfare states.
International migration has both direct and indirect effects on economic growth. First, migration has a
demographic impact, not only by increasing the size of the population but also by changing the age
pyramid of receiving countries as migrants tends to be younger than the general population. Second,
migrants arrive with skills and abilities, and so supplement the stock of human capital of the host
country. The proportion of highly educated immigrants is indeed rising sharply as discussed in the
5 OECD (2014a), Is migration good for the economy?, Migration Policy debates n°2, OECD,
https://www.oecd.org/migration/OECD%20Migration%20Policy%20Debates%20Numero%202.pdf 6 OECD (2014b), “Labour Market Integration of Immigrants and their Children: Developing, Activating and
Using Skills”, International Migration Outlook 2014, OECD Publishing, Paris,
http://dx.doi.org/10.1787/migr_outlook-2014-en 7 OECD (2013), “The Fiscal Impact of Immigration in OECD Countries”, International Migration Outlook
2013, OECD Publishing, Paris, http://dx.doi.org/10.1787/migr_outlook-2013-6-en.
G20 GLOBAL DISPLACEMENT AND MIGRATION TRENDS REPORT 2017 © OECD 2017
17
previous section on “Diaspora and highly skilled emigration to the G20” (see also OECD-UNDESA
2013).8
Third, evidence suggests that skilled immigrants contribute to boosting research and
innovation, as well as technological progress.
Effective integration also increases migrants’ capabilities to contribute to the development of their
country of origin through remittances and capacity transfer, which, over time, in turn reduces
international wage gaps and migration pressures (OECD-ILO-WB-IMF 2017).9
Understanding these impacts is essential to designing policies for managing migration flows as well
as for recognising their skills and competences so as to improve migrants’ employment situation. This
policy mix will, of course, vary from country to country. But the fundamental question of how to
maximise the benefits of migration, both for host and origin countries and the migrants themselves,
needs to be addressed.
Conclusion
Migration is not a zero sum game and if well managed and seen as a long-term investment yields
potential benefits for origin, transit and destination countries as well as for the migrants themselves.
One should not however underestimate the challenges associated with managing the flows and
promoting integration of those who are going to stay in the host country. There are increasing
concerns about the distributive effects of international migration both within destination countries and
between origin and destination countries, notably when it comes to highly skilled migration and the
brain drain.
The G20 has an important role to play in addressing these challenges and make the most out of
migration. This requires, however, having access to sound, up-to-date and international comparable
data. In this context there is a need to improve the information system on migration, to monitor major
trends as well as to identify good practices. The OECD could help to close this gap by providing a
regular update to the G20 on migration issues. This could take the form of a yearly report to inform
on the evolution of migration phenomena and of their economic impact, both within the G20 and
globally. It would also contribute to address the SDGs mandate and support UN Global Compacts on
Refugees and Migrants.
8 OECD-UNDESA (2013), World Migration in Figures, OECD/United Nations Department of Economics and
Social Affairs, www.oecd.org/els/mig/World-Migration-in-Figures.pdf. 9 OECD-ILO-WB-IMF (2017) Towards a Framework for fair and effective integration of migrants into the
labour market, G20 LEMM, 17-18 June 2017
G20 GLOBAL DISPLACEMENT AND MIGRATION TRENDS REPORT 2017 © OECD 2017


