45
G8 Education – Investor Presentation G8 Education Limited (ASX:GEM) 26 April 2016
| Date post: | 07-Jun-2018 |
| Category: |
Documents |
| Upload: | nguyencong |
| View: | 233 times |
| Download: | 1 times |

G8 Education – Investor Presentation
G8 Education Limited (ASX:GEM) 26 April 2016

Transaction Summary New Issue Overview
2
Issuer G8 Education Limited
Guarantors In accordance with the Programme, the Issuer will ensure that, at all times, the consolidated total assets of the Issuer and the subsidiary guarantors (taken as a whole) shall be at least 90 per cent. of the consolidated total assets of the Group, taken as a whole
Status Direct, unconditional, unsubordinated and unsecured obligations of the Issuer and the Guarantors
Rating Unrated
Format Reg S, S274 & 275 of SFA, issuance off S$600 Million Multicurrency Debt Issuance Programme (“Programme”)
Currency [•]
Tenor [•]
Issue Price 100.00
Payment Semi-annual, actual/365 (fixed)
Redemption upon Cessation or Suspension of Trading of the Issuer’s Shares at the Option of the Noteholders
At par, in accordance with the Programme
Redemption upon Change of Control at the Option of the Issuer
At 101%, in accordance with the Programme
Redemption for Taxation Reasons at the Option of the Issuer
At par, in accordance with the Programme
Details SGD250K/Multicurrency Debt Issuance Programme/Singapore Law/CDP
Listing SGX-ST
Use of Proceeds To finance (i) the purchase of the aggregate purchase price for the 2017 Notes validly tendered in the Invitation and accepted for purchase by the Issuer, (ii) the redemption of the remaining 2017 Notes and (iii) the aggregate consent fees payable to eligible holders of the 2017 Notes who vote in favour of the extraordinary resolution
Sole Bookrunner DBS Bank Ltd.
Note: Please refer to the Information Memorandum dated 26 April 2016 for more details
Transaction Summary Tender Offer and Consent Solicitation Overview
3
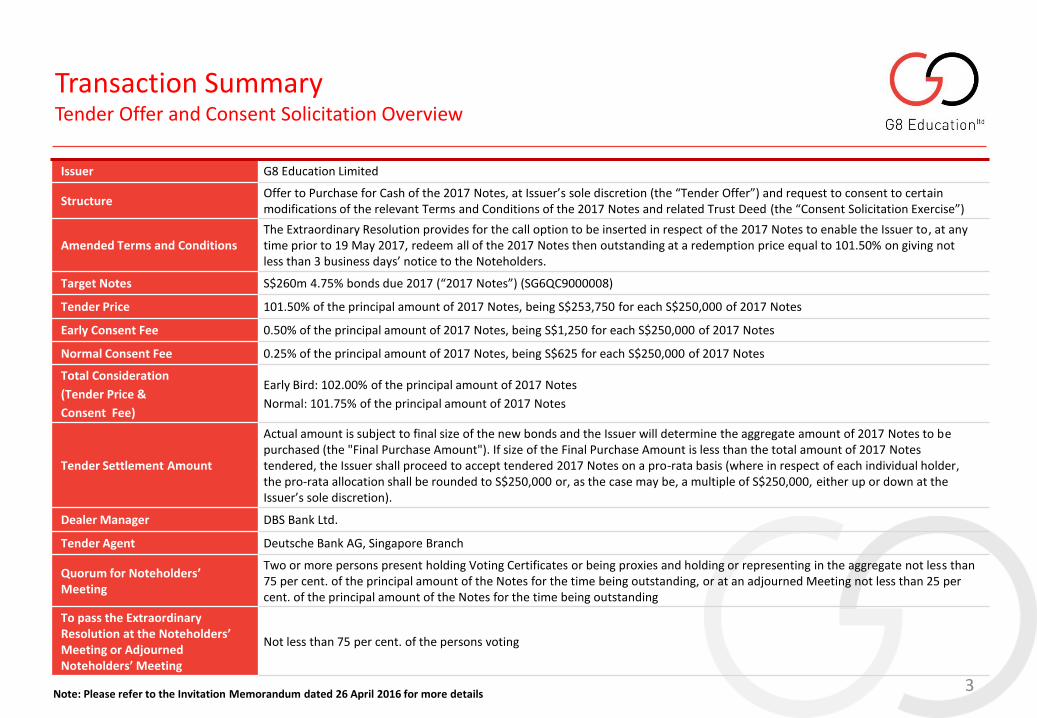
Issuer G8 Education Limited
Structure Offer to Purchase for Cash of the 2017 Notes, at Issuer’s sole discretion (the “Tender Offer”) and request to consent to certain modifications of the relevant Terms and Conditions of the 2017 Notes and related Trust Deed (the “Consent Solicitation Exercise”)
Amended Terms and Conditions The Extraordinary Resolution provides for the call option to be inserted in respect of the 2017 Notes to enable the Issuer to, at any time prior to 19 May 2017, redeem all of the 2017 Notes then outstanding at a redemption price equal to 101.50% on giving not less than 3 business days’ notice to the Noteholders.
Target Notes S$260m 4.75% bonds due 2017 (“2017 Notes”) (SG6QC9000008)
Tender Price 101.50% of the principal amount of 2017 Notes, being S$253,750 for each S$250,000 of 2017 Notes
Early Consent Fee 0.50% of the principal amount of 2017 Notes, being S$1,250 for each S$250,000 of 2017 Notes
Normal Consent Fee 0.25% of the principal amount of 2017 Notes, being S$625 for each S$250,000 of 2017 Notes
Total Consideration
(Tender Price &
Consent Fee)
Early Bird: 102.00% of the principal amount of 2017 Notes
Normal: 101.75% of the principal amount of 2017 Notes
Tender Settlement Amount
Actual amount is subject to final size of the new bonds and the Issuer will determine the aggregate amount of 2017 Notes to be purchased (the "Final Purchase Amount"). If size of the Final Purchase Amount is less than the total amount of 2017 Notes tendered, the Issuer shall proceed to accept tendered 2017 Notes on a pro-rata basis (where in respect of each individual holder, the pro-rata allocation shall be rounded to S$250,000 or, as the case may be, a multiple of S$250,000, either up or down at the Issuer’s sole discretion).
Dealer Manager DBS Bank Ltd.
Tender Agent Deutsche Bank AG, Singapore Branch
Quorum for Noteholders’ Meeting
Two or more persons present holding Voting Certificates or being proxies and holding or representing in the aggregate not less than 75 per cent. of the principal amount of the Notes for the time being outstanding, or at an adjourned Meeting not less than 25 per cent. of the principal amount of the Notes for the time being outstanding
To pass the Extraordinary Resolution at the Noteholders’ Meeting or Adjourned Noteholders’ Meeting
Not less than 75 per cent. of the persons voting
Note: Please refer to the Invitation Memorandum dated 26 April 2016 for more details
Transaction Timetable
4
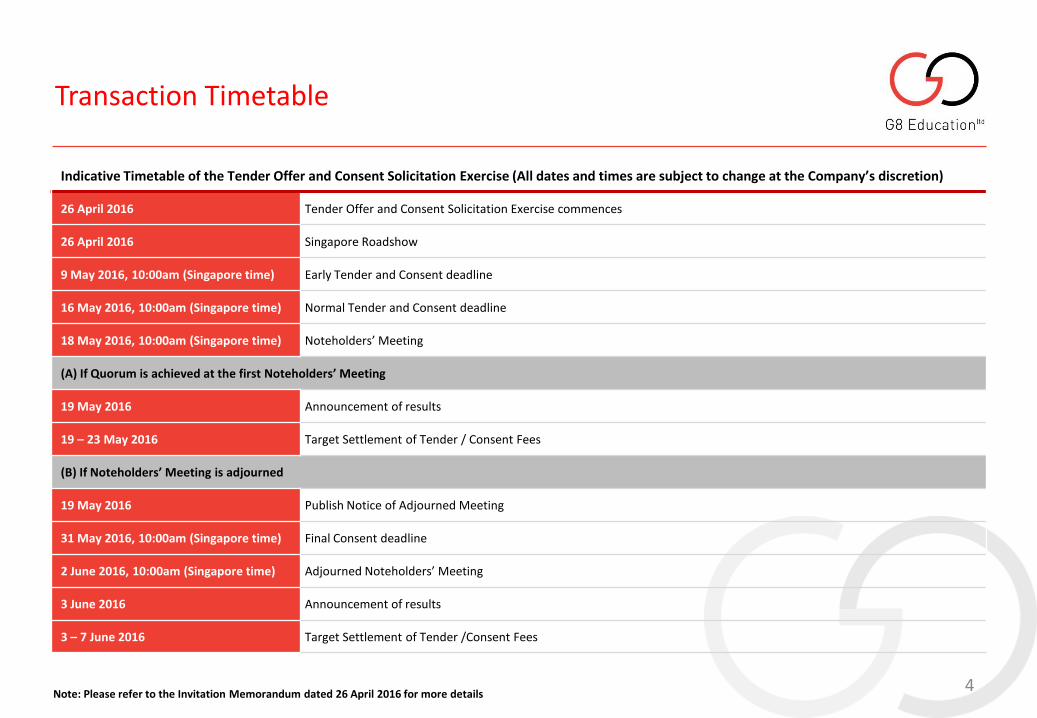
Indicative Timetable of the Tender Offer and Consent Solicitation Exercise (All dates and times are subject to change at the Company’s discretion)
26 April 2016 Tender Offer and Consent Solicitation Exercise commences
26 April 2016 Singapore Roadshow
9 May 2016, 10:00am (Singapore time) Early Tender and Consent deadline
16 May 2016, 10:00am (Singapore time) Normal Tender and Consent deadline
18 May 2016, 10:00am (Singapore time) Noteholders’ Meeting
(A) If Quorum is achieved at the first Noteholders’ Meeting
19 May 2016 Announcement of results
19 – 23 May 2016 Target Settlement of Tender / Consent Fees
(B) If Noteholders’ Meeting is adjourned
19 May 2016 Publish Notice of Adjourned Meeting
31 May 2016, 10:00am (Singapore time) Final Consent deadline
2 June 2016, 10:00am (Singapore time) Adjourned Noteholders’ Meeting
3 June 2016 Announcement of results
3 – 7 June 2016 Target Settlement of Tender /Consent Fees
Note: Please refer to the Invitation Memorandum dated 26 April 2016 for more details

Table of Contents
5
Business Overview 1
Competitive Strengths
Business Strategies
Financial Overview
Key Performance Metrics
Organic Growth Case Studies
2
3
4
5
6
Appendix 1: Government Regulation, Funding & Policy 7
Appendix 2: FY 15 Financial Statements 8

Business Overview

Corporate Snapshot
7
Key Financial Highlights FY15
Underlying EBIT $145.4m
Like For Like Centre Organic EBIT Growth $8.3m
Underlying EBITDA / Net Interest Paid 8.0x
Underlying EBITDA to Net Debt 2.1x
Post Tax Return on Equity 14.5%
Cash Conversion from Underlying EBITDA 99%
Underlying Earnings per Share Growth 29%
Capital Structure
Fully Paid Ordinary Shares (current) 374.7m
Share Price (as at 19 Apr 2016) $3.95
Market Capitalisation (as at 19 Apr 2016) $1.4bn
Cash (as at 31 Dec 15) $194m
Senior Secured Debt - Undrawn (as at 31 Dec 15) $50m
Senior A$ Unsecured Notes $120m
Senior S$ Unsecured Notes $260m
Senior SGD Unsecured Notes - Redeemed 29/02/16 $155m
Substantial Shareholder Shares % Holding
Challenger Limited 26.3m 7.0%
UBS Group AG 22.4m 6.0%
10.8% 10.6% 11.2%
14.5%
FY12 FY13 FY14 FY15
Post Tax Return on Equity

Mission Statement
8
G8’s key strategic objective is to be the leading provider of high quality, developmental and education childcare services in both Australia and Singapore. By building and operating a portfolio of outstanding early childhood education brands, focusing on the importance of early childhood education and by making good centres great centres by delivering outstanding early childhood education management the Group’s objectives are achieved.
Quality Education & Care
• G8 believes that continually investing in its facilities provides the tools for its educators to continue to deliver exceptional care and education for the thousands of children that attend G8’s childcare and education centres
Employees
• G8 is committed to maintaining a positive workplace culture and is focused on becoming an employer of choice through offering a number of workplace benefits for over 10,000 employees
Community
• G8 now operates under 24 brands in Australia and Singapore. Community engagement on every level is an essential component of our strategy and a key point of difference for the group

G8 Education Limited (‘G8 Education’) is an Australasian childcare services provider that is listed on the Australian Stock Exchange (‘ASX’) under the ticker code ‘GEM’, with a market capitalisation of approximately $1.4 billion as at 19th April 2016. We have a total portfolio of 489 childcare and education centres in Australia and Singapore. Our acquisition strategy has been to buy profitable centres which are in operation and to integrate and manage a number of key operational metrics and performance indicators to improve individual centre performance in line with the overall group performance.
Australia G8 Education has a portfolio of 471 childcare and education centres. G8 Education is the largest for-profit operator in Australia. G8 Education estimates that there are 6,500 long day care centres across Australia, resulting in G8 Education currently having over 7% market share. 4,000 of these centres are within the addressable market. The Australian childcare services industry comprises 11,420 centres (including family day care, occasional care, long day care and outside school care) run by 7,850 operators, employing 122,000 people and generates A$7.8 billion revenue p.a.
Singapore G8 Education currently owns 18 childcare and education centres and operates 37 franchised childcare and education centres in Singapore.
9
Figure 1: Child care services in Australia - market share
Overview
Goodstart 12%
Anchorage 1%
G8 Education 7%
Other 79%
Guardian 1%
Source: Company Data; Q8710 - Child Care Services in Australia, Feb, 2014, IBISWorld Pty Ltd
Group Centre Portfolio
10
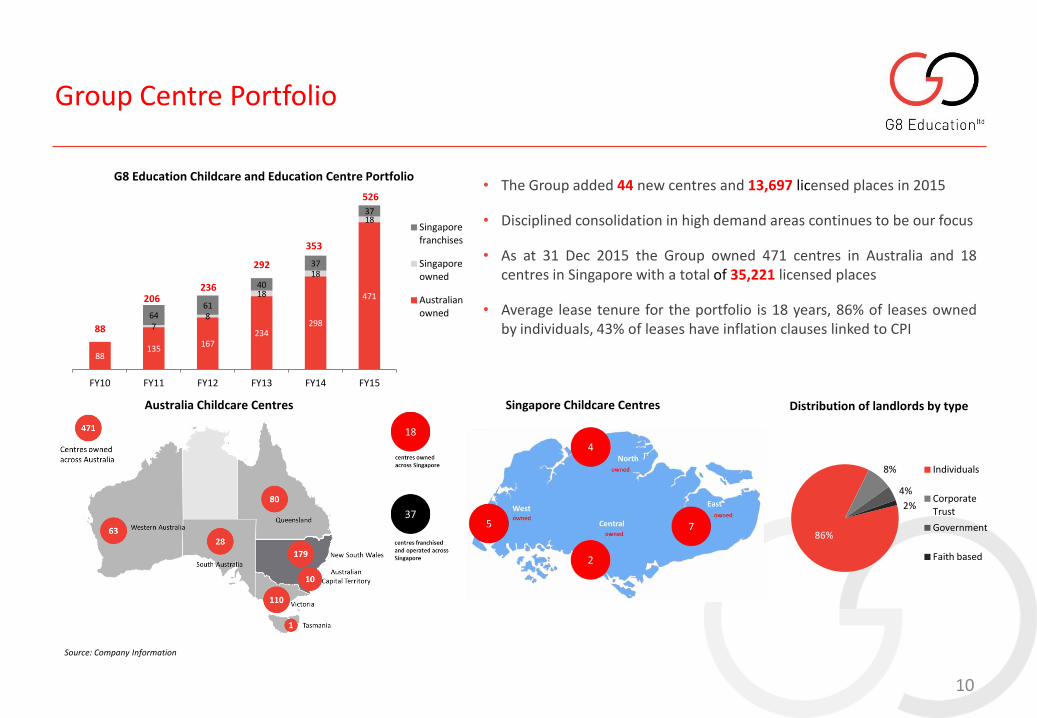
• The Group added 44 new centres and 13,697 licensed places in 2015
• Disciplined consolidation in high demand areas continues to be our focus
• As at 31 Dec 2015 the Group owned 471 centres in Australia and 18 centres in Singapore with a total of 35,221 licensed places
• Average lease tenure for the portfolio is 18 years, 86% of leases owned by individuals, 43% of leases have inflation clauses linked to CPI
86%
8%
4%
2%
Distribution of landlords by type
Individuals
Corporate Trust
Government
Faith based
Singapore Childcare Centres
Source: Company Information
88 135
167 234
298
471
7 8
18
18
18
64 61
40
37
37
FY10 FY11 FY12 FY13 FY14 FY15
Singapore franchises
Singapore owned
Australian owned
G8 Education Childcare and Education Centre Portfolio
88
206 236
292
353
526
Australia Childcare Centres

Brands - Singapore
Owned
G8 Education acquired 7 centres in 2011, with a further centre being acquired in 2012. G8 Education took ownership of a further 10 centres in 2013.
Currently 18 centres are owned by G8 Education across Singapore.
Franchised Centres
The model under which the Singapore ‘franchise’ centres operate is a fee for service.
Currently, 37 centres are franchised and managed by G8 Education across Singapore under the Our Juniors and Cherie Hearts brands.
11
BRAND # OF CENTRES (OWNED)
# OF CENTRES (FRANCHISED)
Cherie Hearts 13 32 Bright Juniors 4 - Our Juniors 1 5 TOTAL 18 37

12
Brands - Australia
Brand Total
Casa Bambini 3
Community Kids 84
Early Learning Services 48
First Grammar 29
Great Beginnings 35
Headstart 20
Kinder Haven 17
Kool Kids 10
Kindy Patch 37
NurtureOne 22
Pelican 9
Penguin 7
World of Learning 68
Creative Garden 17
Bambinos 12
Jellybeans 21
Sandcastles 7
The Learning
Sanctuary 9
Buggles 16
Total 471

Business Organisation Flow Chart
13
Chief Financial Officer
Chief Executive Officer
General Manager of Operations
Financial Controller
Financial Reporting
AP and AR
Senior Operations Managers
Operations Managers
Centre Directors
1
45
471
6
Marketing Information Technology
Safety and Facilities
Human Resources
Operations Support
10 10 23
8
6
6
Training and education
6
17
Executive Officer
Managing Director
Revenue Generation Revenue Accounting
Advice for Tax/Modelling
matters obtained
Accounts preparation to
month end level
A. 1st draft FC B. Review by CEO
C. Signed off by CFO
Big Four Auditors & Misc Lawyers
Educators 10,122
Non executive director Chairman Non executive director Non executive director Non executive director
Acquisitions Responsibility Flow Chart
14
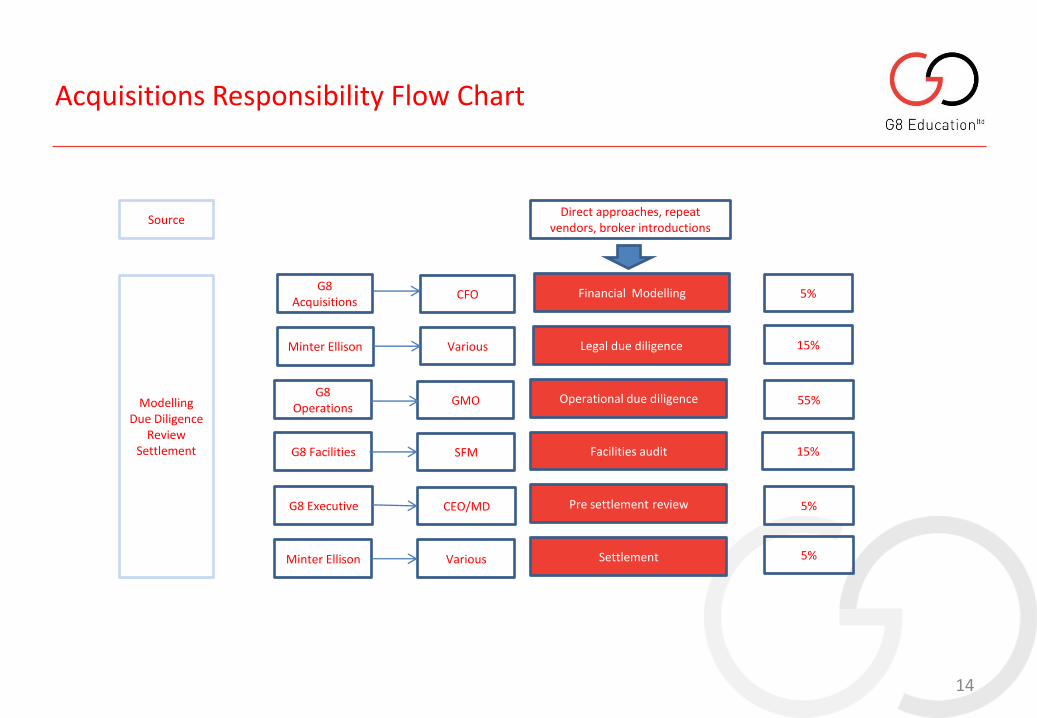
Financial Modelling
Legal due diligence
Operational due diligence
Settlement
Facilities audit
Pre settlement review
Direct approaches, repeat vendors, broker introductions
Minter Ellison
G8 Acquisitions
G8 Operations
G8 Facilities
G8 Executive
Minter Ellison
15%
55%
15%
5%
5%
5%
Various
CFO
GMO
SFM
CEO/MD
Various
Source
Modelling Due Diligence
Review Settlement

Board of Directors
15
Mark Johnson Chris Scott Brian Bailison Matthew Reynolds Susan Forrester David Foster
B.Com, FCA, FAICD B.Econ. (Hons) B.Com., B.Acc (Cum Laude), ACA
B. Sc. (Hons), LLB (Hons), MQLS
BA, LLB(Hons) EMBA, FAICD B.App.Sci, MBA, GAICD,
SFFin
Chairman Managing Director Non Executive Director Non Executive Director Non Executive Director Non Executive Director
Mark Johnson is an experienced chairman and company director. Prior to embarking on his Board career, Mark was the CEO and Senior Partner of PricewaterhouseCoopers (PwC) from July 2008 to June 2012. His former roles include Chairman of the PwC Foundation, member of the Auditing and Assurance Board and Deputy Chair of the Finance and Reporting Committee at the Australian Institute of Company Directors.
Chris has over 25 years experience in senior management positions. He has spent over 30 years in business in Singapore where he was involved in a number of successful businesses.
Chris was also the founder and managing director of ASX listed S8 which was an integrated travel company that made 36 acquisitions over 5 years and was capitalised at A$700 million. His operational, analytical and strategic skills are critical in the selection of potential acquisitions.
Brian has over 17 years experience in finance, corporate finance and operations from senior roles in listed and unlisted businesses in South Africa and Australia, including senior positions at Rand Merchant Bank Limited (South Africa’s largest bank-assurance business), the Ivany Investment Group (diversified investment Group) and Payce Consolidated Limited which operated 59 child care centres prior to them becoming part of the Group.
Matthew is currently a partner at HWL Ebsworth Lawyers and has experience in capital markets, ASX listing, private equity and mergers and acquisitions. He specialises in providing tailored legal and strategic advice in a highly regulated and technical market and has advised on a large number of complex capital and merger and acquisition projects.
Susan Forrester is an experienced company director with a diverse portfolio career. She has a significant blend of commercial, financial and legal management experience gained across public, private organisations.
She is currently chair for National Veterinary Care Ltd (ASX: NVL) and Oncore Group Holdings Pty Ltd, is a non-executive director of Over the Wire Group Ltd and Uniting Care Qld. She serves as Independent Chair of the Audit Committee of Transport and Main Roads Qld. She also leads the Strategy Practice of Board Matters Pty Ltd, where she provides expert advice to listed and unlisted Boards on Board.
David Foster enjoyed a successful career in financial services spanning over 25 years. His last executive role was as CEO of Suncorp Bank, Australia’s 5th largest bank.
Since leaving Suncorp, Mr Foster has further developed his career as an experienced Non-Executive Director with a portfolio of Board roles across a diverse range of industries including financial services, retailing, local government, education and professional services. He currently serves as a Director on the Boards of the Thorn Group Limited (ASX:TGA) and Kina Securities Limited (ASX:KSL) and chairs both their Audit and Risk Committees.

Competitive Strengths

Competitive Strengths
17
Multi-brand portfolio strategy
G8 Education adopts a multi-brand approach, operating over 19 brands in Australia and 3 brands in Singapore to cater to the needs of the local community
Revenue underpinned by supportive government policies
Supportive government policies in the form of government rebates and benefits contribute to the financial revenue generated by G8 Education
Strong long-term demand for early childhood education services
Positive demand backdrop with the increased number of women in the workforce and a changing attitude towards early childhood education as an important educational foundation step creates significant growth opportunities
Acquisition opportunities driven by highly fragmented industry and strategic partnerships
Low level of ownership concentration within the child care sector in Australia and good relationships with brokers and vendors of childcare centres enable G8 Education to be highly selective in targeting potential businesses
Portfolio of high quality established childcare centres
The diversity of brands and geographical locations of centres within G8 Education’s portfolio contributes greatly to its earnings resilience

Business Strategies

Business Strategies
19
Acquisition Strategy Quality Care and
Education Employees Community
G8 Education focuses on identifying childcare
centre brands within socio-economic areas
which have the potential to increase
placements, and which are capable of being acquired on terms
based on a multiple of centre EBIT as
determined by G8 Education from time to
time
G8 Education believes that continually
investing in its facilities provides the tools for
its educators to continue to deliver
exceptional care and education for the
children. In 2015, G8 Education spent
approximately A$9 million on improving
childcare facilities within its centres.
G8 Education is committed to
maintaining a positive workplace culture.
With a continued focus on providing the highest level of
employee workplace satisfaction and
engagement, staff turnover within G8
Education has declined.
G8 Education provided care and education to over tens of thousands of children in Australia and Singapore in 2015.
Its centres are a collaboration of
children, parents and educators and continue to be an integral part of their local community offering support to the families, charities and
community events.

Financial Overview

Financial Strategy
The Group’s primary financial objective is to maintain year on year double digit earnings per share growth through:
1. Occupancy Growth Driven by sustaining the execution of the G8 corporate model with an emphasis on first class care provision through on going investment in our staff, facilities and brands
2. EBIT Growth Driven by maintaining revenue growth in excess of cost growth (positive jaws) and exercising discipline at the support office cost level
3. Portfolio Growth Driven by ongoing bolt on acquisitions of earnings accretive premium child care centres
21
Corporate Objectives for FY16: • Generate double digit EPS growth • Acquire between $50m and $150m in • centre acquisitions • Maintain net debt to EBITDA at or under 2x
FY10 FY11 FY12 FY13 FY14 FY15

Track Record of Financial Performance
67 143 180
275
491
706
FY10 FY11 FY12 FY13 FY14 FY15
Total Revenue (A$m)
22
5 17 19
31
53 89
6.8%
12.1% 10.7% 11.3% 10.7%
12.5%
0.0%
2.0%
4.0%
6.0%
8.0%
10.0%
12.0%
14.0%
0
20
40
60
80
100
FY10 FY11 FY12 FY13 FY14 FY15
(A$m) NPAT (A$m) & NPAT margin
Net Profit After Tax NPAT Margin
91%
118%
90%
103% 103% 99%
FY10 FY11 FY12 FY13 FY14 FY15
Historical Cash Conversion(1)
(1) Note: Cash conversion = Operating Cashflow plus net interest paid and tax paid divided by Underlying EBITDA.
8 27 32
54
105
155
11.9%
18.9% 17.8% 19.6%
21.4% 21.9%
0.0%
5.0%
10.0%
15.0%
20.0%
25.0%
0
50
100
150
200
FY10 FY11 FY12 FY13 FY14 FY15
(A$m) EBITDA (A$m) and EBITDA Margin
EBITDA EBITDA Margin

Key Balance Sheet Statistics
115 188 269
482
1,003
1,234
FY10 FY11 FY12 FY13 FY14 FY15
Total Assets (A$m)
23
8 14 22 114 121
194
-16 -36 -49 -114
-353 -515 (8) (22) (27) (0)
(232)
(321) -800
-600
-400
-200
0
200
400
FY10 FY11 FY12 FY13 FY14 FY15
(A$m) (Net Borrowings)/Net Cash Position (A$m)
Cash and Cash Equivalents Total Borrowings Net Borrowings Position
84 115 182
305
542 603
FY10 FY11 FY12 FY13 FY14 FY15
Total Equity (A$m)
149(1)
252
50 70
0
100
200
300
FY16 FY17 FY18 FY19
(A$m) Debt Maturity Profile (A$m)
(1) S$155m of bonds have been redeemed on 29 Feb 2016

Prudent Capital Management
0.19
0.32 0.27 0.37
0.65
0.85
0.09 0.19 0.15
0.00
0.43 0.53
FY10 FY11 FY12 FY13 FY14 FY15
Gearing Ratio (x)
Total Borrowings / Total Equity (x) Net Borrowings / Total Equity (x)
24
13.5%
19.3% 18.3%
9.5%
0.0% 0.0%
FY10 FY11 FY12 FY13 FY14 FY15
Total Secured Debt / Total Assets (%)
0.94 0.82 0.86
0.00
2.49 2.30
FY10 FY11 FY12 FY13 FY14 FY15
Net Borrowings / EBITDA (x)
6.1
12.3 12.6 11.1
7.1 6.8
FY10 FY11 FY12 FY13 FY14 FY15
EBITDA / Finance Charges (x)
Debt Structure
25
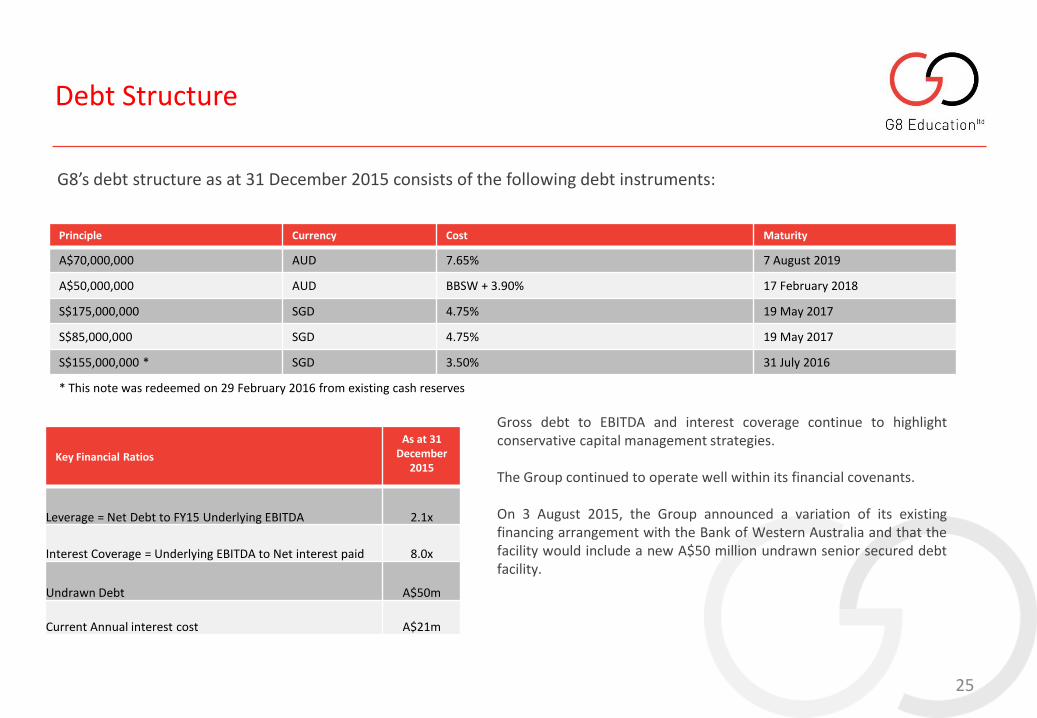
Principle Currency Cost Maturity
A$70,000,000 AUD 7.65% 7 August 2019
A$50,000,000 AUD BBSW + 3.90% 17 February 2018
S$175,000,000 SGD 4.75% 19 May 2017
S$85,000,000 SGD 4.75% 19 May 2017
S$155,000,000 * SGD 3.50% 31 July 2016
* This note was redeemed on 29 February 2016 from existing cash reserves
G8’s debt structure as at 31 December 2015 consists of the following debt instruments:
Gross debt to EBITDA and interest coverage continue to highlight conservative capital management strategies. The Group continued to operate well within its financial covenants. On 3 August 2015, the Group announced a variation of its existing financing arrangement with the Bank of Western Australia and that the facility would include a new A$50 million undrawn senior secured debt facility.
Key Financial Ratios
As at 31 December
2015
Leverage = Net Debt to FY15 Underlying EBITDA 2.1x
Interest Coverage = Underlying EBITDA to Net interest paid 8.0x
Undrawn Debt A$50m
Current Annual interest cost A$21m

Key performance metrics

Full year like for like EBIT performance
27
• Like for like EBIT margin
increased to 23.8% in 2015 from 22.8% in 2014
• Like for like EBIT grew by $8.3m which represents a 11% growth rate on 2014
Like for likes calculated based on ownership of centre for a full calendar year. Acquisitions made part way through a year are captured in the following years data.
Full Year Like for Like EBIT $000
Vintage Number of
centres
2011 2012 2013 2014 2015 Growth FY15 on
FY14
Acquired pre 2011 74 15,682 17,298 21,021 21,579 24,019 2,440
% increase 10% 22% 3% 11%
Acquired in 2011 43 - 12,933 15,476 18,288 20,603 2,315
% increase 20% 18% 13%
Acquired in 2012 33 - - 14,737 16,040 17,561 1,521
% increase 9% 9%
Acquired in 2013 74 - - - 21,268 23,320 2,051
% increase 10%
Centre EBIT from 2014 settled Acquisitions 203 72,578 Centre EBIT from 2015 settled Acquisitions 44 6,897 Head Office and Corporate Costs (19,540)
Total Group Underlying EBIT 471 145,438 8,328

Like for Like - Occupancy
28
Vintage Number of centres 2011 2012 2013 2014 2015
Acquired pre 2011 74 86% 86% 87% 87% 85%
Acquired in 2011 43 - 93% 95% 94% 93%
Acquired in 2012 33 - 95% 94% 93%
Acquired in 2013 74 87% 85%
LFL Peak Occupancy
Like for likes calculated based on ownership for a full calendar year. Acquisitions made part way through a year are captured in the following years data. Acquisitions made in 2014 are excluded.
Peak occupancy refers to the highest monthly occupancy achieved throughout the year.

Support Office Cost per Licensed Place
• Support office cost per licensed place fell in 2015 to $439.
• Efficiency and productivity gains from process upgrades and application of technology continues to push costs lower.
• Ongoing discipline in recruitment have allowed wage costs to remain anchored.
29
2010 2011 2012 2013 2014 2015
Number of Places 6,304 9,868 12,661 17,597 32,782 35,221
Support Office Cost per Licensed Place $710 $523 $520 $485 $455 $439
$0
$100
$200
$300
$400
$500
$600
$700
$800
2010 2011 2012 2013 2014 2015
Support Office Cost per Licensed Place
Support office cost per place includes all costs associated with the operation and execution of our centre based strategy. It does not include corporate costs relating to our capital structure such as listing fees nor depreciation and amortisation

Organic Growth Case Studies

Operational case studies
A selection of group acquisitions demonstrates the Group’s ability to drive organic EBIT growth via the execution of the G8 corporate model:
• Ramsay Bourne – 25 Centres acquired in March 2010
• Local Kids – 19 Centres acquired in September 2010
• Kindy Patch - 24 Centres acquired in January 2011
• Kids Korner - 6 Centres acquired in April 2011
• Pacific Group - 16 Centres acquired in September 2012
• Roly Poly - 8 Centres acquired in September 2013
The aggregate EBIT of these centres when combined in 2015 generates $40.8m which on a purchase price of $97.5m implies an effective acquisition multiple in FY15 of 2.39x.
The increase in other operating costs as a percentage of revenue reflects the Group’s commitment to continual investment in educational resources and facility maintenance.
31
Purchase Price $'000 97,480
$'000 CY15
Revenue 155,239
Employment Expenses 82,370
as % of revenue 53.1%
Rent Expenses 14,842
as % of revenue 9.6%
Other Operating Costs 17,250
as % of revenue 11.1%
EBIT 40,777
EBIT Margin 26.3%
Effective Acquisition Multiple 2.39

Operational Excellence – Case Studies
32
Name of Acquisition Local Kids
Number of Centres 19
Date Acquired Sep-10
Purchase Price
14,300,000
$'000 FY11 FY12 FY13 FY14 FY15
Revenue 22,094 24,685 27,192 27,385 29,064
Revenue Growth (%) 11.7% 10.2% 0.7% 6.1%
Employment Expenses 13,357 15,017 15,959 16,119 16,568
as % of revenue 60.5% 60.8% 58.7% 58.9% 57.0%
Rent Expenses
2,687
2,751
2,742
2,722
2,802
as % of revenue 12.2% 11.1% 10.1% 9.9% 9.6%
Other Operating Costs
2,332
2,781
3,081
3,170
3,478
as % of revenue 10.6% 11.3% 11.3% 11.6% 12.0%
EBIT 3,718 4,136 5,410 5,374 6,216
EBIT Margin 16.8% 16.8% 19.9% 19.6% 21.4%
Acquisition Multiple
3.85
3.46
2.64
2.66
2.30
Name of Acquisition Ramsay Bourne
Number of Centres 25
Date Acquired Mar-10
Purchase Price
16,000,000
$'000 FY11 FY12 FY13 FY14 FY15
Revenue 25,130 27,706 30,130 33,489 36,133
Revenue Growth (%) 10.3% 8.7% 11.1% 7.9%
Employment Expenses 14,418 15,690 16,906 18,650 19,591
as % of revenue 57.4% 56.6% 56.1% 55.7% 54.2%
Rent Expenses
2,424
2,586
2,679
2,850
2,906
as % of revenue 9.6% 9.3% 8.9% 8.5% 8.0%
Other Operating Costs
2,678
2,998
3,433
3,914
4,453
as % of revenue 10.7% 10.8% 11.4% 11.7% 12.3%
EBIT 5,609 6,432 7,112 8,075 9,184
EBIT Margin 22.3% 23.2% 23.6% 24.1% 25.4%
Acquisition Multiple
2.85
2.49
2.25
1.98
1.74

Operational Excellence – Case Studies
33
Name of Acquisition Kindy Patch
Number of Centres 24
Date Acquired Jan-11
Purchase Price
22,300,000
$'000 FY12 FY13 FY14 FY15
Revenue 29,868 32,539 34,218 37,248
Revenue Growth (%) 8.9% 5.2% 8.9%
Employment Expenses 17,816 18,712 18,569 18,697
as % of revenue 59.6% 57.5% 54.3% 50.2%
Rent Expenses
3,286
3,307
3,294
3,398
as % of revenue 11.0% 10.2% 9.6% 9.1%
Other Operating Costs
2,845
3,150
3,337
4,081
as % of revenue 9.5% 9.7% 9.8% 11.0%
EBIT 5,921 7,369 9,018 11,072
EBIT Margin 19.8% 22.6% 26.4% 29.7%
Acquisition Multiple
3.77
3.03
2.47
2.01
Name of Acquisition Kids Korner
Number of Centres 6
Date Acquired Apr-11
Purchase Price
7,080,000
$'000 FY12 FY13 FY14 FY15
Revenue 8,275 9,178 9,959 10,824
Revenue Growth (%) 10.9% 8.5% 8.7%
Employment Expenses 4,268 4,641 4,782 4,785
as % of revenue 51.6% 50.6% 48.0% 44.2%
Rent Expenses
1,562
1,623
1,691
1,752
as % of revenue 18.9% 17.7% 17.0% 16.2%
Other Operating Costs
748
807
888
1,018
as % of revenue 9.0% 8.8% 8.9% 9.4%
EBIT 1,698 2,107 2,597 3,270
EBIT Margin 20.5% 23.0% 26.1% 30.2%
Acquisition Multiple
4.17
3.36
2.73 2.17

Operational Excellence – Case Studies
34
Name of Acquisition Pacific Group
Number of Centres 16
Date Acquired Sep-12
Purchase Price 28,000,000
$'000 FY13 FY14 FY15
Revenue 28,563 30,840 33,000
Revenue Growth (%) 8.0% 7.0%
Employment Expenses 16,256 17,566 18,663
as % of revenue 56.9% 57.0% 56.6%
Rent Expenses 2,768 2,880 3,032
as % of revenue 9.7% 9.3% 9.2%
Other Operating Costs 2,964 3,025 3,329
as % of revenue 10.4% 9.8% 10.1%
EBIT 6,575 7,369 7,976
EBIT Margin 23.0% 23.9% 24.2%
Acquisition Multiple 4.26 3.80 3.51
Name of Acquisition Roly Poly
Number of Centres 8
Date Acquired Sep-13
Purchase Price
9,800,000
$'000 FY14 FY15
Revenue 8,500 8,969
Revenue Growth (%) 5.5%
Employment Expenses 3,914 4,067
as % of revenue 46.0% 45.3%
Rent Expenses 915 952
as % of revenue 10.8% 10.6%
Other Operating Costs 784 891
as % of revenue 9.2% 9.9%
EBIT 2,887 3,059
EBIT Margin 34.0% 34.1%
Acquisition Multiple 3.39 3.20

APPENDIX 1: GOVERNMENT REGULATION, FUNDING & POLICY 35

Overview - Singapore
Early Childhood and Development Agency
The Early Childhood and Development Agency serves as the regulatory and developmental authority for the early childhood sector in Singapore, overseeing all aspects of children's development below the age of 6, across both kindergartens and childcare centres.
Early Childhood and Development Agency is an autonomous agency jointly overseen by the Ministry of Education and the Ministry of Social and Family Development, and hosted under the Ministry of Social and Family Development.
Early Childhood and Development Agency was officially launched on 1 April 2013 and integrates the regulation, planning, professional development and public education functions of Ministry of Education 's Pre-School Education Branch and Ministry of Social and Family Development's Child Care Division.
Early Childhood and Development Agency's key responsibilities are to:
Oversee measures to raise quality standards of early childhood programmes, including regulation, quality assurance, and the provision of early childhood development resources;
Facilitate the training and continuing professional development of early childhood professionals;
Master-plan for infrastructure and manpower resources to support the early childhood sector;
Provide subsidies and grants to keep quality pre-school programmes affordable, especially for low and middle income families; and
Conduct public education and outreach to raise parents' awareness and support for their children's development.
36

Government Funding - Singapore
Childcare subsidies
To enhance the affordability of childcare services in Singapore, the Singaporean Government provides child care subsidies to working and non-working mothers whose children are enrolled in a licensed centre.
From 1 April 2013, the ComCare Child Care Subsidies (also known as the Centre Based Financial Assistance for Child Care or CFAC) was combined with the universal working mother subsidy, into one subsidy framework. This simplifies the application process for parents and childcare operators.
All parents will continue to receive a Basic Subsidy. Families with a gross monthly income of up to S$7,500 will receive an Additional Subsidy depending on the monthly income.
Childcare centres can apply on behalf of parents for these Subsidies to the Early Childhood and Development Agency.
37
Basic Subsidy
Working mothers qualify for a Basic Subsidy of up to S$600 for infant care and S$300 for child care. Non working mothers receive S$150 for both child care and infant care.
Additional Subsidy
Families with a gross household income of S$7,500 and below, or larger families with a per capita income of S$1,875 and below, will benefit from an additional subsidy of at least S$200 for infant care and S$100 for childcare.

Government Regulation - Australia
National Quality Framework
The recent introduction of the National Quality Framework has resulted in a large change to the regulatory environment of the childcare industry in Australia. Introduced in January 2012, the framework replaces existing state-based standards, licensing and regulations. As an agreement between the Commonwealth, State and Territory Governments of Australia, it establishes a standardised national quality assessment and regulation framework for early childhood education and care. The National Quality Framework initially covers most long day care services, outside school hours care services, preschools (or kindergartens) and family day care services; however, some services are excluded such as occasional care and education and in-home care and education.
National Quality Standard
The National Quality Standard is a key aspect of the National Quality Framework and sets a national benchmark against which early childhood education and care services, and outside school hours care services, are rated.
Services are assessed and given a rating against seven ‘Quality Areas’ as well as an overall rating. The ratings process aims to drive continuous quality improvement and provide families with better information for making choices about their children’s education and care.
38

National Quality Standard
39

Government Funding - Australia
40
Co
mm
on
wea
lth
G
ove
rnm
ent
The Commonwealth Government provides fee assistance to families to increase the accessibility of childcare. Government investment in childcare has increased significantly over the last decade (Figure 2) and is expected to continue (Figure 3).
The Commonwealth Government provides families with two main forms of financial assistance – Child Care Benefit and the Child Care Rebate. These two assistance programs are central in supporting families to increase their participation in the workforce and the early education and development of their children. Child Care Benefit The Child Care Benefit, which was introduced on 1 July 2000 to replace previous Commonwealth Government funding programs, is an income tested payment based on family income which reduces the cost of childcare. Payments are typically paid directly to providers approved to receive the Child Care Benefit to reduce the out-of-pocket fees payable, although parents and guardians can elect to have the payment received as a lump sum. The Child Care Benefit is indexed to changes in the Consumer Price Index (“CPI”). Child Care Rebate The Child Care Rebate was introduced in 2004 to supplement the Child Care Benefit and is a non-income tested payment to help recover the out of pocket costs to parents and guardians, of childcare. The rebate covers up to 50% of out of pocket costs up to a maximum of A$7,500 per child, per year where it will remain, subject to the passage of legislation, until 30 June 2017. Other Commonwealth Government funding In addition to the Child Care Benefit and Child Care Rebate, the Commonwealth Government also has in place other support initiatives to assist with the cost of childcare. These include the Jobs, Education and Training Child Care fee assistance program, the Grandparent Child Care Benefit and the Special Child Care Benefit.

Government Funding - Australia
41
Figure 3: Growth in Commonwealth Government Funding expected through to FY17
Source: DSS & Education and Training portfolio budget statements 2014-2015 and 2015-2016, HGIB. Figures relate to daycare only, which is the childcare service which the Issuer provides and is part of the overall early childhood education and care services data used in Figure 2.
Figure 2: Total Government Expenditure ($’M)
Source: Australian Government Productivity Commission - Report on Government Services 2016: Total government expenditure on early childhood education and care. Figures include amounts relating to early childhood education and care (ECEC) services, which include childcare services and pre-school services
3000
4000
5000
6000
7000
8000
9000
2005-06 2006-07 2007-08 2008-09 2009-10 2010-11 2011-12 2012-13 2013-14 2014-15
Government funding
FY15 $bn
FY16 $bn
FY17 $bn
Child Care Benefit 3.36 3.62 3.84
Child Care Rebate 3.07 3.53 3.99
Total Funding 6.43 7.15 7.83
Increase Year-on-Year 11.2% 9.5%

APPENDIX 2: FY 15 FINANCIAL STATEMENTS

43
• Revenue increased by 44% year on year rising from $488m in 2014 to $703m in 2015.
• Wages as a percentage of revenue from continuing operations were 55.5% in 2015 versus 56.0% in 2014.
• Rent expense in 2015 was 11.3% of revenue from continuing operations compared to 11.6% in 2014.
• The Group continued to generate year on year improvements in underlying EBIT margin recording 21.2% for the period.
• Underlying earnings before interest and tax, net profit after tax and underlying earnings per share increased by 45%, 44% and 29% respectively.
• The finance cost shown is net of interest income ($2.6m) and includes the foreign currency loss ($12.0m) on the SGD bonds as well as the borrowing costs ($5.6m) written off associated with the bonds.
Consolidated Year end 31 December 2015
$'000 2014
$'000
Revenue* 703,547 488,402
Expenses (543,124) (382,437)
Earnings Before Interest and Tax 160,423 105,965
Financing Cost (net of interest income)* (37,650) (33,404)
Net Profit Before Tax 122,773 72,561
Net Profit After Tax 88,581 52,731
Less non-operating transactions:
Deferred consideration not paid**1 (5,755) (9,178)
Acquisition expenses 916 3,354
Share based payment expense ** 344 107
Profit on sale of financial assets^2 (7,343) -
Write off of SGD borrowing costs relating to sale of financial assets^ 2,010 -
Write off of borrowing costs on refinance**^ - 566
Foreign currency translation loss**^ 8,378 13,033
Underlying Net Profit After Tax 87,131 60,613
Effective Tax Rate 28% 27%
Underlying EPS (cents per share) 23.87 18.57
Underlying Earnings Before Interest and Tax 145,438 100,248
* Excludes interest income of $2.6m which is included in finance costs
** These items are non cash adjustments
^ These items have been adjusted for tax
1 Deferred consideration not paid relates to the write back of centre based earnouts not achieved 2 Profit on sale of Affinity (AFJ) shares was $10.5m pre tax excluding cost of SGD bond raising
FY 15 Income Statement

FY 15 Balance Sheet
• Trade and other receivables – An increase of $8.7m was due to the timing of year end cut off and the consequent impact on debtors combined with a rise in GST receivable.
• Other current assets - A decrease in deposits on acquisitions caused other current assets to fall from $13.6m to $9.7m.
• Property, plant and equipment – PP&E increased by $11.8m due acquisitions and centre based CAPEX.
• Goodwill – There was a $135.4m increase in goodwill reflecting the purchase price of centres settled in 2015.
• Trade and other payables – This increase of $10.6m is largely due to a rise in other payables and accruals partially offset by a reduction in deferred centre acquisition payments.
• Current borrowings - $148.9m relates to the SGD unsecured note to finance the cash component of the Affinity Education acquisition. This will be repaid on the 29 February 2016.
• Non-current borrowings – The increase in this liability is a function of the year end revaluation of the SGD bond at year end.
44
2015
$'000 2014
$'000
ASSETS
Current assets
Cash and cash equivalents 193,840 120,804
Trade and other receivables 22,943 14,164
Other current assets 9,754 13,642
Total current assets 226,537 148,610
Non-current assets
Property plant and equipment 41,370 29,575
Deferred tax assets 21,678 15,448
Goodwill 944,604 809,162
Total non-current assets 1,007,652 854,185
Total assets 1,234,189 1,002,795
LIABILITIES
Current liabilities
Trade and other payables 83,054 75,567
Borrowings 148,891 -
Employee entitlements 22,824 18,110
Derivative financial instruments 1,184 230
Current tax liabilities 4,400 9,655
Total current liabilities 260,353 103,562
Non-current liabilities
Borrowings 366,270 352,944
Other payables 712 652
Provisions 4,069 3,628
Total non-current liabilities 371,051 357,224
Total liabilities 631,404 460,786
Net assets 602,785 542,009
Following the decision to appoint Ernst & Young as external auditor for 2016, the Company has engaged Ernst & Young to perform specific procedures to compare G8’s current accounting policies, as disclosed in note 1 in the Annual Report, to Australian accounting standards. As a result of the procedures, the Directors are satisfied that no change in accounting policies is required that will result in a change in balances previously reported by G8.

FY 15 Cash Flow
45
• Operating cash flow in 2015 was strong at $95.1m compared
to $74.7m in 2014.
• Cash conversion remained impressive at 99% calculated as
operating cashflow plus net interest paid and tax paid divided
by underlying EBITDA.
• Payments for businesses of $128.9m represents the payments
of centres announced in 2014 and 2015 which settled in 2015.
• Proceeds and payments from the sale/purchase of financial
assets relates to the shares held in Affinity Education
subsequently sold to Anchorage Capital.
• Payments for PP&E relate to capital improvements to the
centres.
• Cash flow from financing activities increased by $108.8m
during the year due to the issue of the SGD corporate note,
plus the proceeds from issue of shares which related to the
Dec 14 dividend underwritten by UBS.
2015 $'000
2014 $'000
Cash flows from Operating Activities
Receipts from customers 676,870 494,744
Payments to suppliers and employees (516,762) (383,483)
Interest received 2,861 2,919
Interest paid (22,354) (14,240)
Income taxes paid (45,563) (25,224)
Net cash inflows from operating activities 95,052 74,716
Cash flows from Investing Activities
Payments for purchase of businesses (net of cash acquired) (128,940) (447,751)
Repayment of loans by Key Management Personnel - 1,642
Proceeds from sale of shares 52,073 -
Payments for purchase of shares (33,182) -
Payments for property plant and equipment (21,082) (16,508)
Net cash outflows from investing activities (131,131) (462,617)
Cash flows from Financing Activities
Share issue costs (151) (7,249)
Debt issue costs (4,282) (7,845)
Dividends paid (53,244) (33,273)
Proceeds from issue of corporate note 153,617 272,963
Proceeds from issue of shares 12,934 216,499
Repayment of borrowings - (46,579)
Net cash inflows from financing activities 108,874 394,516
Net increase in cash and cash equivalents 72,795 6,615
Cash and cash equivalents at the beginning of the financial year 120,179 114,029
Effects of exchange rate changes on cash 852 (465)
Cash and cash equivalents at the end of the financial year 193,826 120,179


