182
GADS Open Source Analysis & Reporting GADS Open Source Project
GADS Open Source
Analysis & Reporting
GADS Open Source Project

This manual was produced using ComponentOne Doc-To-Help.™
Analysis & Reporting Contents iii
Contents
Analysis & Reporting 1
Introduction ............................................................................................................................... 1 Quick Start ................................................................................................................................. 3 Main Menu ................................................................................................................................ 5 File ............................................................................................................................................. 5 Load Data .................................................................................................................................. 6
Delete all Event and Performance Data ....................................................................... 6 Load from Data Entry .................................................................................................. 7 View Current Data Loaded – Performance Data ......................................................... 8 View Current Data Loaded – Event Data .................................................................... 9 View Current Data Loaded – Clear Data View ........................................................... 9 Validate Current Data Loaded ..................................................................................... 9
Create Data Tables ................................................................................................................... 10 Perform Calculations ................................................................................................. 10 Create Special Time Sets ........................................................................................... 11 Continuous Timeline ................................................................................................. 11 Discrete Periods ......................................................................................................... 14 List All Sets ............................................................................................................... 16
Generate Reports ..................................................................................................................... 16 Crystal Reports Report Viewer.................................................................................. 17 Important Calculation Notes ...................................................................................... 18 Select Reports ............................................................................................................ 18 Cause Code Selection ................................................................................................ 18 Custom Cause Code Ranges ...................................................................................... 20 User-Defined Cause Code Range Groups ................................................................. 21 NERC GADS Standard Cause Code Groups ............................................................. 22 Event Type Selection ................................................................................................. 22 Individual Events ....................................................................................................... 24 Individual Events – Deratings by Equipment Cause Code ........................................ 26 Individual Events – Event Summary ......................................................................... 27 Individual Events – Event Details ............................................................................. 28 Individual Events – Major Component Work Summary ........................................... 29 Individual Events – Events Following POs/MOs ...................................................... 30 Calculated Events ...................................................................................................... 31 Calculated Events – Deratings by Equipment Cause Code ....................................... 32 Calculated Events – Event Summary ........................................................................ 33 Calculated Events – Event Details ............................................................................. 34 Calculated Events – Major Component Work Summary .......................................... 35 Calculated Events: Performance Measures – Part 1 .................................................. 36 Calculated Events: Performance Measures – Part 2 .................................................. 37 Calculated Events: Hours Summary .......................................................................... 39 Calculated Events: Cause Code Impact ..................................................................... 40 Calculated Events: States by Cause Code ................................................................. 41 Calculated Events: Cause Codes by MWh ................................................................ 42 Performance Statistics ............................................................................................... 42
iv Contents Analysis & Reporting
Performance Statistics: Operating Data Summary .................................................... 43 Performance Statistics: Generating Indexes .............................................................. 45 Performance Statistics: Demand-Related Statistics (EFORd and FORd) .................. 47 EFORdTotal .............................................................................................................. 49 Equipment Cause Code Groups ................................................................................. 50 Custom Calculations .................................................................................................. 52 Unit/Group Selection ................................................................................................. 54
Performance Indexes and Equations ........................................................................................ 56 General Information .................................................................................................. 56 Summary of Various Time and Energy Factors Used by Indexes ............................. 56 Some Words About Calculations .............................................................................. 57 More Words About Data Pooling .............................................................................. 57 Unweighted (Time-Based) Performance Indexes — Single Unit Calculations .......... 58 Unweighted (Time-Based) Performance Indexes — Pooling Unit Calculations ........ 63 Weighted (Energy-Based) Performance Indexes — Pooling Unit Calculations......... 67 Weighted (Energy-Based) Performance Indexes — Outside Management Control
Unit Calculations ....................................................................................................... 71 Custom Reporting .................................................................................................................... 72
Event Hours ............................................................................................................... 72 Event Details ............................................................................................................. 75 Event Records ............................................................................................................ 76 Performance Records................................................................................................. 77 EFORd ....................................................................................................................... 80 EFORd Total ............................................................................................................. 82 Importing GADS Open Source Database Data into Microsoft Excel ........................ 84
Exiting the Program ................................................................................................................. 90 Tips & Tricks ........................................................................................................................... 90
Steam Cycle Heat Rate .............................................................................................. 90 Example 3D Calculation ............................................................................................ 90
Troubleshooting ....................................................................................................................... 91 Timeout Expired ........................................................................................................ 93
Installation & Quick Start 97
Installation ............................................................................................................................... 97 Install Database Setup/Server Console .................................................................................. 100 Install Unit Setup Console ..................................................................................................... 100 Install Administrator Console ................................................................................................ 101 Install Windows User Interface ............................................................................................. 102 Install Web User Interface ..................................................................................................... 103 Web User Interface Installation Issues .................................................................................. 104 Authenticating Web Users/Logging In .................................................................................. 104 Special IIS 5.x and 6.0 Considerations .................................................................................. 106 Unlocking the Software with Keys.xml ................................................................................. 107 Code Access Security ............................................................................................................ 108 .NET Runtime Security Policy Installer ................................................................................ 109 SQL Server 2000 Desktop Engine ......................................................................................... 110 Adobe Reader ........................................................................................................................ 110 CD Reading Troubleshooter .................................................................................................. 111 Installation Quick Start .......................................................................................................... 111 Initial Startup Issues .............................................................................................................. 111
Server Console 113
Creating a Connection to Your GADS Database ................................................................... 113 Configuring the Data Connection in GADSNG.xml ............................................................. 113
Analysis & Reporting Contents v
Customizing Microsoft Access .............................................................................................. 115 Customizing Microsoft SQL Server ...................................................................................... 117 Customizing Oracle 8i/9i ....................................................................................................... 121 SQL Scripts for SQL Server and Oracle ................................................................................ 124
Unit Setup Console 125
Entering Required Data ......................................................................................................... 125 Unit Identification Code ........................................................................................................ 130 Option Page 1 ........................................................................................................................ 131 Option Page 2 ........................................................................................................................ 134 Option Page 3 ........................................................................................................................ 136 Option Page 4 ........................................................................................................................ 138
Administrative Console 139
Introduction ........................................................................................................................... 139 Defining Users ....................................................................................................................... 141 Defining Groups .................................................................................................................... 143 Assigning Units to Groups ..................................................................................................... 147 Assigning Users to Groups .................................................................................................... 148 Calc Settings .......................................................................................................................... 148 Rpt Settings ............................................................................................................................ 152 Status ..................................................................................................................................... 153 Login Settings ........................................................................................................................ 154
Glossary of Terms 155
Index 175

GADS Open Source Analysis & Reporting Analysis & Reporting 1
Analysis & Reporting
Introduction
GADS Open Source assumes the user has a basic knowledge of the NERC GADS
and, as appropriate, of the additional data reporting requirements and calculated
indices of the various ISOs that also require GADS data to be reported.
It is helpful if the user is familiar with the NERC GADS DRI Appendix G –
Reporting Outages to the Generating Availability Data System (GADS) – Examples
and Recommended Methods.
Two of the data types reported in GADS are used in Analysis & Reporting: event
and performance data. The design data is not used directly by this software.
Event data are reported in the Event Report (07) format and performance data in the
Performance Report (05) format. Each of these formats is described in detail in
Sections III and IV of the NERC GADS DRI.
Generally, references to ―GADS‖ refer to the definitions, terms, and requirements
provided in the NERC GADS DRI, since all the ISOs have adopted the NERC
GADS DRI as part of their reporting requirements.
However, be aware that in some cases there are specific differences related to the
way events and performance data are reported. For example, events resulting from
equipment failures or other causes ―external‖ to the generating unit, can be reported
significantly different between NERC and the various ISOs (e.g., U1 vs. RS).
Procedures for determining performance data such as Maximum Capacities can be
different between the two organizations, as well. Such differences can have a
profound effect on calculated factors and rates.
The GADS Open Source Data Entry software will allow you to enter data following
either the NERC or ISO standards, but it is your responsibility to determine which
way to report the GADS data for your generating unit considering all the factors
governing your reporting requirements.
Because of these differences you must give careful consideration to the options in the
various GADS Open Source administrator and setup consoles, which allow you to
determine how the software performs the calculations. The defaults are generally
geared toward the NERC GADS DRI methodologies. You can customize some of
these default settings to allow the use of formulas and equations defined by the
various ISOs. We will be happy to discuss these issues with you at any time.
2 Analysis & Reporting GADS Open Source Analysis & Reporting
Submitting GADS data to NERC is currently voluntary. Submitting GADS data to
the various independent system operators, such as ISO-NE, NYISO, and PJM is a
part of your company‘s contractual obligation in return for connecting your
generating units with their transmission systems.
Whether they submit GADS data to NERC and the ISOs or not, most companies find
the performance and reliability information created from the GADS Open Source
Analysis & Reporting software is an invaluable source to aid in achieving the best
performance from each generating unit, at the lowest possible cost.
Even if they do not submit GADS data externally, most generating companies collect
GADS data on each generating unit because of the tremendous value it provides to
plant managers, engineers, and operating and maintenance personnel when combined
with the analysis capabilities of the GADS Open Source Analysis & Reporting
software.
The GADS Open Source Data Entry software allows you to collect the GADS
Performance and Event data and to submit that data, as required, to NERC, the
various ISOs such as the ISO of New England, New York ISO, Midwest ISO, and
PJM, and any other agency or organization that collects the standard NERC GADS.
For the purposes of GADS data reporting, the term ―unit‖ is defined by NERC
GADS as follows:
Nuclear and fossil (steam) units – those units consisting of a single
reactor or boiler and a single turbine generator. In cases where multiple
boilers and/or multiple turbine generators are headered together, the
entire ensemble is considered a single unit and reported using the
―Miscellaneous Unit‖ design data forms found in Appendix E, Pages E-
117 to E-122 of the NERC DRI.
Hydro, pumped storage, gas turbine, jet engine, and diesel units –
those units consisting of the unique prime mover and a single
generator. In cases where multiple combinations of turbines/engines
and generators exist, either physically or because of operating
philosophy, the entire ensemble may be considered as a single unit (i.e.,
a ―block‖) or reported as individual units. Your specific reporting
criteria should be noted on the NERC design data forms.
Combined cycle units (or blocks) – By definition, a combined cycle is
a process for generating energy (either electricity or steam) created by
the combination of a Rankine Cycle (use heat to boil water to make
steam to turn a steam turbine) with a Brayton Cycle (expand hot gas to
turn a gas turbine). The combined cycle consisting of one or more gas
turbines/jet engines and one or more heat recovery boilers. The steam
from the heat recovery boiler is sent to a steam turbine for generating
electricity. Each gas turbine/jet engine and each steam turbine is a
―unit.‖ The entire ensemble is considered a ―BLOCK.‖ Units where the
gas turbines/jet engines can generate independent of the heat recovery
boilers and steam turbine are also combined cycle blocks. Report
design data using the ―Combined Cycle Block‖ design data forms
found in Appendix E, Pages E-123 to E-XXX of the NERC DRI.

GADS Open Source Analysis & Reporting Analysis & Reporting 3
Cogeneration units – those units consisting of one or more gas
turbines/jet engines and one or more heat recovery boilers.
Cogeneration is similar to the combined cycle block except part of the
steam from the heat recovery boiler is used for other purposes (process
steam); not the generating electricity. The entire ensemble is considered
a single block. Report design data using the ―Combined Cycle Block‖
design data forms found in Appendix E, Pages E-123 to E-XXX of the
NERC DRI.
Fluidized bed combustion units – those units consist of one or more
bubbling, circulating, or pressurized bed boilers or steam turbines.
Consider the entire group as a single unit.
Reporting data to NERC GADS begins when one of the following conditions is met:
1. ―The unit first enters the active state. This is termed the ―service date‖
and occurs when the unit is first declared available for the dispatch of
power at some level of its capability
2. ―The unit first operates at 50% of its generator nameplate megawatt
capability. For purposes of determining reporting requirements, the
generator nameplate capability can be calculated by multiplying the
MVA (megavoltamperes) by the rated power factor found on the
nameplate affixed to the generator (nameplates in the case of multiple
generator units).‖ 1
Reporting event and performance data prior to either of the dates listed above is
optional.
Data reporting requirements for the various ISOs are determined by each individual
ISO. Check with an ISO representative to determine their initial reporting
requirements.
Figure II-1 in the NERC DRI indicates the type of data each company should report
for its units depending on the type and size of those units. Detailed data reporting for
larger units is suggested and is indicated by the term ―required.‖ The term ―optional‖
implies that each company must determine whether it can reasonably provide the
detailed data on smaller units.
We encourage generating organizations to report all data elements currently
collected for their units and any additional information they can reasonably provide.
Quick Start
After you have successfully created your generating units‘ GADS data, there are
three steps to go through each month to initiate the full GADS Open Source Analysis
& Reporting processing.
Very Important Note Step 3 – Generate Reports can be run at any time and as often as needed after the
first two steps are complete.
The following steps assume that the Unit Setup Console input has been completed,
all of the generating units have been properly created, and the authorizations have
been established in the Admin Console, as required.
1. Snapshot the data from the GADS Open Source Data Entry tables into
the GADS Open Source Analysis & Reporting tables.
1 Source: NERC GADS DRI
4 Analysis & Reporting GADS Open Source Analysis & Reporting
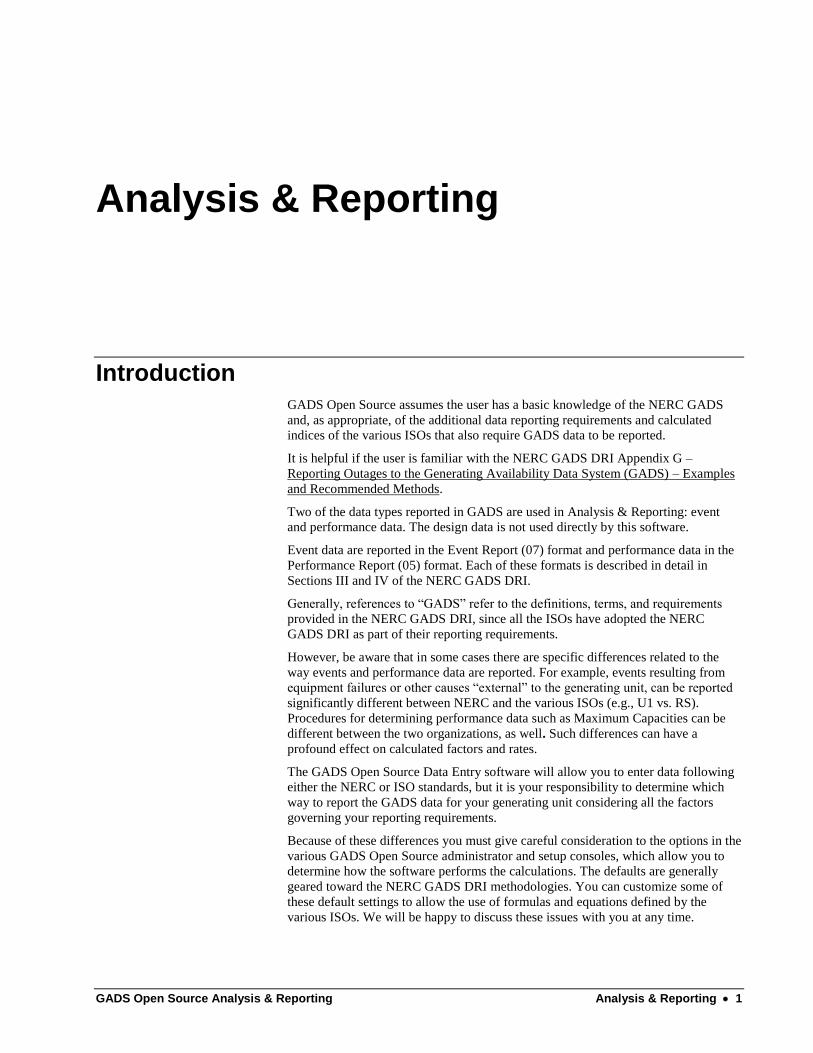
The snapshot process (Load Data | Load from Data Entry) transfers
only the event and performance records that have been changed or
added since the last snapshot was executed, eliminating the need to
transfer all historical data between the two sets of tables. This transfer
is done on the database server; the data is not transmitted over the
network to or from the machine invoking the snapshot.
Figure 1. Load Data Menu
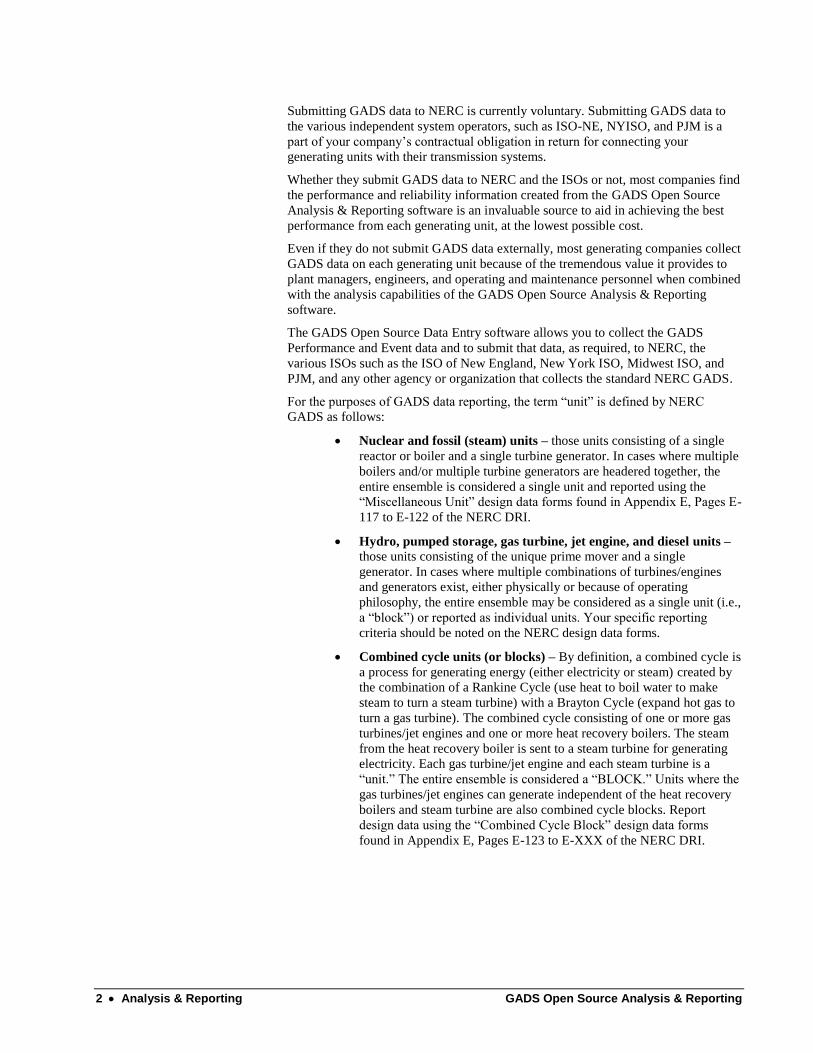
2. Perform Calculations.
Calculations (Create Data Tables | Perform Calculations) are
performed only for the units and years with changed or new
performance and/or event data.
For example, it is 2005. You are entering and revising GADS event and
performance records in GADS Open Source Data Entry for all the units
in your fleet. However, this month you also need to update a
performance or event record from 2002 for Dallas Unit No. 1.
In this example, when you Perform Calculations, the software
calculates 2004 for all units (in most cases) and 2002 for Dallas Unit
No. 1. By incorporating smart processing (Smart Proc™) into the
calculation engine, the historical years and units that are not revised are
not re-calculated; this is a tremendous timesaver.
Figure 2. Create Data Tables Menu
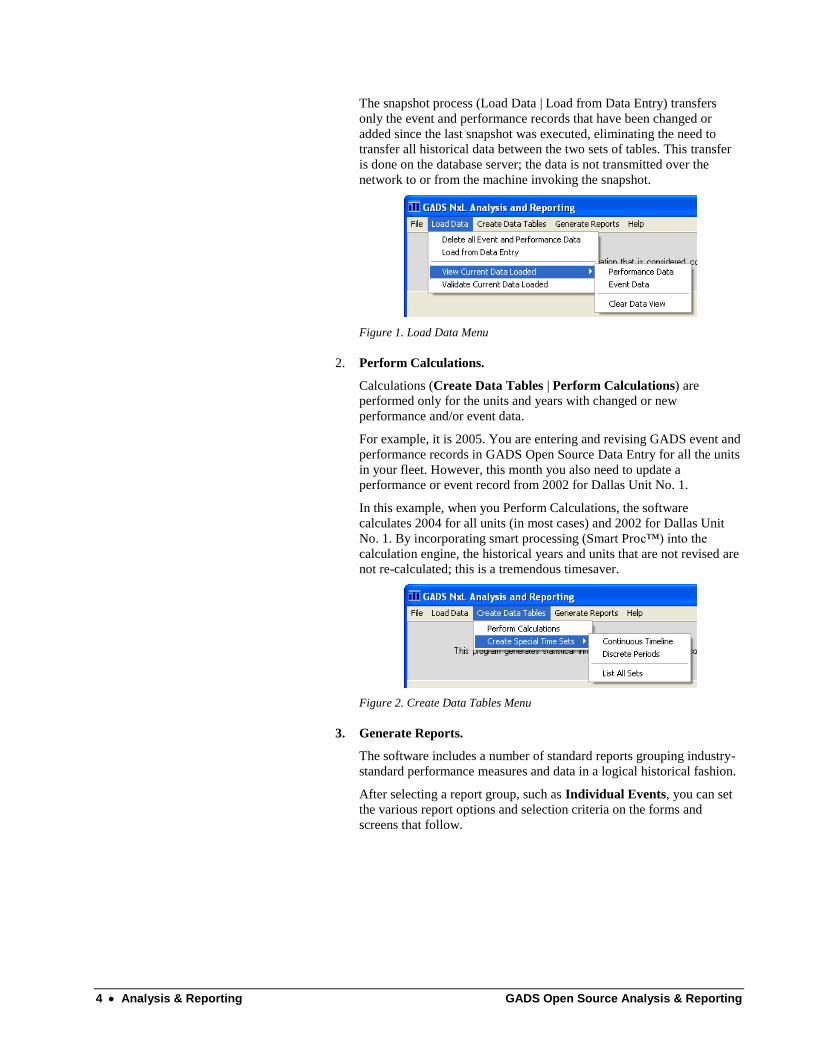
3. Generate Reports.
The software includes a number of standard reports grouping industry-
standard performance measures and data in a logical historical fashion.
After selecting a report group, such as Individual Events, you can set
the various report options and selection criteria on the forms and
screens that follow.
GADS Open Source Analysis & Reporting Analysis & Reporting 5
Figure 3. Generate Reports Menu
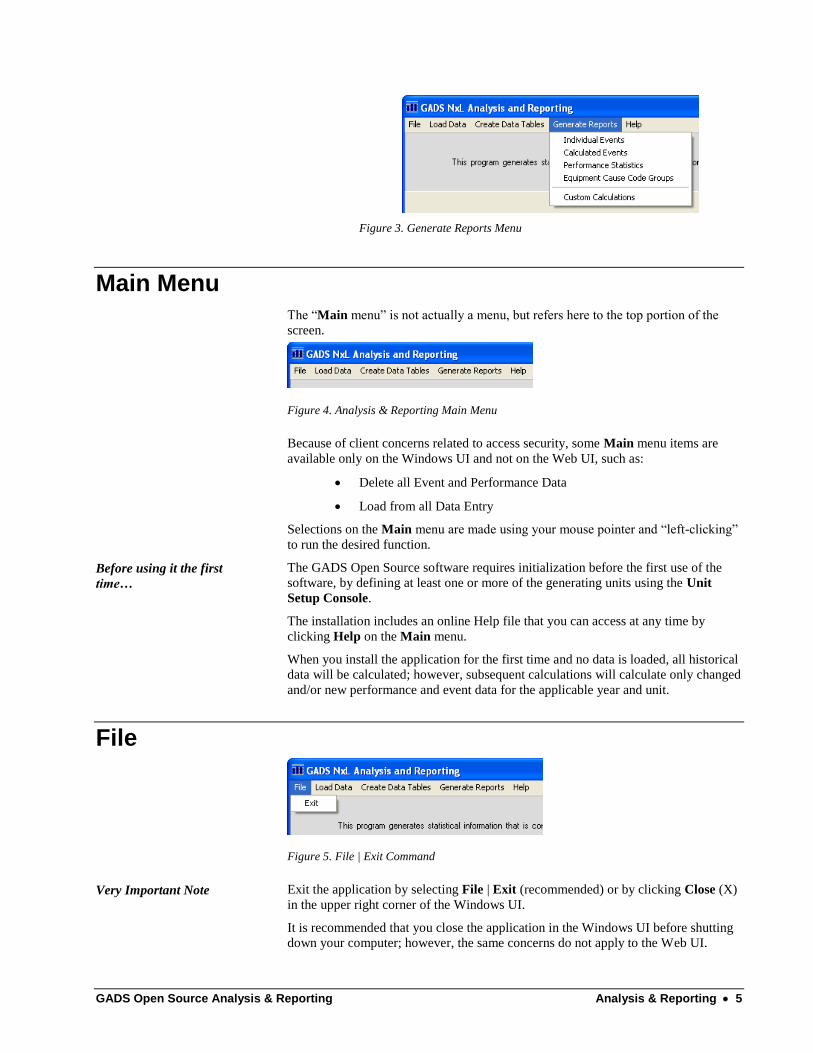
Main Menu
The ―Main menu‖ is not actually a menu, but refers here to the top portion of the
screen.
Figure 4. Analysis & Reporting Main Menu
Because of client concerns related to access security, some Main menu items are
available only on the Windows UI and not on the Web UI, such as:
Delete all Event and Performance Data
Load from all Data Entry
Selections on the Main menu are made using your mouse pointer and ―left-clicking‖
to run the desired function.
Before using it the first
time…
The GADS Open Source software requires initialization before the first use of the
software, by defining at least one or more of the generating units using the Unit
Setup Console.
The installation includes an online Help file that you can access at any time by
clicking Help on the Main menu.
When you install the application for the first time and no data is loaded, all historical
data will be calculated; however, subsequent calculations will calculate only changed
and/or new performance and event data for the applicable year and unit.
File
Figure 5. File | Exit Command
Very Important Note Exit the application by selecting File | Exit (recommended) or by clicking Close (X)
in the upper right corner of the Windows UI.
It is recommended that you close the application in the Windows UI before shutting
down your computer; however, the same concerns do not apply to the Web UI.

6 Analysis & Reporting GADS Open Source Analysis & Reporting
Load Data
Figure 6. Load Data Menu
Delete all Event and Performance Data
Very Important Note This command allows you to reset all Analysis & Reporting tables that are mirror-
images of the GADS Open Source Data Entry event and performance data tables.
This essentially forces the software to snapshot all of the data from the GADS Open
Source Data Entry data tables and to recalculate all the historical data. This is useful
if you need to ―start over‖ for any reason.
When you click Delete all Event and Performance Data, the following dialog box
appears asking if you wish to continue.
If you do not wish to delete all event and performance data, click No.
Figure 7. Delete Data Warning
If you click Yes, the GADS data will be deleted from the Analysis & Reporting
tables and will have to be reloaded for the program to have data to use in the
calculation process. This option is useful when it is necessary to start over; for
example, when it appears that the data in the Analysis & Reporting tables has been
corrupted.

GADS Open Source Analysis & Reporting Analysis & Reporting 7
Load from Data Entry
When you install the
application for the first
time and no data is loaded,
all historical data will be
loaded; however, all
subsequent loading will
copy only changed and/or
new performance and event
data for the applicable
year and unit.
Load from Data Entry snapshots the data from the GADS Open Source Data Entry
tables into the GADS Open Source Analysis & Reporting tables.
The snapshot process (Load Data | Load from Data Entry) transfers only the
GADS event and performance records that have been changed or added since the last
snapshot was executed, eliminating the need to transfer all historical data between
the two sets of tables. This transfer is done on the database server; the data is not
transmitted over the network to or from the machine invoking the snapshot.
When you click Load from Data Entry, the following dialog box appears asking if
you wish to continue.
If you do not wish to load the event and performance data, click No.
Figure 8. Load Data from Data Entry Dialog Box
If you click Yes, the screen in Figure 9 appears, allowing you to select which units to
include in the loading. If you select No, the snapshot process is cancelled and you are
returned to the main screen.
Figure 9. Unit Selection Dialog Box
8 Analysis & Reporting GADS Open Source Analysis & Reporting
All units determined by the GADS Open Source Data Entry software to be OK and
error-free are automatically checked. However, there may be a need to process units
that have revised data that has not yet had final validation run (MOD) or units that
have errors (ERR). While units with MOD and ERR status can be processed, it is up
to the user to determine whether the calculations can be successfully run or whether
the results will be meaningful.
Checked units‘ data will be loaded into Analysis & Reporting.
You can also set a ―cutoff‖ date for loading as well. For example, it is September 7th
and you are getting ready to calculate through August, since everyone‘s data is now
in, but several of the plant sites have started to enter September event data already.
By setting the month/year as shown in Figure 9, only event and performance records
up through and including August 2004 will be included in the snapshot, so
potentially invalid data will be screened out.
When you have selected the units and the month/year, click Continue, or click
Cancel to cancel the snapshot and return to the main screen.
The bottom left panel shows the last date/time when the data was snapshot from the
Data Entry tables (Data Last Loaded…).
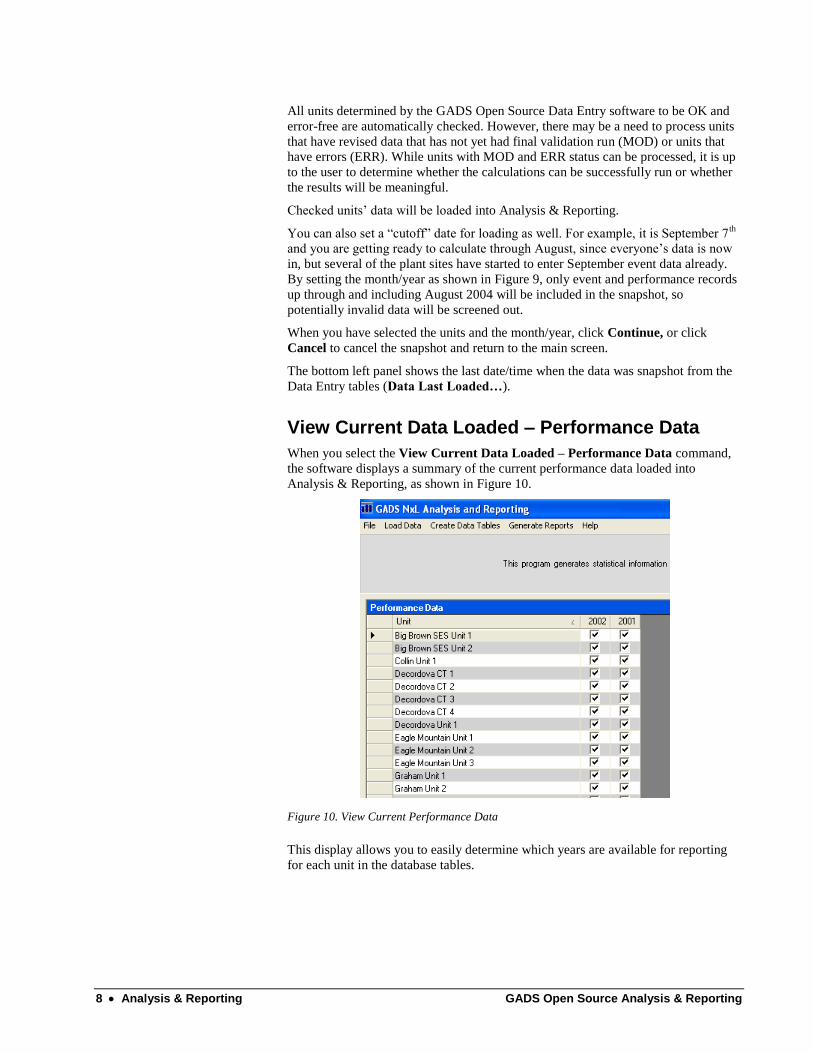
View Current Data Loaded – Performance Data
When you select the View Current Data Loaded – Performance Data command,
the software displays a summary of the current performance data loaded into
Analysis & Reporting, as shown in Figure 10.
Figure 10. View Current Performance Data
This display allows you to easily determine which years are available for reporting
for each unit in the database tables.

GADS Open Source Analysis & Reporting Analysis & Reporting 9
View Current Data Loaded – Event Data
When you select the View Current Data Loaded – Event Data command, the
software displays a summary of the current event data loaded into Analysis &
Reporting, as shown in Figure 11.
Figure 11. View Current Event Data
This display allows you to easily determine which years are available for reporting
for each unit in the database tables.
View Current Data Loaded – Clear Data View
The View Current Data Loaded – Clear Data View command restores the main
screen display, removing the Performance or Event summary.
Validate Current Data Loaded
The Validate Current Data Loaded command is reserved for future use. It is
shown in the production version to promote user suggestions and feedback. The
menu item is intended for situations where the user populates the database tables
from outside the GADS Open Source software, using other applications such as PI
Historian.
The normal assumption is that the user‘s application will validate the data before
loading it into the Data Entry-equivalent tables. However, if such data needed
validation prior to being calculated in Analysis & Reporting, this command would
run the data validation objects.
10 Analysis & Reporting GADS Open Source Analysis & Reporting
Create Data Tables
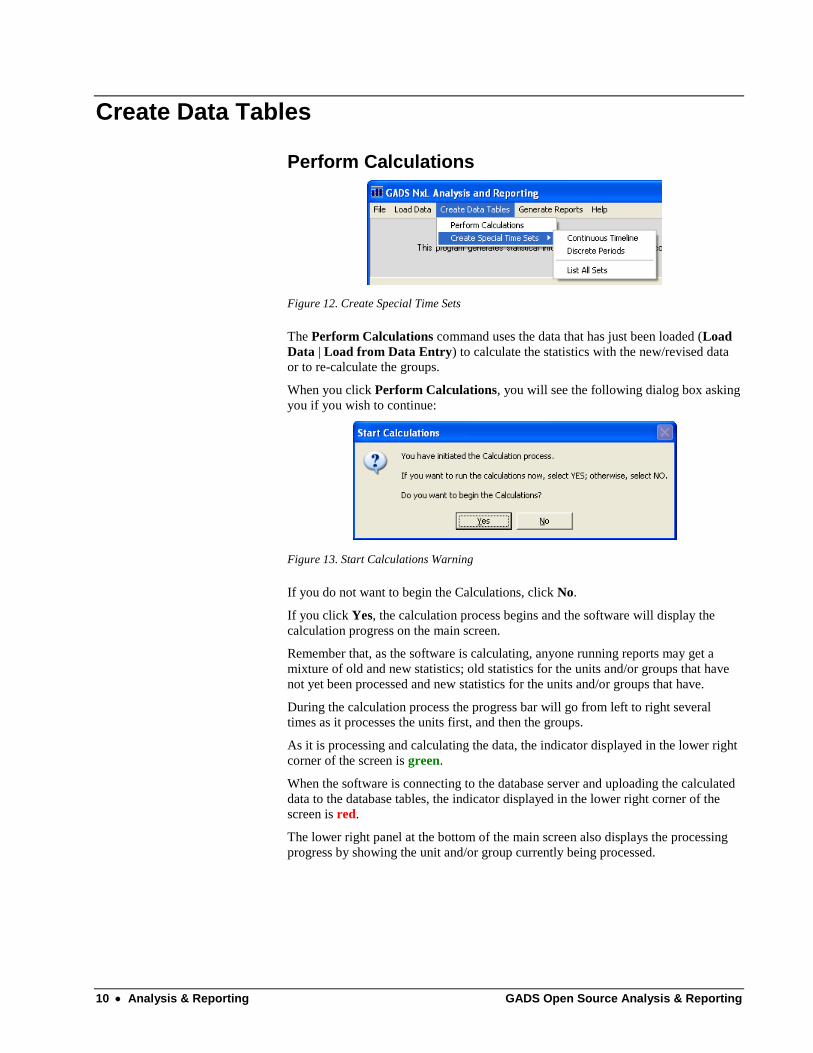
Perform Calculations
Figure 12. Create Special Time Sets
The Perform Calculations command uses the data that has just been loaded (Load
Data | Load from Data Entry) to calculate the statistics with the new/revised data
or to re-calculate the groups.
When you click Perform Calculations, you will see the following dialog box asking
you if you wish to continue:
Figure 13. Start Calculations Warning
If you do not want to begin the Calculations, click No.
If you click Yes, the calculation process begins and the software will display the
calculation progress on the main screen.
Remember that, as the software is calculating, anyone running reports may get a
mixture of old and new statistics; old statistics for the units and/or groups that have
not yet been processed and new statistics for the units and/or groups that have.
During the calculation process the progress bar will go from left to right several
times as it processes the units first, and then the groups.
As it is processing and calculating the data, the indicator displayed in the lower right
corner of the screen is green.
When the software is connecting to the database server and uploading the calculated
data to the database tables, the indicator displayed in the lower right corner of the
screen is red.
The lower right panel at the bottom of the main screen also displays the processing
progress by showing the unit and/or group currently being processed.

GADS Open Source Analysis & Reporting Analysis & Reporting 11
Once it starts, we do not recommend stopping the processing by closing the main
screen or shutting down your machine. Other than the one-time processing of all
historical data for all units, the normal month-to-month processing should only
calculate the current year‘s data for all units.
Very Important Note If the unit data has not changed, but you have changed the groups to which units are
assigned, the calculations can be re-run at any time, since only the groups will be
recalculated. This process is very fast, since most of the calculation time is spent
calculating the unit event and performance data, not in rolling the unit data into the
group statistics. The group statistics are recalculated for all groups for all periods and
granularities whenever the calculations are run.
When the calculations are complete, the center portion of the panel at the bottom of
the main screen will show the date and time that the calculations were last performed
(Calculations Last Performed on…).
Create Special Time Sets
Create Special Time Sets allows you to break the time period of interest into any
subperiods of interest. There are two ways of segmenting the total time frame so that
you can have the maximum flexibility in defining the subperiods:
Continuous Timeline – breaks the total time period into contiguous
(back-to-back without any gaps) subperiods (e.g., seasons of the year).
There is no limit to the number or ―fineness‖ of the granularity of each
subperiod (the smallest subperiod that can be defined is one minute).
Discrete Periods – breaks the total time period into discrete subperiod
blocks that can (and generally do) have gaps between the subperiods
(e.g., peak periods of the day, month, or year).
Continuous Timeline
The continuous timeline is broken into various back-to-back segments of time. The
length of each time segment can be the same as, or different from, the other time
segments. All time segments are calculated.
Event data prior to the first date/time entered will not be included in the results
tables; therefore, you must enter a timeline beginning date/time as the first date/time
in the list.
The continuous timeline is useful in a number of ways. For example, suppose you
want to compare the summer peaking season, the fall overhaul season, the winter
peaking season, and the spring overhaul season reliability for the last 5 years. The
break points define the boundary date/time between each season. The first break
point entered will be the date/time beginning the first season of interest.
The date/time values entered for this example do not have to match the normal
seasons and do not have to break at traditional boundaries, such as the end of the
month or at midnight.

12 Analysis & Reporting GADS Open Source Analysis & Reporting
You can have an unlimited number of pre-defined period sets. These sets are stored
in a table in the database. Each unit can have its own continuous timeline period set
identified in the Unit Setup Console.
When the calculations are run, each unit will have statistics calculated for each
defined subperiod.
Figure 14. Continuous Timeline
To create a new timeline, type the name for the timeline in the text box under Enter
Name for Timeline and click New. Enter the break points in the grid on the right.
In the example shown at the top of the form, you would enter the following break
points:
7/3/2004 06:18
7/3/2004 11:53
7/3/2004 13:43
7/3/2004 17:22
8/13/2004 11:14
9/11/2004 09:06
GADS Open Source Analysis & Reporting Analysis & Reporting 13
The calculations would proceed as follows:
1. All hours before 07/03/2004 at 06:18 would not be included in the
results tables. 07/03/2004 at 06:18 is the beginning of the timeline set.
2. Hours after 09/11/2004 at 09:06 would be calculated through the end of
the current reporting month (if the calculations were run on November
5, 2004, the hours would reflect the entire period 09/11/2004 at 09:06
through October 31, 2004 at 23:59:59, since October is assumed to be
the end of the current reporting month).
3. The results tables would show the hours and statistics for each of the
six periods listed above (the last period being 09/11/2004 at 09:06 to
the end of the current reporting month) for the units assigned to this
timeline period set.
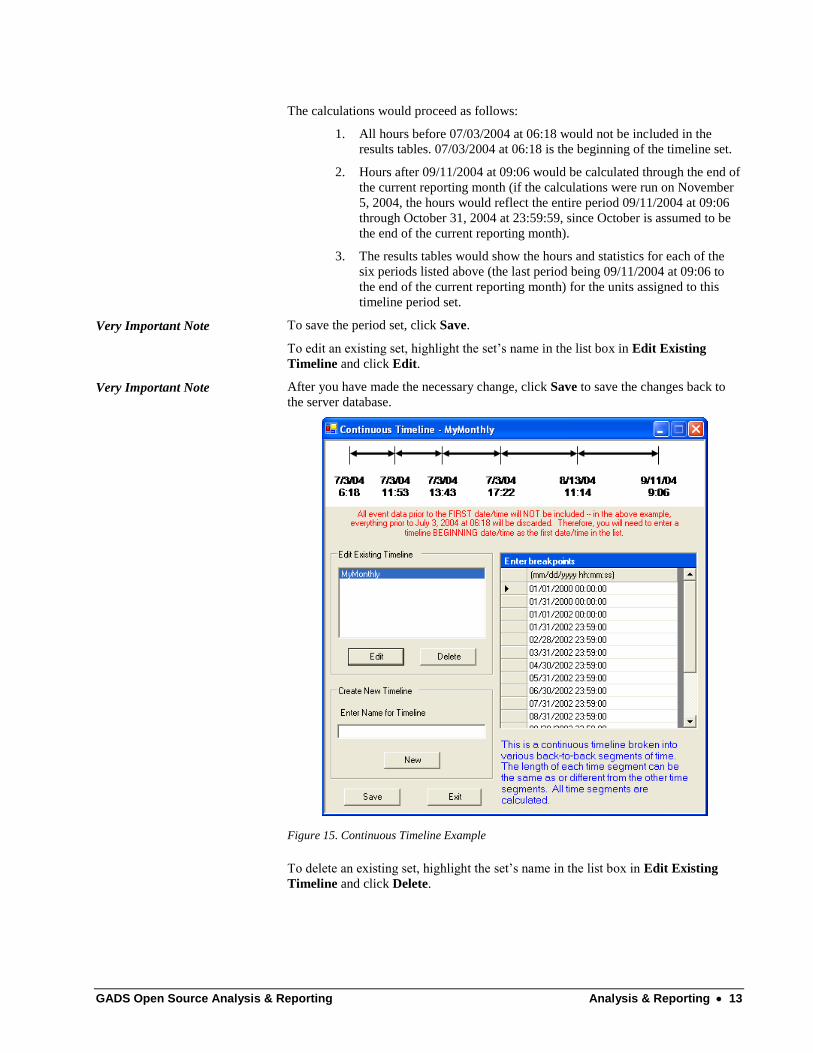
Very Important Note To save the period set, click Save.
To edit an existing set, highlight the set‘s name in the list box in Edit Existing
Timeline and click Edit.
Very Important Note After you have made the necessary change, click Save to save the changes back to
the server database.
Figure 15. Continuous Timeline Example
To delete an existing set, highlight the set‘s name in the list box in Edit Existing
Timeline and click Delete.
14 Analysis & Reporting GADS Open Source Analysis & Reporting
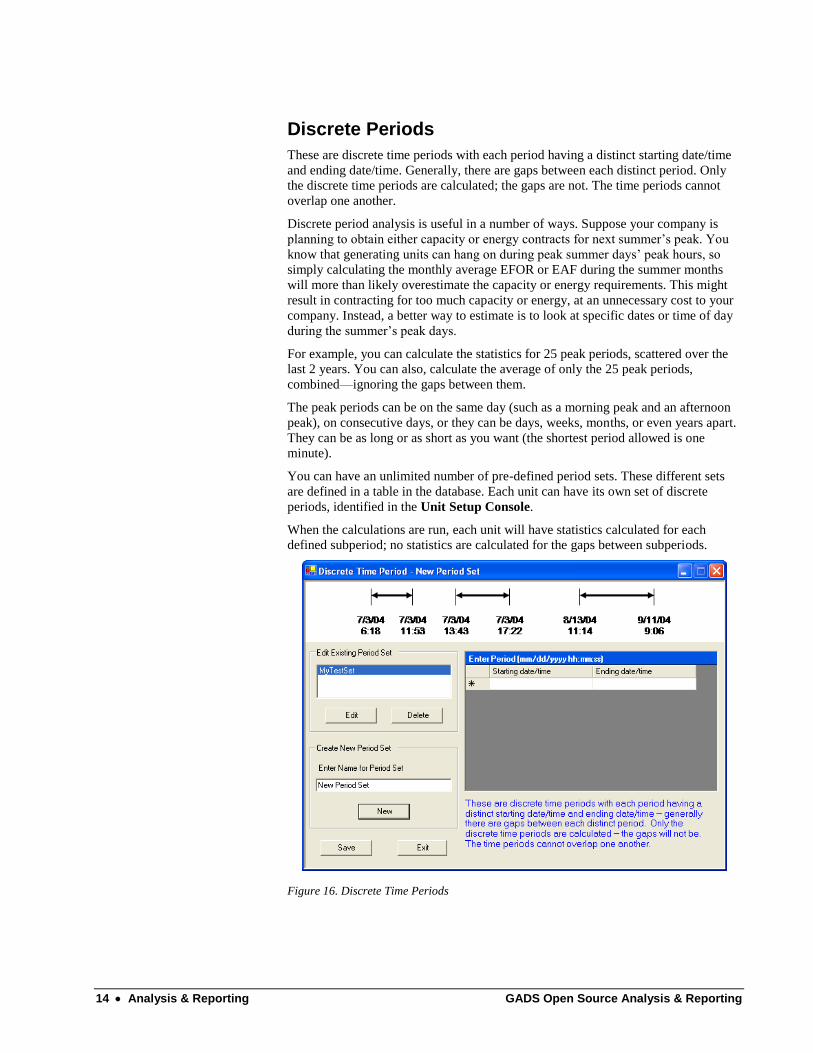
Discrete Periods
These are discrete time periods with each period having a distinct starting date/time
and ending date/time. Generally, there are gaps between each distinct period. Only
the discrete time periods are calculated; the gaps are not. The time periods cannot
overlap one another.
Discrete period analysis is useful in a number of ways. Suppose your company is
planning to obtain either capacity or energy contracts for next summer‘s peak. You
know that generating units can hang on during peak summer days‘ peak hours, so
simply calculating the monthly average EFOR or EAF during the summer months
will more than likely overestimate the capacity or energy requirements. This might
result in contracting for too much capacity or energy, at an unnecessary cost to your
company. Instead, a better way to estimate is to look at specific dates or time of day
during the summer‘s peak days.
For example, you can calculate the statistics for 25 peak periods, scattered over the
last 2 years. You can also, calculate the average of only the 25 peak periods,
combined—ignoring the gaps between them.
The peak periods can be on the same day (such as a morning peak and an afternoon
peak), on consecutive days, or they can be days, weeks, months, or even years apart.
They can be as long or as short as you want (the shortest period allowed is one
minute).
You can have an unlimited number of pre-defined period sets. These different sets
are defined in a table in the database. Each unit can have its own set of discrete
periods, identified in the Unit Setup Console.
When the calculations are run, each unit will have statistics calculated for each
defined subperiod; no statistics are calculated for the gaps between subperiods.
Figure 16. Discrete Time Periods
GADS Open Source Analysis & Reporting Analysis & Reporting 15
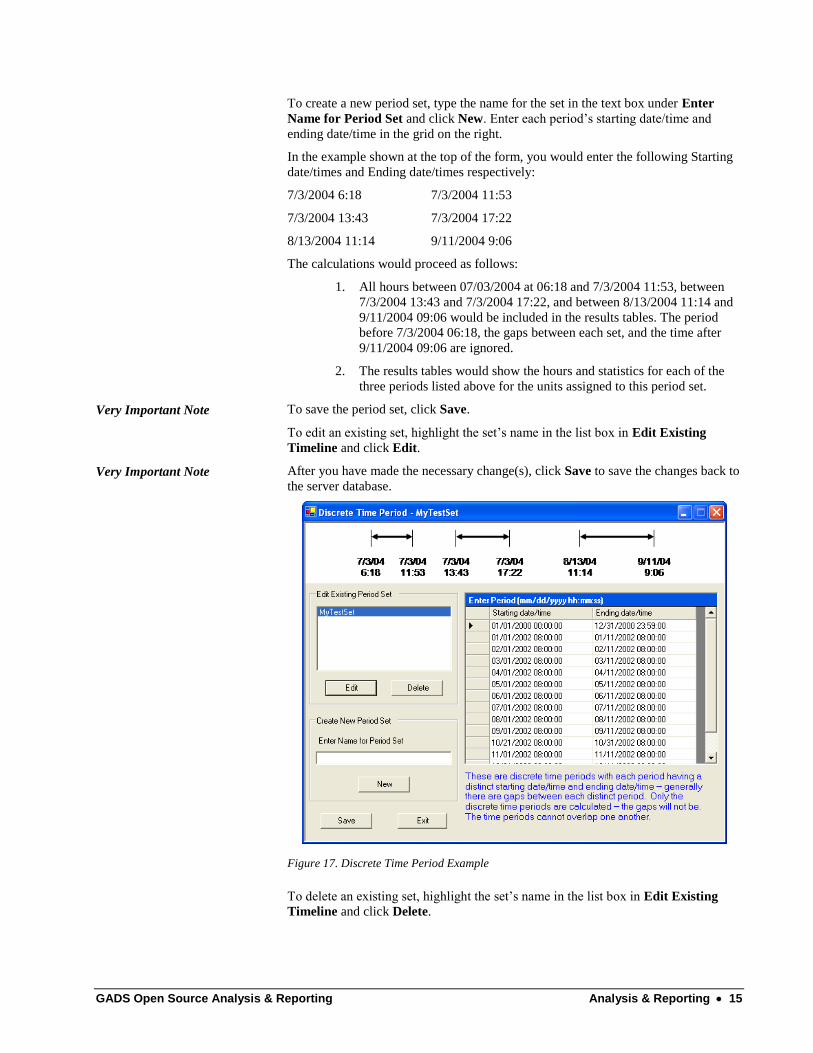
To create a new period set, type the name for the set in the text box under Enter
Name for Period Set and click New. Enter each period‘s starting date/time and
ending date/time in the grid on the right.
In the example shown at the top of the form, you would enter the following Starting
date/times and Ending date/times respectively:
7/3/2004 6:18 7/3/2004 11:53
7/3/2004 13:43 7/3/2004 17:22
8/13/2004 11:14 9/11/2004 9:06
The calculations would proceed as follows:
1. All hours between 07/03/2004 at 06:18 and 7/3/2004 11:53, between
7/3/2004 13:43 and 7/3/2004 17:22, and between 8/13/2004 11:14 and
9/11/2004 09:06 would be included in the results tables. The period
before 7/3/2004 06:18, the gaps between each set, and the time after
9/11/2004 09:06 are ignored.
2. The results tables would show the hours and statistics for each of the
three periods listed above for the units assigned to this period set.
Very Important Note To save the period set, click Save.
To edit an existing set, highlight the set‘s name in the list box in Edit Existing
Timeline and click Edit.
Very Important Note After you have made the necessary change(s), click Save to save the changes back to
the server database.
Figure 17. Discrete Time Period Example
To delete an existing set, highlight the set‘s name in the list box in Edit Existing
Timeline and click Delete.

16 Analysis & Reporting GADS Open Source Analysis & Reporting
List All Sets
The List All Sets command displays a two-part form listing the period set name and
break points for the continuous timeline and the starting and ending date/times for
the discrete period sets. Refresh reloads the display from the master database table.
Figure 18. List All Sets
Generate Reports
The standard reports included with GADS Open Source Analysis & Reporting
provide listings of similar data in traditional and historical groupings. The standard
reports have been designed based on suggested analysis needs from historical NERC
GATE and GADS reports; on layouts and designs in the 1980s from NERC and
industry COBOL mainframe reports; and on traditional listings of similar factors,
rates, and data found throughout the industry.
Because Analysis & Reporting stores the calculated results in industry-standard
databases, it is easy to create customized reports. This user manual includes the table
structures as well as a data dictionary identifying the fields and the data that can be
used to create any custom reports you choose.
All reports are generated with Crystal Reports (CR) and are displayed in the CR
report viewer. Therefore, they all share the common controls described below:

GADS Open Source Analysis & Reporting Analysis & Reporting 17
Crystal Reports Report Viewer
Figure 19. CR Control Menu
From left to right, the controls are:
First page (disabled on first page)
Previous page (disabled on first page)
Next page
Last Page
Goto Page (enter a page number to go to)
Close Current View
Print Report
Refresh
Export – allows you to export the report into Adobe Acrobat (.PDF),
Microsoft Excel (.xls), Microsoft Word (.doc) and Rich Text Format
(.rtf) files, as shown in Figure 20.
Figure 20. Export Report File Formats
Zoom (increases/decreases the report display within the report viewer)
Search Text (enter text and the report viewer will find it in the report)
18 Analysis & Reporting GADS Open Source Analysis & Reporting
Important Calculation Notes
In other GADS analysis systems, you may be required to re-calculate the entire
historical data set each time you want to change, for example, from monthly to
annual reports.
Very Important Note During the GADS Open Source Analysis & Reporting setup process, you can select
which granularities (such as monthly, yearly, ,etc.) are calculated each time the
calculations are run. These granularities become a part of the standard calculation
process and are stored in the database tables. As a result, reports are very fast;
changing from monthly to annual reports and back again is simply a matter of
extracting data that is already calculated and stored in the tables.
Select Reports
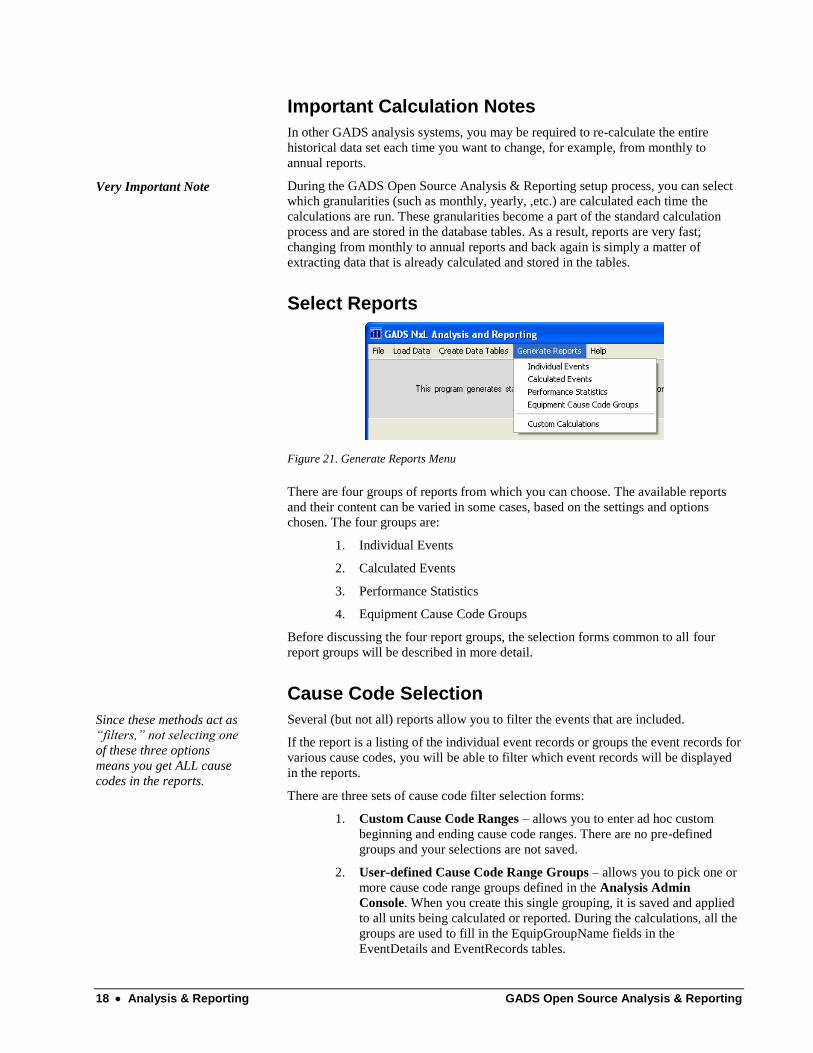
Figure 21. Generate Reports Menu
There are four groups of reports from which you can choose. The available reports
and their content can be varied in some cases, based on the settings and options
chosen. The four groups are:
1. Individual Events
2. Calculated Events
3. Performance Statistics
4. Equipment Cause Code Groups
Before discussing the four report groups, the selection forms common to all four
report groups will be described in more detail.
Cause Code Selection
Since these methods act as
“filters,” not selecting one
of these three options
means you get ALL cause
codes in the reports.
Several (but not all) reports allow you to filter the events that are included.
If the report is a listing of the individual event records or groups the event records for
various cause codes, you will be able to filter which event records will be displayed
in the reports.
There are three sets of cause code filter selection forms:
1. Custom Cause Code Ranges – allows you to enter ad hoc custom
beginning and ending cause code ranges. There are no pre-defined
groups and your selections are not saved.
2. User-defined Cause Code Range Groups – allows you to pick one or
more cause code range groups defined in the Analysis Admin
Console. When you create this single grouping, it is saved and applied
to all units being calculated or reported. During the calculations, all the
groups are used to fill in the EquipGroupName fields in the
EventDetails and EventRecords tables.
GADS Open Source Analysis & Reporting Analysis & Reporting 19
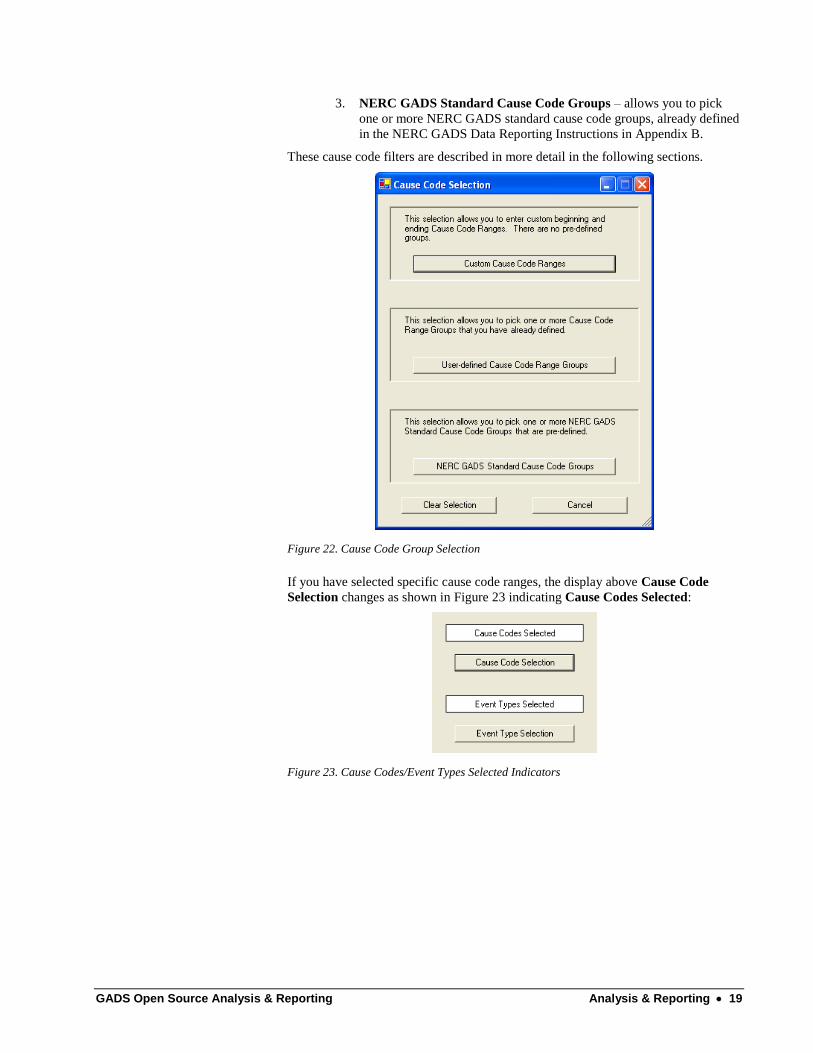
3. NERC GADS Standard Cause Code Groups – allows you to pick
one or more NERC GADS standard cause code groups, already defined
in the NERC GADS Data Reporting Instructions in Appendix B.
These cause code filters are described in more detail in the following sections.
Figure 22. Cause Code Group Selection
If you have selected specific cause code ranges, the display above Cause Code
Selection changes as shown in Figure 23 indicating Cause Codes Selected:
Figure 23. Cause Codes/Event Types Selected Indicators
20 Analysis & Reporting GADS Open Source Analysis & Reporting
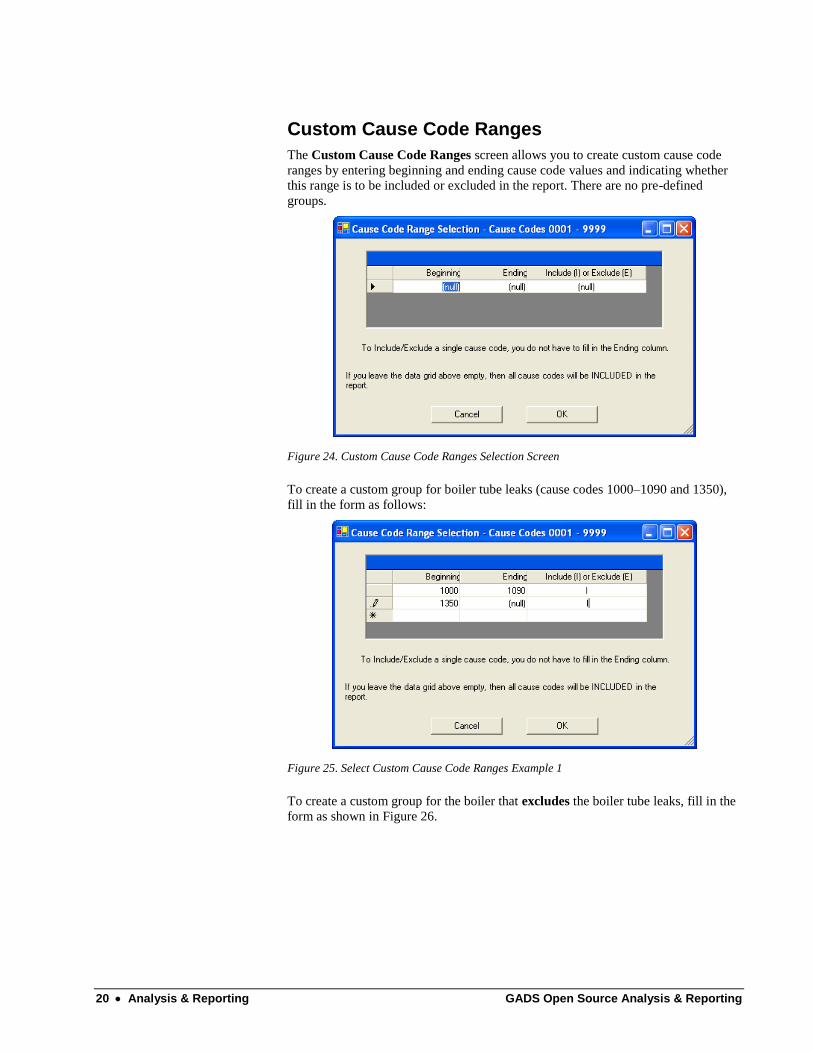
Custom Cause Code Ranges
The Custom Cause Code Ranges screen allows you to create custom cause code
ranges by entering beginning and ending cause code values and indicating whether
this range is to be included or excluded in the report. There are no pre-defined
groups.
Figure 24. Custom Cause Code Ranges Selection Screen
To create a custom group for boiler tube leaks (cause codes 1000–1090 and 1350),
fill in the form as follows:
Figure 25. Select Custom Cause Code Ranges Example 1
To create a custom group for the boiler that excludes the boiler tube leaks, fill in the
form as shown in Figure 26.
GADS Open Source Analysis & Reporting Analysis & Reporting 21
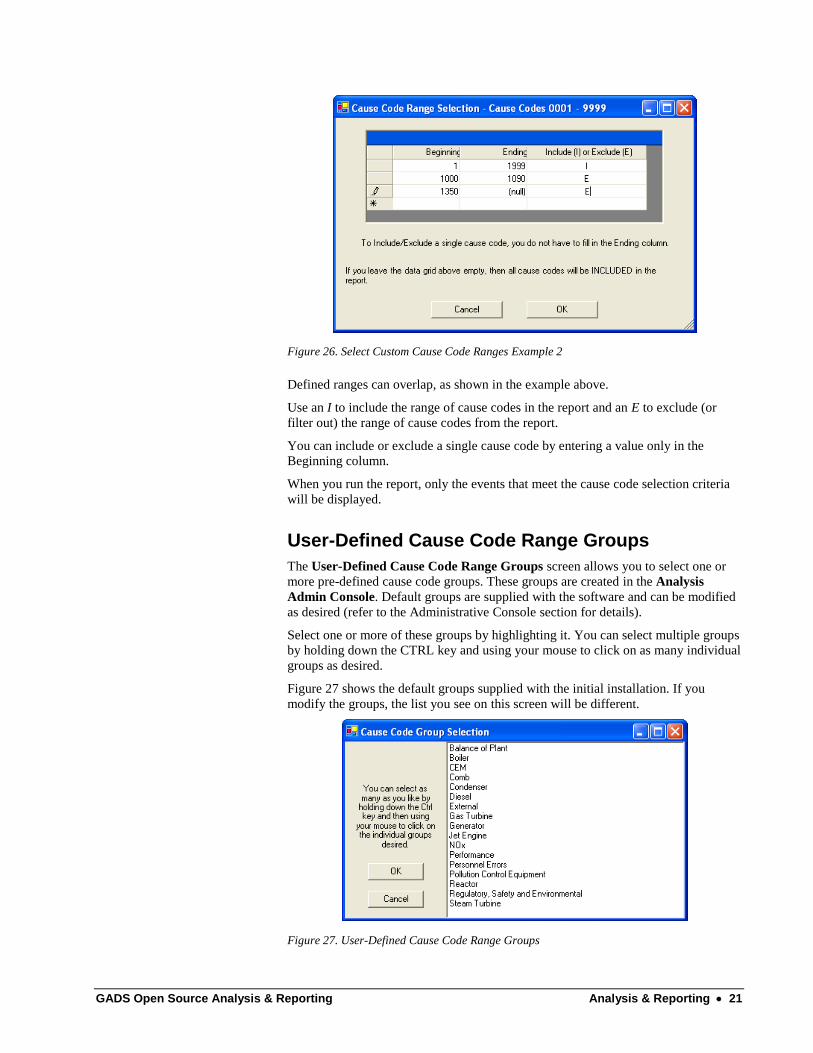
Figure 26. Select Custom Cause Code Ranges Example 2
Defined ranges can overlap, as shown in the example above.
Use an I to include the range of cause codes in the report and an E to exclude (or
filter out) the range of cause codes from the report.
You can include or exclude a single cause code by entering a value only in the
Beginning column.
When you run the report, only the events that meet the cause code selection criteria
will be displayed.
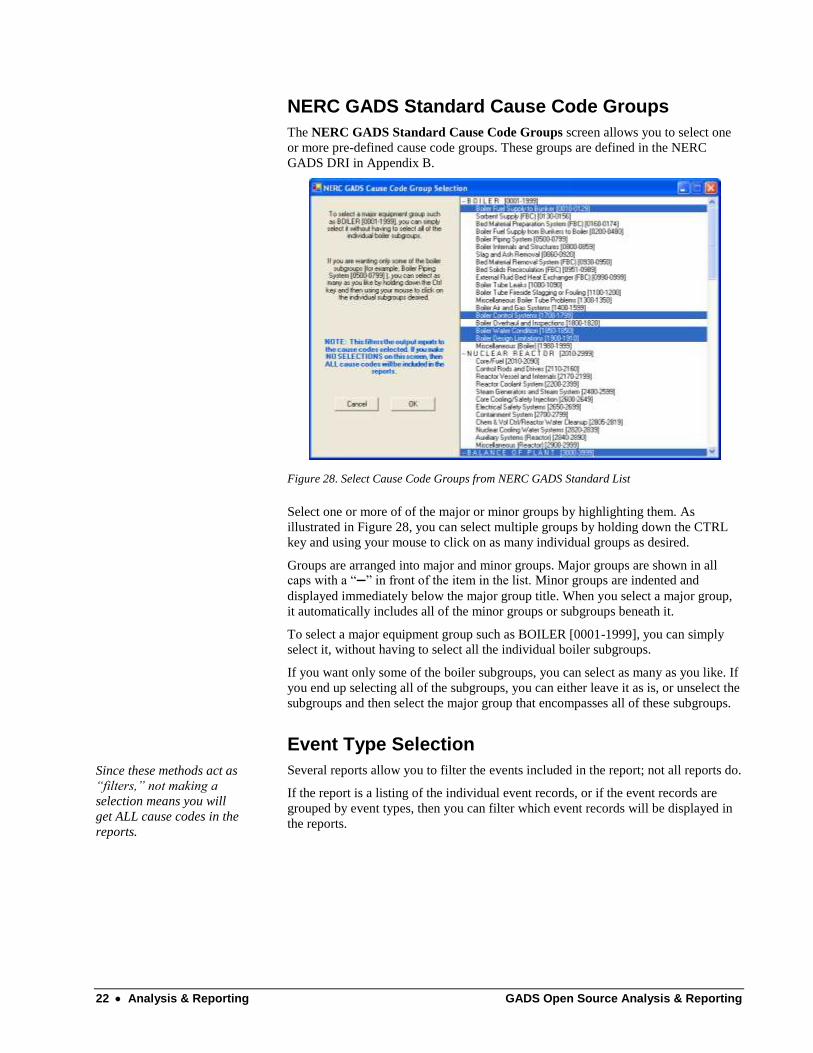
User-Defined Cause Code Range Groups
The User-Defined Cause Code Range Groups screen allows you to select one or
more pre-defined cause code groups. These groups are created in the Analysis
Admin Console. Default groups are supplied with the software and can be modified
as desired (refer to the Administrative Console section for details).
Select one or more of these groups by highlighting it. You can select multiple groups
by holding down the CTRL key and using your mouse to click on as many individual
groups as desired.
Figure 27 shows the default groups supplied with the initial installation. If you
modify the groups, the list you see on this screen will be different.
Figure 27. User-Defined Cause Code Range Groups
22 Analysis & Reporting GADS Open Source Analysis & Reporting
NERC GADS Standard Cause Code Groups
The NERC GADS Standard Cause Code Groups screen allows you to select one
or more pre-defined cause code groups. These groups are defined in the NERC
GADS DRI in Appendix B.
Figure 28. Select Cause Code Groups from NERC GADS Standard List
Select one or more of of the major or minor groups by highlighting them. As
illustrated in Figure 28, you can select multiple groups by holding down the CTRL
key and using your mouse to click on as many individual groups as desired.
Groups are arranged into major and minor groups. Major groups are shown in all caps with a ―—‖ in front of the item in the list. Minor groups are indented and
displayed immediately below the major group title. When you select a major group,
it automatically includes all of the minor groups or subgroups beneath it.
To select a major equipment group such as BOILER [0001-1999], you can simply
select it, without having to select all the individual boiler subgroups.
If you want only some of the boiler subgroups, you can select as many as you like. If
you end up selecting all of the subgroups, you can either leave it as is, or unselect the
subgroups and then select the major group that encompasses all of these subgroups.
Event Type Selection
Since these methods act as
“filters,” not making a
selection means you will
get ALL cause codes in the
reports.
Several reports allow you to filter the events included in the report; not all reports do.
If the report is a listing of the individual event records, or if the event records are
grouped by event types, then you can filter which event records will be displayed in
the reports.
GADS Open Source Analysis & Reporting Analysis & Reporting 23
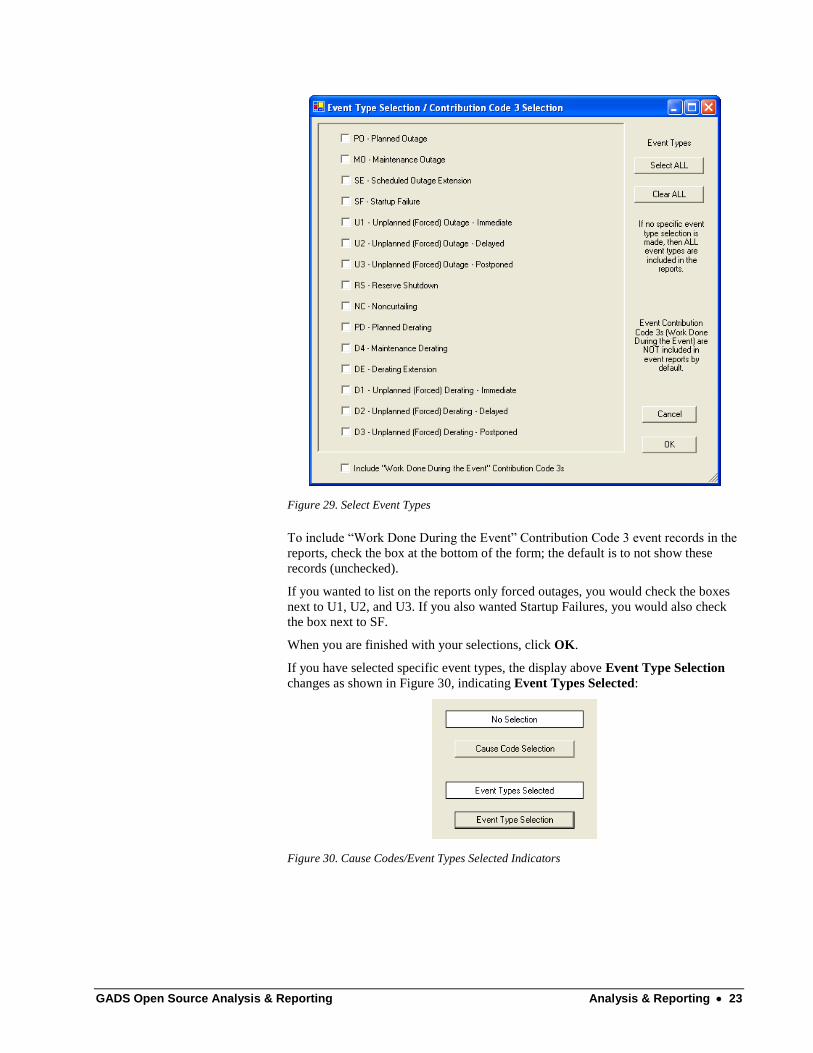
Figure 29. Select Event Types
To include ―Work Done During the Event‖ Contribution Code 3 event records in the
reports, check the box at the bottom of the form; the default is to not show these
records (unchecked).
If you wanted to list on the reports only forced outages, you would check the boxes
next to U1, U2, and U3. If you also wanted Startup Failures, you would also check
the box next to SF.
When you are finished with your selections, click OK.
If you have selected specific event types, the display above Event Type Selection
changes as shown in Figure 30, indicating Event Types Selected:
Figure 30. Cause Codes/Event Types Selected Indicators
24 Analysis & Reporting GADS Open Source Analysis & Reporting
Individual Events
For event-related reports, the equivalent hours shown in the reports are for the entire
duration of the event.
You can screen or filter the events included in the report based on the event‘s span
relative to the Reporting Window, defined by the two date/time boxes shown
graphically at the beginning and end of the Reporting Window.
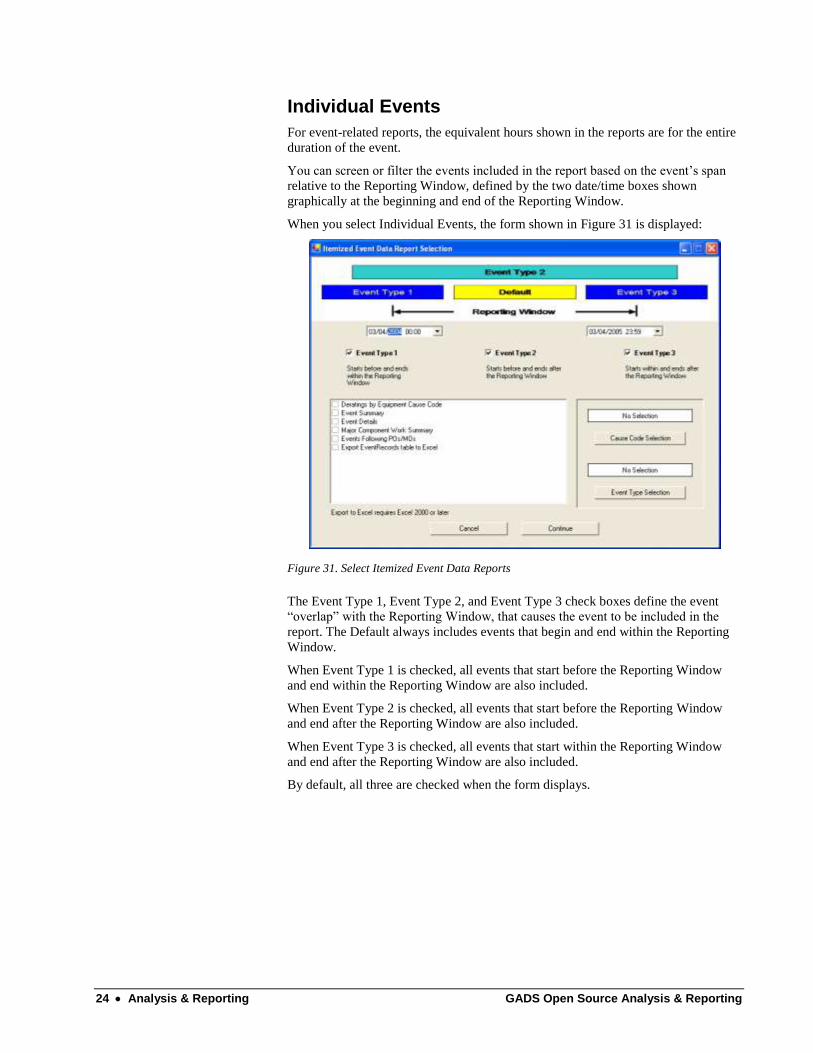
When you select Individual Events, the form shown in Figure 31 is displayed:
Figure 31. Select Itemized Event Data Reports
The Event Type 1, Event Type 2, and Event Type 3 check boxes define the event
―overlap‖ with the Reporting Window, that causes the event to be included in the
report. The Default always includes events that begin and end within the Reporting
Window.
When Event Type 1 is checked, all events that start before the Reporting Window
and end within the Reporting Window are also included.
When Event Type 2 is checked, all events that start before the Reporting Window
and end after the Reporting Window are also included.
When Event Type 3 is checked, all events that start within the Reporting Window
and end after the Reporting Window are also included.
By default, all three are checked when the form displays.
GADS Open Source Analysis & Reporting Analysis & Reporting 25
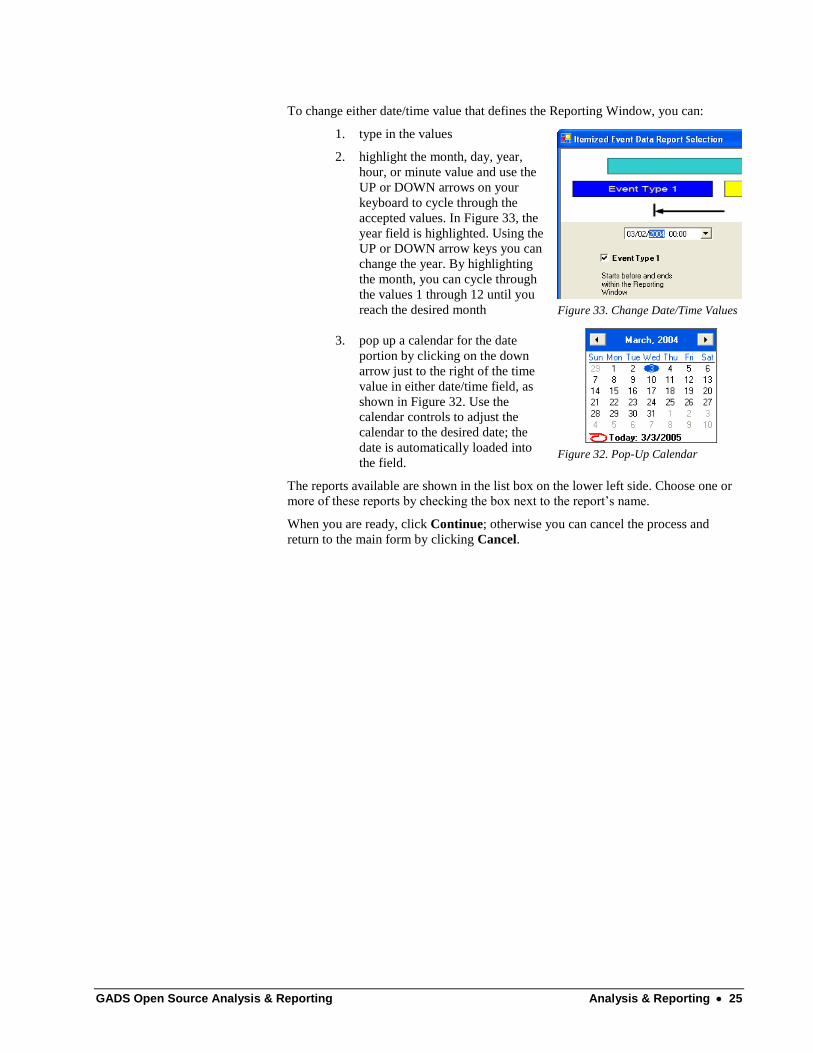
To change either date/time value that defines the Reporting Window, you can:
1. type in the values
2. highlight the month, day, year,
hour, or minute value and use the
UP or DOWN arrows on your
keyboard to cycle through the
accepted values. In Figure 33, the
year field is highlighted. Using the
UP or DOWN arrow keys you can
change the year. By highlighting
the month, you can cycle through
the values 1 through 12 until you
reach the desired month
3. pop up a calendar for the date
portion by clicking on the down
arrow just to the right of the time
value in either date/time field, as
shown in Figure 32. Use the
calendar controls to adjust the
calendar to the desired date; the
date is automatically loaded into
the field.
The reports available are shown in the list box on the lower left side. Choose one or
more of these reports by checking the box next to the report‘s name.
When you are ready, click Continue; otherwise you can cancel the process and
return to the main form by clicking Cancel.
Figure 32. Pop-Up Calendar
Figure 33. Change Date/Time Values

26 Analysis & Reporting GADS Open Source Analysis & Reporting
Individual Events – Deratings by Equipment Cause Code
This report allows you to determine the causes for unit deratings. All derating event
types and cause codes will be listed unless specific types and codes have been
selected.
The Total Event Duration (clock hours) and the Equivalent Derated Hours are for the
entire event.
Figure 34. Individual Events – Deratings by Equipment Cause Code
This report includes:
Cause code
Unit short name
Event number
Event type
Gross available capacity
Net available capacity
Start of event date/time
End of event date/time
Total event duration in hours
Equivalent derated hours
GADS Open Source Analysis & Reporting Analysis & Reporting 27
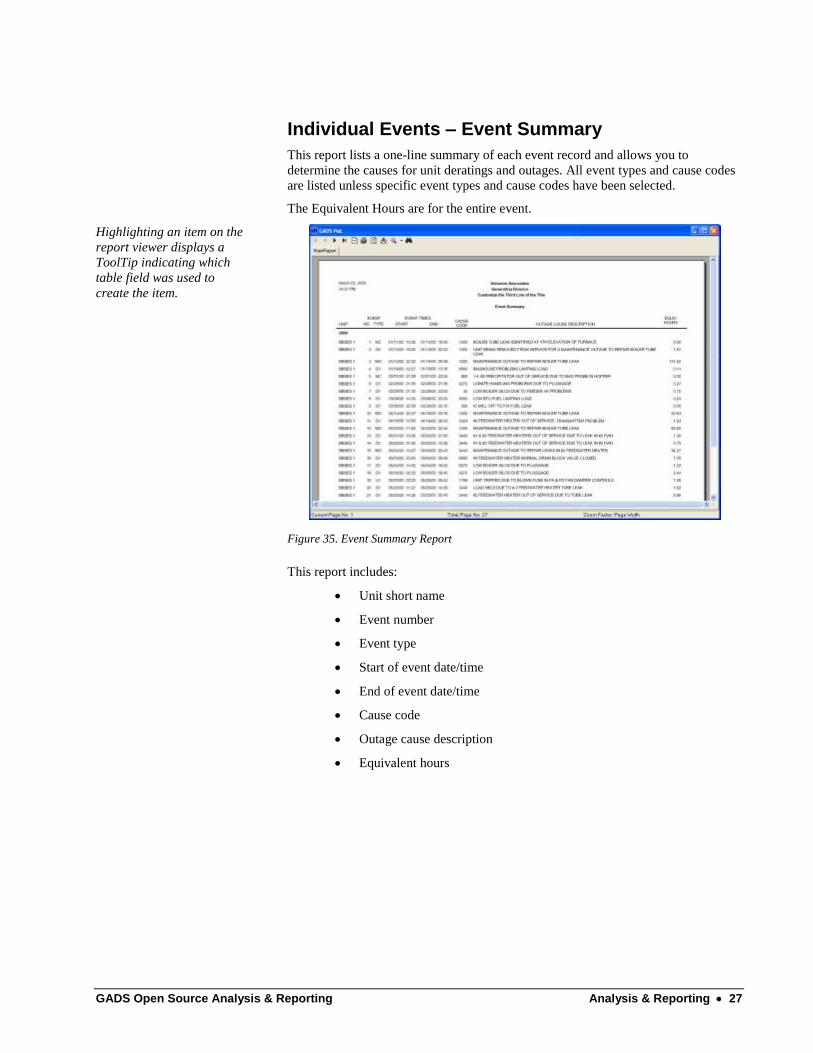
Individual Events – Event Summary
This report lists a one-line summary of each event record and allows you to
determine the causes for unit deratings and outages. All event types and cause codes
are listed unless specific event types and cause codes have been selected.
The Equivalent Hours are for the entire event.
Highlighting an item on the
report viewer displays a
ToolTip indicating which
table field was used to
create the item.
Figure 35. Event Summary Report
This report includes:
Unit short name
Event number
Event type
Start of event date/time
End of event date/time
Cause code
Outage cause description
Equivalent hours
28 Analysis & Reporting GADS Open Source Analysis & Reporting
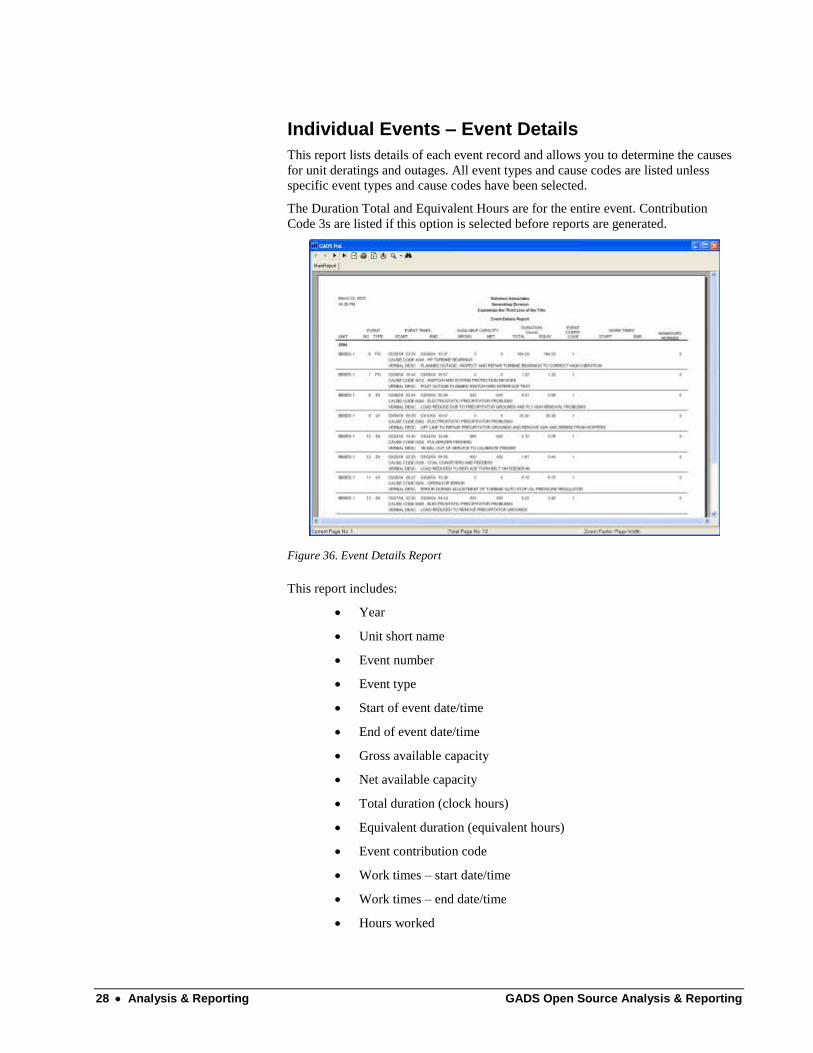
Individual Events – Event Details
This report lists details of each event record and allows you to determine the causes
for unit deratings and outages. All event types and cause codes are listed unless
specific event types and cause codes have been selected.
The Duration Total and Equivalent Hours are for the entire event. Contribution
Code 3s are listed if this option is selected before reports are generated.
Figure 36. Event Details Report
This report includes:
Year
Unit short name
Event number
Event type
Start of event date/time
End of event date/time
Gross available capacity
Net available capacity
Total duration (clock hours)
Equivalent duration (equivalent hours)
Event contribution code
Work times – start date/time
Work times – end date/time
Hours worked
GADS Open Source Analysis & Reporting Analysis & Reporting 29
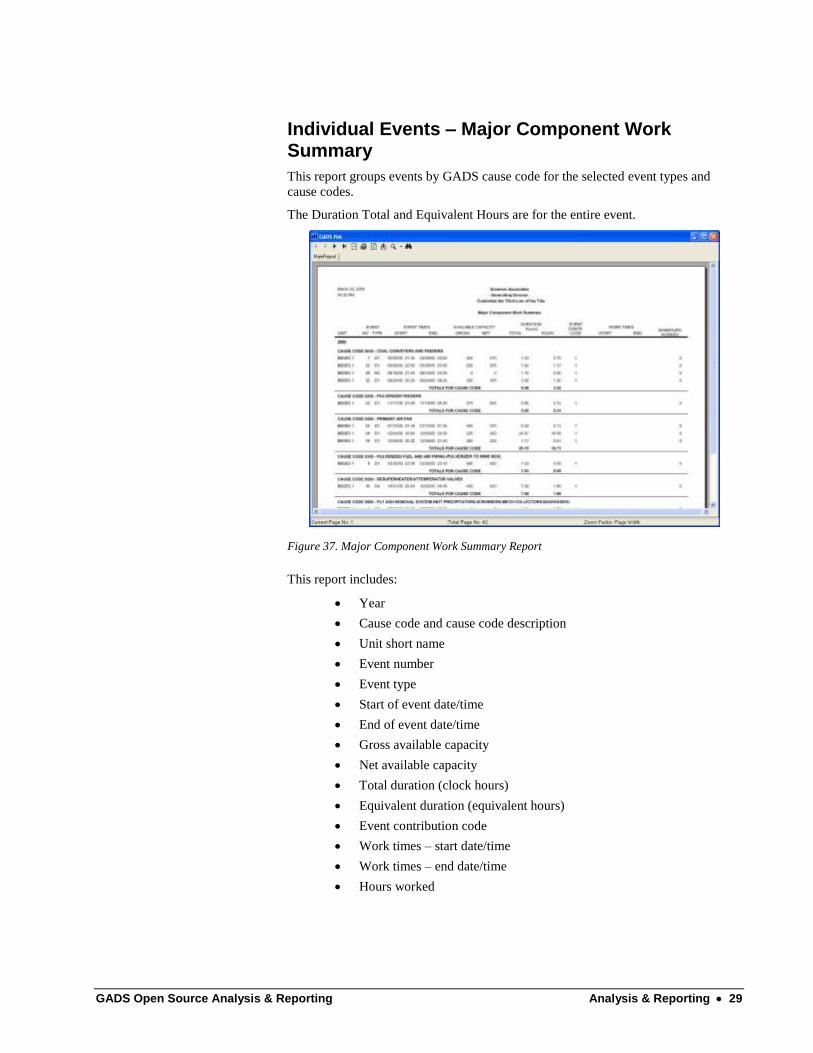
Individual Events – Major Component Work Summary
This report groups events by GADS cause code for the selected event types and
cause codes.
The Duration Total and Equivalent Hours are for the entire event.
Figure 37. Major Component Work Summary Report
This report includes:
Year
Cause code and cause code description
Unit short name
Event number
Event type
Start of event date/time
End of event date/time
Gross available capacity
Net available capacity
Total duration (clock hours)
Equivalent duration (equivalent hours)
Event contribution code
Work times – start date/time
Work times – end date/time
Hours worked
30 Analysis & Reporting GADS Open Source Analysis & Reporting
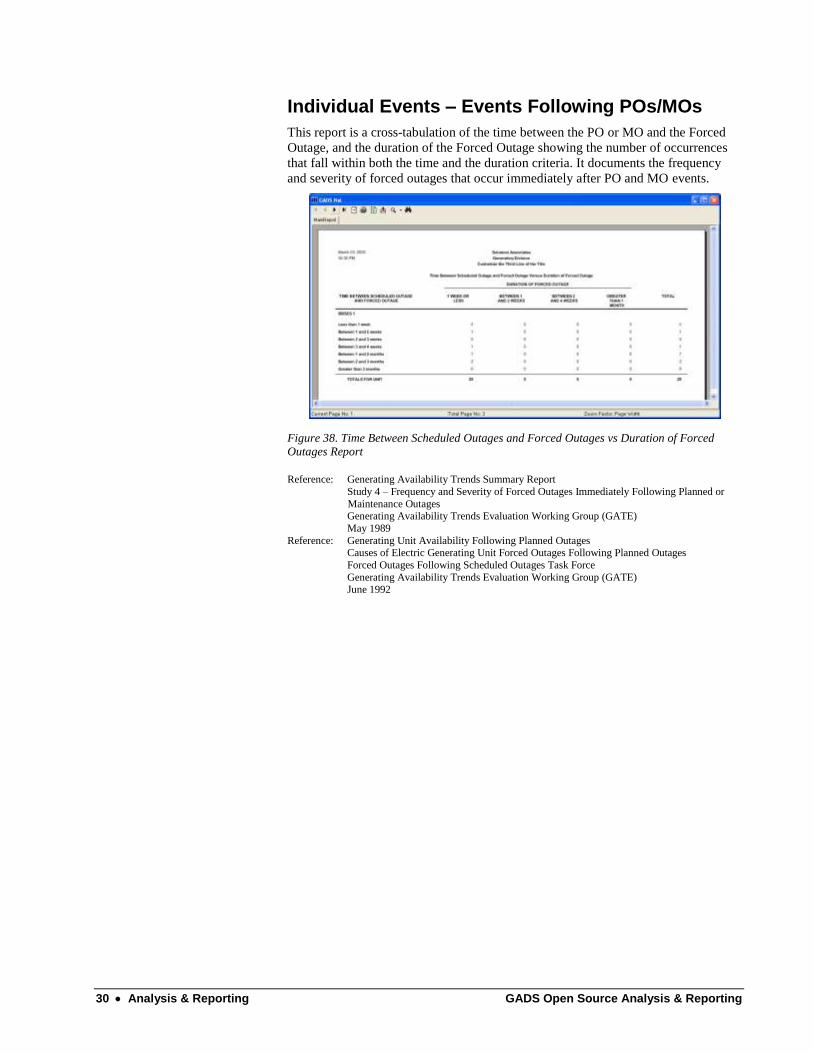
Individual Events – Events Following POs/MOs
This report is a cross-tabulation of the time between the PO or MO and the Forced
Outage, and the duration of the Forced Outage showing the number of occurrences
that fall within both the time and the duration criteria. It documents the frequency
and severity of forced outages that occur immediately after PO and MO events.
Figure 38. Time Between Scheduled Outages and Forced Outages vs Duration of Forced Outages Report
Reference: Generating Availability Trends Summary Report
Study 4 – Frequency and Severity of Forced Outages Immediately Following Planned or
Maintenance Outages Generating Availability Trends Evaluation Working Group (GATE)
May 1989
Reference: Generating Unit Availability Following Planned Outages Causes of Electric Generating Unit Forced Outages Following Planned Outages
Forced Outages Following Scheduled Outages Task Force
Generating Availability Trends Evaluation Working Group (GATE) June 1992

GADS Open Source Analysis & Reporting Analysis & Reporting 31
Calculated Events
These reports include the various granularities calculated during the standard
production processing. The form in Figure 39 shows only Monthly, Yearly (Annual),
and Peak Periods enabled. These are the only granularities calculated during the
standard production processing.
If you wish to add the Quarterly granularity to the reports, you must use the Analysis
Admin Console to add Quarterly to the appropriate group(s). When the calculations
are re-run, Quarterly will be listed as available for reports.
Calculating stores the calculated results for all selected granularities in the database
tables; therefore, running reports is simply a matter of extracting the previously
calculated statistics and data from the database tables. This saves time when running
reports for monthly departmental reporting, which typically requires a mix of
monthly, yearly, and peak period reports.
Figure 39. Select Calculated Event Report

32 Analysis & Reporting GADS Open Source Analysis & Reporting
Calculated Events – Deratings by Equipment Cause Code
This report allows you to determine the causes for unit deratings. All derating event
types and cause codes will be listed unless specific types and codes have been
selected.
The Total Event Duration (clock hours) and the Equivalent Derated Hours are for the
defined period range only.
Figure 40. Deratings by Equipment Cause Code Report
This report includes:
Cause code
Unit short name
Event number
Event type
End of event date/time
PJM IO Code
Percent derating
Total event duration in hours
Equivalent derated hours
Equivalent derated MWh

GADS Open Source Analysis & Reporting Analysis & Reporting 33
Calculated Events – Event Summary
This report lists a one-line summary of each event record and allows you to
determine the causes for unit deratings and outages. All event types and cause codes
are listed unless specific types and codes have been selected.
The Equivalent Hours are for the defined period range only.
Figure 41. Events Summary Report
This report includes:
Year
Unit short name
Event Number
Event Type
End of event date/time
Cause code description (NERC GADS)
Equivalent derated hours (for full outages this is also the clock hours)
34 Analysis & Reporting GADS Open Source Analysis & Reporting
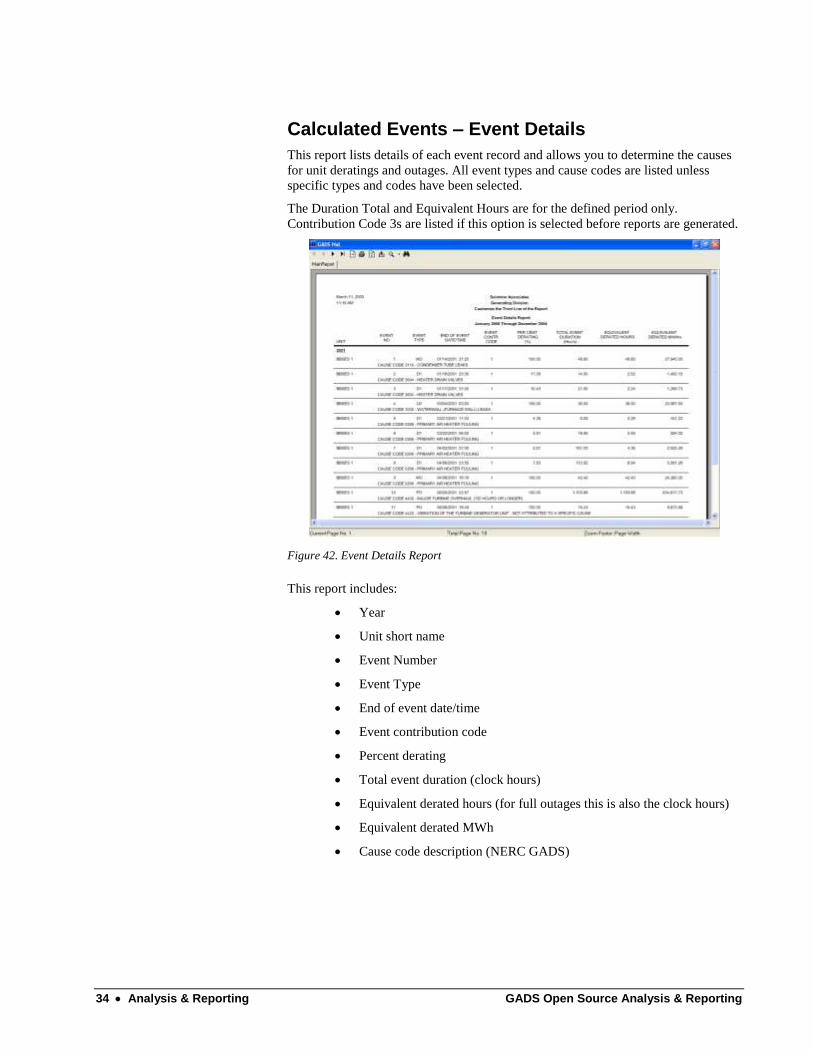
Calculated Events – Event Details
This report lists details of each event record and allows you to determine the causes
for unit deratings and outages. All event types and cause codes are listed unless
specific types and codes have been selected.
The Duration Total and Equivalent Hours are for the defined period only.
Contribution Code 3s are listed if this option is selected before reports are generated.
Figure 42. Event Details Report
This report includes:
Year
Unit short name
Event Number
Event Type
End of event date/time
Event contribution code
Percent derating
Total event duration (clock hours)
Equivalent derated hours (for full outages this is also the clock hours)
Equivalent derated MWh
Cause code description (NERC GADS)

GADS Open Source Analysis & Reporting Analysis & Reporting 35
Calculated Events – Major Component Work Summary
This report groups events by GADS cause code for the selected event types and
cause codes.
The Duration Total and Equivalent Hours are for the defined period only.
Figure 43. Major Component Work Summary Report
This report includes:
Year
Cause code and cause code description
Unit short name
Event number
Event type
Start of event date/time
End of event date/time
Gross available capacity
Net available capacity
Total duration (clock hours)
Equivalent duration (equivalent hours)
Event contribution code
Work times – start date/time
Work times – end date/time
Hours worked
36 Analysis & Reporting GADS Open Source Analysis & Reporting
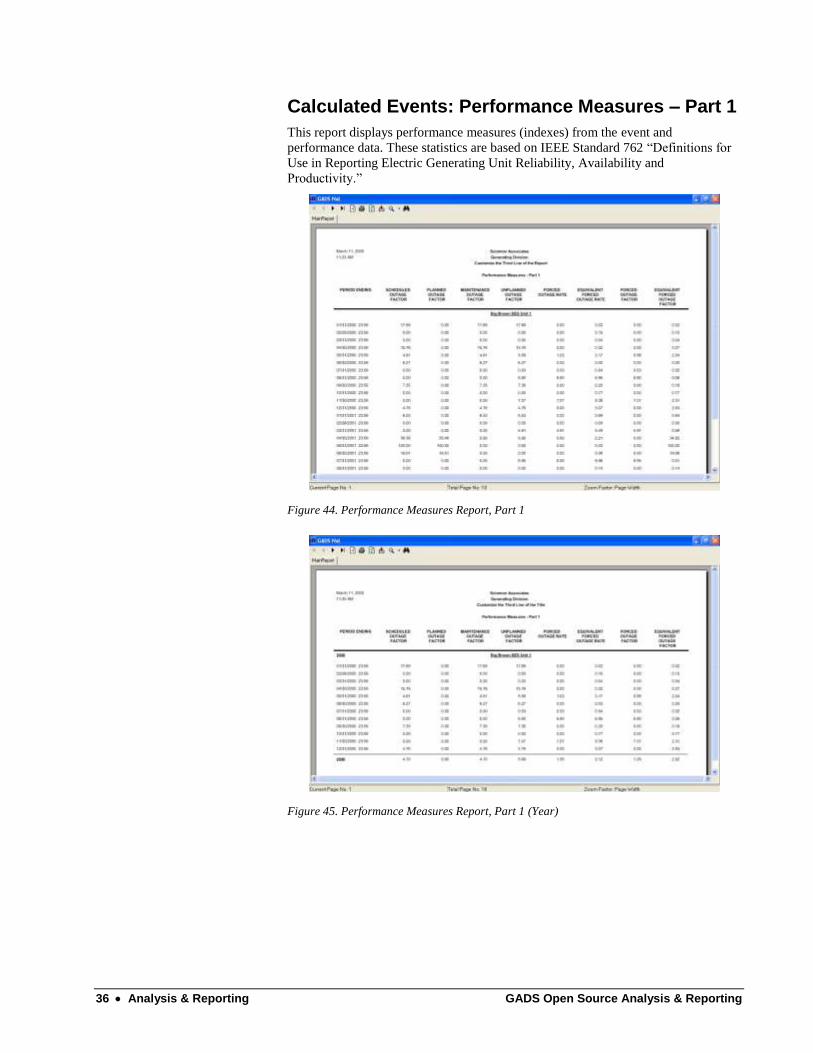
Calculated Events: Performance Measures – Part 1
This report displays performance measures (indexes) from the event and
performance data. These statistics are based on IEEE Standard 762 ―Definitions for
Use in Reporting Electric Generating Unit Reliability, Availability and
Productivity.‖
Figure 44. Performance Measures Report, Part 1
Figure 45. Performance Measures Report, Part 1 (Year)
GADS Open Source Analysis & Reporting Analysis & Reporting 37
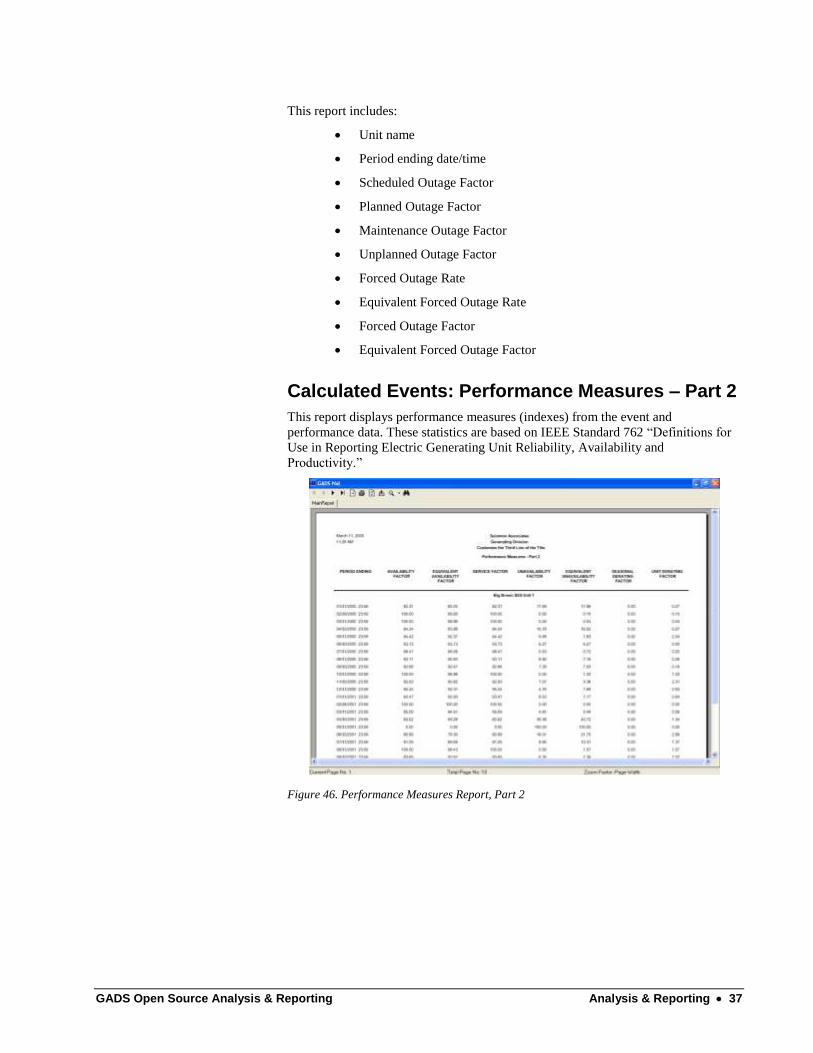
This report includes:
Unit name
Period ending date/time
Scheduled Outage Factor
Planned Outage Factor
Maintenance Outage Factor
Unplanned Outage Factor
Forced Outage Rate
Equivalent Forced Outage Rate
Forced Outage Factor
Equivalent Forced Outage Factor
Calculated Events: Performance Measures – Part 2
This report displays performance measures (indexes) from the event and
performance data. These statistics are based on IEEE Standard 762 ―Definitions for
Use in Reporting Electric Generating Unit Reliability, Availability and
Productivity.‖
Figure 46. Performance Measures Report, Part 2

38 Analysis & Reporting GADS Open Source Analysis & Reporting
Figure 47. Performance Measures Report, Part 2 (Year)
This report includes:
Unit name
Period ending date/time
Availability Factor
Equivalent Availability Factor
Service Factor
Unavailability Factor
Equivalent Unavailability Factor
Seasonal Derating Factor
Unit Derating Factor
GADS Open Source Analysis & Reporting Analysis & Reporting 39
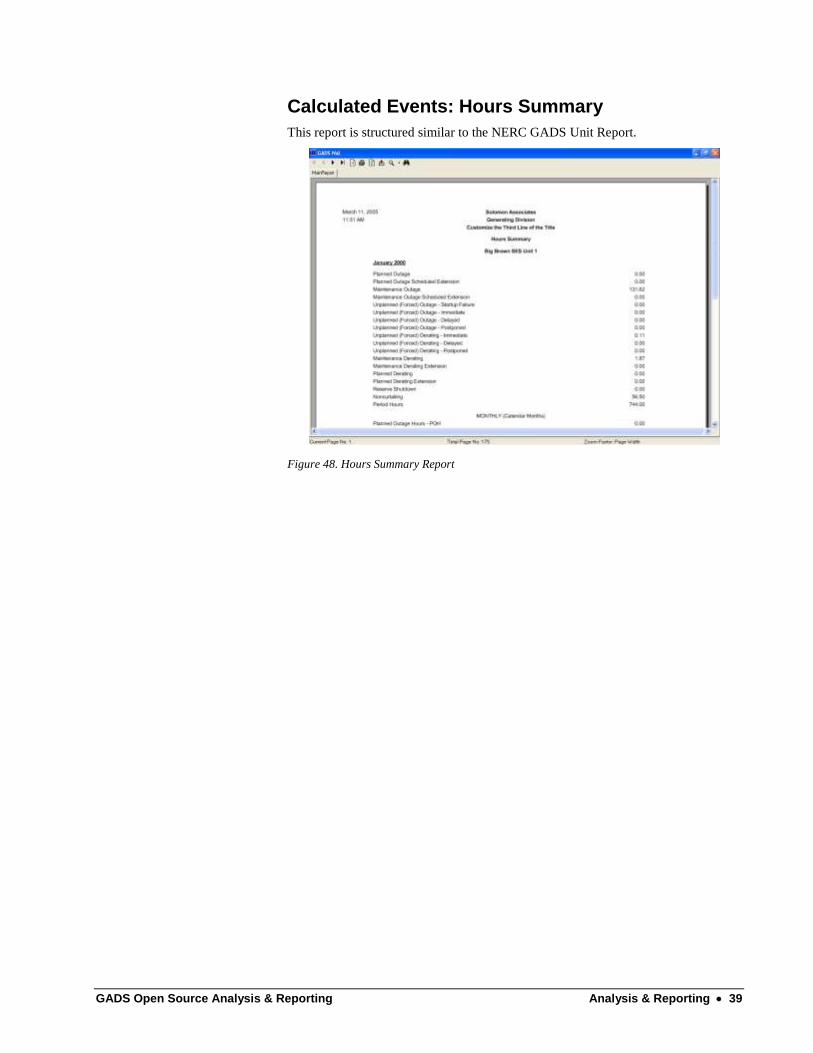
Calculated Events: Hours Summary
This report is structured similar to the NERC GADS Unit Report.
Figure 48. Hours Summary Report

40 Analysis & Reporting GADS Open Source Analysis & Reporting
Calculated Events: Cause Code Impact
This report summarizes the impact each cause code has had on the unit.
Figure 49. Cause Code Impact Report
This report includes:
Unit name
Cause code and description
Number of events (both full outages and deratings)
Percent of lost availability based on equivalent hours
Equivalent hours (for full outages, equivalent hours are equal to clock
hours)
Percent of lost availability based on lost MWh
Lost MWh
GADS Open Source Analysis & Reporting Analysis & Reporting 41
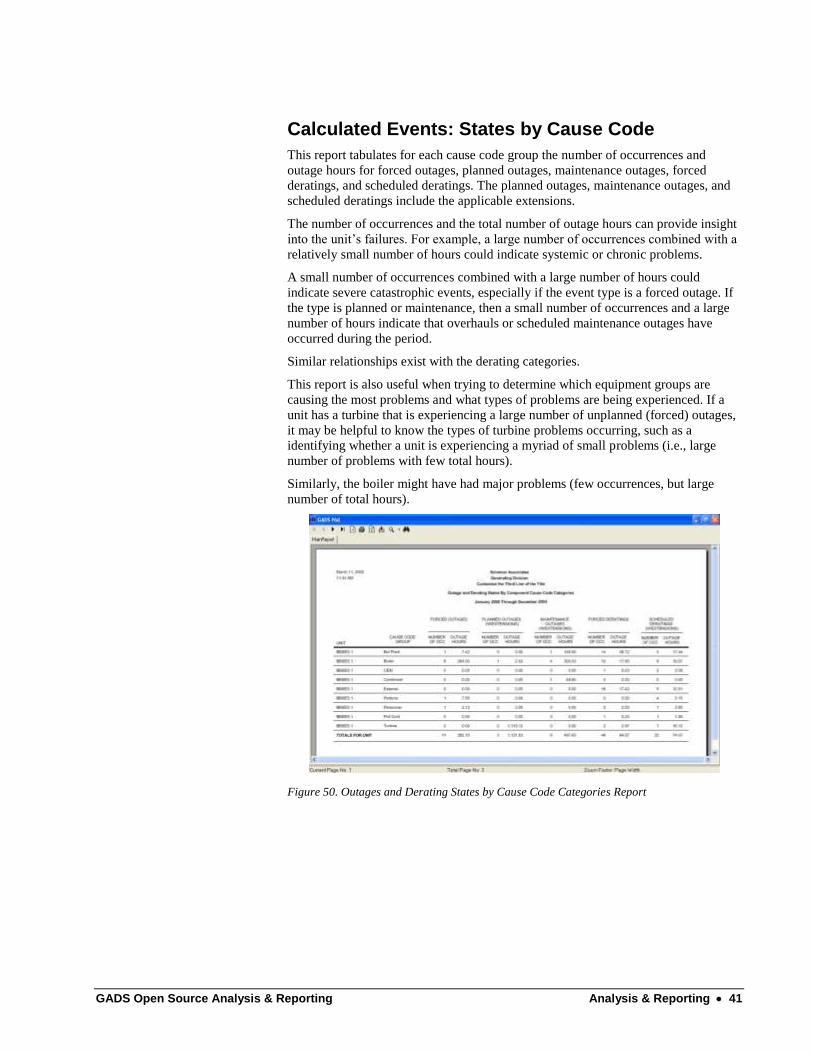
Calculated Events: States by Cause Code
This report tabulates for each cause code group the number of occurrences and
outage hours for forced outages, planned outages, maintenance outages, forced
deratings, and scheduled deratings. The planned outages, maintenance outages, and
scheduled deratings include the applicable extensions.
The number of occurrences and the total number of outage hours can provide insight
into the unit‘s failures. For example, a large number of occurrences combined with a
relatively small number of hours could indicate systemic or chronic problems.
A small number of occurrences combined with a large number of hours could
indicate severe catastrophic events, especially if the event type is a forced outage. If
the type is planned or maintenance, then a small number of occurrences and a large
number of hours indicate that overhauls or scheduled maintenance outages have
occurred during the period.
Similar relationships exist with the derating categories.
This report is also useful when trying to determine which equipment groups are
causing the most problems and what types of problems are being experienced. If a
unit has a turbine that is experiencing a large number of unplanned (forced) outages,
it may be helpful to know the types of turbine problems occurring, such as a
identifying whether a unit is experiencing a myriad of small problems (i.e., large
number of problems with few total hours).
Similarly, the boiler might have had major problems (few occurrences, but large
number of total hours).
Figure 50. Outages and Derating States by Cause Code Categories Report

42 Analysis & Reporting GADS Open Source Analysis & Reporting
Calculated Events: Cause Codes by MWh
This report displays the MWh lost by major event type (forced outages, planned
outages, maintenance outages, forced deratings, and scheduled deratings) in the
indicated cause code groups.
Figure 51. Component Cause Code Categories by MWh Report
Performance Statistics
These monthly reports are based on the GADS Performance records.
Figure 52. Select Performance Statistics Report
GADS Open Source Analysis & Reporting Analysis & Reporting 43
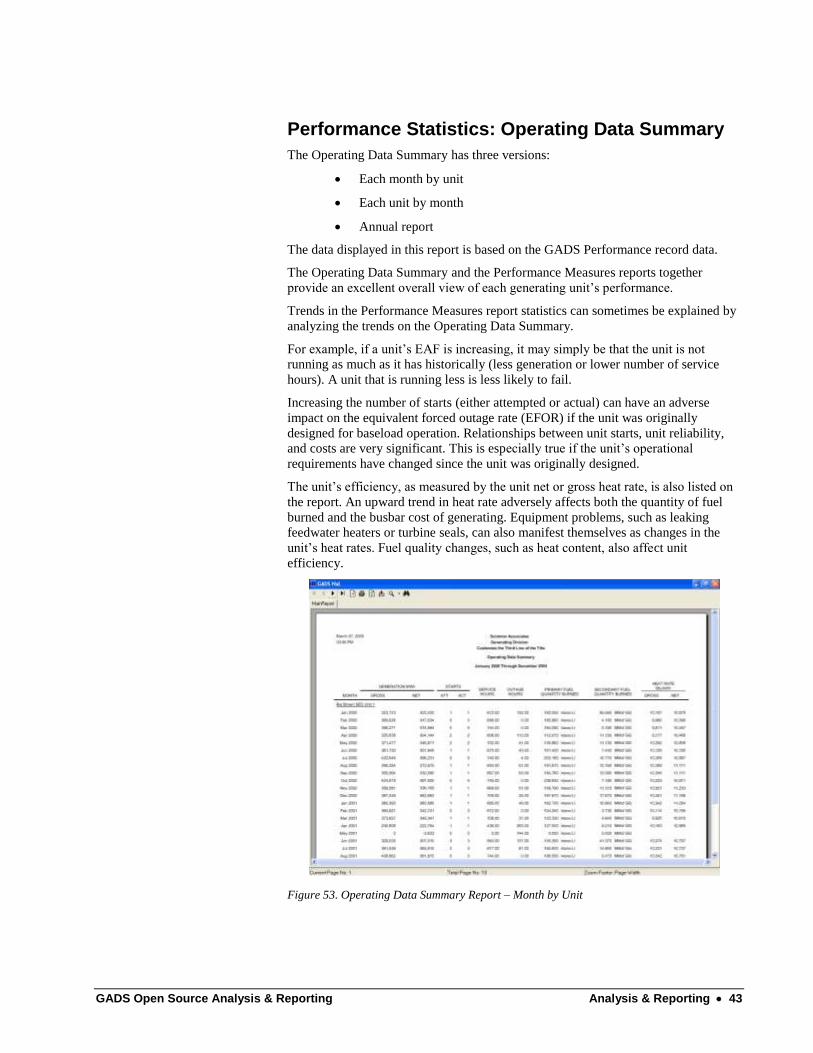
Performance Statistics: Operating Data Summary
The Operating Data Summary has three versions:
Each month by unit
Each unit by month
Annual report
The data displayed in this report is based on the GADS Performance record data.
The Operating Data Summary and the Performance Measures reports together
provide an excellent overall view of each generating unit‘s performance.
Trends in the Performance Measures report statistics can sometimes be explained by
analyzing the trends on the Operating Data Summary.
For example, if a unit‘s EAF is increasing, it may simply be that the unit is not
running as much as it has historically (less generation or lower number of service
hours). A unit that is running less is less likely to fail.
Increasing the number of starts (either attempted or actual) can have an adverse
impact on the equivalent forced outage rate (EFOR) if the unit was originally
designed for baseload operation. Relationships between unit starts, unit reliability,
and costs are very significant. This is especially true if the unit‘s operational
requirements have changed since the unit was originally designed.
The unit‘s efficiency, as measured by the unit net or gross heat rate, is also listed on
the report. An upward trend in heat rate adversely affects both the quantity of fuel
burned and the busbar cost of generating. Equipment problems, such as leaking
feedwater heaters or turbine seals, can also manifest themselves as changes in the
unit‘s heat rates. Fuel quality changes, such as heat content, also affect unit
efficiency.
Figure 53. Operating Data Summary Report – Month by Unit

44 Analysis & Reporting GADS Open Source Analysis & Reporting
Figure 54. Operating Data Summary Report – Unit by Month
Figure 55. Operating Data Summary Annual Report
This report includes:
Unit name
Month
Gross generation
Net generation
Attempted starts
Actual starts
Service hours
Outage hours
Primary fuel quantity burned
Secondary fuel quantity burned
Gross heat rate (Btu/kWh)
Net heat rate (Btu/kWh)

GADS Open Source Analysis & Reporting Analysis & Reporting 45
Performance Statistics: Generating Indexes
The statistics in the Generating Indexes report can be sorted and displayed in three
different ways:
Each month by unit
Each unit by month
Annual report
The data displayed in this report is based on the GADS Performance record data.
The Generating Indexes and the Performance Measures reports together provide an
excellent overall view of each generating unit‘s performance.
Trends in the Performance Measures report statistics can sometimes be explained by
analyzing the trends on the Operating Data Summary.
For example, if a unit‘s EAF is increasing, it may simply be that the unit is not
running as much as it has historically (less generation or lower number of service
hours). A unit that is running less is less likely to fail.
Increasing the number of starts (either attempted or actual) can have an adverse
impact on the equivalent forced outage rate (EFOR) if the unit was originally
designed for baseload operation. Relationships between unit starts, unit reliability,
and costs are very significant. This is especially true if the unit‘s operational
requirements have changed since the unit was originally designed. Measurements
such as Service Hours Per Start can also be an indicator of the bases for changes in
unit reliability.
Trends in Gross or Net Output Factor can have a direct correlation to unit reliability.
The Output Factor is the average load at which the unit runs, and is a direct
measurement of how hard the unit is being operated. Units that have high or upward-
trending output factors might experience increasing unplanned outages and
deratings.
The number of starts, starting reliability, and service hours per start can be used to
track unit operation in response to changes in system demand or the market.
Figure 56. Generation Indexes – Month by Unit
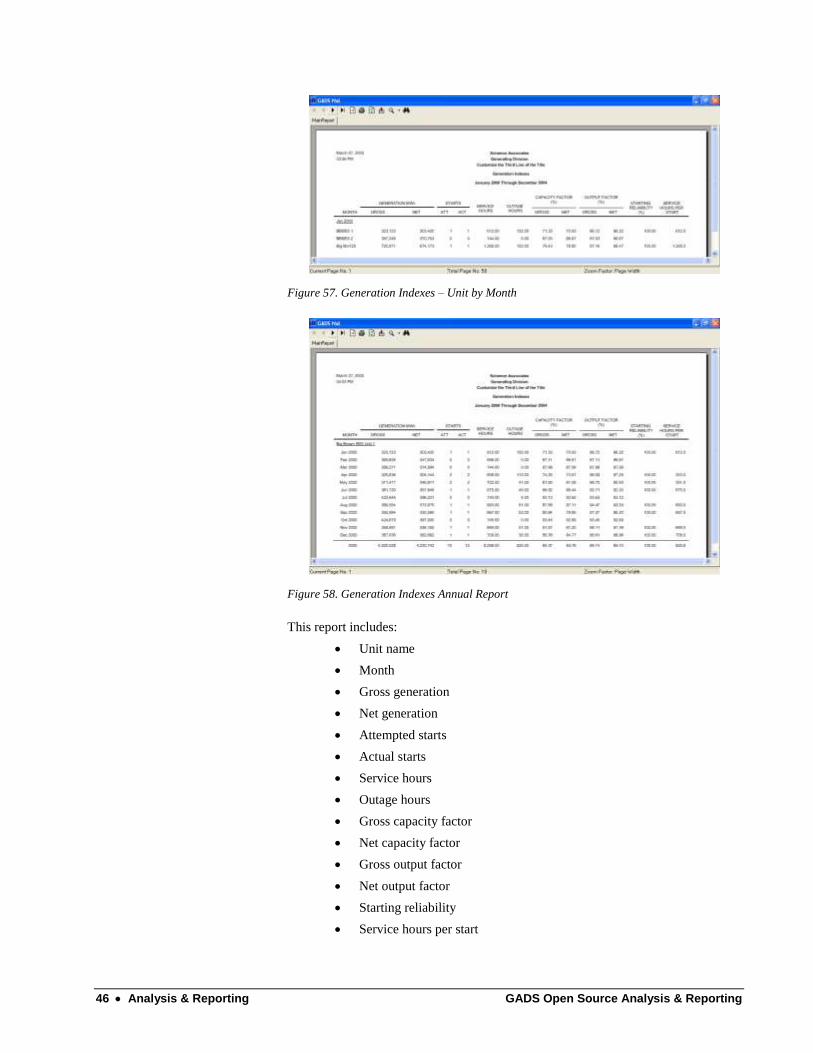
46 Analysis & Reporting GADS Open Source Analysis & Reporting
Figure 57. Generation Indexes – Unit by Month
Figure 58. Generation Indexes Annual Report
This report includes:
Unit name
Month
Gross generation
Net generation
Attempted starts
Actual starts
Service hours
Outage hours
Gross capacity factor
Net capacity factor
Gross output factor
Net output factor
Starting reliability
Service hours per start

GADS Open Source Analysis & Reporting Analysis & Reporting 47
Performance Statistics: Demand-Related Statistics (EFORd and FORd)
This report not only generates the output display, but also populates the EFORdTotal
table with data on which the Demand-related Statistics report is based.
Running this report for all units for the last 12 months not only generates the report,
but also populates the EFORdTotal table with the statistics and supporting data for
the same units over the same time period—one record for each unit for the entire
time period selected.
The EFORdTotal table is not populated during the production processing, but only
by the running of this report, since this report provides confirmation that the data is
correct and that the calculated EFORd and FORd values are as expected—both for
the individual months and for the period calculated values. If you chose to include a
group in the report, the group values are also created in the tables.
As each report is generated, the data and calculated statistics are added to the
EFORdTotal table. Existing table records are not deleted, and are only replaced if the
same time period is re-run. This allows you to maintain a historical set of records
showing how the EFORd and FORd have changed over time.
This feature was added to provide the various ISOs with EFORd data for calculating
UCAP/ICAP values. The group and period EFORd values are calculated using the
ISO-NE and NYISO methodology.
Figure 59. Operating Data Summary Report, Demand-Related Statistics
48 Analysis & Reporting GADS Open Source Analysis & Reporting
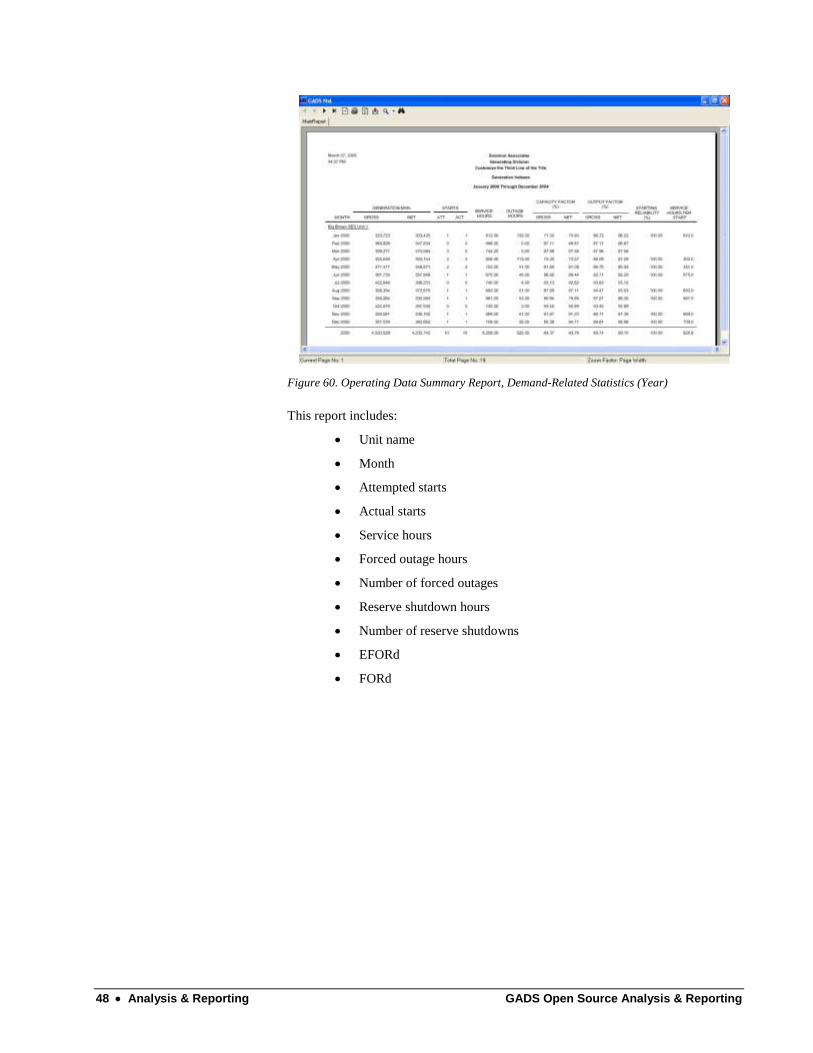
Figure 60. Operating Data Summary Report, Demand-Related Statistics (Year)
This report includes:
Unit name
Month
Attempted starts
Actual starts
Service hours
Forced outage hours
Number of forced outages
Reserve shutdown hours
Number of reserve shutdowns
EFORd
FORd
GADS Open Source Analysis & Reporting Analysis & Reporting 49
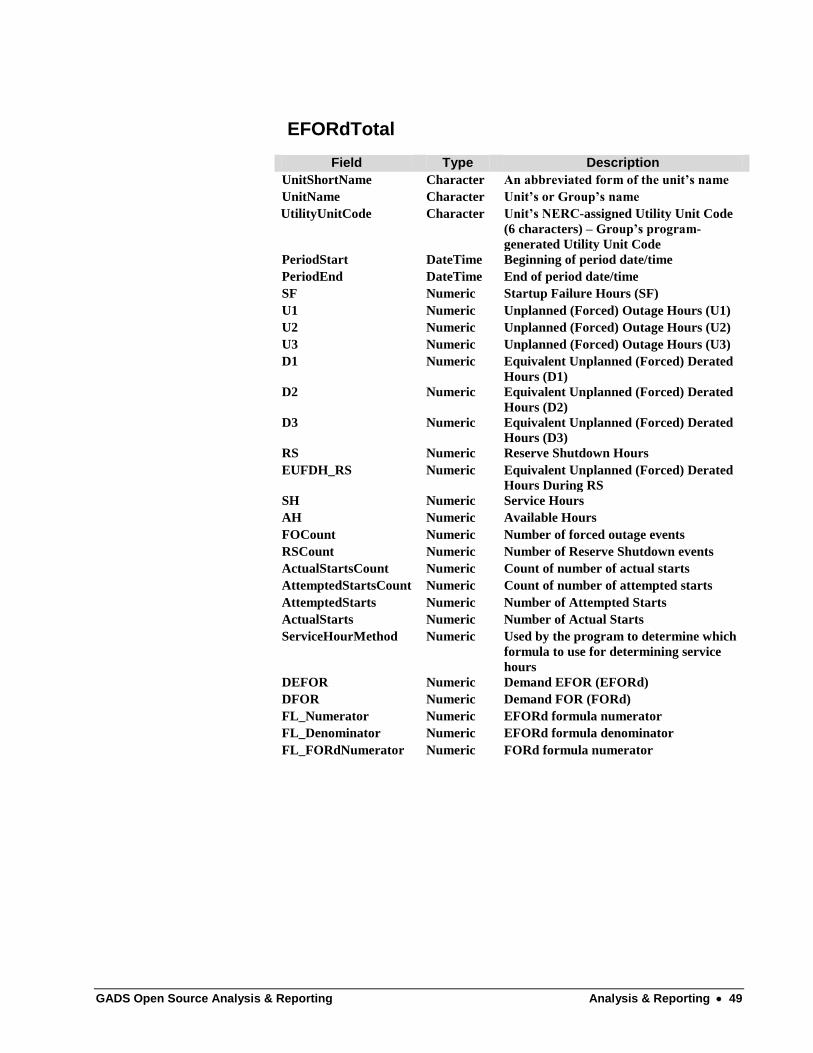
EFORdTotal
Field Type Description
UnitShortName Character An abbreviated form of the unit’s name
UnitName Character Unit’s or Group’s name
UtilityUnitCode Character Unit’s NERC-assigned Utility Unit Code
(6 characters) – Group’s program-
generated Utility Unit Code
PeriodStart DateTime Beginning of period date/time
PeriodEnd DateTime End of period date/time
SF Numeric Startup Failure Hours (SF)
U1 Numeric Unplanned (Forced) Outage Hours (U1)
U2 Numeric Unplanned (Forced) Outage Hours (U2)
U3 Numeric Unplanned (Forced) Outage Hours (U3)
D1 Numeric Equivalent Unplanned (Forced) Derated
Hours (D1)
D2 Numeric Equivalent Unplanned (Forced) Derated
Hours (D2)
D3 Numeric Equivalent Unplanned (Forced) Derated
Hours (D3)
RS Numeric Reserve Shutdown Hours
EUFDH_RS Numeric Equivalent Unplanned (Forced) Derated
Hours During RS
SH Numeric Service Hours
AH Numeric Available Hours
FOCount Numeric Number of forced outage events
RSCount Numeric Number of Reserve Shutdown events
ActualStartsCount Numeric Count of number of actual starts
AttemptedStartsCount Numeric Count of number of attempted starts
AttemptedStarts Numeric Number of Attempted Starts
ActualStarts Numeric Number of Actual Starts
ServiceHourMethod Numeric Used by the program to determine which
formula to use for determining service
hours
DEFOR Numeric Demand EFOR (EFORd)
DFOR Numeric Demand FOR (FORd)
FL_Numerator Numeric EFORd formula numerator
FL_Denominator Numeric EFORd formula denominator
FL_FORdNumerator Numeric FORd formula numerator

50 Analysis & Reporting GADS Open Source Analysis & Reporting
Equipment Cause Code Groups
These reports include the various granularities calculated during the standard
production processing. Shown on the form in Figure 61, only Monthly, Yearly
(Annual), and Peak Periods are enabled. These are the only granularities that have
been calculated during the standard production processing.
If you wish to add Quarterly reports, you need to use the Analysis Admin Console
to add Quarterly granularity to the appropriate group(s). After the calculations are re-
run, Quarterly be listed as available for reports.
Calculating stores the calculated results for all selected granularities in the database
tables; therefore, running reports is simply a matter of extracting the previously
calculated statistics and data from the database tables. This saves time when running
reports for monthly departmental reporting, which typically requires a mix of
monthly, yearly and peak period reports.
Figure 61. Select Equipment Cause Code Group
This report displays five calculated factors and rates for each of selected equipment
group.
The equivalent forced outage rates (EFOR) calculated on this report are different
from those calculated by NERC.
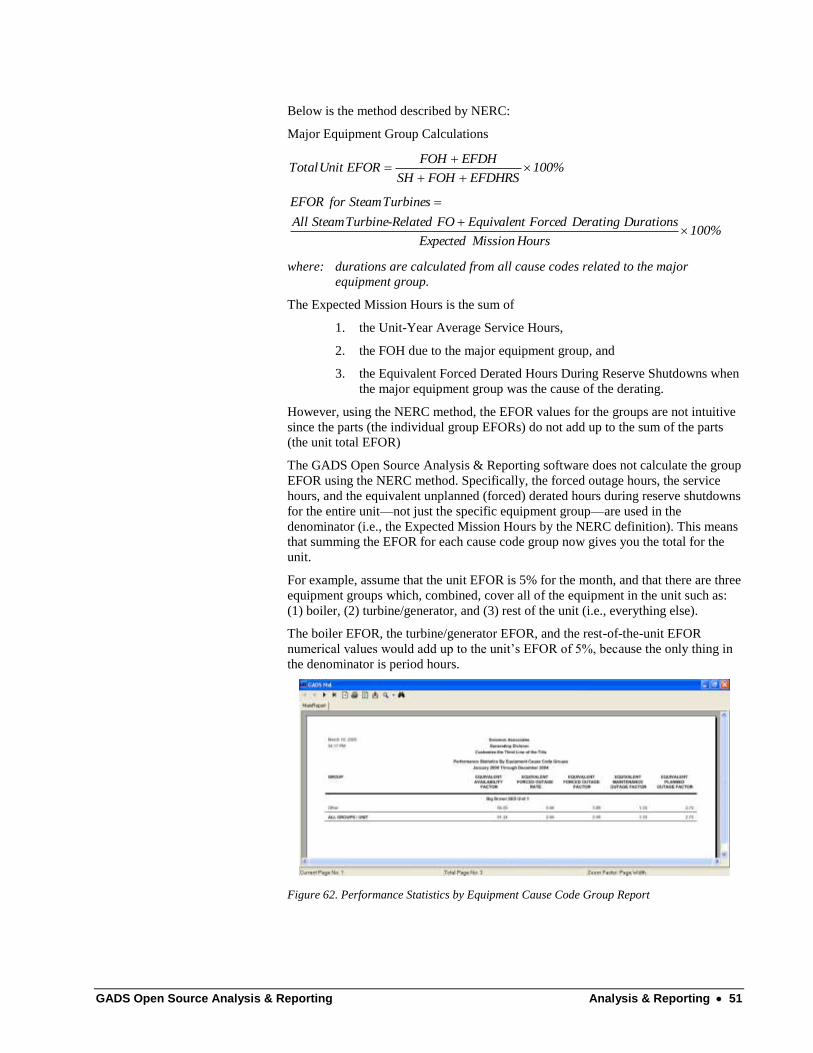
GADS Open Source Analysis & Reporting Analysis & Reporting 51
Below is the method described by NERC:
Major Equipment Group Calculations
100%EFDHRSFOHSH
EFDHFOHEFOR Unit Total
100%Hours MissionExpected
Durations Derating Forced EquivalentFO Related-Turbine SteamAll
Turbines Steamfor EFOR
where: durations are calculated from all cause codes related to the major
equipment group.
The Expected Mission Hours is the sum of
1. the Unit-Year Average Service Hours,
2. the FOH due to the major equipment group, and
3. the Equivalent Forced Derated Hours During Reserve Shutdowns when
the major equipment group was the cause of the derating.
However, using the NERC method, the EFOR values for the groups are not intuitive
since the parts (the individual group EFORs) do not add up to the sum of the parts
(the unit total EFOR)
The GADS Open Source Analysis & Reporting software does not calculate the group
EFOR using the NERC method. Specifically, the forced outage hours, the service
hours, and the equivalent unplanned (forced) derated hours during reserve shutdowns
for the entire unit—not just the specific equipment group—are used in the
denominator (i.e., the Expected Mission Hours by the NERC definition). This means
that summing the EFOR for each cause code group now gives you the total for the
unit.
For example, assume that the unit EFOR is 5% for the month, and that there are three
equipment groups which, combined, cover all of the equipment in the unit such as:
(1) boiler, (2) turbine/generator, and (3) rest of the unit (i.e., everything else).
The boiler EFOR, the turbine/generator EFOR, and the rest-of-the-unit EFOR
numerical values would add up to the unit‘s EFOR of 5%, because the only thing in
the denominator is period hours.
Figure 62. Performance Statistics by Equipment Cause Code Group Report
52 Analysis & Reporting GADS Open Source Analysis & Reporting
This report includes:
Unit name
Group
Equivalent availability factor
Equivalent forced outage rate
Equivalent forced outage factor
Equivalent maintenance outage factor
Equivalent planned outage factor
Custom Calculations
Analysis & Reporting performs standard calculations for the selected granularities
for all historical periods. The granularities are established for each group using the
Analysis & Reporting Admin Console. The group granularity selections are
assigned to each of the units that make up that group.
For example, Dallas Unit 1, a gas-fired fossil steam unit, is assigned to both the
fossil steam group and the gas-fired group. The fossil steam group needs reports for
both monthly and yearly granularities. The gas-fired group needs daily and monthly
granularities. Since Dallas Unit 1 is assigned to both groups, when the calculations
are run, daily, monthly, and yearly calculations are run on its data. All three
granularities‘ factors and rates for Dallas Unit 1 are stored in the database tables for
quick and easy reporting.
There may be occasions, however, that require calculating a granularity for a period
that is not a part of the standard processing; such occasions require using the Custom
Calculation form. This form allows you to select one or more units, a granularity,
and a period range, and the software calculates statistics based on your selections.
The results are stored in the database tables and are available for reporting using the
standard reporting methods discussed in this user manual.
The only difference is that the new granularity does not become a part of the regular
standard calculations; rather, it is a ―one-time‖ process that is manually initiated.
You will note in Figure 63 that Monthly and Yearly (Annual) are disabled. Those
results are already calculated and stored in the database tables, so all you need to do
is to run the reports; no custom calculations are needed.
After making the necessary selections, click Continue to begin the calculations.
To cancel the Custom Calculations, click Cancel.
During the calculations, the processing status is displayed above Cancel and
Continue. It displays each unit as it is being calculated and then displays a message
indicating the calculations are complete.
When the calculations are complete, simply select Generate Reports from the Main
menu, and use the standard methods to create the required reports. The only
difference is that there is no pre-defined group; therefore, you must choose the
individual units to create a custom group for this granularity.
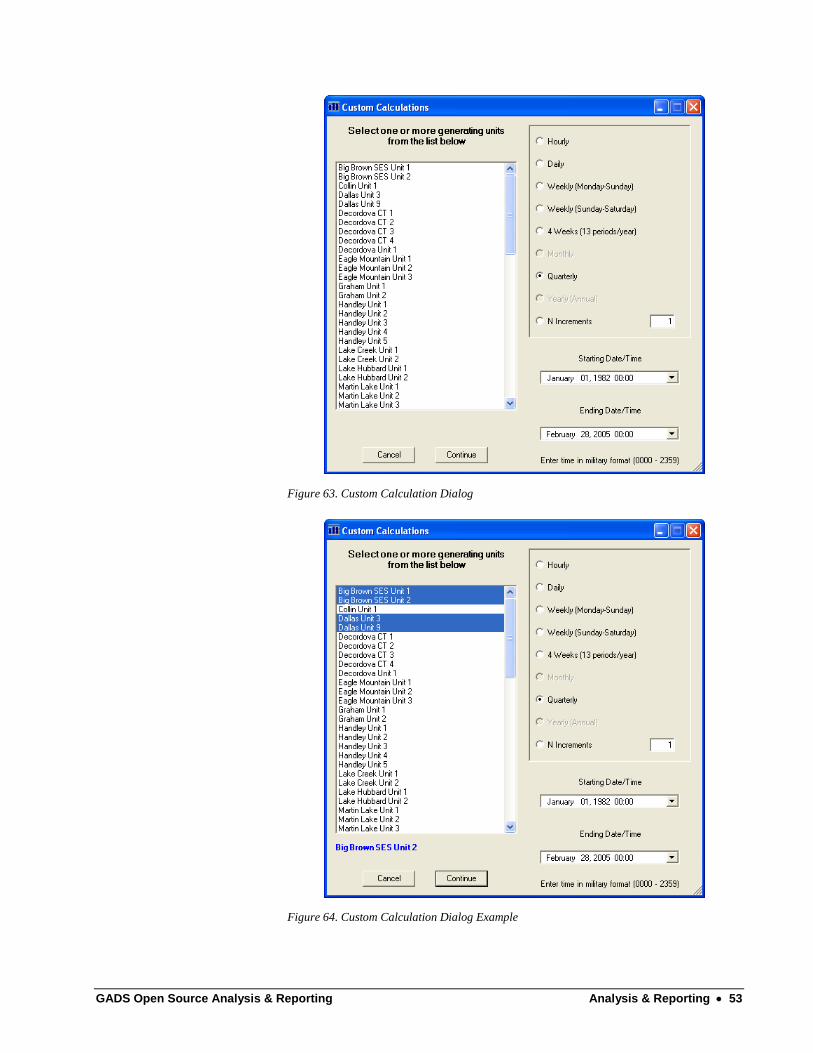
GADS Open Source Analysis & Reporting Analysis & Reporting 53
Figure 63. Custom Calculation Dialog
Figure 64. Custom Calculation Dialog Example

54 Analysis & Reporting GADS Open Source Analysis & Reporting
Unit/Group Selection
After clicking Continue on any of the report forms, you will be taken to the form
shown in Figure 65. Select the units and/or groups to include in the report, as well as
optional items to be displayed on the report itself.
The name of the report being generated is displayed at the top of the Unit/Group
Selection form. As shown in Figure 65, the report being processed is Deratings by
Equipment Cause Code.
For some of the reports, you can change the sorting of the displayed data. In most
cases, the sorting will be applied only to reports where sorting can be actually done,
such as event listings.
When this form is displayed the software ―focuses‖ on the right panel, used to select
the standard groups. In this panel, choose first whether to report the Group Only or
both the Units & Group. If you choose Units & Group, the units are listed and the
group is shown as a summary page. The group pages appear in the report, sorted
alphabetically by the unit and group names.
After you have chosen either Group Only or Units & Group, select one or more
groups from the list. If you select more than one group, the software will generate the
selected report for every group selected in a back-to-back process.
For example, if the group name is ―Big Bear,‖ and the units are named ―Big Bear 1‖
and ―Big Bear 2,‖ the ―Big Bear‖ group page will be listed first. If the group name is
changed to ―Big Bear Plant,‖ the group will be the last pages in the report. This is a
―feature‖ of Crystal Reports, and we are unable to easily ―code around it.‖
Figure 65. Unit Selection Dialog
If you want to pick your own custom group of units, click anywhere on the left panel
to change the focus. The unit list is now enabled, allowing you to select one or more
units for the report (refer to Figure 66). The three choices are Units (units only; no
group page), Units & Summary (individual units and a summary page), or Summary
Only (group page only; no unit pages). After you have chosen one of the three
options, select the units to be included in the report. You can select more than one
item in the list by holding down the CTRL key, while clicking the desired items

GADS Open Source Analysis & Reporting Analysis & Reporting 55
using the left mouse button. You can select a range of items by selecting the first unit
in the range, holding down the SHIFT key, and selecting the last unit in the range.
Figure 66. Unit Selection Example
On these forms, the following options are available for the selected report:
Change 3rd
Line of Title If Desired – in the Admin Console, you had the
option to enter three title lines to customize the top of each report.
Typically, these title lines include your company‘s name, the division that is
responsible for the GADS data, and the group that is generating the reports;
what you decide to use is up to you. You can, however, change the third
line for this specific report by entering the new third line here. If left blank,
the default third line will be used.
Include Selection Summary – on the last page of each report, the software
can list a summary of the selection criteria and assumptions used to create
the report. Check this option to include the Selection Summary on the last
page.
Include Footer on Reports – in the Admin Console you had the option to
enter standardized text for the footer on each report page. Typically, the text
addresses the confidentiality of the report or who to contact if the reader has
any questions. The text you use is up to you. Check this option if you want
the footer text displayed on each report page.
Change the SORTING for this report – on some reports you can
customize the order in which data is displayed in the report. Check this
option if you want to change the display order.
If you have checked the Change the SORTING for this report, after you click
Continue the Sort Order form (Figure 67) appears, allowing you to designate how
the report data will be displayed.

56 Analysis & Reporting GADS Open Source Analysis & Reporting
Figure 67. Sort Order Filters
On the form, designate the sort order and whether that field is sorted ascending or
descending. When you are finished with the form, click OK to enable the sorting, or
Cancel to revert back to the report‘s default sort.
Performance Indexes and Equations
General Information
This section discusses the relationships among the performance indexes calculated
from the event and performance data. The basis for these relationships is IEEE
Standard 762 ―Definitions for Use in Reporting Electric Generating Unit Reliability,
Availability and Productivity.‖
Summary of Various Time and Energy Factors Used by Indexes
The following sections describe performance indexes used to measure the
performance of generating units. The sections are divided into:
Unweighted (time-based) methods for calculating single unit statistics
Unweighted (time-based) methods for pooled (group) unit statistics
Weighted (energy-based) methods for pooling (group) unit statistics
Weighted (energy-based) statistics excluding problems outside
management control. This fourth section is used Europe and other
places in the world for measuring plant personnel productivity

GADS Open Source Analysis & Reporting Analysis & Reporting 57
Some Words About Calculations
Please note that when you are calculating a single generating unit‘s performance
statistics, it does not matter whether you use unweighted or weighted statistics. The
answer will generally be the same. The real difference between the unweighted and
weighted statistics is in pooling (or grouping) a set of generating units. In such cases,
a group of units of similar size will show little or no differences, but for a group of
units where the range in MW size is very different (greater than 50 MW), the
statistics will be very different.
With unweighted statistics, all units are considered equal in outage impact. In the
unweighted equations, no MW size is introduced into the equations and the results
are based on time; not energy produced (or not produced). In such cases, a 50 MW
gas turbine and a 1,000 MW nuclear unit have the same impact of the resulting
statistics.
With weighted statistics, the larger MW size unit in the group has more impact on
the final statistics than a smaller generating unit, because the MW size of the unit
(NMC/GMC) is part of the equation. In such cases, a 1,000 MW nuclear unit would
have 20 times impact on the final outcome of the pool or fleet calculation that its 50
MW gas turbine companion would have.
More Words About Data Pooling
To weight an equation, one
does not simply take each
unit’s EFOR, for example,
and multiply the EFOR by
the NMC, add them u,p and
divide by the sum of the
NMCs.
Each term in the equation
must be multiplied by the
NMC, and all the products
summed over all the units.
When grouping a fleet of units with dissimilar sizes and/or duty cycles, weighting
puts the proper relative weight for each unit‘s contribution into the fleet‘s composite
indexes.
Using the unweighted equations currently in the IEEE 762 Standard (Section 7), an
older, smaller, little-run unit will have just as much weight as a newer, larger,
baseload unit. This approach could unrealistically and disproportionately swing the
unweighted fleet averages too high (for a very high availability on a small unit) or
too low (for a very low availability on a small unit).
The current IEEE 762 Standard‘s unweighted equations should not be abandoned,
however, even for group statistics. There are valid applications for this method, such
as evaluating equipment reliability and availability regardless of size.
Weighted calculations, although primarily needed for grouping units‘ performance
indexes, may apply to individual units as well. The effect will be minimal, but over
months or years, many units‘ net maximum capacities (NMC) do change somewhat.
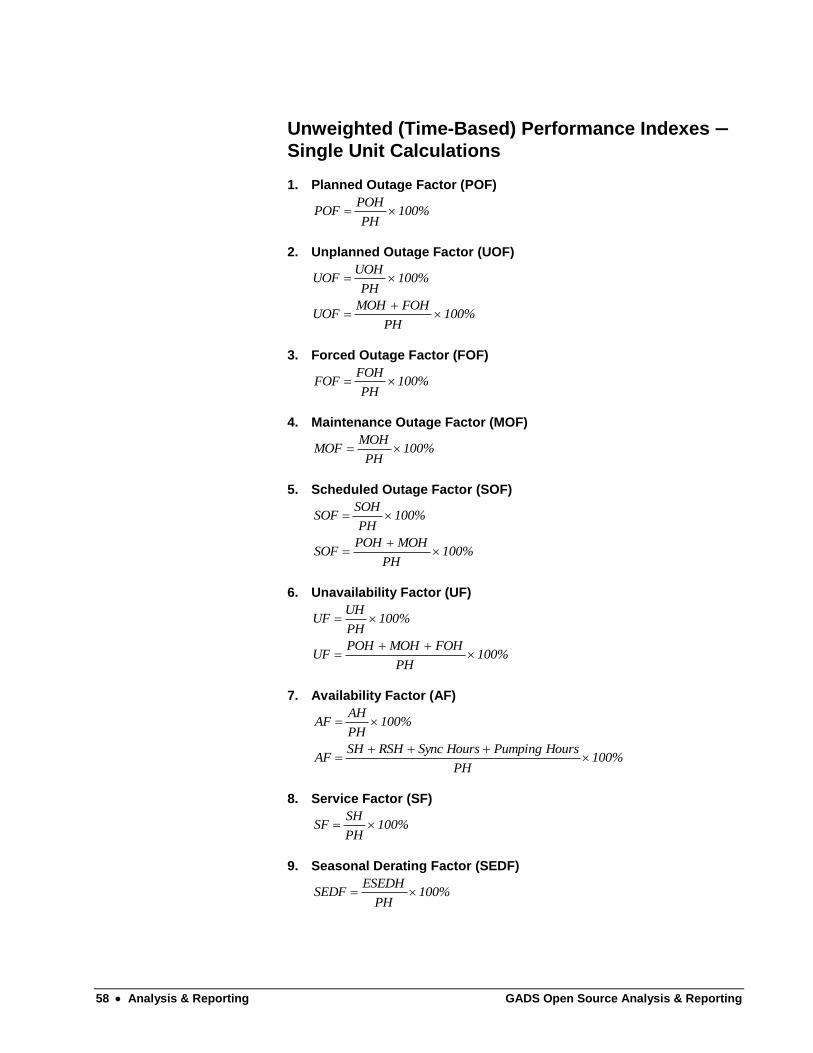
58 Analysis & Reporting GADS Open Source Analysis & Reporting
Unweighted (Time-Based) Performance Indexes —
Single Unit Calculations
1. Planned Outage Factor (POF)
100%PH
POHPOF
2. Unplanned Outage Factor (UOF)
100%PH
UOHUOF
100%PH
FOHMOHUOF
3. Forced Outage Factor (FOF)
100%PH
FOHFOF
4. Maintenance Outage Factor (MOF)
100%PH
MOHMOF
5. Scheduled Outage Factor (SOF)
100%PH
SOHSOF
100%PH
MOHPOHSOF
6. Unavailability Factor (UF)
100%PH
UHUF
100%PH
FOHMOHPOHUF
7. Availability Factor (AF)
100%PH
AHAF
100%PH
Hours PumpingHours SyncRSHSHAF
8. Service Factor (SF)
100%PH
SHSF
9. Seasonal Derating Factor (SEDF)
100%PH
ESEDHSEDF
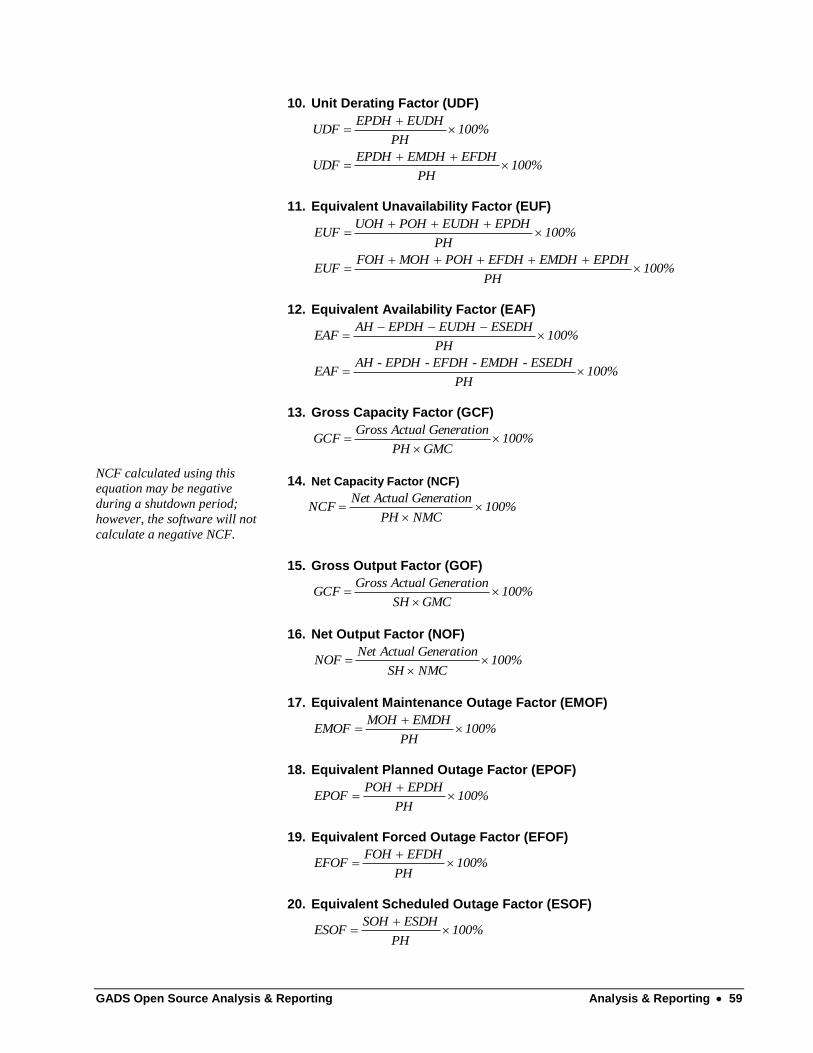
GADS Open Source Analysis & Reporting Analysis & Reporting 59
10. Unit Derating Factor (UDF)
100%PH
EUDHEPDHUDF
100%PH
EFDHEMDHEPDHUDF
11. Equivalent Unavailability Factor (EUF)
100%PH
EPDHEUDHPOHUOHEUF
100%PH
EPDHEMDHEFDHPOHMOHFOHEUF
12. Equivalent Availability Factor (EAF)
100%PH
ESEDHEUDHEPDHAHEAF
100%PH
ESEDH-EMDH-EFDH-EPDH-AHEAF
13. Gross Capacity Factor (GCF)
100%GMCPH
Generation Actual GrossGCF
NCF calculated using this
equation may be negative
during a shutdown period;
however, the software will not
calculate a negative NCF.
14. Net Capacity Factor (NCF)
100%NMCPH
Generation Actual NetNCF
15. Gross Output Factor (GOF)
100%GMCSH
Generation Actual GrossGCF
16. Net Output Factor (NOF)
100%NMCSH
Generation Actual NetNOF
17. Equivalent Maintenance Outage Factor (EMOF)
100%PH
EMDHMOHEMOF
18. Equivalent Planned Outage Factor (EPOF)
100%PH
EPDHPOHEPOF
19. Equivalent Forced Outage Factor (EFOF)
100%PH
EFDHFOHEFOF
20. Equivalent Scheduled Outage Factor (ESOF)
100%PH
ESDHSOHESOF
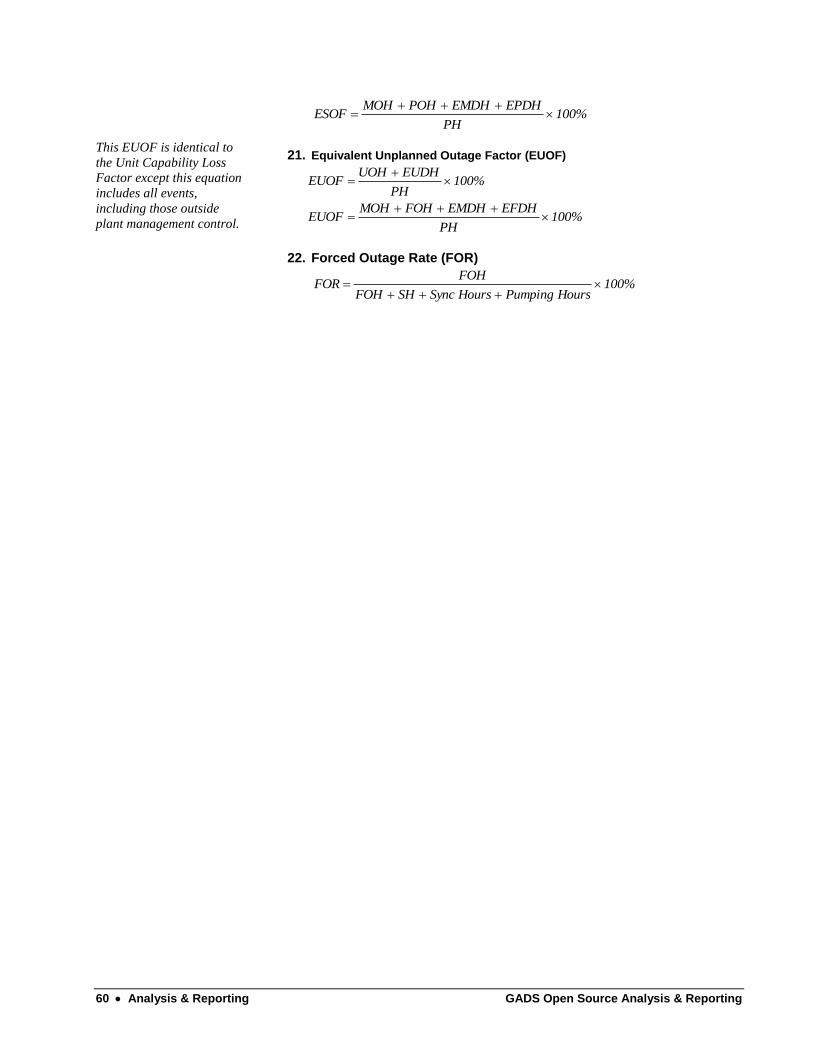
60 Analysis & Reporting GADS Open Source Analysis & Reporting
100%PH
EPDHEMDHPOHMOHESOF
This EUOF is identical to
the Unit Capability Loss
Factor except this equation
includes all events,
including those outside
plant management control.
21. Equivalent Unplanned Outage Factor (EUOF)
100%PH
EUDHUOHEUOF
100%PH
EFDHEMDHFOHMOHEUOF
22. Forced Outage Rate (FOR)
100%Hours PumpingHours SyncSHFOH
FOHFOR

GADS Open Source Analysis & Reporting Analysis & Reporting 61
23. Forced Outage Rate Demand (FORd)
D
1
T
1
r
1
T
1
r
1
f
FOH fxFOHd
where
100%SHFOHd
FOHdFORd
r = Average Forced outage duration = (FOH)/(# of FO occurrences)
D = Average demand time = (SH)/(# of unit actual starts)
T = Average reserve shutdown time = (RSH)/(# of unit attempted starts)
24. Equivalent Forced Outage Rate (EFOR)
100%EFDHRSHours PumpingHours SyncSHFOH
EFDHFOHEFOR
25. Equivalent Forced Outage Rate demand (EFORd)
100%SHFOHd
EFDHdFOHdEFORd
where
FOHd = fx FOH
EFDHd = (EFDH – EFDHRS) if reserve shutdown events reported, or
= (fp × EFDH) if no reserve shutdown events reported
(an approximation)
D
1
T
1
r
1
T
1
r
1
f
AH
SHfp
r = Average Forced outage duration = (FOH)/(# of FO occurrences)
D = Average demand time = (SH)/(# of unit actual starts)
T = Average reserve shutdown time = (RSH)/(# of unit attempted starts)
26. Equivalent Planned Outage Rate (EPOR)
100%EPDHRSHours PumpingHours SyncSHPOH
EPDHPOHEPOR
27. Equivalent Maintenance Outage Rate (EMOR)
100%EMDHRSHours PumpingHours SyncSHMOH
EMDHMOHEMOR
28. Equivalent Unplanned Outage Rate (EUOR)
100%EUDHRSHours PumpingHours SyncSHUOH
EUDHUOHEUOR
100%EMDHRSEFDHRSHrs PumpHrs SyncSHMOHFOH
EMDHMOHEFDHFOHEUOR
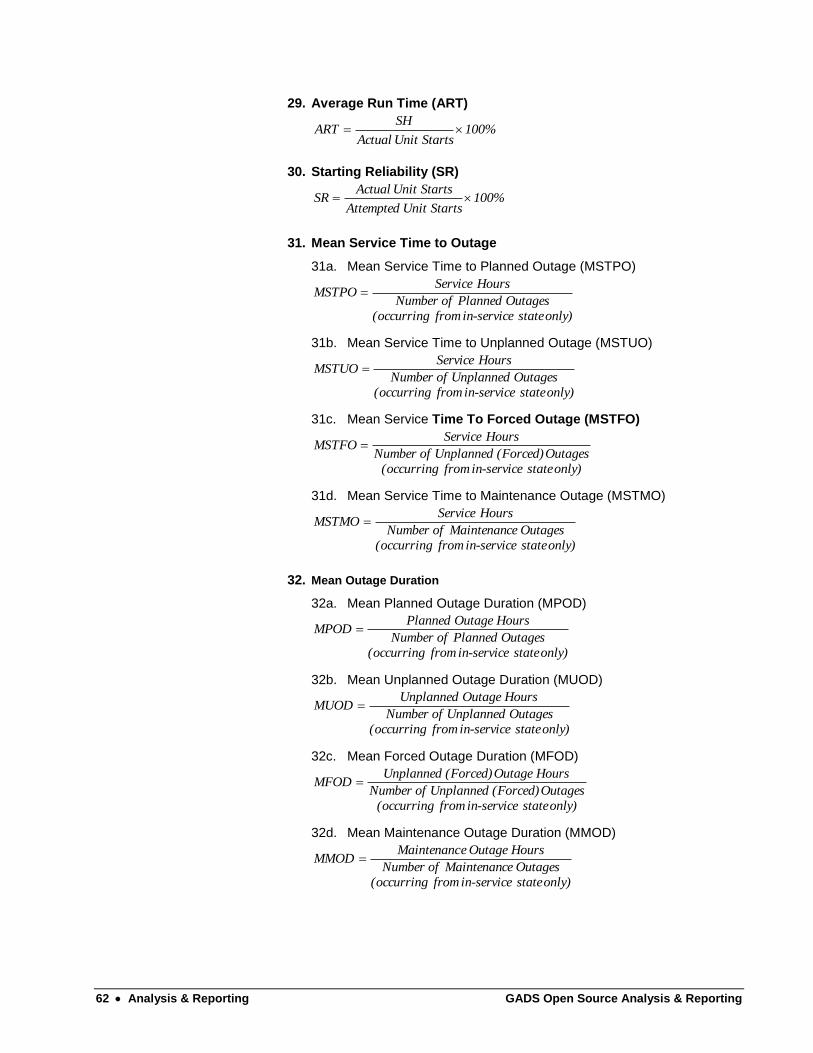
62 Analysis & Reporting GADS Open Source Analysis & Reporting
29. Average Run Time (ART)
100% StartsUnit Actual
SHART
30. Starting Reliability (SR)
100% StartsUnit Attempted
StartsUnit ActualSR
31. Mean Service Time to Outage
31a. Mean Service Time to Planned Outage (MSTPO)
only) stateservice-in from (occurring
Outages Planned of Number
Hours ServiceMSTPO
31b. Mean Service Time to Unplanned Outage (MSTUO)
only) stateservice-in from (occurring
Outages Unplanned of Number
Hours ServiceMSTUO
31c. Mean Service Time To Forced Outage (MSTFO)
only) stateservice-in from (occurring
Outages (Forced) Unplanned of Number
Hours ServiceMSTFO
31d. Mean Service Time to Maintenance Outage (MSTMO)
only) stateservice-in from (occurring
Outages ce Maintenanof Number
Hours ServiceMSTMO
32. Mean Outage Duration
32a. Mean Planned Outage Duration (MPOD)
only) stateservice-in from (occurring
Outages Planned of Number
Hours Outage PlannedMPOD
32b. Mean Unplanned Outage Duration (MUOD)
only) stateservice-in from (occurring
Outages Unplanned of Number
Hours Outage UnplannedMUOD
32c. Mean Forced Outage Duration (MFOD)
only) stateservice-in from (occurring
Outages (Forced) Unplanned of Number
Hours Outage (Forced) UnplannedMFOD
32d. Mean Maintenance Outage Duration (MMOD)
only) stateservice-in from (occurring
Outages ce Maintenanof Number
Hours Outage eMaintenancMMOD
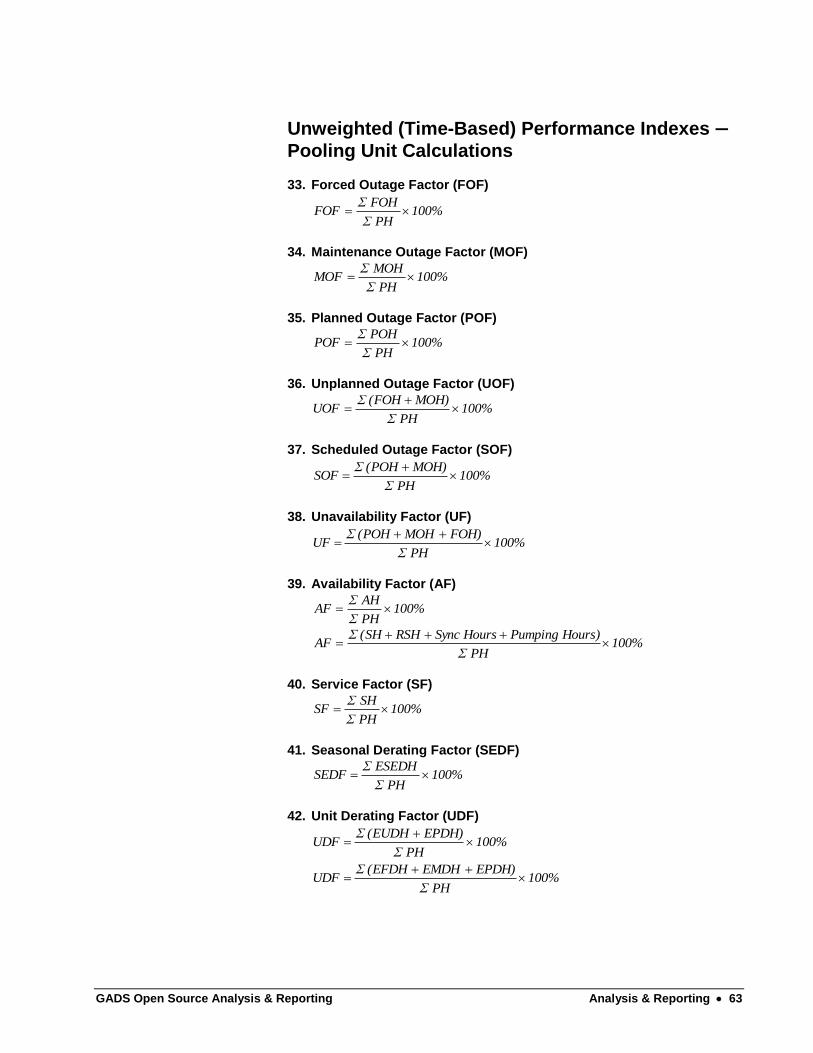
GADS Open Source Analysis & Reporting Analysis & Reporting 63
Unweighted (Time-Based) Performance Indexes —
Pooling Unit Calculations
33. Forced Outage Factor (FOF)
100%PH Σ
FOH ΣFOF
34. Maintenance Outage Factor (MOF)
100%PH Σ
MOHΣMOF
35. Planned Outage Factor (POF)
100%PH Σ
POH ΣPOF
36. Unplanned Outage Factor (UOF)
100%PH Σ
MOH)(FOH ΣUOF
37. Scheduled Outage Factor (SOF)
100%PH Σ
MOH)(POH ΣSOF
38. Unavailability Factor (UF)
100%PH Σ
FOH)MOH(POH ΣUF
39. Availability Factor (AF)
100%PH Σ
AH ΣAF
100%PH Σ
Hours) PumpingHours SyncRSH(SH ΣAF
40. Service Factor (SF)
100%PH Σ
SHΣSF
41. Seasonal Derating Factor (SEDF)
100%PH Σ
ESEDH ΣSEDF
42. Unit Derating Factor (UDF)
100%PH Σ
EPDH)(EUDH ΣUDF
100%PH Σ
EPDH)EMDH(EFDH ΣUDF
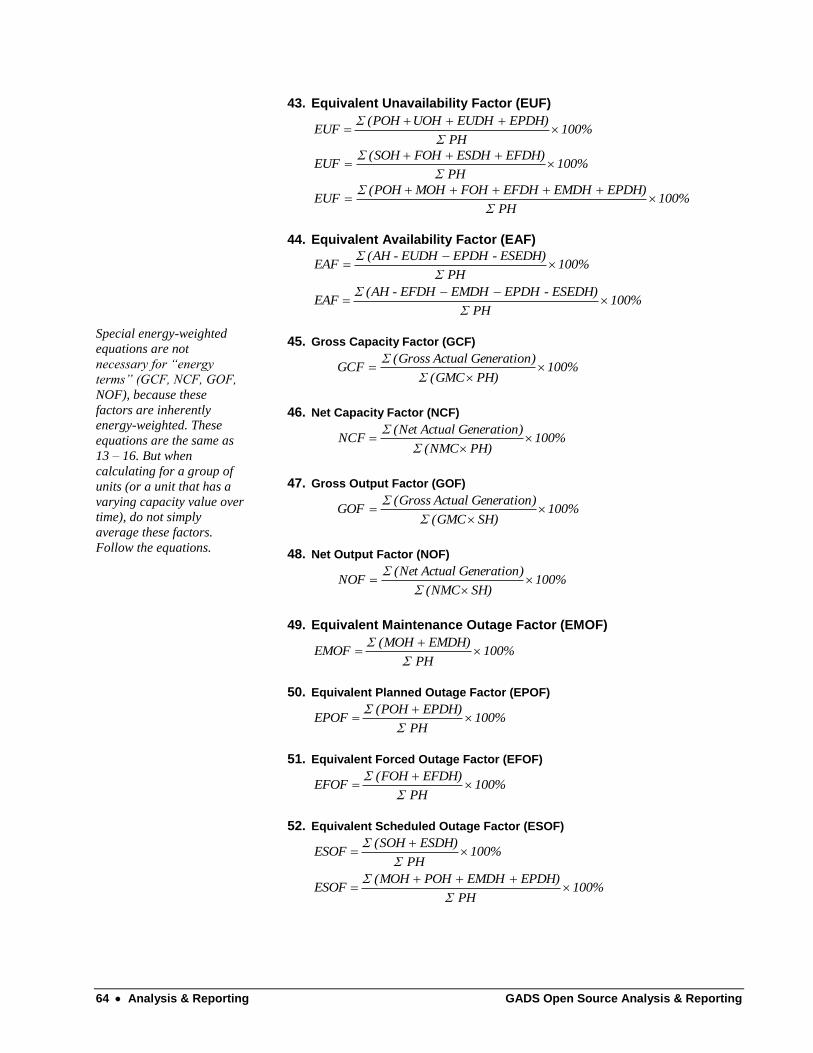
64 Analysis & Reporting GADS Open Source Analysis & Reporting
43. Equivalent Unavailability Factor (EUF)
100%PH Σ
PDH)EEUDHUOH(POH ΣEUF
100%PH Σ
FDH)EESDHFOH(SOH ΣEUF
100%PH Σ
PDH)EEMDHEFDHFOHMOH(POH ΣEUF
44. Equivalent Availability Factor (EAF)
100%PH Σ
ESEDH)-PDHEEUDH-(AH ΣEAF
100%PH Σ
ESEDH)-PDHEEMDHEFDH-(AH ΣEAF
Special energy-weighted
equations are not
necessary for “energy
terms” (GCF, NCF, GOF,
NOF), because these
factors are inherently
energy-weighted. These
equations are the same as
13 – 16. But when
calculating for a group of
units (or a unit that has a
varying capacity value over
time), do not simply
average these factors.
Follow the equations.
45. Gross Capacity Factor (GCF)
100%PH)(GMC Σ
)Generation Actual (Gross ΣGCF
46. Net Capacity Factor (NCF)
100%PH)(NMC Σ
)Generation Actual (Net ΣNCF
47. Gross Output Factor (GOF)
100%SH)(GMC Σ
)Generation Actual (Gross ΣGOF
48. Net Output Factor (NOF)
100%SH)(NMC Σ
)Generation Actual (Net ΣNOF
49. Equivalent Maintenance Outage Factor (EMOF)
100%PH
EMDH)(MOH EMOF
50. Equivalent Planned Outage Factor (EPOF)
100%PH
EPDH)(POH EPOF
51. Equivalent Forced Outage Factor (EFOF)
100%PH
EFDH)(FOH EFOF
52. Equivalent Scheduled Outage Factor (ESOF)
100%PH
ESDH)(SOH ESOF
100%PH
EPDH)EMDHPOH(MOH ESOF

GADS Open Source Analysis & Reporting Analysis & Reporting 65
53. Equivalent Unplanned Outage Factor (EUOF)
100%PH
EUDH)(UOH EUOF
100%PH
EFDH)EMDHFOH(MOH EUOF
54. Forced Outage Rate (FOR)
100%Hours) PumpingHours SyncSH(FOH
OHF FOR
55. Forced Outage Rate demand (FORd)
D
1
T
1
r
1
T
1
r
1
f
FOH fxFOHd
where
100%SH)(FOHd
FOHd ΣFORd
r = Average Forced outage duration = (FOH)/(# of FO occurrences)
D = Average demand time = (SH)/(# of unit actual starts)
T = Average reserve shutdown time = (RSH)/(# of unit attempted starts)
56. Equivalent Forced Outage Rate (EFOR)
100%EFDHRS)Hours PumpingHours SyncSH(FOH
EFDHFOHEFOR
)(
57. Equivalent Forced Outage Rate demand (EFORd)
100%SH)(FOHd
EFDHd)(FOHd ΣEFORd
where
FOHd = fx FOH
EFDHd = (EFDH – EFDHRS) if reserve shutdown events reported, or
= (fp × EFDH) if no reserve shutdown events reported
(an approximation)
D
1
T
1
r
1
T
1
r
1
f
AH
SHfp
r = Average Forced outage duration = (FOH)/(# of FO occurrences)
D = Average demand time = (SH)/(# of unit actual starts)
T = Average reserve shutdown time = (RSH)/(# of unit attempted starts)
58. Equivalent Planned Outage Rate (EPOR)
100%EPDHRS)Hours PumpingHours SyncSH(POH
EPDHPOHEPOR
)(
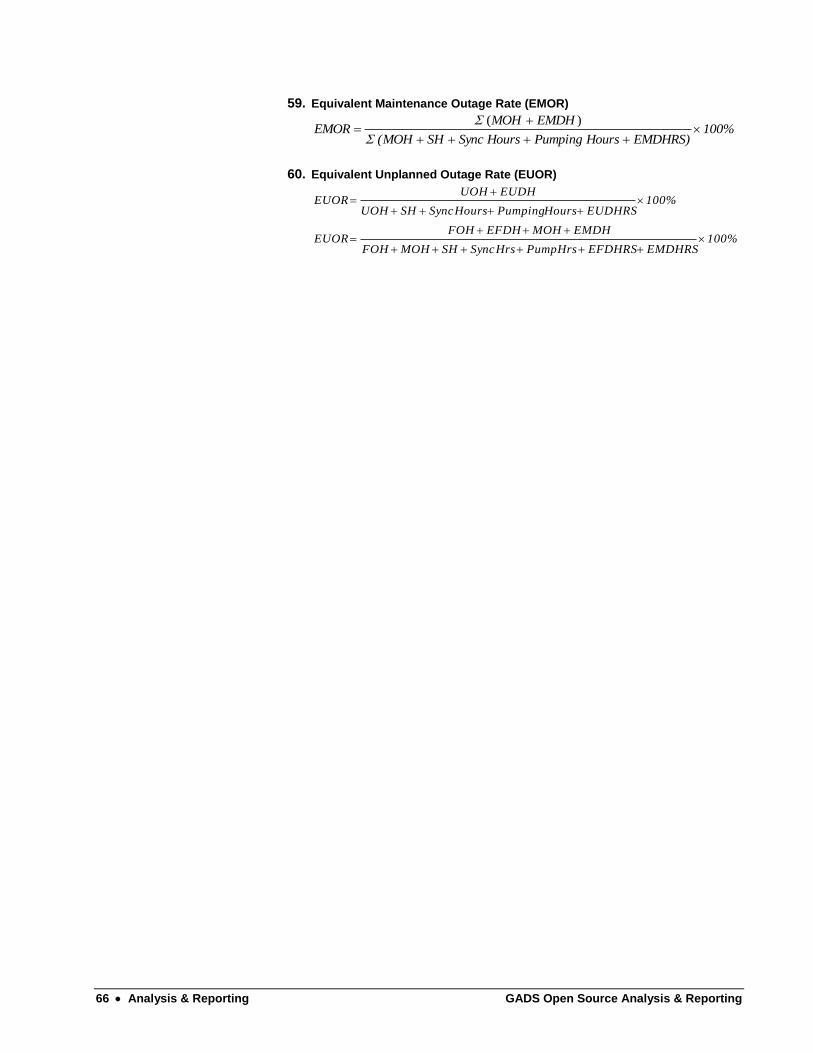
66 Analysis & Reporting GADS Open Source Analysis & Reporting
59. Equivalent Maintenance Outage Rate (EMOR)
100%EMDHRS)Hours PumpingHours SyncSH(MOH
EMDHMOHEMOR
)(
60. Equivalent Unplanned Outage Rate (EUOR)
100%EUDHRSHours PumpingHours SyncSHUOH
EUDHUOHEUOR
100%EMDHRSEFDHRSHrs PumpHrs SyncSHMOHFOH
EMDHMOHEFDHFOHEUOR
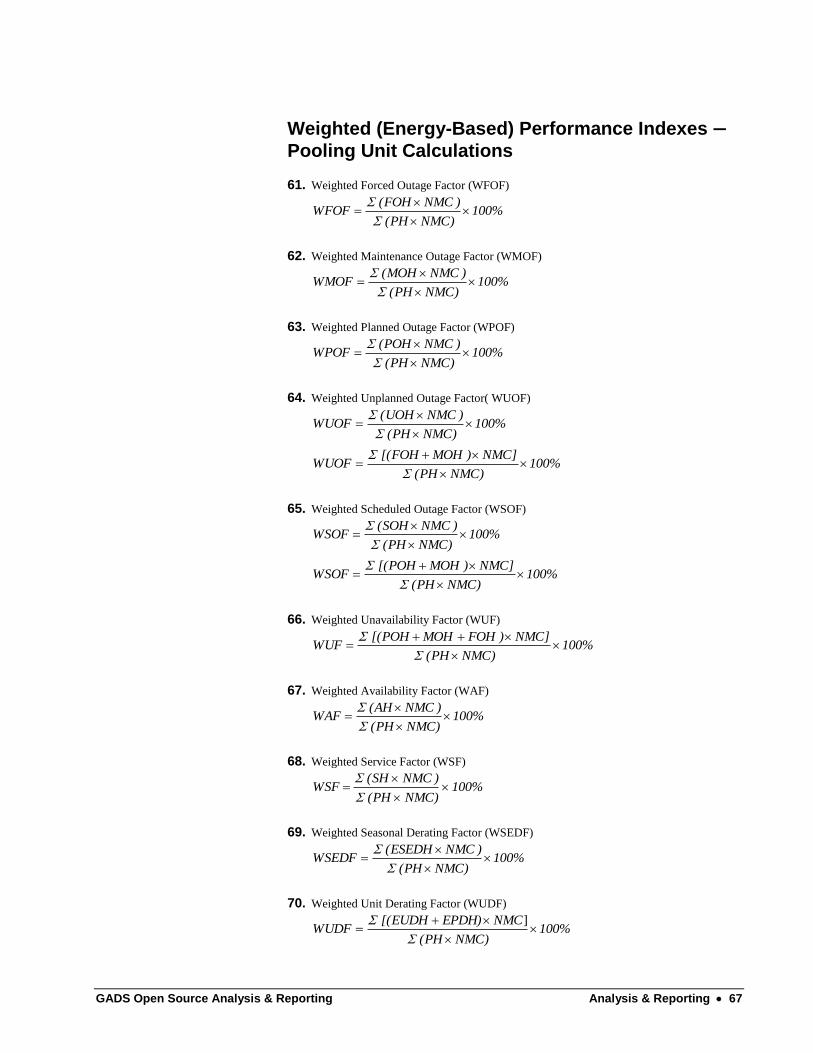
GADS Open Source Analysis & Reporting Analysis & Reporting 67
Weighted (Energy-Based) Performance Indexes —
Pooling Unit Calculations
61. Weighted Forced Outage Factor (WFOF)
100%NMC)(PH
)NMC(FOH WFOF
62. Weighted Maintenance Outage Factor (WMOF)
100%NMC)(PH
)NMC(MOH WMOF
63. Weighted Planned Outage Factor (WPOF)
100%NMC)(PH
)NMC(POH WPOF
64. Weighted Unplanned Outage Factor( WUOF)
100%NMC)(PH
)NMC(UOH WUOF
100%NMC)(PH
NMC])MOH[(FOH WUOF
65. Weighted Scheduled Outage Factor (WSOF)
100%NMC)(PH
)NMC(SOH WSOF
100%NMC)(PH
NMC])MOH[(POH WSOF
66. Weighted Unavailability Factor (WUF)
100%NMC)(PH
NMC])FOHMOH[(POH WUF
67. Weighted Availability Factor (WAF)
100%NMC)(PH
)NMC(AH WAF
68. Weighted Service Factor (WSF)
100%NMC)(PH
)NMC(SH WSF
69. Weighted Seasonal Derating Factor (WSEDF)
100%NMC)(PH
)NMC(ESEDH WSEDF
70. Weighted Unit Derating Factor (WUDF)
100%NMC)(PH
NMCEPDH)[(EUDH WUDF
]
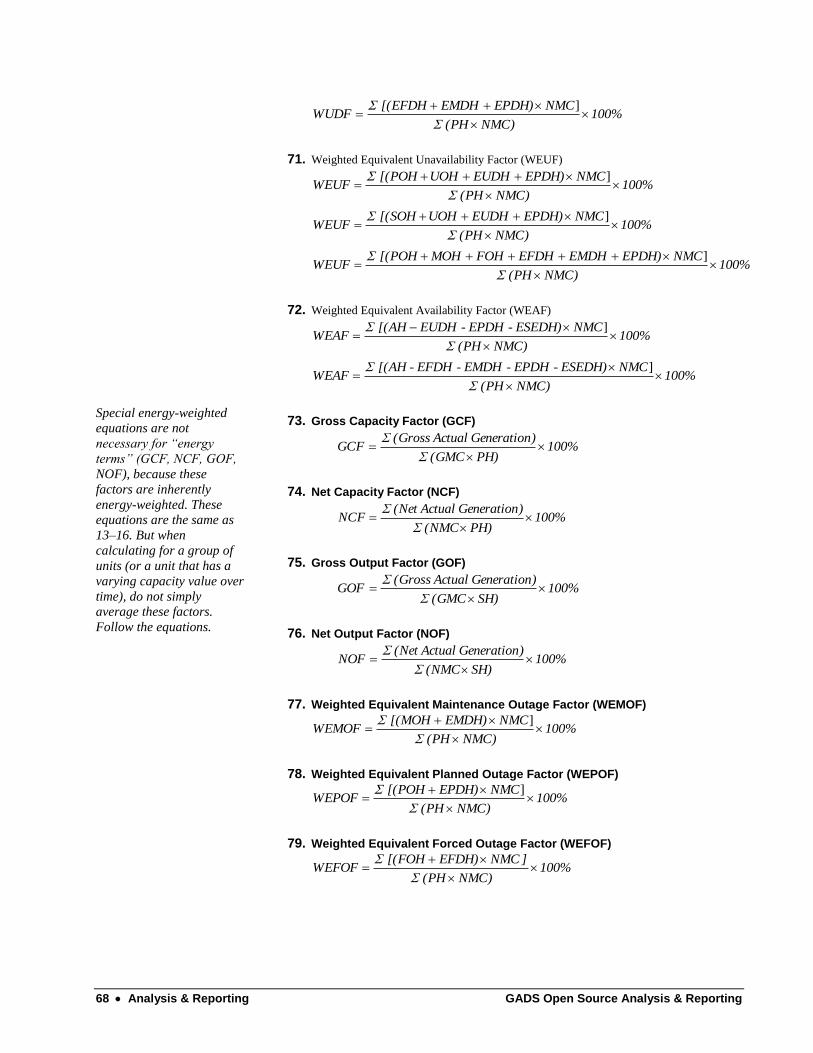
68 Analysis & Reporting GADS Open Source Analysis & Reporting
100%NMC)(PH
NMCEPDH)EMDH[(EFDH WUDF
]
71. Weighted Equivalent Unavailability Factor (WEUF)
100%NMC)(PH
NMCEPDH)EUDHUOH[(POH WEUF
]
100%NMC)(PH
NMCEPDH)EUDHUOH[(SOH WEUF
]
100%NMC)(PH
NMCEPDH)EMDHEFDHOHFMOH[(POH WEUF
]
72. Weighted Equivalent Availability Factor (WEAF)
100%NMC)(PH
NMCESEDH)-EPDH-EUDH[(AH WEAF
]
100%NMC)(PH
NMCESEDH)-EPDH-EMDH-EFDH-[(AH WEAF
]
Special energy-weighted
equations are not
necessary for “energy
terms” (GCF, NCF, GOF,
NOF), because these
factors are inherently
energy-weighted. These
equations are the same as
13–16. But when
calculating for a group of
units (or a unit that has a
varying capacity value over
time), do not simply
average these factors.
Follow the equations.
73. Gross Capacity Factor (GCF)
100%PH)(GMC Σ
)Generation Actual (Gross ΣGCF
74. Net Capacity Factor (NCF)
100%PH)(NMC Σ
)Generation Actual (Net ΣNCF
75. Gross Output Factor (GOF)
100%SH)(GMC Σ
)Generation Actual (Gross ΣGOF
76. Net Output Factor (NOF)
100%SH)(NMC Σ
)Generation Actual (Net ΣNOF
77. Weighted Equivalent Maintenance Outage Factor (WEMOF)
100%NMC)(PH
NMCEMDH)[(MOH WEMOF
]
78. Weighted Equivalent Planned Outage Factor (WEPOF)
100%NMC)(PH
NMCEPDH)[(POH WEPOF
]
79. Weighted Equivalent Forced Outage Factor (WEFOF)
100%NMC)(PH
]NMCEFDH)[(FOH WEFOF

GADS Open Source Analysis & Reporting Analysis & Reporting 69
80. Weighted Equivalent Scheduled Outage Factor (WESOF)
100%NMC)(PH
NMCESDH)[(SOH WESOF
]
100%NMC)(PH
NMC])EPDHEMDHPOH[(MOH WESOF
81. Weighted Equivalent Unplanned Outage Factor (WEUOF)
100%NMC)(PH
NMCEUDH)[(UOH WEUOF
]
100%NMC)(PH
NMC])EMDHEFDHFOH[(MOH WEUOF
NOTE: This is identical to the Weighted Unit Capability Loss Factor except
this equation includes all events, including those outside plant
management control.
82. Weighted Forced Outage Rate (WFOR)
100%NMC]Hours) PumpingHours SyncSH[(FOH
NMCFOHWFOR
)(
83. Weighted Forced Outage Rate demand (WFORd)
100%NMC]SH)[(FOHd
NMC)(FOHd ΣWFORd
where
FOHd = fx FOH
D
1
T
1
r
1
T
1
r
1
f
r = Average Forced outage duration = (FOH)/(# of FO occurrences)
D = Average demand time = (SH)/(# of unit actual starts)
T = Average reserve shutdown time = (RSH)/(# of unit attempted starts)
84. Weighted Equivalent Forced Outage Rate (WEFOR)
100%NMCEFDHRS)]Hours PumpingHours SyncSH[(FOH
NMCEFDHFOHEFOR
])[(
85. Weighted Equivalent Forced Outage Rate demand (WEFORd)
100%NMC]SH)[(FOHd
NMC]EFDHd)[(FOHd ΣWEFORd
where
FOHd = fx FOH
EFDHd = (EFDH – EFDHRS) if reserve shutdown events reported, or
= (fp × EFDH) if no reserve shutdown events reported
(an approximation)

70 Analysis & Reporting GADS Open Source Analysis & Reporting
D
1
T
1
r
1
T
1
r
1
f
AH
SHfp
r = Average Forced outage duration = (FOH)/(# of FO occurrences)
D = Average demand time = (SH)/(# of unit actual starts)
T = Average reserve shutdown time = (RSH)/(# of unit attempted starts)
86. Weighted Equivalent Planned Outage Rate (WEPOR)
100%NMC]EPDHRS)Hrs PumpHrs SyncSH[(POH
NMCEPDHPOHWEPOR
])[(
87. Weighted Equivalent Maintenance Outage Rate (WEMOR)
100%NMC]EMDHRS)Hrs PumpHrs SyncSH[(MOH
NMCEMDHMOHWEMOR
])[(
88. Weighted Equivalent Unplanned Outage Rate (WEUOR)
100%NMC]EUDHRS)Hrs PumpHrs SyncSH[(UOH
NMCEUDHUOHWEUOR
])[(
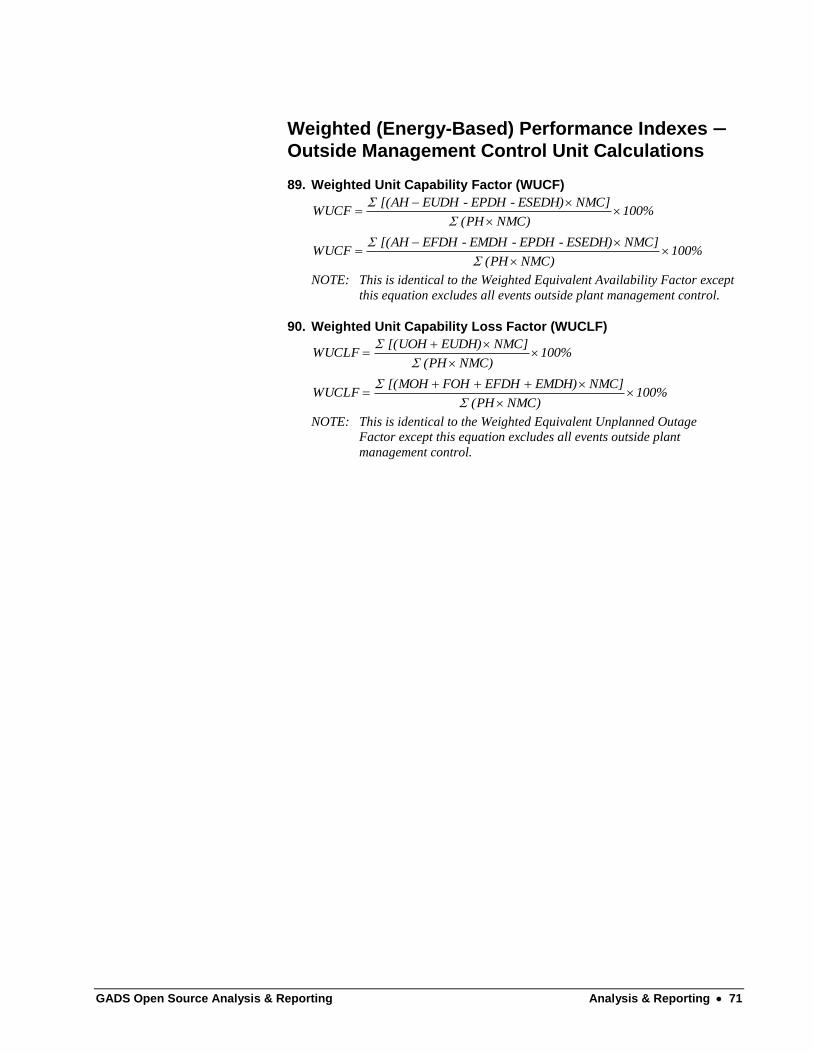
GADS Open Source Analysis & Reporting Analysis & Reporting 71
Weighted (Energy-Based) Performance Indexes —
Outside Management Control Unit Calculations
89. Weighted Unit Capability Factor (WUCF)
100%NMC)(PH
NMC]ESEDH)-EPDH-EUDH[(AH WUCF
100%NMC)(PH
NMC]ESEDH)-EPDH-EMDH-EFDH[(AH WUCF
NOTE: This is identical to the Weighted Equivalent Availability Factor except
this equation excludes all events outside plant management control.
90. Weighted Unit Capability Loss Factor (WUCLF)
100%NMC)(PH
NMC]EUDH)[(UOH WUCLF
100%NMC)(PH
NMC]EMDH)EFDHFOH[(MOH WUCLF
NOTE: This is identical to the Weighted Equivalent Unplanned Outage
Factor except this equation excludes all events outside plant
management control.
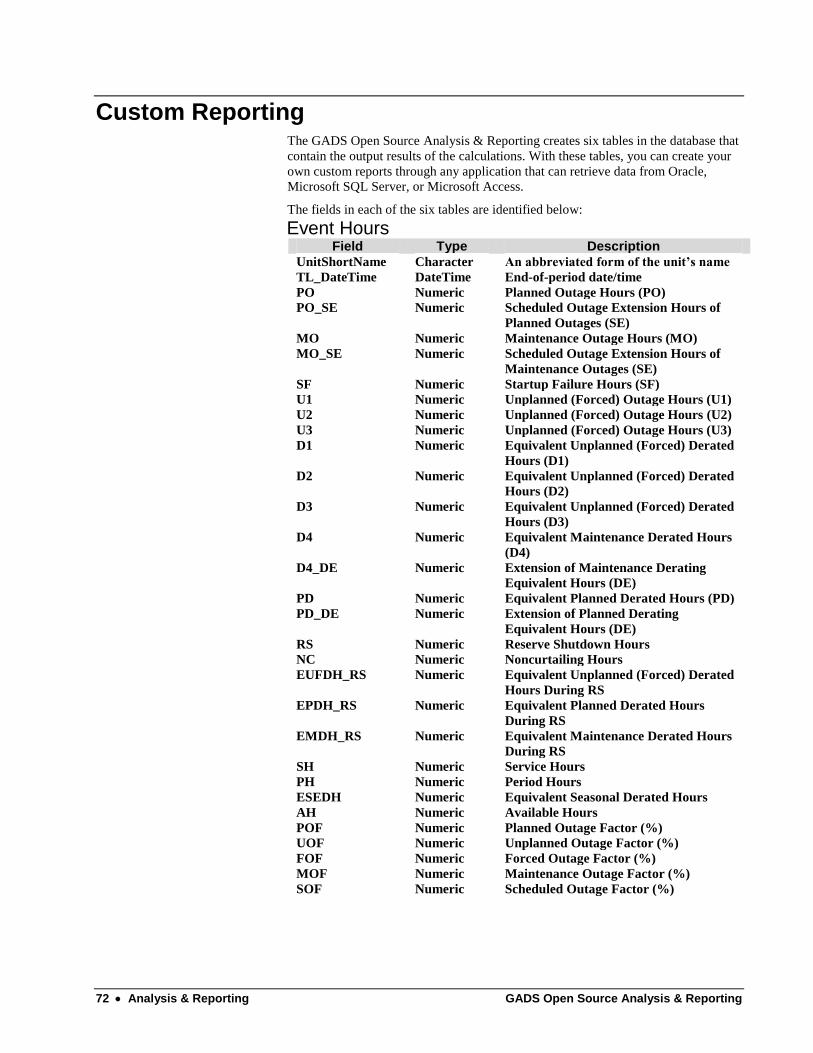
72 Analysis & Reporting GADS Open Source Analysis & Reporting
Custom Reporting The GADS Open Source Analysis & Reporting creates six tables in the database that
contain the output results of the calculations. With these tables, you can create your
own custom reports through any application that can retrieve data from Oracle,
Microsoft SQL Server, or Microsoft Access.
The fields in each of the six tables are identified below:
Event Hours Field Type Description
UnitShortName Character An abbreviated form of the unit’s name
TL_DateTime DateTime End-of-period date/time
PO Numeric Planned Outage Hours (PO)
PO_SE Numeric Scheduled Outage Extension Hours of
Planned Outages (SE)
MO Numeric Maintenance Outage Hours (MO)
MO_SE Numeric Scheduled Outage Extension Hours of
Maintenance Outages (SE)
SF Numeric Startup Failure Hours (SF)
U1 Numeric Unplanned (Forced) Outage Hours (U1)
U2 Numeric Unplanned (Forced) Outage Hours (U2)
U3 Numeric Unplanned (Forced) Outage Hours (U3)
D1 Numeric Equivalent Unplanned (Forced) Derated
Hours (D1)
D2 Numeric Equivalent Unplanned (Forced) Derated
Hours (D2)
D3 Numeric Equivalent Unplanned (Forced) Derated
Hours (D3)
D4 Numeric Equivalent Maintenance Derated Hours
(D4)
D4_DE Numeric Extension of Maintenance Derating
Equivalent Hours (DE)
PD Numeric Equivalent Planned Derated Hours (PD)
PD_DE Numeric Extension of Planned Derating
Equivalent Hours (DE)
RS Numeric Reserve Shutdown Hours
NC Numeric Noncurtailing Hours
EUFDH_RS Numeric Equivalent Unplanned (Forced) Derated
Hours During RS
EPDH_RS Numeric Equivalent Planned Derated Hours
During RS
EMDH_RS Numeric Equivalent Maintenance Derated Hours
During RS
SH Numeric Service Hours
PH Numeric Period Hours
ESEDH Numeric Equivalent Seasonal Derated Hours
AH Numeric Available Hours
POF Numeric Planned Outage Factor (%)
UOF Numeric Unplanned Outage Factor (%)
FOF Numeric Forced Outage Factor (%)
MOF Numeric Maintenance Outage Factor (%)
SOF Numeric Scheduled Outage Factor (%)
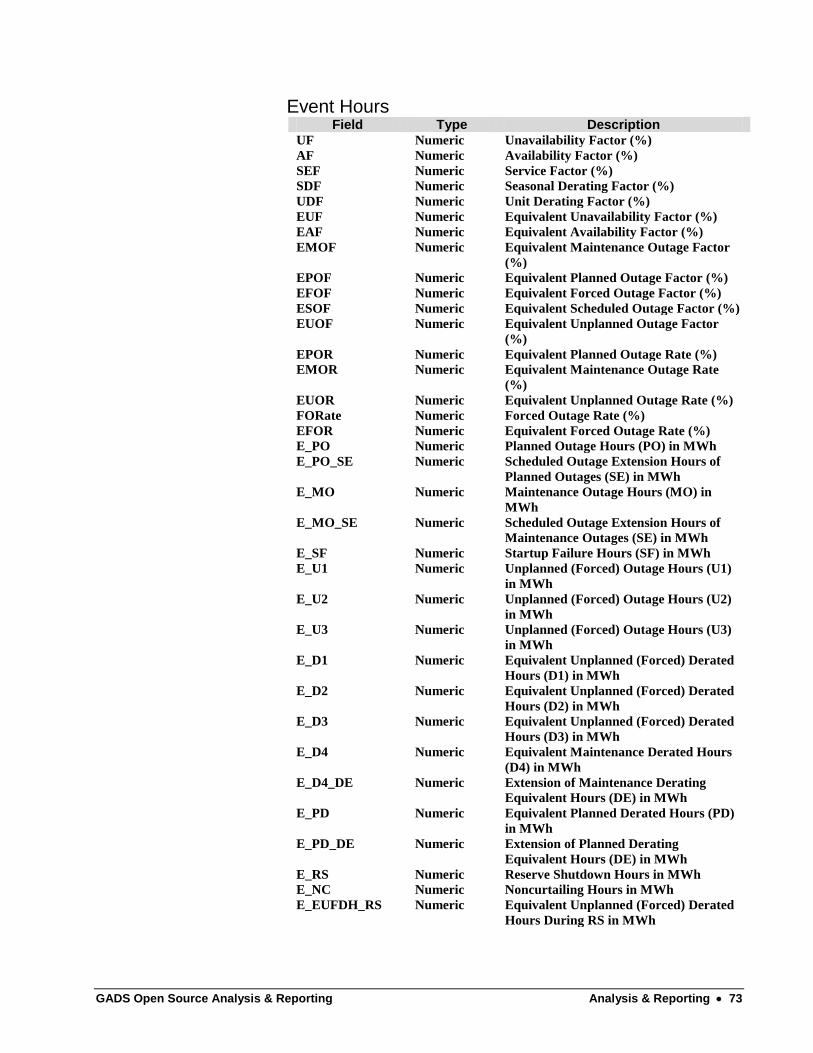
GADS Open Source Analysis & Reporting Analysis & Reporting 73
Event Hours Field Type Description
UF Numeric Unavailability Factor (%)
AF Numeric Availability Factor (%)
SEF Numeric Service Factor (%)
SDF Numeric Seasonal Derating Factor (%)
UDF Numeric Unit Derating Factor (%)
EUF Numeric Equivalent Unavailability Factor (%)
EAF Numeric Equivalent Availability Factor (%)
EMOF Numeric Equivalent Maintenance Outage Factor
(%)
EPOF Numeric Equivalent Planned Outage Factor (%)
EFOF Numeric Equivalent Forced Outage Factor (%)
ESOF Numeric Equivalent Scheduled Outage Factor (%)
EUOF Numeric Equivalent Unplanned Outage Factor
(%)
EPOR Numeric Equivalent Planned Outage Rate (%)
EMOR Numeric Equivalent Maintenance Outage Rate
(%)
EUOR Numeric Equivalent Unplanned Outage Rate (%)
FORate Numeric Forced Outage Rate (%)
EFOR Numeric Equivalent Forced Outage Rate (%)
E_PO Numeric Planned Outage Hours (PO) in MWh
E_PO_SE Numeric Scheduled Outage Extension Hours of
Planned Outages (SE) in MWh
E_MO Numeric Maintenance Outage Hours (MO) in
MWh
E_MO_SE Numeric Scheduled Outage Extension Hours of
Maintenance Outages (SE) in MWh
E_SF Numeric Startup Failure Hours (SF) in MWh
E_U1 Numeric Unplanned (Forced) Outage Hours (U1)
in MWh
E_U2 Numeric Unplanned (Forced) Outage Hours (U2)
in MWh
E_U3 Numeric Unplanned (Forced) Outage Hours (U3)
in MWh
E_D1 Numeric Equivalent Unplanned (Forced) Derated
Hours (D1) in MWh
E_D2 Numeric Equivalent Unplanned (Forced) Derated
Hours (D2) in MWh
E_D3 Numeric Equivalent Unplanned (Forced) Derated
Hours (D3) in MWh
E_D4 Numeric Equivalent Maintenance Derated Hours
(D4) in MWh
E_D4_DE Numeric Extension of Maintenance Derating
Equivalent Hours (DE) in MWh
E_PD Numeric Equivalent Planned Derated Hours (PD)
in MWh
E_PD_DE Numeric Extension of Planned Derating
Equivalent Hours (DE) in MWh
E_RS Numeric Reserve Shutdown Hours in MWh
E_NC Numeric Noncurtailing Hours in MWh
E_EUFDH_RS Numeric Equivalent Unplanned (Forced) Derated
Hours During RS in MWh
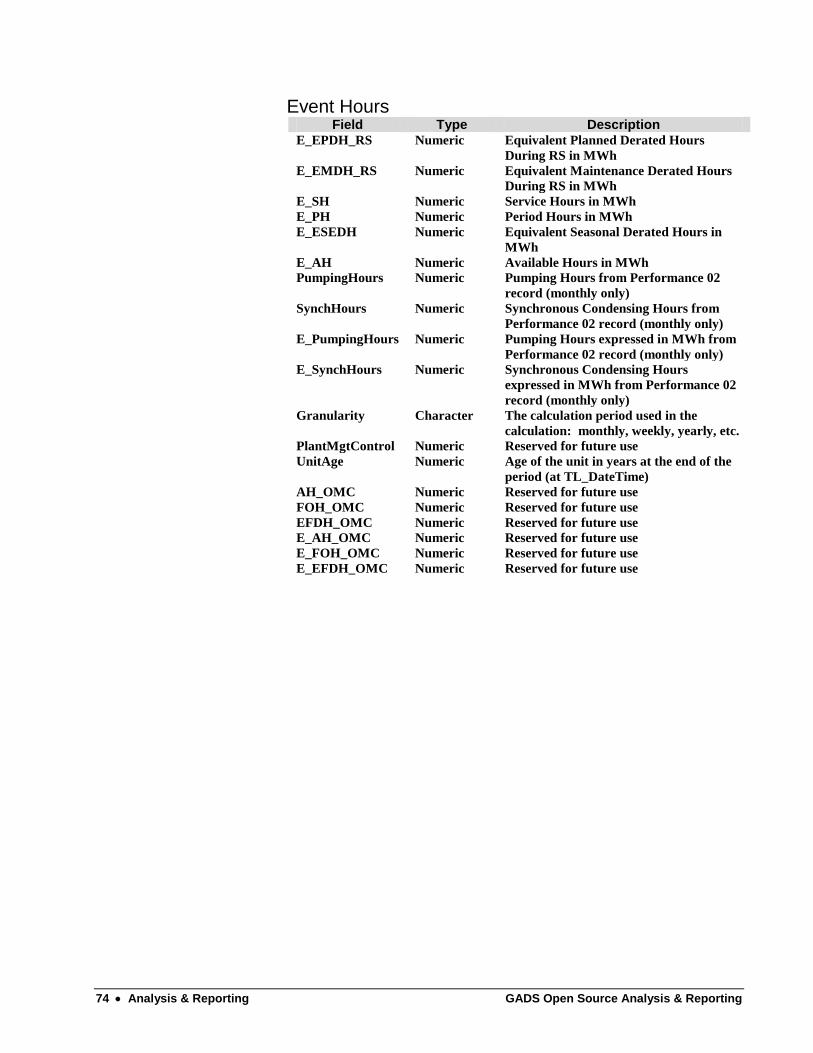
74 Analysis & Reporting GADS Open Source Analysis & Reporting
Event Hours Field Type Description
E_EPDH_RS Numeric Equivalent Planned Derated Hours
During RS in MWh
E_EMDH_RS Numeric Equivalent Maintenance Derated Hours
During RS in MWh
E_SH Numeric Service Hours in MWh
E_PH Numeric Period Hours in MWh
E_ESEDH Numeric Equivalent Seasonal Derated Hours in
MWh
E_AH Numeric Available Hours in MWh
PumpingHours Numeric Pumping Hours from Performance 02
record (monthly only)
SynchHours Numeric Synchronous Condensing Hours from
Performance 02 record (monthly only)
E_PumpingHours Numeric Pumping Hours expressed in MWh from
Performance 02 record (monthly only)
E_SynchHours Numeric Synchronous Condensing Hours
expressed in MWh from Performance 02
record (monthly only)
Granularity Character The calculation period used in the
calculation: monthly, weekly, yearly, etc.
PlantMgtControl Numeric Reserved for future use
UnitAge Numeric Age of the unit in years at the end of the
period (at TL_DateTime)
AH_OMC Numeric Reserved for future use
FOH_OMC Numeric Reserved for future use
EFDH_OMC Numeric Reserved for future use
E_AH_OMC Numeric Reserved for future use
E_FOH_OMC Numeric Reserved for future use
E_EFDH_OMC Numeric Reserved for future use

GADS Open Source Analysis & Reporting Analysis & Reporting 75
Event Details
Field Type Description UnitShortName Character An abbreviated form of the unit’s name
UtilityUnitCode Character Unit’s NERC-assigned Utility Unit Code
(6 characters)
EventNumber Numeric Event Number
EventType Character Event Type
TL_DateTime DateTime End-of-period date/time
ContribCode Numeric Event Contribution Code (modified for
sort)
EventContribCode Numeric Event Contribution Code
EquipGroupName Character Cause Code Group Name
CauseCode Numeric System/Component Cause Code
CauseCodeExt Character System/Component Cause Code
Extension
CalcHours Numeric Event Duration – Calculated Hours
EquivHours Numeric Event Duration – Equivalent Hours
EV_DateTime DateTime Start of Event Date/Time
EquivMWh Numeric Equivalent Megawatt Hours
EUFDH_RS Numeric Equivalent Unplanned (Forced) Derated
Hours during Reserve Shutdown (for D1,
D2, and D3 only)
E_EUFDH_RS Numeric Equivalent Unplanned (Forced) Derated
Hours during Reserve Shutdown in MWh
(for D1, D2, and D3 only)
EPDH_RS Numeric Equivalent Planned Derated Hours
during Reserve Shutdown (for D1, D2,
and D3 only)
E_EPDH_RS Numeric Equivalent Planned Derated Hours
during Reserve Shutdown in MWh (for
D1, D2, and D3 only)
EMDH_RS Numeric Equivalent Maintenance Derated Hours
during Reserve Shutdown (for D1, D2,
and D3 only)
E_EMDH_RS Numeric Equivalent Maintenance Derated Hours
during Reserve Shutdown in MWh (for
D1, D2, and D3 only)
ExtensionType Character If the EventType field is an SE or DE,
then this is a PO, MO, PD, or D4
LFilter Logical Internal; not normally used outside
program
Granularity Character The calculation period used in the
calculation: monthly, weekly, yearly, etc.
PlantMgtControl Numeric Reserved for future use
PJMIOCode Character Reserved for future use
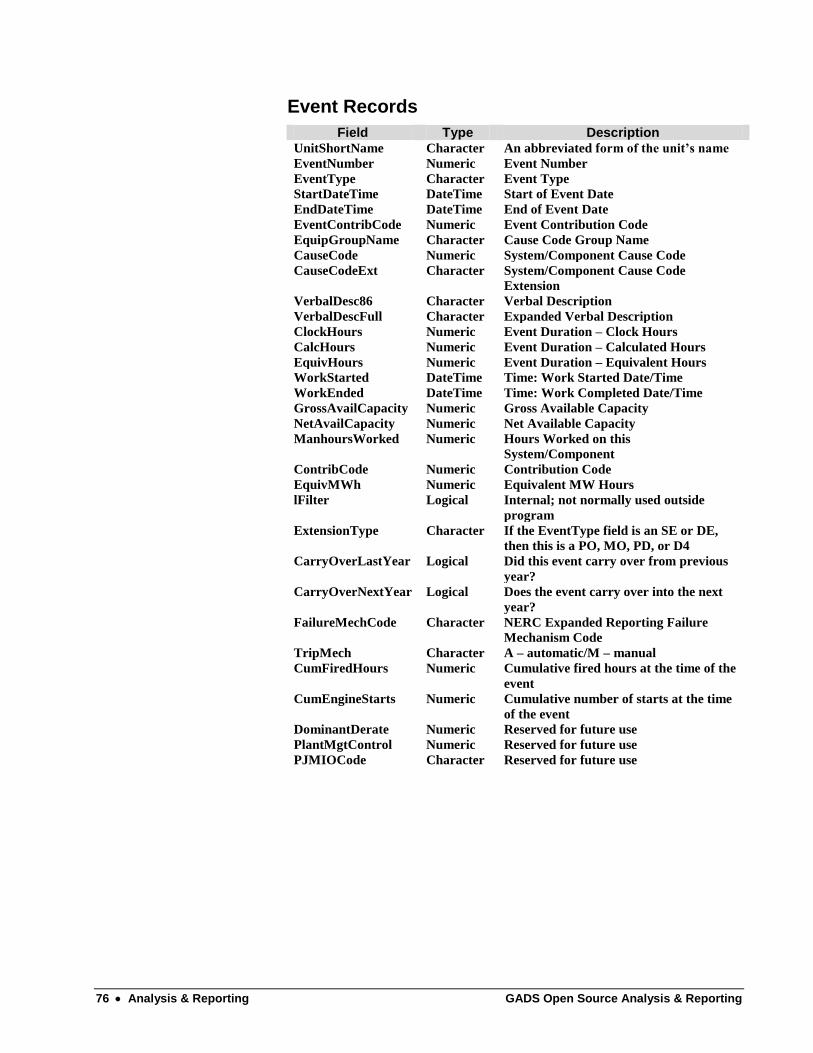
76 Analysis & Reporting GADS Open Source Analysis & Reporting
Event Records
Field Type Description UnitShortName Character An abbreviated form of the unit’s name
EventNumber Numeric Event Number
EventType Character Event Type
StartDateTime DateTime Start of Event Date
EndDateTime DateTime End of Event Date
EventContribCode Numeric Event Contribution Code
EquipGroupName Character Cause Code Group Name
CauseCode Numeric System/Component Cause Code
CauseCodeExt Character System/Component Cause Code
Extension
VerbalDesc86 Character Verbal Description
VerbalDescFull Character Expanded Verbal Description
ClockHours Numeric Event Duration – Clock Hours
CalcHours Numeric Event Duration – Calculated Hours
EquivHours Numeric Event Duration – Equivalent Hours
WorkStarted DateTime Time: Work Started Date/Time
WorkEnded DateTime Time: Work Completed Date/Time
GrossAvailCapacity Numeric Gross Available Capacity
NetAvailCapacity Numeric Net Available Capacity
ManhoursWorked Numeric Hours Worked on this
System/Component
ContribCode Numeric Contribution Code
EquivMWh Numeric Equivalent MW Hours
lFilter Logical Internal; not normally used outside
program
ExtensionType Character If the EventType field is an SE or DE,
then this is a PO, MO, PD, or D4
CarryOverLastYear Logical Did this event carry over from previous
year?
CarryOverNextYear Logical Does the event carry over into the next
year?
FailureMechCode Character NERC Expanded Reporting Failure
Mechanism Code
TripMech Character A – automatic/M – manual
CumFiredHours Numeric Cumulative fired hours at the time of the
event
CumEngineStarts Numeric Cumulative number of starts at the time
of the event
DominantDerate Numeric Reserved for future use
PlantMgtControl Numeric Reserved for future use
PJMIOCode Character Reserved for future use
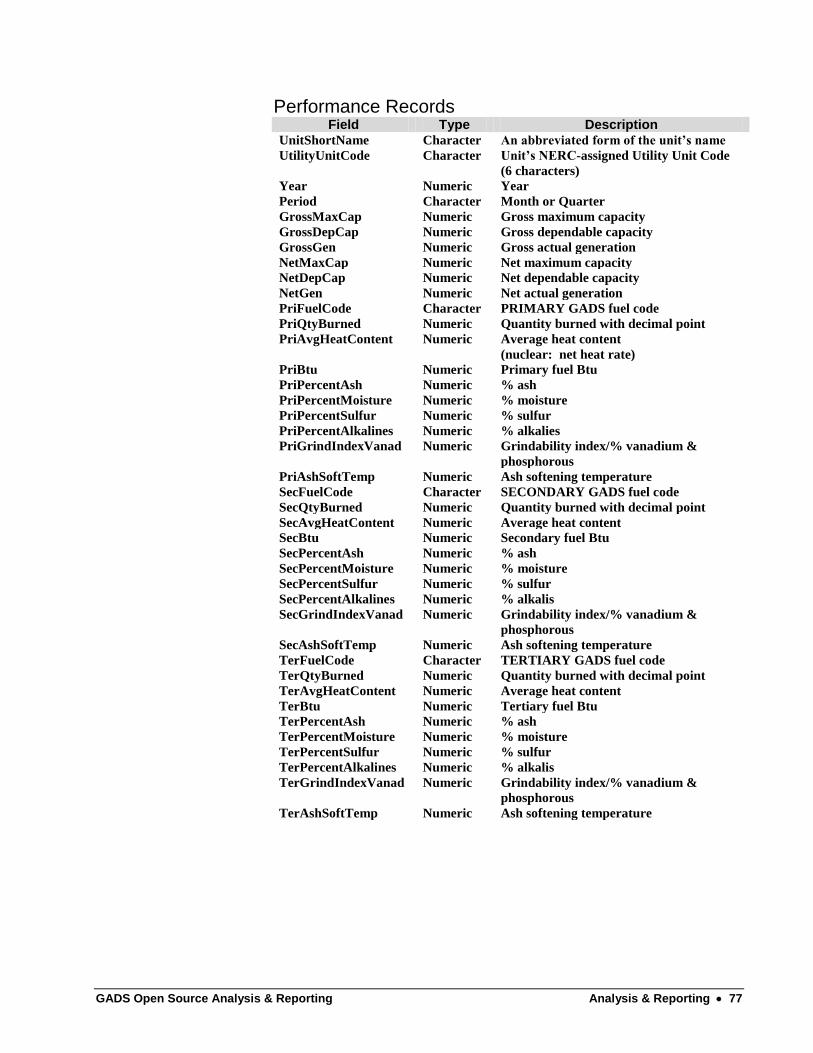
GADS Open Source Analysis & Reporting Analysis & Reporting 77
Performance Records Field Type Description
UnitShortName Character An abbreviated form of the unit’s name
UtilityUnitCode Character Unit’s NERC-assigned Utility Unit Code
(6 characters)
Year Numeric Year
Period Character Month or Quarter
GrossMaxCap Numeric Gross maximum capacity
GrossDepCap Numeric Gross dependable capacity
GrossGen Numeric Gross actual generation
NetMaxCap Numeric Net maximum capacity
NetDepCap Numeric Net dependable capacity
NetGen Numeric Net actual generation
PriFuelCode Character PRIMARY GADS fuel code
PriQtyBurned Numeric Quantity burned with decimal point
PriAvgHeatContent Numeric Average heat content
(nuclear: net heat rate)
PriBtu Numeric Primary fuel Btu
PriPercentAsh Numeric % ash
PriPercentMoisture Numeric % moisture
PriPercentSulfur Numeric % sulfur
PriPercentAlkalines Numeric % alkalies
PriGrindIndexVanad Numeric Grindability index/% vanadium &
phosphorous
PriAshSoftTemp Numeric Ash softening temperature
SecFuelCode Character SECONDARY GADS fuel code
SecQtyBurned Numeric Quantity burned with decimal point
SecAvgHeatContent Numeric Average heat content
SecBtu Numeric Secondary fuel Btu
SecPercentAsh Numeric % ash
SecPercentMoisture Numeric % moisture
SecPercentSulfur Numeric % sulfur
SecPercentAlkalines Numeric % alkalis
SecGrindIndexVanad Numeric Grindability index/% vanadium &
phosphorous
SecAshSoftTemp Numeric Ash softening temperature
TerFuelCode Character TERTIARY GADS fuel code
TerQtyBurned Numeric Quantity burned with decimal point
TerAvgHeatContent Numeric Average heat content
TerBtu Numeric Tertiary fuel Btu
TerPercentAsh Numeric % ash
TerPercentMoisture Numeric % moisture
TerPercentSulfur Numeric % sulfur
TerPercentAlkalines Numeric % alkalis
TerGrindIndexVanad Numeric Grindability index/% vanadium &
phosphorous
TerAshSoftTemp Numeric Ash softening temperature
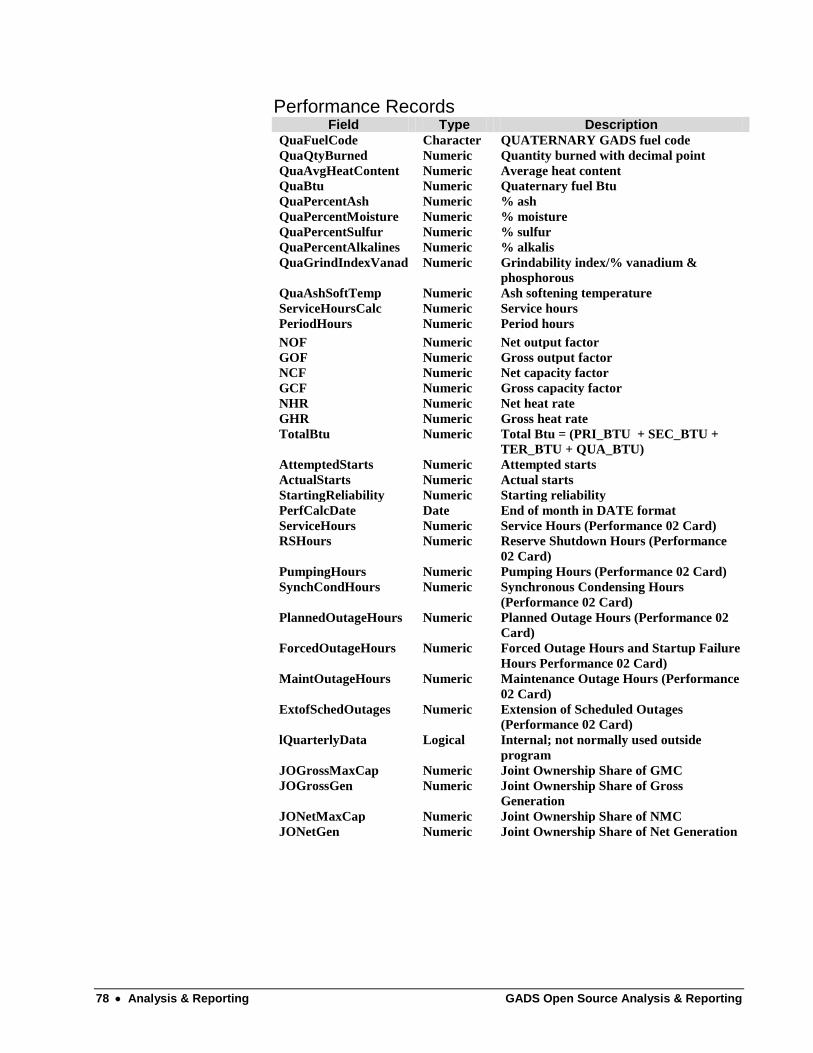
78 Analysis & Reporting GADS Open Source Analysis & Reporting
Performance Records Field Type Description
QuaFuelCode Character QUATERNARY GADS fuel code
QuaQtyBurned Numeric Quantity burned with decimal point
QuaAvgHeatContent Numeric Average heat content
QuaBtu Numeric Quaternary fuel Btu
QuaPercentAsh Numeric % ash
QuaPercentMoisture Numeric % moisture
QuaPercentSulfur Numeric % sulfur
QuaPercentAlkalines Numeric % alkalis
QuaGrindIndexVanad Numeric Grindability index/% vanadium &
phosphorous
QuaAshSoftTemp Numeric Ash softening temperature
ServiceHoursCalc Numeric Service hours
PeriodHours Numeric Period hours
NOF Numeric Net output factor
GOF Numeric Gross output factor
NCF Numeric Net capacity factor
GCF Numeric Gross capacity factor
NHR Numeric Net heat rate
GHR Numeric Gross heat rate
TotalBtu Numeric Total Btu = (PRI_BTU + SEC_BTU +
TER_BTU + QUA_BTU)
AttemptedStarts Numeric Attempted starts
ActualStarts Numeric Actual starts
StartingReliability Numeric Starting reliability
PerfCalcDate Date End of month in DATE format
ServiceHours Numeric Service Hours (Performance 02 Card)
RSHours Numeric Reserve Shutdown Hours (Performance
02 Card)
PumpingHours Numeric Pumping Hours (Performance 02 Card)
SynchCondHours Numeric Synchronous Condensing Hours
(Performance 02 Card)
PlannedOutageHours Numeric Planned Outage Hours (Performance 02
Card)
ForcedOutageHours Numeric Forced Outage Hours and Startup Failure
Hours Performance 02 Card)
MaintOutageHours Numeric Maintenance Outage Hours (Performance
02 Card)
ExtofSchedOutages Numeric Extension of Scheduled Outages
(Performance 02 Card)
lQuarterlyData Logical Internal; not normally used outside
program
JOGrossMaxCap Numeric Joint Ownership Share of GMC
JOGrossGen Numeric Joint Ownership Share of Gross
Generation
JONetMaxCap Numeric Joint Ownership Share of NMC
JONetGen Numeric Joint Ownership Share of Net Generation
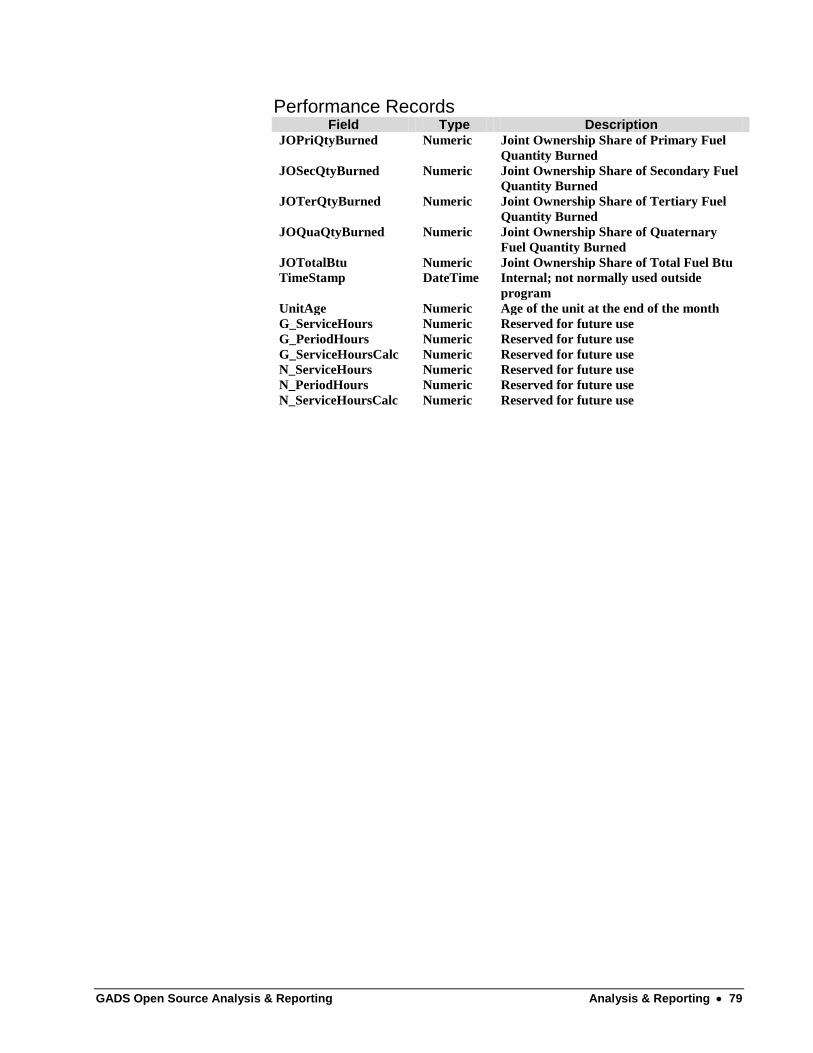
GADS Open Source Analysis & Reporting Analysis & Reporting 79
Performance Records Field Type Description
JOPriQtyBurned Numeric Joint Ownership Share of Primary Fuel
Quantity Burned
JOSecQtyBurned Numeric Joint Ownership Share of Secondary Fuel
Quantity Burned
JOTerQtyBurned Numeric Joint Ownership Share of Tertiary Fuel
Quantity Burned
JOQuaQtyBurned Numeric Joint Ownership Share of Quaternary
Fuel Quantity Burned
JOTotalBtu Numeric Joint Ownership Share of Total Fuel Btu
TimeStamp DateTime Internal; not normally used outside
program
UnitAge Numeric Age of the unit at the end of the month
G_ServiceHours Numeric Reserved for future use
G_PeriodHours Numeric Reserved for future use
G_ServiceHoursCalc Numeric Reserved for future use
N_ServiceHours Numeric Reserved for future use
N_PeriodHours Numeric Reserved for future use
N_ServiceHoursCalc Numeric Reserved for future use
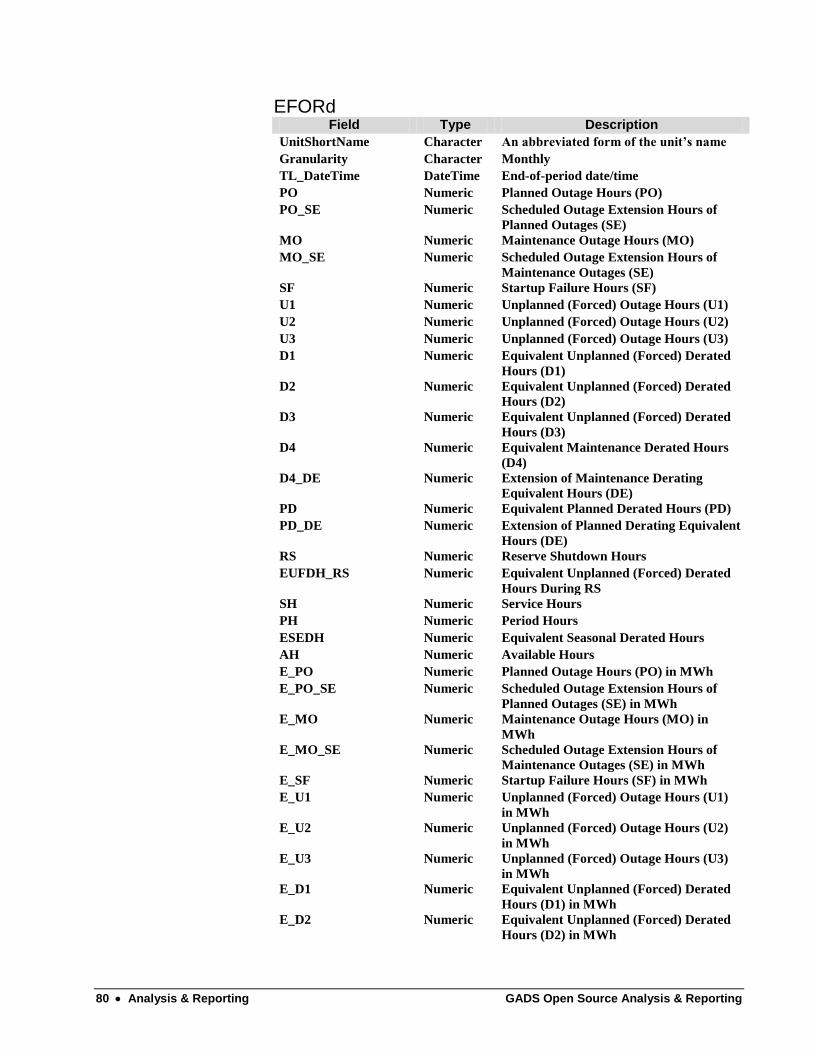
80 Analysis & Reporting GADS Open Source Analysis & Reporting
EFORd Field Type Description
UnitShortName Character An abbreviated form of the unit’s name
Granularity Character Monthly
TL_DateTime DateTime End-of-period date/time
PO Numeric Planned Outage Hours (PO)
PO_SE Numeric Scheduled Outage Extension Hours of
Planned Outages (SE)
MO Numeric Maintenance Outage Hours (MO)
MO_SE Numeric Scheduled Outage Extension Hours of
Maintenance Outages (SE)
SF Numeric Startup Failure Hours (SF)
U1 Numeric Unplanned (Forced) Outage Hours (U1)
U2 Numeric Unplanned (Forced) Outage Hours (U2)
U3 Numeric Unplanned (Forced) Outage Hours (U3)
D1 Numeric Equivalent Unplanned (Forced) Derated
Hours (D1)
D2 Numeric Equivalent Unplanned (Forced) Derated
Hours (D2)
D3 Numeric Equivalent Unplanned (Forced) Derated
Hours (D3)
D4 Numeric Equivalent Maintenance Derated Hours
(D4)
D4_DE Numeric Extension of Maintenance Derating
Equivalent Hours (DE)
PD Numeric Equivalent Planned Derated Hours (PD)
PD_DE Numeric Extension of Planned Derating Equivalent
Hours (DE)
RS Numeric Reserve Shutdown Hours
EUFDH_RS Numeric Equivalent Unplanned (Forced) Derated
Hours During RS
SH Numeric Service Hours
PH Numeric Period Hours
ESEDH Numeric Equivalent Seasonal Derated Hours
AH Numeric Available Hours
E_PO Numeric Planned Outage Hours (PO) in MWh
E_PO_SE Numeric Scheduled Outage Extension Hours of
Planned Outages (SE) in MWh
E_MO Numeric Maintenance Outage Hours (MO) in
MWh
E_MO_SE Numeric Scheduled Outage Extension Hours of
Maintenance Outages (SE) in MWh
E_SF Numeric Startup Failure Hours (SF) in MWh
E_U1 Numeric Unplanned (Forced) Outage Hours (U1)
in MWh
E_U2 Numeric Unplanned (Forced) Outage Hours (U2)
in MWh
E_U3 Numeric Unplanned (Forced) Outage Hours (U3)
in MWh
E_D1 Numeric Equivalent Unplanned (Forced) Derated
Hours (D1) in MWh
E_D2 Numeric Equivalent Unplanned (Forced) Derated
Hours (D2) in MWh
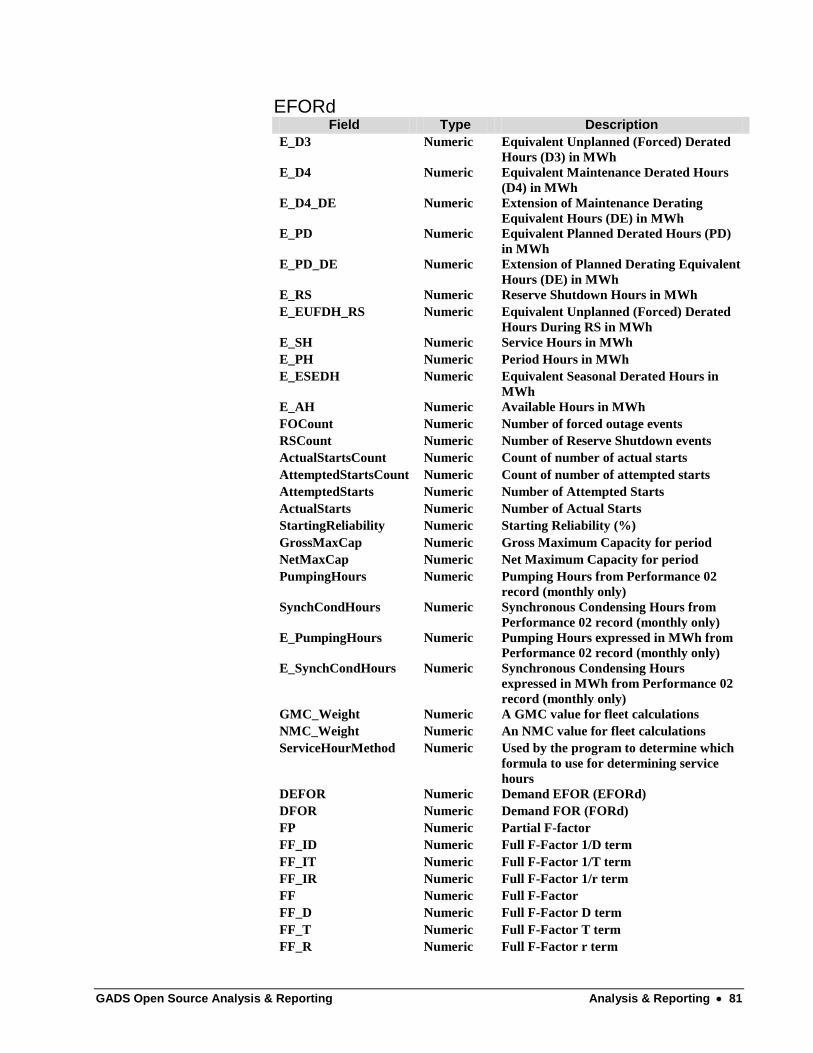
GADS Open Source Analysis & Reporting Analysis & Reporting 81
EFORd Field Type Description
E_D3 Numeric Equivalent Unplanned (Forced) Derated
Hours (D3) in MWh
E_D4 Numeric Equivalent Maintenance Derated Hours
(D4) in MWh
E_D4_DE Numeric Extension of Maintenance Derating
Equivalent Hours (DE) in MWh
E_PD Numeric Equivalent Planned Derated Hours (PD)
in MWh
E_PD_DE Numeric Extension of Planned Derating Equivalent
Hours (DE) in MWh
E_RS Numeric Reserve Shutdown Hours in MWh
E_EUFDH_RS Numeric Equivalent Unplanned (Forced) Derated
Hours During RS in MWh
E_SH Numeric Service Hours in MWh
E_PH Numeric Period Hours in MWh
E_ESEDH Numeric Equivalent Seasonal Derated Hours in
MWh
E_AH Numeric Available Hours in MWh
FOCount Numeric Number of forced outage events
RSCount Numeric Number of Reserve Shutdown events
ActualStartsCount Numeric Count of number of actual starts
AttemptedStartsCount Numeric Count of number of attempted starts
AttemptedStarts Numeric Number of Attempted Starts
ActualStarts Numeric Number of Actual Starts
StartingReliability Numeric Starting Reliability (%)
GrossMaxCap Numeric Gross Maximum Capacity for period
NetMaxCap Numeric Net Maximum Capacity for period
PumpingHours Numeric Pumping Hours from Performance 02
record (monthly only)
SynchCondHours Numeric Synchronous Condensing Hours from
Performance 02 record (monthly only)
E_PumpingHours Numeric Pumping Hours expressed in MWh from
Performance 02 record (monthly only)
E_SynchCondHours Numeric Synchronous Condensing Hours
expressed in MWh from Performance 02
record (monthly only)
GMC_Weight Numeric A GMC value for fleet calculations
NMC_Weight Numeric An NMC value for fleet calculations
ServiceHourMethod Numeric Used by the program to determine which
formula to use for determining service
hours
DEFOR Numeric Demand EFOR (EFORd)
DFOR Numeric Demand FOR (FORd)
FP Numeric Partial F-factor
FF_ID Numeric Full F-Factor 1/D term
FF_IT Numeric Full F-Factor 1/T term
FF_IR Numeric Full F-Factor 1/r term
FF Numeric Full F-Factor
FF_D Numeric Full F-Factor D term
FF_T Numeric Full F-Factor T term
FF_R Numeric Full F-Factor r term
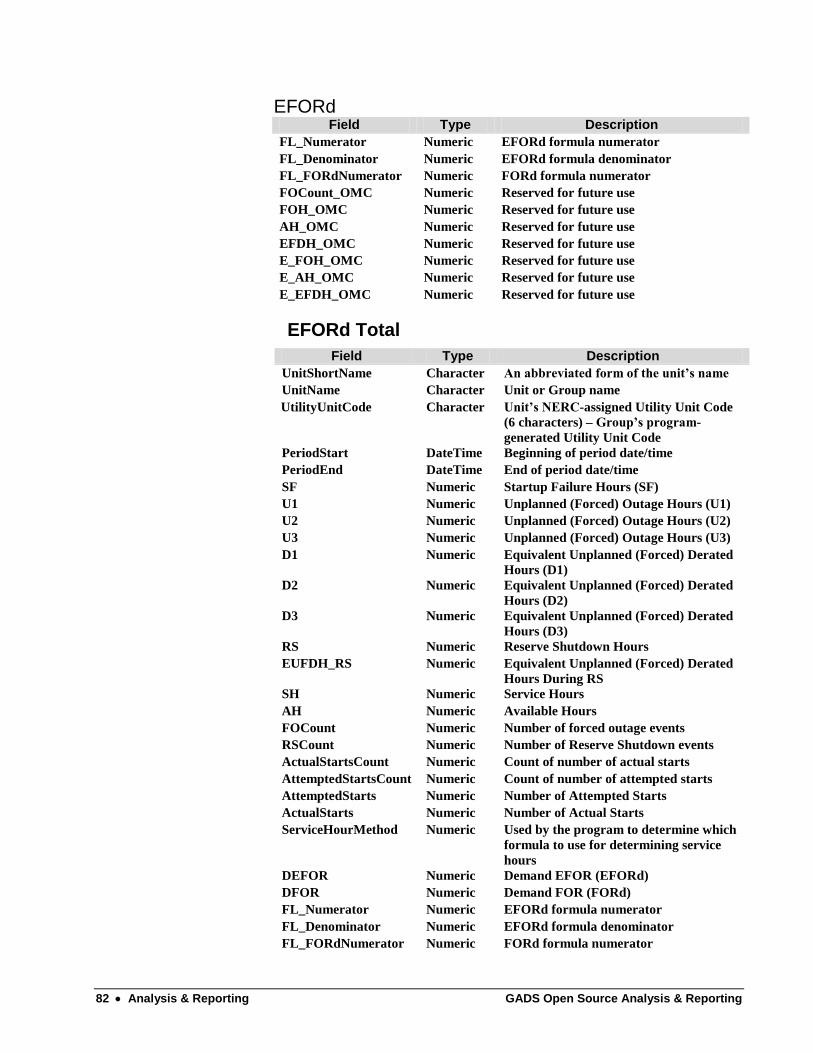
82 Analysis & Reporting GADS Open Source Analysis & Reporting
EFORd Field Type Description
FL_Numerator Numeric EFORd formula numerator
FL_Denominator Numeric EFORd formula denominator
FL_FORdNumerator Numeric FORd formula numerator
FOCount_OMC Numeric Reserved for future use
FOH_OMC Numeric Reserved for future use
AH_OMC Numeric Reserved for future use
EFDH_OMC Numeric Reserved for future use
E_FOH_OMC Numeric Reserved for future use
E_AH_OMC Numeric Reserved for future use
E_EFDH_OMC Numeric Reserved for future use
EFORd Total
Field Type Description
UnitShortName Character An abbreviated form of the unit’s name
UnitName Character Unit or Group name
UtilityUnitCode Character Unit’s NERC-assigned Utility Unit Code
(6 characters) – Group’s program-
generated Utility Unit Code
PeriodStart DateTime Beginning of period date/time
PeriodEnd DateTime End of period date/time
SF Numeric Startup Failure Hours (SF)
U1 Numeric Unplanned (Forced) Outage Hours (U1)
U2 Numeric Unplanned (Forced) Outage Hours (U2)
U3 Numeric Unplanned (Forced) Outage Hours (U3)
D1 Numeric Equivalent Unplanned (Forced) Derated
Hours (D1)
D2 Numeric Equivalent Unplanned (Forced) Derated
Hours (D2)
D3 Numeric Equivalent Unplanned (Forced) Derated
Hours (D3)
RS Numeric Reserve Shutdown Hours
EUFDH_RS Numeric Equivalent Unplanned (Forced) Derated
Hours During RS
SH Numeric Service Hours
AH Numeric Available Hours
FOCount Numeric Number of forced outage events
RSCount Numeric Number of Reserve Shutdown events
ActualStartsCount Numeric Count of number of actual starts
AttemptedStartsCount Numeric Count of number of attempted starts
AttemptedStarts Numeric Number of Attempted Starts
ActualStarts Numeric Number of Actual Starts
ServiceHourMethod Numeric Used by the program to determine which
formula to use for determining service
hours
DEFOR Numeric Demand EFOR (EFORd)
DFOR Numeric Demand FOR (FORd)
FL_Numerator Numeric EFORd formula numerator
FL_Denominator Numeric EFORd formula denominator
FL_FORdNumerator Numeric FORd formula numerator

GADS Open Source Analysis & Reporting Analysis & Reporting 83
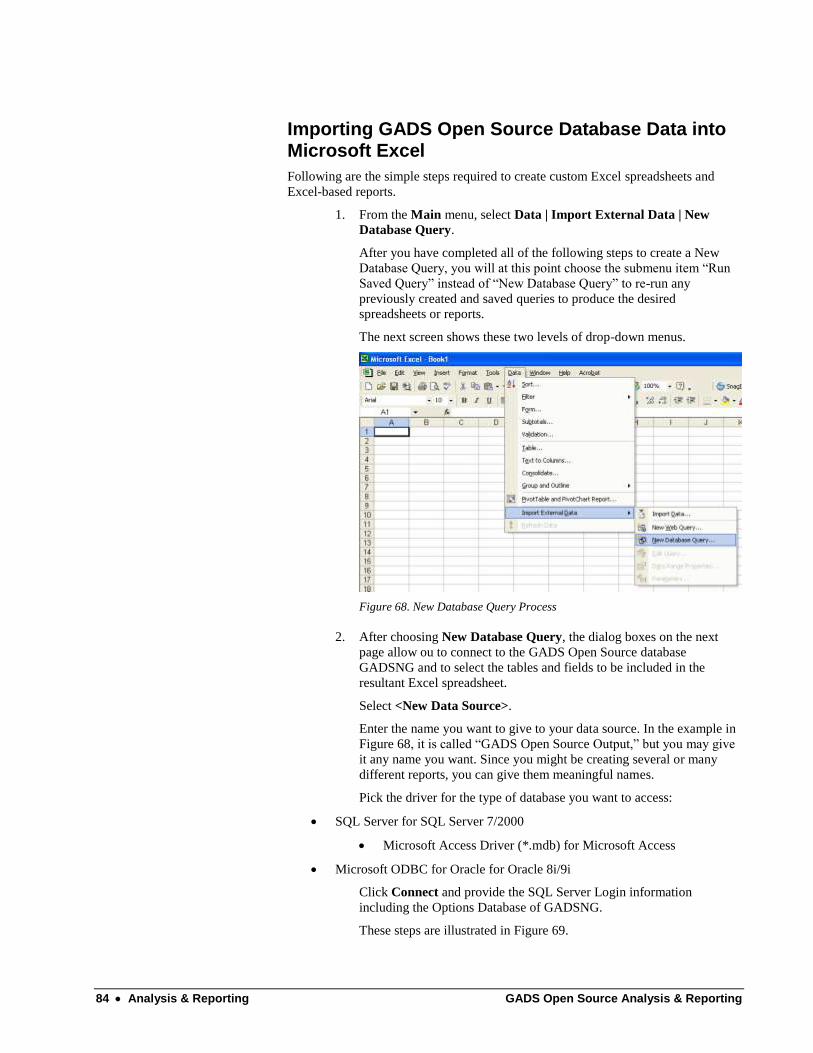
84 Analysis & Reporting GADS Open Source Analysis & Reporting
Importing GADS Open Source Database Data into Microsoft Excel
Following are the simple steps required to create custom Excel spreadsheets and
Excel-based reports.
1. From the Main menu, select Data | Import External Data | New
Database Query.
After you have completed all of the following steps to create a New
Database Query, you will at this point choose the submenu item ―Run
Saved Query‖ instead of ―New Database Query‖ to re-run any
previously created and saved queries to produce the desired
spreadsheets or reports.
The next screen shows these two levels of drop-down menus.
Figure 68. New Database Query Process
2. After choosing New Database Query, the dialog boxes on the next
page allow ou to connect to the GADS Open Source database
GADSNG and to select the tables and fields to be included in the
resultant Excel spreadsheet.
Select <New Data Source>.
Enter the name you want to give to your data source. In the example in
Figure 68, it is called ―GADS Open Source Output,‖ but you may give
it any name you want. Since you might be creating several or many
different reports, you can give them meaningful names.
Pick the driver for the type of database you want to access:
SQL Server for SQL Server 7/2000
Microsoft Access Driver (*.mdb) for Microsoft Access
Microsoft ODBC for Oracle for Oracle 8i/9i
Click Connect and provide the SQL Server Login information
including the Options Database of GADSNG.
These steps are illustrated in Figure 69.
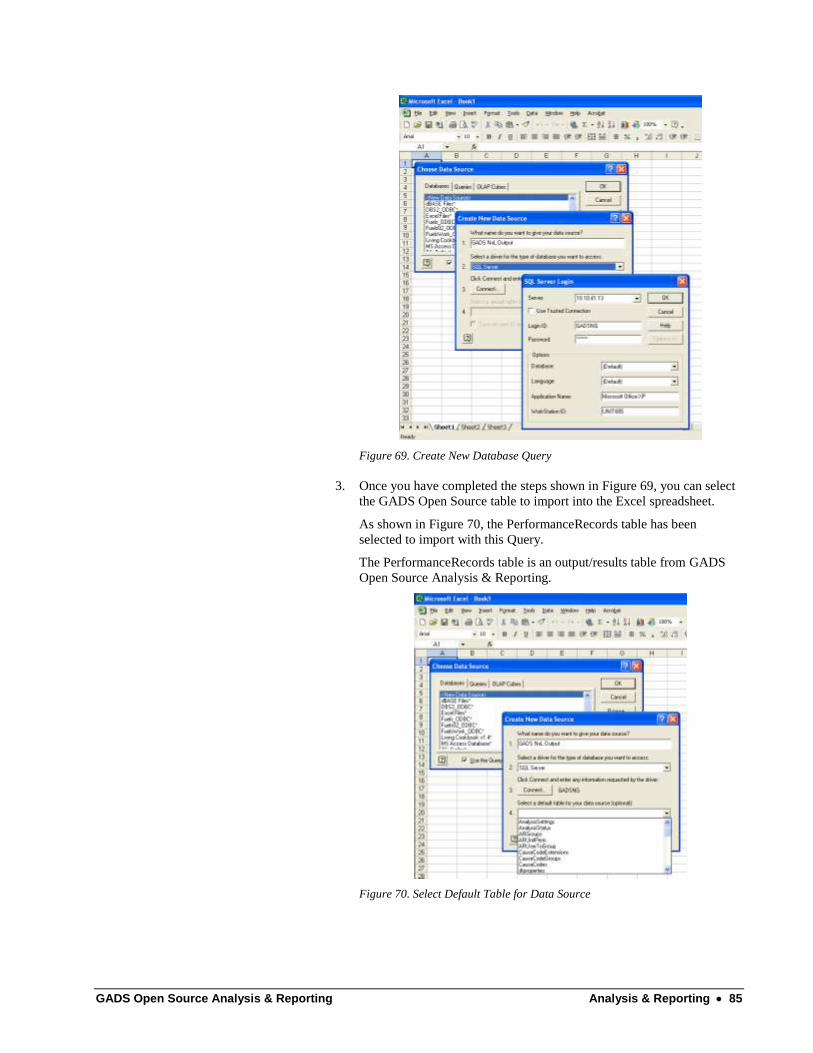
GADS Open Source Analysis & Reporting Analysis & Reporting 85
Figure 69. Create New Database Query
3. Once you have completed the steps shown in Figure 69, you can select
the GADS Open Source table to import into the Excel spreadsheet.
As shown in Figure 70, the PerformanceRecords table has been
selected to import with this Query.
The PerformanceRecords table is an output/results table from GADS
Open Source Analysis & Reporting.
Figure 70. Select Default Table for Data Source

86 Analysis & Reporting GADS Open Source Analysis & Reporting
Figure 71. Select Default Table for Data Source Example
Figure 72. Select Data Source
4. The steps above create a New Data Source that becomes an available
source of data for importing into Excel.
This completes the query setup, and you can now open the ―GADS
Open Source Output‖ directly with having to repeat the steps each time.
Continue with the Query Wizard to choose the columns from the
PerformanceRecords table that you want to include in the Excel
spreadsheet.
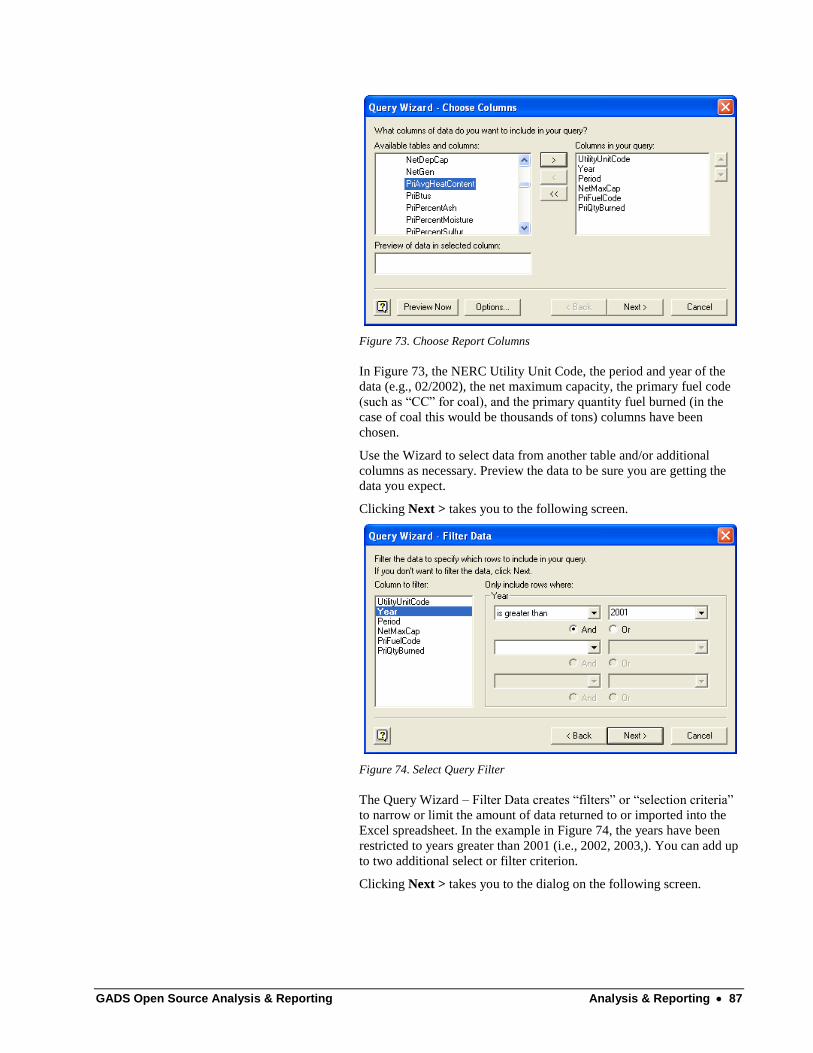
GADS Open Source Analysis & Reporting Analysis & Reporting 87
Figure 73. Choose Report Columns
In Figure 73, the NERC Utility Unit Code, the period and year of the
data (e.g., 02/2002), the net maximum capacity, the primary fuel code
(such as ―CC‖ for coal), and the primary quantity fuel burned (in the
case of coal this would be thousands of tons) columns have been
chosen.
Use the Wizard to select data from another table and/or additional
columns as necessary. Preview the data to be sure you are getting the
data you expect.
Clicking Next > takes you to the following screen.
Figure 74. Select Query Filter
The Query Wizard – Filter Data creates ―filters‖ or ―selection criteria‖
to narrow or limit the amount of data returned to or imported into the
Excel spreadsheet. In the example in Figure 74, the years have been
restricted to years greater than 2001 (i.e., 2002, 2003,). You can add up
to two additional select or filter criterion.
Clicking Next > takes you to the dialog on the following screen.
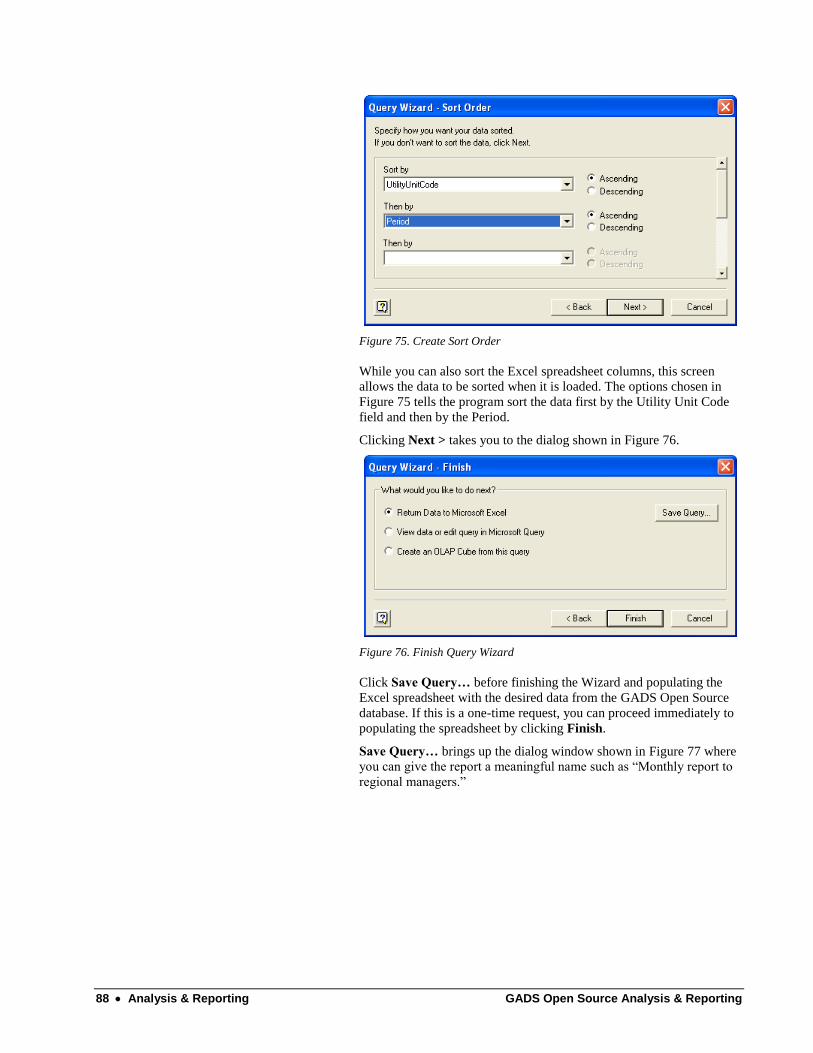
88 Analysis & Reporting GADS Open Source Analysis & Reporting
Figure 75. Create Sort Order
While you can also sort the Excel spreadsheet columns, this screen
allows the data to be sorted when it is loaded. The options chosen in
Figure 75 tells the program sort the data first by the Utility Unit Code
field and then by the Period.
Clicking Next > takes you to the dialog shown in Figure 76.
Figure 76. Finish Query Wizard
Click Save Query… before finishing the Wizard and populating the
Excel spreadsheet with the desired data from the GADS Open Source
database. If this is a one-time request, you can proceed immediately to
populating the spreadsheet by clicking Finish.
Save Query… brings up the dialog window shown in Figure 77 where
you can give the report a meaningful name such as ―Monthly report to
regional managers.‖

GADS Open Source Analysis & Reporting Analysis & Reporting 89
Figure 77. Save Query
When you click Finish, either immediately or after having saved the
query, the dialog box in Figure 78 appears, asking where in the Excel
spreadsheet you want to load the data. The default is cell A1 on the
current sheet.
Figure 78. Import Data to Existing Worksheet
At this point the data is loaded, and you can customize it and any
Excel-based reports as needed.
Figure 79. Example Data Saved in Excel Spreadsheet
90 Analysis & Reporting GADS Open Source Analysis & Reporting
Exiting the Program
Be sure to submit your
current work before exiting
the program or shutting
down your machine;
otherwise, you will lose all
work done since the last
submission.
To exit, select File from the Main menu, and then choose Exit.
With the Windows UI, you should always exit the program from the Main menu and
always exit the program completely before shutting down your computer. Do not
turn the computer off during the operation of this software without properly exiting
the program; doing so may cause unrecoverable data loss.
Due to the nature of web-based applications, it is not required that you exit the Web
UI before shutting down your computer.
Tips & Tricks
Steam Cycle Heat Rate
How is the steam cycle heat rate of a combined cycle unit calculated?
A combined cycle plant incorporates a highly fuel-efficient process that involves
generating electricity in combustion turbines and utilizing the procedure‗s hot
exhaust (waste heat) to create water vapor, which is then used to generate additional
electricity in a steam turbine. Heat rate is a measure of energy efficiency that defines
how much fuel it takes to generate a kilowatt-hour of electricity.
The combined cycle plant involves the sequential use of the fuel energy in both the
gas turbine generator and the steam turbine generator. The steam turbine operates in
conjunction with the gas turbine(s), providing extra generation to the station at an
effective heat rate of zero, ignoring any duct burners.
Therefore, heat rates are defined for the gas turbines and for the combined cycle, but
not the steam cycle by itself.
Using the GADS fuel and generation data and the performance reports from GADS
Open Source, you can determine the approximate overall heat rate of the combined
cycle plant and an approximate heat rate for each gas turbine. Based on these heat
rates, it you can infer the approximate heat rates for the steam turbine; however, the
computation is somewhat involved.
Normally, the overall heat rate (Btu/kWh) for the combined cycle is calculated by
summing the fuel burned in each of the gas turbines and the fuel burned in the duct
burners (expressed in Btu) and dividing the summed Btu value by the total
generation (kWh) from the gas turbine generator(s) and the steam turbine generator.
So the answer to the question is that the heat rate for the steam cycle is not normally
calculated by itself. It can be accurately calculated by testing and by performing a
detailed heat balance for the steam cycle.
Example 3D Calculation
What is the Example 3D calculation option?
This setting in the GADS Open Source Analysis & Reporting software applies
specifically to calculating overlapping deratings. This setting causes all overlapping
deratings to be calculated, as shown in Example 3D in the NERC GADS DRI,
Appendix G.
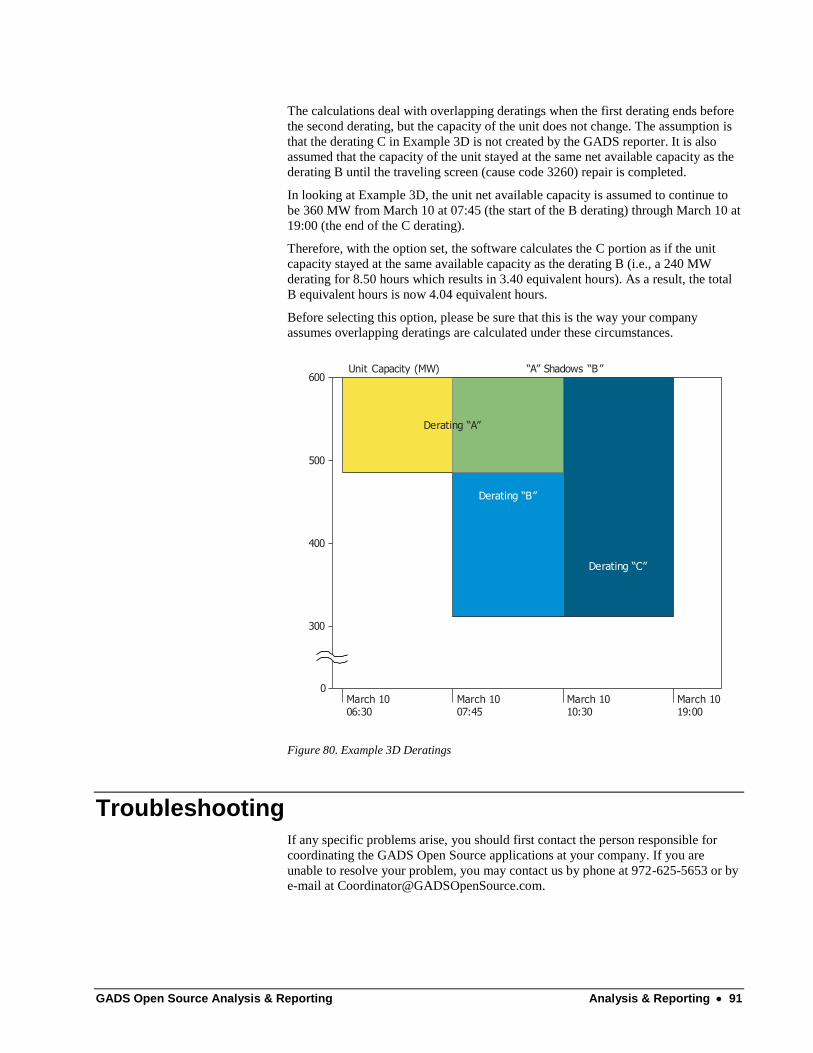
GADS Open Source Analysis & Reporting Analysis & Reporting 91
The calculations deal with overlapping deratings when the first derating ends before
the second derating, but the capacity of the unit does not change. The assumption is
that the derating C in Example 3D is not created by the GADS reporter. It is also
assumed that the capacity of the unit stayed at the same net available capacity as the
derating B until the traveling screen (cause code 3260) repair is completed.
In looking at Example 3D, the unit net available capacity is assumed to continue to
be 360 MW from March 10 at 07:45 (the start of the B derating) through March 10 at
19:00 (the end of the C derating).
Therefore, with the option set, the software calculates the C portion as if the unit
capacity stayed at the same available capacity as the derating B (i.e., a 240 MW
derating for 8.50 hours which results in 3.40 equivalent hours). As a result, the total
B equivalent hours is now 4.04 equivalent hours.
Before selecting this option, please be sure that this is the way your company
assumes overlapping deratings are calculated under these circumstances.
Derating “B”
Derating “C”
600Unit Capacity (MW) “A” Shadows “B”
March 1006:30
March 1007:45
March 1010:30
March 1019:00
500
400
300
0
Derating “A”
Figure 80. Example 3D Deratings
Troubleshooting
If any specific problems arise, you should first contact the person responsible for
coordinating the GADS Open Source applications at your company. If you are
unable to resolve your problem, you may contact us by phone at 972-625-5653 or by
e-mail at [email protected].

92 Analysis & Reporting GADS Open Source Analysis & Reporting
In the unlikely event that you encounter an error while using the software, we have
tried to find a ―graceful‖ way to recover from errors and present you with a
description of the problem that occurred (i.e., to ―trap‖ the error). However, it is
possible that some errors may not get trapped and the software simply stops, without
any obvious indication of what caused the problem. If this does happen, we will need
to work with you to determine what may have been the cause.
If an error does occur, you may be asked to open the Event Viewer on the machine
or application server where the error occurred for the Windows UI or the web server
for the Web UI. Generally, the Event Viewer is available in the Administrative Tools
for your Windows operating system.
We also recommend that you press ALT+PRINT SCREEN (press the ALT key, hold
it down, and press the PRINT SCREEN key) to capture the ―active window‖ to the
Windows clipboard. You can then open WordPad or Microsoft® Word (Notepad will
not work for this purpose) to paste the screen shot into the new document. Make sure
the window with the error message is displayed in the document. If not, simply
minimize the editor, click on the top of the window that displays the error, and repeat
the process of capturing the active window to the clipboard and pasting it into the
editor. Save the document in case it is needed to resolve the problem.
All errors should be captured under the Application Log section of the event viewer,
as shown in Figure 81.
Figure 81. Event Viewer for Application Errors
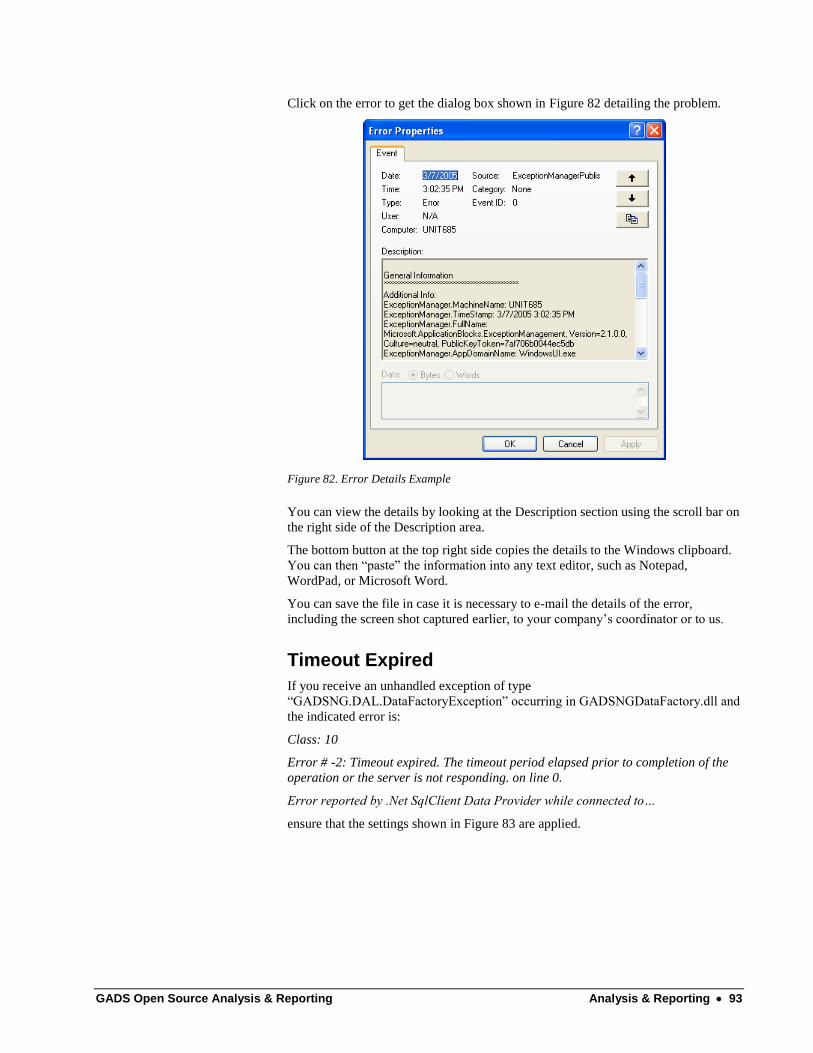
GADS Open Source Analysis & Reporting Analysis & Reporting 93
Click on the error to get the dialog box shown in Figure 82 detailing the problem.
Figure 82. Error Details Example
You can view the details by looking at the Description section using the scroll bar on
the right side of the Description area.
The bottom button at the top right side copies the details to the Windows clipboard.
You can then ―paste‖ the information into any text editor, such as Notepad,
WordPad, or Microsoft Word.
You can save the file in case it is necessary to e-mail the details of the error,
including the screen shot captured earlier, to your company‘s coordinator or to us.
Timeout Expired
If you receive an unhandled exception of type
―GADSNG.DAL.DataFactoryException‖ occurring in GADSNGDataFactory.dll and
the indicated error is:
Class: 10
Error # -2: Timeout expired. The timeout period elapsed prior to completion of the
operation or the server is not responding. on line 0.
Error reported by .Net SqlClient Data Provider while connected to…
ensure that the settings shown in Figure 83 are applied.

94 Analysis & Reporting GADS Open Source Analysis & Reporting
If the MCMS server is running on the same system as the SQL server (i.e., the
MCMS server is a local client of Microsoft SQL Server), adjust the SQL Client
Network settings as follows (this is accessible through the Microsoft SQL
Server\Client Network Utility | Start Menu item:
Uncheck Enable shared memory protocol
Rearrange the Enabled protocols by order: so that Named Pipes comes
before TCP/IP
If necessary, restart Microsoft Internet Information Server (IIS)
This error can occur regardless of the database size.
Figure 83. SQL Server Client Network Utility – Enable Protocols
GADS Open Source Analysis & Reporting Analysis & Reporting 95
This page intentionally left blank.


GADS Open Source Analysis & Reporting Installation & Quick Start 97
Installation & Quick Start
Installation
This section takes you briefly through installing the GADS Open Source Data Entry
application and highlights any special installation considerations.
Verify that all the required
supporting software has
been installed by first
clicking Check Now. In
addition to determining
whether the prerequisite
software is installed, you
can install the needed
software directly from the
installation CD.
The ODBC .NET Data
Provider Windows Installer
Package odbc_net.msi can
be found on the installation
CD in the ODBC Data
Provider folder.
It is recommended that you close all other programs running under Windows.
The Windows User Interface installation requires that all machines running the Data
Entry application have Microsoft .NET Framework version 1.1 and the ODBC .NET
Data Provider installed on the machine—even if the GADS application itself is
installed on a network drive. This is a requirement for all Microsoft .NET Windows
applications. The Web UI does not require this software to be installed on the
user’s machines, but it must be installed on the same web server as the GADS
application.
The installation requires BOTH
a GADS Open Source Data Entry installation CD
a client-specific Keys.xml file, which is either supplied on a 3.5‖ diskette or sent
via e-mail; it is not included on the installation CD.
Insert the GADS Open Source Data Entry installation CD into your CD drive. The
GADS Open Source Data Entry Installer should start automatically.
If the installation does not start automatically:
Click Start on the taskbar (Start is typically in the lower left corner of the
screen) and then click Run.
In the text box next to Open, type E:\autorun.hta (where E is the CD drive
letter).
Click OK.
(You can also open Windows Explorer and right-click on the CD-ROM drive. If the
pop-up menu lists AutoPlay as an option, clicking AutoPlay will run the installation
program. If AutoPlay is not listed, you can double-click on the file autorun.hta to
manually start the installation process.)
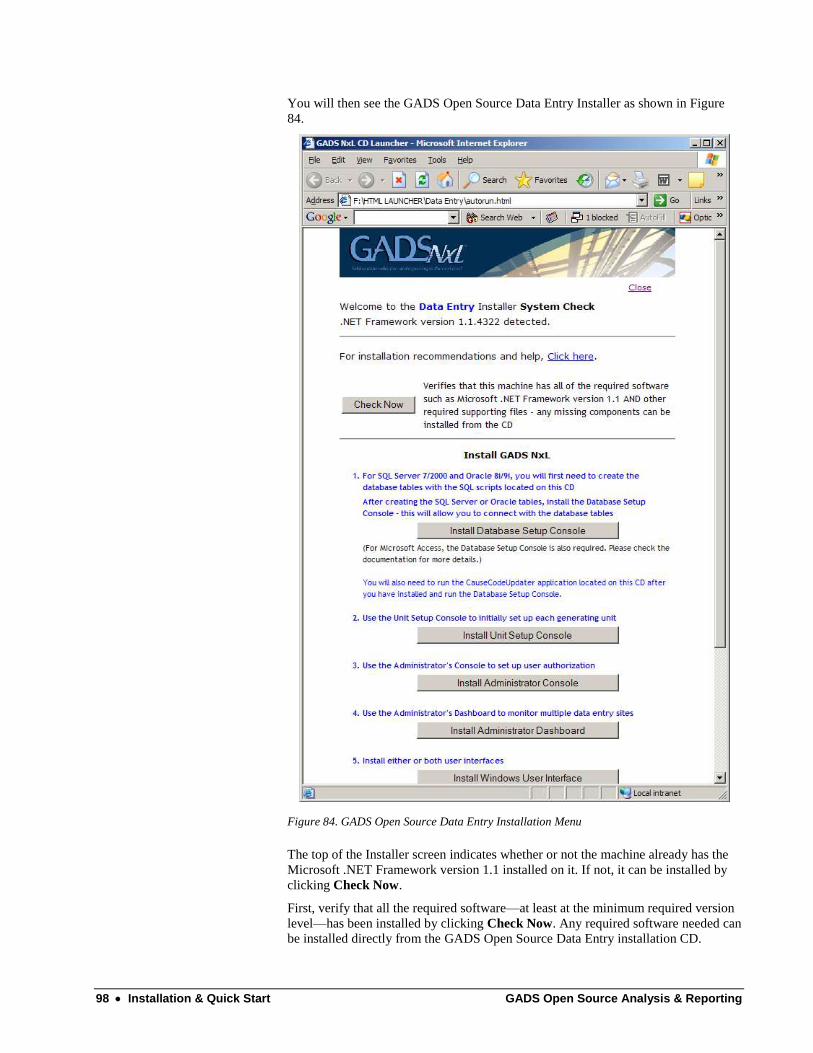
98 Installation & Quick Start GADS Open Source Analysis & Reporting
You will then see the GADS Open Source Data Entry Installer as shown in Figure
84.
Figure 84. GADS Open Source Data Entry Installation Menu
The top of the Installer screen indicates whether or not the machine already has the
Microsoft .NET Framework version 1.1 installed on it. If not, it can be installed by
clicking Check Now.
First, verify that all the required software—at least at the minimum required version
level—has been installed by clicking Check Now. Any required software needed can
be installed directly from the GADS Open Source Data Entry installation CD.
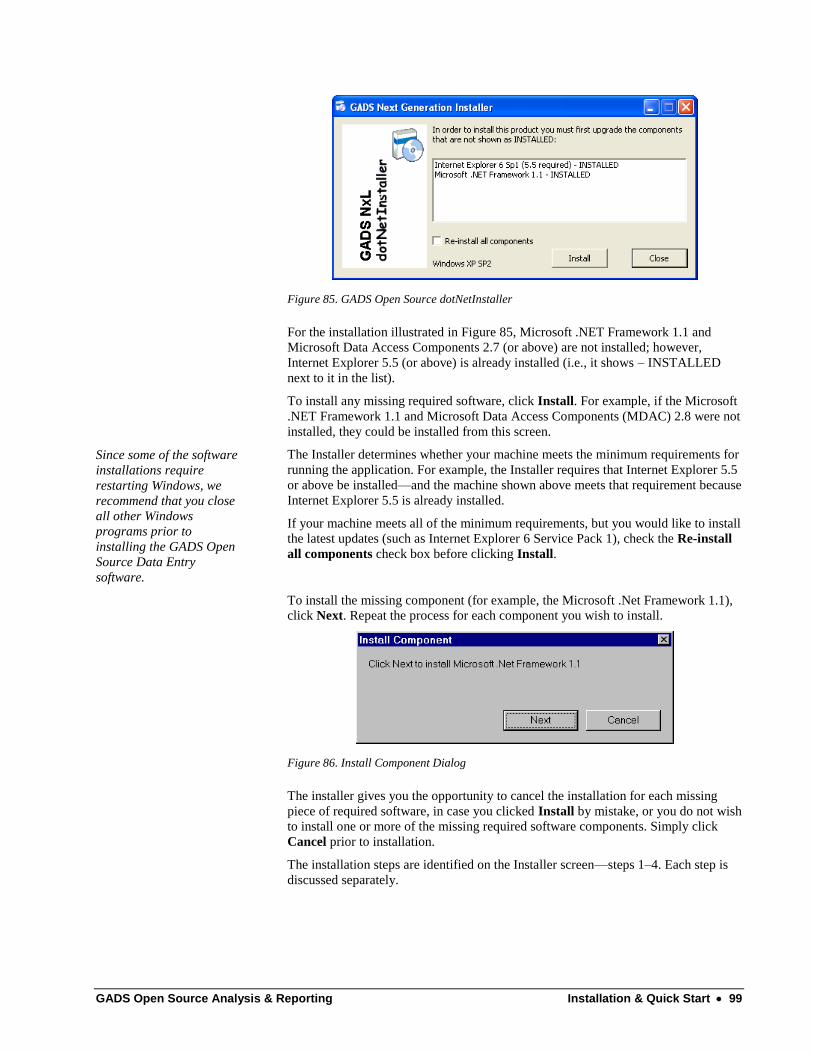
GADS Open Source Analysis & Reporting Installation & Quick Start 99
Figure 85. GADS Open Source dotNetInstaller
For the installation illustrated in Figure 85, Microsoft .NET Framework 1.1 and
Microsoft Data Access Components 2.7 (or above) are not installed; however,
Internet Explorer 5.5 (or above) is already installed (i.e., it shows – INSTALLED
next to it in the list).
To install any missing required software, click Install. For example, if the Microsoft
.NET Framework 1.1 and Microsoft Data Access Components (MDAC) 2.8 were not
installed, they could be installed from this screen.
Since some of the software
installations require
restarting Windows, we
recommend that you close
all other Windows
programs prior to
installing the GADS Open
Source Data Entry
software.
The Installer determines whether your machine meets the minimum requirements for
running the application. For example, the Installer requires that Internet Explorer 5.5
or above be installed—and the machine shown above meets that requirement because
Internet Explorer 5.5 is already installed.
If your machine meets all of the minimum requirements, but you would like to install
the latest updates (such as Internet Explorer 6 Service Pack 1), check the Re-install
all components check box before clicking Install.
To install the missing component (for example, the Microsoft .Net Framework 1.1),
click Next. Repeat the process for each component you wish to install.
Figure 86. Install Component Dialog
The installer gives you the opportunity to cancel the installation for each missing
piece of required software, in case you clicked Install by mistake, or you do not wish
to install one or more of the missing required software components. Simply click
Cancel prior to installation.
The installation steps are identified on the Installer screen—steps 1–4. Each step is
discussed separately.

100 Installation & Quick Start GADS Open Source Analysis & Reporting
Remember to copy the
Keys.xml file to the same
folders as the installed
applications.
After the installation steps are completed, copy the Keys.xml file to the same
folder(s) where the Windows UI or Web UI applications were installed. For the
Web UI, Keys.xml is installed in the ―Secure‖ subfolder.
Be sure to have one or more secure backups of the Keys.xml file, since it is
necessary to continue to run the application.
Additional software such as the SQL Server 2000 Desktop Engine (MSDE 2000) and
the Adobe Reader can also be installed from the GADS Open Source Data Entry
installation CD.
Install Database Setup/Server Console
For SQL Server 7/2000 and Oracle 8i/9i, you will first need to create the database
and tables using the SQL scripts located on the Installation CD before running the
Unit Setup Console.
After creating the SQL Server or Oracle tables, install the Database Setup/Server
Console. This allows you to connect with the databases.
For Microsoft Access installations, the Database Setup/Server Console is also
required to locate the GADSNG.mdb file in the default location, which is the same
folder where the application was installed. The Setup/Server Console correctly
configures the GADSNG.XML file to the full folder path name.
Install Unit Setup Console
The Unit Setup Console is used to input pedigree or setup information on the
individual generating units for which you will be collecting GADS data. The Unit
Setup Console is not optional and is required regardless of the database type.
Remember to copy the
Keys.xml file to the same
folders as the installed
applications.
The total number of generating units you can enter using the Unit Setup Console is
limited to the number your company specified when the software license was
purchased. This value is stored in the Keys.xml file. This file is required, and must
be installed in the same folder where the application was installed. If you install both
the Windows User Interface and the Web User Interface, then the Keys.xml file must
be copied into both installation folders with the applications. For the Web User
Interface, both the Keys.xml and the GADSNG.xml files must be copied to the
―Secure‖ folder of the virtual directory.
GADS Open Source Analysis & Reporting Installation & Quick Start 101
Install Administrator Console
The Administrator (Admin) Console allows you to set up authorizations for
individual GADS data reporters, engineers, managers, or anyone who needs to
generate reports, and to limit access to specific units and software functionality. The
Admin Console uses the concept of defining authorization ―report groups‖ and
assigning generating units to each user-defined report group.
The Administrator also assigns individuals to the report groups, thereby controlling
access to the functionality and reports for each group of units.
Typically, plant sites, divisions/regions, or plant types are defined as groups. The
difference between Data Entry groups and Analysis & Reporting groups is that Data
Entry groups are geared mostly to plant locations where the GADS data is being
entered.
Analysis & Reporting groups, on the other hand, can include not only plant
locations, but also fuel types, unit types, regions, equipment manufacturers (such as
boiler manufacturers), operating modes, etc.—or any group for which you need to
calculate key performance indicators. Individual units can be assigned to any number
of groups.
For example, if your company has engineers responsible for tracking the
performance of combustion turbines by OEM, use the Admin Console to create a
group for each OEM. The same CTs may also be included in a plant site or fuel type
group.
Enter information on each engineer and assign the engineer to the necessary
group(s). An individual can also be assigned to one or more groups—as many as
necessary; there is no need to create fictitious groups.
The Admin Console also allows you to restrict the activities the engineers are
allowed to perform. You may want to allow only administrators to snapshot the
GADS data over from the Data Entry tables and to perform calculations. But you
may want to allow the engineers to generate reports for their assigned units and to
perform custom calculations.
Analysis & Reporting performs standard calculations for all the selected granularities
for all historical periods. The granularities are established for each group using the
Admin Console. Each unit in a group is automatically assigned the established
granularities.
For example, Dallas Unit 1, a gas-fired fossil steam unit, is assigned to both the
fossil steam group and the gas-fired group. The fossil steam group needs reports for
both monthly and yearly granularities. The gas-fired group needs daily and monthly
granularities. Since Dallas Unit 1 is assigned to both groups, daily, monthly, and
yearly calculations will be run on its data. All three granularities‘ factors and rates
for Dallas Unit 1 will be stored in the database tables for quick and easy reporting.
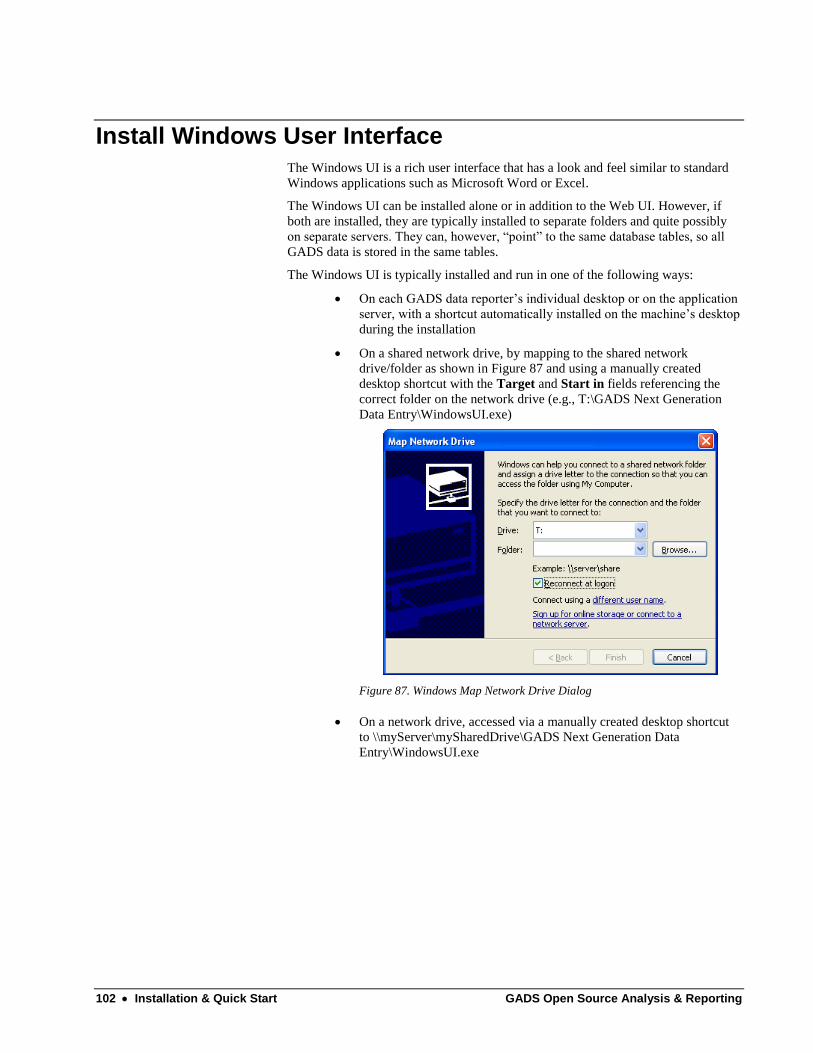
102 Installation & Quick Start GADS Open Source Analysis & Reporting
Install Windows User Interface
The Windows UI is a rich user interface that has a look and feel similar to standard
Windows applications such as Microsoft Word or Excel.
The Windows UI can be installed alone or in addition to the Web UI. However, if
both are installed, they are typically installed to separate folders and quite possibly
on separate servers. They can, however, ―point‖ to the same database tables, so all
GADS data is stored in the same tables.
The Windows UI is typically installed and run in one of the following ways:
On each GADS data reporter‘s individual desktop or on the application
server, with a shortcut automatically installed on the machine‘s desktop
during the installation
On a shared network drive, by mapping to the shared network
drive/folder as shown in Figure 87 and using a manually created
desktop shortcut with the Target and Start in fields referencing the
correct folder on the network drive (e.g., T:\GADS Next Generation
Data Entry\WindowsUI.exe)
Figure 87. Windows Map Network Drive Dialog
On a network drive, accessed via a manually created desktop shortcut
to \\myServer\mySharedDrive\GADS Next Generation Data
Entry\WindowsUI.exe

GADS Open Source Analysis & Reporting Installation & Quick Start 103
Any .NET application run on
your local machine is fully
trusted by default. If you run the
same application from another
machine, .NET checks to see
what permissions that
application has to run on your
machine. Depending on your
company’s enterprise-wide
settings, a .NET application
may require permissions that
have not been granted; so we
supply our policy installer on
the installation CD.
Since the application is on a non-local drive, the machine‘s .NET security policy
may have to be modified to allow the Data Entry application to run on the subject
machine.
The installation CD contains a setup file (policy installer) that modifies the local
machine‘s security policy to allow the application to run. You can install it using
either the Setup.exe or the .msi file.
Your company‘s required enterprise-wide runtime security policy is not modified.
The security policy is changed only at the machine level, and grants Full Trust to the
GADS Open Source applications.
The Data Entry application can then be run by clicking the desktop icon/shortcut
using the proper path to the installation location.
Install Web User Interface
The Web UI is a browser-based user interface that has a look and feel similar to
standard internet/intranet applications using a browser such as Microsoft Internet
Explorer.
It does not require that any software be installed on the user‘s machine; however, we
recommend that Internet Explorer version 5.5 or above be installed on the user‘s
machine to take advantage of the capabilities offered by ASP.NET.
To ASP.NET, all browsers have either an UpLevel or DownLevel classification.
UpLevel browsers are defined as Internet Explorer 5.5 and greater. DownLevel
browsers are defined as Internet Explorer 5.01 and earlier, or browsers other than
Internet Explorer. Microsoft ASP.NET web controls use this browser classification
to determine which type of code to generate at runtime: client-side or server-side.
If a user has an UpLevel browser, the Web Controls generate client-side JavaScript
and trap the action events directly on the client. If a user has a DownLevel browser,
the Web Controls generate standard HTML, requiring the browser to perform a
round-trip to the server for triggered action events.
Regardless of whether the user‘s browser is UpLevel or DownLevel, the appropriate
code is sent without the user worrying about browsers or browser versions.
To deploy to a web server,
you must have
administrative access
privileges for that
computer.
The Web UI can be installed alone or in addition to the Windows UI.
Typically, the Web UI is deployed to a web server and installs files into a virtual
directory of the web server; the default virtual directory is GADSNGDEWeb.
If using Oracle 8i/9i, add the ASPNET account to the Oracle home folder. Give the
ASPNET account full control. Right-click the Oracle home folder in Windows
Explorer, click Properties, then click the Security tab. Add the ASPNET account
and give it full control. You may need to restart the computer.
However, if both user interfaces are installed, they are typically installed to separate
folders and quite possibly on separate servers. They can, however, ―point‖ to the
same database tables, so all GADS data is stored in the same tables. This feature is
possible by using the same GADSNG.xml file for both installations.
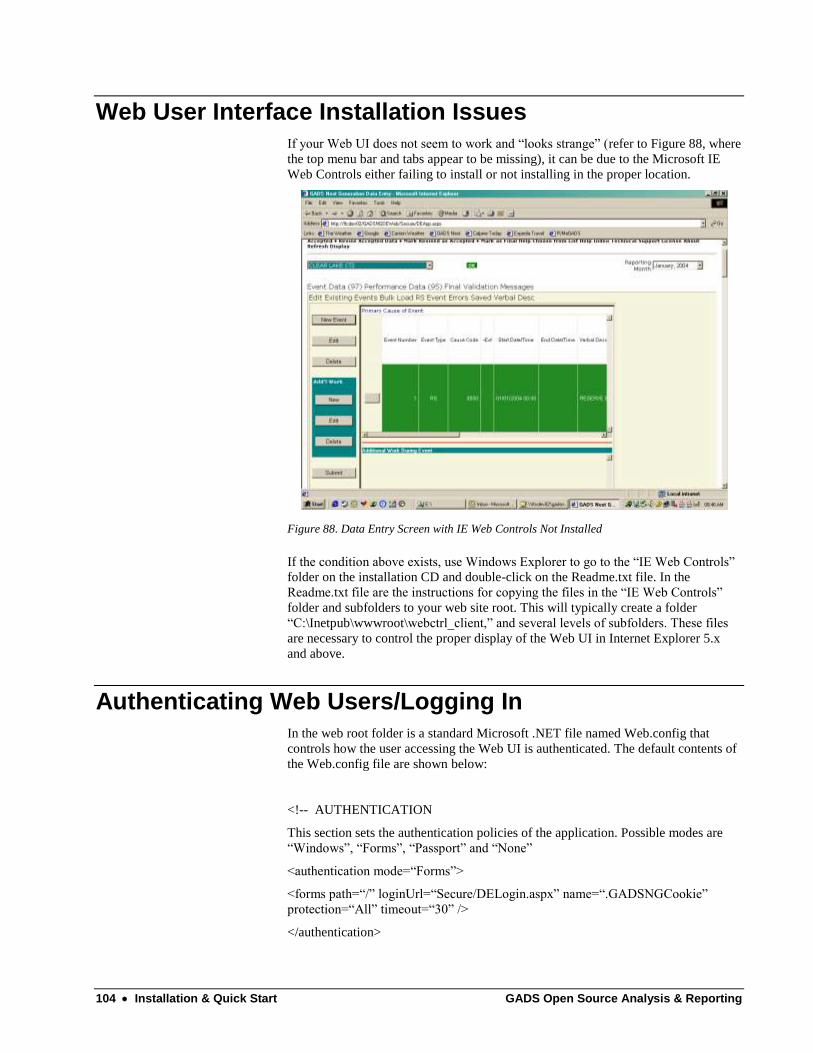
104 Installation & Quick Start GADS Open Source Analysis & Reporting
Web User Interface Installation Issues
If your Web UI does not seem to work and ―looks strange‖ (refer to Figure 88, where
the top menu bar and tabs appear to be missing), it can be due to the Microsoft IE
Web Controls either failing to install or not installing in the proper location.
Figure 88. Data Entry Screen with IE Web Controls Not Installed
If the condition above exists, use Windows Explorer to go to the ―IE Web Controls‖
folder on the installation CD and double-click on the Readme.txt file. In the
Readme.txt file are the instructions for copying the files in the ―IE Web Controls‖
folder and subfolders to your web site root. This will typically create a folder
―C:\Inetpub\wwwroot\webctrl_client,‖ and several levels of subfolders. These files
are necessary to control the proper display of the Web UI in Internet Explorer 5.x
and above.
Authenticating Web Users/Logging In
In the web root folder is a standard Microsoft .NET file named Web.config that
controls how the user accessing the Web UI is authenticated. The default contents of
the Web.config file are shown below:
<!-- AUTHENTICATION
This section sets the authentication policies of the application. Possible modes are
―Windows‖, ―Forms‖, ―Passport‖ and ―None‖
<authentication mode=―Forms‖>
<forms path=―/‖ loginUrl=―Secure/DELogin.aspx‖ name=―.GADSNGCookie‖
protection=―All‖ timeout=―30‖ />
</authentication>
GADS Open Source Analysis & Reporting Installation & Quick Start 105
<authentication mode=―Windows‖></authentication>
-->
<authentication mode=―Forms‖>
<forms path=―/‖ loginUrl=―Secure/DELogin.aspx‖ name=―.GADSNGCookie‖
protection=―All‖ timeout=―30‖ />
</authentication>
The default mode is ―Forms‖ authentication that uses a cookie with a default 30
minute timeout. What makes it work and defines how the authentication is performed
is the information between the ―<authentication mode=…‖ and the ending
―</authentication>‖ as shown below. What this default setting means is that whether
the user is inside or outside the firewall, they must login using a Login form every
time. As discussed below, this behavior can be changed by changing the
authentication method to ―Windows‖ in the Web.config file.
<authentication mode=“Forms”>
<forms path=“/” loginUrl=“Secure/DELogin.aspx” name=“.GADSNGCookie”
protection=“All” timeout=“30” />
</authentication>
The top part of the AUTHENTICATION section is ―commented out‖ through the
use of the ―<!--‖ and ―-->‖ markers (i.e., everything between these two markers is
commented out). In other words, this is commented out:
<!-- AUTHENTICATION
This section sets the authentication policies of the application. Possible modes are
―Windows‖, ―Forms‖, ―Passport‖ and ―None‖
<authentication mode=―Forms‖>
<forms path=―/‖ loginUrl=―Secure/DELogin.aspx‖ name=―.GADSNGCookie‖
protection=―All‖ timeout=―30‖ />
</authentication>
<authentication mode=―Windows‖></authentication>
-->
Integrated Windows authentication uses a cryptographic exchange with the user‘s
Internet Explorer Web browser to confirm the identity of the user.
To change the method for user authentication from ―Forms‖ to ―Windows‖, using
any standard text editor such Windows WordPad or Notepad simply change:
<authentication mode=“Forms”>
<forms path=“/” loginUrl=“Secure/DELogin.aspx” name=“.GADSNGCookie”
protection=“All” timeout=“30” />
</authentication>
106 Installation & Quick Start GADS Open Source Analysis & Reporting
to
<authentication mode=“Windows”></authentication>
making sure that it is also ―outside‖ the commented-out portion of the file as shown
below:
<!-- AUTHENTICATION
This section sets the authentication policies of the application. Possible modes are
―Windows‖, ―Forms‖, ―Passport‖ and ―None‖
<authentication mode=―Forms‖>
<forms path=―/‖ loginUrl=―Secure/DELogin.aspx‖ name=―.GADSNGCookie‖
protection=―All‖ timeout=―30‖ />
</authentication>
<authentication mode=―Windows‖></authentication>
-->
<authentication mode=“Windows”></authentication>
This setting must be consistent with the Authentication Method set on the Directory
Security tab of IIS for the web root folder and the Secure folder. If you want to use
Windows Authentication, it must be set up in IIS for the web root. However, if IIS
cannot authenticate the user with Windows Authentication, they will still be able to
log in using the Login form.
As a reminder, even if Integrated Windows authentication is checked on the
Authentications Methods tab in IIS, leaving the authentication mode setting
described above set to ―Forms‖ will force everyone to fill in their User ID and
Password on a Login screen before they can access the data. However, changing the
setting to ―Windows‖ will require only those users who cannot be authenticated by
IIS based on their Windows identity to log in using the Login screen.
The ―Forms‖ login timeout can be set to any valid value in minutes; the default value
is 30 minutes. If you do not interact with the server-side portion of the application
within the 30 minute timeout period, by clicking Submit for example, your web
session will timeout and you will lose any data changes made since the last
submission.
Special IIS 5.x and 6.0 Considerations
By default, in versions of IIS before 6.0, the option to allow IIS to control the
password for the Anonymous account is selected when you enable Anonymous
authentication for a web site. This functionality is provided through the sub-
authentication component, Iissuba.dll.
By default, the ASPNET account has only the read and execute privileges of the
Users Group. The GADS Open Source applications need to write to and create new
files in the Secure subfolder of the web root. You can grant permissions to the
Secure folder by modifying the Access Control Lists (ACLs). You can access the
ACLs for a folder by right-clicking the folder in Windows Explorer, selecting
Properties, and selecting the Security tab. It is preferable to modify the ACLs for
the Secure folder, rather than to add general privileges to the ASPNET account.

GADS Open Source Analysis & Reporting Installation & Quick Start 107
The permissions needed by the GADS Open Source applications are: Read, Write,
Execute, and Create; essentially allowing Full Control to the Secure folder.
Also, by default IIS 6.0 does not enable sub-authentication. GADS Open Source‘s
Web UIs can be installed (and are therefore designed) to use Anonymous
authentication; as a result, they must run under the LocalSystem identity. You can
use sub-authentication to manage passwords for anonymous accounts in IIS 6.0 by
meeting the following requirements:
The worker process must run as LocalSystem. This is required because
sub-authentication permits the process that is running under IIS to
authenticate without providing a password. By default, all worker
process actions are completed in the context of this worker process
identity account. However, when a client request is processed, the
thread that processes the request uses a token associated with the client
(in this case, the Anonymous or IUSR account) for the duration of the
request. This is known as impersonation. (LocalSystem is a highly
privileged account. When you enable sub-authentication, administering
a Web server by using anonymous users is much easier to set up.)
The sub-authentication component, Iissuba.dll, must be registered.
The AnonymousPasswordSync metabase property must be enabled
(that is, set to TRUE).
IIS 6.0 permits you to group applications in application pools. To configure an
application to run under the LocalSystem identity:
1. In the IIS Manager (ISM), expand local computer, expand
Application Pools, right-click the application pool you want to
configure, and click Properties.
2. Click the Identity tab
3. Click Predefined, and in the list box next to it, click Local System
4. Click OK
Set the AnonymousPasswordSync metabase property to TRUE:
1. At the command prompt, change to the IIS AdminScripts folder. By
default, this folder is located at C:\Inetpub\AdminScripts
2. Type the following command, and then click Enter:
Adsutil.vbs set W3svc/AnonymousPasswordSync true
The above guidelines are based on the Microsoft Knowledge Base Article—
332167—IIS 6.0: HOW TO: Configure IIS to Control the Anonymous Password
(last reviewed by Microsoft 7/21/2003). Users are responsible for ensuring that all
current and/or revised Microsoft instructions and procedures are followed in
configuring IIS 6.0 and should consider the above as suggestions for accomplishing
the required changes.
Unlocking the Software with Keys.xml
This file MUST be installed in the same folder(s) as the application(s), including the
Unit Setup Console installation folder if the Unit Setup Console was installed to a
separate folder.
The Keys.xml file contains the maximum number of generating units permitted
under your software license.
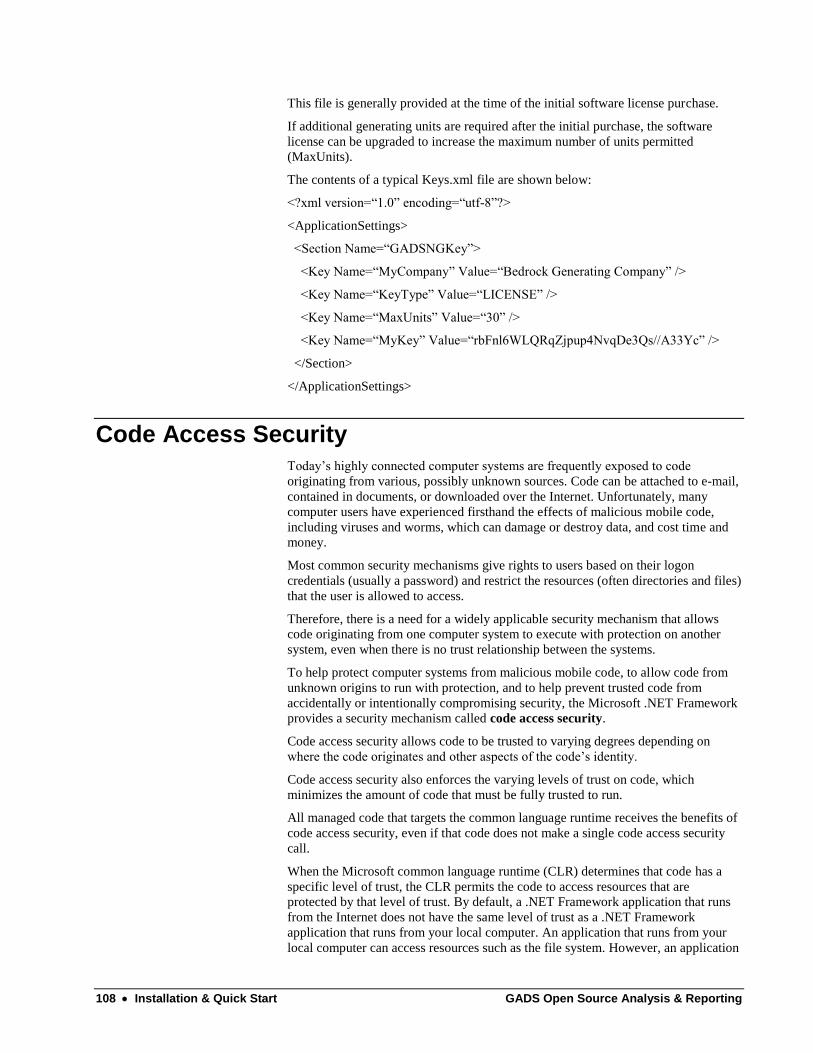
108 Installation & Quick Start GADS Open Source Analysis & Reporting
This file is generally provided at the time of the initial software license purchase.
If additional generating units are required after the initial purchase, the software
license can be upgraded to increase the maximum number of units permitted
(MaxUnits).
The contents of a typical Keys.xml file are shown below:
<?xml version=―1.0‖ encoding=―utf-8‖?>
<ApplicationSettings>
<Section Name=―GADSNGKey‖>
<Key Name=―MyCompany‖ Value=―Bedrock Generating Company‖ />
<Key Name=―KeyType‖ Value=―LICENSE‖ />
<Key Name=―MaxUnits‖ Value=―30‖ />
<Key Name=―MyKey‖ Value=―rbFnl6WLQRqZjpup4NvqDe3Qs//A33Yc‖ />
</Section>
</ApplicationSettings>
Code Access Security Today‘s highly connected computer systems are frequently exposed to code
originating from various, possibly unknown sources. Code can be attached to e-mail,
contained in documents, or downloaded over the Internet. Unfortunately, many
computer users have experienced firsthand the effects of malicious mobile code,
including viruses and worms, which can damage or destroy data, and cost time and
money.
Most common security mechanisms give rights to users based on their logon
credentials (usually a password) and restrict the resources (often directories and files)
that the user is allowed to access.
Therefore, there is a need for a widely applicable security mechanism that allows
code originating from one computer system to execute with protection on another
system, even when there is no trust relationship between the systems.
To help protect computer systems from malicious mobile code, to allow code from
unknown origins to run with protection, and to help prevent trusted code from
accidentally or intentionally compromising security, the Microsoft .NET Framework
provides a security mechanism called code access security.
Code access security allows code to be trusted to varying degrees depending on
where the code originates and other aspects of the code‘s identity.
Code access security also enforces the varying levels of trust on code, which
minimizes the amount of code that must be fully trusted to run.
All managed code that targets the common language runtime receives the benefits of
code access security, even if that code does not make a single code access security
call.
When the Microsoft common language runtime (CLR) determines that code has a
specific level of trust, the CLR permits the code to access resources that are
protected by that level of trust. By default, a .NET Framework application that runs
from the Internet does not have the same level of trust as a .NET Framework
application that runs from your local computer. An application that runs from your
local computer can access resources such as the file system. However, an application
GADS Open Source Analysis & Reporting Installation & Quick Start 109
that runs from the Internet or from a local intranet cannot access the file system on
your local computer.
In the .NET Framework, code access security controls access to resources by
controlling how code runs. When a user runs an application, the CLR assigns the
application to one of the following zones:
My Computer – the application code is hosted directly on the user‘s
computer
Local Internet – the application code runs from a ―file share‖ on the
user‘s intranet
Internet – the application code runs from the Internet
Trusted Sites – the application code runs from a Web site that is
defined as ―Trusted‖ in Internet Explorer
Untrusted Sites – the application code runs from a Web site that is
defined as ―Restricted‖ in Internet Explorer.
You can set the security level for each zone to High, Medium, Medium-Low, or
Low.
Trust levels define the resources that the application can access. The zone, together
with other security evidence, such as the publisher, the strong name, the Web site,
and the URL of the code, determines the permissions that the CLR grants to the code
at run time.
An application that is hosted on a network drive can run on your local computer. To
run the application, you must grant a level of trust to the assembly that corresponds
to the application. The trust level settings range from None to Full Trust.
To run the application on your local computer, you must grant Full Trust to the
GADS Open Source assemblies. You can use the .NET Runtime Security Policy
Installer included on the Installation CD to grant Full Trust permission to the GADS
Open Source applications.
.NET Runtime Security Policy Installer
When you run any .NET application on your local machine, it is fully trusted by
default.
If you run the same application from another machine, .NET checks to see what
permissions that application has to run on your machine.
Depending upon the enterprise-wide settings for your company, a .NET application
may require permissions that have not been granted. If the application attempts to
run and does not have the required permissions, it will fail with an error related to
security violations.
That is why we supply our security policy installer on the installation CD. Otherwise,
the GADS Open Source Installer would have to be run on each end user machine
using either the supplied Setup.exe or .msi file, unless your company prefers to
revise the security policy by some other means.
After the Security Policy Installer is run, your .NET configuration runtime security
policy for the machine is modified as shown below.
Under the Machine/Code Groups/All_Code, our Installer adds the Code Group
GADSNG_Code and under it the GADSNG_Strong_Name Code Group. (All of
our .NET assemblies are given Strong Names.)
110 Installation & Quick Start GADS Open Source Analysis & Reporting
The security policy is changed only at the machine level, and grants Full Trust to the
GADS Open Source applications.
Figure 89. The .NET Configuration 1.1 Wizard
SQL Server 2000 Desktop Engine
Until recently, Microsoft offered two database management options: Microsoft
Access and Microsoft SQL Server. With the release of the Microsoft Data Engine
(MSDE), an SQL Server-compatible database engine, there is an exciting new option
for creating desktop and shared database solutions.
The SQL Server 2000 Desktop Engine (MSDE 2000) is a data engine built and based
on core SQL Server technology. With support for single- and dual-processor desktop
computers, MSDE 2000 is a reliable storage engine and query processor for desktop
or small group applications.
You can install the Microsoft SQL Server 2000 Desktop Engine (MSDE 2000) from
the GADS Open Source Data Entry installation CD Installer.
You can then use the SQL Server 2000 Scripts from the installation CD to create the
required tables.
However, please be aware that MSDE 2000 is not an ―end user‖ product such as
Access, and requires a more sophisticated level of knowledge to use and to support.
Adobe Reader
To install Adobe Reader version 6.0, insert the GADS Open Source CD into your
CD-ROM drive. When the Installer displays, click Close in the upper right corner of
the screen. Open Windows Explorer and browse to the Adobe Reader 6 folder on the
GADS Open Source CD. Double-click on AdbeRdr60_enu_full.exe to install the
English version of Adobe Reader Version 6.

GADS Open Source Analysis & Reporting Installation & Quick Start 111
CD Reading Troubleshooter
While rare, some CD-ROM drives, especially older ones, simply do not read CD-R
discs well, or at all. CD-R disc reflectivity spans a broad range specified by CD
standards, but some CD-ROM drives were calibrated to read only factory-pressed
(silver) discs, which fall within a narrow part of this reflectivity range.
If your CD-ROM drive is unable to read the installation CD, try reading the disc in a
different CD-ROM drive, if possible.
If the installation does not start automatically:
1. Click Start on the taskbar (Start is typically in the lower left corner of
the screen) and click Run.
2. In the text box next to Open, type E:\autorun.hta (where E is the CD
drive letter).
3. Click OK.
You can also open Windows Explorer and right-click the CD-ROM drive. If the pop-
up menu lists AutoPlay as an option, clicking AutoPlay will run the installation
program. If AutoPlay is not displayed, you can double-click on the file autorun.hta
to manually start the installation process.
Be sure not to leave CD-R
discs in a high-temperature
location (e.g., in a hot car).
Heat damage can make
them unreadable.
Some CD-ROM drives may have trouble reading a disc when the lens on the reading
laser gets dirty. Check with the manufacturer of the CD-ROM drive about
recommended cleaning methods (for example, blowing out dust with a can of
compressed air).
Installation Quick Start
The Installer will create up to four desktop shortcuts:
1. GADSNG Server Console (if installed)
2. GADSNG Unit Setup
3. GADSNG Admin Console (if installed)
4. GADSNG Data Entry (Windows UI only)
The specific URL will
depend upon the actual
installation on your web
server.
For the Web User Interface you will need to manually set up a Favorite in your
browser, to an address such as:
http://111.222.1.100/GADSNGDEWeb/MainDE.aspx
MainDE.aspx is the main web page for the Data Entry Web UI.
Initial Startup Issues
Why does it take so long for the application to start the first time after it is initially
installed or after we install updates to the software? Every time after that it is fine,
but what happens the first time?
The Microsoft .NET Framework 1.1 common language runtime (CLR) provides the
infrastructure, enabling managed execution and a variety of services that can be used
during execution.
112 Installation & Quick Start GADS Open Source Analysis & Reporting
However, before an application can be run, it must be compiled to processor-specific
code based on the machine on which it is installed.
Each Data Entry method (or function) for which Microsoft intermediate language
(MSIL) has been generated and installed on your machines is just-in-time-compiled
(JIT-compiled) when it is called for the first time, and then run.
The next time the Data Entry method is run, the existing JIT-compiled native code is
run. The process of JIT-compiling and then executing the code is repeated until
execution is complete.
This means that the very first time the application is run after initial installation or
updating, it takes a little longer, because the JIT compiler is compiling the code to
optimize it for the machine on which it is installed. The next time the application is
run it will open normally.

GADS Open Source Analysis & Reporting Server Console 113
Server Console
Creating a Connection to Your GADS Database
With GADS Next Generation, your GADS data can be stored in Microsoft Access,
Microsoft SQL Server 7/2000, or Oracle 8i/9i databases. The Server Console allows
you to customize the default installation by selecting the location and database type.
The ―out-of-the-box‖ default installation assumes that you are using the Microsoft
Access database GADSNG.mdb automatically installed in the same folder as the
application. This default installation can be used under a variety of situations, but
will be most suited for small GADS data collection groups and for stand-alone
installations at individual plant locations.
Use the Server Console to:
1. Initially set up the default location in GADSNG.XML for the Microsoft
Access database file GADSNG.mdb, or to move GADSNG.mdb to
another folder on the same drive or to a network drive (i.e., to change
its location)
2. Change the database to either a Microsoft SQL Server 7/2000 or an
Oracle 8i/9i database. This requires that you first create the required
GADS Open Source tables using the supplied SQL scripts as described
in the appropriate sections.
Configuring the Data Connection in GADSNG.xml
We do not recommend that
you edit or change this file
“by hand” using Notepad,
WordPad, or any other text
editor, since typing errors
could cause the GADS
Open Source Data Entry
application to fail.
The Server Console is responsible for updating the Connection section of the
GADSNG.xml file—specifically the DataSource and DBType values. The
GADSNG.xml file must be installed in the same folder as the application. This file
tells the Data Entry application where the data is stored and what type of database is
being used.
There are default values that allow the application to run in a stand-alone installation
on a single user‘s desktop using Microsoft Access as the database. For more typical
installations, the Server Console and the Admin Console are used to update this
file.
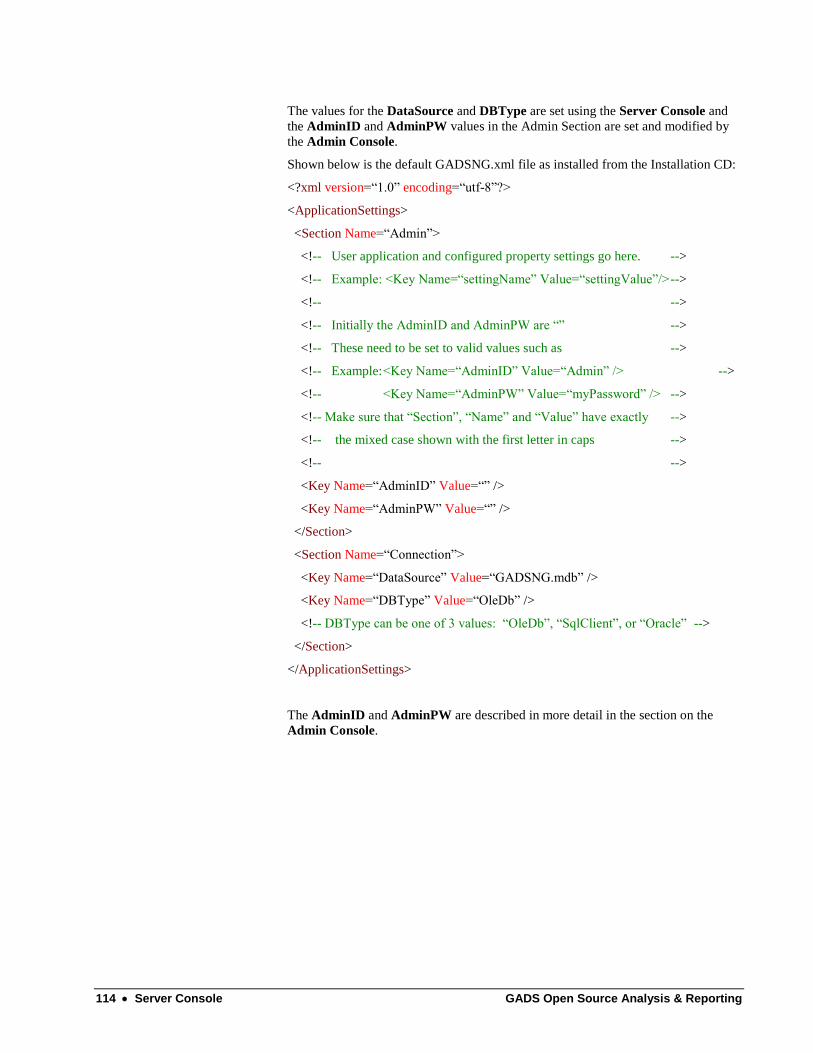
114 Server Console GADS Open Source Analysis & Reporting
The values for the DataSource and DBType are set using the Server Console and
the AdminID and AdminPW values in the Admin Section are set and modified by
the Admin Console.
Shown below is the default GADSNG.xml file as installed from the Installation CD:
<?xml version=―1.0‖ encoding=―utf-8‖?>
<ApplicationSettings>
<Section Name=―Admin‖>
<!-- User application and configured property settings go here. -->
<!-- Example: <Key Name=―settingName‖ Value=―settingValue‖/> -->
<!-- -->
<!-- Initially the AdminID and AdminPW are ―‖ -->
<!-- These need to be set to valid values such as -->
<!-- Example: <Key Name=―AdminID‖ Value=―Admin‖ /> -->
<!-- <Key Name=―AdminPW‖ Value=―myPassword‖ /> -->
<!-- Make sure that ―Section‖, ―Name‖ and ―Value‖ have exactly -->
<!-- the mixed case shown with the first letter in caps -->
<!-- -->
<Key Name=―AdminID‖ Value=―‖ />
<Key Name=―AdminPW‖ Value=―‖ />
</Section>
<Section Name=―Connection‖>
<Key Name=―DataSource‖ Value=―GADSNG.mdb‖ />
<Key Name=―DBType‖ Value=―OleDb‖ />
<!-- DBType can be one of 3 values: ―OleDb‖, ―SqlClient‖, or ―Oracle‖ -->
</Section>
</ApplicationSettings>
The AdminID and AdminPW are described in more detail in the section on the
Admin Console.
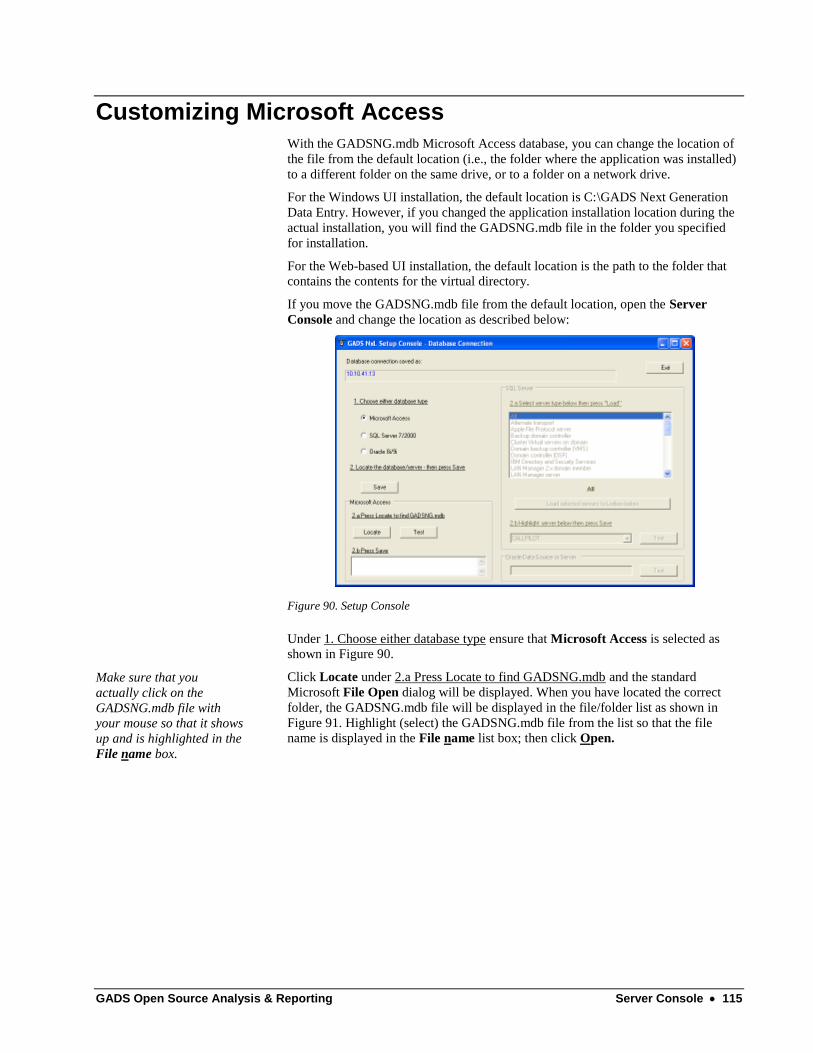
GADS Open Source Analysis & Reporting Server Console 115
Customizing Microsoft Access
With the GADSNG.mdb Microsoft Access database, you can change the location of
the file from the default location (i.e., the folder where the application was installed)
to a different folder on the same drive, or to a folder on a network drive.
For the Windows UI installation, the default location is C:\GADS Next Generation
Data Entry. However, if you changed the application installation location during the
actual installation, you will find the GADSNG.mdb file in the folder you specified
for installation.
For the Web-based UI installation, the default location is the path to the folder that
contains the contents for the virtual directory.
If you move the GADSNG.mdb file from the default location, open the Server
Console and change the location as described below:
Figure 90. Setup Console
Under 1. Choose either database type ensure that Microsoft Access is selected as
shown in Figure 90.
Make sure that you
actually click on the
GADSNG.mdb file with
your mouse so that it shows
up and is highlighted in the
File name box.
Click Locate under 2.a Press Locate to find GADSNG.mdb and the standard
Microsoft File Open dialog will be displayed. When you have located the correct
folder, the GADSNG.mdb file will be displayed in the file/folder list as shown in
Figure 91. Highlight (select) the GADSNG.mdb file from the list so that the file
name is displayed in the File name list box; then click Open.
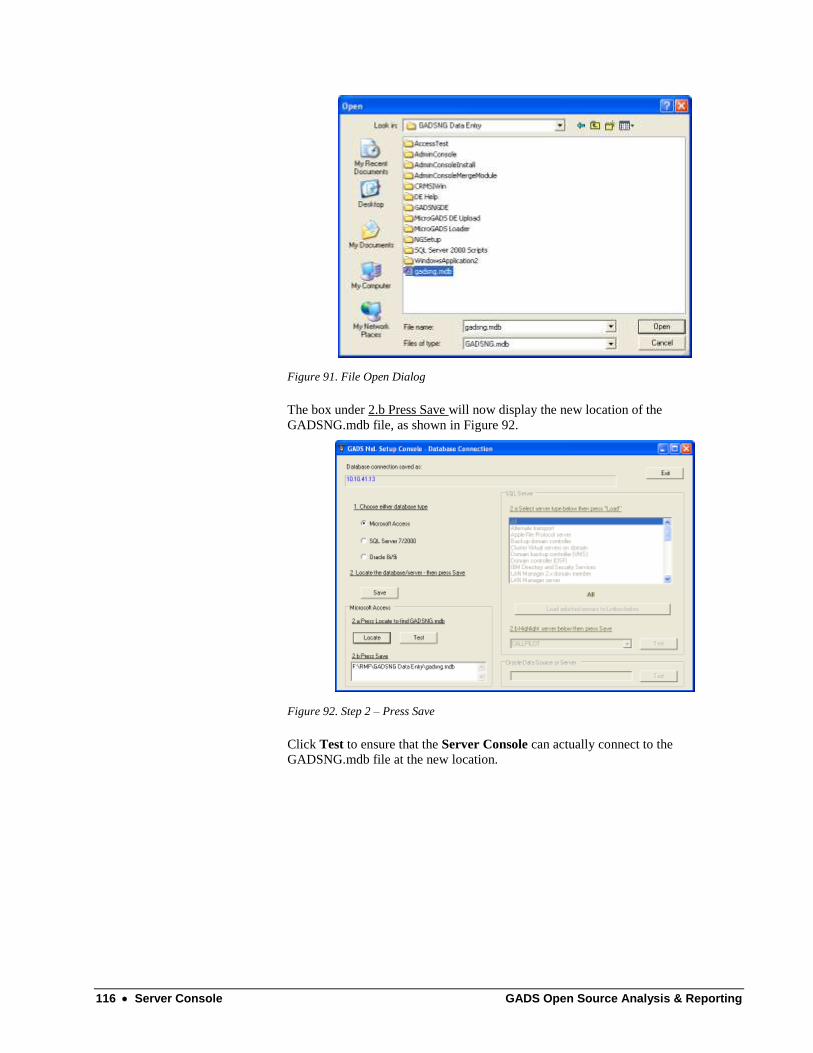
116 Server Console GADS Open Source Analysis & Reporting
Figure 91. File Open Dialog
The box under 2.b Press Save will now display the new location of the
GADSNG.mdb file, as shown in Figure 92.
Figure 92. Step 2 – Press Save
Click Test to ensure that the Server Console can actually connect to the
GADSNG.mdb file at the new location.

GADS Open Source Analysis & Reporting Server Console 117
If the Console successfully connects, you will see a dialog box similar to that shown
in Figure 93.
Figure 93. Step 2 – Test Connection
(If the Console cannot connect, you will see a dialog box explaining the reason.)
If the Console successfully connects with the GADSNG.mdb database, click Save
under 2. Locate the database/server – then press Save.
At this point you can click Exit.
Customizing Microsoft SQL Server
CAUTION – Ensure that
the SQL server tables have
been created prior to
starting this portion of the
setup.
Before proceeding with the steps below, create the required GADS Open Source
SQL Server 7 or 2000 tables using the supplied SQL scripts.
The scripts are found on the installation CD in the applicable folder.
Under 1. Choose either database type ensure that SQL Server 7/2000 is selected, as
shown Figure 94.
Figure 94. SQL Server 7/2000 Selection

118 Server Console GADS Open Source Analysis & Reporting
Select the server type from the drop-down list under 2.a Select server type below
then press ―Load‖. You can also use the default selection ―All.‖
After selecting the appropriate server type, click Load selected servers to Listbox
below. The Console will search the network connected to the machine where the
application is installed (including the machine on which the application is installed)
for all servers of the designated type that might be hosting the SQL Server.
If you select a type, and the Console is not able to locate any servers of that type, the
list box will display (none). At this point, you can select another type or re-select
All, and click Load selected servers to Listbox below again.
Figure 95. Highlight Selected Server for 2.b
If the Console is able to find attached servers, it displays a list of servers in the List
box under 2.b Highlight server below and then press Save.
Figure 96. Highlight Selected Server for 2.b Example 1
Using the list box, highlight the server where the SQL server is installed and the
GADS Open Source tables have been created.

GADS Open Source Analysis & Reporting Server Console 119
It is recommended that you test the connection to the appropriate server to ensure
that the GADS Open Source SQL Server tables are on the selected server and that
the Console is able to connect.
Figure 97. Highlight Selected Server for 2.b Example 2
Click Test to ensure that the Server Console can actually connect to the SQL
Server.
If the Console successfully connects, you will see a dialog box similar to those
shown in Figure 98 for SQL Server 7 and SQL Server 2000 respectively:
Figure 98. Server Connection Verification Examples
(If the Console cannot connect, you will see a dialog box explaining the reason.)

120 Server Console GADS Open Source Analysis & Reporting
Figure 99. SQL Server 7/2000 Connection Information Saved
If the Console connects with the GADS Open Source SQL Server tables, click Save
under 2. Locate the database/server – then press Save.
At this point, you can click Exit.
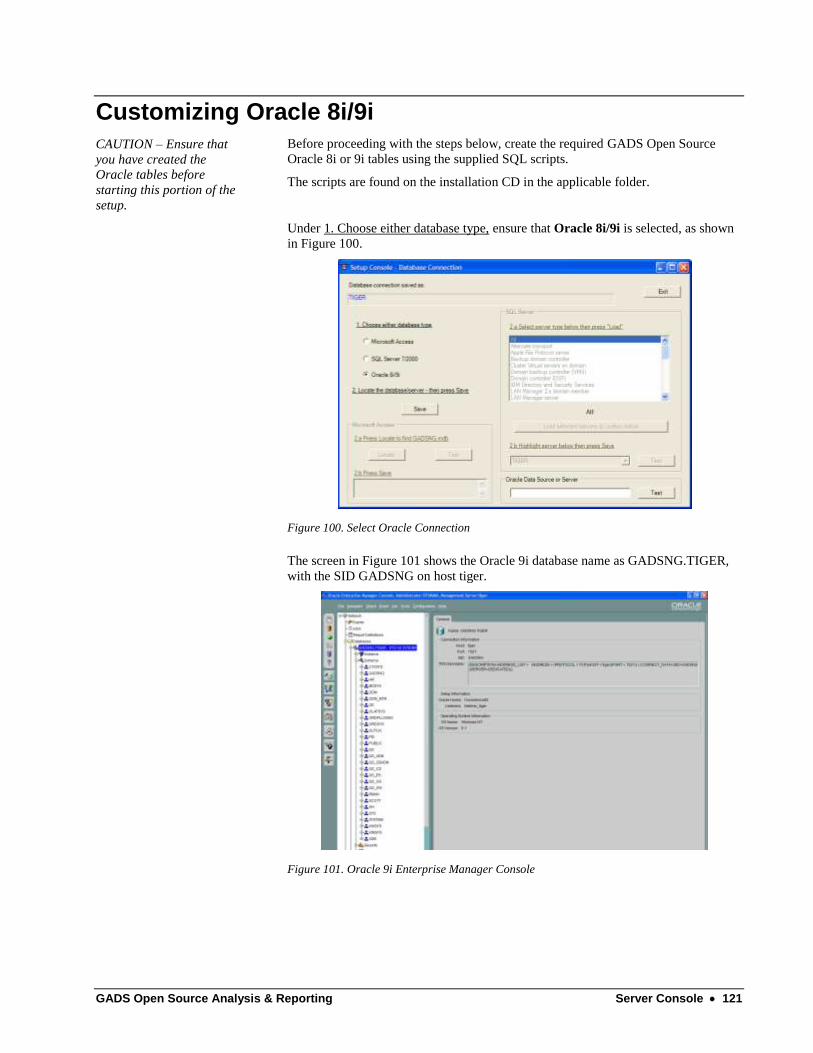
GADS Open Source Analysis & Reporting Server Console 121
Customizing Oracle 8i/9i
CAUTION – Ensure that
you have created the
Oracle tables before
starting this portion of the
setup.
Before proceeding with the steps below, create the required GADS Open Source
Oracle 8i or 9i tables using the supplied SQL scripts.
The scripts are found on the installation CD in the applicable folder.
Under 1. Choose either database type, ensure that Oracle 8i/9i is selected, as shown
in Figure 100.
Figure 100. Select Oracle Connection
The screen in Figure 101 shows the Oracle 9i database name as GADSNG.TIGER,
with the SID GADSNG on host tiger.
Figure 101. Oracle 9i Enterprise Manager Console
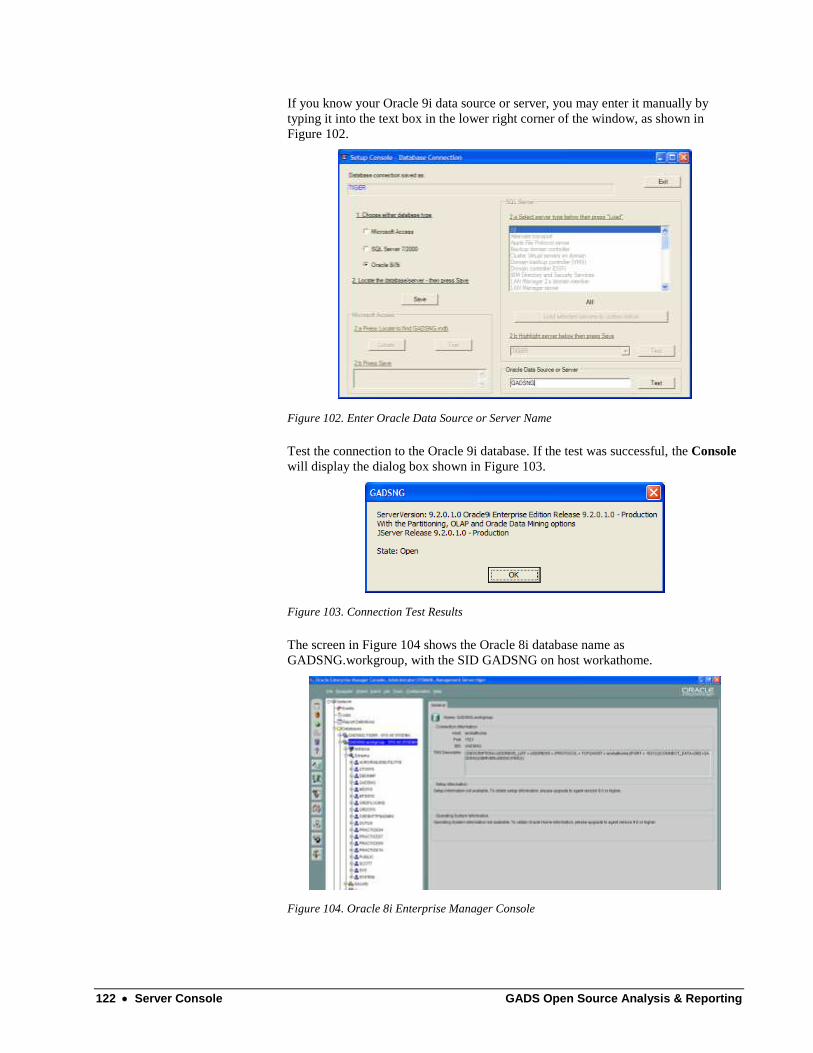
122 Server Console GADS Open Source Analysis & Reporting
If you know your Oracle 9i data source or server, you may enter it manually by
typing it into the text box in the lower right corner of the window, as shown in
Figure 102.
Figure 102. Enter Oracle Data Source or Server Name
Test the connection to the Oracle 9i database. If the test was successful, the Console
will display the dialog box shown in Figure 103.
Figure 103. Connection Test Results
The screen in Figure 104 shows the Oracle 8i database name as
GADSNG.workgroup, with the SID GADSNG on host workathome.
Figure 104. Oracle 8i Enterprise Manager Console
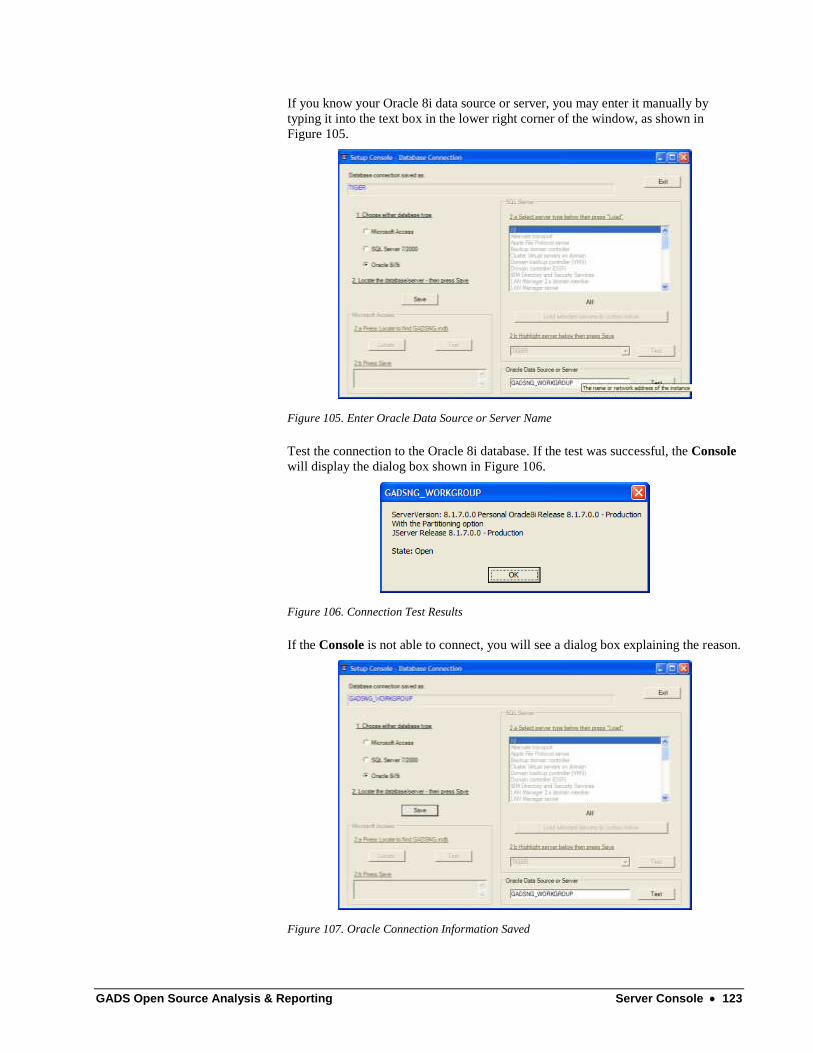
GADS Open Source Analysis & Reporting Server Console 123
If you know your Oracle 8i data source or server, you may enter it manually by
typing it into the text box in the lower right corner of the window, as shown in
Figure 105.
Figure 105. Enter Oracle Data Source or Server Name
Test the connection to the Oracle 8i database. If the test was successful, the Console
will display the dialog box shown in Figure 106.
Figure 106. Connection Test Results
If the Console is not able to connect, you will see a dialog box explaining the reason.
Figure 107. Oracle Connection Information Saved

124 Server Console GADS Open Source Analysis & Reporting
If the Console successfully connects with the GADS Open Source Oracle databases,
click Save under 2. Locate the database/server – then press Save.
At this point, you can click Exit.
Web User Interface –
important note for the
Oracle home folder.
If using Oracle 8i/9i and the Web User Interface, add the ASPNET account to the
Oracle home folder. Give the ASPNET account full control. To do this, right-click
the Oracle home folder in Windows Explorer. Click Properties, then click the
Security tab. Add the ASPNET account and give it full control. You may need to
restart the computer.
SQL Scripts for SQL Server and Oracle
The SQL scripts can be found on the installation CD in the appropriate folder:
Oracle 8i Scripts
Oracle 9i Scripts
SQL Server 2000 Scripts
SQL Server 7 Scripts
Check out the README.txt
file in each folder for
installation instructions.
Each folder contains a complete set of initial installation scripts to create and
populate the required GADS Open Source tables for the appropriate database system.
The README.txt file contains the installation instructions.
Why do we use SQL
scripts?
There are several reasons for using SQL scripts. First, most SQL Server and Oracle
database administrators (DBAs) are very familiar with SQL scripts and want to
review the changes that software vendors propose to ensure that the changes to their
databases do not break their existing installations—a very understandable request.
(―What’s this vendor going to do to MY database? Crash it?‖)
Second, SQL scripts make it possible for us to make future changes to your existing
GADS Open Source databases without overwriting all of your historical data. If
NERC adds a new GADS data element (such as the Dominant Derating field), scripts
allow us to easily ―update‖ your existing database tables to add a new column or
field without sending you a replacement ―database‖ or ―table,‖ which would wipe
out all of your historical GADS data. Also, your DBAs are going to be much happier
if they can see what changes we‘re going to make and, again, this is best done with
SQL scripts.
GADS Open Source Analysis & Reporting Unit Setup Console 125
Unit Setup Console
Entering Required Data
When you start the Unit
Setup Console, the screen
shows the Required Data
as well as tabs to select any
of the four Option Pages.
When you initially install the Data Entry application and open the Unit Setup
Console, you will see that each Unit Name consists of {Available unit nnnn} where
nnnn starts at 0001 and ends at the maximum number of units for which your
software is licensed.
To add a generating unit to the list, select the first ―open‖ available unit and highlight
it in the Unit Name list box. You can then type in the name of the unit to be added
such as ―My New Unit‖.
You should notice that the NERC Unit Code field has the value of nnnn for the unit
being entered and that there is an error indicator (a white ! inside a red circle) next to
this field. The error message is that nnnn is an invalid NERC Unit Code.
The error icon serves two purposes: (1) an indication which ―available unit‖ record is
being completed and (2) a reminder that you must complete the NERC Unit Code
field. (The NERC Unit Code is a unique identifier assigned to the unit.)
For example, if you fill in the Unit Name for ―My New Unit,‖ you will see in Figure
108 that the NERC Unit Code is 78—the first available unit—which was expected.
If the user then presses the TAB key, the cursor moves down to the line below ―My
New Unit‖ to ―{Available unit 0079}‖ and now the NERC Unit Code field shows
79; not 78 as expected. (Refer to Figure 108.) While you can readily correct or
change any data records after entry, carefully noting which data record is being
entered can save a lot of frustration.

126 Unit Setup Console GADS Open Source Analysis & Reporting
Figure 108. Unit Setup Console
Data Field Description
Unit Name Common name for the unit such as Valley
Unit 1 (50 characters maximum)
NERC Unit Code Six-character NERC utility + unit code of the
format nAAnAA where n is a numeric digit
and A is any alphanumeric character such as
866123.
Short Name Abbreviated name for reports and data listings (10 characters maximum)
Unit Type
(* see definition below)
Fossil Steam
Fluidized Bed
Nuclear
Diesel
Hydro/Pumped Storage
Combustion Turbine – Simple Cycle*
Jet Engine – Simple Cycle*
Combined Cycle Combustion Turbine*
Combined Cycle Jet Engine*
Combined Cycle Steam Cycle*
Combined Cycle BLOCK with Combustion
Turbines*
Combined Cycle BLOCK with Jet Engines*
Geothermal
Misc Multi-Boilers/Multi-Turbines
Misc – Other
Commercial Date Either the actual unit commercial date or the
date that GADS data starts with
Retirement Date Either the actual unit retirement date or the
date that GADS data is no longer available
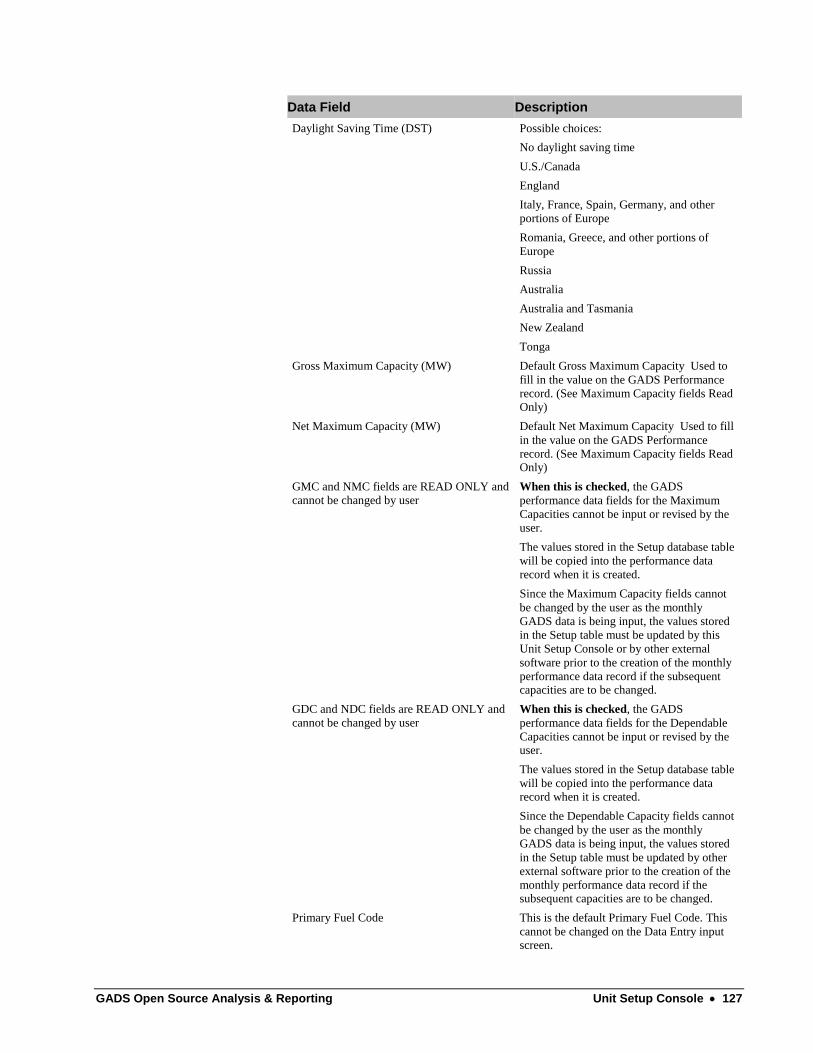
GADS Open Source Analysis & Reporting Unit Setup Console 127
Data Field Description
Daylight Saving Time (DST) Possible choices:
No daylight saving time
U.S./Canada
England
Italy, France, Spain, Germany, and other
portions of Europe
Romania, Greece, and other portions of
Europe
Russia
Australia
Australia and Tasmania
New Zealand
Tonga
Gross Maximum Capacity (MW) Default Gross Maximum Capacity Used to
fill in the value on the GADS Performance
record. (See Maximum Capacity fields Read Only)
Net Maximum Capacity (MW) Default Net Maximum Capacity Used to fill
in the value on the GADS Performance
record. (See Maximum Capacity fields Read Only)
GMC and NMC fields are READ ONLY and
cannot be changed by user
When this is checked, the GADS
performance data fields for the Maximum
Capacities cannot be input or revised by the
user.
The values stored in the Setup database table
will be copied into the performance data
record when it is created.
Since the Maximum Capacity fields cannot
be changed by the user as the monthly
GADS data is being input, the values stored
in the Setup table must be updated by this
Unit Setup Console or by other external
software prior to the creation of the monthly
performance data record if the subsequent capacities are to be changed.
GDC and NDC fields are READ ONLY and
cannot be changed by user
When this is checked, the GADS
performance data fields for the Dependable
Capacities cannot be input or revised by the user.
The values stored in the Setup database table
will be copied into the performance data record when it is created.
Since the Dependable Capacity fields cannot
be changed by the user as the monthly
GADS data is being input, the values stored
in the Setup table must be updated by other
external software prior to the creation of the
monthly performance data record if the subsequent capacities are to be changed.
Primary Fuel Code This is the default Primary Fuel Code. This
cannot be changed on the Data Entry input screen.
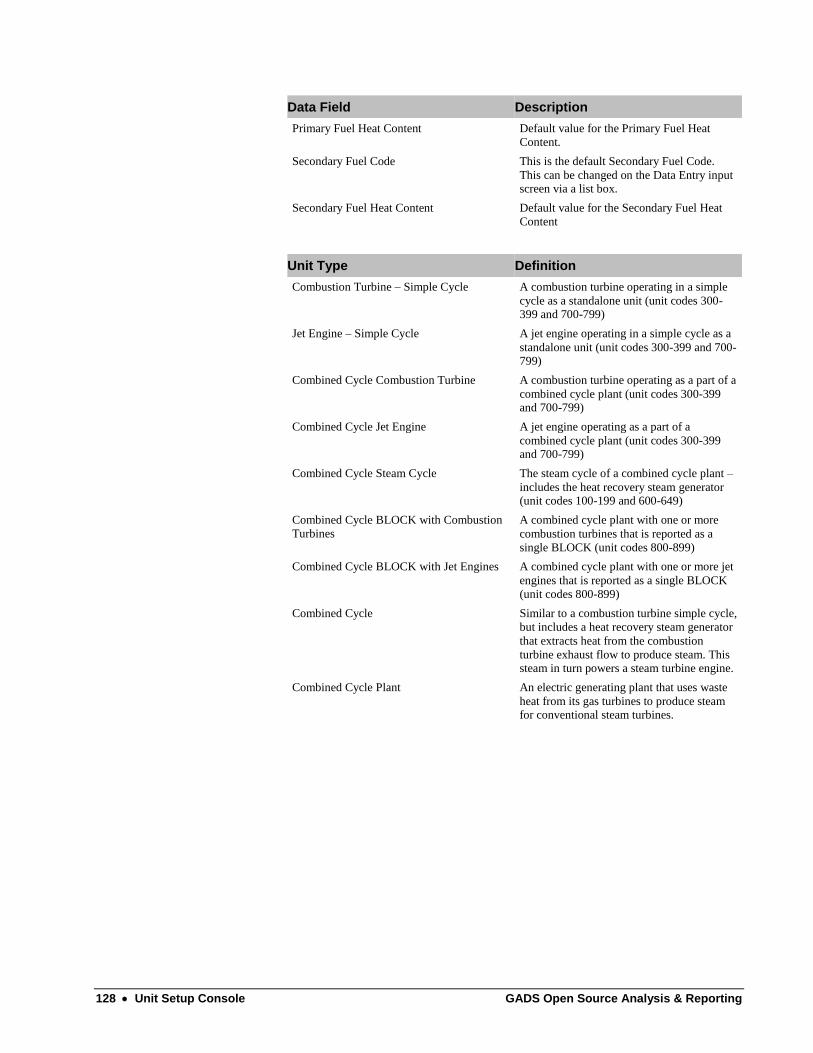
128 Unit Setup Console GADS Open Source Analysis & Reporting
Data Field Description
Primary Fuel Heat Content Default value for the Primary Fuel Heat
Content.
Secondary Fuel Code This is the default Secondary Fuel Code.
This can be changed on the Data Entry input screen via a list box.
Secondary Fuel Heat Content Default value for the Secondary Fuel Heat
Content
Unit Type Definition
Combustion Turbine – Simple Cycle A combustion turbine operating in a simple
cycle as a standalone unit (unit codes 300-399 and 700-799)
Jet Engine – Simple Cycle A jet engine operating in a simple cycle as a
standalone unit (unit codes 300-399 and 700-799)
Combined Cycle Combustion Turbine A combustion turbine operating as a part of a
combined cycle plant (unit codes 300-399 and 700-799)
Combined Cycle Jet Engine A jet engine operating as a part of a
combined cycle plant (unit codes 300-399 and 700-799)
Combined Cycle Steam Cycle The steam cycle of a combined cycle plant –
includes the heat recovery steam generator (unit codes 100-199 and 600-649)
Combined Cycle BLOCK with Combustion
Turbines
A combined cycle plant with one or more
combustion turbines that is reported as a
single BLOCK (unit codes 800-899)
Combined Cycle BLOCK with Jet Engines A combined cycle plant with one or more jet
engines that is reported as a single BLOCK
(unit codes 800-899)
Combined Cycle Similar to a combustion turbine simple cycle,
but includes a heat recovery steam generator
that extracts heat from the combustion
turbine exhaust flow to produce steam. This steam in turn powers a steam turbine engine.
Combined Cycle Plant An electric generating plant that uses waste
heat from its gas turbines to produce steam for conventional steam turbines.
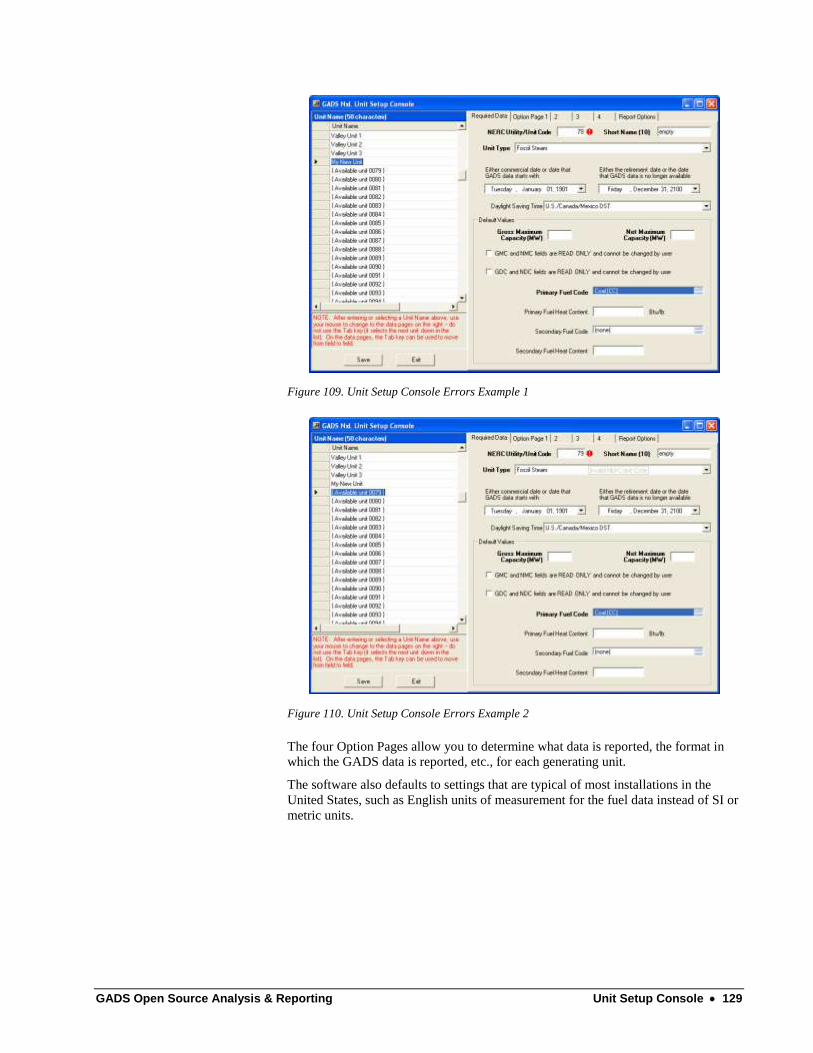
GADS Open Source Analysis & Reporting Unit Setup Console 129
Figure 109. Unit Setup Console Errors Example 1
Figure 110. Unit Setup Console Errors Example 2
The four Option Pages allow you to determine what data is reported, the format in
which the GADS data is reported, etc., for each generating unit.
The software also defaults to settings that are typical of most installations in the
United States, such as English units of measurement for the fuel data instead of SI or
metric units.
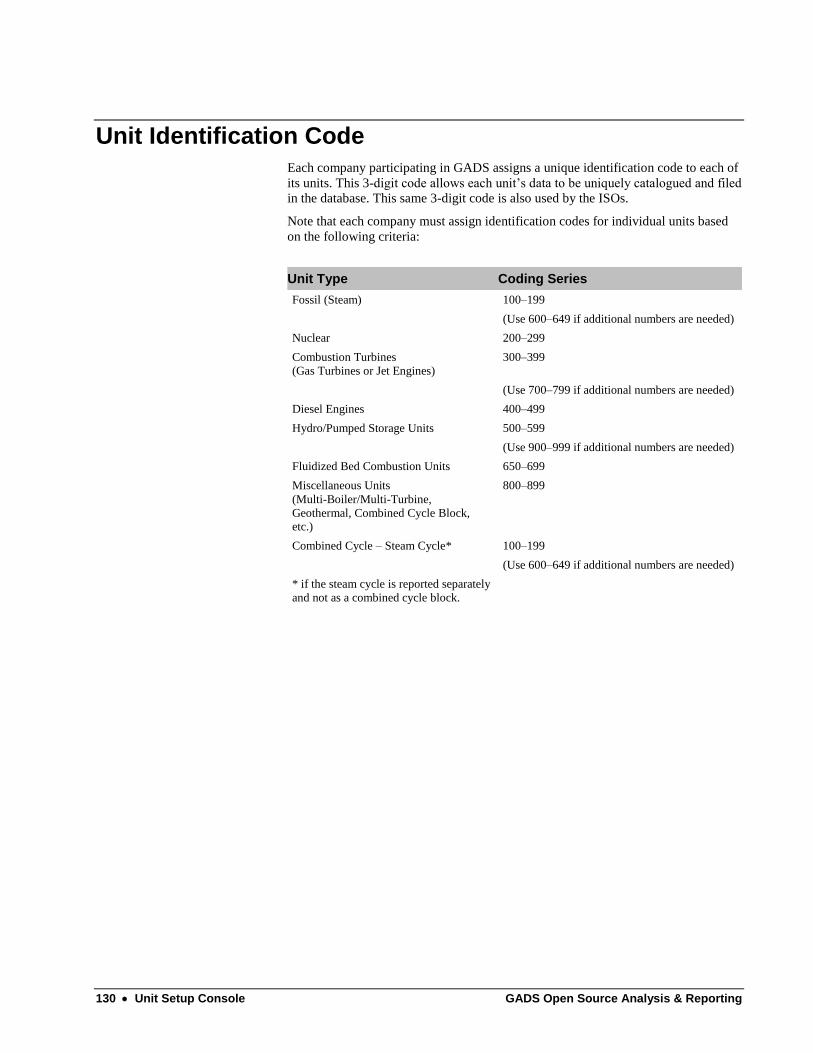
130 Unit Setup Console GADS Open Source Analysis & Reporting
Unit Identification Code
Each company participating in GADS assigns a unique identification code to each of
its units. This 3-digit code allows each unit‘s data to be uniquely catalogued and filed
in the database. This same 3-digit code is also used by the ISOs.
Note that each company must assign identification codes for individual units based
on the following criteria:
Unit Type Coding Series
Fossil (Steam) 100–199
(Use 600–649 if additional numbers are needed)
Nuclear 200–299
Combustion Turbines
(Gas Turbines or Jet Engines)
300–399
(Use 700–799 if additional numbers are needed)
Diesel Engines 400–499
Hydro/Pumped Storage Units 500–599
(Use 900–999 if additional numbers are needed)
Fluidized Bed Combustion Units 650–699
Miscellaneous Units
(Multi-Boiler/Multi-Turbine,
Geothermal, Combined Cycle Block, etc.)
800–899
Combined Cycle – Steam Cycle* 100–199
(Use 600–649 if additional numbers are needed)
* if the steam cycle is reported separately
and not as a combined cycle block.
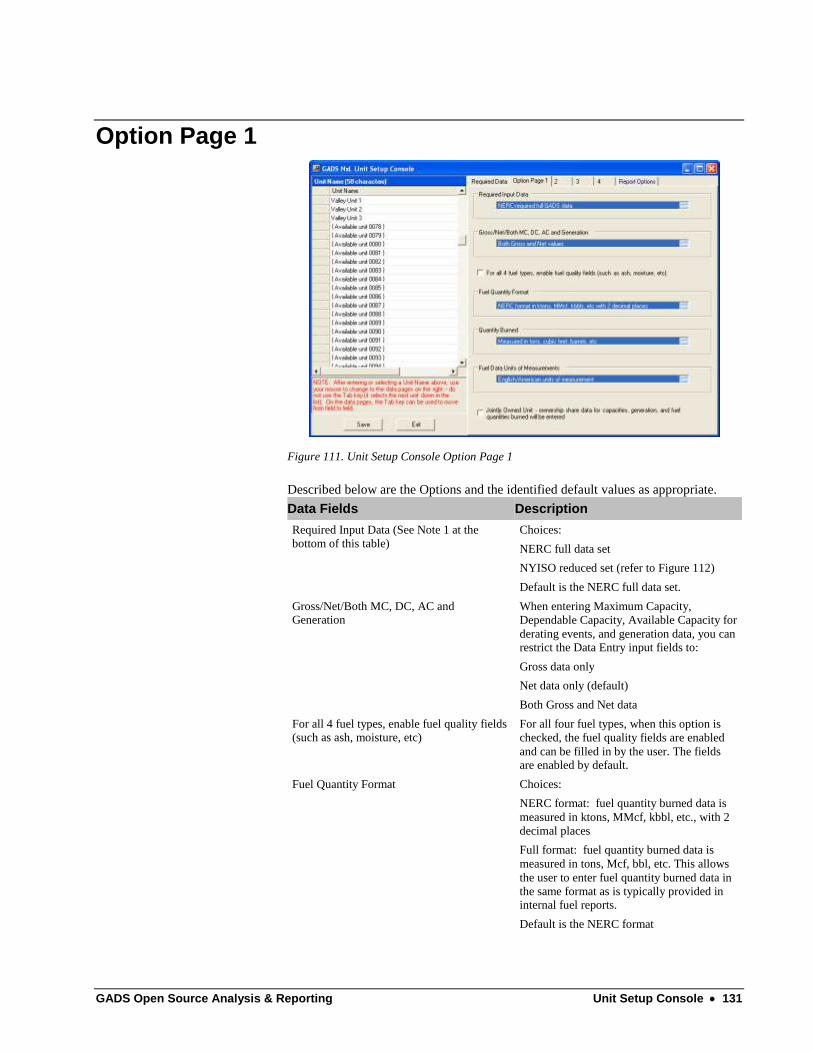
GADS Open Source Analysis & Reporting Unit Setup Console 131
Option Page 1
Figure 111. Unit Setup Console Option Page 1
Described below are the Options and the identified default values as appropriate.
Data Fields Description
Required Input Data (See Note 1 at the
bottom of this table)
Choices:
NERC full data set
NYISO reduced set (refer to Figure 112)
Default is the NERC full data set.
Gross/Net/Both MC, DC, AC and Generation
When entering Maximum Capacity,
Dependable Capacity, Available Capacity for
derating events, and generation data, you can restrict the Data Entry input fields to:
Gross data only
Net data only (default)
Both Gross and Net data
For all 4 fuel types, enable fuel quality fields (such as ash, moisture, etc)
For all four fuel types, when this option is
checked, the fuel quality fields are enabled
and can be filled in by the user. The fields are enabled by default.
Fuel Quantity Format Choices:
NERC format: fuel quantity burned data is
measured in ktons, MMcf, kbbl, etc., with 2
decimal places
Full format: fuel quantity burned data is
measured in tons, Mcf, bbl, etc. This allows
the user to enter fuel quantity burned data in
the same format as is typically provided in internal fuel reports.
Default is the NERC format

132 Unit Setup Console GADS Open Source Analysis & Reporting
Data Fields Description
Quantity Burned Choices:
Fuel quantity burned data is in ktons, MMcf,
kbbl, etc – consistent with the Fuel Quantity
Format selection above. (Default)
Fuel quantity burned data is in MMBtu –
primarily used for gas-fueled units, but any
fuel type can use this measurement selection.
The default choice is the same as NERC requires.
Fuel Data Units of Measurement Choices:
Metric (SI) units of measurements
English units of measurements
Default is English (United States).
Jointly Owned Unit This is a jointly-owned unit and the
ownership share of
- capacity (GMC/GDC and/or NMC/NDC)
- gross and/or net generation (MWh) and
- fuels quantity burned data
will be entered for this unit.
Default is false
Note 1 – Required Input Data option
NYISO does not require that the full NERC GADS data set be submitted to the ISO
each month. Figure 112 shows the ―minimum‖ required data.
Because of these requirements, some clients have requested that the Data Entry
software not require the full NERC GADS data set to be input. For example, gross
maximum capacity, gross dependable capacity, gross actual generation, all fuel data,
and the GADS event 02–99 records are NOT required NYISO submissions.
Therefore, clients did not want to be required to enter more data than the NYISO
requires.
As a result, when the NYISO-required reduced GADS data is selected for this
option, various input fields and selected validations are disabled to allow the user to
enter only the NYISO-required data, and no other data.
The NYISO data set can be
created from the full NERC
GADS data, but the reverse
is not true for creating
NERC, PJM and ISO-NE
output files when only the
NYISO dataset is input.
However, you can still input the full NERC GADS data, and send to NYISO only the
required GADS data subset. This is one of the output options with the GADS Open
Source Data Entry software. To do this, simply select the NERC-required full
GADS data choice for the Required Input Data option. When you prepare to send
the data to NYISO, select NYISO data as the output option. When the NYISO ASCII
file is created, it will contain only the NYISO-required output data fields.
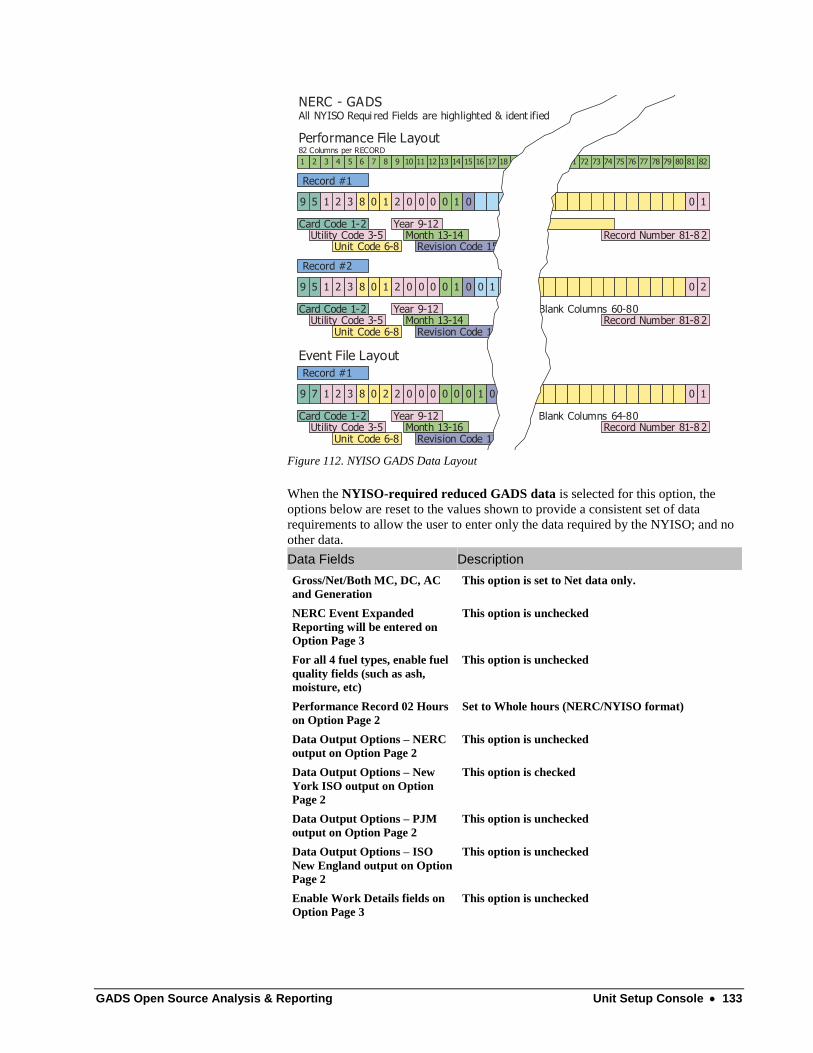
GADS Open Source Analysis & Reporting Unit Setup Console 133
NERC - GADSAll NYISO Requi red Fields are highlighted & ident ified
Performance File Layout
Event File Layout
82 Columns per RECORD
1 2 3 4 5 6 7 8 9 10 11 12 13 14 15 16 17 18 19 70 71 72 73 74 75 76 77 78 79 80 81 82
Record #1
9 5 1 2 3 8 0 1 2 0 0 0 0 1 0 0 1
Year 9-12Month 13-14
Revision Code 15
Card Code 1-2Utility Code 3-5 Record Number 81-8 2
Unit Code 6-8
Record #2
9 5 1 2 3 8 0 1 2 0 0 0 0 1 0 0 1 0 0 2
Year 9-12 Blank Columns 60-80Month 13-14
Revision Code 15
Card Code 1-2Utility Code 3-5 Record Number 81-8 2
Unit Code 6-8
Record #1
9 7 1 2 3 8 0 2 2 0 0 0 0 0 0 1 0 0 1
Year 9-12 Blank Columns 64-80Month 13-16
Revision Code 17
Card Code 1-2Utility Code 3-5 Record Number 81-8 2
Unit Code 6-8
Figure 112. NYISO GADS Data Layout
When the NYISO-required reduced GADS data is selected for this option, the
options below are reset to the values shown to provide a consistent set of data
requirements to allow the user to enter only the data required by the NYISO; and no
other data.
Data Fields Description
Gross/Net/Both MC, DC, AC
and Generation
This option is set to Net data only.
NERC Event Expanded
Reporting will be entered on
Option Page 3
This option is unchecked
For all 4 fuel types, enable fuel
quality fields (such as ash,
moisture, etc)
This option is unchecked
Performance Record 02 Hours
on Option Page 2
Set to Whole hours (NERC/NYISO format)
Data Output Options – NERC
output on Option Page 2
This option is unchecked
Data Output Options – New
York ISO output on Option
Page 2
This option is checked
Data Output Options – PJM
output on Option Page 2
This option is unchecked
Data Output Options – ISO
New England output on Option
Page 2
This option is unchecked
Enable Work Details fields on
Option Page 3
This option is unchecked

134 Unit Setup Console GADS Open Source Analysis & Reporting
Option Page 2
Figure 113. Unit Setup Console Option Page 2
Described below are the Options and the identified default values as appropriate.
Data Fields Description
Performance Record 02 Hours Choices:
Whole hours (NERC/NYISO format)
Hours to 2 decimal places (PJM format)
Default is Whole hours.
This unit enters Pumping Hours Does this unit enter pumping data?
If it is a Hydro/Pumped Storage unit type,
checking this option enables the Performance
02 record hours data field so that its pumping
hours can be input; otherwise, it is disabled
Default is checked/enabled.
This unit enters Synchronous Condensing
Hours
Does this unit enter synchronous condensing
data?
If it operates in a synchronous condensing
mode and the hours will be reported on the
Performance 02 record, checking this option
enables the Performance 02 record hours
data field so that its synchronous condensing hours can be input; otherwise, it is disabled.
Default is checked/enabled for CT/Hydro.

GADS Open Source Analysis & Reporting Unit Setup Console 135
Data Fields Description
Data Output Options – NERC output If this option is checked, when the NERC
output data files are created, this unit‘s data is included in the output file.
Data Output Options – NYISO output If this option is checked, when the NYISO
output data files are created, this unit‘s data is included in the output file.
Data Output Options – PJM output If this option is checked, when the PJM
output data files are created, this unit‘s data is included in the output file.
Data Output Options – ISO-NE output If this option is checked, when the ISO-NE
output data files are created, this unit‘s data is included in the output file.
Reporting of Events Choices:
All event data are reported. (Default)
All event data EXCEPT Reserve Shutdown
events are reported.
No Event Data are reported.

136 Unit Setup Console GADS Open Source Analysis & Reporting
Option Page 3
Figure 114. Unit Setup Console Option Page 3
Described below are the Options and the identified default values as appropriate.
Data Fields Description
Enable Work Details fields Does this unit report Work Details on the
Event records? Default is true (checked).
Enable Bulk RS screen When entering Reserve Shutdown events,
enable bulk RS screen?
The software has a special screen that allows
generating units that have a large number of
RS events to quickly and easily enter only
the start of event and end of event
dates/times and the software creates the rest
of the RS event record.
This is primarily a benefit for peaking units
that have a large number of RS events per month.
Default is false (not checked).
GADS Open Source Analysis & Reporting Unit Setup Console 137
Data Fields Description
NERC Event Expanded Data will be entered Will this unit input the NERC expanded data
in the event verbal description field columns
50–65? This is primarily aimed at combustion turbine/jet engine units.
If you enter the optional Expanded Data
Reporting data fields for this unit, check this option.
Default is not checked.
Copy the Cause Code Verbal Description
into the Event Description field
If you want to enable the software feature to
copy the NERC GADS Cause Code
Description into the Event Description field, check this option.
Default is false (Event Description filled in
by hand).
Display the Cause Code Extension field The 2-character Cause Code Extension field
is an optional field.
If this option is checked, the software will
display the Cause Code Extension combo
box with the NERC-defined list of valid cause code extensions.
Since this is optional, the default is false.
User can also enter custom values (editable) The Cause Code Extension is a combo box.
This option tells the software whether or not
the user can enter free-form text (editable).
Default is false.
Use PJM method to determine Unit Attempted and Actual Starts
Even if the unit‘s data is not reported to
PJM, you can have the software determine
the Unit Attempted and Actual Starts from
the Event data using the PJM methodology.
This is done primarily for consistency within
a generating fleet consisting of both PJM and
non-PJM units.
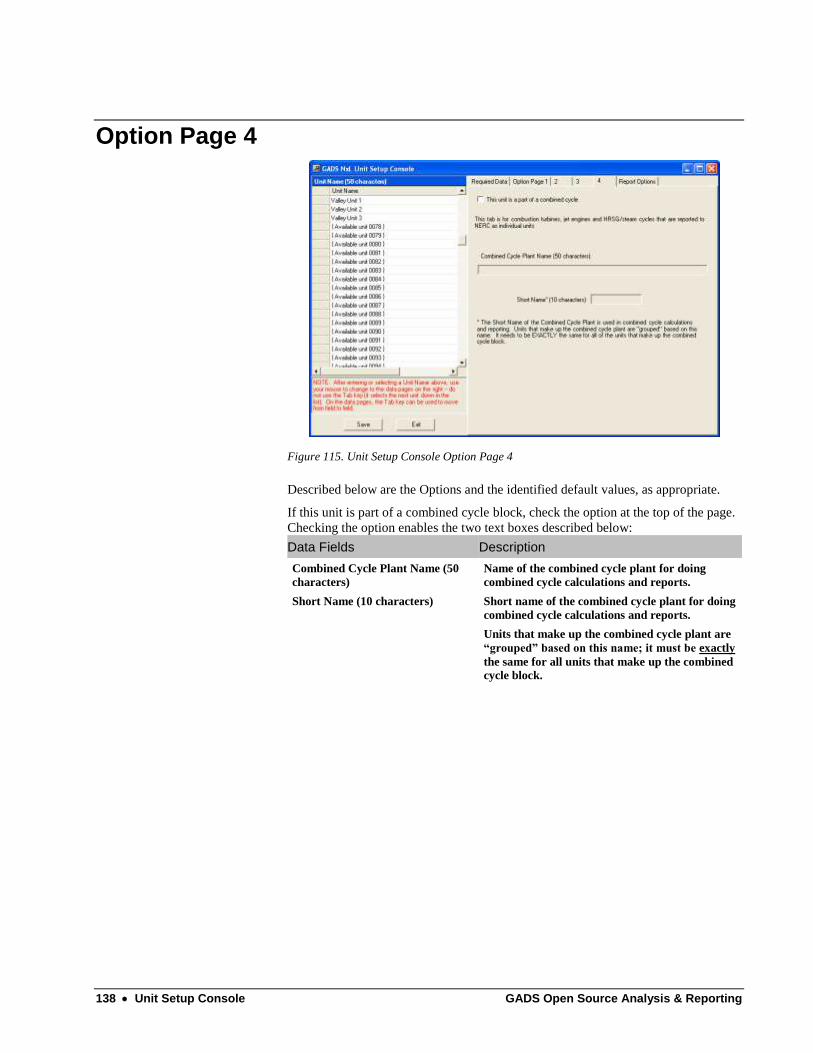
138 Unit Setup Console GADS Open Source Analysis & Reporting
Option Page 4
Figure 115. Unit Setup Console Option Page 4
Described below are the Options and the identified default values, as appropriate.
If this unit is part of a combined cycle block, check the option at the top of the page.
Checking the option enables the two text boxes described below:
Data Fields Description
Combined Cycle Plant Name (50
characters)
Name of the combined cycle plant for doing
combined cycle calculations and reports.
Short Name (10 characters) Short name of the combined cycle plant for doing
combined cycle calculations and reports.
Units that make up the combined cycle plant are
“grouped” based on this name; it must be exactly
the same for all units that make up the combined
cycle block.
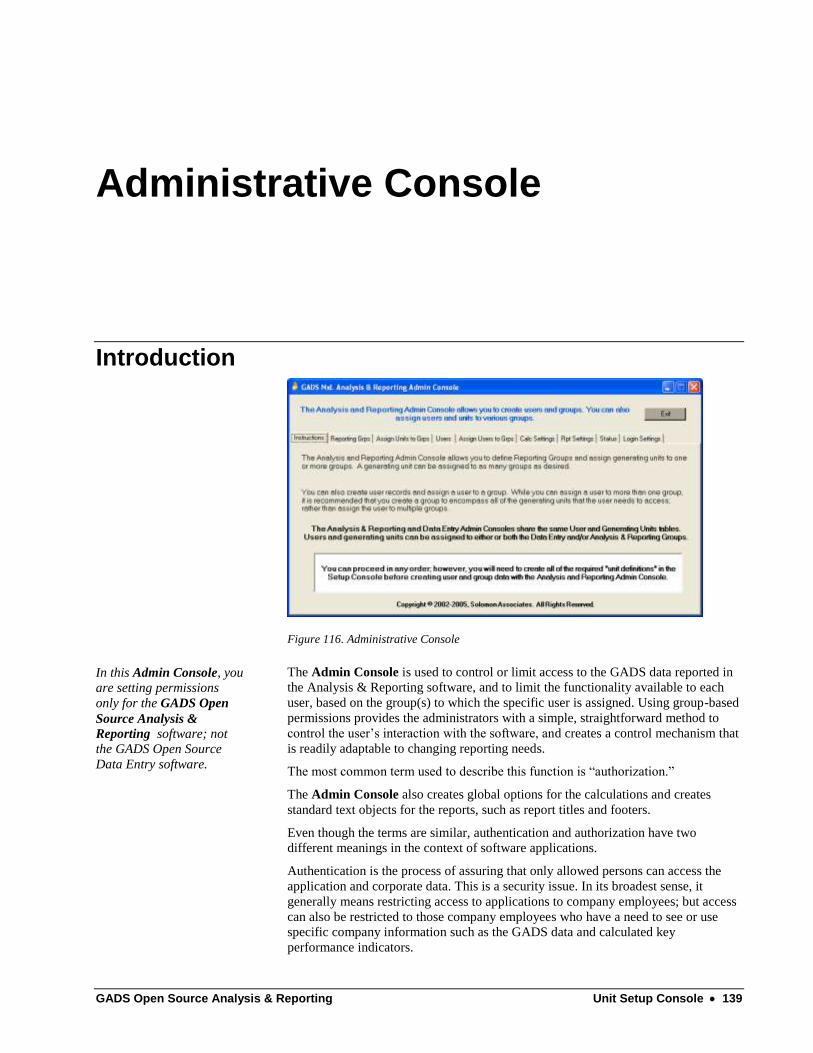
GADS Open Source Analysis & Reporting Unit Setup Console 139
Administrative Console
Introduction
Figure 116. Administrative Console
In this Admin Console, you
are setting permissions
only for the GADS Open
Source Analysis &
Reporting software; not
the GADS Open Source
Data Entry software.
The Admin Console is used to control or limit access to the GADS data reported in
the Analysis & Reporting software, and to limit the functionality available to each
user, based on the group(s) to which the specific user is assigned. Using group-based
permissions provides the administrators with a simple, straightforward method to
control the user‘s interaction with the software, and creates a control mechanism that
is readily adaptable to changing reporting needs.
The most common term used to describe this function is ―authorization.‖
The Admin Console also creates global options for the calculations and creates
standard text objects for the reports, such as report titles and footers.
Even though the terms are similar, authentication and authorization have two
different meanings in the context of software applications.
Authentication is the process of assuring that only allowed persons can access the
application and corporate data. This is a security issue. In its broadest sense, it
generally means restricting access to applications to company employees; but access
can also be restricted to those company employees who have a need to see or use
specific company information such as the GADS data and calculated key
performance indicators.
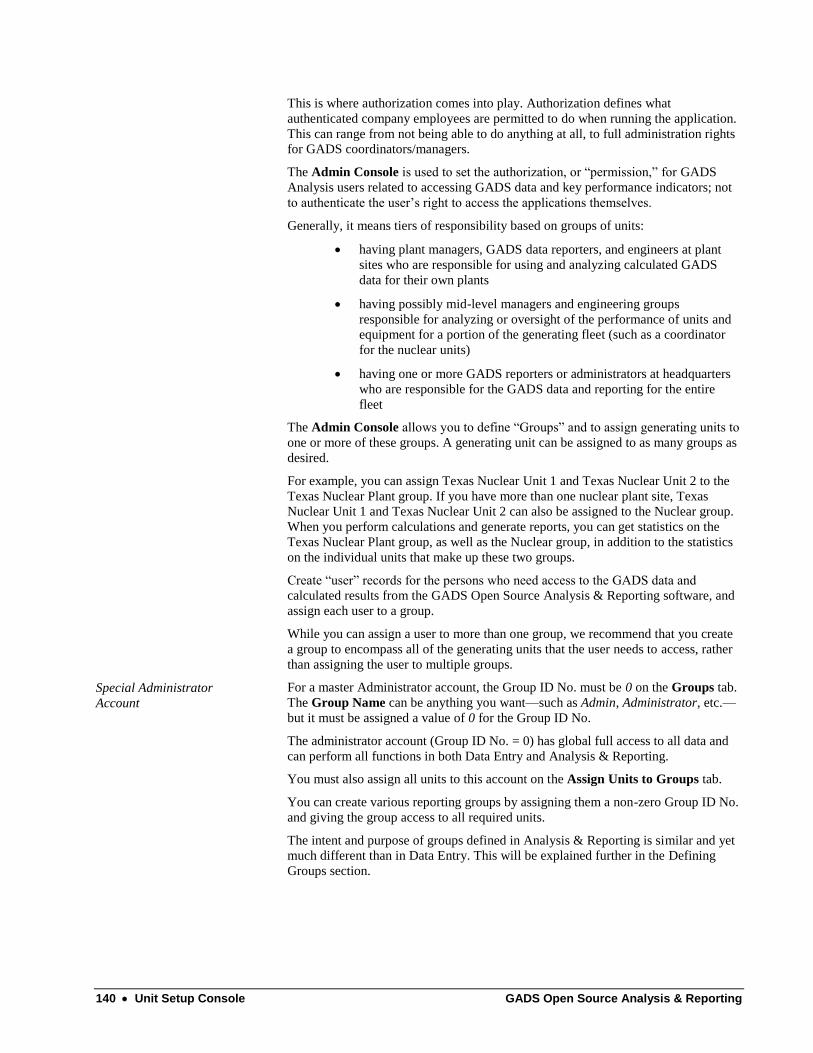
140 Unit Setup Console GADS Open Source Analysis & Reporting
This is where authorization comes into play. Authorization defines what
authenticated company employees are permitted to do when running the application.
This can range from not being able to do anything at all, to full administration rights
for GADS coordinators/managers.
The Admin Console is used to set the authorization, or ―permission,‖ for GADS
Analysis users related to accessing GADS data and key performance indicators; not
to authenticate the user‘s right to access the applications themselves.
Generally, it means tiers of responsibility based on groups of units:
having plant managers, GADS data reporters, and engineers at plant
sites who are responsible for using and analyzing calculated GADS
data for their own plants
having possibly mid-level managers and engineering groups
responsible for analyzing or oversight of the performance of units and
equipment for a portion of the generating fleet (such as a coordinator
for the nuclear units)
having one or more GADS reporters or administrators at headquarters
who are responsible for the GADS data and reporting for the entire
fleet
The Admin Console allows you to define ―Groups‖ and to assign generating units to
one or more of these groups. A generating unit can be assigned to as many groups as
desired.
For example, you can assign Texas Nuclear Unit 1 and Texas Nuclear Unit 2 to the
Texas Nuclear Plant group. If you have more than one nuclear plant site, Texas
Nuclear Unit 1 and Texas Nuclear Unit 2 can also be assigned to the Nuclear group.
When you perform calculations and generate reports, you can get statistics on the
Texas Nuclear Plant group, as well as the Nuclear group, in addition to the statistics
on the individual units that make up these two groups.
Create ―user‖ records for the persons who need access to the GADS data and
calculated results from the GADS Open Source Analysis & Reporting software, and
assign each user to a group.
While you can assign a user to more than one group, we recommend that you create
a group to encompass all of the generating units that the user needs to access, rather
than assigning the user to multiple groups.
Special Administrator
Account
For a master Administrator account, the Group ID No. must be 0 on the Groups tab.
The Group Name can be anything you want—such as Admin, Administrator, etc.—
but it must be assigned a value of 0 for the Group ID No.
The administrator account (Group ID No. = 0) has global full access to all data and
can perform all functions in both Data Entry and Analysis & Reporting.
You must also assign all units to this account on the Assign Units to Groups tab.
You can create various reporting groups by assigning them a non-zero Group ID No.
and giving the group access to all required units.
The intent and purpose of groups defined in Analysis & Reporting is similar and yet
much different than in Data Entry. This will be explained further in the Defining
Groups section.

GADS Open Source Analysis & Reporting Unit Setup Console 141
The Admin Console maintains the data in four database tables:
ARGroups
ARUnitPerm
NGUsers
ARUserToGroup
The NGUsers table contains the list of valid users and is shared with the Data Entry
software; there is only one user list to maintain.
It also utilizes the data stored in the Setup table.
Defining Users
Defining the users who will have access to the GADS data and calculated results is
fairly straightforward.
If there are no users defined in the NGUsers table, there are no restrictions or
limitations regarding which generating units each user is allowed to access.
Special note for
Administrators
As an administrator, you need to make sure that your user information is included in
this list, or you will not be able to assign yourself to the Admin group.
Figure 117. Define Users
The First_Name and Last_Name fields are obvious; however, the programs
themselves do not use either of these fields. The fields are there because the
company Windows Login IDs may not allow you to readily identify the user by their
Login ID.
The Email_Address, Phone, and LocationDesc fields are optional, but useful,
providing a handy information source, should you need to contact a particular
person.

142 Unit Setup Console GADS Open Source Analysis & Reporting
The intent of the LocationDesc field is to provide a note about the person‘s office
location (e.g., ―Bob‘s desk is in the room next to the maintenance foreman‘s office‖),
but it can be used for any notes that you think would be helpful.
Special Note –
A Must-Read Section
The Login ID and Password fields require special attention, depending on the type of
access the user needs.
FOR THE WINDOWS UI, the Login ID must be the Windows ID that they use to
log in to Windows on their machines.
FOR THE WEB UI WITH THE USER INSIDE THE FIREWALL, normally IIS
will authenticate the user using the Integrated Windows Authentication and pass the
user‘s ID to the GADS Open Source software. If the user ID sent by IIS matches the
Login ID created with the Admin Console, the user can perform their authorized
functions. The user has been ―authenticated‖ by IIS and the password is not required.
If the user ID sent by IIS does not match any of the Login IDs stored in the GADS
Open Source tables, then the user will be required to fill in both the Login ID and
Password in a GADS Open Source login web page. If the supplied Login ID and
Password match those created with the Admin Console, the user can perform their
authorized functions.
FOR THE WEB UI WITH THE USER OUTSIDE THE COMPANY’S
FIREWALL, the user will be required to fill in both the Login ID and Password in a
GADS Open Source login web page. If the supplied Login ID and Password match
those created with the Admin Console, the user can perform their authorized
functions.
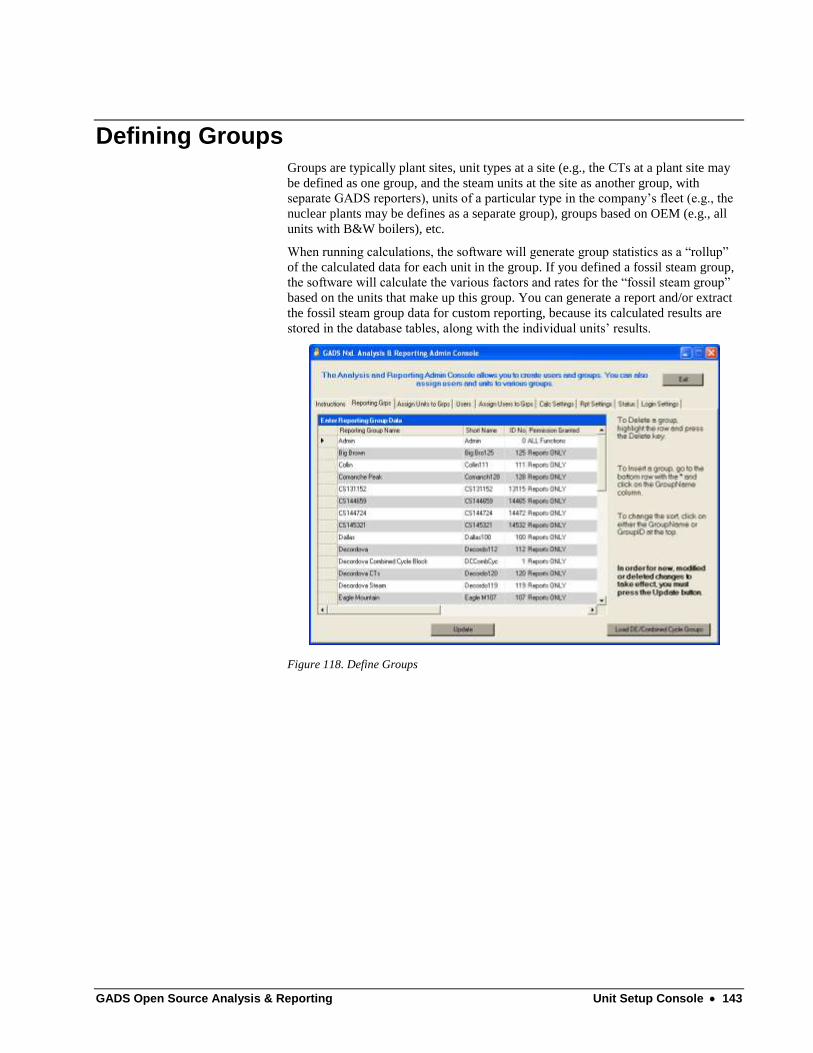
GADS Open Source Analysis & Reporting Unit Setup Console 143
Defining Groups
Groups are typically plant sites, unit types at a site (e.g., the CTs at a plant site may
be defined as one group, and the steam units at the site as another group, with
separate GADS reporters), units of a particular type in the company‘s fleet (e.g., the
nuclear plants may be defines as a separate group), groups based on OEM (e.g., all
units with B&W boilers), etc.
When running calculations, the software will generate group statistics as a ―rollup‖
of the calculated data for each unit in the group. If you defined a fossil steam group,
the software will calculate the various factors and rates for the ―fossil steam group‖
based on the units that make up this group. You can generate a report and/or extract
the fossil steam group data for custom reporting, because its calculated results are
stored in the database tables, along with the individual units‘ results.
Figure 118. Define Groups

144 Unit Setup Console GADS Open Source Analysis & Reporting
Figure 119. Assign Granularities, Part 1
Figure 120. Assign Granularities, Part 2
―Groups‖ can be any grouping of units, and any given unit can be in more than one
group. As an example, a nuclear unit can be in its plant group, as well as your fleet‘s
nuclear group.
Each named group must also have a unique ID No. assigned.

GADS Open Source Analysis & Reporting Unit Setup Console 145
Special Administrator
Account/Group
For a master Administrator account, the Group ID No. must be 0 on the Groups tab.
The Group Name can be anything you want—such as Admin, Administrator, etc.—
but it must be assigned a value of 0 for the Group ID No.
The administrator account (Group ID No. = 0) has global full access to all data and
can perform all functions in both Data Entry and Analysis & Reporting.
You must also assign all units to this account on the Assign Units to Groups tab.
You can create ―divisional administrators‖ or ―sub-administrators‖ by assigning
them a non-zero Group ID No. and giving the group access to the required units.
Permission Granted has 4 choices, which can be selected by clicking on the right side
of the Permission Granted box for the selected group, using the down arrow to
activate the drop-down list, and selecting the permission to be granted to this group.
Figure 121. Assign Permissions Granted
These choices determine which tasks the group members are permitted or authorized
to perform. If a person is assigned to more than one group, they will be assigned the
highest level of authorization allowed by any or all of the groups.
This functionality is tied to the menu items on the main window of the Analysis &
Reporting software; depending on the permissions granted, some menu items are
disabled and/or not visible, to prevent the user from performing functions they are
not authorized to do. The four choices are described as follows:
Reports ONLY – Users can only see the Generate Reports command,
and can only generate the four report groups, not the Custom
Calculations. This setting might be used for accounting groups or
managers who only need to run the standard reports.
Reports & Spec Calcs – Users can only see the Generate Reports
command, allowing them to generate the four report groups and
perform Custom Calculations. This setting might be used for
engineers or engineering groups who not only need to run the standard
reports, but also need to run special calculations from time to time.
146 Unit Setup Console GADS Open Source Analysis & Reporting
Reports & ALL Calcs – Users can see both the Create Data Tables
and Generate Reports commands, and have the full functionality
listed under both menu items. This setting might be used for staff
assigned to the group responsible for GADS calculations and report
generation. They are not authorized to snapshot the data from the Data
Entry tables..
ALL Functions – Users can see all menu items and are fully
authorized to perform all Analysis & Reporting functions, including the
functions listed under Load Data.
The units for which a user is allowed to see/generate reports and the tasks the user
can perform are all tied to the group or groups to which they are assigned.
Users assigned to more than one group (such as the administrators) are granted
access to units based on the combination of permissions for all assigned groups.
They are authorized to perform the functions assigned to the group with the highest
level of functionality, rather than restricting the user‘s ability to do his/her job by
assigning the most severe limitations.
The groups must also be assigned the granularities to be calculated during the
standard production run (Create Data Tables | Perform Calculations).
For example, the fleet needs only monthly and yearly statistics, but the nuclear units
also need hourly statistics. Therefore, you can assign monthly and yearly
granularities to the All Units in Fleet group by checking those two columns on the
All Units in Fleet line. On the Nuclear Units group line, you would check the
Hourly, Monthly, and Yearly columns. Being in both groups won‘t cause the nuclear
to be run twice. They will, however, be included in the Monthly and Yearly records
for both the All Units in Fleet group and the Nuclear Units group. Only the nuclear
units individually and the ―Nuclear Units‖ group will have ―Hourly‖ records in the
database tables.
Unlike some software applications that only store the monthly statistics or the yearly
statistics in their database, GADS Open Source Analysis & Reporting stores all
needed statistics in the database tables at the same time. This provides reports more
quickly and with less hassle, and makes it easier to create custom reports or data
extractions.
You might assume that the calculations take longer since the software is doing all the
granularities in one run; however, since the software only calculates the revised or
new data, the calculations are amazingly fast, even when calculating all granularities
in the same run.
As indicated, the calculations (Create Data Tables | Perform Calculations) are
performed only for units and years with revised or new performance and/or event
data. For example, it is 2005, and you are entering and revising GADS event and
performance records in GADS Open Source Data Entry for all the units in your fleet.
However, this month you also need to update a performance or event record from
2002 for Dallas Unit No. 1. When you Perform Calculations, the software calculates
2004 for all units (in most cases) and Dallas Unit No. 1 for 2002. By incorporating
smart processing (Smart Proc™) into the calculation engine, all historical years and
units that are not revised are not re-calculated, saving a tremendous amount of time.
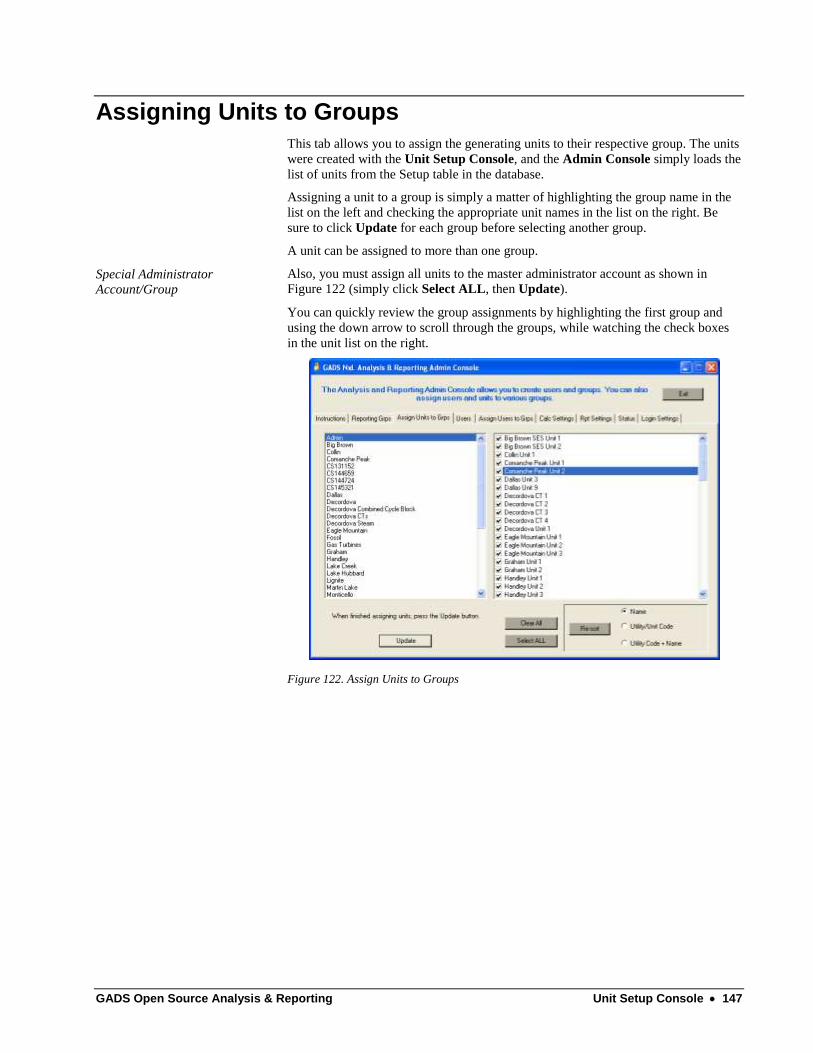
GADS Open Source Analysis & Reporting Unit Setup Console 147
Assigning Units to Groups
This tab allows you to assign the generating units to their respective group. The units
were created with the Unit Setup Console, and the Admin Console simply loads the
list of units from the Setup table in the database.
Assigning a unit to a group is simply a matter of highlighting the group name in the
list on the left and checking the appropriate unit names in the list on the right. Be
sure to click Update for each group before selecting another group.
A unit can be assigned to more than one group.
Special Administrator
Account/Group
Also, you must assign all units to the master administrator account as shown in
Figure 122 (simply click Select ALL, then Update).
You can quickly review the group assignments by highlighting the first group and
using the down arrow to scroll through the groups, while watching the check boxes
in the unit list on the right.
Figure 122. Assign Units to Groups
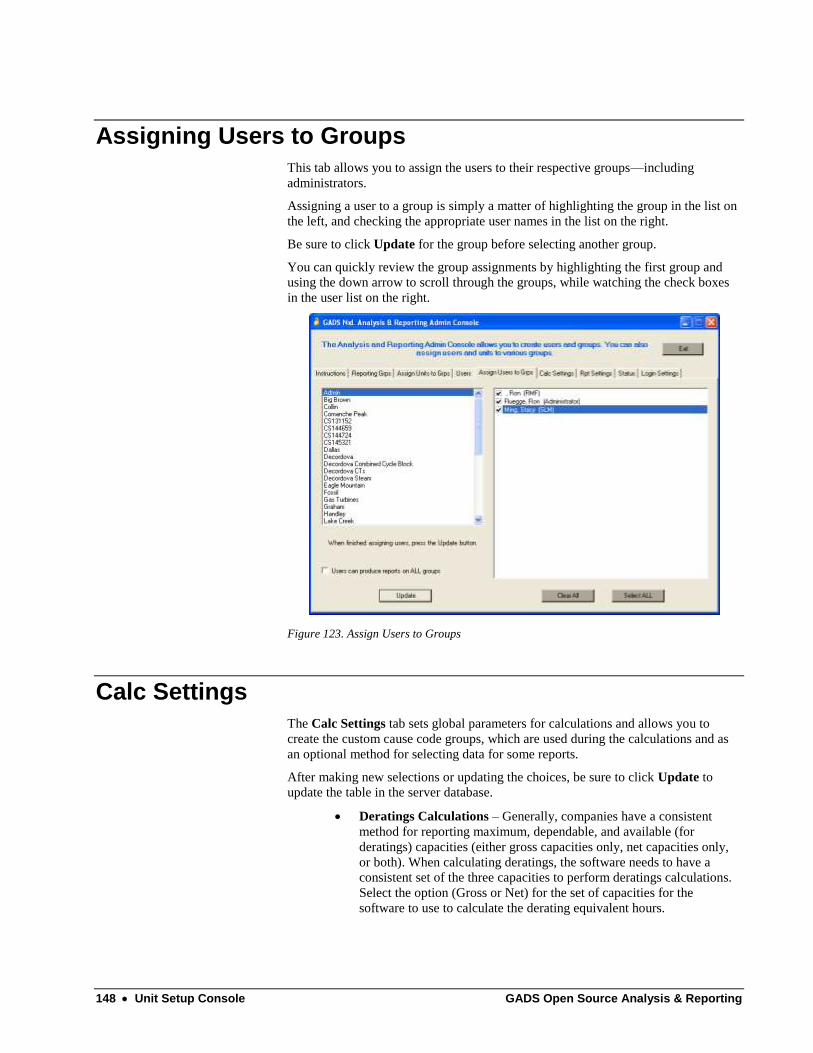
148 Unit Setup Console GADS Open Source Analysis & Reporting
Assigning Users to Groups
This tab allows you to assign the users to their respective groups—including
administrators.
Assigning a user to a group is simply a matter of highlighting the group in the list on
the left, and checking the appropriate user names in the list on the right.
Be sure to click Update for the group before selecting another group.
You can quickly review the group assignments by highlighting the first group and
using the down arrow to scroll through the groups, while watching the check boxes
in the user list on the right.
Figure 123. Assign Users to Groups
Calc Settings
The Calc Settings tab sets global parameters for calculations and allows you to
create the custom cause code groups, which are used during the calculations and as
an optional method for selecting data for some reports.
After making new selections or updating the choices, be sure to click Update to
update the table in the server database.
Deratings Calculations – Generally, companies have a consistent
method for reporting maximum, dependable, and available (for
deratings) capacities (either gross capacities only, net capacities only,
or both). When calculating deratings, the software needs to have a
consistent set of the three capacities to perform deratings calculations.
Select the option (Gross or Net) for the set of capacities for the
software to use to calculate the derating equivalent hours.

GADS Open Source Analysis & Reporting Unit Setup Console 149
Figure 124. Choose Calculation Settings
Deratings Sorting – When overlapping deratings have the same start
of event date/times, the software needs to know how to calculate these
deratings. Historically, companies have used one of the following
methods as the preferred means to calculate deratings.
o Overlapped deratings are MASKED (SHADOWED) – This
method assumes the masking (or shadowing) of all smaller
deratings by the largest overlapping derating
o All overlapping deratings are ADDITIVE – This method
assumes that all overlapping deratings are additive
o Events are in EVENT NUMBER order (NERC method) – This
method assumes that events are in Event Number order (NERC
method). NERC processes the data after sorting first by start date,
then by event number. This means that when start date/times are
identical, the derating with the lower event number is processed
first. Therefore, deratings are either shadowed or additive,
depending on the event number assigned to the derating and the
magnitude of the available capacity.
Fleet Calculations – When units are rolled up into groups, the
calculations can be either weighted by the maximum capacity or
unweighted. For an unweighted calculation, the smallest unit and the
largest unit in the group contribute equally to the group‘s calculated
statistic. For a weighted calculations, a 1000 MW unit‘s hours are given
10 times the weight of a 100 MW unit‘s hours, when they are both in
the same statistics group.
EFORd Equation – Currently, two equations define how the EFORd
is calculated. The only difference is related to the T term and requires
that all RS events be reported. The PJM/ NYISO equation does not
require reporting all RS events, and uses attempted starts in calculating
the T term. The Markov model equation requires that all RS events be
reported, and uses a count of the actual number of RS events reported
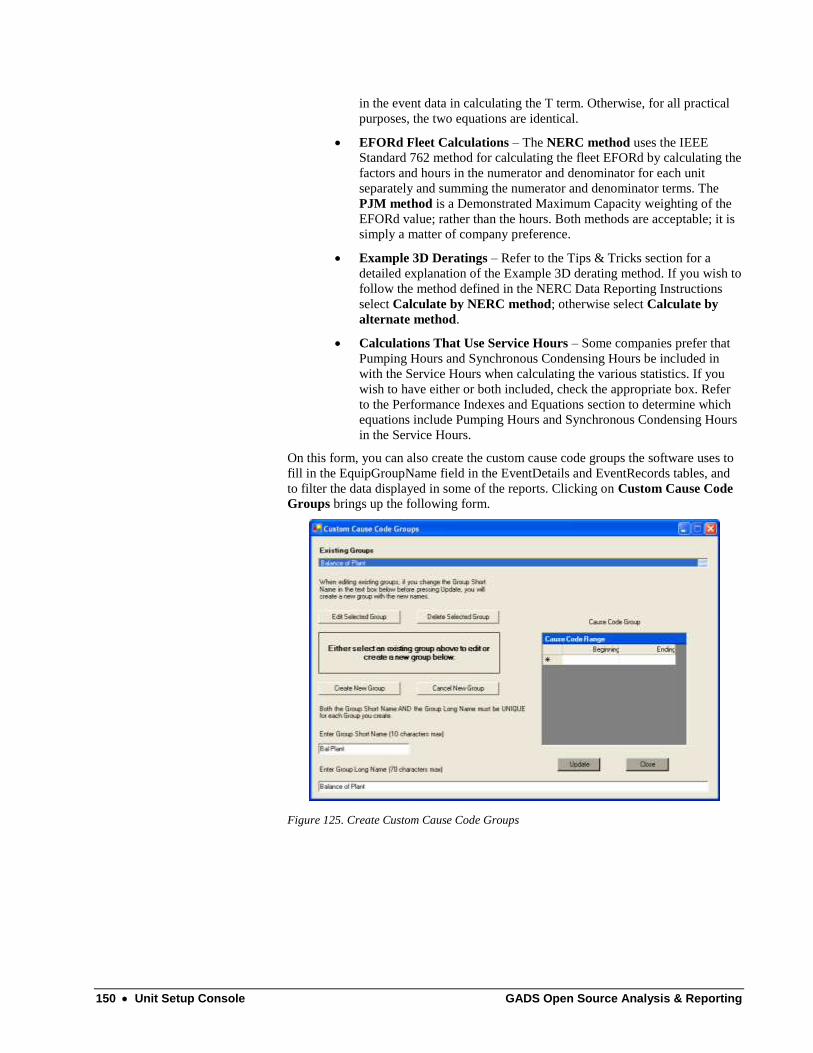
150 Unit Setup Console GADS Open Source Analysis & Reporting
in the event data in calculating the T term. Otherwise, for all practical
purposes, the two equations are identical.
EFORd Fleet Calculations – The NERC method uses the IEEE
Standard 762 method for calculating the fleet EFORd by calculating the
factors and hours in the numerator and denominator for each unit
separately and summing the numerator and denominator terms. The
PJM method is a Demonstrated Maximum Capacity weighting of the
EFORd value; rather than the hours. Both methods are acceptable; it is
simply a matter of company preference.
Example 3D Deratings – Refer to the Tips & Tricks section for a
detailed explanation of the Example 3D derating method. If you wish to
follow the method defined in the NERC Data Reporting Instructions
select Calculate by NERC method; otherwise select Calculate by
alternate method.
Calculations That Use Service Hours – Some companies prefer that
Pumping Hours and Synchronous Condensing Hours be included in
with the Service Hours when calculating the various statistics. If you
wish to have either or both included, check the appropriate box. Refer
to the Performance Indexes and Equations section to determine which
equations include Pumping Hours and Synchronous Condensing Hours
in the Service Hours.
On this form, you can also create the custom cause code groups the software uses to
fill in the EquipGroupName field in the EventDetails and EventRecords tables, and
to filter the data displayed in some of the reports. Clicking on Custom Cause Code
Groups brings up the following form.
Figure 125. Create Custom Cause Code Groups
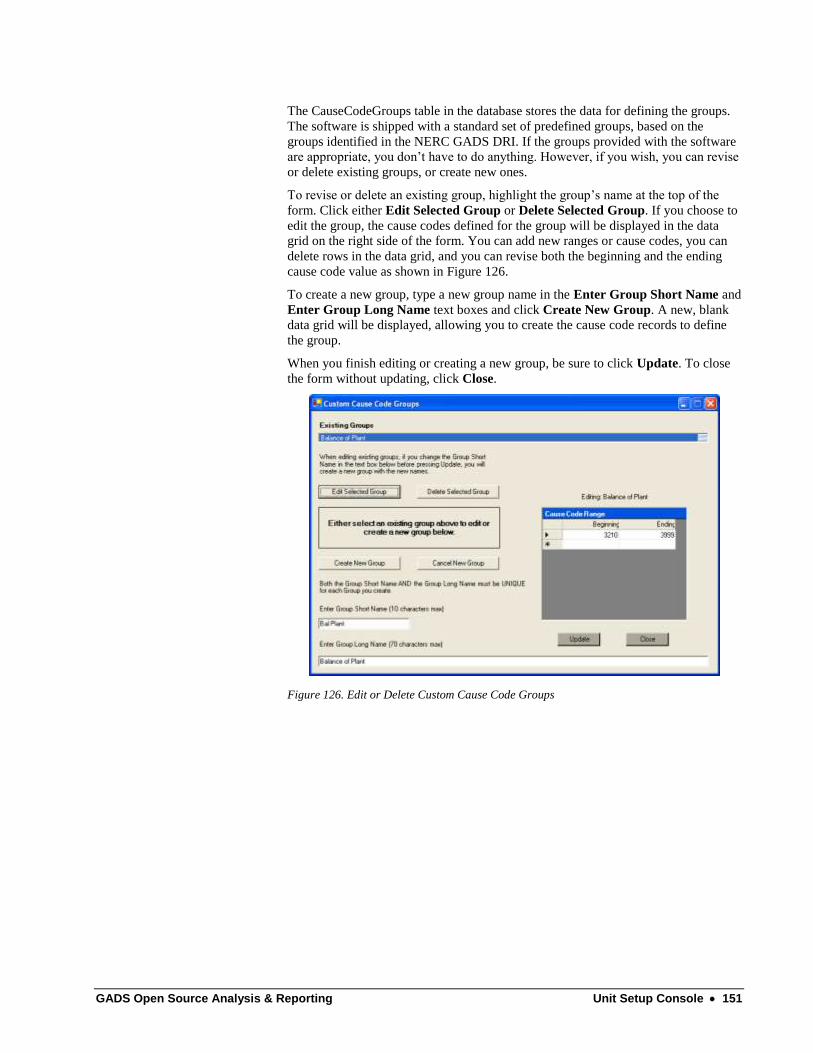
GADS Open Source Analysis & Reporting Unit Setup Console 151
The CauseCodeGroups table in the database stores the data for defining the groups.
The software is shipped with a standard set of predefined groups, based on the
groups identified in the NERC GADS DRI. If the groups provided with the software
are appropriate, you don‘t have to do anything. However, if you wish, you can revise
or delete existing groups, or create new ones.
To revise or delete an existing group, highlight the group‘s name at the top of the
form. Click either Edit Selected Group or Delete Selected Group. If you choose to
edit the group, the cause codes defined for the group will be displayed in the data
grid on the right side of the form. You can add new ranges or cause codes, you can
delete rows in the data grid, and you can revise both the beginning and the ending
cause code value as shown in Figure 126.
To create a new group, type a new group name in the Enter Group Short Name and
Enter Group Long Name text boxes and click Create New Group. A new, blank
data grid will be displayed, allowing you to create the cause code records to define
the group.
When you finish editing or creating a new group, be sure to click Update. To close
the form without updating, click Close.
Figure 126. Edit or Delete Custom Cause Code Groups

152 Unit Setup Console GADS Open Source Analysis & Reporting
Rpt Settings
Figure 127. Select Report Settings
The Rpt Settings tab, shown in Figure 127, allows you to enter the three lines that
will appear at the top of your reports. This can be anything you want. When you run
the reports, you will have an opportunity to customize the third line of the report;
however, if you choose not to enter a custom third line, the default text shown above
will be displayed.
In addition to the report titles, you can enter the footer text that is displayed at the
bottom of each report page. Typically, this is a statement related to the report being
company confidential. A default footer is supplied with the software, which will
automatically display when opening this form for the first time. The option buttons
determine whether the user has an option not to include the footer when the reports
are run. This is a policy issue for your company to decide.
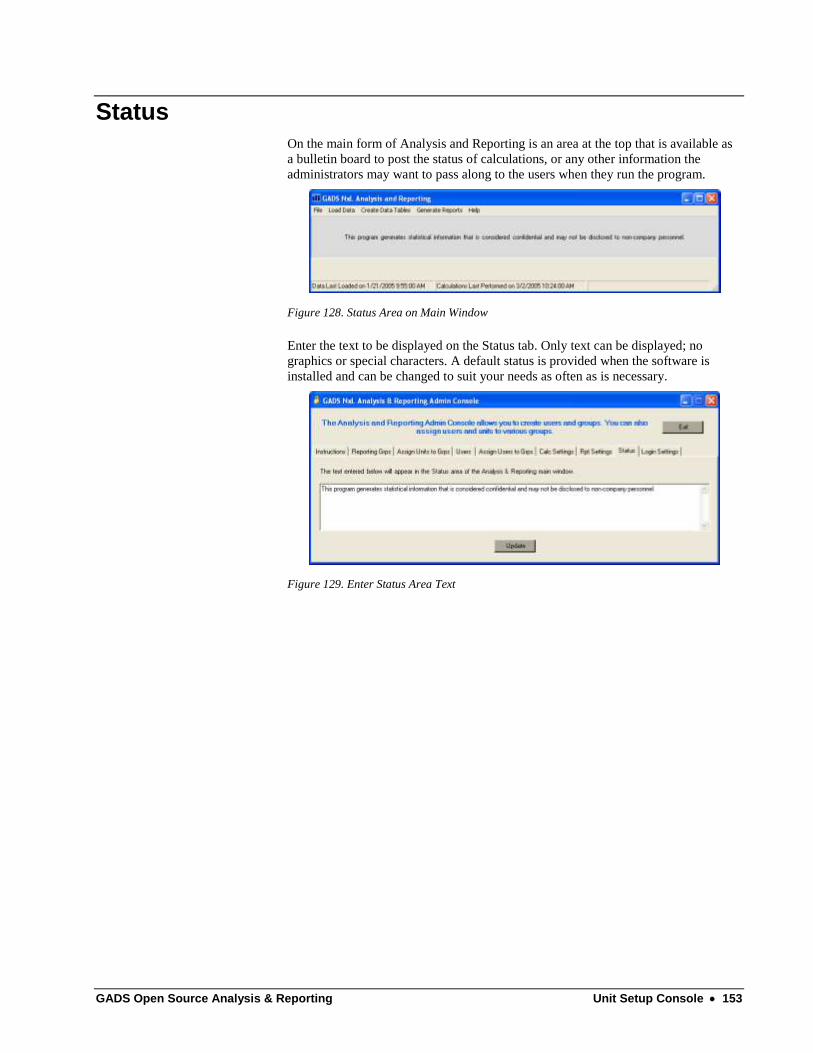
GADS Open Source Analysis & Reporting Unit Setup Console 153
Status
On the main form of Analysis and Reporting is an area at the top that is available as
a bulletin board to post the status of calculations, or any other information the
administrators may want to pass along to the users when they run the program.
Figure 128. Status Area on Main Window
Enter the text to be displayed on the Status tab. Only text can be displayed; no
graphics or special characters. A default status is provided when the software is
installed and can be changed to suit your needs as often as is necessary.
Figure 129. Enter Status Area Text

154 Unit Setup Console GADS Open Source Analysis & Reporting
Login Settings
This tab allows you to set the Administrator‘s Login ID and Password for permission
to run the Admin Console.
Initially, the Login ID and Password are blank, to allow you to run the Admin
Console after a new installation of the software.
Special Note regarding
Login ID
It is recommended that you set the Login ID on this tab to be the same as your
Windows Login ID, so you can open the Admin Console automatically without the
login dialog box popping up each time.
After a new installation, the software defaults both the Login ID and the Password to
your Windows Login ID. You may change either or both as desired; however, if the
Login ID does not match your Windows Login ID, you will be required to log in
manually each time.
Figure 130. Administrative Login Settings
GADS Open Source Analysis & Reporting Unit Setup Console 155
Glossary of Terms
% Alkalis
The sum of the average sodium and potassium contents of the fuel, to the nearest
0.1% (by weight), as obtained from an ash analysis.
Because the average heat content (Btu), ash, moisture, sulfur, alkalis, grindability
index, vanadium and phosphorus, and softening temperature values may change
during a month due to new fuel supplies, etc., these values should be weighted
averages.
% Ash
The average ash content of the fuel, to the nearest 0.1% (by weight), obtained from
an ultimate analysis of the fuel.
Because the average heat content (Btu), ash, moisture, sulfur, alkalis, grindability
index, vanadium and phosphorus, and softening temperature values may change
during a month due to new fuel supplies, etc., these values should be weighted
averages.
% Moisture
The average moisture content of the fuel, to the nearest 0.1% (by weight), obtained
from an ultimate analysis of the fuel.
Because the average heat content (Btu), ash, moisture, sulfur, alkalis, grindability
index, vanadium and phosphorus, and softening temperature values may change
during a month due to new fuel supplies, etc., these values should be weighted
averages.
% Sulfur
The average sulfur content of the fuel, to the nearest 0.1% (by weight), obtained
from an ultimate analysis of the fuel.
Because the average heat content (Btu), ash, moisture, sulfur, alkalis, grindability
index, vanadium and phosphorus, and softening temperature values may change
during a month due to new fuel supplies, etc., these values should be weighted
averages.

156 Unit Setup Console GADS Open Source Analysis & Reporting
% Vanadium and Phosphorus (Oil Units Only)
If the fuel type has been identified as oil (OO), kerosene (KE), JP4/5 (JP), or
distillate oil (DI), the sum of the average vanadium and phosphorus contents of the
fuel, to the nearest 0.1% (by weight), as obtained from an ash analysis.
Because the average heat content (Btu), ash, moisture, sulfur, alkalis, grindability
index, vanadium and phosphorus, and softening temperature values may change
during a month due to new fuel supplies, etc., these values should be weighted
averages.
Actual Unit Starts
Enter the number of times the unit was actually synchronized during the month.
The number of actual unit starts must be less than or equal to the number of
attempted unit starts.
AH
Available Hours – The sum of the Unit Service Hours (SH), Reserve Shutdown
Hours (RSH), Pumping Hours (PH) if applicable, and Synchronous Condensing
Hours (SCH) if applicable.
Ash Softening Temperature
The average ash softening temperature (°F) of the fuel. This temperature should be
determined under reducing atmosphere conditions.
Because the average heat content (Btu), ash, moisture, sulfur, alkalis, grindability
index, vanadium and phosphorus, and softening temperature values may change
during a month due to new fuel supplies, etc., these values should be weighted
averages.
Attempted Unit Starts
The number of attempts made to synchronize the unit during the month. Repeated
failures to synchronize for the same cause without attempting corrective actions are
considered a single attempt.
If startup attempts are abandoned and the unit is shut down for repairs and then
started at a future time, report two startup attempts.
Available Capacity
The capacity that is available from the unit, given the restriction imposed by the
derating event being reported, after the reduction has been taken into account.
The GAC, the NAC, or both must be completed when the event type is a derating.
Net data is preferred, but gross data must be reported to NERC if it is the only value
available. However, PJM and the New York ISO require that Net data be reported.
Data consistency is necessary to calculate availability statistics.

GADS Open Source Analysis & Reporting Unit Setup Console 157
Average Heat Content
The average heat content for the fuel, to the nearest Btu/lb. of coal, Btu/gal. of oil or
Btu/cu. ft. of gas. A weighted average if the heat content of the fuel varied.
When reporting data for geothermal units, calculate the heat content using the
following equation:
(kWh) Generation Net
(Btu/lb) 1195.5(lb) nConsumptio Steam
For nuclear units, this value is the Net Plant Heat Rate (Btu/kWh).
Cause Code Amplification Code
The purpose of the amplification code is to further identify the cause of outage by
describing the failure mode. They are alpha-numeric characters place in an unused
space following the existing cause code.
Failure modes are leaks, corrosion, personnel error, fire, etc. They are almost
identical to the GADS Failure Mechanism Codes except the Cause Code
Amplification Code is just two-characters.
Some existing cause codes contain these amplification codes as part of their
description.
The Cause Code Amplification Code allows all cause codes to be described with the
set of failure modes without increasing the number of cause codes.
It will also allow analysts to further explore the common causes of outages.
Cumulative Engine Starts at Time of Event (Gas turbine and jet engine units only)
The cumulative number of engine starts experienced by the unit at the time the event
began. This data is taken directly from the engine starts counter typically located on
the unit‘s control panel. This counter clocks cumulative engine starts since unit
startup.
Cumulative Fired Hours at Time of Event (Gas turbine and jet engine units only)
The cumulative number of fired hours experienced by the unit at the time the event
began.
This data is taken directly from the fired hours meter typically located on the unit‘s
control panel. This meter clocks cumulative operating hours since unit startup.
D1
Unplanned (Forced) Derating – Immediate – A derating that requires an immediate
reduction in capacity.
D2
Unplanned (Forced) Derating – Delayed – A derating that does not require an
immediate reduction in capacity but requires a reduction within six hours.
158 Unit Setup Console GADS Open Source Analysis & Reporting
D3
Unplanned (Forced) Derating – Postponed – A derating that can be postponed
beyond six hours but requires a reduction in capacity before the end of the next
weekend.
D4
Maintenance Derating – A derating that can be deferred beyond the end of the next
weekend but requires a reduction in capacity before the next Planned Derating (PD).
A D4 can have a flexible start date and may or may not have a predetermined
duration.
DE
Derating Extension – An extension of a Planned Derating (PD) or a Maintenance
Derating (D4) beyond its estimated completion date.
Use a DE only in instances where the original scope of work requires more time to
complete than originally scheduled. Do not use a DE in those instances where
unexpected problems or delays outside the scope of work are encountered which
render the unit incapable of full load beyond the estimated end date of the PD or D4.
The DE must start at the same time (month/day/hour/minute) that the PD or D4
ended.
Deratings
A derating exists whenever a unit is limited to some power level less than the unit‘s
Net Maximum Capacity. Similar to outages, the general derating event classification
is divided into distinct event types, based on IEEE Standard 762.
A derating starts when the unit is not capable of reaching 100% capacity. The
available capacity is based on the output of the unit and not on dispatch
requirements.
The derating ends when the equipment that caused the derating is returned to service,
whether it is used at that time by the operators or not.
More than one derating can occur at one time. It is important to have the events listed
in order where the least amount of impact on the unit is listed before the derating
with more impact.
All deratings that are greater than 2% of the unit‘s Net Maximum Capacity and
longer than 30 minutes in duration are reported.
Deratings are not caused by ambient-related conditions or system dispatch
requirements.
Dominant Derating
All deratings reported to GADS are considered additive unless reported in a more
complex manner. When reported in the complex manner, the same events are
reported more than once in order to emphasize which derating is the more dominant
of the two. It thus creates a problem with the frequency and duration of the derating
because the same derating is reported more than once.
GADS Open Source Analysis & Reporting Unit Setup Console 159
The purpose of the Dominant Derating Code is to mark the dominate derating if
more than two deratings are occurring at the same time.
By marking the dominate derating, the GADS Next Generation Analysis &
Reporting will process the cause code for that dominate derating for its full impact
and not hide part of the impact credited to other deratings.
Unit performance statistics will not be affected. Cause code statistics will be more
accurate by recording the true frequency and impact of the dominate derating.
The Dominant Derating Code will be identified by a ―D‖.
One example of how two deratings would be reported to GADS – one without the
Dominant Derating Code and one with the Dominant Derating Code – is shown in
the NERC GADS DRI as Figure III-8.
EFDH
Equivalent Unplanned (Forced) Derated Hours – Each individual Unplanned
(Forced) Derating (D1, D2, D3) is transformed into equivalent full outage hour(s).
This is calculated by multiplying the actual duration of the derating (hours) by the
size of the reduction (MW) and dividing by the Net Maximum Capacity (NMC).
These equivalent hour(s) are then summed.
NMC
*Reduction of SizeHours Derating
* Includes Unplanned (Forced) Deratings (D1, D2, D3) during Reserve Shutdowns
(RS)
EFDHRS
Equivalent Unplanned (Forced) Derated Hours During Reserve Shutdowns – Each
individual Unplanned (Forced) Derating (D1, D2, D3) or the portion of any
Unplanned (Forced) derating which occurred during a Reserve Shutdown (RS) is
transformed into equivalent full outage hour(s).
This is calculated by multiplying the actual duration of the derating (hours) by the
size of the reduction (MW) and dividing by the Net Maximum Capacity (NMC).
These equivalent hour(s) are then summed.
NMC
Reduction of SizeHours Derating
EMDH
EMDHRS
Equivalent Maintenance Derated Hours During Reserve Shutdowns – Each
individual Maintenance Derating (D4) or the portion of any Maintenance derating
which occurred during a Reserve Shutdown (RS) is transformed into equivalent full
outage hour(s).
This is calculated by multiplying the actual duration of the derating (hours) by the
size of the reduction (MW) and dividing by the Net Maximum Capacity (NMC).
These equivalent hour(s) are then summed.

160 Unit Setup Console GADS Open Source Analysis & Reporting
NMC
Reduction of SizeHours Derating
EPDH
Equivalent Planned Derated Hours – Each individual Planned Derating (PD, DE) is
transformed into equivalent full outage hour(s).
This is calculated by multiplying the actual duration of the derating (hours) by the
size of reduction (MW) and dividing by the Net Maximum Capacity (NMC). These
equivalent hour(s) are then summed.
NMC
*Reduction of SizeHours Derating
* Includes Planned Deratings (PD) during Reserve Shutdowns (RS)
EPDHRS
Equivalent Planned Derated Hours During Reserve Shutdowns – Each individual
Planned Derating (PD) or the portion of any Planned derating which occurred during
a Reserve Shutdown (RS) is transformed into equivalent full outage hour(s).
This is calculated by multiplying the actual duration of the derating (hours) by the
size of the reduction (MW) and dividing by the Net Maximum Capacity (NMC).
These equivalent hour(s) are then summed.
NMC
Reduction of SizeHours Derating
ESEDH
Equivalent Seasonal Derated Hours – ((Net Maximum Capacity (NMC) - Net
Dependable Capacity (NDC)) × Available Hours (AH)) / Net Maximum Capacity
(NMC)
NMC
AHNDC-NMC
EUDH
Equivalent Unplanned Derated Hours – Each individual Unplanned Derating (D1,
D2, D3, D4, DE) is transformed into equivalent full outage hour(s).
This is calculated by multiplying the actual duration of the derating (hours) by the
size of reduction (MW) and dividing by the Net Maximum Capacity (NMC). These
equivalent hour(s) are then summed.
NMC
*Reduction of SizeHours Derating
* Includes Unplanned Deratings (D1, D2, D3, D4, DE) during Reserve Shutdowns
(RS)
GADS Open Source Analysis & Reporting Unit Setup Console 161
Event Contribution Code
A one-digit code that best describes how the system, major component, or piece of
equipment contributed to the event.
Codes
1 Primary cause of event
The contribution code 1 must always appear in Section C: Primary Cause
of Event. A 1 can only be used on Section D – Additional Cause of Event for a PO or an MO when work on multiple components is scheduled.
2 Contributed to primary cause of event
Use this code to describe other systems, components, external conditions,
or human factors that contributed to cause the event but were not primarily
responsible for the event.
3 Work done during the event
Use this code to identify systems or components that were worked on
during the event but did not contribute to the initiation of the event or cause a delay in startup.
5 After startup, delayed unit from reaching load point
Event Contribution Codes 2, 3, and 5 can be reported on Section D records, and may
be used more than once.
Expanded Data Reporting
Some companies had expressed an interest in reporting more detailed operating and
maintenance data to GADS, which would allow them to perform more detailed
reliability analyses.
Reporting of this additional information is optional, although strongly encouraged.
NERC believes reporting of these data will enhance the usefulness of the GADS
database and benefit the entire power industry.
Failure Mechanism Code
The code that best describes the manner in which the component failed.
FOH
Unplanned (Forced) Outage Hours – Sum of all hours experienced during Unplanned
(Forced) Outages (U1, U2, U3) and Startup Failures (SF)
Fuel Code
For the Secondary, Tertiary and Quaternary fuels, the two-character code from the
list below that identifies the fuels burned in the unit during the reporting period.
Fuel Code Description
CC Coal
LI Lignite
PE Peat
WD Wood

162 Unit Setup Console GADS Open Source Analysis & Reporting
OO Oil
DI Distillate Oil (No. 2)
KE Kerosene
JP JP4 or JP5
WA Water
GG Gas
PR Propane
SL Sludge Gas
GE Geothermal
NU Nuclear
WM Wind
SO Solar
WH Waste Heat
OS Other Solid (Tons)
OL Other Liquid (BBL)
OG Other Gas (Cu. Ft.)
GAC
Gross Available Capacity – The greatest capacity at which the unit can operate
during the period of restriction caused by the derating.
If you report Gross Available Capacity (GAC), you must report Gross Maximum
Capacity (GMC), Gross Dependable Capacity (GDC), and Gross Actual Generation
(GAG) on the Performance Report (95).
GADS
Generating Availability Data System
GADS Cause Codes Outside Plant Management Control (As of November 4, 2003 – NERC GADS DRI)
Code Description
3600 Switchyard transformers and associated cooling systems – external
3611 Switchyard circuit breakers – external
3612 Switchyard system protection devices – external
3619 Other switchyard equipment – external
3720 Transmission equipment at the 1st substation (refer to code 9300 if applicable)
3730 Transmission equipment beyond the 1st substation (refer to code 9300 if
applicable)
9000 Flood
9010 Fire, not related to a specific component
9020 Lightning
9025 Geomagnetic disturbance
9030 Earthquake
9035 Hurricane
9036 Storms (ice, snow, etc)

GADS Open Source Analysis & Reporting Unit Setup Console 163
9040 Other catastrophe
9130 Lack of fuel (water from rivers or lakes, coal mines, gas lines, etc.) where the
operator is not in control of contracts, supply lines, or fuel delivery
9135 Lack of water (hydro)
9150 Labor strikes company-wide problems or strikes outside the company‘s
jurisdiction such as manufacturers (delaying repairs) or transportation (fuel
supply) problems.
9300 Transmission system problems other than catastrophes (do not include
switchyard problems in this category; refer to codes 3600 to 3629, 3720 to 3730)
9320 Other miscellaneous external problems
9500 Regulatory (nuclear) proceedings and hearings – regulatory agency initiated
9502 Regulatory (nuclear) proceedings and hearings – intervener initiated
9504 Regulatory (environmental) proceedings and hearings – regulatory agency initiated
9506 Regulatory (environmental) proceedings and hearings – intervener initiated
9510 Plant modifications strictly for compliance with new or changed regulatory
requirements (scrubbers, cooling towers, etc.)
9590 Miscellaneous regulatory (this code is primarily intended for use with Event
Contribution Code 2 to indicate that a regulatory-related factor contributed to the primary cause of the event)
GAG
Gross Actual Generation – The actual number of gross electrical megawatt-hours
(MWh) generated by the unit during the month.
If you report both Service Hours and Gross Actual Generation (one to 9999999),
GMC or GDC must also be reported. Similarly, if both service hours and a gross
capacity value are reported, Gross Actual Generation must also be reported. This
provides consistency when calculating performance statistics.
GDC
Gross Dependable Capacity – The gross power level that the unit can sustain during
a given period if there are no equipment, operating, or regulatory restrictions. By
definition, therefore, the GDC is the GMC modified for ambient limitations.
The GDC is the same in intent and purpose as the historically reported Maximum
Dependable Capacity (MDC).
GMC
Gross Maximum Capacity – The maximum capacity the unit can sustain over a
specified period of time when not restricted by ambient conditions or deratings. To
establish this capacity, formal demonstration is generally required. No standard
demonstration test method or test duration exists as far as is known at this time, but
many of the NERC Regions have their own criteria that all generating companies in
that Region follow.
The GMC of a unit should change only as a result of a new performance test or
permanent unit modification. GMC is never changed due to equipment problems,
even if they persist for a lengthy period of time unless the unit is permanently
164 Unit Setup Console GADS Open Source Analysis & Reporting
modified as a result. If the unit is permanently modified, note changes in the unit‘s
design on a new design data form and submit it to NERC GADS for updating.
The various ISOs have their own requirements for establishing the Maximum
Capacity values.
Grindability Index (Coal Units Only)
If the fuel type has been identified as coal (CC) or lignite (LI), the weighted average
grindability index of the fuel burned during the period.
Because the average heat content (Btu), ash, moisture, sulfur, alkalies, grindability
index, vanadium and phosphorus, and softening temperature values may change
during a month due to new fuel supplies, etc., these values should be weighted
averages.
Hours Worked
The number of hours spent correcting the event cause or making repairs. Include
hours expended for on-site repairs, as well as any off-site work.
If the number of hours exceeds four digits, enter 9999 in this field and describe the
actual hours expended in the Verbal Description.
If this situation occurs, consider reporting more detailed cause codes, and dividing
the hours into the amounts associated with each system or component.
ISO
Independent system operator
ISO-NE
ISO of New England
kWh
kilowatt-hours
MO
Maintenance Outage – An outage that can be deferred beyond the end of the next
weekend, but requires that the unit be removed from service, another outage state, or
Reserve Shutdown state before the next Planned Outage (PO).
Characteristically, an MO can occur any time during the year, has a flexible start
date, may or may not have a predetermined duration, and is usually much shorter
than a PO.
MOH
Maintenance Outage Hours – Sum of all hours experienced during Maintenance
Outages (MO) and any Scheduled Outage Extensions (SE)

GADS Open Source Analysis & Reporting Unit Setup Console 165
MW
megawatts
MWh
megawatt-hours
NAC
Net Available Capacity – The GAC less any capacity utilized for station service or
auxiliary loads.
NAG
Net Actual Generation – NAG is the unit‘s GAG less any generation (MWh) utilized
for that unit‘s station service or auxiliary loads. If NAG is negative during the month
being reported, enter the minus sign in the field with the reported value.
For consistency in calculating statistics, if Net Actual Generation is reported
(negative integer or positive integer), NMC or NDC must also be reported. Similarly,
if a net capacity value is reported, Net Actual Generation must also be reported.
NC
Noncurtailing Event – An event that exists whenever equipment or a major
component is removed from service for maintenance, testing, or other purposes that
does not result in a unit outage or derating.
An NC also can exist when a generating unit is operating at less than full capacity
due to system dispatch requirements. During this period, equipment can be removed
from service for maintenance, testing, or other reasons and be reported as an NC if
both of the following conditions are met:
The available capacity of the unit is not reduced below that required by
system dispatch; and,
Maintenance work can be stopped or completed and the units reach its net
dependable capacity (NDC) level within its normal ramp-up time, if and
when the unit was needed by the system.
If the conditions cannot be met, report an outage or derating event rather than an NC.
NDC
Net Dependable Capacity – NDC is the unit‘s GDC less any capacity (MW) utilized
for that unit‘s station service or auxiliary loads.
NERC
National Electric Reliability Council
166 Unit Setup Console GADS Open Source Analysis & Reporting
NERC Format
Requires the use of a decimal place in the fuel data. Data is entered in ktons, kbbl,
and MMcf to two decimal places. This option is set in the Unit Setup Console.
Therefore, enter a factor of the actual quantity burned in this field. Use the following
factors to determine the correct number to enter:
1,000 short tons (2,000 pounds) for coal;
1,000 barrels (42 gallons/barrel) for oil; and,
1,000,000 cubic feet for gas.
Example:
If coal is your primary fuel and 900 tons of coal was burned in the unit during the
reporting period, enter 0.90
If oil is your primary fuel and the unit burned 900,000 barrels of oil, enter 900.00
If gas is your primary fuel and the unit burned 5,090 Mcf (thousands of cubic feet) of
gas, enter 5.09
When reporting data for geothermal units, enter in this field the quantity of steam
brought into the plant from the geothermal wells. The factor used to determine the
number to enter is 1,000,000. Thus, 1,234,500,000 pounds of steam is entered as
1234.50
Leave this field blank when reporting data for nuclear units.
NMC
Net Maximum Capacity – NMC is the unit‘s GMC less any capacity (MW) utilized
for that unit‘s station service or auxiliary load.
The New York ISO and PJM require Net values only. Gross values are not provided
to either when the GADS output files are created for these two ISOs.
NYISO
New York ISO
Optional Full Format
The full value is entered without the NERC decimal. Data is entered in tons, bbls
and Mcf as whole integer values. This option is set in the Unit Setup Console.
Example:
If coal is your primary fuel and 900 tons of coal was burned in the unit during the
reporting period, enter 900
If oil is your primary fuel and the unit burned 900,000 barrels of oil, enter 900000
If gas is your primary fuel and the unit burned 5,090 Mcf (thousands of cubic feet) of
gas, enter 5090
When reporting data for geothermal units, this field is the quantity of steam brought
into the plant from the geothermal wells. The factor used to determine the number to
enter is 1,000. Thus, 1,234,500,000 pounds of steam is entered as 1234500

GADS Open Source Analysis & Reporting Unit Setup Console 167
This field is blank when reporting data for nuclear units.
Outage
An outage exists whenever a unit is not synchronized to the grid system and not in a
Reserve Shutdown state. The general outage event classification is divided into
seven distinct event types
An outage starts when the unit is either desynchronized from the grid or when it
moves from one unit state to another (for example, goes from a reserve shutdown to
a maintenance outage.) The outage ends when the unit is synchronized to the grid or
moves to another unit state.
In the case of moving from one unit state to another, the exact date and time that one
outage ends will be the same as the next outage starts. The unit state can only be
changed if the first outage ends. For example, if the unit is forced off line due to a
water wall tube leak (just before it was to come off line for a planned outage), then
the forced outage leak repair must be completed before the unit state can be changed
from a U1 to a PO. The maintenance crew can start the PO work, but it will not be a
PO until the U1 outage work is complete and the unit could be put back in service.
Outside Plant Management Control
IEEE Standard 762 has made a change to examine losses of generation caused by
problems with and outside plant management control. The following is quoted from
the standard. GADS accepts these guidelines and follows them the best they can in
their calculations of unit performance. Following these Guidelines, we have listed
those cause codes NERC currently recognizes as being outside plant management
control. The following is quoted from the NERC GADS DRI:
“Power Plant Outages Outside of Plant Management Control. There are a
number of outage causes that may prevent the energy coming from a power
generating plant from reaching the customer. Some causes are due to the plant
operation and equipment while others are outside plant management control.
―This Standard sets a perimeter around the power station...It may be assumed that all
problems within the power station boundary are within plant management control;
however that is not always the case. Therefore, there is a need for some additional
clarification as to what is and what is not under plant management control.
―It is easier to identify those actions outside plant management control than to
identify the responsibilities of plant management. Therefore, the following are
considered to be outside (external) of plant management control. All other items are
considered within their jurisdiction and are the responsibility of the plant
management for calculating power plant performance and statistics.
―Energy losses due to the following causes should not be considered when
computing the unit controllable performance because these losses are not considered
to be under the control of plant management:
―Grid connection or substation failure. This reason relates to problems
with transmission lines and switchyard equipment outside the
boundaries of the plant as specified by the ―boundary of plant
responsibility‖ section (see section 3.4.xxxx – to be assigned) of the
Standard.
168 Unit Setup Console GADS Open Source Analysis & Reporting
―Acts of nature such as ice storms, tornados, winds, lightning, etc are
not under plant management control, whether inside or outside the plant
boundary.
―Acts of terrors or transmission operating/repair errors are not under
plant management control.
―Special environmental limitations such as low cooling pond level, or
water intake restrictions that could not be prevented by operator action.
These are acts of nature such as high ambient temperatures where the
equipment is working within design specifications. However, if the
equipment is not maintained by the plant such as opacity out of limits
or NOx out of control, etc, then plant management should be penalized.
These are equipment problems and are within plant management
control.
―Lack of fuels (water from rivers or lakes, coal mines, gas lines, etc)
where the operator is not in control of contracts, supply lines, or
delivery of fuels.
―However, if the operator elected to contract for fuels where the fuel
(for example, natural gas) can be interrupted so that the fuel suppliers
can sell the fuels to others (part of the plant fuel cost-saving measure),
then the lack of fuel is under management control and is not applicable
to this case.
―Labor strikes. Outages or load reductions caused by labor strikes are
not normally under the direct control of plant management. These
strikes may be company-wide problems or strikes outside the
company‘s jurisdiction such as manufacturers (delaying repairs) or
transportation (fuel supply) problems.
―However, direct plant management grievances that result in a walkout
or strike are under plant management control and are included as
penalties against the plant. If a labor strike is caused by plant
management/worker problems during an outage, any outage extensions
are included as energy losses as long as the unit is incapable of being
restarted because of equipment failures, maintenance, overhauls, or
other activities.
―Other weather related problems such as seasonal variations in gross
dependable capacity due to cooling water temperature variations are not
within plant management control.‖

GADS Open Source Analysis & Reporting Unit Setup Console 169
PD
Planned Derating – A derating scheduled well in advance and of a predetermined
duration.
Do not report periodic deratings for tests—such as weekly turbine valve tests—as
PDs. Report such deratings as Maintenance Deratings (D4).
PH
Period Hours – The number of hours in the month being reported that the unit was in
the active state. The sum of Available Hours and Unavailable Hours must equal
Period Hours.
PJM
Pennsylvania New Jersey Maryland Interconnection LLC
PJM IO Code
This field is enabled if the generating unit is flagged in the Unit Setup Console as a
PJM-reporting unit.
The only valid IO Codes are 0 and 9.
A 0 means no IO Code is being submitted. The software will allow either a blank
field or 0. When writing the data out in the PJM format, the software converts a
blank IO Code to 0.
A 9 means an outage (MO, SE, U1–U3) or derating (DE or D1–D4) of a periodic
routine nature (e.g., condenser cleaning, deslagging, etc.) which started and ended
during a single off-peak period (2200–0800).
The software looks at the Start of Event date/time and the End of Event date/time to
determine whether the event qualifies for PJM IO Code 9.
If the event qualifies, by default the software will set the field to a 9. If you do not
want it to be set to 9, you can manually override the default and reset the field to 0.
If enter a 9 and the event does not qualify, the software resets the field to 0.
PJM Special Requirements for Unit Starts
PJM requires that the number of Attempted Unit Starts must be equal to the number
of Actual Unit Starts plus the number of Startup Failure events reported in the
month. If a unit is flagged as reporting to PJM, then this more restrictive error check
is imposed on the unit. NERC does not have this requirement.
PO
Planned Outage – An outage scheduled well in advance and of a predetermined
duration. A planned outage lasts for several weeks, and occurs only once or twice a
year.
170 Unit Setup Console GADS Open Source Analysis & Reporting
Turbine and boiler overhauls or inspections, testing, and nuclear refueling are typical
Planned Outages.
POH
Planned Outage Hours – The total hours the unit was off-line during Planned
Outages (PO) and any Scheduled Outage Extensions (SE).
Problem Alert
The problem with the system or component is generic to its design or operation
practices.
Because this information may be helpful to others using similar equipment, an ―X‖
alerts the NERC staff to initiate an investigation.
Pumping Hours
Sum of all hours the pumped storage unit is in pumping mode. The units are
considered to be in a non-generating service operation.
The number of hours the hydro turbine/generator operated as a pump/motor.
Quantity Burned
The quantity of fuel consumed during the reporting period.
RS
Reserve Shutdown – An event that exists whenever a unit is available for load but is
not synchronized due to lack of demand. This type of event is sometimes referred to
as an economy outage or economy shutdown. If a unit is shut down due to any
equipment-related problems, whether or not the unit was needed by the system,
report an Unplanned (Forced) Outage, Maintenance Outage, or Planned Outage, not
a Reserve Shutdown.
While a unit is on RS, maintenance work is often performed that would have resulted
in a unit outage or derating had the unit been on line. This work can be reported as
part of the RS event if, at anytime, the work can be stopped or completed without
preventing the unit from:
synchronizing after a normal startup cycle; and,
reaching its available capacity after a normal loading cycle.
This criterion remains the same whether or not the unit was needed by the system.
If the above criterion is met, report maintenance work done during the RS on the
Event Report (97), Section D (beginning with Record 04), using an Event
Contribution Code 3-Other Components Worked During Event.
If maintenance work cannot be stopped or completed the Reserve Shutdown
condition of the unit is altered and an outage or derating must be reported.
If the unit cannot be synchronized while the work is being performed, an outage
exists and the RS must end.
GADS Open Source Analysis & Reporting Unit Setup Console 171
If the unit cannot attain its available capacity while the work is being performed, a
derating exists. The RS event does not end, but report the derating too. Estimate the
available capacity as a result of the derating.
RSH
Reserve Shutdown Hours – The sum of all hours the unit was available to the system
but not synchronized for economic reasons.
SCH
Synchronous Condensing Hours – The number of hours the unit operated in the
synchronous condensing mode (applies primarily to hydro/pumped storage and some
combustion turbine units). Do not report these hours as Unit Service Hours.
SE
Scheduled Outage Extensions – GADS defines a scheduled outage extension as an
extension of a Planned Outage (PO) or a Maintenance Outage (MO) beyond its
estimated completion date. This means that at the start of the PO or MO, the outage
had an estimated duration (time period) for the work and a date set for the unit to
return to service. All work during the PO and MO is scheduled and all repair times
are determined before the outage started.
IEEE Standard 762 states that an extended planned outage is ―… the extension of the
basic planned outage beyond its predetermined duration.‖ Although the IEEE
Standard 762 uses ―planned outage‖, GADS also included maintenance outages as
well since they are scheduled and also have a predetermined duration.
The ―predetermined duration‖ of outage also determines the ―estimated completion
date‖ of the PO or MO. If the unit is scheduled for four weeks of repairs, then the
unit is expected back in service at a certain date four weeks after the start of the
outage. In cases where the outage is moved up or back according to the needs of the
operating company, ISO or power pool, then the start of the outage plus duration of
the outage determines the new completion date. As long as the outage is not longer
than planned, the expected completion date is moved to coincide with the
predetermined duration period.
If the unit is on outage (for example, U1 outage due to a boiler tube leak) at the time
the unit is scheduled to start the PO or MO work, then the work on the cause of the
outage (tube repairs) must be completed before changing from the U1 outage to the
PO or MO outage. PO and MO work can start but not counted as PO or MO work
until the U1 repairs are complete.
All work during PO and MO events are determined in advance and is referred to as
the ―original scope of work.‖ Use SE only in instances where the original scope of
work requires more time to complete than originally scheduled. Where applicable,
the extension of the planned or maintenance outage may be required to be approved
in advance by your power pool or ISO. Advance warning of an extension is very
important and may be an ISO requirement. However, GADS is not dispatch
orientated, but is an equipment-orientated database. The reporting of the SE is based
on IEEE 762-GADS rules, not ISO requirements. Therefore, if the extension meets
the GADS rules, then report it as a SE and not a U1 when reporting to NERC GADS
only.
172 Unit Setup Console GADS Open Source Analysis & Reporting
Do not use SE in those instances where unexpected problems or conditions
discovered during the outage which render the unit out of service beyond the
estimated end date of the PO or MO. Report these delays as Unplanned (Forced)
Outage-Immediate (U1). Do not use SE if unexpected problems occur during unit
startup. If a unit completes a PO or MO before the original estimated completion
date, then any problems causing outages or deratings up until that date are not
usually considered to be part of the PO or MO.
SE or U1 must start at the same time (month/day/hour/minute) that the PO or MO
ended.
SF
Startup Failure – An outage that results when a unit is unable to synchronize within a
specified startup time following an outage or Reserve Shutdown.
The startup period for each unit is determined by the operating company. It is unique
for each unit, and depends on the condition of the unit at the time of startup (hot,
cold, standby, etc.). A startup period begins with the command to start and ends
when the unit is synchronized. SF begins when the problem preventing the unit from
synchronizing occurs. The SF ends when the unit is synchronized, another SF occurs,
or the unit enters another permissible state.
SH
Service Hours – Sum of all Unit Service Hours
Size of Reduction
Size of Reduction is determined by subtracting the Available Capacity (NAC/GAC)
from the Dependable Capacity (NDC/GDC). In cases of multiple deratings, the Size
of Reduction of each derating will be determined by the difference in the Net/Gross
Available Capacity of the unit prior to the derating and the reported Net/Gross
Available Capacity as a result of the derating.
SOH
Scheduled Outage Hours – Sum of all hours experienced during Planned Outages
(PO), Maintenance Outages (MO), and any Scheduled Outage Extensions (SE)
Synchronous Hours
Sum of all hours the unit is in the synchronous condensing mode. The units are
considered to be in a non-generating service operation.
System/Component Cause Code
The 4-digit code that best identifies the system, major component, or piece of
equipment you are describing.
Two additional columns (the cause code extension) are provided for organizations
using more detailed cause codes in their internal reporting systems.
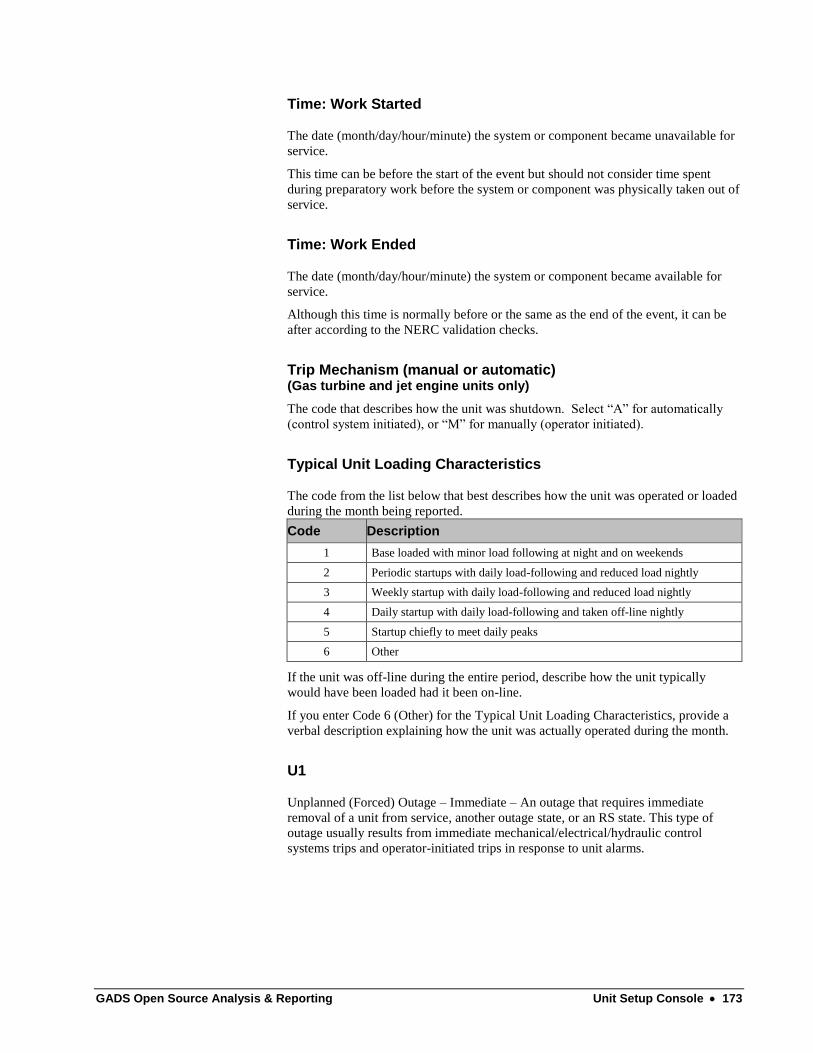
GADS Open Source Analysis & Reporting Unit Setup Console 173
Time: Work Started
The date (month/day/hour/minute) the system or component became unavailable for
service.
This time can be before the start of the event but should not consider time spent
during preparatory work before the system or component was physically taken out of
service.
Time: Work Ended
The date (month/day/hour/minute) the system or component became available for
service.
Although this time is normally before or the same as the end of the event, it can be
after according to the NERC validation checks.
Trip Mechanism (manual or automatic) (Gas turbine and jet engine units only)
The code that describes how the unit was shutdown. Select ―A‖ for automatically
(control system initiated), or ―M‖ for manually (operator initiated).
Typical Unit Loading Characteristics
The code from the list below that best describes how the unit was operated or loaded
during the month being reported.
Code Description
1 Base loaded with minor load following at night and on weekends
2 Periodic startups with daily load-following and reduced load nightly
3 Weekly startup with daily load-following and reduced load nightly
4 Daily startup with daily load-following and taken off-line nightly
5 Startup chiefly to meet daily peaks
6 Other
If the unit was off-line during the entire period, describe how the unit typically
would have been loaded had it been on-line.
If you enter Code 6 (Other) for the Typical Unit Loading Characteristics, provide a
verbal description explaining how the unit was actually operated during the month.
U1
Unplanned (Forced) Outage – Immediate – An outage that requires immediate
removal of a unit from service, another outage state, or an RS state. This type of
outage usually results from immediate mechanical/electrical/hydraulic control
systems trips and operator-initiated trips in response to unit alarms.
174 Unit Setup Console GADS Open Source Analysis & Reporting
U2
Unplanned (Forced) Outage – Delayed – An outage that does not require immediate
removal of a unit from the in-service state but requires removal within 6 hours. This
type of outage can only occur while the unit is in service.
U3
Unplanned (Forced) Outage – Postponed – An outage that can be postponed beyond
6 hours but requires a unit to be removed from the in-service state before the end of
the next weekend. This type of outage can only occur while the unit is in service.
UH
Unavailable Hours – The sum of Planned Outage Hours (PO), Unplanned (Forced)
Outage Hours (FOH: U1, U2, U3 + SF), Maintenance Outage Hours (MOH), and
Extensions of Scheduled Outages (SE).
Unit Service Hours
The number of hours the unit was synchronized to the system. For units equipped
with multiple generators, count only those hours when at least one of the generators
was synchronized, regardless of whether one or more generators were actually in
service.
UOH
Unplanned Outage Hours – Sum of all hours the unit was off-line due to immediate,
delayed, and postponed outages (U1, U2, and U3), Startup Failures (SF),
Maintenance Outages (MO), and any Scheduled Outage Extensions (SE).
Verbal Description
This space allows a detailed explanation of the event and the cause(s) identified by
the system/component cause code(s).
GADS Open Source Analysis & Reporting Index 175
Index
.
.NET Runtime 109
A
Administrator Console 3, 18, 21, 31, 50, 52, 55, 101,
111, 113, 114, 139, 140, 141, 142, 147, 154
Adobe Reader 100, 110
B
Block 2, 3, 11, 126, 128, 130, 138
C
Cause Codes
Custom 18, 20, 21
NERC GADS Standard 19, 22
User-defined 18
Codes 164
Event Contribution 75, 76
Fuel Code 127, 128, 161
PJM IO Code 32, 169
Cogeneration 3
Combined Cycle 2, 3, 90, 126, 128, 130, 138
Custom Calculations 52
Custom Reporting 49, 72, 75, 76, 79, 82
Customizing
MS Access 115
MS SQL Server 117
Oracle 8i/9i 121
D
Data Pooling 57
Deratings 169
D1 169
D4 169
DE 169
Diesel 2, 126, 130
E
EFORd 49, 79, 82
Equations 56
Events
End of Event 169
Start of Event 169
Example 3D Calculation 90
Excel 17, 84, 85, 86, 87, 88, 89, 102
F
Fluidized Bed 126, 130
Formulas 56
Fossil 2, 52, 101, 126, 130, 143
G
GADSNG.xml 100, 103, 113, 114
H
Hydro 2, 126, 130, 134
I
IEEE Standard 762 36, 37, 56, 150
Install
Administrator Console 101
Database Setup/Server Console 100
Quick Start 111
Startup Issues 111
Unit Setup Console 100
Web User Interface 103
Windows User Interface 102
J
Jet Engine 126, 128, 130
K
Keys.xml 97, 100, 107, 108
L
Loading GADS Data 6, 7
M
MSDE 100, 110
N
NERC GADS 1, 2, 3, 19, 22, 33, 34, 39, 90, 132, 137,
151
Nuclear 2, 57, 77, 126, 130, 140, 143, 144, 146, 162

176 Unit Setup Console GADS Open Source Analysis & Reporting
NYISO 2, 47, 131, 132, 133, 134, 135, 149
O
Outages
MO 161, 169
PO 161
SE 169
U1 169, 174
U2 174
U3 169, 174
P
Peak Periods 11, 14
Perform Calculations 10
PJM 169
Pumped Storage 126, 130, 134
Q
Quantity Burned 79, 132
R
Reports 24, 26, 27, 28, 29, 30, 32, 33, 34, 35, 42, 50
Required Files 97, 100, 103, 107, 108, 113, 114
S
Seasons 11
Special Time Sets 11, 14
SQL Server 2000
Desktop Engine 100, 110
T
Time Sets
Continuous Timeline 11, 12, 13
Discrete Periods 11, 14
Tips and Tricks 90
Troubleshooting 91
U
Unit Setup Console 3, 5, 12, 14, 100, 107, 125, 126,
127, 129, 131, 134, 136, 138, 147
V
View Data Loaded 8, 9


