Page 1
Louis Gagnon provides this scientific self-archived article free of charge.For more research info see LouisGagnon.com
This article is the final submission, post-review, version of the following article:
Gagnon, L.*, Richard, M.J., Beardsell, G., and Boudreau, M., « The Process of Making an Aerodynamically Efficient Car Body for the SAE Supermileage Competition », SAE Technical Paper 2012-01-0176, 2012, doi: 10.4271/2012-01-0176
Note: The version of this document may differ in format from the official version distributed by the publisher. The scientific content should nevertheless be identical as this version was created after conclusion of the peer-review process. For the official version, please consult the publishers website. Do keep in mind that a subscription or fee may be asked for the official version.
Page 2
Page 1 of 13
2012-01-0176
The Process of Making an Aerodynamically Efficient Car Body for the
SAE Supermileage Competition
Author, co-author (Do NOT enter this information. It will be pulled from participant tab in MyTechZone)
Affiliation (Do NOT enter this information. It will be pulled from participant tab in MyTechZone)
Copyright © 2012 SAE International
ABSTRACT
In the summer of 2010, a new body shell for the SAE Supermileage car of Laval University was designed. The complete shell design
process included, amongst other steps, the generation of a shape through the parametric shape modeling software Unigraphics NX7
and the evaluation of aerodynamic forces acting on the chassis using the open source Computational Fluid Dynamics (CFD) software
OpenFOAM. The CFD analyses were ran at steady-state using a k-omega-SST turbulence model and roughly 2.5 million cells.
An efficient method for evaluating the effect of ambient wind conditions and vehicle trajectory on the track was developed. It
considers the proportion of time that the car operates at each combination of velocity and wind yaw angle and computes the overall
energy demand of the shell. An iterative process was conducted over a significant number of different shapes, which were generated
by joining formula-based guide curves using intersection and tangency conditions.
The new shell has a 25 % larger frontal area due to modified design constraints. When aerodynamically compared to the smaller and
already highly efficient old vehicle, reductions of 50 % of the negative lift, 15 % of the energy demand when driving forward, and 5 %
of the energy demand when turning are achieved by the new design. Also, the drag coefficient is reduced by 20 %. These
improvements come from the quasi-NACA profiles on the side and top walls; a reduction of cavities to prevent redundant frontal
areas; a short vehicle and smother wheel cover closures; and a thorough study of the nose and tail. This paper describes numerical
flow simulations and the changes that were brought to the vehicle body to make it as aerodynamically efficient as possible.
INTRODUCTION
The Supermileage is an annual student competition organized by the SAE where students are asked to design and build a one-person
vehicle. The aim of the competition is to have the most fuel efficient vehicle. The vehicles are tested for efficiency by running six laps
around a 2.6 km oval track. More details on the setting of the competition are given in the official competition rules [1]. The team of
Laval University is comprised of undergraduate and graduate engineering students who aim to continuously improve the fuel
efficiency of their gasoline powered one-person vehicle. Their vehicle is commonly called the Alérion and is powered by a customized
56.5 cm2 fuel injected four stroke engine. It has three wheels, two in front that steer and one at the rear that drives. A disc brake is
installed on each wheel and the two front wheels are protected by carbon fiber internal covers that reinforce the body structure and
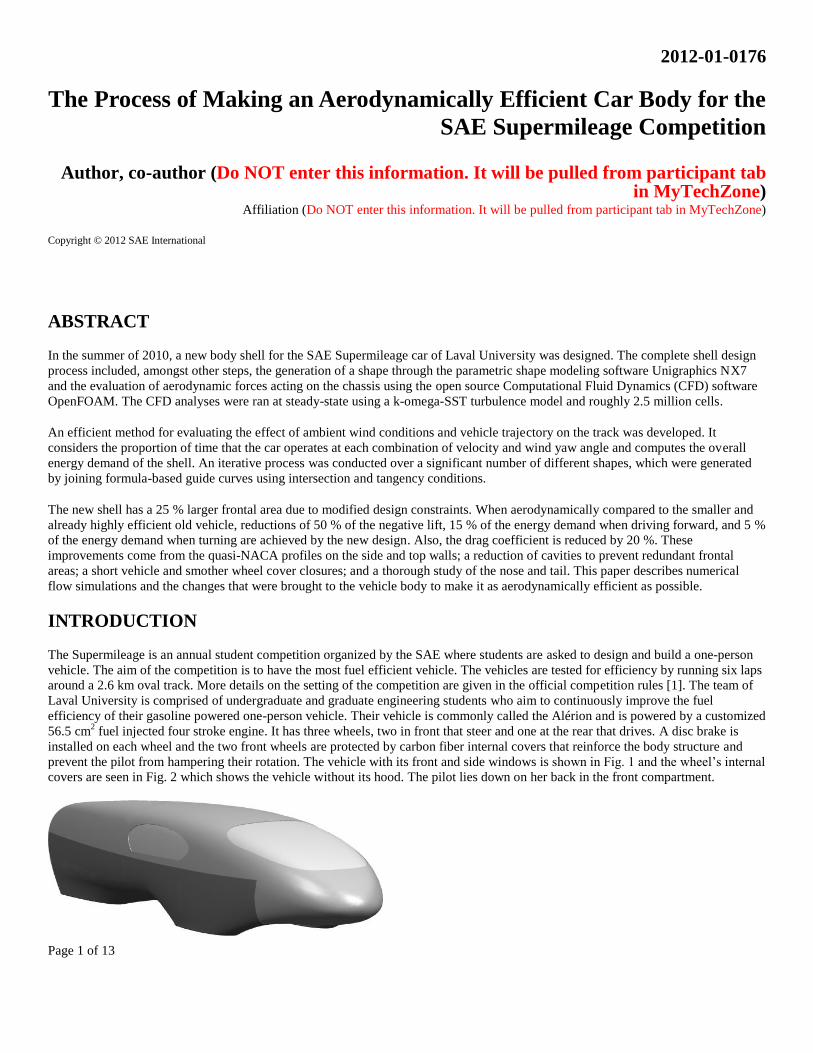
prevent the pilot from hampering their rotation. The vehicle with its front and side windows is shown in Fig. 1 and the wheel’s internal
covers are seen in Fig. 2 which shows the vehicle without its hood. The pilot lies down on her back in the front compartment.
Page 3
Page 2 of 13
Figure 1 – The Alérion with windows outlined.
Figure 2 – Lower half of the new vehicle’s carbon fiber body.
Because there is no frame other than the carbon fiber shell, a honeycomb underbody rigidifies the shell to prevent a distortion of the
body which would cause a misalignment of the front wheels. The car holds the North American record for fuel consumption at
1347 km/L, as registered at the Eaton proving grounds during the 2008 Supermileage competition.
While already quite successful, the old body of the car needed to be discarded and the team took this opportunity to design a new
carbon fiber shell by carefully studying its aerodynamic performance. The benefits of improving the aerodynamics of a Supermileage
vehicle have already been reported by another team [2]. Some new requirements were taken into and the major challenge was that
these new requirements led to a need for a larger vehicle, which makes it quite a challenge to reduce the overall drag forces. A major
new requirement was the use of Michelin tires 45/75R16. These tires are considerably wider but have a remarkably lower rolling
resistance and thus significantly contribute to increase the fuel efficiency of the vehicle. Another important new requirement was that
the wheelbase of the vehicle increased, thus the maximum steering angle of the front wheels had to be increased by 0.5 degree to
maintain the same turning radius. The evaluation of the energy efficiency of each vehicle shape analyzed was done by considering all
the driving conditions that the vehicle encounters on track. In fact, the driving strategy and oval-shape of the track make the vehicle
face many different wind speeds during the race and a breakdown of the occurrence of each wind angle and speed and its respective
presence over the race was used to evaluate that efficiency. The Laval team was granted access to an eight thousand processor
supercomputer and this allowed a quick turnover time between design iterations. While this article tends to focus on the shape
optimization process and the various features of the flow on the body, a more complete description of the numerical approach is given
in [3]. The new shape of the vehicle was created within an uncoupled iterative process between the aerodynamics analysis and the
shape creation. After every new CFD analysis, a careful observation of the results led to ideas for improvements to the shape, until the
final shape was chosen. The whole process was done using the OpenFOAM open source CFD library. The computations were ran at
steady state on the cluster using a k-ω-SST turbulence model and a 2.5 million cell mesh with y+ value on the body of the vehicle
ranging from 0.25 to 120. In this paper, two vehicle bodies are mainly discussed, the old and new models, which refer to the shape to
improve and the one which was selected for the new vehicle, respectively. An overview of the iterative process and some shapes that
came out of it are also discussed.
Page 4
Page 3 of 13
NUMERICAL APPROACH
SHAPE GENERATION
Unigraphic NX7 is the chosen CAD software for shape modeling due to its ability to model complex shapes. Because the old vehicle
model was not available in a proper format to work with NX7, it was thus reconstructed as a parametric shape using a solid version of
the old vehicle model as a guide. From there, modifications of the current shell were produced as a constant back and forth interaction
between the shape modeling and aerodynamic analyses. The goal was to reduce the drag as much as possible while respecting the
assembly constraints. With the Studio Surface application of the software, the team was able to create the surfaces of the car using
different curves as guides and by imposing tangency conditions at their ends. The main guides were derived from mathematical
formulas describing airplane wing profiles such as the NACA 3312. This particular profile was used for the top of the vehicle. The
remaining curves were made using splines created by dragging points by hand to their desired positions.
While countless versions of the new vehicle were tested to obtain satisfactory results, the team was slowly redesigning the vehicle too
meet the new objectives. These objectives resulted in an increased shell frontal area. First, the camber angle, angle formed by the
wheel vertical axis and the ground normal direction, was reduced from 8 to 1.2 degrees. The reasons for having an angle of 8 degrees
had been to minimize the frontal area by reducing the top width of the vehicle while respecting the minimum authorized distance of
50 cm on the ground between the front wheels, as requested by the competition rules. However, due to the objectives of having larger
reinforced inner wheel fairings, wider tires, and a greater steering angle, the ground track width of the front wheels had to increase.
Therefore, a camber angle in these wheels could no longer reduce the frontal area. Besides, the camber angle increased the friction
losses between the tires and the road. A small camber of 1.2 degree was still maintained to ensure a good stability of the car when
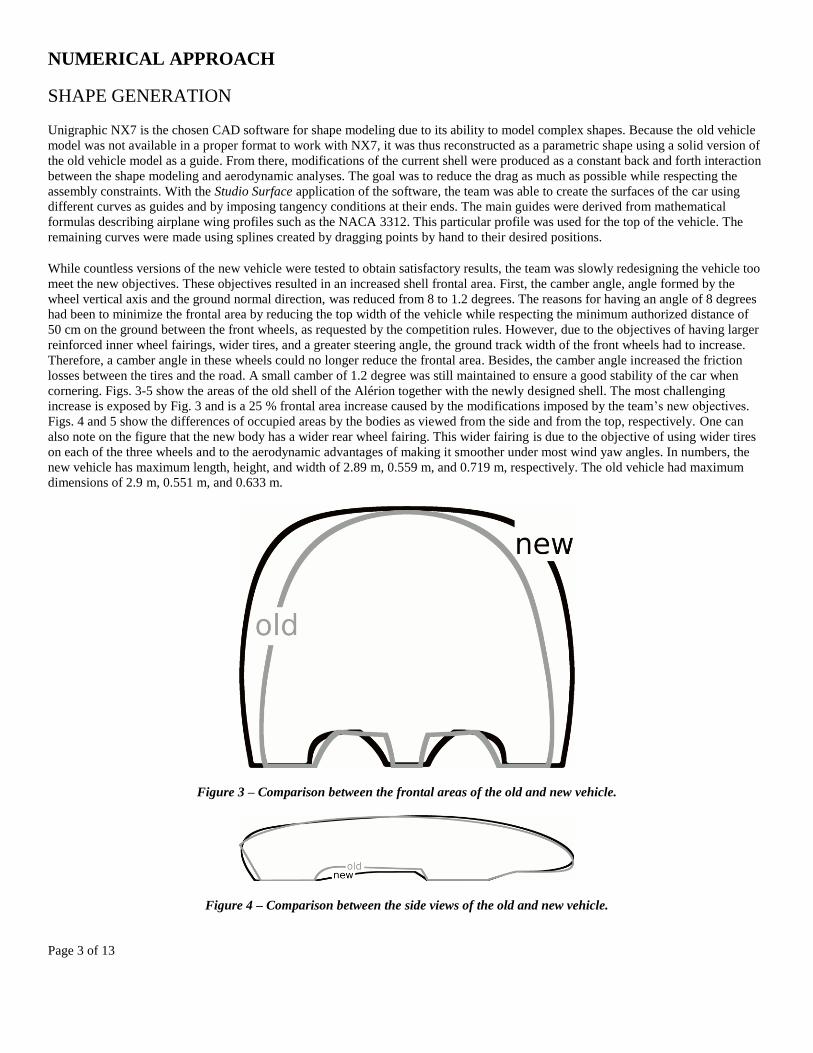
cornering. Figs. 3-5 show the areas of the old shell of the Alérion together with the newly designed shell. The most challenging
increase is exposed by Fig. 3 and is a 25 % frontal area increase caused by the modifications imposed by the team’s new objectives.
Figs. 4 and 5 show the differences of occupied areas by the bodies as viewed from the side and from the top, respectively. One can
also note on the figure that the new body has a wider rear wheel fairing. This wider fairing is due to the objective of using wider tires
on each of the three wheels and to the aerodynamic advantages of making it smoother under most wind yaw angles. In numbers, the
new vehicle has maximum length, height, and width of 2.89 m, 0.559 m, and 0.719 m, respectively. The old vehicle had maximum
dimensions of 2.9 m, 0.551 m, and 0.633 m.
Figure 3 – Comparison between the frontal areas of the old and new vehicle.
Figure 4 – Comparison between the side views of the old and new vehicle.
Page 5
Page 4 of 13
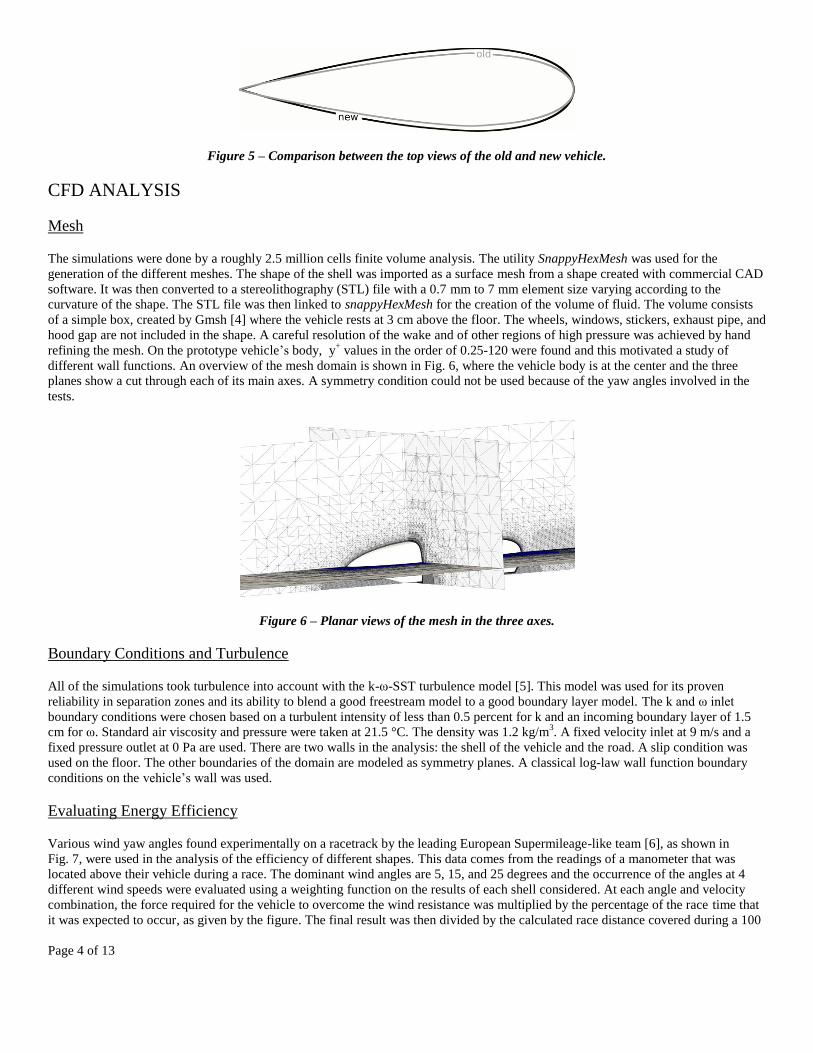
Figure 5 – Comparison between the top views of the old and new vehicle.
CFD ANALYSIS
Mesh
The simulations were done by a roughly 2.5 million cells finite volume analysis. The utility SnappyHexMesh was used for the
generation of the different meshes. The shape of the shell was imported as a surface mesh from a shape created with commercial CAD
software. It was then converted to a stereolithography (STL) file with a 0.7 mm to 7 mm element size varying according to the
curvature of the shape. The STL file was then linked to snappyHexMesh for the creation of the volume of fluid. The volume consists
of a simple box, created by Gmsh [4] where the vehicle rests at 3 cm above the floor. The wheels, windows, stickers, exhaust pipe, and
hood gap are not included in the shape. A careful resolution of the wake and of other regions of high pressure was achieved by hand
refining the mesh. On the prototype vehicle’s body, y+ values in the order of 0.25-120 were found and this motivated a study of
different wall functions. An overview of the mesh domain is shown in Fig. 6, where the vehicle body is at the center and the three
planes show a cut through each of its main axes. A symmetry condition could not be used because of the yaw angles involved in the
tests.
Figure 6 – Planar views of the mesh in the three axes.
Boundary Conditions and Turbulence
All of the simulations took turbulence into account with the k-ω-SST turbulence model [5]. This model was used for its proven
reliability in separation zones and its ability to blend a good freestream model to a good boundary layer model. The k and ω inlet
boundary conditions were chosen based on a turbulent intensity of less than 0.5 percent for k and an incoming boundary layer of 1.5
cm for ω. Standard air viscosity and pressure were taken at 21.5 °C. The density was 1.2 kg/m3. A fixed velocity inlet at 9 m/s and a
fixed pressure outlet at 0 Pa are used. There are two walls in the analysis: the shell of the vehicle and the road. A slip condition was
used on the floor. The other boundaries of the domain are modeled as symmetry planes. A classical log-law wall function boundary
conditions on the vehicle’s wall was used.
Evaluating Energy Efficiency
Various wind yaw angles found experimentally on a racetrack by the leading European Supermileage-like team [6], as shown in
Fig. 7, were used in the analysis of the efficiency of different shapes. This data comes from the readings of a manometer that was
located above their vehicle during a race. The dominant wind angles are 5, 15, and 25 degrees and the occurrence of the angles at 4
different wind speeds were evaluated using a weighting function on the results of each shell considered. At each angle and velocity
combination, the force required for the vehicle to overcome the wind resistance was multiplied by the percentage of the race time that
it was expected to occur, as given by the figure. The final result was then divided by the calculated race distance covered during a 100
Page 6
Page 5 of 13
second theoretical race made up of those percentages in order to get the average energy demand in Joules per meter travelled. Two
versions of this calculation were done, one where the vehicle was assumed to be moving forward and subjected to side winds and one
where the vehicle was assumed to be slipping, or in other words turning. This allowed the team to have an accurate idea of the
efficiency of a shape in real-world conditions, without only relying on the commonly used but invalid assumption that the wind is
always coming at a null relative angle.
Figure 7: Percentage of time each yaw angle and velocity combination occurs during the race. Picture adapted from [6].
Validation
The resources needed to complete an experimental validation of the numerical model were unfortunately unavailable. A large enough
wind tunnel was not available and it was not possible for the team to build a small mockup of the vehicle. Thus, it was chosen to
validate the aerodynamic model using a test on the Ahmed body with all CFD parameters identical to the Alérion model, but adjusted
for their different flow velocities and vehicle lengths. The 12.5 degree slant angle Ahmed body was chosen for the availability of a lot
of numerical data and the existence of at least two experimental reports on its flow [7, 8]. The goal was not to tune the model to the
Ahmed body but rather to validate the flow characteristics on the overall Alérion body. The Alérion only has large angles in the small
rear zones were no ambiguity is present with regards to whether the flow is attached or not, because it separates. Since the flow behind
the Ahmed body is known to be difficult to model, the validation was done more on the comparison of the flow on other zones and the
separation or non-separation of the flow on the slant angle was seen as an advantage but not a necessity. It is also known that for
RANS models, it is difficult to precisely predict the shape of a detached vortex and it was chosen to accept that as an uncertainty of
the analyses.
In order to have a similar dimensionless wall distance, y+, than for a 2.5 million cells Alérion body mesh, the simulations for the
Ahmed body were done using a 15.1 million cells mesh. This is due to the fact that on the Ahmed body the velocity was four times
greater, which means that the cells need to be roughly four times smaller in each direction to have the same wall distance. The y+
value varied between 2 and 88 on that body and it exceeded 125 on the floor. The first published experimental drag coefficient of the
Ahmed body [7] value found is 0.23 with 76 % coming from pressure forces and 24 % coming from friction forces. The error coming
from the friction inaccuracy calculated by the chosen wall model on the Ahmed body was smaller than 5 % of the total drag
coefficient. The somewhat larger error in the pressure calculation was attributed to the difficulty RANS models have to predict flow
reattachment. This error was less than 25 % of the total drag coefficient, which is large. Nonetheless, the model was kept because of
the good prediction of the vortex behavior and overall good behavior on the flow. One has to keep in mind that the flow on the Alérion
body does not detach much and inaccuracies due to the exact position of reattachment can be put aside considering that the purpose of
the CFD modeling is to rapidly iterate over many different shapes during the design process. Another confirmation of the proper
working of the analysis was the replication by the tests of the experimentally seen [7] bubble on the slant surface with streamlines
remaining well aligned with the slant side edges.
While this section outlined the important aspects of the validation process, more details are given in a previous article [3].
Page 7
Page 6 of 13
RESULTS AND DISCUSSION
AERODYNAMICS
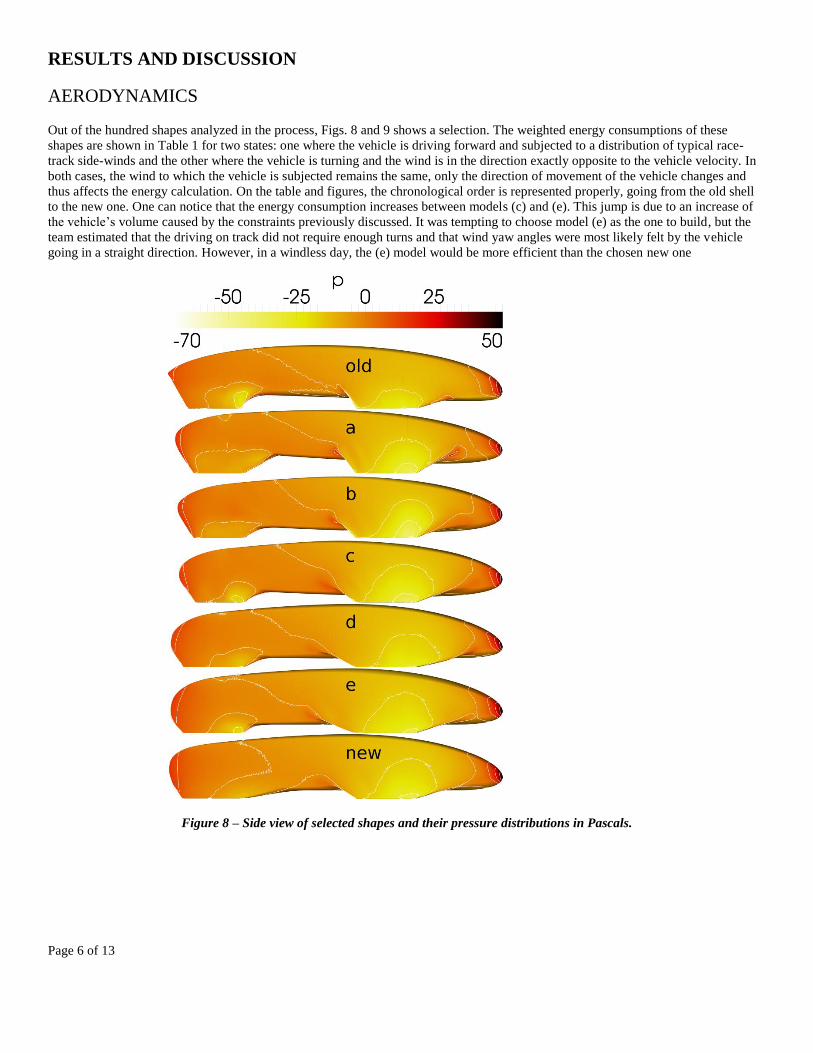
Out of the hundred shapes analyzed in the process, Figs. 8 and 9 shows a selection. The weighted energy consumptions of these
shapes are shown in Table 1 for two states: one where the vehicle is driving forward and subjected to a distribution of typical race-
track side-winds and the other where the vehicle is turning and the wind is in the direction exactly opposite to the vehicle velocity. In
both cases, the wind to which the vehicle is subjected remains the same, only the direction of movement of the vehicle changes and
thus affects the energy calculation. On the table and figures, the chronological order is represented properly, going from the old shell
to the new one. One can notice that the energy consumption increases between models (c) and (e). This jump is due to an increase of
the vehicle’s volume caused by the constraints previously discussed. It was tempting to choose model (e) as the one to build, but the
team estimated that the driving on track did not require enough turns and that wind yaw angles were most likely felt by the vehicle
going in a straight direction. However, in a windless day, the (e) model would be more efficient than the chosen new one
Figure 8 – Side view of selected shapes and their pressure distributions in Pascals.
Page 8
Page 7 of 13
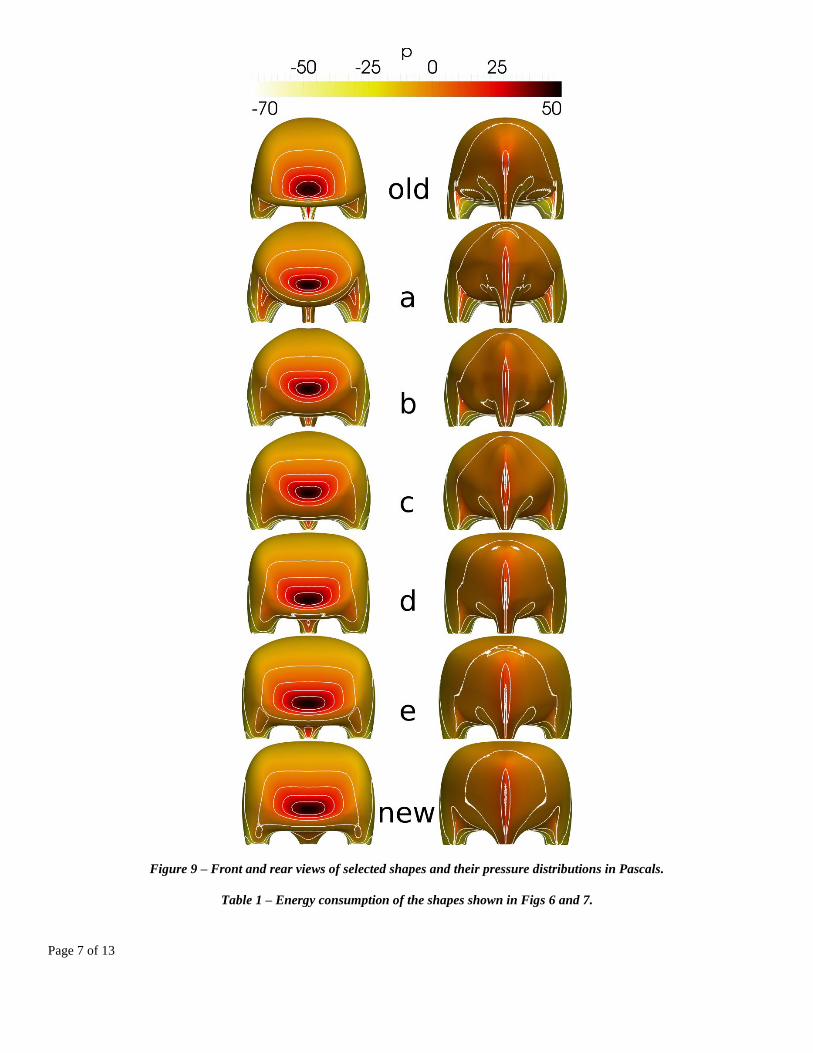
Figure 9 – Front and rear views of selected shapes and their pressure distributions in Pascals.
Table 1 – Energy consumption of the shapes shown in Figs 6 and 7.
Page 9
Page 8 of 13
model forward (J/m) turning (J/m)
old 1.63 3.54
a 1.24 3.31
b 1.14 2.92
c 1.11 2.71
d 1.28 3.09
e 1.44 3.26
new 1.41 3.41
The general shape of the top of the vehicle as seen from aside is now a NACA 3312 airfoil with camber. On the old prototype, it was
an ellipse tilted forward as seen in Fig. 8. By tilting that ellipse a little forward, the view of the driver was improved significantly. For
the new model, the camber of the airfoil allowed preserving the pilot’s field of view while improving the aerodynamic efficiency of
the vehicle.
On models (a-c) and on the old one, the point at which the vehicle is the closest to the ground was located towards the front of the
vehicle. Because of that, the bottom of the vehicle would rise until it met the rear wheel cover. The fluid analyses showed that this
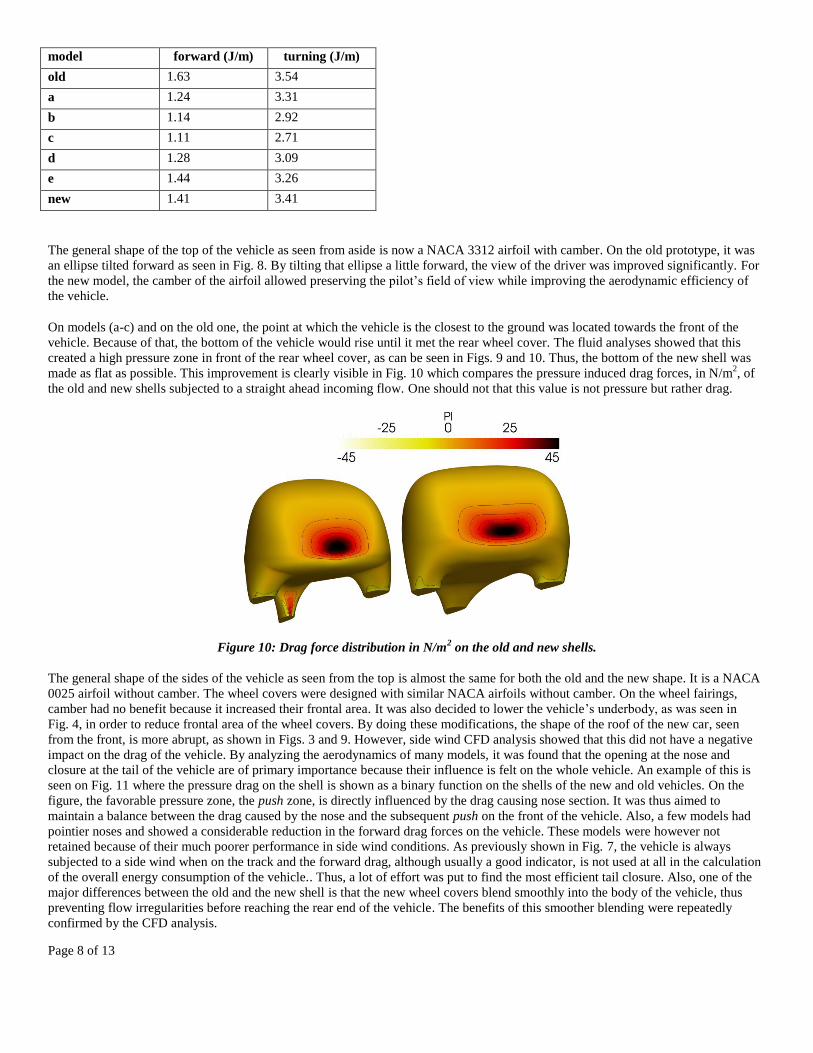
created a high pressure zone in front of the rear wheel cover, as can be seen in Figs. 9 and 10. Thus, the bottom of the new shell was
made as flat as possible. This improvement is clearly visible in Fig. 10 which compares the pressure induced drag forces, in N/m2, of
the old and new shells subjected to a straight ahead incoming flow. One should not that this value is not pressure but rather drag.
Figure 10: Drag force distribution in N/m2 on the old and new shells.
The general shape of the sides of the vehicle as seen from the top is almost the same for both the old and the new shape. It is a NACA
0025 airfoil without camber. The wheel covers were designed with similar NACA airfoils without camber. On the wheel fairings,
camber had no benefit because it increased their frontal area. It was also decided to lower the vehicle’s underbody, as was seen in
Fig. 4, in order to reduce frontal area of the wheel covers. By doing these modifications, the shape of the roof of the new car, seen
from the front, is more abrupt, as shown in Figs. 3 and 9. However, side wind CFD analysis showed that this did not have a negative
impact on the drag of the vehicle. By analyzing the aerodynamics of many models, it was found that the opening at the nose and
closure at the tail of the vehicle are of primary importance because their influence is felt on the whole vehicle. An example of this is
seen on Fig. 11 where the pressure drag on the shell is shown as a binary function on the shells of the new and old vehicles. On the
figure, the favorable pressure zone, the push zone, is directly influenced by the drag causing nose section. It was thus aimed to
maintain a balance between the drag caused by the nose and the subsequent push on the front of the vehicle. Also, a few models had
pointier noses and showed a considerable reduction in the forward drag forces on the vehicle. These models were however not
retained because of their much poorer performance in side wind conditions. As previously shown in Fig. 7, the vehicle is always
subjected to a side wind when on the track and the forward drag, although usually a good indicator, is not used at all in the calculation
of the overall energy consumption of the vehicle.. Thus, a lot of effort was put to find the most efficient tail closure. Also, one of the
major differences between the old and the new shell is that the new wheel covers blend smoothly into the body of the vehicle, thus
preventing flow irregularities before reaching the rear end of the vehicle. The benefits of this smoother blending were repeatedly
confirmed by the CFD analysis.
Page 10
Page 9 of 13
Figure 11: Drag and push pressure zones on the old and new shells.
The four number NACA series was chosen because the airfoils are described by parametric equations which depend explicitly the
thickness, maximum camber, and its position on the chord. A thickness of 12 % of the chord length was chosen because it was the
minimum that would allow space for the pilot, the engine, the wheels, and all the other components. Some 2D tests were ran with
Xfoil software to find low drag airfoils that would not interfere with the geometrical constraints and preserve the pilot’s field of view.
This reduced the number of available airfoils to a few, which were then analysed in a 3D analysis.
It was found during the tests that a longer vehicle could, with carefully designed nose, tail, and wheel fairings yield a lower forward
drag coefficient than a shorter and otherwise equivalent vehicle. However, such a long vehicle did not perform well when subjected to
side winds and performed very poorly when the vehicle was turning. This very poor behavior results from the large area seen by the
incoming wind which the vehicle has to overcome when turning. Also, the front wheel covers were made fairly short and smooth all
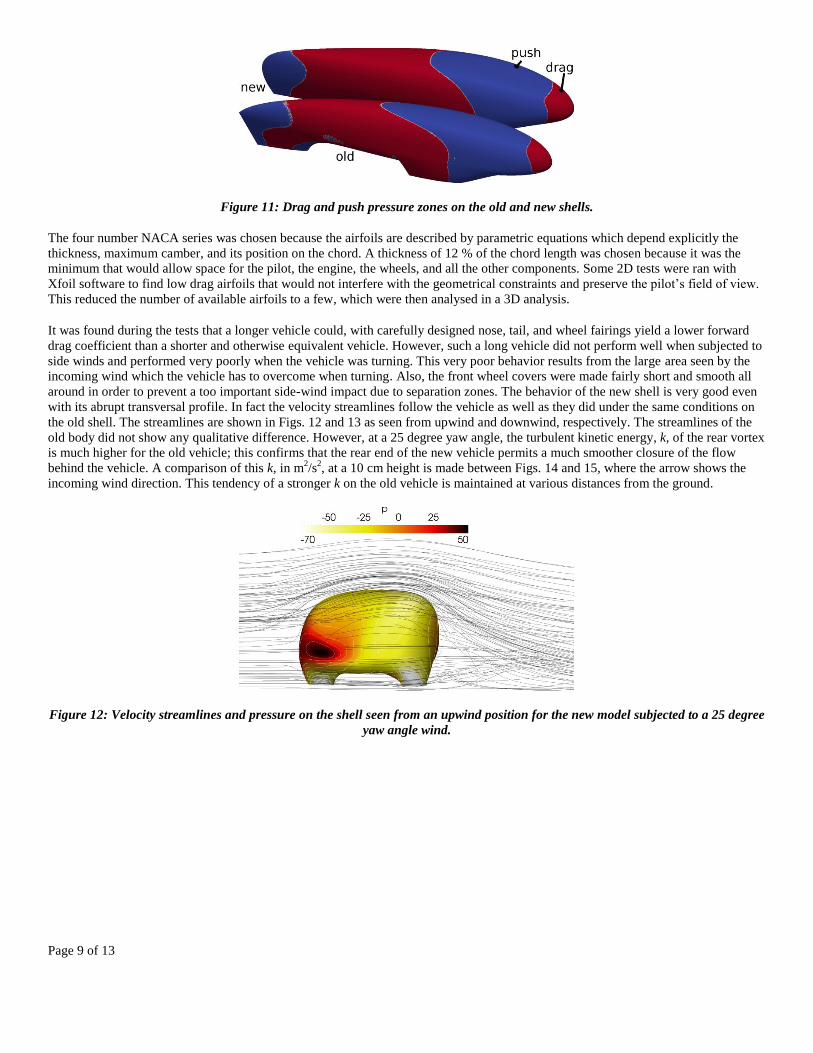
around in order to prevent a too important side-wind impact due to separation zones. The behavior of the new shell is very good even
with its abrupt transversal profile. In fact the velocity streamlines follow the vehicle as well as they did under the same conditions on
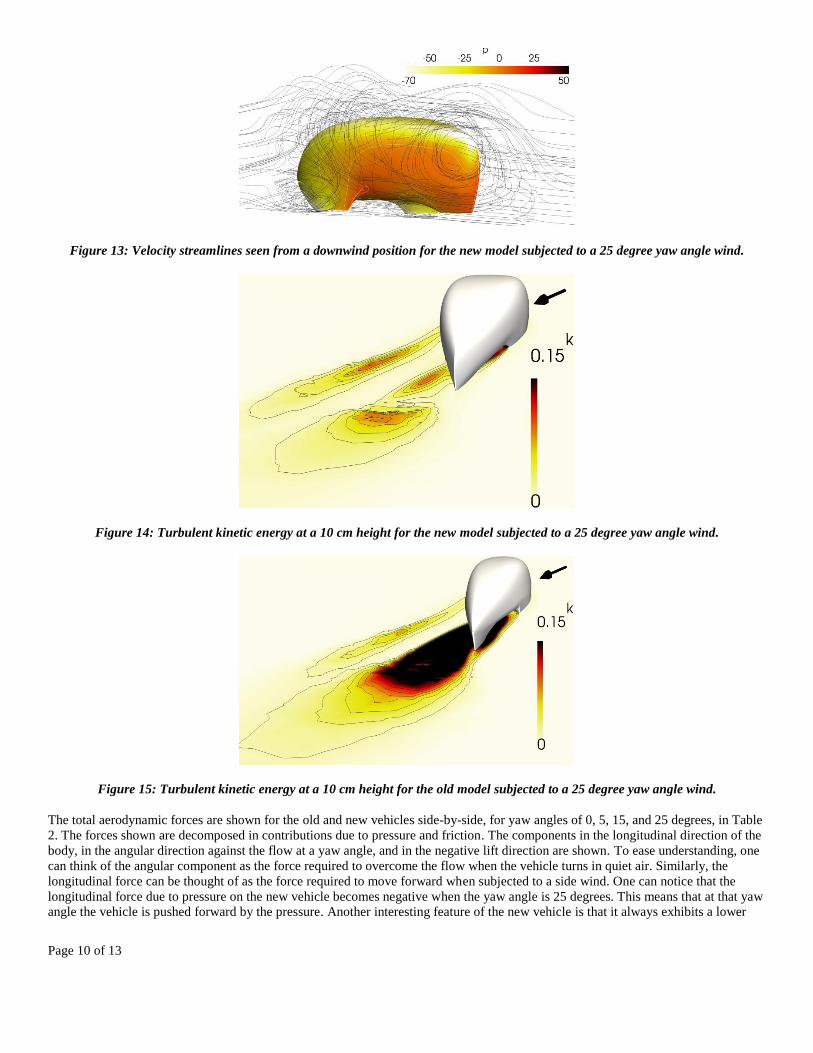
the old shell. The streamlines are shown in Figs. 12 and 13 as seen from upwind and downwind, respectively. The streamlines of the
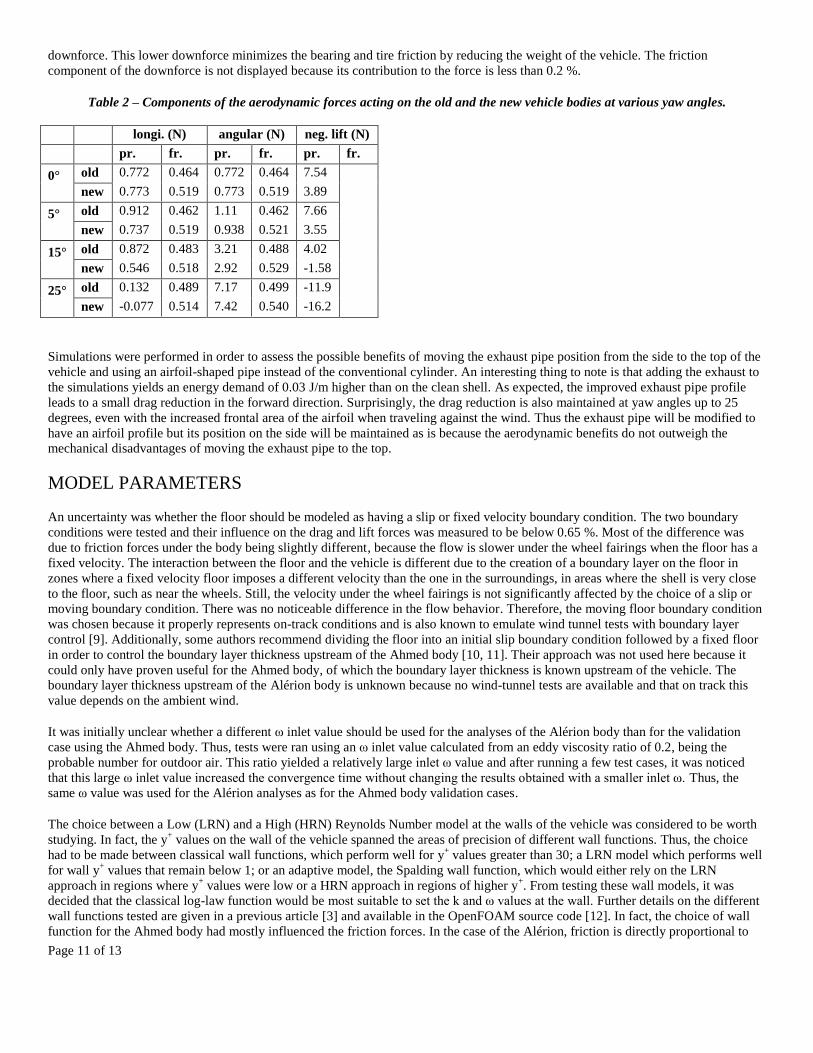
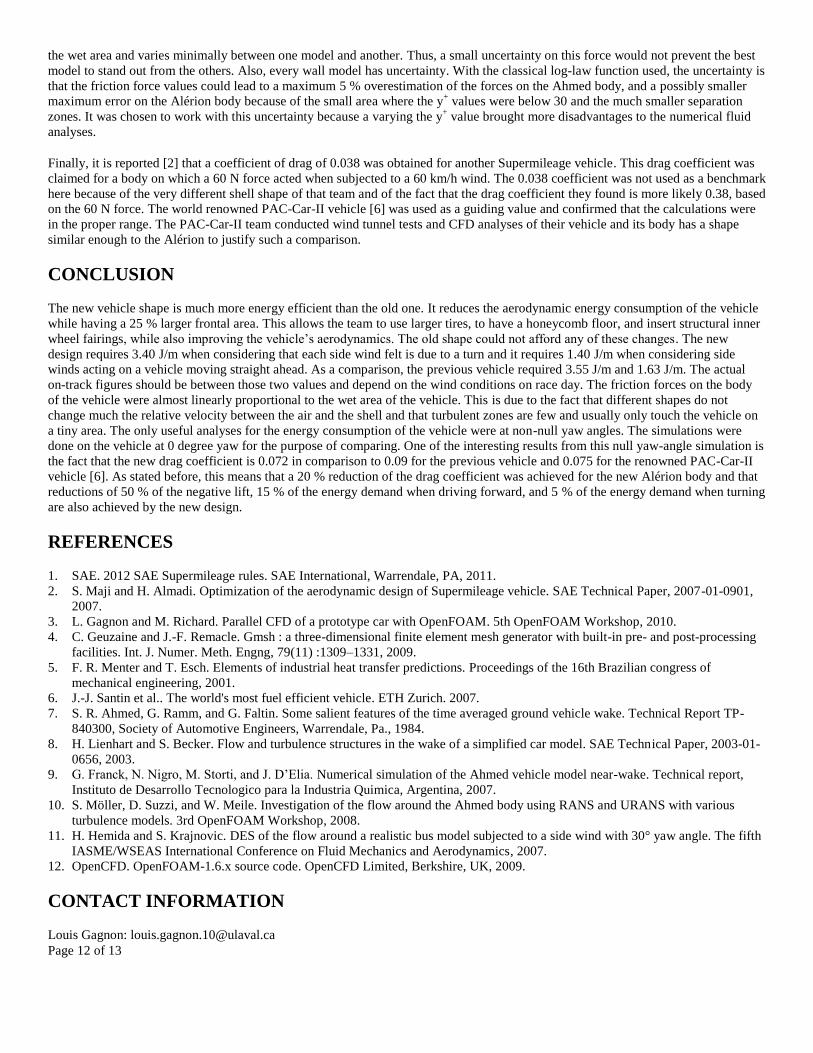
old body did not show any qualitative difference. However, at a 25 degree yaw angle, the turbulent kinetic energy, k, of the rear vortex
is much higher for the old vehicle; this confirms that the rear end of the new vehicle permits a much smoother closure of the flow
behind the vehicle. A comparison of this k, in m2/s
2, at a 10 cm height is made between Figs. 14 and 15, where the arrow shows the
incoming wind direction. This tendency of a stronger k on the old vehicle is maintained at various distances from the ground.
Figure 12: Velocity streamlines and pressure on the shell seen from an upwind position for the new model subjected to a 25 degree
yaw angle wind.
Page 11
Page 10 of 13
Figure 13: Velocity streamlines seen from a downwind position for the new model subjected to a 25 degree yaw angle wind.
Figure 14: Turbulent kinetic energy at a 10 cm height for the new model subjected to a 25 degree yaw angle wind.
Figure 15: Turbulent kinetic energy at a 10 cm height for the old model subjected to a 25 degree yaw angle wind.
The total aerodynamic forces are shown for the old and new vehicles side-by-side, for yaw angles of 0, 5, 15, and 25 degrees, in Table
2. The forces shown are decomposed in contributions due to pressure and friction. The components in the longitudinal direction of the
body, in the angular direction against the flow at a yaw angle, and in the negative lift direction are shown. To ease understanding, one
can think of the angular component as the force required to overcome the flow when the vehicle turns in quiet air. Similarly, the
longitudinal force can be thought of as the force required to move forward when subjected to a side wind. One can notice that the
longitudinal force due to pressure on the new vehicle becomes negative when the yaw angle is 25 degrees. This means that at that yaw
angle the vehicle is pushed forward by the pressure. Another interesting feature of the new vehicle is that it always exhibits a lower
Page 12
Page 11 of 13
downforce. This lower downforce minimizes the bearing and tire friction by reducing the weight of the vehicle. The friction
component of the downforce is not displayed because its contribution to the force is less than 0.2 %.
Table 2 – Components of the aerodynamic forces acting on the old and the new vehicle bodies at various yaw angles.
longi. (N) angular (N) neg. lift (N)
pr. fr. pr. fr. pr. fr.
0° old 0.772 0.464 0.772 0.464 7.54
new 0.773 0.519 0.773 0.519 3.89
5° old 0.912 0.462 1.11 0.462 7.66
new 0.737 0.519 0.938 0.521 3.55
15° old 0.872 0.483 3.21 0.488 4.02
new 0.546 0.518 2.92 0.529 -1.58
25° old 0.132 0.489 7.17 0.499 -11.9
new -0.077 0.514 7.42 0.540 -16.2
Simulations were performed in order to assess the possible benefits of moving the exhaust pipe position from the side to the top of the
vehicle and using an airfoil-shaped pipe instead of the conventional cylinder. An interesting thing to note is that adding the exhaust to
the simulations yields an energy demand of 0.03 J/m higher than on the clean shell. As expected, the improved exhaust pipe profile
leads to a small drag reduction in the forward direction. Surprisingly, the drag reduction is also maintained at yaw angles up to 25
degrees, even with the increased frontal area of the airfoil when traveling against the wind. Thus the exhaust pipe will be modified to
have an airfoil profile but its position on the side will be maintained as is because the aerodynamic benefits do not outweigh the
mechanical disadvantages of moving the exhaust pipe to the top.
MODEL PARAMETERS
An uncertainty was whether the floor should be modeled as having a slip or fixed velocity boundary condition. The two boundary
conditions were tested and their influence on the drag and lift forces was measured to be below 0.65 %. Most of the difference was
due to friction forces under the body being slightly different, because the flow is slower under the wheel fairings when the floor has a
fixed velocity. The interaction between the floor and the vehicle is different due to the creation of a boundary layer on the floor in
zones where a fixed velocity floor imposes a different velocity than the one in the surroundings, in areas where the shell is very close
to the floor, such as near the wheels. Still, the velocity under the wheel fairings is not significantly affected by the choice of a slip or
moving boundary condition. There was no noticeable difference in the flow behavior. Therefore, the moving floor boundary condition
was chosen because it properly represents on-track conditions and is also known to emulate wind tunnel tests with boundary layer
control [9]. Additionally, some authors recommend dividing the floor into an initial slip boundary condition followed by a fixed floor
in order to control the boundary layer thickness upstream of the Ahmed body [10, 11]. Their approach was not used here because it
could only have proven useful for the Ahmed body, of which the boundary layer thickness is known upstream of the vehicle. The
boundary layer thickness upstream of the Alérion body is unknown because no wind-tunnel tests are available and that on track this
value depends on the ambient wind.
It was initially unclear whether a different ω inlet value should be used for the analyses of the Alérion body than for the validation
case using the Ahmed body. Thus, tests were ran using an ω inlet value calculated from an eddy viscosity ratio of 0.2, being the
probable number for outdoor air. This ratio yielded a relatively large inlet ω value and after running a few test cases, it was noticed
that this large ω inlet value increased the convergence time without changing the results obtained with a smaller inlet ω. Thus, the
same ω value was used for the Alérion analyses as for the Ahmed body validation cases.
The choice between a Low (LRN) and a High (HRN) Reynolds Number model at the walls of the vehicle was considered to be worth
studying. In fact, the y+ values on the wall of the vehicle spanned the areas of precision of different wall functions. Thus, the choice
had to be made between classical wall functions, which perform well for y+ values greater than 30; a LRN model which performs well
for wall y+ values that remain below 1; or an adaptive model, the Spalding wall function, which would either rely on the LRN
approach in regions where y+ values were low or a HRN approach in regions of higher y
+. From testing these wall models, it was
decided that the classical log-law function would be most suitable to set the k and ω values at the wall. Further details on the different
wall functions tested are given in a previous article [3] and available in the OpenFOAM source code [12]. In fact, the choice of wall
function for the Ahmed body had mostly influenced the friction forces. In the case of the Alérion, friction is directly proportional to
Page 13
Page 12 of 13
the wet area and varies minimally between one model and another. Thus, a small uncertainty on this force would not prevent the best
model to stand out from the others. Also, every wall model has uncertainty. With the classical log-law function used, the uncertainty is
that the friction force values could lead to a maximum 5 % overestimation of the forces on the Ahmed body, and a possibly smaller
maximum error on the Alérion body because of the small area where the y+ values were below 30 and the much smaller separation
zones. It was chosen to work with this uncertainty because a varying the y+ value brought more disadvantages to the numerical fluid
analyses.
Finally, it is reported [2] that a coefficient of drag of 0.038 was obtained for another Supermileage vehicle. This drag coefficient was
claimed for a body on which a 60 N force acted when subjected to a 60 km/h wind. The 0.038 coefficient was not used as a benchmark
here because of the very different shell shape of that team and of the fact that the drag coefficient they found is more likely 0.38, based
on the 60 N force. The world renowned PAC-Car-II vehicle [6] was used as a guiding value and confirmed that the calculations were
in the proper range. The PAC-Car-II team conducted wind tunnel tests and CFD analyses of their vehicle and its body has a shape
similar enough to the Alérion to justify such a comparison.
CONCLUSION
The new vehicle shape is much more energy efficient than the old one. It reduces the aerodynamic energy consumption of the vehicle
while having a 25 % larger frontal area. This allows the team to use larger tires, to have a honeycomb floor, and insert structural inner
wheel fairings, while also improving the vehicle’s aerodynamics. The old shape could not afford any of these changes. The new
design requires 3.40 J/m when considering that each side wind felt is due to a turn and it requires 1.40 J/m when considering side
winds acting on a vehicle moving straight ahead. As a comparison, the previous vehicle required 3.55 J/m and 1.63 J/m. The actual
on-track figures should be between those two values and depend on the wind conditions on race day. The friction forces on the body
of the vehicle were almost linearly proportional to the wet area of the vehicle. This is due to the fact that different shapes do not
change much the relative velocity between the air and the shell and that turbulent zones are few and usually only touch the vehicle on
a tiny area. The only useful analyses for the energy consumption of the vehicle were at non-null yaw angles. The simulations were
done on the vehicle at 0 degree yaw for the purpose of comparing. One of the interesting results from this null yaw-angle simulation is
the fact that the new drag coefficient is 0.072 in comparison to 0.09 for the previous vehicle and 0.075 for the renowned PAC-Car-II
vehicle [6]. As stated before, this means that a 20 % reduction of the drag coefficient was achieved for the new Alérion body and that
reductions of 50 % of the negative lift, 15 % of the energy demand when driving forward, and 5 % of the energy demand when turning
are also achieved by the new design.
REFERENCES
1. SAE. 2012 SAE Supermileage rules. SAE International, Warrendale, PA, 2011.
2. S. Maji and H. Almadi. Optimization of the aerodynamic design of Supermileage vehicle. SAE Technical Paper, 2007-01-0901,
2007.
3. L. Gagnon and M. Richard. Parallel CFD of a prototype car with OpenFOAM. 5th OpenFOAM Workshop, 2010.
4. C. Geuzaine and J.-F. Remacle. Gmsh : a three-dimensional finite element mesh generator with built-in pre- and post-processing
facilities. Int. J. Numer. Meth. Engng, 79(11) :1309–1331, 2009.
5. F. R. Menter and T. Esch. Elements of industrial heat transfer predictions. Proceedings of the 16th Brazilian congress of
mechanical engineering, 2001.
6. J.-J. Santin et al.. The world's most fuel efficient vehicle. ETH Zurich. 2007.
7. S. R. Ahmed, G. Ramm, and G. Faltin. Some salient features of the time averaged ground vehicle wake. Technical Report TP-
840300, Society of Automotive Engineers, Warrendale, Pa., 1984.
8. H. Lienhart and S. Becker. Flow and turbulence structures in the wake of a simplified car model. SAE Technical Paper, 2003-01-
0656, 2003.
9. G. Franck, N. Nigro, M. Storti, and J. D’Elia. Numerical simulation of the Ahmed vehicle model near-wake. Technical report,
Instituto de Desarrollo Tecnologico para la Industria Quimica, Argentina, 2007.
10. S. Möller, D. Suzzi, and W. Meile. Investigation of the flow around the Ahmed body using RANS and URANS with various
turbulence models. 3rd OpenFOAM Workshop, 2008.
11. H. Hemida and S. Krajnovic. DES of the flow around a realistic bus model subjected to a side wind with 30° yaw angle. The fifth
IASME/WSEAS International Conference on Fluid Mechanics and Aerodynamics, 2007.
12. OpenCFD. OpenFOAM-1.6.x source code. OpenCFD Limited, Berkshire, UK, 2009.
CONTACT INFORMATION
Louis Gagnon: [email protected]
Page 14
Page 13 of 13
ACKNOWLEDGMENTS
The authors would like to thank Compute Canada for providing the resources necessary to conduct high performance computing
operations.
ABBREVIATIONS
CAD computer aided design
CFD computational fluid dynamics
HRN high Reynolds number
LRN low Reynolds number
NACA national advisory committee for aeronautics
STL stereolithography