Gains from Export Growth: Do Linkages Matter? by Prema-Chandra Athukorala and Bambang H. Santosa* Abstract Policy makers in developing countries often place emphasis on inter-sectoral input linkages (‘linkages’ for short) in determining sectoral priorities in export development policy, particularly in designing export promotion schemes and in screening and monitoring export-oriented foreign direct investment. Development analysts too place emphasis on linkages as an operational norm in assessing the developmental impact of emerging export industries. The purpose of this paper is to argue that the use of this closed-economy planning tool as a performance criterion in the context of export- oriented growth strategy is fundamentally flawed. We illustrate our argument using Indonesia as a case study. The methodology adopted involves the examination, using the Leontief inter-industry accounting framework as the main analytical tool, of the relationship between sectoral input linkages, and employment impact and contribution to net foreign exchange earnings of manufactured exports in Indonesian manufacturing during 1985-95. JEL Classification: F14, O20, O53 _____________________________________________________________________ * Kantor Statistik Propinsi Jawa Timur, Indonesia
Transcript
Gains from Export Growth: Do Linkages Matter?
by
Prema-Chandra Athukorala
and
Bambang H. Santosa*
Abstract
Policy makers in developing countries often place emphasis on inter-sectoral inputlinkages (‘linkages’ for short) in determining sectoral priorities in export developmentpolicy, particularly in designing export promotion schemes and in screening andmonitoring export-oriented foreign direct investment. Development analysts too placeemphasis on linkages as an operational norm in assessing the developmental impact ofemerging export industries. The purpose of this paper is to argue that the use of thisclosed-economy planning tool as a performance criterion in the context of export-oriented growth strategy is fundamentally flawed. We illustrate our argument usingIndonesia as a case study. The methodology adopted involves the examination, usingthe Leontief inter-industry accounting framework as the main analytical tool, of therelationship between sectoral input linkages, and employment impact and contributionto net foreign exchange earnings of manufactured exports in Indonesian manufacturingduring 1985-95.
JEL Classification: F14, O20, O53
_____________________________________________________________________* Kantor Statistik Propinsi Jawa Timur, Indonesia
1
2
Gains from Export Growth: Do Linkages Matter?*
1. Introduction
The linkage analysis due to Hirschman (1958) was widely used as a planning tool in
developing countries during the import-substitution era (1950s and 1960s). The key
premise of Hirschman’s policy advocacy was that, under the existing domestic demand
conditions, a country can maximise developmental gains from limited investible
resources by directing investment flows towards key sectors. A key sector was
defined as a sector which has maximum linkages with the rest of the economy in terms
of potential sales to other sectors (forward linkages) or purchase from other sectors
(backward linkages). Like other popular growth theories of the time, Hirschman’s
unbalanced growth strategy was intended to serve as “an alternative strategy to linking
the economy to the rest of the world on the basis of comparative advantage” (Findlay
1984). In other words, the basic policy thrust was to turn inward and seek the key to
industrial development in greater interaction between domestically oriented sectors,
while ignoring neoclassical “efficiency” (or factor proportions) considerations of
resource allocation.1
By the mid-1970s, there was ample evidence that import-substitution policies
had largely failed. Consequently an increasing number of countries have since then
been opening up their economies and integrating them into the international economic
system. Notwithstanding this palpable policy shift, surprisingly, the concept of
linkages, whose very purposes was to assist developing countries to delink from the
international economy, has continued to linger in the minds of both policy makers and
* The authors are grateful to Chris Manning, Jayant Menon and Kunal Sen for extensivecomments on the draft paper, and George Fane and Sisira Jayasuriya for valuable preliminarydiscussions on the methodology.
1. To the criticism that administratively created linkages may imply waste, Hirschman
replied that such criticism is valid only if one assumes resources to be in fixed supply;as he saw it, disequilibria resulting from emphasis on key sectors would call into beingextra investment by stimulating entrepreneurship.
3
development analysts. Policy makers often take into account potential linkages2 in
determining sectoral priorities in export development policy. Linkages are also an
important consideration underlying export incentive policies, and approval and
monitoring of export-oriented foreign direct investment. Development analysts often
place emphasis on linkages as an operational norm in assessing the developmental
impact of emerging export industries. For instance, the popular criticism of affiliates of
multinational enterprises (MNEs) involved in export-oriented industries in developing
countries for stifling linkage development in manufacturing and labelling thriving
labour-intensive export industries as “footloose” (or “enclave”) industries are based on
the implicit perception that linkages are a key to success through export-oriented
industrialisation.
The purpose of this paper is to argue that the use of linkages - a closed-
economy planning tool- as a performance criterion in the context of export-oriented
growth strategy is fundamentally flawed. More specifically we argue that placing
emphasis on linkages in determining sectoral priorities is likely to yield wrong policy
inferences under export orientation. This is because under the ongoing process of
internationalisation of production, industries with low linkages could well have the
potential to make a greater contribution to employment and net foreign exchange
earnings. We illustrate our arguments using Indonesia as a case study. The
methodology adopted involves the examination, using the Leontief inter-industry
accounting framework as the main analytical tool, of the relationship between sectoral
input linkages, and employment impact and contribution to net foreign exchange
earnings of manufactured exports in Indonesian manufacturing during 1985-95.
The choice of Indonesia as the subject of our study was motivated by the
following reasons. First, following the market-oriented policy reforms initiated in the
mid-1980s Indonesia has experienced strong growth in manufactured exports. While
2 Forward-linkages essentially relates to domestic downstream processing of sectoraloutput, and therefore are not relevant in assessing the implications of export expansionfor the domestic economy. Therefore, in the context of an export-oriented policyregime the term ‘linkages’ is usually used to mean ‘backward linkages’. In this paperwe use these two terms interchangeably.
4
there was very heavy reliance initially on just two products, plywood and clothing, the
export commodity mix has begun to diversify considerably since about the late 1980s
(See Appendix 1).3 This ongoing process of export diversification provides an
excellent laboratory for the study of on-going changes in the commodity structure and
their developmental implications at the initial stage of export-led industrialisation in a
surplus-labour economy.
Second, import intensity and/or the footloose nature of emerging export
patterns has attracted much attention in the recent economic policy debate in Indonesia
(Jayasuriya and Manning 1996). In particular, redirecting investment to the export
sectors which make greater use of domestic intermediate inputs has been a key
element of the export development policy embodied in successive five-year
development plans (Repelita), starting with Repelita IV (1984/85-1988/89). A recent
influential consultancy report for the Indonesian government has emphasised that “in
the emerging international environment .....export sustainability requires that the base
of Indonesia’s competitive advantage be broadened and deepened, with the upgrading
of export products, greater local context in export activity, and broad entry into more
high value-added products’ (Lall and Rao 1995, p.1) (emphasis added). However, the
rationale behind this policy emphasis has not been seriously examined in the otherwise
rich literature on Indonesian policy reforms.
The third consideration relates to data availability. The empirical analysis of
the issue at hand requires a complete set of input-output tables which put export and
domestic production on a comparable basis, while separating imports from domestic
output relating to all intermediate and final transactions. Indonesia is one of the few
developing countries which meet this data requirement.
3 There have been a number of studies on Indonesia’s export policy and emerging exportpatterns. See, in particular, Hill 1996a (Chap. 8) and 1996b, Pangestu 1994 andJames 1996.
5
The remainder of the paper is organised as follows: Section 2 presents and
clarifies the conceptual issues surrounding the linkage analysis in the context of export-
oriented industrialisation, in order to provide the setting for the ensuing empirical
analysis. Section 3 presents the empirical procedure for the measurement of linkages,
net exports and export-induced manufacturing employment. Section 4 presents
interpres the results. Concluding remarks are in section 5.
2. Linkages and Export-oriented Industrialisation: Conceptual Issues
The use of linkage as a policy criterion in the context of export-oriented
industrialisation suffers from two fundamental limitations. First it runs counter to the
conventional factor proportions considerations which are at the heart of the current
debate on gains from export-led industrialisation. Second it overlooks the nature of
market potential for manufactured exports from developing countries. When these
two considerations are appropriately taken into account, there are strong grounds for
the alternative view that attempts to forge linkages through direct policy intervention
can be both ineffective and counterproductive. In this section, we present and
elaborate on, this alternative view in order to set the stage for the ensuing empirical
analysis.
Let us begin with the factor proportions considerations. In an open economy,
the factor intensity of production depends not only upon the technology in the final
and intermediate stages of domestic production, but also upon the technology which
underlies the structure of foreign trade. This is because participation in international
trade provides the economy with the opportunity to specialise in products in which it
has comparative advantage (i.e. labour-intensive products in the case of a surplus
labour economy), while relying on world trade for the procurement of intermediate
inputs. Intermediate goods industries are typically more capital intensive than are final
goods industries. The importation of intermediate inputs for export production,
therefore, involves an implicit substitution of labour for relatively capital intensive
intermediate products in the production process. For instance, when an economy
imports capital intensive inputs such as machinery, synthetic fibre, and industrial
chemicals with foreign exchange earned by exporting labour intensive products such as
6
garments, footwear and toys, it is implicitly substituting the latter labour intensive
goods for the former capital-intensive goods in the production process. This would
enhance the labour intensity of the overall production process. Thus, resource
allocation considerations derived from the principle of comparative advantage seems to
make a strong case for the development of footloose (loosely linked) export industries
in a labour -abundant economy (Riedel 1975 and 1977). 4 Such specialisation would
reduce the resource cost of production and enhance the employment potential of
export expansion.5
As regards market potential, our contention is that emphasis on achieving a
greater domestic content in exports can run counter to the objective of rapid market
penetration in world trade. Unlike in the closed-economy approach of import-
substitution industrialisation (ISI), the key to success under export oriented
industrialisation (EOI) lies in a country’s ability to produce what is demanded in
international markets. This in turn requires timely and swift changes in the export
structure in line with changing patterns of internationalisation of production. In this
context there is little room for forging input linkages through government intervention.
For the purpose of analysing market opportunities for exports from developing
countries, it is useful to distinguish between four different product categories of
manufactures: (1) ‘resource-based’ manufacturing or manufacturing activities which
involve further local processing of material previously exported in raw state; (2) light
component production and assembly within vertically integrated or otherwise tightly
controlled production systems; and (4) mature technology final products (motor
vehicles, radios, TVs, computers). A resource rich country (like Indonesia) has
considerable room for the expansion of exports in the first category. However, quite
apart from the obvious limits which would eventually be set by the resource
4 There is ample evidence that administratively created linkages through emphasis on
intermediate industries was one of the main causes of very high capital intensity inmanufacturing and sometimes of value subtracted at world prices (Little, 1982, p 44).
5 In this study we focus only on the latter aspect. For an interesting theoreticalexposition and empirical test of the former aspect see Riedel 1995.
7
endowment, there are other constraints on export success in this arena (Helleiner 1973,
p. 25). For instance, some processing activities, particularly those in the mineral and
chemical industries, are characterised by high physical and/or human capital intensity
and may not therefore be suitable for location in a low-income country. Moreover,
world demand growth for resource-based manufactures has proved to be much slower
than that for the other three product categories. In the area of differentiated final goods
(category 4), world exports originate almost exclusively from developed market
economies or in more advanced newly industrialising countries (NICs). In these
products labour cost, while significant, take second place to the availability of high-
quality operator and technical skills, a good domestic basis of supplies and services and
excellent infrastructure. Also, given the heavy initial fixed costs, MNEs - which play a
pivotal role in the production and trade in these products - hesitate to establish an
overseas plant without considerable experience of involvement in the host country
(Guisinger 1985).
For a labour-surplus country, light manufactured goods (Category 2) and
component production and assembly (Category 3) are the most promising areas in the
early stage of export-led industrialisation. Production in both categories is
characterised by the use of technologies extremely intensive in low-skilled labour. In
the 1960s, when the present-day NICs began to make strides along the export-led
growth path, the former was the most promising growth area. Since the late 1960s
production activities in the latter area have shown phenomenal growth as a new aspect
of modern world trade. This phenomenon has been the outcome of the growing ability
of modern industry to ‘slice up the value chain’ of goods traditionally viewed as skill-,
capital-, or technology-intensive and shift the labour -intensive slices to low-wage
locations (Krugman 1995). The transfer abroad of component assembly occurs in
many industries where the technology of production permits the separation of labour-
intensive segments from other stages of production. Assembly activities related to
high-tech electronic industries, the production of semi-conductor devices in particular,
are by far the most important. The other industries with significant assembly
operations located in developing countries are computers, electrical appliances,
automobile parts, electrical machinery and optical products. The indications are that
this form of internationalisation of production will continue to expand giving labour-
8
surplus countries the opportunity to find expanded niches for labour intensive
production.
In the area of standard consumer goods, market potential for goods that are
made to local specifications using local inputs (and hence have greater potential for
forging backward linkages) is extremely limited. Such goods account for only a small
and shrinking share of manufactured exports from DCs. Success in expanding the
volume of exports in this sphere depends crucially on the country’s ability to enter the
fast-growing markets for made-to-order manufactured goods, which are generally
more import intensive. As distinct from meeting consumer requirements in a shortage-
ridden suppliers’ market for import-substituting products, producing what is sought in
the former markets call for a vector of imported inputs meeting exacting quality
requirements and specifications. The substitution of such inputs with locally produced
inputs of secondary quality may lead to significant market losses, and the cost involved
in correcting the defect in a further stage may be prohibitive ((Wortzel and Wortzel
1980, Keesing and Lall 1992, p. 179).
Limits to the use of local raw materials (even if they meet quality requirements)
in the production of light consumer goods can also derive from the nature of global
strategies of multinational enterprise (MNE) and international buying groups.6 MNE
subsidiaries operate within a framework of their own international production and
marketing networks. The parent firms generally aims to preserve a high level of
international mobility for their processing operations. Establishing long-term
commercial relationships with local suppliers may run counter to this goal (Athukorala
1995, p. 561). Even in a situation where production is undertaken largely by local
firms without MNE involvement, like in the case of the clothing industry in Indonesia,
successful market penetration in these goods depends on the relationship between
domestic producers and buyers abroad, a relationship which is normally formed
through the involvement of international buying groups (the ‘buyers’, for short). The
6 MNE subsidiaries are directly involved in both production and exporting while thebuying groups are trade intermediaries who play a crucial role in linking domesticproducers with sellers in end markets.
9
buyers place orders with producers according to their own market assessment, and in
most cases, they insist on the use of inputs from specific foreign sources for quality
considerations (Keesing 1993, Keesing and Lall 1992, Rhee et al. 1984).
Assembly production in vertically integrated industries (Category 3) naturally
tends to be even more import intensive than light manufactured goods. Because of the
multi-stage vertical integration of the overall production process, value added by a
manufacturing facility in a given location is likely to be only a small fraction of the
value of its shipments, which are dominated by the cost of intermediate inputs
(Krugman 1995, p 334). Moreover, the input structure of this type of production
activity is rigidly determined as part of the overall global value chain. In particular, in
semi-conductor and other high-tech industries which account for the bulk of world
trade in assembly activities, offshore assembly activities are often carried out by
subsidiaries (mostly fully-owned) of the end-user companies using components
obtained through intra-firm trade. This is because of the need to preserve technical
secrets and undertake precision operation to exacting standards. Given these features
of the production process, there is limited, if any, room for encouraging local sourcing
through government policy. However, despite the high import intensity and meagre
value addition on a per unit basis, the entry into the process of ‘slicing up of value
chain’, which accounts for a large and ever expanding share of world trade, is an
effective means for a developing country to maximise its total net export earnings and
to open up a vent for its surplus labour.
It follows from the above that, in the context of emerging patterns of
international division of labour, there are powerful forces which make the export
structure of a surplus-labor economy import intensive and hence footloose. When the
export structure shifts away from traditional resource based processing activities and
towards more dynamic product lines, in particular when the manufacturing industry
successfully links itself to the process of “slicing of value chain” in vertically integrated
industries, import intensity of export production could well increase leading to a
decline in overall sectoral linkages. However, the enlarged market potential for these
new product lines would lead to a rapid expansion of total net export earnings. At the
same time growing labour intensity of the emerging export structure (as a result of the
10
increased substitution of labour for intermediate inputs), coupled with rapid export
growth, would be reflected in growing employment opportunities in export-oriented
manufacturing. Thus we hypothesise that declining (or stagnating) input linkages, and
rapid growth of total net exports earnings and export-related employment can go hand
in hand at the initial stage of export-led industrialisation in a surplus-labour economy.
From a policy point of view, this implies that linkages are a misleading indicator of the
developmental implications of export-oriented industrialisation.
3. Methodology and Data
(a) Methodology
The empirical analysis of this paper involves the measurement of three important
aspects of export performance, backward (input) linkages, net foreign exchange
earnings and employment generation. For this purpose we make use of the Leontief
inter-industry accounting framework which provides for capturing both direct and
indirect (intersectoral) repercussion in the measurement process.
Following an input-output framework of the ‘complementary import’ type7,
let
X = Ad X + Yd + E (1)
Where X is the vector of total gross output, Ad= [ ],a a
X
Xijd
ijd ij
j
= , is the domestic
input-output coefficient matrix; and Yd and E are vectors of domestic and export
demand on domestically produced goods.
7 Input-output tables are basically of two types, depending on the way importtransactions are treated in the compilation. In a complementary import type I-O tablethe import content of each transaction is separately identified and allocated to animport matrix. A competitive import type” I-O table treat all imports (intermediate plusfinal) as competing with domestic production and thus, imports are not separated fromdomestic transactions. For the purpose of accurate measurement of linkages andimport intensity of domestic production it is necessary to work with a table of theformer type (Bulmet-Thomas 1982).
11
Solving equation (1) for X,
X = (I-Ad)-1 (Yd + E) (2)
where (I-Ad)-1 is the Leontief domestic inverse matrix. An element of this matrix, Aijd ,
indicates output required of the ith sector to sustain one unit of output of sector j.
Thus the sum of the jth column of (I-Ad)-1 gives a measure of total backward
linkages (BWLj) when domestic final demand or exports for the jth commodity
increases by one unit:
BWLj = Aijd
i
n
∑ (3)
Note that BWLj shows the total units of output required directly and indirectly from all
sectors (including the unit of output delivered to final demand by the given sector)
when the demand for the jth commodity rises by one unit.
To measure import intensity of domestic production, define a diagonal matrix
of impoted input coefficients, R = [ri] , ri = R
Xi
i
, where Ri shows direct imports used
per unit-production in a given sector. The empirical basis for the quantification of the
total import content of sectoral production can then be obtained as,
R(I-Ad)-1 = M (4)
where M is the import inverse matrix (total import requirement matrix of domestic
production) . An element of this matrix, mij , indicates the total amount of import i
(both direct and indirect) required to produce a unit of commodity j locally.
Therefore, when there is a unit increase in final demand for sector j, the corresponding
increase in total demand from that sector for imported inputs (mTj ) is given by,
12
mTj = rij
i
m
=∑
1
(j = 1,2,..., n) (5)
Let ej refer to the value of total exports from sector j. Assuming that imports required
to produce a unit of output are identical whether the product is sold domestically or
exported, the total value of imports embodied in ej , which is denoted by mTj , can be
estimated as,
m m eTje
Tj j= (6)
Net export earnings of sector j (denoted by e jn ) is given by :
e jn = ej - m eTj j = (1 - mTj) ej (7)
Total net export earnings (net foreign exchange earnings from exports) of the economy
(ET ) is therefore,
ET = e jn
j∑ (8)
The procedure for measuring employment implications of exports is similar to
that adopted in measuring import intensity. The starting point is to define a diagonal
matrix of employment coefficients, G = [gi] , gi = G
Xi
i
, where Gi is number of workers
employed in industry i . The empirical basis for the quantification of the total import
content in sectoral production can be obtained as,
G (I-Ad)-1 = L (9)
Where L is the employment inverse matrix (total employment requirement matrix of
domestic production). An element of this matrix, which we denote by lij , indicates the
total number of workers employed by sector I (both direct and indirect) to produce a
13
unit of commodity j locally. Therefore, when there is a unit increase in final demand
for sector j, the corresponding increase in total employment (lTj ) is given by,
lTj = liji
m
=∑
1
(j = 1,2,..., n) (10)
Based on L sectoral and total export-induced employment can be estimated by
replicating the estimation procedure suggested by Equations (7) and (8).
(b) Data
In order to implement the methodology developed in the previous section we make
use of the input-output tables for 1985 and 1990 and export data for the period 1985-
1995 provided by the Biro Pusat Statistik (BPS). The input-output tables are based
on the Klasifikasi Lapangan Usaha Indonesia (KLUI) - the Indonesian version of the
International Standard Industry Classification (ISIC). For the purpose of our analysis
two modifications are made to the original data provided by the BPS. First, in order to
achieve intertemporal comparability we reclassify the 169-sector 1990 table according
to the 128-sector classification used in 1985, using a sectoral concordance provided
by the BPS. Second, export data for the period 1985-95 which are based on the
Standard International Trade Classification (SITC) system are converted to the I-O
classification using the SITC-KLUI concordance developed in Santosa (1994). After
undertaking the computations relating to Equations (2), (4) and (9) using the 138
sector tables, final estimates of net exports and export-related employment were made
for the manufacturing sectors only. After omitting three “non-exporting industries’
(i.e. industries for which there were no reported exports for any of the years) and two
sectors for which there was ambiguity in separating ‘manufactured’ component from
total exports, the final analysis cover 77 KLUI /ISIC industries.
There is no unique way to separate manufactured exports from total
merchandise exports. The two most widely used definitions are the ISIC-based
definition under which all products belonging to ISIC 3 are treated as manufactures
and the SITC based definition which covers only the products in SITC sections 5
through 8, less 68 (non-ferrous metals). To ensure wider comparability of our results,
14
we prepare estimates under both definitions, with the difference between the two
identified as a third category, resource based manufacturing. In order to see the
sensitivity of the results to the ‘special’ market conditions faced by processed wood
and clothing during the period under study we also generate alternative estimates net
of these exports.8
Before turning to the results, it is pertinent to comment on limitations of our
estimation procedure. First the estimation procedure is based on the implicit
assumption that the import content of production of exports in each industry is
identical to the average import content of total production of the industry. This is not
entirely accurate. The usual pattern is that when industries are finely classified, import
content in an industry’s production for exports is higher than its production for the
home market (Michaely 1984, p. 28; Athukorala and Bandara, 1989, p. 899). Our
estimation procedure may, therefore, have led to an under estimation of the relative
import intensity of manufactured exports (and therefore over estimation of linkages
and net exports). Second, the estimates , as they are based on the inter-industry
transaction table, incorporate import requirements on the current account only. The
unavailability of a capital coefficient matrix precludes the measurement of import
requirements on the capital account. Third, the measurement of linkages solely on the
basis of material flows has its own limitations. In particular, the charting of simple
interindustry flows fails to account for the degree to which components of value added
- returns to capital, labour and the state - interact with the rest of the economy.9 This
(third) limitation does not, however, pose a problem for our analysis; the current
debate on the economic effects of manufactured exports expansion has largely (if not
solely) focussed on material (input) linkages.
4. Results
8 The expansion of processed wood exports was propelled by government -enforced export
substitution ( through progressive prohibition on the export of logs since the early 1980s),buttressed by the country’s power in the international market for tropical timber. Clothingexports have been influenced by export quotas imposed under the Multi-fibre Arrangement(Hill 1996 Chap. 8).
9 For a useful discussion on the limitations of the measurement of linkages using I-Otables see Weisskoff and Wolf (1977).
15
Summary indicators of linkages, import intensity and net exports are reported in Table
1. Estimates of sectoral linkage indices and data on export composition used in
deriving these summary measures are reported in Appendix table 1.
The estimates clearly point to a decline in the degree of linkage of
manufactured exports during the period under study. This result is remarkably resilient
to the particular definition of manufactures used and the inclusion/exclusion of
plywood and clothing as part of total exports. In terms of the broader ISIC definition,
in 1985 US$1000 worth of exports was reflected in an increase in output by US$1820
from all sectors in the economy. This declined to 1752 in 1990 and further to 1730 by
1995. The decline is even sharper for non-clothing SITC exports of exports, from
17900 in 1990 to 1600 in 1995.
The time patterns of import intensity of exports are largely consistent with this
reduction in export linkages. In all cases, the degree of import intensity has increased,
with non-clothing SITC exports indicating the sharpest increase. This is consistent
with our expectation based on the ongoing process of export diversification towards
assembly-type activities and relatively more import dependent light consumer goods
such as shoes, toys and spots goods.
Despite the increased import dependence and weakened linkages, net export
earnings from manufactured exports have recorded strong growth. Thus, in line with
our postulation, rapid expansion in export volume (in gross terms) under the
emerging pattern of export orientation has more than compensated for the increased
import intensity of the production structure. Interestingly, even when the increased
import intensity of exports is appropriately allowed for, there has been an impressive
16
Table 1: Linkages, Import Intensity and Net Export Earnings of Manufactured
ISIC manufacturing excluding plywood and clothing 514
(0.82)
1416
(1.92)
3752
---
6566
---
SITC manufacturing 436
(0.70)
2044
(2.76)
5643
---
5789
---
SITC manufacturing excluding clothing 154
(0.24)
865
(1.11)
2440
---
3863
---
Source and method:
Authors’ estimates based on the methodology and data sources discussed in the text.
19
(from 154 thousand to 865 thousand) and then a six-fold increase to 1995 (3.8
million).
The discussion so far has clearly shown that both the contribution of
manufactured exports to net foreign exchange earnings and their employment
contribution have been impressive despite decline in linkages. And this inference
remains unaltered when plywood and clothing, the two largest product categories
which benefited from special market circumstances, are excluded from our
calculations. In fact, the growth trends in net exports and export-related employment
are much sharper for the non-clothing SITC exports, which holds the future for
Indonesia’s manufactured export expansion drive. Thus the results support our
contention that at the early stage of export-led industrialisation, linkages are not an
appropriate criteria for judging developmental implications.
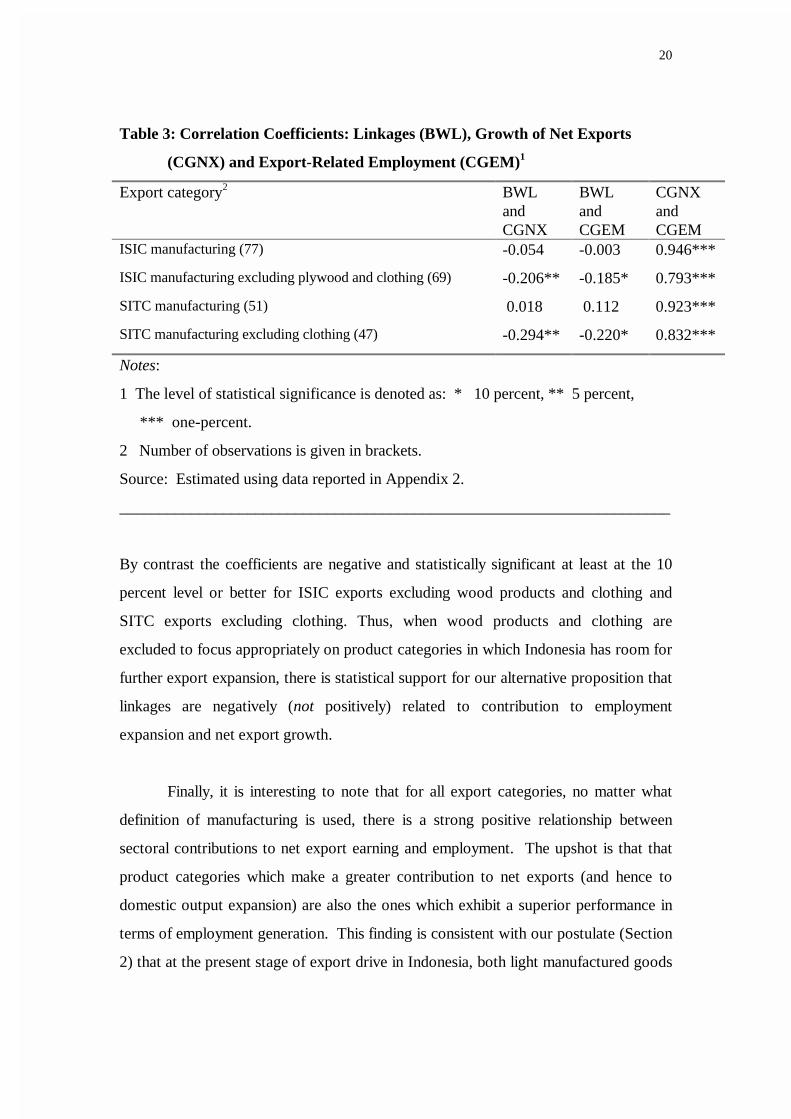
As a further test, we undertook a correlation analysis of the relationship
between sectoral linkages, and sectoral contribution to growth of net foreign exchange
earning and export employment. Contribution to employment and net export growth
are measured (in current US$ terms) between 1985/86 and 1993/95. Two year
averages at the beginning and end of the period are used to allow for possible random
changes in data. Linkages indices used are the ones based on the 1990 I-O table.10 The
results are reported in Table 3.
There is little support for a positive association (as implied in the linkage
enthusiast’s position) between linkages (BWL) and, contribution to net export growth
(CGNX) and contribution to employment increment (CGEM). The coefficients for
total SITC exports are positive, but they are not statistically different from zero. For
total ISIC exports the coefficients are negative but do not attain statistical significance.
10 Obviously the 1990 I-O table better reflects the export production structure during thepost-reform era than the table for 1985. he results are, however, remarkably resilientto the use of 1985 linkage estimates. In other word there has not been significantchange in sectoral ranking in terms of linkages between the two year. The correlationcoefficient between the two linkage series is as high as 0.82.
20
Table 3: Correlation Coefficients: Linkages (BWL), Growth of Net Exports
(CGNX) and Export-Related Employment (CGEM)1
Export category2 BWLandCGNX
BWLandCGEM
CGNXandCGEM
ISIC manufacturing (77) -0.054 -0.003 0.946***
ISIC manufacturing excluding plywood and clothing (69) -0.206** -0.185* 0.793***
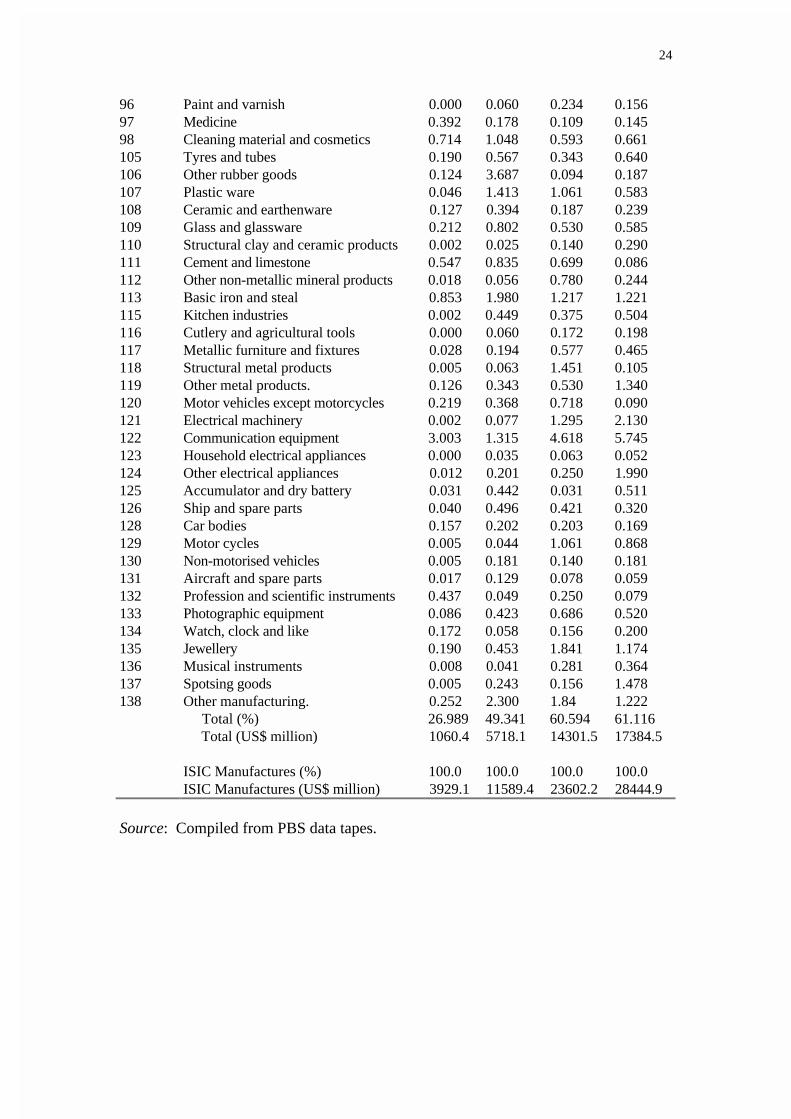
Appendix 2Sectoral Linkages, and Contribution to Net Exports and Export-related Employment
ISICcode
BWL:1985 BWL: 1990 CGNX CGEM
Resource-based Manufactures52 Canned and preserved meat 2.265 2.302 0.133 0.05753 Dairy products 2.051 1.997 0.032 0.01554 Processed and preserved vegetables 1.817 1.906 0.776 0.33555 Processed and preserved fish 2.077 2.076 0.742 0.31756 Vegetable and animal oil 1.971 1.604 5.444 2.27957 Milled and polished rice 2.041 2.062 0.050 0.01560 Other flour 2.029 1.789 0.116 0.07761 Bread and bakery products 1.911 1.829 0.006 0.00462 Noodle/macaroni/similar products 1.931 1.629 0.139 0.11863 Sugar 1.821 1.776 0.063 0.04564 Chocolate and sugar confectionary 1.957 1.353 0.181 0.28265 Syrups of all kind 1.847 2.094 0.066 0.04066 Ground coffee 1.866 1.661 3.463 5.25968 Processed soybeans 1.797 1.782 0.014 0.02669 Other foods 2.112 2.038 0.170 0.26770 Animal feed 2.148 1.839 0.728 1.15671 Alcoholic beverages 1.369 1.471 0.009 0.00672 Non-alcoholic beverages 2.074 2.094 0.038 0.02273 Cigarettes 1.786 1.609 0.459 0.10274 Other processed tobacco 2.007 1.861 0.004 0.00084 Swan and processed wood 1.659 1.636 18.173 26.16885 Plywood and other products 1.848 1.637 -0.119 -0.70886 Wooden construction material 1.891 1.895 0.073 0.10587 Wooden furniture and fixtures 1.764 2.059 4.210 6.099104 Processed rubber 2.062 2.042 5.031 1.580114 Nonferrous basic metal 1.633 1.589 0.483 0.170
SITC Manufactures75 Spinning 1.245 1.331 2.458 2.17576 Weaving 1.746 1.774 4.634 7.36877 Made-up textile goods except apparel 1.813 2.136 0.633 0.95878 Knitting 1.967 1.827 -0.068 -0.11179 Wearing apparel 2.009 2.054 10.942 16.60580 Carpet/rug/rope etc 1.450 1.741 -0.009 -0.06381 Other textiles 1.980 1.741 0.371 0.53582 Tanned and finished leather 2.148 2.146 0.175 0.20283 Footwear and leather products 1.931 1.573 8.368 11.86689 Woven goods except yarn and plastic 1.648 1.744 0.587 0.86590 Paper and cardboard 1.348 1.684 2.427 0.92291 Goods made of paper and cardboard 1.308 1.991 0.781 0.25592 Printed material 1.419 1.918 0.026 0.00893 Non-fertiliser basic chemical 1.304 1.449 1.689 0.48494 Fertiliser and pesticides 1.432 1.561 0.467 0.06695 Synthetic resin and plastic material 1.122 1.686 0.690 0.17896 Paint and varnish 1.279 1.529 0.185 0.05497 Medicine 1.428 1.672 0.100 0.024
26
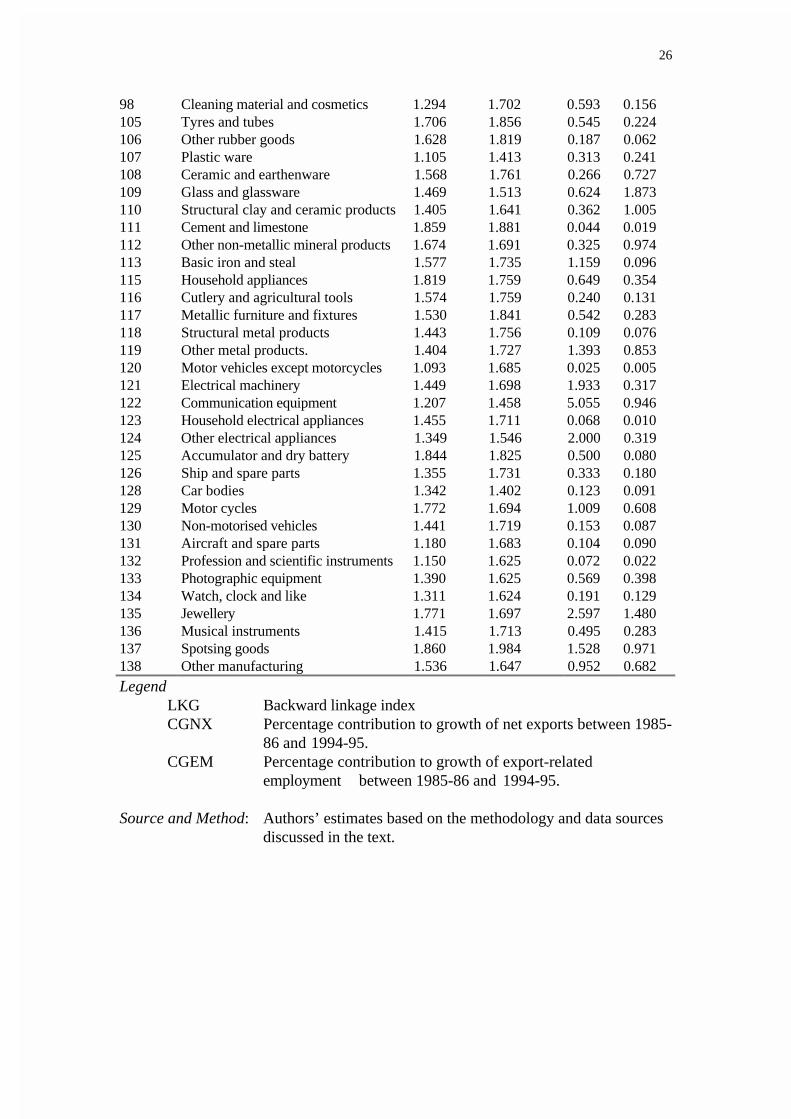
98 Cleaning material and cosmetics 1.294 1.702 0.593 0.156105 Tyres and tubes 1.706 1.856 0.545 0.224106 Other rubber goods 1.628 1.819 0.187 0.062107 Plastic ware 1.105 1.413 0.313 0.241108 Ceramic and earthenware 1.568 1.761 0.266 0.727109 Glass and glassware 1.469 1.513 0.624 1.873110 Structural clay and ceramic products 1.405 1.641 0.362 1.005111 Cement and limestone 1.859 1.881 0.044 0.019112 Other non-metallic mineral products 1.674 1.691 0.325 0.974113 Basic iron and steal 1.577 1.735 1.159 0.096115 Household appliances 1.819 1.759 0.649 0.354116 Cutlery and agricultural tools 1.574 1.759 0.240 0.131117 Metallic furniture and fixtures 1.530 1.841 0.542 0.283118 Structural metal products 1.443 1.756 0.109 0.076119 Other metal products. 1.404 1.727 1.393 0.853120 Motor vehicles except motorcycles 1.093 1.685 0.025 0.005121 Electrical machinery 1.449 1.698 1.933 0.317122 Communication equipment 1.207 1.458 5.055 0.946123 Household electrical appliances 1.455 1.711 0.068 0.010124 Other electrical appliances 1.349 1.546 2.000 0.319125 Accumulator and dry battery 1.844 1.825 0.500 0.080126 Ship and spare parts 1.355 1.731 0.333 0.180128 Car bodies 1.342 1.402 0.123 0.091129 Motor cycles 1.772 1.694 1.009 0.608130 Non-motorised vehicles 1.441 1.719 0.153 0.087131 Aircraft and spare parts 1.180 1.683 0.104 0.090132 Profession and scientific instruments 1.150 1.625 0.072 0.022133 Photographic equipment 1.390 1.625 0.569 0.398134 Watch, clock and like 1.311 1.624 0.191 0.129135 Jewellery 1.771 1.697 2.597 1.480136 Musical instruments 1.415 1.713 0.495 0.283137 Spotsing goods 1.860 1.984 1.528 0.971138 Other manufacturing 1.536 1.647 0.952 0.682
LegendLKG Backward linkage indexCGNX Percentage contribution to growth of net exports between 1985-
86 and 1994-95.CGEM Percentage contribution to growth of export-related
employment between 1985-86 and 1994-95.
Source and Method: Authors’ estimates based on the methodology and data sources discussed in the text.
27
References
Athukorala, Prema-Chandra and Jayatilake S. Bandara (1989), ‘Growth ofmanufactured Exports, Primary Commodity Dependence and Net ForeignExchange earnings: Sri Lanka”, World Development, 17(6). 897-903.
Athukorala, Prema-Chandra (1995), “Foreign Direct Investment and Manufacturingfor Exports in a New Exporting Country”, World Economy, 18(4), 543-64.
Findlay, Ronald (1984), “Trade and Development: Theory and Asian Experience”,Asian Development Review, 2(1), 23-42.
Helleiner, Gerald K. (1973), “Manufactured Exports from Less developed Countriesand Multinational Firms”, Economic Journal, 83(329), 21-47.
Hill, Hal (1996a) The Indonesian Economy Since 1966, Cambridge: CambridgeUniversiy Press.
Hill, Hal (1996b), “Indonesia’s Industrial Policy and Performance: ‘Orthodoxy’Vindicated”, Economic Development and Cultural Change (forthcoming).
Hirschman, Albert O. (1958) The Strategy of Economic Development, New haven:Yale University Press.
Fugita, Natsuki and William E. James (1996), “employment Creation andManufactured Exports in Indonesia: 1980-90”, Bulletin of IndonesianEconomic Studies (forthcoming).
Guisinger, Stephen (1985), Investment Incentives and Performance, New York: Praeger.
Keesing, Donald B. (1983), “Linking Up to the Distant Markets: South to NorthExports of Manufactured Consumer Goods”, American Economic Review:Papers and proceedings, 73, 338-42.
Keesing, Donald B. and Sanjaya Lall (1992), “marketing manufactured exports fromDeveloping Countries: learning Sequences and Public Support”, in Gerald K.Helleiner (ed.), Trade Policy, Industrialisation and Development: NewPerspectives, Oxford Clarendon Press, Pp. 176-93.
Krugman, Paul (1995), “Growing World Trade: Causes and Consequences”, BrookingPapers on Economic Activity, 25th Anniversary Issue, 327-77.
James, William E. (1996), Indonesia: Non-Oil and Non-Gas Export Performance in1995, Agency for Research and Development, Ministry of Industry and Trade,Jakarta (mimeo).
Jayasuriya, Sisira and Chris Manning (1996) “Survey of Recent Developments”,Bulletin of Indonesian Economic Studies, forthcoming.
28
Lall, Sanjaya and Kishore Rao (1995), Indonesia: Sustaining Manufactured ExportGrowth (Vol. 1), Ministry of Trade and Industry, Jakata (mimeo).
Little, Ian M.D. (1982) Economic Development: Theory, Policy and InternationalRelations, New York: Basic Books.
Michaely, Michael (1984), Trade, Income Levels and Dependence, Amsterdam: NorthHolland.
Pangestu, Marie (1994), ‘Letter from Indonesia’, International Economic Insights,5(2), 42-4.
Poot, Huib (1991), “Industry Linkages in Indonesian Manufacturing”, Bulletin ofIndonesian Economic Studies, 27(2),61-90.
Poot, Huib, Arie Kuyvenhoven and Jaap C Jansen (1990), Industrialization and Tradein Indonesia, Bulaksumur, Yogyakarta: Gadjah Mada University Press.
Rhee, Yung Whee, Bruce Ross-Larrson and Garry Pursell (1984), Korea’sCompetitive Edge: Managing the Entry into World Markets, Baltimore: JohnsHopkins University Press.
Riedel, James (1974), “Factor Proportions, Linkages and the Open DevelopingEconomy”, Review of Economics and Statistics, 75(4), 487-94.
Riedel, James (1976), “A Balanced -growth Version of the Linkage Hypothesis: AComment”, Quarterly Journal of Economics, 90(3), 319-22.
Santosa, Bambang H. (1994), Export Expansion and the Indonesian Economy: AnInput-Output Approach (unpublished Masters thesis), La Trobe University,Australia.
Weisskoff, Richard and Edward Wolf (1977), “linkages and Leakages: Industrialtracking in an Enclave Economy”, Economic Development and CulturalChange, 25(4),607-28.
Wortzel, L.H. and H.V. Wortzel (1980), “Export Marketing Strategies for NIC andLDC-based Firms”, Colombia Journal of World Business, 16 (Spring), 51-61.