98
Game Changer 2015 Annual Report
| Date post: | 25-May-2018 |
| Category: |
Documents |
| Upload: | phungkhanh |
| View: | 219 times |
| Download: | 2 times |

Game Changer2015 Annual Report
1000 Cranberry Woods Drive
Cranberry Township, PA 16066
724-776-8600
www.MSAsafety.com

Business of MSAMSA is in the business of developing, manufacturing and selling
innovative products that enhance the safety and health of workers and
protect facility infrastructures throughout the world. Critical to MSA’s
mission is a clear understanding of customer processes and safety
needs. MSA dedicates significant resources to research which allows
the company to develop a keen understanding of customer safety
requirements for a diverse range of markets, including the fire service,
construction, public utilities, mining, the oil, gas and petrochemical
industry, HVAC, hazardous materials remediation, and the military.
MSA’s principal products, each designed to serve the needs of these
target markets, include respiratory protective equipment, portable
gas detection instruments and sensors, fixed gas and flame detection
systems, fall and head protection products, as well as products for eye,
face and hearing protection, and thermal imaging cameras.
MSA was founded in 1914 by John T. Ryan and George H. Deike, two
mining engineers who had firsthand knowledge of the terrible human
loss that was occurring in underground coal mines at that time. Their
knowledge of the mining industry provided the foundation for the
development of safety equipment to better protect underground
miners. While the range of markets served by MSA has expanded
greatly over the years, the founding philosophy of understanding
customer safety needs and designing innovative safety equipment
solutions that address those needs remains unchanged.
MSA is headquartered in Cranberry Township, Pennsylvania, with
operations employing 4,600 associates throughout the world.
A publicly held company, MSA’s stock is traded on the New York Stock
Exchange under the symbol MSA.
About the CoverMore than five years
in the making, the
G1 Self-Contained
Breathing Apparatus
(SCBA) represents the
single largest new
product development
effort in MSA’s history.
With two patents
issued and 12 patents
pending (as of the printing of this report), the
G1 SCBA is truly a market “game changer.” Quite
simply, it is the most technologically advanced,
streamlined, balanced, and customizable SCBA that
MSA has ever produced. Firefighters and industrial
workers rely on SCBA to provide respiratory
protection in life-threatening environments. In its
first full year of availability, the G1 unit is already
generating unprecedented demand, as demonstrated
by an $80 million global SCBA backlog at the
beginning of 2015. Even more impressive is the fact
that more than half of all incoming orders for the G1
SCBA are from fire departments using competitive
models. Appropriately so, it was named MSA’s Product
of the Year for 2015 and has rightfully earned its place
on the cover of our 2015 Annual Report.
Our MissionThat men and women may work in safety and that they, their families and their communities may live in health throughout the world.
Our VisionTo be the world’s leading provider of safety solutions that protect workers when life is on the line. We pursue this vision with an unsurpassed commitment to integrity, customer service and product innovation that creates exceptional value for all MSA stakeholders.
Organization
William M. Lambert was elected Chairman of the Board, succeeding John T. Ryan III, who was elected as the company’s chairman in 1991 and served in that capacity for 24 years. Mr. Lambert, who is the fifth chairman in MSA’s century-long history, joined MSA in 1981, became an MSA director in 2007 and was elected President and Chief Executive Officer in May, 2008.
Kenneth D. Krause was elected Vice President, Chief Financial Officer and Treasurer, ensuring continuity of experienced financial leadership. A 10-year veteran of MSA, Mr. Krause most recently served as Vice President, Strategic Finance and Treasurer.
Also in 2015 MSA took several steps to build a solid foundation for the company’s second century in business, including modernizing the company’s 100-year-old business structure. This involved changing MSA’s geographic reporting structure from three regions to two – MSA International and MSA Americas – and changing the areas of responsibility for three of our executive leaders.
Kerry M. Bove was promoted to Senior Vice President and Chief Strategy Officer. In this newly created role, Mr. Bove oversees MSA’s strategic plan execution, mid-course corrections, the execution of M&A activities, and the implementation of strategic marketing strategies. A 36-year veteran of MSA, Mr. Bove most recently served as Vice President and President, MSA International, responsible for MSA’s operations in Asia, Australia, Africa, and Latin America.
Ronald N. Herring, Jr. was promoted to Senior Vice President and President, MSA International. In this capacity, Mr. Herring oversees the company’s business in Europe, Russia, the Caspian Sea region, the Middle East, India, China, Japan, South East Asia, Australia, and Africa. Mr. Herring joined MSA in 1983 and most recently served as Vice President and President, MSA Europe, responsible for MSA’s business throughout Europe as well as in Russia, the Caspian Sea region, the Middle East, and India.
Nishan J. Vartanian was promoted to Senior Vice President and President, MSA Americas. In this role, Mr. Vartanian is responsible for MSA’s business in Spanish-speaking Latin America, Brazil, Mexico, and North America. A 30-year veteran of MSA, Mr. Vartanian most recently served as Vice President and President, MSA North America, responsible for the company’s operations in the U.S., Canada and Mexico.
While Mr. Herring and Mr. Vartanian were officially appointed to these new roles in 2015, they spent the latter half of the year in transition. They began their full-time responsibilities as Senior Vice President and President, MSA International and Senior Vice President and President, MSA Americas, respectively, at the beginning of 2016.
Section 302 Certifications and NYSE CEO CertificationIn June 2015, the Company’s Chief Executive Officer submitted
to the New York Stock Exchange the annual certification as to
compliance with the Exchange’s Corporate Governance Listing
Standards required by Section 303A.12(a) of the Exchange’s Listed
Company Manual. The certification was unqualified.
The Company’s reports filed with the Securities and Exchange
Commission during the past year, including the Annual Report on
Form 10-K for the year ended December 31, 2015, have contained
the certifications of the Company’s Chief Executive Officer and Chief
Financial Officer regarding the quality of the Company’s public
disclosure required by Section 302 of the Sarbanes-Oxley Act.
Shareholders’ InquiriesAdditional copies of the company’s 2015 Annual Report, including
Form 10-K, as filed with the Securities and Exchange Commission,
may be obtained by shareholders after March 31, 2016. Printed
and electronic versions are available. Requests should be directed
to the Chief Financial Officer, who can be reached at one of the
following:
Phone: 724-741-8270
Fax: 866-538-7488
Internet: www.MSAsafety.com
U.S. Mail: MSA
Chief Financial Officer
1000 Cranberry Woods Drive
Cranberry Township, PA 16066
Kenneth D. KrauseWilliam M. Lambert Kerry M. Bove Ronald N. Herring, Jr. Nishan J. Vartanian

1
BALANCED CAPITAL ALLOCATION STRATEGY DRIVING OUR BUSINESS FORWARD
EXECUTING GROWTH STRATEGIES IN ATTRACTIVE AND DIVERSE END MARKETS
INVESTMENTS DRIVING CONSISTENT LOCAL CURRENCY GROWTH
STRONG GROWTH CONTINUES TO GENERATE VALUE, AND WE’RE COMMITTED TO RETURNING THAT VALUE TO SHAREHOLDERS THROUGH AN INCREASING DIVIDEND
INVESTING IN STRATEGIC ACQUISITIONS
5-YEAR GROWTH METRICS
Debt to EBITDA
2011 2012 2013 2014 2015
2.11.5 1.5 1.4
2.5
2010: General Monitors
$260 million net of cash
2015: Latchways
$180 million net of cash
Latchways acquisition doubles market share in Fall Protection - the largest and fastest growing segment of the sophisticated safety products market.
Expect earnings accretion in 2016 from Latchways investment
Launched revolutionary G1 SCBA to coincide with replacement cycle in North American fire service.
Consolidated SCBA revenue growth of 52% in 2015
Fixed Gas and Flame Detection
Fall Protection
Breathing Apparatus
Portable Gas Detection
Industrial Head Protection
Fire Helmets
16%
12%
11%
7%
7%
4%
* All CAGRs and growth rates stated in local currency terms.
1 1% 6% +550Core Sales CAGR
(8% organic) (5% organic) Basis Points
Total Sales CAGR Gross Profit
In 2015, we recognized double digit revenue growth on a local currency basis, executed a strategic acquistion and continued to fund an increasing dividend. While we have taken steps to mitigate the impact of headwinds in certain end markets by streamlining our cost structure and controlling discretionary spend, we have and will continue to use our strong balance sheet to make strategic investments that enable us to deliver innovative solutions to our customers, capture market share in key industries and drive operating margin expansion and earnings growth.
Financial Highlights
2011 2013 2014
$1.03
$0.28*
* includes special dividend
$1.18$1.23
2012
$1.10
2015
$1.27
$ PER SHARE DIVIDEND PAYMENTSYield: 2.9% (March 2016)
INVESTING IN NEW PRODUCTS
3.5% 3.7% 4.1% 4.3% 4.3%
2011 2012 2013 2014 2015R&D Expense (% of Sales)
1
Total sales from products developed and launched over past 5 years
38%
Core Product CAGRs

TO OUR SHAREHOLDERS, CUSTOMERS, CHANNEL PARTNERS AND ASSOCIATES:In the first year of MSA’s second century as a global leader
in safety, we saw both success and challenge. Success in the
form of a new and revolutionary product platform – the G1
Self-Contained Breathing Apparatus (SCBA) – that has become
a game changer and is setting an entirely new standard for
respiratory protection in the global fire service market. And
challenge in the form of economic headwinds, such as China’s
economic slowdown, a deepening recession in Brazil and,
most notably, the impact of plunging oil and natural gas
prices on the demand for MSA products in the oil, gas and
petrochemical (OGP) industry.
In particular, the staggering loss of an estimated quarter-
million jobs in the global OGP industry in 2015 had a direct
impact on our business, as these conditions reduced demand
for nearly every MSA Core Product, excluding fire helmets
and SCBA. This includes our gas detectors, hard hats and fall
protection systems. And that proved to be a major challenge
for us throughout the year.
Challenge, however, is nothing new to MSA. In fact, if 100
years in business has taught us anything – or, if 34 years at
MSA has taught me anything – it’s that there’s never an easy
path to success.
That same experience also has taught me that, despite any
obstacle we encounter, we have some great and very unique
qualities at MSA on which we can depend. And they
are our authenticity and culture, our core values, and our
commitment to teamwork. Those are the underpinnings of
our success, that’s the culture and spirit that propelled
us forward in 2015, even in the face of a challenging
macroeconomic environment.
For instance, I believe we are – more than ever – focused on
creating true value for all MSA stakeholders. I say that because
we took bold steps in 2015 to build a solid foundation for
the company’s second century. This included revisiting and
“refreshing” our corporate strategy, and modernizing our
business structure to enable the speed and agility required
to successfully execute that strategy. (See our Organization
section on the inside back cover for more details about
this change.)
We also continued to manage costs and expenses while
making further progress on our long-term growth objectives,
which are to advance the “core of MSA,” optimize our presence
in emerging markets, and achieve operational excellence.
Indeed, we can be proud of our achievements in these critical
areas in 2015, and here are just a few of the accomplishments
and initiatives that helped define our year:
A Game Changer in Firefighter SafetyIn early 2015, with regulatory approval delays finally behind
us and market “buzz” at an all-time high, MSA shifted into
full production of our groundbreaking G1 SCBA – MSA’s
2
MSA Chairman, President and Chief Executive Officer William M. Lambert with Chief Clyde Wilhelm of the Swissvale Fire Department, near Pittsburgh.

3
The Swissvale Fire Department near Pittsburgh, staffed
by both career and volunteer firefighters, is just one of the
hundreds of fire departments that changed SCBA brands in
2015 and took delivery of MSA’s groundbreaking G1 SCBA.
Shown from left to right are David Miller, Deputy Fire Chief;
Kip DeLeonibus, Assistant Fire Chief; Jon Smeltzer, firefighter;
William Lambert, MSA CEO; Clyde Wilhelm, Fire Chief;
Mike Artman, Fire Marshal; and Brian Lowe, Captain.
Product of the Year for 2015. More than five years in the
making, the G1 SCBA represents the single largest new
product development effort in MSA’s history. With its
revolutionary new facepiece design and a multitude of
patented and ergonomic features, the G1 SCBA is generating
unprecedented demand. Nowhere is this more evident
than in the U.S. fire service market, where a majority of fire
departments have SCBA nearing the end of their 10- to
15-year life cycle. These older units, many of which were
purchased with government funding following the tragic
events of 9/11, are driving a replacement cycle that is
expected to keep demand for the G1 SCBA strong for the
next several years.
That’s a major reason why MSA entered 2015 with an
elevated $80 million global SCBA backlog. Throughout the
year, our global teams in Murrysville and Cranberry Township,
Pennsylvania, and in Berlin, Germany, played a key role in
working down this backlog, and we finished the year with
a backlog of $45 million. Even more impressive was the fact
that more than half of all incoming orders for the G1 SCBA
were conversions from fire departments using competitive
SCBA models.
Driven by the G1’s strong performance in North America,
MSA’s consolidated SCBA sales increased 52 percent for
the year as we continued to grow market share in the very
important fire service sector.
Driving Operational Excellence During the year, we made further progress on our
transformational initiative, Europe 2.0. This multi-year project
is positioning MSA for long-term success by shifting our
business model in Europe from a fragmented structure of
individually managed affiliates to a closely coordinated and
fully aligned pan-European organization, enabled by a single
IT platform.
As part of this initiative, in January 2015, MSA completed
the “go-live” rollout of our new Principal Operating
Company (POC) model in Switzerland. As an extension of
our original Europe 2.0 initiative, the go-live of our POC
model represented the completion of our transition away
from an affiliate-based business model in Europe.
ANNUAL SALESBY REGION
North America
Western Europe
Emerging Europe
South America and Africa
Asia and Pacific Rim
54%
19%
7%
9%
11%
ANNUAL SALESBY CORE PRODUCT GROUP
Breathing Apparatus
Fall Protection
Portable Gas Detection
Industrial Head Protection
Fire and Rescue Helmets
Fixed Gas and Flame Detection
Other Products
5%
5%
27%
21%
11%13%
The G1 SCBA includes several ground-breaking features,
including the elimination of all electronic components
from the facepiece; darkness- and smoke-piercing “buddy
lights” (immediate right) that provide visible indicators
of critical air supply data from any angle; and improved
voice amplification communications (far right), all of
which come standard on every MSA G1 SCBA.
3
18%

MSA’s largest European affiliates – France, Germany, Italy, and
Spain – became the first to operate under this new,
more efficient model, followed by eight more affiliates
throughout 2015 and into early 2016. Throughout this
transition we experienced no major business disruptions,
and we accomplished this while also consolidating 10
European warehouses into one central location. We expect this
new warehouse structure to help us reduce overall inventory
and management costs, with improved on-time delivery
performance for our customers.
Separately, and as another example of
MSA’s customer focus, we embarked
on a new Customer Service strategy
for Europe in 2015. We call it CS2020,
and the first step of this initiative was
to establish a new and centralized
customer call center in Berlin – a first for MSA Europe. Overall,
we continue to implement strategic changes in the European
organization to strengthen customer satisfaction, identify key
customer “touch points” and put teams together to work on
customer-focused improvements.
I fully expect us to see improved operating margin
performance in Europe over the next several years as a
result of the investments we’ve made, along with a lower
consolidated effective tax rate. Without question, this
transformation has been a major undertaking for MSA, but
I’m confident it will help drive solid performance in Europe for
many years to come.
Two Great Companies – One Great ConnectionAs part of our strategic focus to create value, in October
2015 MSA acquired Latchways plc, a leading developer and
manufacturer of highly engineered fall protection systems and
solutions. Based in the United Kingdom, Latchways employs
approximately 250 people globally and had 2015 revenues
of approximately $50 million. The acquisition strengthens
our competitive position in the $1.5 to $2 billion global fall
protection market – one of the largest and fastest growing
segments of the sophisticated global safety market.
The addition of the Latchways brand doubles MSA’s fall
protection business, enhances and broadens a key Core
Product line and, perhaps most importantly, presents us with
several new and exciting growth opportunities in the utilities,
telecom and aircraft maintenance segments, further balancing
our existing market strengths in the oil and gas and fire service
industries. I’m pleased to report the Latchways integration
plan is fully on track and we expect this investment to be
accretive to earnings in 2016, our first full year of ownership.
Solid Capital ManagementThe Latchways acquisition is a solid example of MSA’s well-
balanced capital allocation strategy, which includes investing
in organic and inorganic growth initiatives, funding our
dividend to shareholders, and effectively managing our debt
to maintain MSA’s investment grade status while ensuring
access to additional capital at very attractive long-term rates.
Reflecting our commitment to enhancing shareholder value
and our steadfast confidence in MSA’s future, our Board of
Directors increased the quarterly dividend in May 2015 by
3 percent to 32 cents per common share, continuing a nearly
50-year-long track record of increased dividends.
2015 Financial ResultsDespite the economic headwinds I mentioned at the
beginning of this letter, our consolidated sales of $1.13billion
increased 8 percent on a local currency basis year over
year, or 7 percent excluding the Latchways acquisition. Our
reported revenue was essentially flat when compared to 2014,
reflecting an 8 percent foreign currency translation headwind
related to the stronger U.S. dollar. But clearly we continued to
see strong results from the organic investments we’ve made in
R&D over the past several years.
Nowhere was this more evident than in North America,
where our G1 SCBA helped drive a 16 percent increase in Core
Product sales. Europe delivered year-over-year Core Product
sales growth of 7 percent on a local currency basis, while MSA
International achieved Core Product sales growth of 3 percent
on a local currency basis. Despite the headwinds that we saw
in the oil and gas market, which placed significant pressure on
In October MSA acquired U.K.-based Latchways plc,
a move that instantly strengthened the company’s position
and competitiveness in the global fall protection market.
Shown at left are a variety of the high-quality fall protection
solutions Latchways offers. At right, MSA Chairman, President
and CEO William M. Lambert celebrates the formal closing of
the transaction with David Hearson, Latchways CEO.

5
our sales of portable gas detection and industrial head
protection products, local currency revenue from our Core
Product lines increased 11 percent as our diversified portfolio
supported double-digit growth in this challenging
macroeconomic environment.
In response to these challenges, and as part of our heightened
focus on value creation, we embarked upon a restructuring
initiative in the second half of 2015 that will deliver $10 million
in operating cost savings in 2016.
Looking ahead, we will continue to take a close look at MSA’s
cost structure and geographic footprint to identify further
areas of opportunity for savings, as we foresee continued
headwinds in the key end markets and emerging markets that
MSA serves.
Before I close this letter, I would like to reiterate MSA’s
commitment to the core values that have made our company
a leader in safety for more than a century. These values –
Integrity, Customer Focus, Speed and Agility, Innovation and
Change, Diversity and Inclusion, Teamwork, and Engagement,
all of which are connected by a “culture of safety” – have been
the underpinnings of our longevity and success. They are
also the foundation of the culture and drive that will propel
us forward.
These values were undoubtedly a
reason why MSA was just recently
recognized as a 2016 World’s Most
Ethical Company® by the Ethisphere
Institute. This is the second
consecutive year MSA has received this honor – one that
recognizes organizations that are making a material impact on
the way business is conducted by fostering a culture of ethics
and transparency at every level. This recognition, I believe, also
underscores MSA’s commitment to developing and utilizing
ethical business standards and practices that drive value for all
of our key stakeholders.
Guided by these beliefs, MSA is focused on creating long-
term value – for our customers, our shareholders, our
associates, and our communities. I am proud of how the MSA
organization navigated the challenges of 2015. We achieved
our mid-single digit local currency sales growth goal, invested
in strategic growth opportunities, and made restructuring
investments to streamline our operations and reduce
operating expenses.
Moving into 2016, we continue to look at how we might
further optimize our cost structure to drive higher operating
margins. Despite the headwinds that we face, we’re going to
continue to use our strong capital structure to make focused
investments that will drive progress against the pillars of
our corporate strategy and position MSA strategically and
financially for long-term value creation. Yes, our success will
be hard earned, but I am more certain than ever that we are
navigating the right course.
In closing, I want to express my gratitude to MSA’s
shareholders, customers and channel partners for your
confidence in our company, and I want to thank the Board
of Directors, my Executive Leadership Team, and all of the
associates of MSA for your tireless dedication to our mission
and your commitment to serving our customers around
the world.
Sincerely,
William M. Lambert
Chairman, President and Chief Executive Officer
In 2015 Australia’s largest Fire Brigade – the Fire and
Rescue New South Wales Brigade – put into service
7,000 F1 XF Fire Helmets. Showing off their new
“jet style” helmets are firefighters Jess Grimwood
and James Hourigan, immediate right, and Emergency
Services Minister, David Elliott, and Fire and Rescue
New South Wales Commissioner Greg Mullins, far right.
5

> Business of MSA 4
> Management’s Discussion and Analysis 19
> Financial Statements and Supplementary Data 35
Consolidated Statement of Income 39
Consolidated Statement of Comprehensive Income 40
Consolidated Balance Sheet 41
Consolidated Statement of Cash Flows 42
Consolidated Statement of Changes in Retained Earnings and
Accumulated Other Comprehensive Loss 43
Notes to Consolidated Financial Statements 44
2015 Financial Contents
6

UNITED STATES
SECURITIES AND EXCHANGE COMMISSION
Washington, D.C. 20549
For the fiscal year ended December 31, 2015
FORM 10-K
Commission File No. 1-15579
ANNUAL REPORT PURSUANT TO SECTION 13 OR 15(d) OF THE
SECURITIES EXCHANGE ACT OF 1934
MSA SAFETY INCORPORATED (Exact name of registrant as specified in its charter)
Pennsylvania (State or other jurisdiction of
incorporation or organization)
1000 Cranberry Woods Drive Cranberry Township, Pennsylvania
(Address of principal executive offices) Registrant’s telephone number, including area code: (724) 776-8600
46-4914539(IRS Employer Identification No.)
16066-5207 (Zip code)
(Title of each class) Common Stock, no par value
Securities registered pursuant to Section 12(b) of the Act: (Name of each exchange on which registered)
New York Stock Exchange
Indicate by check mark whether the registrant is a well-known seasoned issuer, as defined in Rule 405 of the Securities
Act. Yes No
Indicate by check mark if the registrant is not required to file reports pursuant to Section 13 or Section 15(d) of the Act. Yes No
Indicate by check mark whether the registrant (1) has filed all reports required to be filed by Section 13 or 15(d) of the Securities Exchange
Act of 1934 during the preceding 12 months and (2) has been subject to such filing requirements for the past 90 days. Yes No
Indicate by check mark whether the registrant has submitted electronically and posted on its corporate Website, if any, every Interactive Data
File required to be submitted and posted pursuant to Rule 405 of Regulation S-T (§ 232.405 of this chapter) during the preceding 12 months
(or for such shorter period that the registrant was required to submit and post such files). Yes No
Indicate by check mark if disclosure of delinquent filers pursuant to Item 405 of Regulation S-K (§ 229.405 of this chapter) is not contained
herein, and will not be contained, to the best of registrant’s knowledge, in the definitive proxy statement incorporated by reference in Part III
of this Form 10-K or any amendment to this Form 10-K.
Indicate by check mark whether the registrant is a large accelerated filer, an accelerated filer, a non-accelerated filer, or a smaller reporting
company. See the definitions of “large accelerated filer,” “accelerated filer” and “smaller reporting company” in Rule 12b-2 of the Exchange
Act. (Check one):
Large accelerated filer Accelerated filer
Non-accelerated filer Smaller reporting company
(Do not check if a smaller reporting company)
Indicate by check mark whether the registrant is a shell company (as defined in Rule 12b-2 of the Act). Yes No
As of February 19, 2016, there were outstanding 37,372,425 shares of common stock, no par value. The aggregate market value of voting stock
held by non-affiliates as of June 30, 2015 was approximately $1.5 billion.
DOCUMENTS INCORPORATED BY REFERENCE
Portions of the Proxy Statement for the May 10, 2016 Annual Meeting of Shareholders are incorporated by reference into Part III.

2
Table of Contents
Item No. Page
Part I
1. Business 4
1A. Risk Factors 8
1B. Unresolved Staff Comments 13
2. Properties 14
3. Legal Proceedings 15
4. Mine Safety Disclosures 15
Executive Officers of the Registrant 15
Part II
5. Market for the Registrant’s Common Equity, Related Stockholder Matters and Issuer Purchases of Equity Securities 16
6. Selected Financial Data 18
7. Management’s Discussion and Analysis of Financial Condition and Results of Operations 19
7A. Quantitative and Qualitative Disclosures About Market Risk 34
8. Financial Statements and Supplementary Data 35
9. Changes in and Disagreements with Accountants on Accounting and Financial Disclosure 76
9A. Controls and Procedures 76
9B. Other Information 76
Part III
10. Directors, Executive Officers and Corporate Governance 77
11. Executive Compensation 77
12. Security Ownership of Certain Beneficial Owners and Management and Related Stockholder Matters 77
13. Certain Relationships and Related Transactions, and Director Independence 77
14. Principal Accountant Fees and Services 77
Part IV
15. Exhibits and Financial Statement Schedules 78
Signatures 80

3
Forward-Looking Statements
This report may contain (and verbal statements made by MSA Safety Incorporated (MSA) may contain) forward-looking
statements within the meaning of the Private Securities Litigation Reform Act of 1995. These statements relate to future events
or our future financial performance and involve known and unknown risks, uncertainties and other factors that may cause our
actual results, levels of activity, performance or achievements to be materially different from any future results, levels of
activity, performance or achievements expressed or implied by these forward-looking statements. These risks and other factors
include, but are not limited to, those listed in this report under “Risk Factors,” “Management’s Discussion and Analysis of
Financial Condition and Results of Operations,” and elsewhere in this report. In some cases, you can identify forward-looking
statements by words such as “may,” “will,” “should,” “expects,” “intends,” “plans,” “anticipates,” “believes,” “estimates,”
“predicts,” “potential” or other comparable words. Actual results, performance or outcomes may differ materially from those
expressed or implied by these forward-looking statements. Although we believe that the expectations reflected in the forward-
looking statements are reasonable, we cannot guarantee future results, levels of activity, performance or achievements. We are
under no duty to update publicly any of the forward-looking statements after the date of this report, whether as a result of new
information, future events or otherwise.
4
PART I
Item 1. Business
Overview—MSA was founded in Pennsylvania in 1914. We are a global leader in the development, manufacture and
supply of safety products that protect people and facility infrastructures. Our safety products typically integrate a combination
of electronics, mechanical systems and advanced materials to protect users against hazardous or life threatening situations. Our
comprehensive line of safety products is used by workers around the world in a broad range of markets including the oil and
gas, fire service, construction and mining industries. We also sell products designed for specific industrial and military
applications. The company's core products include self-contained breathing apparatus ("SCBA"), fixed gas and flame detection
systems, portable gas detection instruments, industrial head protection, fire and rescue helmets, and fall protection devices.
We dedicate significant resources to research and development, which allows us to produce innovative safety products
that are often first to market and exceed industry standards. Our global product development teams include cross-geographic
and cross-functional members from various areas throughout the company, including research and development, marketing,
sales, operations and quality management. Our engineers and technical associates work closely with the safety industry’s
leading standards-setting groups and trade associations to develop industry specific product requirements and standards and to
anticipate their impact on our product lines.
Segments—We tailor our product offerings and distribution strategy to satisfy distinct customer preferences that vary
across geographic regions. To best serve these customer preferences, we have organized our business into seven geographic
operating segments that are aggregated into four reportable geographic segments: North America, Europe, International and
Corporate. Segment information is presented in the note entitled “Segment Information” in Item 8—Financial Statements and
Supplementary Data.
Because our financial statements are stated in U.S. dollars and much of our business is conducted outside the U.S.,
currency fluctuations may affect our results of operations and financial position and may affect the comparability of our results
between financial periods.
Products—We manufacture and sell a comprehensive line of safety products to protect the safety of workers and facility
infrastructures around the world in the oil and gas, fire service, construction, and mining industries. We also sell products
designed for specific industrial and military applications. Our products protect people against a wide variety of hazardous or
life-threatening situations.
The following is a brief description of each of our product categories:
Core products. MSA's corporate strategy includes a focus on driving sales of core products, which have leading market
positions and a competitive advantage. These products typically realize a higher gross profit margin than non-core products.
Core products, as mentioned above, include fixed gas and flame detection systems, breathing apparatus where SCBA is the
principal product, portable gas detection instruments, industrial head protection products, fire and rescue helmets and fall
protection devices. These products receive the highest levels of investment and resources as they typically realize a higher gross
profit margin and provide higher levels of return on investment than non-core products. Core products comprised
approximately 81% of sales in 2015 compared to 78% in 2014.
The following is a brief description of our core product offerings:
Fixed gas and flame detection instruments ("FGFD"). Our permanently installed fixed gas and flame detection instruments
are used in oil, gas and petrochemical facilities and general industrial production facilities to detect the presence or absence of
various gases in the air. Typical applications of these instruments include the detection of an oxygen deficiency in confined
spaces or the presence of combustible or toxic gases. FGFD product lines have a meaningful portion of overall revenue
generated from recurring business including replacement components and related service. A portion of business from this
product line is project oriented and more associated with upstream exploration and production activity. Our strongest sales of
these instruments have historically been in North America, Western Europe, Middle East and China. Key products include:
• Multi-point permanently installed gas detection systems. This product line is used to monitor for combustible and toxic
gases and oxygen deficiency in virtually any application where continuous monitoring is required. Our systems are
used for gas detection in petrochemical, pulp and paper, wastewater, refrigerant monitoring, and general industrial
applications. These systems utilize a wide array of sensing technologies including electrochemical, catalytic, infrared
and ultrasonic.

5
• Flame detectors and open-path infrared gas detectors. These instruments are used for plant-wide monitoring of toxic
gases and for detecting the presence of flames. These systems use infrared optics to detect potentially hazardous
conditions across long distances, making them suitable for use in such applications as offshore oil rigs, storage vessels,
refineries, pipelines and ventilation ducts. First used in the oil and gas industry, our systems now have broad
applications in petrochemical facilities, the transportation industry and in pharmaceutical production.
Breathing apparatus products. Breathing apparatus products include SCBA, face masks and respirators, where SCBA is
the primary product offering. SCBA are used by first responders, petrochemical plant workers and anyone entering an
environment deemed immediately dangerous to life and health. Our newest breathing apparatus product, the MSA G1 SCBA,
is an entirely redesigned platform that offers many customizable and differentiated features. We currently have 3 patents issued
and an additional 10 patents pending for this product. Our strongest sales of breathing apparatus products have historically been
in North America, across Western Europe and in China.
Portable gas detection instruments. Our hand-held portable gas detection instruments are used to detect the presence or
absence of various gases in the air. The product is used by oil, gas and petrochemical workers; general industry workers;
miners; first responders or anyone working in a confined space environment. Typical applications of these instruments include
the detection of an oxygen deficiency in confined spaces or the presence of combustible or toxic gases. Our single- and multi-
gas detectors provide portable solutions for detecting the presence of oxygen, combustible gases and various toxic gases,
including hydrogen sulfide, carbon monoxide, ammonia and chlorine, either singularly or up to six gases at once. Our ALTAIR®
2X Single or Two Gas Detectors; ALTAIR® 4X and ALTAIR
® 5X Multigas Detectors with XCell
® sensor technology, which
include internally developed sensors, provide faster response times and unsurpassed durability in a tough, easy-to-operate
package. The ALTAIR® 2XP provides users with unique and significant cost of ownership advantages over competitive
offerings by giving users the ability to perform their own daily bump test to make sure the instrument is functioning properly.
Our strongest sales of portable gas detection instruments have historically been in North America, across Western Europe and in
Latin America.
Head protection. We offer a complete line of industrial head protection that includes the iconic V-Gard® helmet brand, a
bellwether product in MSA's portfolio for over 50 years. We offer customers a wide range of color choices and we are a world
leader in the application of customized logos. Our industrial head protection has a wide user base including oil, gas and
petrochemical workers, steel and construction workers, miners and industrial workers. Our Fas-Trac® III Suspension system
was designed to provide comfort for the users of our helmets without sacrificing safety. Our strongest sales of head protection
products have historically been in North America and Brazil.
Fire and rescue helmets. We offer a complete line of fire helmets that includes our Cairns®
and Gallet® helmet brands.
Our Cairns helmets are primarily used by firefighters in North America while the Gallet helmets are used by firefighters across
our European and International segments. Rescue helmets including the F2 X-Trem Brand, are used by military and first
responders outside of North America. Our strongest sales of fire and rescue helmets have historically been in North America
and Western Europe.
Fall protection. Our broad line of fall protection equipment includes confined space equipment, harnesses, fall arrest
equipment, lanyards and lifelines. Fall protection equipment is used by workers in the construction industry, oil, gas and
petrochemical market, utilities industry and general industrial applications, and anyone working at height. Our strongest sales
of fall protection equipment have historically been in North America. In October 2015, MSA acquired UK-based Latchways
plc ("Latchways"). This acquisition - complementary from a product, geographic and end market standpoint - is expected to
double our fall protection revenue, positioning MSA as one of the largest fall protection providers globally.
Non-core products. MSA maintains a portfolio of non-core products which includes both adjacent and peripheral
offerings. Adjacent products reinforce and extend the core, drawing upon our customer relationships, distribution channels,
geographical presence and technical experience. These products are complimentary to the core offerings and have their roots
within the core product value chain. Key adjacent products include respirators, eye and face protection, thermal imaging
cameras, and gas masks. Gas masks and ballistic helmet sales are the primary purchases from our military customers and were
approximately $56 million globally in 2015. Peripheral products are primarily sold to the mining industry and reflect a small
portion of consolidated sales.
Customers—Our customers generally fall into three categories: distributors, industrial or military end-users, and retail
consumers. In North America, the majority of our sales are made through our distributors. In our European and International
segments, sales are made through both indirect and direct sales channels. For the year ended December 31, 2015, no individual
customer represented more than 10% of our sales.

6
Sales and Distribution—Our sales and distribution team consists of marketing, field sales and customer service
organizations. In most geographic areas, our field sales organizations work jointly with select distributors to call on end-users
and educate them about hazards, exposure limits, safety requirements and product applications, as well as the specific
performance attributes of our products. In our South Africa and Eastern Europe regions, where distributors are not as well
established, our sales associates often work with and sell directly to end-users. We believe that understanding end-user
requirements is critical to increasing MSA's market share.
The in-depth customer training and education provided by our sales associates to our customers is critical to ensuring
proper use of many of our products, such as SCBA and gas detection instruments. As a result of our sales associates working
closely with end-users, they gain valuable insight into customer preferences and needs. To better serve our customers and to
ensure that our sales associates are among the most knowledgeable and professional in the industry, we place significant
emphasis on training our sales associates in product application, industry standards and regulations.
We believe our sales and distribution strategy allows us to deliver a customer value proposition that differentiates our
products and services from those of our competitors, resulting in increased customer loyalty and demand.
In areas where we use indirect selling, we promote, distribute and service our products to general industry through
authorized national, regional and local distributors. Some of our key distributors include W.W. Grainger Inc., Airgas, Sonepar,
Bunzl and Fastenal. In North America, we distribute fire service products primarily through specially trained local and regional
distributors who provide advanced training and service capabilities to volunteer and paid municipal fire departments. In our
European and International segments, we primarily sell to and service the fire service market directly. Because of our broad and
diverse product line and our desire to reach as many markets and market segments as possible, we have over 4,000 authorized
distributor locations worldwide. No individual distributor accounts for more than 10% of our sales.
Competition— The global safety products market is broad and highly fragmented with few participants offering a
comprehensive line of safety products. The sophisticated safety products market in which we compete is comprised of both core
and non-core offerings - and is a subset of the larger personal protection equipment market, and generates estimated annual
sales of approximately $12 billion. We maintain leading positions in all of our core products. Over the long-term, we believe
global demand for safety products will continue to grow. Purchases of these products are non-discretionary, protecting workers'
health in hazardous and life-threatening work environments. Their use is often mandated by government and industry
regulations, which are increasingly enforced on a global basis.
The safety products market is highly competitive, with participants ranging in size from small companies focusing on a
single type of personal protection equipment to several large multinational corporations that manufacture and supply many
types of sophisticated safety products. Our main competitors vary by region and product. We believe that participants in this
industry compete primarily on the basis of product characteristics (such as functional performance, agency approvals, design
and style), brand name recognition, service support and price.
We believe we compete favorably within each of our operating segments as a result of our high quality, our innovative
offerings and strong brand trust and recognition.
Research and Development—To maintain our position at the forefront of safety equipment technology, we operate
several sophisticated research and development facilities. We believe our dedication and commitment to innovation and
research and development allows us to produce state-of-the-art safety products that are often first to market and exceed industry
standards. In 2015, 2014 and 2013, on a global basis, we spent $48.6 million, $48.2 million and $45.9 million, respectively, on
research and development, reflecting 4.3%, 4.3% and 4.1% of sales respectively. Our primary engineering groups are located in
the United States, Germany, China and France. Our global product development teams include cross-geographic and cross-
functional members from various areas throughout the company, including research and development, marketing, sales,
operations and quality management. These teams are responsible for setting product line strategy based on their understanding
of customers' needs and available technology, as well as the opportunities and challenges they foresee in each product area. We
believe our team-based, cross-geographic and cross-functional approach to new product development is a source of competitive
advantage. Our approach to the new product development process allows us to tailor our product offerings and product line
strategies to satisfy distinct customer preferences and industry regulations that vary across our operating segments.

7
We believe another important aspect of our approach to new product development is that our engineers and technical
associates work closely with the safety industry’s leading standards-setting groups and trade associations. These organizations
include the National Institute for Occupational Safety and Health ("NIOSH"), the National Fire Protection Association
("NFPA"), American National Standards Institute ("ANSI"), International Safety Equipment Association ("ISEA"), and their
overseas counterparts. We work with these organizations to develop industry specific product requirements and standards and
anticipate their impact on our product lines. Key members of our management team understand the impact that these standard-
setting organizations have on our new product development pipeline. As such, management devotes significant time and
attention to anticipating a new standard’s impact on our sales and operating results. Because of our understanding of customer
needs, membership on global standard-setting bodies, investment in research and development and our unique new product
development process, we believe we are well-positioned to anticipate and adapt to changing product standards. While we
acknowledge that the length of the approval process can be unpredictable, we also believe that we are well positioned to gain
the approvals and certifications necessary to meet new government and multinational product regulations.
Patents and Intellectual Property—We own significant intellectual property, including a number of domestic and foreign
patents, patent applications and trademarks related to our products, processes and business. Although our intellectual property
plays an important role in maintaining our competitive position in a number of markets that we serve, no single patent, or patent
application, trademark or license is, in our opinion, of such value to us that our business would be materially affected by the
expiration or termination thereof, other than the “MSA” trademark. Our patents expire at various times in the future not
exceeding 20 years. Our general policy is to apply for patents on an ongoing basis in the United States and other countries, as
appropriate, to perfect our patent development. In addition to our patents, we have also developed or acquired a substantial
body of manufacturing know-how that we believe provides a significant competitive advantage over our competitors.
Raw Materials and Suppliers—Many of the components of our products are formulated, machined, tooled or molded in-
house from raw materials, which comprise approximately two thirds of our cost of sales. For example, we rely on integrated
manufacturing capabilities for breathing apparatus, gas masks, ballistic helmets, hard hats and circuit boards. The primary raw
materials that we source from third parties include rubber, high density polyethylene, chemical filter media, eye and face
protective lenses, air cylinders, certain metals, electronic components and ballistic resistant and non-ballistic fabrics. We
purchase these materials both domestically and internationally, and we believe our supply sources are both well established and
reliable. We have close vendor relationship programs with the majority of our key raw material suppliers. Although we
generally do not have long-term supply contracts, thus far we have not experienced any significant problems in obtaining
adequate raw materials. Please refer to MSA's Form SD filed on May 29, 2015 for further information on our conflict minerals
analysis. Form SD may be obtained free of charge at www.sec.gov.
Associates—At December 31, 2015, we employed approximately 4,600 associates of which 2,300 were employed by our
European and International segments. None of our U.S. associates are subject to the provisions of a collective bargaining
agreement. Some of our associates outside the United States are members of unions. We have not experienced a significant
work stoppage in over 10 years and believe our relations with our associates are strong.
Environmental Matters— Our facilities and operations are subject to laws and regulations relating to environmental
protection and human health and safety. In the opinion of management, compliance with current environmental protection laws
will not have a material adverse effect on our financial condition. See Item 1A, Risk Factors, for further information regarding
our environmental risks which could impact the Company.
Seasonality— Our operating results are not significantly affected by seasonal factors. Sales are generally higher during
the second and fourth quarters. During periods of economic expansion or contraction and following significant catastrophes,
our sales by quarter have varied from this seasonal pattern. Government related sales tend to spike in the fourth quarter. North
America sales tend to be strong during the oil and gas market turnaround seasons late in the first quarter, early in the second
quarter and then again at the end of the third quarter and beginning of the fourth quarter. European sales are typically weaker in
the summer holiday months of July and August. International has recently had strong fourth quarters, but seasonality can be
strongly affected by the timing of delivery of larger orders. Invoicing and the delivery of larger orders can affect sales patterns
variably across all reporting segments. Additionally, strong shipments of the G1 SCBA in North America during all four
quarters in 2015 somewhat masked underlying seasonal trends.

8
Available Information—Our Internet address is www.MSAsafety.com. We make the following filings available free of
charge on the Investor Relations page on our website as soon as reasonably practicable after they have been electronically filed
with or furnished to the Securities and Exchange Commission ("SEC"): our annual reports on Form 10-K, our quarterly reports
on Form 10-Q, our current reports on Form 8-K and any amendments to those reports filed or furnished pursuant to
Section 13(a) or 15(d) of the Securities Exchange Act of 1934, as well as our proxy statement. Information contained on our
website is not part of this annual report on Form 10-K or our other filings with the Securities and Exchange Commission. The
SEC maintains an Internet site at www.sec.gov that contains reports, proxy and information statements and other information
regarding issuers like us who file electronically with the SEC. You also may read and copy any materials we file with the SEC
at the SEC’s Public Reference Room at 100 F Street, NE, Washington, DC 20549-0213. You may obtain information on the
operation of the Public Reference Room by calling the SEC at 1-800-SEC-0330.
Item 1A. Risk Factors
Unfavorable economic and market conditions could materially and adversely affect our business, results of operations
and financial condition.
We are subject to risks arising from adverse changes in global economic conditions. The global economy remains
unstable. For example, we are currently seeing a slowdown in China, recessionary conditions in Brazil and a slowdown in
certain regions that are dependent upon the mining of certain commodities. We expect economic conditions will continue to
be challenging and uneven for the foreseeable future. Adverse changes in economic conditions could result in declines in
revenue, profitability and cash flow due to reduced orders, payment delays, supply chain disruptions or other factors caused
by the economic challenges faced by our customers and suppliers.
A portion of MSA's sales are made to customers in the oil, gas and petrochemical market. These sales expose MSA to
the risks of doing business in that global market. We estimate that roughly 35% of our global business is sold into energy
market vertical. Approximately 10% - 15% of consolidated revenue, primarily in industrial head protection and portable gas
detection, is more exposed to a pull back in employment trends across the energy market. Another 5% - 10% of consolidated
revenue, primarily in the FGFD product line is more exposed to a pull back in capital equipment spending within the energy
market. It is possible that the volatility in upstream, midstream and downstream markets, driven partly by geopolitical
factors, could negatively impact our business and our results of operations and financial condition.
A reduction in the spending patterns of government agencies or delays in obtaining government approval for our
products could materially and adversely affect our net sales, earnings and cash flow.
The demand for our products sold to the fire service market, the homeland security market and other government
agencies is, in large part, driven by available government funding. Government budgets are set annually and we cannot assure
that government funding will be sustained at the same level in the future. A significant reduction in available government
funding could materially and adversely affect our net sales, earnings and cash flow.
Our ability to market and sell our products is subject to existing government regulations and standards. Changes in
such regulations and standards or our failure to comply with them could materially and adversely affect our results of
operations.
Most of our products are required to meet performance and test standards designed to protect the safety of people and
infrastructures around the world. Our inability to comply with these standards may materially and adversely affect our results
of operations. Changes in regulations could reduce the demand for our products or require us to re-engineer our products,
thereby creating opportunities for our competitors. Regulatory approvals for our products may be delayed or denied for a
variety of reasons that are outside of our control. Additionally, market anticipation of significant new standards can cause
customers to accelerate or delay buying decisions.
We are subject to various federal, state and local laws and any violation of these laws could adversely affect our
results of operations.
We are subject to extensive regulation from U.S. federal, state, and local governments, as well as the governments of
the countries in which we conduct business. Failure to comply with these regulations could result in severe civil or criminal
penalties, sanctions or significant changes to our operations. These actions could have a materially adverse effect on our
business, results of operations and financial condition.

9
We are subject to various environmental laws and any violation of these laws could adversely affect our results of
operations.
Included in the extensive laws, regulations and ordinances, to which we are subject, are those relating to the protection
of the environment. Examples include those governing discharges to air and water, handling and disposal practices for solid
and hazardous wastes and the maintenance of a safe workplace. These laws impose penalties for noncompliance and liability
for response costs and certain damages resulting from past and current spills, disposals, or other releases of hazardous
materials. We could incur substantial costs as a result of noncompliance with or liability for cleanup pursuant to these
environmental laws. Such laws continue to change, and we may be subject to more stringent environmental laws in the
future. If more stringent environmental laws are enacted, these future laws could have a materially adverse effect on our
results of operations.
The markets in which we compete are highly competitive, and some of our competitors have greater financial and
other resources than we do. The competitive pressures faced by us could materially and adversely affect our business,
results of operations and financial condition.
The safety products market is highly competitive, with participants ranging in size from small companies focusing on
single types of safety products, to large multinational corporations that manufacture and supply many types of safety
products. Our main competitors vary by region and product. We believe that participants in this industry compete primarily
on the basis of product characteristics (such as functional performance, agency approvals, design and style), price, brand
name trust and recognition and customer service. Some of our competitors have greater financial and other resources than we
do and our business could be adversely affected by competitors’ new product innovations, technological advances made to
competing products and pricing changes made by us in response to competition from existing or new competitors. We may
not be able to compete successfully against current and future competitors and the competitive pressures faced by us could
materially and adversely affect our business, results of operations and financial condition.
If we fail to introduce successful new products or extend our existing product lines, we may lose our market position
and our financial performance may be materially and adversely affected.
In the safety products market, there are frequent introductions of new products and product line extensions. If we are
unable to identify emerging consumer and technological trends, maintain and improve the competitiveness of our products
and introduce new products, we may lose our market position, which could have a materially adverse effect on our business,
financial condition and results of operations. We continue to invest significant resources in research and development and
market research. However, continued product development and marketing efforts are subject to the risks inherent in the
development process. These risks include delays, the failure of new products and product line extensions to achieve
anticipated levels of market acceptance and the risk of failed product introductions.
Product liability claims and our inability to collect related insurance receivables could have a materially adverse effect
on our business, operating results and financial condition.
MSA and its subsidiaries face an inherent business risk of exposure to product liability claims arising from the alleged
failure of our products to prevent the types of personal injury or death against which they are designed to protect. Although
we have not frequently experienced material uninsured losses due to product liability claims, it is possible that we could
experience material losses in the future. In the event any of our products prove to be defective, we could be required to recall
or redesign such products. In addition, we may voluntarily recall or redesign certain products that could potentially be
harmful to end users. Any claim or product recall that results in significant expense or adverse publicity against us, could
have a materially adverse effect on our business, operating results and financial condition, including any successful claim
brought against us in excess or outside of available insurance coverage.
In the normal course of business, we make payments to settle product liability claims and for related legal fees and we
record receivables for the amounts covered by insurance. Our insurance receivables totaled $229.5 million at December 31,
2015. Various factors could affect the timing and amount of recovery of insurance receivables, including: the outcome of
negotiations with insurers, legal proceedings with respect to product liability insurance coverage and the extent to which
insurers may become insolvent in the future. Amounts due from insurance carriers are subject to insolvency risk. Failure to
recover amounts due from our insurance carriers could have a materially adverse effect on our business, operating results and
financial condition. Mine Safety Appliances Company, LLC, ("MSA LLC") is currently involved in insurance coverage
litigation with a number of insurance carriers. When those matters are fully resolved, MSA LLC will be solely responsible for
expenses related to cumulative trauma product liability claims. Please refer to Note 19 in Part II Item 8 of this Form 10-K for
further details.

10
Damage to the reputation of MSA or to one or more of our product brands could adversely affect our business.
Developing and maintaining our reputation, as well as the reputation of our brands, is a critical factor in our relationship
with customers, distributors and others. Our inability to address adverse publicity or other issues, including concerns about
product safety or quality, real or perceived, could negatively impact our business which could have a materially adverse effect
on our business, operating results and financial condition.
A failure of our information systems could materially and adversely affect our business, results of operations and
financial condition.
The proper functioning and security of our information systems is critical to the operation of our business. Our
information systems may be vulnerable to damage or disruption from natural or man-made disasters, computer viruses, power
losses or other system or network failures. In addition, hackers and cybercriminals could attempt to gain unauthorized access
to our information systems with the intent of harming our company or obtaining sensitive information such as intellectual
property, trade secrets, financial and business development information, and customer and vendor related information. If our
information systems or security fail, our business, results of operations and financial condition could be materially and
adversely affected.
Like many companies, from time to time, we have experienced attacks on our computer systems by unauthorized
outside parties; however, we do not believe that such attacks have resulted in any material damage to us or our customers.
Because the techniques used by computer hackers and others to access or sabotage networks constantly evolve and generally
are not recognized until launched against a target, we may be unable to anticipate, prevent or detect these attacks. As a result,
our technologies and processes may be misappropriated and the impact of any future incident cannot be predicted. Any loss
of such information could harm our competitive position, or cause us to incur significant costs to remedy the damages caused
by the incident. We routinely implement improvements to our network security safeguards and we expect to devote
increasing resources to the security of our information technology systems. We cannot assure that such system improvements
will be sufficient to prevent or limit the damage from any future cyber-attack or network disruptions.
Our plans to continue to improve productivity and reduce complexity may not be successful, which could adversely
affect our ability to compete.
MSA has transitioned parts of its European business segment to a principal operating company ("European
reorganization"). A Principal Operating Company is an entity that conducts manufacturing and purchasing activities in
accordance with the laws and regulations of Switzerland. This principal operating company model integrates our historically
individually managed entities, into one that is a centrally managed organization. We have begun to and plan to continue to
leverage the benefits of scale created from this approach and are in the process of implementing a more efficient and cost-
effective enterprise resource planning system in additional locations across the European and International Segments. MSA
runs the risk that these and similar initiatives may not be completed substantially as planned, may be more costly to
implement than expected, or may not have the positive effects anticipated. In addition, these various initiatives require MSA
to implement a significant amount of organizational change which could divert management’s attention from other concerns,
and if not properly managed, could cause disruptions in our day-to-day operations and have a negative impact on MSA's
financial results. It is also possible that other major productivity and streamlining programs may be required in the future.
Our plans to improve future profitability through restructuring programs may not be successful and may lead to
unintended consequences.
MSA incurred a significant amount of restructuring expense during 2015, primarily related to headcount reduction.
These efforts should contribute to profitability in future periods. Our success will depend on our ability to maintain increased
productivity without backfilling certain positions.
We have significant international operations and are subject to the risks of doing business in foreign countries.
We have business operations in over 40 foreign countries. In 2015, approximately half of our net sales were made by
operations located outside the United States. Our international operations are subject to various political, economic and other
risks and uncertainties, which could adversely affect our business. These risks include the following:
• unexpected changes in regulatory requirements;
• changes in trade policy or tariff regulations;
• changes in tax laws and regulations;
• changes to the company's legal structure could have unintended tax consequences;

11
• inability to generate sufficient profit in certain foreign jurisdictions could lead to additional valuation allowances on
deferred tax assets;
• intellectual property protection difficulties;
• difficulty in collecting accounts receivable;
• complications in complying with a variety of foreign laws and regulations, some of which may conflict with U.S.
laws;
• trade protection measures and price controls;
• trade sanctions and embargoes;
• nationalization and expropriation;
• increased international instability or potential instability of foreign governments;
• effectiveness of worldwide compliance with MSA's anti-bribery policy, local laws and the Foreign Corrupt Practices
Act
• the ability to effectively negotiate with labor unions in foreign countries;
• the need to take extra security precautions for our international operations; and
• costs and difficulties in managing culturally and geographically diverse international operations.
Any one or more of these risks could have a negative impact on the success of our international operations and, thereby,
materially and adversely affect our business as a whole.
Our future results are subject to the risk that purchased components and materials are unavailable or available at
excessive cost due to material shortages, excessive demand, currency fluctuation and other factors.
We depend on various components and materials to manufacture our products. Although we have not experienced any
difficulty in obtaining components and materials, it is possible that any of our supplier relationships could be terminated or
otherwise disrupted. Any sustained interruption in our receipt of adequate supplies could have a materially adverse effect on
our business, results of operations and financial condition. We cannot assure you that we will be able to successfully manage
price fluctuations due to market demand, currency risks or material shortages, or that future price fluctuations will not have a
materially adverse effect on our business, results of operations and financial condition.
Because we derive a significant portion of our sales from the operations of our foreign subsidiaries, future currency
exchange rate fluctuations may adversely affect our results of operations and financial condition, and may affect the
comparability of our results between financial periods.
For the year ended December 31, 2015, the operations in our European and International segments accounted for
approximately 46% of our net sales. The results of our foreign operations are generally reported in the local currency and
then translated into U.S. dollars at the applicable exchange rates for inclusion in our consolidated financial statements. The
exchange rates between some of these currencies and the U.S. dollar have fluctuated significantly in recent years, and may
continue to do so in the future. In addition, because our financial statements are stated in U.S. dollars, such fluctuations may
affect our results of operations and financial position, and may affect the comparability of our results between financial
periods. We cannot assure you that we will be able to effectively manage our exchange rate risks or that any volatility in
currency exchange rates will not have a materially adverse effect on our results of operations and financial condition.
If we lose any of our key personnel or are unable to attract, train and retain qualified personnel, our ability to manage
our business and continue our growth would be negatively impacted.
Our success depends in large part on the continued contributions of our key management, engineering and sales and
marketing personnel, many of whom are highly skilled and would be difficult to replace. Our success also depends on the
abilities of new personnel to function effectively, both individually and as a group. If we are unable to attract, effectively
integrate and retain management, engineering or sales and marketing personnel, then the execution of our growth strategy and
our ability to react to changing market requirements may be impeded, and our business could suffer as a result. Competition
for personnel is intense, and we cannot assure you that we will be successful in attracting and retaining qualified personnel.
In addition, we do not currently maintain key person life insurance.
12
Our inability to successfully identify, consummate and integrate current and future acquisitions or to realize
anticipated cost savings and other benefits could adversely affect our business.
One of our operating strategies is to selectively pursue acquisitions. On October 21, 2015, MSA completed the
acquisition of Latchways - a leading global provider of innovative fall protection systems and solutions based in the United
Kingdom. Please refer to Note 13 in Part II Item 8 of this Form 10-K for further details. Any future acquisitions will depend
on our ability to identify suitable acquisition candidates and successfully consummate such acquisitions. Acquisitions involve
a number of risks including:
• failure of the acquired businesses to achieve the results we expect;
• diversion of our management’s attention from operational matters;
• our inability to retain key personnel of the acquired businesses;
• risks associated with unanticipated events or liabilities;
• potential disruption of our existing business; and
• customer dissatisfaction or performance problems at the acquired businesses.
If we are unable to integrate or successfully manage businesses that we have recently acquired including Latchways, or
may acquire in the future, we may not realize anticipated cost savings, improved manufacturing efficiencies and increased
revenue, which may result in materially adverse short- and long-term effects on our operating results, financial condition and
liquidity. Even if we are able to integrate the operations of our acquired businesses into our operations, we may not realize the
full benefits of the cost savings, revenue enhancements or other benefits that we may have expected at the time of acquisition.
In addition, even if we achieve the expected benefits, we may not be able to achieve them within the anticipated time frame,
and such benefits may be offset by costs incurred in integrating the acquired companies and increases in other expenses.
Our continued success depends on our ability to protect our intellectual property. If we are unable to protect our
intellectual property, our business could be materially and adversely affected.
Our success depends, in part, on our ability to obtain and enforce patents, maintain trade secret protection and operate
without infringing on the proprietary rights of third parties. We have been issued patents and have registered trademarks with
respect to many of our products, but our competitors could independently develop similar or superior products or
technologies, duplicate any of our designs, trademarks, processes or other intellectual property or design around any
processes or designs on which we have or may obtain patents or trademark protection. In addition, it is possible that third
parties may have, or will acquire, licenses for patents or trademarks that we may use or desire to use, so that we may need to
acquire licenses to, or to contest the validity of, such patents or trademarks of third parties. Such licenses may not be made
available to us on acceptable terms, if at all, and we may not prevail in contesting the validity of third party rights.
We also protect trade secrets, know-how and other confidential information against unauthorized use by others or
disclosure by persons who have access to them, such as our employees, through contractual arrangements. These agreements
may not provide meaningful protection for our trade secrets, know-how or other proprietary information in the event of any
unauthorized use, misappropriation or disclosure of such trade secrets, know-how or other proprietary information. If we are
unable to maintain the proprietary nature of our technologies, our results of operations and financial condition could be
materially and adversely affected.
The continued success of our next generation G1 SCBA is dependent on our ability to manufacture the product in line
with customer demand while controlling product cost.
The G1 SCBA has significant market potential; however, our success will depend upon our ability to maintain
increased production and execute key value based engineering efforts aimed at improving the cost profile of the product.
We may be required to recognize impairment charges for our long-lived assets or available for sale investments.
At December 31, 2015, the net carrying value of long-lived assets (property, plant and equipment, goodwill and other
intangible assets) totaled approximately $586.2 million. In accordance with generally accepted accounting principles, we
periodically assess these assets to determine if they are impaired. Significant negative industry or economic trends,
disruptions to our business, unexpected significant changes or planned changes in use of the assets and divestitures may
result in impairments to goodwill and other long-lived assets. Future impairment charges could significantly affect our results
of operations in the periods recognized. Impairment charges would also reduce our consolidated shareholders’ equity and
increase our debt-to-total-capitalization ratio, which could negatively impact our credit rating and access to debt and equity
markets.

13
Risks related to our defined benefit pension and other post-retirement plans may adversely impact our results of
operations and cash flow.
Significant changes in actual investment return on pension assets, discount rates, and other factors could adversely
affect our results of operations and pension contributions in future periods. U.S. generally accepted accounting principles
require that we calculate income or expense for the plans using actuarial valuations. These valuations reflect assumptions
about financial markets and interest rates, which may change based on economic conditions. Funding requirements for our
pension plans may become more significant. However, the ultimate amounts to be contributed are dependent upon, among
other things, interest rates, underlying asset returns and the impact of legislative or regulatory changes related to pension
funding obligations. For further information regarding our pension plans, refer to "Pensions and Other Post-retirement
Benefits" in Note 14 of Item 8 Financial Statements and Supplementary Data.
If we fail to meet our debt service requirements or the restrictive covenants in our debt agreements or if interest rates
increase, our results of operations and financial condition could be materially and adversely affected.
We have a substantial amount of debt upon which we are required to make scheduled interest and principal payments
and we may incur additional debt in the future. A significant portion of our debt bears interest at variable rates that may
increase in the future. Our debt agreements require us to comply with certain restrictive covenants. If we are unable to
generate sufficient cash to service our debt or if interest rates increase, our results of operations and financial condition could
be materially and adversely affected. Additionally, a failure to comply with the restrictive covenants contained in our debt
agreements could result in a default, which if not waived by our lenders, could substantially increase borrowing costs and
require accelerated repayment of our debt. Please refer to Note 11 of the Consolidated Financial Statements in Part II Item 8
of this Form 10-K for commentary on our compliance with the restrictive covenants in our debt agreements as of
December 31, 2015 as well as our drawing upon a Great British Pound denominated shelf facility in January 2016.
Item 1B. Unresolved Staff Comments
None.

14
Item 2. Properties
Our principal executive offices are located at 1000 Cranberry Woods Drive, Cranberry Township, PA 16066 in a 212,000
square-foot building owned by us. We own or lease our primary facilities in the United States and in a number of other
countries. We believe that all of our facilities, including the manufacturing facilities, are in good repair and in suitable condition
for the purposes for which they are used. The following table sets forth a list of our primary facilities:
Location Function Square Feet Owned
or Leased
North America
Murrysville, PA Manufacturing 295,000 Owned
Cranberry Twp., PA Office, Research and Development and Manufacturing 212,000
Owned
New Galilee, PA Distribution 120,000 Leased
Jacksonville, NC Manufacturing 107,000 Owned
Queretaro, Mexico Office, Manufacturing and Distribution 77,000 Leased
Cranberry Twp., PA Research and Development 68,000 Owned
Lake Forest, CA Office, Research and Development and Manufacturing 62,000 Leased
Corona, CA Manufacturing 19,000 Leased
Torreon, Mexico Office 15,000 Leased
Lake Forest, CA Office 6,000 Owned
Houston, TX Office and Distribution 9,000 Leased
Europe
Berlin, Germany Office, Research and Development, Manufacturing and Distribution 340,000
Leased
Chatillon sur Chalaronne, France
Office, Research and Development, Manufacturing and Distribution 94,000
Owned
Milan, Italy Office 43,000 Owned
Rapperswil, Switzerland Office 8,000 Leased
Glasgow, Scotland Office 7,000 Leased
Mohammedia, Morocco Manufacturing 24,000 Owned
Barcelona, Spain Office 23,000 Leased
Galway, Ireland Office and Manufacturing 20,000 Owned
Varnamo, Sweden Office, Manufacturing and Distribution 18,000 Leased
Hoorn, Netherlands Office and Distribution 10,000 Leased
Rajarhat, India Office and Distribution 10,000 Leased
Warsaw, Poland Office and Distribution 18,000 Leased
Devizes, UK Office, Manufacturing and Distribution 115,000 Owned
Kozina, Slovenia Office and Manufacturing 17,000 Leased
International
Suzhou, China Office and Manufacturing 193,000 Owned
Sydney, Australia Office, Manufacturing 18,000 Leased
Sao Paulo, Brazil Office, Manufacturing and Distribution 74,000 Owned
Johannesburg, South Africa Office, Manufacturing and Distribution 35,000 Leased
Lima, Peru Office and Distribution 34,000 Owned
Santiago, Chile Office and Distribution 32,000 Leased
Buenos Aires, Argentina Office and Distribution 9,000 Owned

15
Item 3. Legal Proceedings
Please refer to Note 19 to the Consolidated Financial Statements in Part II Item 8 of this Form 10-K.
Item 4. Mine Safety Disclosures
Not applicable.
Executive Officers of the Registrant
The following sets forth the names and ages of our executive officers as of February 29, 2016, indicating all positions held
during the past five years:
Name Age Title
William M. Lambert(a)
57 Chairman, President and Chief Executive Officer since May 2015.
Joakim Birgersson(b)
51 Vice President and General Manager, Europe since August 2015
Steven C. Blanco(c)
49 Vice President, General Manager Northern North America since May 2015.
Kerry M. Bove(d)
57 Senior Vice President and Chief Strategy Officer since May 2015.
Ronald N. Herring, Jr.(e)
55 Senior Vice President and President, MSA Europe and International Segments since May 2015.
Kenneth D. Krause (f)
40 Vice President, Chief Financial Officer and Treasurer since December 2015.
Douglas K. McClaine 58 Vice President, Secretary and General Counsel since May 2005.
Thomas Muschter(g)
55 Vice President, Global Product Leadership since November 2011.
Paul R. Uhler 57 Vice President, Global Human Resources since May 2006.
Nishan Vartanian(h)
56 Senior Vice President and President, MSA Americas Segment since May 2015.
Markus H. Weber(i)
51 Vice President and Chief Information Officer since April 2010.
(a) Prior to his present position, Mr. Lambert was President and Chief Executive Officer.
(b) Prior to his present position, Mr. Birgersson served as Project Director of Europe 2.0x.
(c) Prior to his present position, Mr. Blanco served as Vice President of Global Operational Excellence.
(d) Prior to his present position, Mr. Bove was Vice President and President MSA International Segment. Mr. Bove also
served as Acting Chief Financial Officer from September to December 2015.
(e) Prior to his present position, Mr. Herring was Vice President and President MSA Europe Segment.
(f) Prior to his present position, Mr. Krause was Vice President, Strategic Finance and Treasurer.
(g) Prior to his present position, Dr. Muschter held the positions of Director, Research & Development, International; and
Director, Research & Development, Europe.
(h) Prior to his present position, Mr. Vartanian was Vice President and President, MSA North America.
(i) Prior to joining MSA, Mr. Weber served as Chief Information Officer of Berlin-Chemie AG, an international research-
based pharmaceutical company.

16
PART II
Item 5. Market for the Registrant’s Common Equity, Related Stockholder Matters and Issuer Purchases of Equity
Securities
Our common stock is traded on the New York Stock Exchange under the symbol “MSA.” Stock price ranges and
dividends declared were as follows:
Price Range of Our
Common Stock
Dividends High Low
Year ended December 31, 2014
First Quarter $ 57.94 $ 46.50 $ 0.30
Second Quarter 58.90 49.85 0.31
Third Quarter 61.08 49.37 0.31
Fourth Quarter 58.99 46.25 0.31
Year ended December 31, 2015
First Quarter $ 53.64 $ 43.12 $ 0.31
Second Quarter 52.59 43.43 0.32
Third Quarter 54.54 38.32 0.32
Fourth Quarter 47.46 39.17 0.32
On February 16, 2016, there were 427 registered holders of our shares of common stock.
Issuer Purchases of Equity Securities
Period Total Number of
Shares Purchased Average Price Paid
Per Share
Total Number of Shares Purchased as Part of Publicly
Announced Plans or Programs
Maximum Number of Shares that May Yet Be Purchased
Under the Plans or Programs
October 1 — October 31, 2015 180 $ 43.48 — 2,136,533
November 1 — November 30, 2015 4,778 44.96 — 1,980,734
December 1 — December 31, 2015 — — — 2,137,024
On May 12, 2015, The Board of Directors adopted a new stock repurchase program to replace the existing program. The
new program authorizes up to $100.0 million in repurchases of MSA common stock in the open market and in private
transactions. The share purchase program has no expiration date. The maximum shares that may be purchased is calculated
based on the dollars remaining under the program and the respective month-end closing share price.
The above share purchases are related to stock compensation transactions.
We do not have any other share purchase programs.

17
Comparison of Five-Year Cumulative Total Return
The following paragraph compares the most recent five year performance of MSA stock with (1) the Standard & Poor’s
500 Composite Index and (2) the Russell 2000 Index. Because our competitors are principally privately held concerns or
subsidiaries or divisions of corporations engaged in multiple lines of business, we do not believe it feasible to construct a peer
group comparison on an industry or line-of-business basis. The Russell 2000 Index, while including corporations both larger
and smaller than MSA in terms of market capitalization, is composed of corporations with an average market capitalization
similar to us.
COMPARISON OF 5 YEAR CUMULATIVE TOTAL RETURN
Among MSA Safety Incorporated, the S&P 500 Index,
and the Russell 2000 Index
Assumes $100 invested on 12/31/10 in stock or index, including reinvestment of dividends. Fiscal year ending December 31.
Value at December 31,
2010 2011 2012 2013 2014 2015
MSA Safety Incorporated $ 100.00 $ 109.73 $ 146.79 $ 180.28 $ 191.17 $ 160.88
S&P 500 Index 100.00 102.11 118.45 156.82 178.28 180.75
Russell 2000 Index 100.00 95.82 111.49 154.78 162.35 155.18
Prepared by Zacks Investment Research, Inc. Used with permission. All rights reserved. Copyright 1980-2016.
Index Data: Copyright Standard and Poor’s, Inc. Used with permission. All rights reserved.
Index Data: Copyright Russell Investments, Inc. Used with permission. All rights reserved.

18
Item 6. Selected Financial Data
(In thousands, except as noted) 2015 2014 2013 2012 2011
Statement of Income Data:
Net sales $ 1,130,783 $ 1,133,885 $ 1,112,058 $ 1,110,443 $ 1,112,814
Income from continuing operations 69,590 87,447 85,858 87,557 67,518
Income from discontinued operations 1,217 1,059 2,389 3,080 2,334
Net income 70,807 88,506 88,247 90,637 69,852
Earnings per share attributable to MSA common shareholders:
Basic per common share (in dollars):
Income from continuing operations $ 1.86 $ 2.34 $ 2.31 $ 2.37 $ 1.85
Income from discontinued operations 0.03 0.03 0.06 0.08 0.06
Net income 1.89 2.37 2.37 2.45 1.91
Diluted per common share (in dollars):
Income from continuing operations $ 1.84 $ 2.30 $ 2.28 $ 2.34 $ 1.81
Income from discontinued operations 0.03 0.03 0.06 0.08 0.06
Net income 1.87 2.33 2.34 2.42 1.87
Dividends paid per common share (in dollars) 1.27 1.23 1.18 1.38 1.03
Weighted average common shares outstanding—basic 37,293 37,138 36,868 36,564 36,221
Weighted average common shares outstanding—diluted 37,710 37,728 37,450 37,042 36,831
Balance Sheet Data:
Total assets $ 1,424,818 $ 1,264,792 $ 1,234,270 $ 1,111,746 $ 1,115,052
Long-term debt 459,959 245,000 260,667 272,333 334,046
Shareholders’ equity 516,496 533,809 566,452 462,955 433,666
The data presented in the Selected Financial Data table should be read in conjunction with comments provided in
Management's Discussion and Analysis of Financial Condition and Results of Operations in Part II Item 7 and the Consolidated
Financial Statements in Part II Item 8 of this Form 10-K. The 2015 data includes Latchways from the date of acquisition on
October 21, 2015.

19
Item 7. Management’s Discussion and Analysis of Financial Condition and Results of Operations
The following discussion and analysis should be read in conjunction with the historical financial statements and other
financial information included elsewhere in this annual report on Form 10-K. This discussion may contain forward-looking
statements that involve risks and uncertainties. The forward-looking statements are not historical facts, but rather are based on
current expectations, estimates, assumptions and projections about our industry, business and future financial results. Our
actual results could differ materially from the results contemplated by these forward-looking statements due to a number of
factors, including those discussed in the sections of this annual report entitled “Forward-Looking Statements” and “Risk
Factors.”
On March 7, 2014, Mine Safety Appliances Company, a Pennsylvania corporation (“Old MSA”), completed a previously
disclosed reorganization into a holding company structure (the “Reorganization”) in accordance with Section 1924(b)(4) of the
Pennsylvania Business Corporation Law of 1988 (the “PBCL”). As a result of the Reorganization, Old MSA became a wholly-
owned subsidiary of MSA Safety Incorporated (“New MSA”), a Pennsylvania corporation and previously a direct wholly-
owned subsidiary of Old MSA. New MSA became the publicly traded holding company of Old MSA and its subsidiaries. New
MSA and its subsidiaries continue to conduct the business and operations that Old MSA and its subsidiaries conducted
immediately prior to the Reorganization.
MSA's South African personal protective equipment distribution business and MSA's Zambian operations had historically
been part of the International reportable segment. In accordance with generally accepted accounting principles, these results
are excluded from continuing operations and are presented as discontinued operations in all periods presented. Please refer to
Note 20 Discontinued Operations, which is included in Part II Item 8 of this Form 10-K, for further commentary on these
discontinued operations.
Sales from MSA's General Monitors companies were historically reported in the country from which product was shipped.
Effective January 1, 2014, the General Monitors business has been fully integrated into MSA. As such, sales made by General
Monitors companies are now allocated to each country based on the destination of the end-customer and other criteria based
on the value added to the order. The 2013 results presented below have been restated to reflect this change in allocation
methodology. Please refer to Note 7 Segment Information, which is included in Part II Item 8 of this Form 10-K, for further
information.
Certain centrally managed expenses were historically allocated and reported in the North America, Europe and
International Segments as well as in the reconciling items column contained in our segment disclosure. Effective January 1,
2015, interest expense, foreign exchange (gain) loss and an allocation of SG&A expenses are now contained in the Corporate
segment. Additionally, effective January 1, 2015, we changed the allocation methodology applied to Research and Development
expense. The 2014 and 2013 results presented below have been recast to reflect the above noted changes. Please refer to Note 7
Segment Information, for further information.
On October 21, 2015, the Company acquired 100% of the common stock of Latchways plc ("Latchways") for $190.9 million
in cash. Latchways, which is headquartered in the United Kingdom, is a leading provider of innovative fall protection systems
and solutions. The acquisition of Latchways represents a key step in the execution of our corporate strategy by expanding our
investment in one of the largest and fastest growing product segments of the global safety market. This acquisition will double
our fall protection business, positioning MSA as one of the largest fall protection providers globally. Within the fall protection
space, the Latchways acquisition strengthens our position in permanent engineered systems and our presence in other sectors
such as utilities, telecommunications, and aircraft maintenance. The data presented in Part II Item 6 of this Form 10-K should
be read in conjunction with the following comments. Additionally, please refer to Note 13 Acquisitions, which is included in
Part II Item 8 of this Form 10-K, for further information.

20
BUSINESS OVERVIEW
We are a global leader in the development, manufacture and supply of products that protect people’s and safety. Our
safety products typically integrate any combination of electronics, mechanical systems and advanced materials to protect users
against hazardous or life threatening situations. Our comprehensive lines of safety products are used by workers around the
world in a broad range of markets including the oil and gas, fire service, mining and construction industries, as well as the
military. We are committed to providing our customers with service unmatched in the safety industry and, in the process,
enhancing our ability to provide a growing line of safety solutions for customers in key global markets.
We tailor our product offerings and distribution strategy to satisfy distinct customer preferences that vary across
geographic regions. To best serve these customer preferences, we have organized our business into seven geographical
operating segments that are aggregated into four reportable geographic segments: North America, Europe, International and
Corporate. Each segment includes a number of operating segments. In 2015, 54%, 26% and 20% of our net sales were made by
our North American, European and International segments, respectively.
North America. Our largest manufacturing and research and development facilities are located in the United States. We
serve our North American markets with sales and distribution functions in the U.S., Canada and Mexico.
Europe. Our European segment includes companies in most Western European countries, and a number of Eastern
European countries along with locations in the Middle East and Russia. In our largest European companies, Germany and
France, we develop, manufacture and sell a wide variety of products. The technology associated with the development of our
products in these countries is owned by our European Principal Operating company which is located in Rapperswil-Jona,
Switzerland. Operations in other European segment countries focus primarily on sales and distribution in their respective home
country markets. While some of these companies may perform limited production, most of their sales are of products that are
manufactured in our plants in Germany, France, the U.S., the U.K., Ireland, Sweden and China, or are purchased from third
party vendors.
International. Our International segment includes companies in South America, Africa and the Asia Pacific region, some
of which are in developing regions of the world. Principal International segment manufacturing operations are located in Brazil
and China. These companies manufacture products that are sold primarily in each company’s home country as well as regional
markets. The other companies in the International segment focus primarily on sales and distribution in their respective home
country markets. While some of these companies may perform limited production, most of their sales are of products that are
manufactured in our plants in China, Germany, France and the U.S., or are purchased from third party vendors.
Corporate. The corporate segment primarily consists of general and administrative expenses incurred in our corporate
headquarters, costs associated with corporate development initiatives, legal expense, interest expense, foreign exchange gains
or losses, and other centrally-managed costs. Corporate general and administrative costs comprise the majority of the expense
in the corporate segment. Corporate general and administrative costs were $38.5 million during the year ended December 31,
2015, which included $7.5 million of transaction and integration costs related to the Latchways acquisition. During the year
ended December 31, 2014, corporate general and administrative costs were $35.0 million.
RESULTS OF OPERATIONS
Year Ended December 31, 2015 Compared to Year Ended December 31, 2014
Net Sales from continuing operations. Net sales for the year ended December 31, 2015 were $1,130.8 million, a
decrease of $3.1 million, from $1,133.9 million for the year ended December 31, 2014.
The unfavorable translation effects of weaker foreign currencies decreased net sales, when stated in U.S. dollars, by 8%.
Excluding the impact of weakening foreign currencies, net sales increased 8% over the prior year period, of which 1% is
attributable to our recent acquisition of Latchways. While we cannot quantify the amount, we expect foreign currency
fluctuations to continue to have an effect on results in 2016 as a result of a strong U.S. dollar.
Net Sales from Continuing Operations 2015 vs. 2014 2014 vs. 2013
Organic growth 7 % 4 %
Acquisitions, divestitures, & other, net 1 % — %
Foreign exchange impact (8 )% (2 )%
Total % Year-Over-Year Change — % 2 %

21
For the year ended December 31, 2015, local currency core product sales increased by 11%, comprising 81% of our total
business. Local currency non-core sales decreased 4%. By product group, core product group sales year-over-year growth was
as follows on a local currency basis:
Percent Increase
(Decrease)
Percent Increase
(Decrease)
Core Sales 2015 2014
Breathing Apparatus 52 % (7 )%
Fall Protection 22 % 5 %
Fire & Rescue Helmets 9 % 4 %
Fixed Gas & Flame Detection (2 )% 10 %
Portable Gas Detection (7 )% 9 %
Head Protection (9 )% 5 %
Total 11 % 4 %
Net Sales (Dollars in millions) 2015 2014
Dollar Increase
(Decrease)
Percent Increase
(Decrease)
North America $ 609.0 $ 547.7 $ 61.3 11 %
Europe 293.2 321.6 (28.4 ) (9 )%
International 228.6 264.5 (35.9 ) (14 )%
Total 1,130.8 1,133.9 (3.1 ) — %
Net sales in the North American segment were $609.0 million for the year ended December 31, 2015, an increase of
$61.3 million, or 11%, compared to $547.7 million for the year ended December 31, 2014. Strong G1 self-contained breathing
apparatus sales throughout the year drove growth in breathing apparatus, up 113% during the period. Strength in fire service
was partially offset by decreased demand in the gas, petroleum, & chemical markets, reflecting decreased shipments of portable
gas detection, industrial head protection, and fixed gas and flame detection, down 16%, 11%, and 6%, respectively.
Net sales for the European segment were $293.2 million for the year ended December 31, 2015, a decrease of $28.4
million, or 9%, compared to $321.6 million for the year ended December 31, 2014. Currency translation effects decreased
European segment sales in the current year, when stated in U.S. dollars, by 16%. Local currency sales in Europe increased 7%,
of which 3% growth is attributable to the Latchways acquisition. The remaining increase reflects strong growth across several
geographies in the segment. In Western Europe, shipments of military helmets in France and fire helmets in Northern and
Central Europe were up 14% and 4% in the segment, respectively. Across Emerging European markets, most notably the
Middle East, shipments of industrial head protection, portable gas detection, and fixed gas and flame detection were up 21%,
5% and 3% in the segment, respectively.
Net sales for the International segment were $228.6 million for the year ended December 31, 2015, a decrease of $35.9
million, or 14%, compared to $264.5 million for the year ended December 31, 2014. Currency translation effects decreased
International segment sales, when stated in U.S. dollars, by 13%, reflecting weakened currencies across several International
geographies, notably in Brazil and Australia. Local currency sales in the International segment decreased 1% when compared to
the same period in 2014, reflecting lower demand in energy and commodities sectors as well as challenging economic
conditions in key emerging markets like Brazil and China. The decrease in sales reflects a lower level of non-core and
industrial head protection shipments, down 13% and 11%, respectively, partially offset by higher sales of fire & rescue helmets,
breathing apparatus, portable gas detection instruments, and fixed gas and flame detection, up 29%, 11%, 6%, and 4%,
respectively.
Other (loss) income. Other loss for the year ended December 31, 2015 was $0.9 million compared to income of $2.8
million for the year ended December 31, 2014. In 2015, other loss of $0.9 million was driven by losses associated with the
disposal of net assets related to the Safety Works business in our North American Segment. These losses were partially offset
by gains from the disposal of assets in Australia. In 2014, income of $2.8 million was primarily driven by a $2.2 million gain
from the sale of detector tube assets in the European segment. Refer to Note 15 of the Consolidated Financial Statements in
Part II Item 8 of this Form 10-K for more information.

22
Gross profit. Gross profit for the year ended December 31, 2015 was $501.1 million, a decrease of $14.2 million, or 3%,
from $515.3 million for the year ended December 31, 2014. The ratio of gross profit to net sales was 44.3% for 2015 compared
to 45.4% in 2014, reflecting lower gross profit in our North American and International segments. The lower gross profit ratio
in 2015 was primarily related to a less favorable product mix, increased indirect costs, and increased amortization related to the
Latchways acquisition.
Selling, general and administrative expenses. Selling, general and administrative expenses for the year ended
December 31, 2015 were $315.3 million, a decrease of $7.5 million, or 2%, from $322.8 million for the year ended
December 31, 2014. Currency translation effects decreased selling, general and administrative expenses for the year ended
December 31, 2015, when stated in U.S. dollars, by 8%. The decrease reflects weakening currencies across several geographies,
notably a weaker Euro, Brazilian real, and Australian dollar. Selling, general and administrative expenses were 27.9% of net
sales in 2015 compared to 28.5% of net sales in 2014. Local currency selling, general and administrative expenses increased
6% in the current period, primarily reflecting Latchways acquisition related costs of $7.5 million and Latchways operating
SG&A costs of $3.2 million. Excluding Latchways acquisition related costs, local currency selling, general, and administrative
expenses increased 4%.
Research and development expenses. Research and development expenses were $48.6 million for the year ended
December 31, 2015, an increase of $0.4 million, or 1%, from $48.2 million for the year ended December 31, 2014. Currency
translation effects decreased research and development expense for the year ended December 31, 2015, when stated in U.S.
dollars, by 5%. Research and development expenses were 4.3% of net sales in both 2015 and 2014, which is in line with our
target ratio of 4.0% - 4.5% of net sales. Local currency research and development spending increased 6%, reflecting our focus
on the development of new and innovative technologies for the G1 platform and other core products. Our past R&D
investments have yielded solid returns, with sales from products developed and launched over the past five years reflecting
38% of total sales.
Restructuring and other charges. For the year ended December 31, 2015, we recorded charges of $12.3 million, an
increase of $3.8 million, or 45%, compared to charges of $8.5 million for the year ended December 31, 2014. At December 31,
2015, the Company had accrued restructuring costs of $8.1 million, primarily related to severance costs associated with our
global cost reduction program. The majority of this accrual at December 31, 2015 is expected to be paid out in 2016. The global
cost reduction program is expected to save an estimated $10.0 million in future operating costs for 2016, primarily impacting
selling, general, and administrative expense and, to a lesser extent, cost of goods sold. While the Company made significant
progress in optimizing its cost structure at the end of 2015, the Company is actively evaluating additional cost reduction
opportunities in 2016. Refer to Note 2 Restructuring and Other Charges of the Consolidated Financial Statements in Part II Item
8 of this Form 10-K for more information.
For the year ended December 31, 2014, the Company recorded charges of $8.5 million. European segment charges of $4.8
million related primarily to severance from staff reductions in Central and Southern Europe as well as reorganization costs in
Central Europe. International segment charges of $3.7 million primarily related to staff reductions in South Africa, Australia,
and Brazil as well as asset disposals in Australia and South Africa, as the Company continued to reduce its footprint and to
optimize its cost structure in response to challenging economic conditions in certain markets.
Interest expense. Interest expense for the year ended December 31, 2015 was $10.9 million, an increase of $1.0 million,
or 10%, from $9.9 million for the year ended December 31, 2014. The increase in interest expense reflects increased borrowing
levels in the current year associated with the Latchways acquisition.
Currency exchange. Currency exchange losses were $2.2 million during the year ended December 31, 2015, compared to
losses of $1.5 million during the same period in 2014. Currency exchange losses in both periods were mostly unrealized and
relate primarily to the effect of the strengthening U.S. dollar on intercompany balances.
Income tax provision. Our effective tax rate from continuing operations for the year ended December 31, 2015 was
40.0% compared to 32.3% for the year ended December 31, 2014. Excluding $7.7 million of charges associated with exit taxes
related to our European reorganization, the effective tax rate for the year was 33.1% and 32.3% for the same period last year.
The effective tax rate increase was primarily due to non-deductible losses in certain foreign jurisdictions.
MSA continues to move affiliates onto the Principal Operating Company model as part of the European reorganization.
The reorganization is designed to drive optimal performance by aligning certain strategic planning and decision making into a
single location enabled by a common IT platform. In January, the Company successfully integrated four more affiliates onto the
model, and we anticipate incurring additional exit taxes in the range of $3 - 5 million in 2016.

23
Net income from continuing operations. Net income from continuing operations for the year ended December 31, 2015
was $69.6 million, a decrease of $17.8 million, or 20%, from net income from continuing operations for the year ended
December 31, 2014 of $87.4 million. Currency translation effects decreased current period net income when stated in U.S.
dollars, by 2%. Local currency net income decreased 18%. Basic earnings per share from continuing operations was $1.86 in
2015 compared to $2.34 in 2014, a decrease of 48 cents per share, or 21%.
North American segment net income for the year ended December 31, 2015 was $87.1 million, an increase of $9.4
million, or 12%, from $77.7 million for the year ended December 31, 2014. The increase in North American segment net
income reflects higher sales, notably in the fire sector, and controlled selling, general, and administrative spending.
European segment net income for the year ended December 31, 2015 was $6.8 million, a decrease of $16.0 million, or
70%, from $22.8 million for the year ended December 31, 2014. Currency translation effects decreased European segment net
income in the current year, when stated in U.S. dollars, by 1%. Local currency net income decreased 69%, reflecting higher exit
taxes earlier in the year associated with the Europe 2.0 program. Excluding exit taxes, local currency pre-tax income was 23%
below the prior year period on higher selling, general, and administrative expense due to the Latchways integration, higher
pension costs, increased customer facing costs, and costs incurred as we continued to transition parts of the European business
to the principal operating model.
International segment net income for the year ended December 31, 2015 was $10.1 million, a decrease of $6.9 million, or
41%, from $17.0 million for the year ended December 31, 2014. Currency translation effects increased current period
International segment net income, when stated in U.S. dollars, by 5%. Local currency net income declined 45%, primarily
related to a lower level of sales, notably in Brazil. The decrease also reflects higher restructuring costs associated with our
global cost reduction program, higher customer facing costs, and higher inventory costs.
Corporate segment net loss for the year ended December 31, 2015 was $33.2 million, an increase of $2.9 million, or 10%,
from $30.3 million for the year ended December 31, 2014. The higher loss during the year ended December 31, 2015 reflects
higher corporate development costs associated with the acquisition and integration of Latchways as well as one-time
restructuring costs associated with our global cost reduction efforts.
Year Ended December 31, 2014 Compared to Year Ended December 31, 2013
Net sales from continuing operations. Net sales for the year ended December 31, 2014 were $1,133.9 million, an
increase of $21.8 million, or 2%, from $1,112.1 million for the year ended December 31, 2013.
The unfavorable translation effects of weaker foreign currencies decreased net sales, when stated in U.S. dollars, by 2%.
Excluding the impact of weakening foreign currencies, net sales increased 4%.
Net Sales from Continuing Operations 2014 vs. 2013 2013 vs. 2012
Organic growth 4 % 2 %
Acquisitions, divestitures, & other, net — % (1 )%
Foreign exchange impact (2 )% (1 )%
Total % Year-Over-Year Change 2 % — %

24
For the year ended December 31, 2014, local currency core product sales increased by 4%, comprising 79% of our
total business. Local currency non-core sales increased 5%, primarily on higher helmet sales to the fire and military markets in
Europe. By product group, core product group sales year-over-year growth was as follows on a local currency basis:
Percent Increase
(Decrease)
Percent Increase
(Decrease)
Core Sales 2014 2013
Fixed Gas & Flame Detection 10 % 6 %
Portable Gas Detection 9 % 11 %
Fall Protection 5 % 6 %
Head Protection 5 % 3 %
Fire & Rescue Helmets 4 % 9 %
Breathing Apparatus (7 )% 4 %
Total 4 % 6 %
Net Sales (Dollars in millions) 2014 2013
Dollar Increase
(Decrease)
Percent Increase
(Decrease)
North America $ 547.7 $ 533.2 $ 14.5 3 %
Europe 321.6 293.1 28.5 10 %
International 264.5 285.8 (21.3 ) (7 )%
Total 1,133.9 1,112.1 21.8 2 %
Net sales by the North American segment were $547.7 million for the year ended December 31, 2014, an increase of
$14.5 million, or 3%, compared to $533.2 million for the year ended December 31, 2013. Leading growth were shipments of
FGFD, head protection, and portable gas instruments, up 11%, 10%, and 7%, respectively. These increases were partially offset
by an 11% decrease in shipments of breathing apparatus to the fire segment, reflecting delays in securing product approvals of
the Company's G1 SCBA platform and other small decreases across a broad range of product lines. The Company began
shipping its G1 SCBA after receiving certification in late November, though these shipments were not overly material to results
in 2014.
Net sales for the European segment were $321.6 million for the year ended December 31, 2014, an increase of $28.5
million, or 10%, from $293.1 million for the year ended December 31, 2013. Local currency sales in Europe increased 10% on
increased shipments of ballistic helmets, up 95% on higher sales to military markets in Southern Europe, increased shipments
of FGFD, up 16%, primarily on strength in the Middle East, and higher sales of breathing apparatus, up 5% on increased
demand across the segment.
Net sales of our International segment were $264.5 million for the year ended December 31, 2014, a decrease of $21.3
million, or 7%, compared to $285.8 million for the year ended December 31, 2013. Currency translation effects decreased
International segment sales, when stated in U.S. dollars, by 6%, reflecting weakening currencies across several International
geographies, notably in Brazil, Argentina, Chile, and Australia. Local currency sales in the International segment decreased 1%
on a lower level of breathing apparatus, FGFD, and head protection shipments, down 17%, 7%, and 4%, respectively, in the
segment. These decreases, primarily in our Latin America, and Australia region, were partially offset by higher sales in portable
gas detection instruments throughout Asia, Australia, and Latin America, up 21% in the segment, as well as higher large
shipments of fire helmets in Asia, driving a 24% increase.
Other income (loss). Other income for the year ended December 31, 2014 was $2.8 million, primarily related to a $2.2
million gain from the sale of detector tube assets in the European segment. The 2014 income compares with a loss of $0.2
million for the year ended December 31, 2013. In 2013, a $1.6 million land impairment loss in the North American segment
was partially offset by interest income of $1.1 million and small gains from asset dispositions.
Gross profit. Gross profit for the year ended December 31, 2014 was $515.3 million, an increase of $18.5 million, or 4%,
from $496.8 million for the year ended December 31, 2013. The ratio of gross profit to net sales was 45.4% for 2014 compared
to 44.7% in 2013, reflecting higher gross profit in our North American and European segment. The higher gross profit ratio in
2014 was primarily related to the Company's ongoing focus of developing and introducing new products, pricing the MSA
brand more effectively, lowering manufacturing costs and a more favorable sales mix weighted toward gas detection products.

25
Selling, general and administrative expenses. Selling, general and administrative expenses for the year ended
December 31, 2014 were $322.8 million, an increase of $13.6 million, or 4%, from $309.2 million for the year ended
December 31, 2013. Currency translation effects decreased selling, general and administrative expenses, when stated in U.S.
dollars, by 2%. The decrease reflects weakening currencies across several geographies in the International segment, notably a
weaker Brazilian real, Argentine peso, and Australian dollar. Selling, general and administrative expenses were 28.5% of net
sales in 2014 compared to 27.8% of net sales in 2013. Local currency selling, general and administrative expenses increased
6% in the current period, primarily reflecting the impact of corporate strategic initiatives and executing our Europe 2.0
program, and higher charges related to the self-insured portion of the Company's recent product liability settlements.
Research and development expenses. Research and development expenses were $48.2 million for the year ended
December 31, 2014, an increase of $2.3 million, or 5%, from $45.9 million for the year ended December 31, 2013. The increase
reflected our focus on developing innovative new products, including the G1 SCBA, a revolutionary new product designed side
by side with firefighters.
Restructuring and other charges. For the year ended December 31, 2014, we recorded charges of $8.5 million compared
to charges of $5.3 million for the year ended December 31, 2013. European segment charges of $4.8 million related primarily to
severance from staff reductions in Central and Southern Europe as well as reorganization costs in Central Europe. International
segment charges of $3.7 million, primarily related to staff reductions in South Africa, Australia, and Brazil and asset disposals
in Australia and South Africa, as the Company reduces its footprint and optimizes its cost structure in response to challenging
economic conditions in certain markets.
For the year ended December 31, 2013, we recorded charges of $5.3 million. European segment charges of $3.0 million
related primarily to staff reductions in Germany and the Netherlands. International segment charges of $2.3 million were
primarily related to staff reductions in Australia and South Africa.
Interest expense. Interest expense for the year ended December 31, 2014 was $9.9 million, a decrease of $0.8 million, or
7%, from $10.7 million for the year ended December 31, 2013. The decrease in interest expense reflects lower borrowing levels
in the current year as well as a reduction in borrowing costs associated with our debt refinancing activities in the first half of
2014.
Currency exchange. Currency exchange losses were $1.5 million during the year ended December 31, 2014, compared to
losses of $5.5 million during the same period in 2013. In 2014, currency exchange losses primarily relate to weakening of the
Russian ruble. Currency exchange losses in both periods were mostly unrealized and relate primarily to the effect of the
strengthening U.S. dollar on intercompany balances.
Income tax provision. Our effective tax rate for the year ended December 31, 2014 was 32.3% compared to 29.3% for the
year ended December 31, 2013. In 2014, the Company recognized a tax benefit for the research and development tax credit. In
2013, the Company recognized a tax benefit for the research and development tax credits for both 2012 and 2013. Additionally,
an unfavorable income mix also contributed to the higher effective tax rate in 2014.
Net income from continuing operations. Net income from continuing operations for the year ended December 31, 2014
was $87.4 million, an increase of $1.5 million, or 2%, from net income from continuing operations for the year ended
December 31, 2013 of $85.9 million. Currency translation effects decreased current period net income when stated in U.S.
dollars, by 2%. Basic earnings per share from continuing operations was $2.34 in 2014 compared to $2.31 in 2013, an increase
of 3 cents per share, or 1%. Local currency net income increased 4%.
North American segment net income for the year ended December 31, 2014 was $77.7 million, an increase of $9.5
million, or 14%, from $68.2 million for the year ended December 31, 2013. The increase in North American segment net
income reflects higher sales and gross profits as well as lower operating costs.
European segment net income for the year ended December 31, 2014 was $22.8 million, an increase of $0.8 million, or
4%, from $22.0 million for the year ended December 31, 2013. Currency translation impacts for the year ended December 31,
2014 increased European segment net income, when stated in U.S. dollars, by 2%. Local currency net income increased by 2%,
reflecting higher selling, general, and administrative expense and restructuring expense, partially offset by increased sales and
strong gross profit.
International segment net income for the year ended December 31, 2014 was $17.0 million, a decrease of $10.9 million,
or 39%, from $27.9 million for the year ended December 31, 2013. Currency translation effects decreased 2014 International
segment net income when stated in U.S. dollars, by 4%, primarily due to a weaker Argentine peso, Brazilian real, and Chilean
peso. Local currency net income decreased 35%, and was primarily related to a lower level of sales, higher operating expense,
and higher restructuring costs.

26
Corporate segment net loss for the year ended December 31, 2014 was $30.3 million, a decrease of $1.7 million, or 5%,
compared to a net loss of $32.0 million for the year ended December 31, 2013. The lower loss during the year ended December
31, 2014 reflects a more favorable foreign currency exchange impact and lower interest expense, partially offset by higher
selling, general, and administrative expense related to corporate strategic initiatives.
LIQUIDITY AND CAPITAL RESOURCES
Our main source of liquidity is operating cash flows, supplemented by borrowings. Our principal liquidity requirements
are for working capital, capital expenditures, principal and interest payments on debt, dividend payments, and acquisitions. At
December 31, 2015, approximately 30% of our long-term debt is at fixed interest rates with repayment schedules through 2021.
Including the multi-currency note purchase and private shelf agreement entered into by the Company in January 2016
referenced below, approximately 47% of our long-term debt is at fixed interest rates. The remainder of our long-term debt is at
variable rates on an unsecured revolving credit facility that is due in 2020. Approximately 78% of our borrowings are
denominated in US dollars, which limits our exposure to currency exchange rate fluctuations.
At December 31, 2015, we had cash and cash equivalents totaling $105.9 million, of which $101.1 million was held by
our foreign subsidiaries. The $101.1 million of cash and cash equivalents are held by our foreign subsidiaries whose earnings
are considered indefinitely reinvested at December 31, 2015. These funds could be subject to additional income taxes if
repatriated. It is not practical to determine the potential income tax liability that we would incur if these funds were repatriated
to the U.S. because the time and manner of repatriation is uncertain. We believe that domestic cash and cash equivalents,
domestic cash flows from operations, annual repatriation of a portion of the current period's foreign earnings, and the
availability of our domestic line of credit are sufficient to fund our domestic liquidity requirements. Cash and cash equivalents
decreased $0.1 million during the year ended December 31, 2015, compared to an increase of $9.7 million during 2014 and an
increase of $13.5 million during 2013.
Our unsecured senior revolving credit facility, which was further amended on December 11, 2015, provides for
borrowings up to $575.0 million through 2020 and is subject to certain commitment fees. This credit facility has sub-limits for
the issuance of letters of credit, swingline borrowings and foreign currency denominated borrowings; and may be used for
general corporate purposes, including working capital, permitted acquisitions, capital expenditures and repayment of existing
indebtedness. The credit agreement also allows the Company to request increases in the aggregate commitments of the lenders
of up to an additional $150.0 million. Loans under the revolving facility will bear interest, at a variable rate based on LIBOR or
the federal funds rate, at the Company's option. Our weighted average interest rate was 1.96% in 2015. At December 31, 2015,
$244.9 million of the $575.0 million senior revolving credit facility was unused including letters of credit.
On January 22, 2016, the Company entered into a multi-currency note purchase and private shelf agreement, by amending
and drawing upon its existing shelf facility previously amended in 2014. MSA has issued notes in an aggregate principal
amount of £54.9 million (approximately $80.0 million). Proceeds from this facility were used to repay a portion of the existing
revolver. The interest rate on these notes is fixed at 3.4%. Please refer to the Form 8-K filed on January 28, 2016 for additional
details on the terms and conditions surrounding these notes.
Considering the above noted changes and our outstanding debt, the Company currently has access to approximately
$669.9 million of capital at December 31, 2015. Refer to Note 11 Short and Long- Term Debt to the Consolidated Financial
Statements in Part II Item 8 of this Form 10-K.
Operating activities. Operating activities provided cash of $55.3 million in 2015, compared to providing cash of $107.0
million in 2014. Lower operating cash flow in 2015 is primarily related to lower profitability in 2015 and changes in working
capital. Trade receivables were $232.9 million at December 31, 2015 compared to $211.4 million at December 31, 2014,
reflecting a local currency increase of $35.7 million on strong G1 SCBA sales results in the 2015 fourth quarter, partially offset
by a $14.2 million decrease due to currency translation effects. Inventories were $125.8 million at December 31, 2015,
compared to $123.0 million at December 31, 2014. Local currency inventory increased $19.2 million primarily due to the
acquisition of Latchways and continued demand planning for our G1 SCBA. Currency translation effects of $16.4 million
decreased inventories. Accounts payable were $68.2 million at December 31, 2015 compared to $70.2 million at December 31,
2014. Local currency accounts payable increased $2.7 million, primarily in the North American segment, offset by currency
translation effects of $4.7 million. The December 31, 2015 trade receivables and inventory balances included Latchways trade
receivables and inventory of $11.8 million and $9.1 million, respectively.
At December 31, 2015, the cumulative trauma product liability reserve totaled $50.1 million, compared to $74.9 million
at December 31, 2014. Amounts comprising most of the reserve will be paid equally over the first two quarters in 2016.
Insurance receivables related to cumulative trauma product liability losses at December 31, 2015 totaled $229.5 million,
compared to $220.5 million at December 31, 2014.

27
Operating activities provided cash of $107.0 million in 2014, compared to providing cash of $110.8 million in 2013.
Lower operating cash flow in 2014 is primarily related to higher insurance receivables, lower pension, and lower currency
exchange losses, offset by changes in working capital. Trade receivables were $211.4 million at December 31, 2014 compared
to $200.4 million at December 31, 2013, reflecting a local currency increase of $23.5 million on strong sales results in the 2014
fourth quarter, partially offset by a $12.5 million decrease due to currency translation effects. Inventories were $123.0 million at
December 31, 2014, compared to $136.8 million at December 31, 2013. Local currency inventory decreased $1.1 million on
decreases in our European and International segments. Currency translation effects of $12.7 million decreased inventories.
Accounts payable were $70.2 million at December 31, 2014 compared to $66.9 million at December 31, 2013. Local currency
accounts payable increased $6.8 million, primarily in the European segment, offset by currency translation effects of $3.5
million. Insurance receivables related to cumulative trauma product liability losses were $220.5 million at December 31, 2014
compared to $124.8 million at December 31, 2013.
Investing activities. Investing activities used cash of $208.5 million for the year ended December 31, 2015, compared to
using $30.7 million in 2014. The increased use of cash for investing activities in 2015 was related to the acquisition of
Latchways. Cash generated from property disposals was $8.0 million in 2015 compared to $3.4 million in 2014. The cash
received from property disposals in 2015 include proceeds from the sale of property in Australia. Capital expenditures were
$36.2 million compared to $33.6 million in 2014. We plan to invest approximately $35.0 million in capital expenditures in
2016.
Investing activities used cash of $30.7 million for the year ended December 31, 2014, compared to using $35.2 million in
2013. The decrease in cash used by investing activities in 2014 was due to lower capital expenditures and higher cash generated
by property disposals. Cash generated from property disposals was $3.4 million in 2014 compared to $1.4 million in 2013. The
cash received from property disposals in 2014 include proceeds from the sale of our detector tube assets. Capital expenditures
were $33.6 million compared to $36.5 million in 2013. The $2.9 million decrease in expenditures was driven primarily from
lower investment in manufacturing in the International segment.
Financing activities. Financing activities provided cash of $165.0 million for the year ended December 31, 2015,
compared to using cash of $58.1 million in 2014. The change was primarily related to borrowings made to finance the
acquisition of Latchways in 2015. We plan to repay these borrowings using the cash flows generated by Latchways.
We made dividend payments of $47.4 million during 2015, compared to $45.6 million during 2014. Dividends paid on
our common stock during 2015 (our 99th consecutive year of dividend payments) were $1.27 per share. Dividends paid on our
common stock in 2014 and 2013 were $1.23 and $1.18 per share, respectively. Restricted cash balances were $2.4 million at
December 31, 2015 compared to $2.7 million at December 31, 2014 and were primarily used to support letter of credit
balances.
As announced on May 13, 2015, the MSA Board of Directors authorized the Company to repurchase up to $100.0 million
in shares of MSA common stock. During the second quarter of 2015 we executed share repurchases of $7.1 million. The
program seeks to offset equity dilution associated with employee stock compensation. The Board of Directors did not set a time
limitation on the repurchase program.
Financing activities used cash of $58.1 million for the year ended December 31, 2014, compared to using cash of $58.2
million in 2013. During 2014, we paid down $15.7 million of long-term debt compared to paying down $11.7 million in 2013.
We made dividend payments of $45.6 million during 2014, compared to $44.0 million during 2013.
CUMULATIVE TRANSLATION ADJUSTMENTS
The year-end position of the U.S. dollar relative to international currencies resulted in a translation loss of $47.7 million
being credited to cumulative translation adjustments for the year ended December 31, 2015. This compares to a translation loss
of $40.0 million in 2014 and a translation loss of $6.1 million in 2013. The translation loss in 2015 was primarily related to the
weakening of the euro, British pound, Brazilian real, and South African rand. The translation loss in 2014 was primarily related
to the weakening of the euro, Mexican peso, Argentine peso, and the South African rand. The translation loss in 2013 was
primarily related to the weakening of the Australian dollar, Brazilian real and the Argentine peso.
COMMITMENTS AND CONTINGENCIES
We are obligated to make future payments under various contracts, including debt and lease agreements. Our significant
cash obligations as of December 31, 2015, including the effects of the January 2016 multi-currency note purchase and private
shelf agreement and subsequent repayment of a portion of our existing unsecured senior revolving credit facility, are as follows:

28
(In millions) Total 2016 2017 2018 2019 2020 Thereafter
Long-term debt $ 466.6 $ 6.7 $ 26.7 $ 26.7 $ 26.7 $ 273.1 $ 106.7
Operating leases 51.4 11.2 9.5 7.4 6.1 4.6 12.6
Totals 518.0 17.9 36.2 34.1 32.8 277.7 119.3
The significant obligations table does not include obligations to taxing authorities due to uncertainty surrounding the
ultimate settlement of amounts and timing of these obligations.
We expect to meet our 2016, 2017, 2018, and 2019 debt service obligations through cash provided by operations.
Approximately $246.6 million of debt payable in 2020 relates to our unsecured senior revolving credit facility. We expect to
generate sufficient operating cash flow to make payments against this amount each year. To the extent that a balance remains
when the facility matures in 2020, we expect to refinance the remaining balance through new borrowing facilities. Interest
expense on fixed rate debt over the next five years is expected to be approximately $8.3 million in 2016, $8.5 million in 2017,
$7.4 million in 2018, $6.2 million in 2019, and $5.1 million in 2020.
The Company had outstanding bank guarantees and standby letters of credit with banks as of December 31, 2015 totaling
$7.9 million, of which $3.5 million relate to the senior revolving credit facility. These letters of credit serve to cover customer
requirements in connection with certain sales orders and insurance companies. No amounts were drawn on these arrangements
at December 31, 2015. The Company is also required to provide cash collateral in connection with certain arrangements. At
December 31, 2015, the Company has $2.4 million of restricted cash in support of these arrangements.
We expect to make net contributions of $6.2 million to our pension plans in 2016 which are primarily associated with our
European and International segments. We have not been required to make contributions to our U.S. based qualified defined
benefit pension plan in many years.
We have purchase commitments for materials, supplies, services and property, plant and equipment as part of our ordinary
conduct of business.
Please refer to Note 19 Contingencies to the Consolidated Financial Statements in Part II Item 8 of this Form 10-K for
further discussion on the Company's product liabilities.
CRITICAL ACCOUNTING POLICIES AND ESTIMATES
We prepare our consolidated financial statements in accordance with U.S. generally accepted accounting principles
(GAAP). The preparation of these financial statements requires us to make estimates and judgments that affect the reported
amounts of assets, liabilities, revenues and expenses and the related disclosures. We evaluate these estimates and judgments on
an on-going basis based on historical experience and various assumptions that we believe to be reasonable under the
circumstances. However, different amounts could be reported if we had used different assumptions and in light of different facts
and circumstances. Actual amounts could differ from the estimates and judgments reflected in our financial statements. A
summary of the Company's significant accounting policies is included in Note 1 to the Consolidated Financial Statements in
Part II, Item 8 of this Form 10-K.
We believe that the following are the more critical judgments and estimates used in the preparation of our financial
statements.
Accounting for contingencies. We accrue for contingencies when we believe that it is probable that a liability or loss has
been incurred and the amount can be reasonably estimated. Contingencies relate to uncertainties that require our judgment both
in assessing whether or not a liability or loss has been incurred and in estimating the amount of the probable loss. Significant
contingencies affecting our consolidated financial statements include pending or threatened litigation, including product
liability claims and product warranties.
Product liability. We face an inherent business risk of exposure to product liability claims arising from the alleged failure
of our products to prevent the types of personal injury or death against which they are designed to protect. The Company
categorizes the product liability losses of its subsidiary MSA LLC into two main categories: single incident and cumulative
trauma.
Single incident product liability claims involve discrete incidents that are typically known to us when they occur and
involve observable injuries which provide an objective basis for quantifying damages. MSA LLC estimates its liability for
single incident product liability claims based on expected settlement costs for reported claims and an estimate of costs for
unreported claims (claims incurred but not reported or IBNR). The estimate for IBNR claims is based on experience, sales
volumes, and other relevant information. The reserve for single incident product liability claims, which includes reported and

29
IBNR claims, at December 31, 2015 and 2014 was $3.5 million in each year. Single incident product liability expense during
the year ended December 31, 2015 was $0.9 million and was not significant for the year ended December 31, 2014. Single
incident product liability exposures are evaluated on an ongoing basis and adjustments are made to the reserve as appropriate.
Cumulative trauma product liability claims involve exposures to harmful substances (e.g., silica, asbestos and coal dust)
that occurred many years ago and may have developed over long periods of time into diseases such as silicosis, asbestosis, or
coal worker’s pneumoconiosis. MSA LLC is presently named as a defendant in 1,988 lawsuits, some of which involve multiple
plaintiffs, in which plaintiffs allege to have contracted certain cumulative trauma diseases. These lawsuits mainly involve
respiratory protection products allegedly manufactured and sold by MSA LLC or its predecessors.
During the 2014 fourth quarter and extending into January 2015, MSA LLC resolved a number of cumulative trauma
cases, the vast majority of which were insured. The settlements were recorded in both the insurance and product liability line
under current liabilities, and in the insurance receivable in the other non-current asset section of the consolidated balance sheet.
More than half of the open lawsuits at December 31, 2015 have had a de minimis level of activity over the last 5 years. It
is possible that these cases could become active again at any point due to changes in circumstances.
Cumulative trauma product liability litigation has been difficult to predict. In our past experience, it has typically not been
until very late in the legal process that we can reasonably determine whether it is probable that any particular case will
ultimately result in a liability. This uncertainty is caused by many factors; Cumulative trauma litigation is inherently
unpredictable. Complaints generally do not provide information sufficient to determine if a lawsuit will develop into an actively
litigated case. Even when a case is actively litigated, it is often difficult to determine if the lawsuit will be dismissed or
otherwise resolved until late in the lawsuit. Moreover, even if it is probable that such a lawsuit will result in a loss; it is often
difficult to estimate the amount of actual loss that will be incurred. These actual loss amounts are highly variable and turn on a
case-by-case analysis of the relevant facts, which are often not learned until late in the lawsuit. In addition, there are
uncertainties concerning the impact of bankruptcies of other companies that are co-defendants in claims, uncertainties
surrounding the litigation process from jurisdiction to jurisdiction and from case to case, and uncertainties regarding the impact
of potential changes in legislative or judicial standards.
Consequently, MSA LLC historically has been unable to estimate its cumulative trauma product liability exposure.
In 2014, MSA LLC engaged an outside valuation consultant to assist in assessing its ability to estimate MSA LLC's
cumulative trauma product liability exposure. This assessment was based on MSA LLC’s cumulative claims experience,
including recent claims trends, and the development of enhanced claims data analytics. The analysis focused on claims made or
resolved over the last several years as these claims are likely to best represent future claim characteristics. After review by the
valuation consultant, outside legal counsel, and Management, it was determined that MSA LLC could not estimate its liability
for reported or IBNR cumulative trauma product liability claims.
The cumulative trauma product liability reserve totaled $74.9 million at December 31, 2014, comprised of $35.1 million
in other non-current liabilities and the remainder recorded in the insurance and product liability line in the other current
liabilities section of the consolidated balance sheet. These amounts relate to settlements that were reached in 2014 and 2015 that
will be paid out in 2015 and 2016.
In 2015, Management continued to work with the outside valuation consultant and outside legal counsel to develop a
method to provide a reasonable estimate for certain reported claims by using appropriate assumptions based on our unique
circumstances. As a result, we've established a reserve for these reported claims that we believe represents our best estimate of
potential loss at December 31, 2015.
The change in ability to estimate was driven by the maturation of MSA LLC’s defense efforts and an additional year of
claims experience. Management’s claims experience has now advanced to a level that enables us to develop a reserve of
potential loss. As a result, for certain reported claims, we estimated a liability of $7.1 million as of December 31, 2015. This
amount has been added to the product liability reserve and the insurance receivable. The product liability reserve totals $50.1
million, and is recorded in the insurance and product liability line within current liabilities in the consolidated balance sheet.
To arrive at the estimate for certain reported claims, it was necessary to employ significant assumptions. In light of these
significant assumptions, and all of the uncertainties inherent in cumulative trauma product liability litigation noted above, there
can be no assurance that future experience with reported claims will follow MSA LLC’s past experience. Thus, the reserve of
$7.1 million as of December 31, 2015 should be viewed as simply an estimate of a possible outcome for those reported claims
where our experience allows us to reasonably make an estimate. Actual liabilities could vary greatly and we will need to adjust
the estimate from time to time based on relevant facts and circumstances. If actual experience is worse than projected, it is
likely that the estimate would increase, and these increases could potentially be material over time.

30
The uncertainties noted above relating to our cumulative trauma product liability litigation are particularly acute in the
case of IBNR claims, which by definition are potential claims that have not yet been filed. Management continues to be unable
to reasonably estimate, and therefore has not recorded any liability for, MSA LLC’s cumulative trauma IBNR claims. This
determination was made by Management after review with its valuation consultant and outside legal counsel.
Our aggregate cumulative trauma product liability losses and administrative and defense costs for the three years ended
December 31, 2015, totaled approximately $156.1 million, substantially all of which was insured.
Because litigation is subject to inherent uncertainties, and unfavorable rulings or developments could occur, there can be
no certainty that MSA LLC may not ultimately incur charges in excess of presently recorded liabilities. The estimate does not
purport to reflect MSA LLC’s overall claims exposure for either reported claims or future claims as noted above.
Although it is impossible to predict the ultimate outcome of current open claims, based on current information, our
experience in handling these matters, and our substantial insurance program, we do not believe that the resolution of these
claims will have a material adverse effect on our future financial condition or liquidity.
Income taxes. We recognize deferred tax assets and liabilities using enacted tax rates to record the tax effect of temporary
differences between the book and tax basis of recorded assets and liabilities. We record valuation allowances to reduce deferred
tax assets to the amounts that we estimate are probable to be realized. When assessing the need for valuation allowances, we
consider projected future taxable income and prudent and feasible tax planning strategies. Should a change in circumstances
lead to a change in our judgments about the realizability of deferred tax assets in future years, we adjust the related valuation
allowances in the period that the change in circumstances occurs. We had valuation allowances of $5.2 million and $3.8 million
at December 31, 2015 and 2014, respectively.
We record an estimated income tax liability based on our best judgment of the amounts likely to be paid in the various tax
jurisdictions in which we operate. We record tax benefits related to uncertain tax positions taken or expected to be taken on a
tax return when such benefits meet a more likely than not threshold. We recognize interest related to unrecognized tax benefits
in interest expense and penalties in operating expenses. The tax liabilities ultimately paid are dependent on a number of factors,
including the resolution of tax audits, and may differ from the amounts recorded. Tax liabilities are adjusted through income
when it becomes probable that the actual liability differs from the amount recorded.
No deferred U.S. income taxes have been provided on undistributed earnings of non-U.S. subsidiaries, which amounted
to $408.5 million as of December 31, 2015. These earnings are considered to be reinvested for an indefinite period of time.
Because we currently do not have any plans to repatriate these funds, we cannot determine the impact of local taxes,
withholding taxes and foreign tax credits associated with the future repatriation of such earnings and, therefore, cannot
reasonably estimate the associated tax liability. In cases where we intend to repatriate a portion of the undistributed earnings of
our foreign subsidiaries, we provide U.S. income taxes on such earnings.
Pensions and other post-retirement benefits. We sponsor certain pension and other post-retirement benefit plans.
Accounting for the net periodic benefit costs and credits for these plans requires us to estimate the cost of benefits to be
provided well into the future and to attribute these costs over the expected work life of the employees participating in these
plans. These estimates require our judgment about discount rates used to determine these obligations, expected returns on plan
assets, rates of future compensation increases, rates of increase in future health care costs, participant withdrawal and mortality
rates and participant retirement ages. Differences between our estimates and actual results may significantly affect the cost of
our obligations under these plans and could cause net periodic benefit costs and credits to change materially from year-to-year.
The discount rate assumptions used in determining projected benefit obligations are based on published long-term bond indices
or a company-specific yield curve model. Please refer to Note 14 to the Consolidated Financial Statements in Part II Item 8 of
this Form 10-K for further details on the funded status of our pension and post-retirement benefit plans.
Stock Compensation. We sponsor both a Management and a Non-Employee Directors' Equity Incentive plan which
provide for grants of stock options, restricted stock and other equity-based vehicles such as restricted stock units and
performance stock units; all of which are recognized as compensation expense based on grant date fair value. Stock options are
valued using the Black-Scholes option pricing model. Performance stock units that have a market condition are valued on the
grant date using a Monte Carlo simulation valuation model. We believe these valuation models are appropriate for use based
and are consistent with models used by our peer companies. Please refer to Note 10 to the Consolidated Financial Statements in
Part II Item 8 of this Form 10-K for further details on the assumptions used in these valuation models.
Revenue Recognition. Revenue from the sale of products is recognized when title, ownership and the risk of loss have
transferred to the customer, which generally occurs either when product is shipped to the customer or, in the case of most U.S.
distributor customers, when product is delivered to the customer’s delivery site. We establish our shipping terms according to
local practice and market characteristics. We do not ship product unless we have an order or other documentation authorizing

31
shipment to our customers. We make appropriate provisions for uncollectible accounts receivable and product returns, both of
which have historically been insignificant in relation to our net sales. Certain distributor customers receive price rebates based
on their level of purchases and other performance criteria that are documented in established distributor programs. These
rebates are accrued as a reduction of net sales as they are earned by the customer.
Goodwill. Historically, in the third quarter of each year, or more frequently if indicators of impairment exist or if a
decision is made to sell a business, we evaluate goodwill for impairment. The company changed its annual impairment
assessment date to October 1 as discussed below. A significant amount of judgment is involved in determining if an indicator of
impairment has occurred. Such indicators may include a decline in expected cash flows, a significant adverse change in the
business climate, unanticipated competition, slower growth rates, or negative developments in equity and credit markets, among
others.
All goodwill is assigned to and evaluated for impairment at the reporting unit level, which is defined as an operating
segment or one level below an operating segment. For goodwill impairment testing purposes, we consider our operating
segments to be our reporting units. We test goodwill for impairment by either performing a qualitative evaluation or a two-step
quantitative test. The qualitative evaluation is an assessment of factors to determine whether it is more likely than not that the
fair value of a reporting unit is less than its carrying value, including goodwill. Factors considered as part of the qualitative
assessment include entity-specific industry, market and general economic conditions. In 2015 we elected to bypass the
qualitative evaluation for all of our reporting units and performed a two-step quantitative test at September 30, 2015.
Quantitative testing involves comparing the estimated fair value of each reporting unit to its carrying value. We estimate
reporting unit fair value using a weighted average of fair values determined by discounted cash flow (DCF) and market
approach methodologies, as we believe both are equally important indicators of fair value. A number of significant assumptions
and estimates are involved in the application of the DCF model, including sales volumes and prices, costs to produce, tax rates,
capital spending, discount rates, and working capital changes. Cash flow forecasts are generally based on approved business
unit operating plans for the early years and historical relationships in later years. The betas used in calculating the individual
reporting units’ weighted average cost of capital (WACC) rate are estimated for each reporting unit based on peer data. The
market approach methodology measures value through an analysis of peer companies. The analysis entails measuring the
multiples of EBITDA at which peer companies are trading.
In the event the estimated fair value of a reporting unit per the weighted average of the DCF and market approach models
is less than the carrying value, additional analysis would be required. The additional analysis would compare the carrying
amount of the reporting unit’s goodwill with the implied fair value of that goodwill, which may involve the use of valuation
experts. The implied fair value of goodwill is the excess of the fair value of the reporting unit over the fair value amounts
assigned to all of the assets and liabilities of that unit as if the reporting unit had been acquired in a business combination and
the fair value of the reporting unit represented the purchase price. If the carrying value of goodwill exceeds its implied fair
value, an impairment loss equal to such excess would be recognized, which could significantly and adversely impact reported
results of operations and shareholders’ equity. At September 30, 2015, based on our quantitative test, the fair values of all of our
reporting units exceeded their carrying value by at least 51%.
During the quarter ended December 31, 2015, the Company voluntarily changed the date of its annual goodwill
impairment testing from the last day of the third quarter to the first day of the fourth quarter. This voluntary change is preferable
under the circumstances as it provides the Company with additional time to complete its annual goodwill impairment testing in
advance of its year-end reporting and results in better alignment with the timing of the Company's long range planning and
forecasting process. The voluntary change in accounting principle related to the annual testing date will not delay, accelerate or
avoid an impairment charge. The change will be applied prospectively.
Foreign currency. As part of our currency exchange rate risk management strategy, we enter into certain derivative
foreign currency forward contracts that do not meet the U.S. GAAP criteria for hedge accounting, but which have the impact of
partially offsetting certain foreign currency exposures. We account for these forward contracts on a full mark-to-market basis
and report the related gains or losses in currency exchange losses (gains) in the consolidated statement of income. Please refer
to Note 17 to the Consolidated Financial Statements in Part II Item 8 of this Form 10-K for further details on our current
positions.

32
RECENTLY ADOPTED AND RECENTLY ISSUED ACCOUNTING STANDARDS
In April 2014, the FASB issued ASU 2014-08, Reporting Discontinued Operations and Disclosures of Disposals of an
Entity. This ASU amends the definition of a discontinued operation to include a disposal of a component or group of
components that is disposed of or is classified as held for sale and represents a strategic shift that has (or will have) a major
effect on an entity's operations and financial results. This ASU was adopted on January 1, 2015. The adoption of this ASU may
have a material effect on our consolidated financial statements in the event that we were to divest of a component that meets the
definition of discontinued operations.
In May 2014, the FASB issued ASU 2014-09, Revenue with Contracts from Customers. This ASU clarifies the principles
for recognizing revenue such that an entity should recognize revenue to depict the transfer of promised goods or services to
customers in an amount that reflects the consideration to which the entity expects to be entitled in exchange for those goods or
services. In August 2015, the FASB issued ASU 2015-15, Revenue with Contracts from Customers. This ASU defers the
effective date of the standard until January 1, 2018. The Company is currently evaluating the impact that the adoption of these
ASUs will have on the consolidated financial statements.
In June 2014, the FASB issued ASU 2014-12, Accounting for Share-Based Payments When the Terms of an Award
Provide That a Performance Target Could be Achieved after the Requisite Service Period. This ASU clarifies the accounting
treatment for share based payment awards that contain performance targets. This ASU will be effective beginning in 2016. The
adoption of this ASU is not expected to have a material effect on our consolidated financial statements.
In August 2014, the FASB issued ASU 2014-15, Presentation of Financial Statements - Going Concern. This ASU
clarifies management's responsibility to evaluate whether there is a substantial doubt about the entity's ability to continue as a
going concern and provides guidance for related footnote disclosures. This ASU will be effective beginning in 2016. The
adoption of this ASU is not expected to have a material effect on our consolidated financial statements.
In January 2015, the FASB issued ASU 2015-01, Income Statement - Extraordinary and Unusual Items. This ASU
eliminates the requirement to separately present and disclose extraordinary and unusual items in the financial statements. This
ASU will be effective beginning in 2016. The adoption of this ASU is not expected to have a material effect on our consolidated
financial statements.
In February 2015, the FASB issued ASU 2015-02, Amendments to the Consolidation Analysis. This ASU changes the
analysis that an entity must perform to determine whether it should consolidate certain types of legal entities. This ASU will be
effective beginning in 2016. The adoption of this ASU is not expected to have a material effect on our consolidated financial
statements.
In April 2015, the FASB issued ASU 2015-03, Imputation of Interest - Simplifying the Presentation of Debt Issuance
Costs. This ASU simplifies the presentation of debt issuance costs and requires that debt issuance costs related to a recognized
debt liability be presented in the balance sheet as a direct deduction from the carrying amount of that debt liability. In August
2015, the FASB issued ASU 2015-15, Imputation of Interest - Simplifying the Presentation of Debt Issuance Costs. This ASU
simplifies the presentation of debt issuance costs for line of credit arrangements. Both ASUs will be effective beginning in
2016. The adoption of these ASU is not expected to have a material effect on our consolidated financial statements.
In April 2015, the FASB issued ASU 2015-04, Retirement Benefits - Practical Expedient for the Measurement Date of an
Employer's Defined Benefit Obligation and Plan Assets. This ASU allows entities with a fiscal year end that does not coincide
with a month end to use the closest month end for measurement purposes. This ASU also allows entities that have a significant
event in an interim period that calls for a remeasurement of defined benefit plan assets and obligations to use the month end
date that is closest to the date of the significant event. This ASU will be effective beginning in 2016. The adoption of this ASU
is not expected to have a material effect on our consolidated financial statements.
In April 2015, the FASB issued ASU 2015-05, Goodwill and Other Internal Use Software - Customer's Accounting for
Fees Paid in a Cloud Computing Arrangement. This ASU clarifies when entities should account for fees paid in a cloud
computing arrangement as a software license or service contract. This ASU will be effective beginning in 2016. The adoption of
this ASU is not expected to have a material effect on our consolidated financial statements.
In July 2015, the FASB issued ASU 2015-11, Simplifying the Measurement of Inventory. This ASU requires inventory to
be measured at the lower of cost and net realizable value. This ASU applies to inventory measured using the first-in, first-out
(FIFO) or average cost methods only. This ASU will be effective beginning in 2017. The adoption of this ASU is not expected
to have a material effect on our consolidated financial statements.

33
In July 2015, the FASB issued ASU 2015-12, Plan Accounting: Defined Benefit Pension Plans (Topic 960), Defined
Contribution Pension Plans (Topic 962), Health and Welfare Benefit Plans (Topic 965). This ASU simplifies complexities
within employee benefit plan accounting including Fully Benefit-Responsive Investment Contracts, Plan Investment
Disclosures, and the Measurement Date Practical Expedient. This ASU will be effective beginning in 2016. The adoption of this
ASU is not expected to have a material effect on our consolidated financial statements.
In September 2015, the FASB issued ASU 2015-16, Simplifying the Accounting for Measurement-Period Adjustments.
This ASU simplifies the accounting for adjustments made to provisional amounts recognized in a business combination. The
amendments in this Update eliminate the requirement to retrospectively account for those adjustments. This ASU will be
effective beginning in 2016. MSA elected to early adopt this standard for the period ended December 31, 2015. The adoption of
this ASU could have a material effect on our consolidated financial statements to the extent that measurement-period
adjustments for business combinations are identified.
In November 2015, the FASB issued ASU 2015-17, Balance Sheet Classification of Deferred Taxes. This ASU simplifies
the presentation of deferred income taxes. The amendments in this Update require that deferred tax liabilities and assets be
classified as noncurrent in a classified statement of financial position. This ASU is effective for financial statements issued for
annual periods beginning after December 15, 2016, and interim periods within those annual periods. Early adoption is
permitted. MSA elected to early adopt this standard for the period ended December 31, 2015. We elected to apply the
amendments in this update retrospectively. As such, we have reclassified $23.8 million and $7.0 thousand previously reported
in the 2014 Form 10-K as current deferred tax assets and other current liabilities on the Consolidated Balance Sheet,
respectively, to non-current deferred tax assets and non-current deferred tax liabilities on the Consolidated Balance Sheet as of
December 31, 2014.
In February 2016, the FASB issued ASU 2016-02, Leases. This ASU requires lessees to record a right of use asset and a
liability for virtually all leases. This ASU will be effective beginning in 2019. While the adoption of this ASU is expected to
have a material effect on our consolidated balance sheet, the Company continues to evaluate the impact that the adoption of this
ASU will have on the consolidated financial statements.

34
Item 7A. Quantitative and Qualitative Disclosures About Market Risk
Market risk represents the risk of adverse changes in the value of a financial instrument caused by changes in currency
exchange rates, interest rates and equity prices. We are exposed to market risks related to currency exchange rates and interest
rates.
Currency exchange rates. We are subject to the effects of fluctuations in currency exchange rates on various transactions
and on the translation of the reported financial position and operating results of our non-U.S. companies from local currencies
to U.S. dollars. A hypothetical 10% strengthening or weakening of the U.S. dollar would increase or decrease our reported sales
and net income for the year ended December 31, 2015 by approximately $51.0 million and $0.9 million, or 4.5% and 1.2%,
respectively.
When appropriate, we may attempt to limit our transactional exposure to changes in currency exchange rates through
forward contracts or other actions intended to reduce existing exposures by creating offsetting currency exposures. At
December 31, 2015, we had open foreign currency forward contracts with a U.S. dollar notional value of $58.6 million. A
hypothetical 10% increase in December 31, 2015 forward exchange rates would result in a $5.9 million increase in the fair
value of these contracts.
Interest rates. We are exposed to changes in interest rates primarily as a result of borrowing and investing activities used
to maintain liquidity and fund business operations. Because of the relatively short maturities of temporary investments and the
variable rate nature of our revolving credit facility, these financial instruments are reported at carrying values which
approximate fair values.
At December 31, 2015, we had $140.0 million of fixed rate debt which matures at various dates through 2021. The
incremental increase in the fair value of fixed rate long-term debt resulting from a hypothetical 10% decrease in interest rates
would be approximately $2.0 million. However, our sensitivity to interest rate declines and the corresponding increase in the
fair value of our debt portfolio would unfavorably affect earnings and cash flows only to the extent that we elected to
repurchase or retire all or a portion of our fixed rate debt portfolio at prices above carrying values.
At December 31, 2015, we had $326.6 million of variable rate borrowings under our revolving credit facility. A 100 basis
point increase or decrease in interest rates could impact on future earnings under our current capital structure. As described in
Note 11 Short-Term and Long-Term Debt in Part II Item 8 of this Form 10-K, we issued $80.0 million in fixed rate notes in
January 2016. The proceeds from this debt were used to pay down a portion of the variable rate revolving credit facility in
January 2016, reducing our exposure to variability in interest rates.
Actuarial assumptions. The most significant actuarial assumptions affecting our net periodic pension credit and pension
obligations are discount rates, expected returns on plan assets and plan asset valuations. Discount rates and plan asset valuations
are point-in-time measures. Expected returns on plan assets are based on our historical returns by asset class.
The following table summarizes the impact of changes in significant actuarial assumptions on our December 31, 2015
actuarial valuations.
Impact of Changes in Actuarial Assumptions
Change in Discount
Rate Change in Expected
Return Change in Market Value
of Assets
(In thousands) 1% (1)% 1% (1)% 5% (5)%
(Decrease) increase in net benefit cost $ (6,771 ) $ 8,209 $ (4,230 ) $ 4,230 $ (975 ) $ 938
(Decrease) increase in projected benefit obligation (63,738 ) 78,520 — — — —
Increase (decrease) in funded status 63,738 (78,520 ) — — 20,954 (20,954 )
35
Item 8. Financial Statements and Supplementary Data
Management’s Reports to Shareholders
Management’s Report on Responsibility for Financial Reporting
Management of MSA Safety Incorporated (the Company) is responsible for the preparation of the financial statements
included in this annual report. The financial statements were prepared in accordance with accounting principles generally
accepted in the United States of America and include amounts that are based on the best estimates and judgments of
management. The other financial information contained in this annual report is consistent with the financial statements.
Management’s Report on Internal Control Over Financial Reporting
Management is responsible for establishing and maintaining adequate internal control over financial reporting. The
Company’s internal control over financial reporting is a process designed to provide reasonable assurance regarding the
reliability of financial reporting and the preparation of financial statements for external purposes in accordance with generally
accepted accounting principles.
The Company’s internal control over financial reporting includes policies and procedures that (1) pertain to the
maintenance of records that, in reasonable detail, accurately and fairly reflect transactions and dispositions of assets; (2) provide
reasonable assurance that transactions are recorded as necessary to permit preparation of financial statements in accordance
with generally accepted accounting principles, and that receipts and expenditures are being made only in accordance with
authorizations of management and the directors of the Company; and (3) provide reasonable assurance regarding prevention or
timely detection of unauthorized acquisition, use or disposition of the Company’s assets that could have a material effect on our
financial statements.
Because of its inherent limitations, internal control over financial reporting may not prevent or detect misstatements. Also,
projections of any evaluation of effectiveness to future periods are subject to the risk that controls may become inadequate
because of changes in conditions, or that the degree of compliance with the policies or procedures may deteriorate.
Management assessed the effectiveness of the Company’s internal control over financial reporting as of December 31,
2015. In making this assessment, management used the criteria set forth by the Committee of Sponsoring Organizations of the
Treadway Commission (COSO) in Internal Control-Integrated Framework (2013). Based on our assessment and those criteria,
management has concluded that the Company maintained effective internal control over financial reporting as of December 31,
2015.
Management has excluded Latchways from its assessment of internal controls over financial reporting as of December 31,
2015 because the Company acquired Latchways effective October 21, 2015 (Acquisition Date), whose total assets represents
14%, and net income represents less than 1%, and whose customer revenues represents less than 1% of the related consolidated
financial statement amounts as of December 31, 2015 and from the period from the acquisition date through December 31,
2015.
The Company's independent registered public accounting firm that audited the consolidated financial statements included
in this annual report issued an attestation report on the Company's internal control over financial reporting.
/s/ WILLIAM M. LAMBERT
William M. Lambert Chief Executive Officer
/s/ KENNETH D. KRAUSE
Kenneth D. Krause Vice President of Finance and Chief Financial Officer
February 29, 2016

36
Report of Independent Registered Public Accounting Firm
The Board of Directors and Shareholders of MSA Safety Incorporated:
We have audited the accompanying consolidated balance sheet of MSA Safety Incorporated as of December 31, 2015, and the
related consolidated statements of income, comprehensive income, cash flows, and changes in retained earnings and
accumulated other comprehensive loss for the year ended December 31, 2015. Our audit also included the financial statement
schedule listed in the Index at Item 15(a). These financial statements and schedule are the responsibility of the Company's
management. Our responsibility is to express an opinion on these financial statements and schedule based on our audit.
We conducted our audit in accordance with the standards of the Public Company Accounting Oversight Board (United States).
Those standards require that we plan and perform the audit to obtain reasonable assurance about whether the financial
statements are free of material misstatement. An audit includes examining, on a test basis, evidence supporting the amounts and
disclosures in the financial statements. An audit also includes assessing the accounting principles used and significant estimates
made by management, as well as evaluating the overall financial statement presentation. We believe that our audit provides a
reasonable basis for our opinion.
In our opinion, the financial statements referred to above present fairly, in all material respects, the consolidated financial
position of MSA Safety Incorporated at December 31, 2015, and the consolidated results of its operations and its cash flows for
the year ended December 31, 2015, in conformity with U.S. generally accepted accounting principles. Also, in our opinion, the
related financial statement schedule, when considered in relation to the basic financial statements taken as a whole, presents
fairly in all material respects the information set forth therein.
We also have audited, in accordance with the standards of the Public Company Accounting Oversight Board (United States),
MSA Safety Incorporated’s internal control over financial reporting as of December 31, 2015, based on criteria established in
Internal Control-Integrated Framework issued by the Committee of Sponsoring Organizations of the Treadway Commission
(2013 framework), and our report dated February 29, 2016 expressed an unqualified opinion thereon.
/s/ Ernst & Young LLP
Pittsburgh, Pennsylvania
February 29, 2016

37
Report of Independent Registered Public Accounting Firm
The Board of Directors and Shareholders of MSA Safety Incorporated:
We have audited MSA Safety Incorporated’s internal control over financial reporting as of December 31, 2015, based on criteria
established in Internal Control-Integrated Framework issued by the Committee of Sponsoring Organizations of the Treadway
Commission (2013 Framework) (the COSO criteria). MSA Safety Incorporated’s management is responsible for maintaining
effective internal control over financial reporting, and for its assessment of the effectiveness of internal control over financial
reporting included in the accompanying Management’s Report on Internal Control Over Financial Reporting. Our responsibility
is to express an opinion on the Company’s internal control over financial reporting based on our audit.
We conducted our audit in accordance with the standards of the Public Company Accounting Oversight Board (United States).
Those standards require that we plan and perform the audit to obtain reasonable assurance about whether effective internal
control over financial reporting was maintained in all material respects. Our audit included obtaining an understanding of
internal control over financial reporting, assessing the risk that a material weakness exists, testing and evaluating the design and
operating effectiveness of internal control based on the assessed risk, and performing such other procedures as we considered
necessary in the circumstances. We believe that our audit provides a reasonable basis for our opinion.
A company’s internal control over financial reporting is a process designed to provide reasonable assurance regarding the
reliability of financial reporting and the preparation of financial statements for external purposes in accordance with generally
accepted accounting principles. A company’s internal control over financial reporting includes those policies and procedures
that (1) pertain to the maintenance of records that, in reasonable detail, accurately and fairly reflect the transactions and
dispositions of the assets of the company; (2) provide reasonable assurance that transactions are recorded as necessary to permit
preparation of financial statements in accordance with generally accepted accounting principles, and that receipts and
expenditures of the company are being made only in accordance with authorizations of management and directors of the
company; and (3) provide reasonable assurance regarding prevention or timely detection of unauthorized acquisition, use, or
disposition of the company’s assets that could have a material effect on the financial statements.
Because of its inherent limitations, internal control over financial reporting may not prevent or detect misstatements. Also,
projections of any evaluation of effectiveness to future periods are subject to the risk that controls may become inadequate
because of changes in conditions, or that the degree of compliance with the policies or procedures may deteriorate.
As indicated in the accompanying Management’s Report on Internal Control Over Financial Reporting, management’s
assessment of and conclusion on the effectiveness of internal control over financial reporting did not include the internal
controls of Latchways plc, which is included in the 2015 consolidated financial statements of MSA Safety Incorporated and
constituted 14% and 34% of total and net assets, respectively, as of December 31, 2015, and less than 1% of revenues and net
income, respectively, for the period from October 21, 2015 (acquisition date) through December 31, 2015. Our audit of internal
control over financial reporting of MSA Safety Incorporated also did not include an evaluation of the internal control over
financial reporting of Latchways, plc.
In our opinion, MSA Safety Incorporated maintained, in all material respects, effective internal control over financial reporting
as of December 31, 2015, based on the COSO criteria.
We also have audited, in accordance with the standards of the Public Company Accounting Oversight Board (United States), the
consolidated balance sheet of MSA Safety Incorporated as of December 31, 2015, and the related consolidated statements of
income, comprehensive income, cash flows, and changes in retained earnings and accumulated other comprehensive loss for the
year ended December 31, 2015 of MSA Safety Incorporated and our report dated February 29, 2016, expressed an unqualified
opinion thereon.
/s/ Ernst & Young LLP
Pittsburgh, Pennsylvania
February 29, 2016

38
2014 Report of Independent Registered Public Accounting Firm
To the Shareholders and Board of Directors of MSA Safety Incorporated:
In our opinion, the consolidated balance sheet as of December 31, 2014 and the related consolidated statements of income,
comprehensive income, cash flows, and changes in retained earnings and accumulated other comprehensive loss for each of two
years in the period ended December 31, 2014 present fairly, in all material respects, the financial position of MSA Safety
Incorporated and its subsidiaries at December 31, 2014, and the results of their operations and their cash flows for each of the
two years in the period ended December 31, 2014, in conformity with accounting principles generally accepted in the United
States of America. In addition, in our opinion, the financial statement schedule for each of the two years in the period ended
December 31, 2014 presents fairly, in all material respects, the information set forth therein when read in conjunction with the
related consolidated financial statements. These financial statements and financial statement schedule are the responsibility of
the Company's management. Our responsibility is to express an opinion on these financial statements and financial statement
schedule based on our audits. We conducted our audits of these statements in accordance with the standards of the Public
Company Accounting Oversight Board (United States). Those standards require that we plan and perform the audit to obtain
reasonable assurance about whether the financial statements are free of material misstatement. An audit includes examining, on
a test basis, evidence supporting the amounts and disclosures in the financial statements, assessing the accounting principles
used and significant estimates made by management, and evaluating the overall financial statement presentation. We believe
that our audits provide a reasonable basis for our opinion.
/s/ PricewaterhouseCoopers LLP
Pittsburgh, Pennsylvania
February 25, 2015, except for the effects of the change in presentation of deferred taxes, discussed in Note 1 and the effects of
the change in the composition of reportable segments discussed in Note 7, as to which the date is February 29, 2016.

39
MSA SAFETY INCORPORATED
CONSOLIDATED STATEMENT OF INCOME
Year ended December 31,
(In thousands, except per share amounts) 2015 2014 2013
Net sales $ 1,130,783 $ 1,133,885 $ 1,112,058
Other (loss) income, net (Note 15) (861 ) 2,765 (175 )
1,129,922 1,136,650 1,111,883
Costs and expenses
Cost of products sold 629,680 618,536 615,213
Selling, general and administrative 315,270 322,797 309,206
Research and development 48,630 48,247 45,858
Restructuring and other charges (Note 2) 12,258 8,515 5,344
Interest expense 10,854 9,851 10,677
Currency exchange losses, net 2,204 1,509 5,452
1,018,896 1,009,455 991,750
Income from continuing operations before income taxes 111,026 127,195 120,133
Provision for income taxes (Note 9) 44,407 41,044 35,145
Income from continuing operations 66,619 86,151 84,988
Income from discontinued operations (Note 20) 1,325 1,776 3,061
Net income 67,944 87,927 88,049
Net loss attributable to noncontrolling interests 2,863 579 198
Net income attributable to MSA Safety Incorporated $ 70,807 $ 88,506 $ 88,247
Amounts attributable to MSA Safety Incorporated common shareholders:
Income from continuing operations $ 69,590 $ 87,447 $ 85,858
Income from discontinued operations (Note 20) 1,217 1,059 2,389
Net income $ 70,807 $ 88,506 $ 88,247
Earnings per share attributable to MSA Safety Incorporated common shareholders (Note 8)
Basic
Income from continuing operations $ 1.86 $ 2.34 $ 2.31
Income from discontinued operations (Note 20) $ 0.03 $ 0.03 $ 0.06
Net income $ 1.89 $ 2.37 $ 2.37
Diluted
Income from continuing operations $ 1.84 $ 2.30 $ 2.28
Income from discontinued operations (Note 20) $ 0.03 $ 0.03 $ 0.06
Net income $ 1.87 $ 2.33 $ 2.34
The accompanying notes are an integral part of the consolidated financial statements.

40
MSA SAFETY INCORPORATED
CONSOLIDATED STATEMENT OF COMPREHENSIVE INCOME
Year ended December 31,
(In thousands) 2015 2014 2013
Net income $ 67,944 $ 87,927 $ 88,049
Foreign currency translation adjustments (Note 5) (49,067 ) (40,568 ) (7,281 )
Pension and post-retirement plan actuarial gains (losses), net of tax (Note 14) 6,181 (48,490 ) 54,951
Comprehensive net income (loss) 25,058 (1,131 ) 135,719
Comprehensive net loss attributable to noncontrolling interests 4,280 1,176 1,331
Comprehensive net income attributable to MSA Safety Incorporated $ 29,338 $ 45 $ 137,050
The accompanying notes are an integral part of the consolidated financial statements.

41
MSA SAFETY INCORPORATED
CONSOLIDATED BALANCE SHEET
December 31,
(In thousands, except share amounts) 2015 2014
Assets
Cash and cash equivalents $ 105,925 $ 105,998
Trade receivables, less allowance for doubtful accounts of $8,189 and $7,821 232,862 211,440
Inventories (Note 3) 125,849 122,954
Income taxes receivable 8,745 2,876
Prepaid expenses and other current assets (Note 17) 31,646 30,771
Total current assets 505,027 474,039
Property, plant, and equipment, net (Note 4) 155,839 151,352
Prepaid pension cost (Note 14) 62,072 75,017
Deferred tax assets (Note 9) 26,455 44,057
Goodwill (Note 12) 340,338 252,520
Intangible assets, net (Note 12) 90,068 31,323
Other noncurrent assets 245,019 236,484
Total assets $ 1,424,818 $ 1,264,792
Liabilities
Notes payable and current portion of long-term debt (Note 11) $ 6,668 $ 6,700
Accounts payable 68,206 70,210
Employees’ compensation 37,642 40,249
Insurance and product liability (Note 19) 57,718 47,456
Taxes on income (Note 9) 11,658 5,545
Other current liabilities 70,013 63,890
Total current liabilities 251,905 234,050
Long-term debt (Note 11) 459,959 245,000
Pensions and other employee benefits (Note 14) 156,160 174,598
Deferred tax liabilities (Note 9) 24,872 26,313
Other noncurrent liabilities (Note 19) 14,794 46,198
Total liabilities $ 907,690 $ 726,159
Commitments and contingencies (Note 19)
Shareholders' Equity
Preferred stock, 4 1/2% cumulative, $50 par value (Note 6) 3,569 3,569
Common stock, no par value (180,000,000 shares authorized; 62,081,391 shares issued; 2015 shares outstanding 37,372,474 and 37,448,310 shares outstanding 2014) 157,643
148,401
Treasury shares, at cost (Note 6) (295,070 ) (286,557 )
Accumulated other comprehensive loss (208,199 ) (166,730 )
Retained earnings 858,553 835,126
Total shareholders’ equity 516,496 533,809
Noncontrolling interests 632 4,824
Total shareholders’ equity 517,128 538,633
Total liabilities and shareholders’ equity $ 1,424,818 $ 1,264,792
The accompanying notes are an integral part of the consolidated financial statements.

42
MSA SAFETY INCORPORATED
CONSOLIDATED STATEMENT OF CASH FLOWS
Year ended December 31,
(In thousands) 2015 2014 2013
Operating Activities
Net income $ 67,944 $ 87,927 $ 88,049
Depreciation and amortization 31,684 29,921 30,764
Pension expense (Note 14) 11,955 4,836 12,268
Net gain from investing activities—asset disposals (Note 15) (1,745 ) (2,094 ) (436 )
Stock-based compensation (Note 10) 7,599 9,053 10,337
Asset Impairment Charges (Note 15) 4,946 — —
Deferred income tax provision (Note 9) (1,699 ) (5,388 ) (3,234 )
Other noncurrent assets and liabilities (45,859 ) (53,482 ) (18,162 )
Currency exchange losses, net 2,471 1,393 5,127
Excess tax benefit related to stock plans (Note 6) (596 ) (2,573 ) (2,246 )
Other, net (2,786 ) (5,168 ) 4,386
Operating cash flow before changes in certain working capital items 73,914 64,425 126,853
(Increase) in trade receivables (21,959 ) (23,480 ) (13,171 )
(Increase) in inventories (Note 3) (9,403 ) (600 ) (6,296 )
Increase in accounts payable and accrued liabilities 20,286 56,988 10,732
(Increase) decrease in income taxes receivable, prepaid expenses and other current assets (7,584 ) 9,698
(7,337 )
Changes in certain working capital items (18,660 ) 42,606 (16,072 )
Cash Flow From Operating Activities 55,254 107,031 110,781
Investing Activities
Capital expenditures (36,241 ) (33,583 ) (36,517 )
Property disposals 8,022 3,385 1,360
Acquistion of business, net of cash acquired (Note 13) (180,271 ) — —
Other investing — (500 ) —
Cash Flow From Investing Activities (208,490 ) (30,698 ) (35,157 )
Financing Activities
Proceeds from (payments on) short-term debt, net (Note 11) 5 (796 ) 662
Payments on long-term debt (Note 11) (291,525 ) (421,667 ) (306,766 )
Proceeds from long-term debt (Note 11) 510,456 406,000 295,100
Restricted cash 264 86 (2,790 )
Cash dividends paid (47,380 ) (45,586 ) (43,994 )
Distributions to noncontrolling interests — — (556 )
Company stock purchases (Note 6) (9,885 ) (5,654 ) (11,785 )
Exercise of stock options (Note 6) 1,930 6,926 9,643
Employee stock purchase plan 488 — —
Excess tax benefit related to stock plans (Note 6) 596 2,573 2,246
Cash Flow From Financing Activities 164,949 (58,118 ) (58,240 )
Effect of exchange rate changes on cash and equivalents (11,786 ) (8,482 ) (3,837 )
(Decrease) increase in cash and cash equivalents (73 ) 9,733 13,547
Beginning cash and cash equivalents 105,998 96,265 82,718
Ending cash and cash equivalents $ 105,925 $ 105,998 $ 96,265
Supplemental cash flow information:
Interest payments $ 10,818 $ 9,663 $ 10,884
Income tax payments 50,001 31,679 36,242
The accompanying notes are an integral part of the consolidated financial statements.
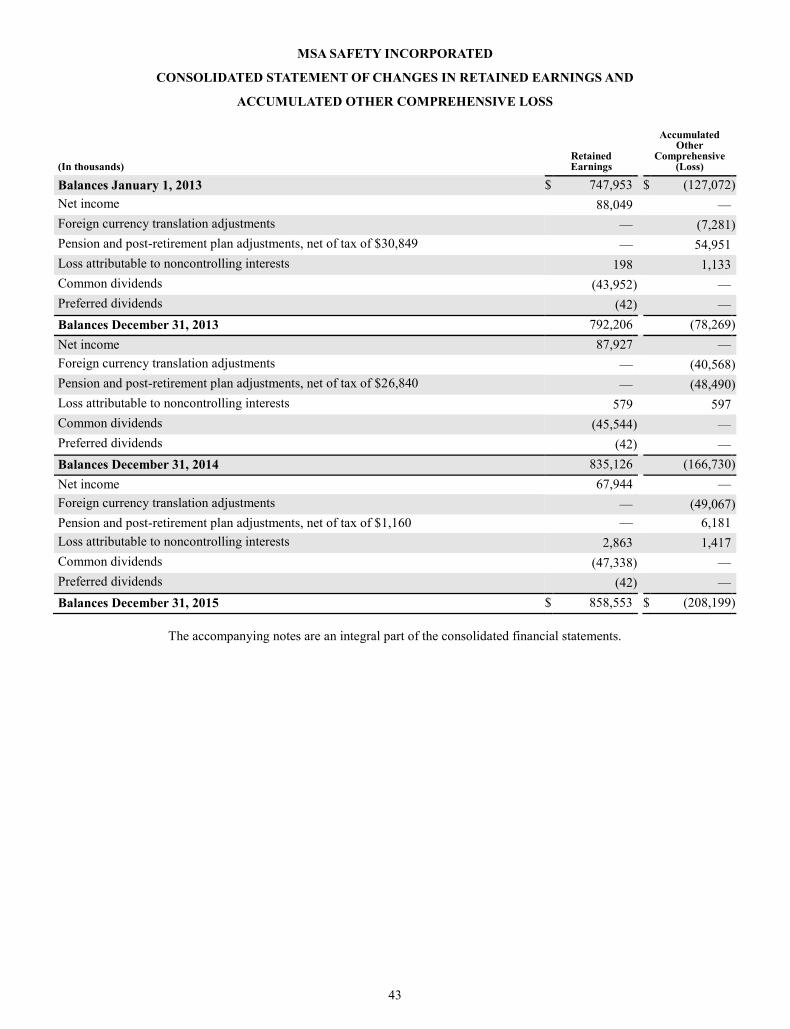
43
MSA SAFETY INCORPORATED
CONSOLIDATED STATEMENT OF CHANGES IN RETAINED EARNINGS AND
ACCUMULATED OTHER COMPREHENSIVE LOSS
(In thousands) Retained Earnings
Accumulated Other
Comprehensive (Loss)
Balances January 1, 2013 $ 747,953 $ (127,072 )
Net income 88,049 —
Foreign currency translation adjustments — (7,281 )
Pension and post-retirement plan adjustments, net of tax of $30,849 — 54,951
Loss attributable to noncontrolling interests 198 1,133
Common dividends (43,952 ) —
Preferred dividends (42 ) —
Balances December 31, 2013 792,206 (78,269 )
Net income 87,927 —
Foreign currency translation adjustments — (40,568 )
Pension and post-retirement plan adjustments, net of tax of $26,840 — (48,490 )
Loss attributable to noncontrolling interests 579 597
Common dividends (45,544 ) —
Preferred dividends (42 ) —
Balances December 31, 2014 835,126 (166,730 )
Net income 67,944 —
Foreign currency translation adjustments — (49,067 )
Pension and post-retirement plan adjustments, net of tax of $1,160 — 6,181
Loss attributable to noncontrolling interests 2,863 1,417
Common dividends (47,338 ) —
Preferred dividends (42 ) —
Balances December 31, 2015 $ 858,553 $ (208,199 )
The accompanying notes are an integral part of the consolidated financial statements.

44
MSA SAFETY INCORPORATED
NOTES TO CONSOLIDATED FINANCIAL STATEMENTS
Note 1—Significant Accounting Policies
Basis of Presentation—The Consolidated Financial Statements of MSA Safety Incorporated ("MSA" or "the Company")
are prepared in conformity with accounting principles generally accepted in the United States of America (GAAP) and require
management to make certain judgments, estimates, and assumptions. These may affect the reported amounts of assets and
liabilities and the disclosure of contingent assets and liabilities at the date of the consolidated financial statements. They also
may affect the reported amounts of revenues and expenses during the period. Actual results could differ from those estimates
upon subsequent resolution of identified matters.
Certain segment results in previously issued consolidated financial statements were recast to conform to the current period
presentation. Refer to Note 7 for further information regarding MSA's segment allocation methodology.
Principles of Consolidation—The consolidated financial statements include the accounts of the Company and all
subsidiaries. Intercompany accounts and transactions are eliminated.
Noncontrolling Interests—Noncontrolling interests reflect noncontrolling shareholders’ investments in certain
consolidated subsidiaries and their proportionate share of the income and accumulated other comprehensive income of those
subsidiaries.
Currency Translation—The functional currency of all significant non-U.S. subsidiaries is the local currency. Assets and
liabilities of these operations are translated at year-end exchange rates. Income statement accounts are translated using the
average exchange rates for the reporting period. Translation adjustments for these companies are reported as a component of
shareholders’ equity and are not included in income. Foreign currency transaction gains and losses are included in net income
for the reporting period.
Cash Equivalents—Cash equivalents include temporary deposits with financial institutions and highly liquid investments
with original maturities of 90 days or less.
Restricted Cash—Restricted cash, which is designated for use other than current operations, is included in prepaid
expenses and other current assets in the Consolidated Balance Sheet. Restricted cash balances were $2.4 million and $2.7
million at December 31, 2015 and December 31, 2014, respectively. These balances were used to support letter of credit
balances.
Inventories—Inventories are stated at the lower of cost or market. Most U.S. inventories are valued on the last-in, first-
out (LIFO) cost method. Other inventories are valued on the average cost method or at standard costs which approximate actual
costs. It is the Company’s general policy to write-down any inventory that is identified as obsolete and any inventory that has
aged or has not moved in more than twenty-four months.
Property and Depreciation—Property is recorded at cost. Depreciation is computed using straight-line and accelerated
methods over the estimated useful lives of the assets, generally as follows: buildings 20 to 40 years and machinery and
equipment 3 to 10 years. Expenditures for significant renewals and improvements are capitalized. Ordinary repairs and
maintenance are expensed as incurred. Gains or losses on property dispositions are included in other income and the cost and
related depreciation are removed from the accounts. Depreciation expense for the years ended December 31, 2015, 2014 and
2013 was $26.9 million, $26.2 million and $27.1 million, respectively. Properties, plants, and equipment are reviewed for
impairment whenever events or changes in circumstances indicate that the carrying amount of such assets may not be
recoverable. Recoverability of assets is determined by comparing the estimated undiscounted net cash flows of the operations
related to the assets to their carrying amount. An impairment loss would be recognized when the carrying amount of the assets
exceeds the estimated undiscounted net cash flows. The amount of the impairment loss to be recorded is calculated as the
excess of the carrying value of the assets over their fair value, with fair value determined using the best information available,
which generally is a discounted cash flow model.

45
Goodwill and Other Intangible Assets—Goodwill and Other Intangible assets are amortized on a straight-line basis over
their useful lives. Intangible assets are reviewed for possible impairment whenever circumstances change such that the recorded
value of the asset may not be recoverable. Goodwill is not amortized, but is subject to impairment assessments. We test the
goodwill of each of our reporting units for impairment at least annually. The annual goodwill impairment assessment has
historically been performed as of September 30 each year. The Company changed its annual impairment assessment date to
October 1 as discussed below. All goodwill is assigned to reporting units. For this purpose, we consider our operating segments
to be our reporting units. We test goodwill for impairment by either performing a qualitative evaluation or a two-step
quantitative test. The qualitative evaluation is an assessment of various factors to determine whether it is more likely than not
that the fair value of a reporting unit is less than its carrying value, including goodwill.
Factors considered as part of the qualitative assessment include entity-specific industry, market and general economic
conditions. We may elect to bypass the qualitative assessment for some or all of our reporting units and perform a two-step
quantitative test. Quantitative testing involves estimating a reporting unit’s fair value. We estimate reporting unit fair value
using discounted cash flow (DCF) and market approach methodologies as we believe both are equally important indicators of
fair value. A number of significant assumptions and estimates are involved in the application of the DCF model, including sales
volumes and prices, costs to produce, tax rates, capital spending, discount rates, and working capital changes. Cash flow
forecasts are generally based on approved business unit operating plans for the early years and historical relationships in later
years. The betas used in calculating the individual reporting units’ weighted average cost of capital (WACC) rate are estimated
for each reporting unit based on peer data. The market approach methodology measures value through an analysis of peer
companies. The analysis entails measuring the multiples of EBITDA at which peer companies are trading.
In the event the estimated fair value of a reporting unit per the weighted average of the DCF and market approach models
is less than the carrying value, additional analysis would be required. The additional analysis would compare the carrying
amount of the reporting unit’s goodwill with the implied fair value of that goodwill, which may involve the use of valuation
experts. The implied fair value of goodwill is the excess of the fair value of the reporting unit over the fair value amounts
assigned to all of the assets and liabilities of that unit as if the reporting unit had been acquired in a business combination and
the fair value of the reporting unit represented the purchase price. If the carrying value of goodwill exceeds its implied fair
value, an impairment loss equal to such excess would be recognized, which could significantly and adversely impact reported
results of operations and shareholders’ equity. There has been no impairment of our goodwill as of December 31, 2015.
During the quarter ended December 31, 2015, the Company voluntarily changed the date of its annual goodwill
impairment testing from the last day of the third fiscal quarter to the first day of the fourth fiscal quarter. This voluntary change
is preferable under the circumstances as it provides the Company with additional time to complete its annual goodwill
impairment testing in advance of its year-end reporting and results in better alignment with the timing of the Company’s long
range planning and forecasting process. The voluntary change in accounting principle related to the annual testing date will not
delay, accelerate or avoid an impairment charge. The change will be applied prospectively.
Revenue Recognition—Revenue from the sale of products is recognized when title, ownership and the risk of loss have
transferred to the customer, which generally occurs either when product is shipped to the customer or, in the case of most U.S.
distributor customers, when product is delivered to the customer’s delivery site. We establish our shipping terms according to
local practice and market characteristics. We do not ship product unless we have an order or other documentation authorizing
shipment to our customers. We make appropriate provisions for uncollectible accounts receivable and product returns, both of
which have historically been insignificant in relation to our net sales. Certain distributor customers receive price rebates based
on their level of purchases and other performance criteria that are documented in established distributor programs. These
rebates are accrued as a reduction of net sales as they are earned by the customer.
Shipping and Handling—Shipping and handling expenses for products sold to customers are charged to cost of products
sold as incurred. Amounts billed to customers for shipping and handling are included in net sales.
Product Warranties—Estimated expenses related to product warranties and additional service actions are charged to cost
of products sold in the period in which the related revenue is recognized or when significant product quality issues are
identified.
Research and Development—Research and development costs are expensed as incurred.

46
Income Taxes—Deferred income taxes are provided for temporary differences between financial and tax reporting.
Deferred tax assets and liabilities are measured using enacted tax rates in effect for the year in which those temporary
differences are expected to be recovered or settled. If it is more likely than not that some portion or all of a deferred tax asset
will not be realized, a valuation allowance is recognized. We record tax benefits related to uncertain tax positions taken or
expected to be taken on a tax return when such benefits meet a more likely than not threshold. We recognize interest related to
unrecognized tax benefits in interest expense and penalties in operating expenses. No provision is made for possible U.S. taxes
on the undistributed earnings of foreign subsidiaries that are considered to be reinvested indefinitely.
Stock-Based Compensation—We account for stock-based compensation in accordance with the FASB guidance on
share-based payment, which requires that we recognize compensation expense for employee and non-employee director stock-
based compensation based on the grant date fair value. Except for retirement-eligible participants, for whom there is no
requisite service period, this expense is recognized ratably over the requisite service periods following the date of grant. For
retirement-eligible participants, this expense is recognized at the grant date.
Derivative Instruments—We may use derivative instruments to minimize the effects of changes in currency exchange
rates. We do not enter into derivative transactions for speculative purposes and do not hold derivative instruments for trading
purposes. Changes in the fair value of derivative instruments designated as fair value hedges are recorded in the balance sheet
as adjustments to the underlying hedged asset or liability. Changes in the fair value of derivative instruments that do not qualify
for hedge accounting treatment are recognized in the income statement as currency exchange (income) loss in the current
period.
Commitments and Contingencies—For asserted claims and assessments, liabilities are recorded when an unfavorable
outcome of a matter is deemed to be probable and the loss is reasonably estimable. Management determines the likelihood of an
unfavorable outcome based on many factors such as the nature of the matter, available defenses and case strategy, progress of
the matter, views and opinions of legal counsel and other advisors, applicability and success of appeals processes, and the
outcome of similar historical matters, among others. Once an unfavorable outcome is deemed probable, management weighs
the probability of estimated losses, and the most reasonable loss estimate is recorded. If an unfavorable outcome of a matter is
deemed to be reasonably possible, then the matter is disclosed and no liability is recorded. With respect to unasserted claims or
assessments, management must first determine that the probability that an assertion will be made is likely, then, a determination
as to the likelihood of an unfavorable outcome and the ability to reasonably estimate the potential loss is made. Legal matters
are reviewed on a continuous basis to determine if there has been a change in management’s judgment regarding the likelihood
of an unfavorable outcome or the estimate of a potential loss. Please refer to Note 19 Contingencies for further details on
product liability related matters.
Discontinued Operations and Assets Held For Sale—For those businesses where management has committed to a plan
to divest, each business is valued at the lower of its carrying amount or estimated fair value less cost to sell. If the carrying
amount of the business exceeds its estimated fair value, an impairment loss is recognized. Fair value is estimated using accepted
valuation techniques such as a discounted cash flow model, valuations performed by third parties, earnings multiples, or
indicative bids, when available. A number of significant estimates and assumptions are involved in the application of these
techniques, including the forecasting of markets and market share, sales volumes and prices, costs and expenses, and multiple
other factors. Management considers historical experience and all available information at the time the estimates are made;
however, the fair value that is ultimately realized upon the divestiture of a business may differ from the estimated fair value
reflected in the Consolidated Financial Statements. Depreciation and amortization expense is not recorded on assets of a
business to be divested once they are classified as held for sale.
For businesses classified as discontinued operations, the results of operations are reclassified from their historical
presentation to discontinued operations on the Consolidated Statement of Income, for all periods presented. The gains or losses
associated with these divested businesses are recorded in discontinued operations on the Consolidated Statement of Income.
Additionally, segment information does not include the operating results of businesses classified as discontinued operations for
all periods presented. Management does not expect any continuing involvement with these businesses following their
divestiture, and these businesses are expected to be disposed of within one year.
Recently Adopted and Recently Issued Accounting Standards—In April 2014, the FASB issued ASU 2014-08,
Reporting Discontinued Operations and Disclosures of Disposals of an Entity. This ASU amends the definition of a
discontinued operation to include a disposal of a component or group of components that is disposed of or is classified as held
for sale and represents a strategic shift that has (or will have) a major effect on an entity's operations and financial results. This
ASU was adopted on January 1, 2015. The adoption of this ASU may have a material effect on our consolidated financial
statements in the event that we were to divest of a component that meets the definition of discontinued operations.

47
In May 2014, the FASB issued ASU 2014-09, Revenue with Contracts from Customers. This ASU clarifies the principles
for recognizing revenue such that an entity should recognize revenue to depict the transfer of promised goods or services to
customers in an amount that reflects the consideration to which the entity expects to be entitled in exchange for those goods or
services. In August 2015, the FASB issued ASU 2015-15, Revenue with Contracts from Customers. This ASU defers the
effective date of the standard until January 1, 2018. The Company is currently evaluating the impact that the adoption of these
ASUs will have on the consolidated financial statements.
In June 2014, the FASB issued ASU 2014-12, Accounting for Share-Based Payments When the Terms of an Award
Provide That a Performance Target Could be Achieved after the Requisite Service Period. This ASU clarifies the accounting
treatment for share based payment awards that contain performance targets. This ASU will be effective beginning in 2016. The
adoption of this ASU is not expected to have a material effect on our consolidated financial statements.
In August 2014, the FASB issued ASU 2014-15, Presentation of Financial Statements - Going Concern. This ASU
clarifies management's responsibility to evaluate whether there is a substantial doubt about the entity's ability to continue as a
going concern and provides guidance for related footnote disclosures. This ASU will be effective beginning in 2016. The
adoption of this ASU is not expected to have a material effect on our consolidated financial statements.
In January 2015, the FASB issued ASU 2015-01, Income Statement - Extraordinary and Unusual Items. This ASU
eliminates the requirement to separately present and disclose extraordinary and unusual items in the financial statements. This
ASU will be effective beginning in 2016. The adoption of this ASU is not expected to have a material effect on our consolidated
financial statements.
In February 2015, the FASB issued ASU 2015-02, Amendments to the Consolidation Analysis. This ASU changes the
analysis that an entity must perform to determine whether it should consolidate certain types of legal entities. This ASU will be
effective beginning in 2016. The adoption of this ASU is not expected to have a material effect on our consolidated financial
statements.
In April 2015, the FASB issued ASU 2015-03, Imputation of Interest - Simplifying the Presentation of Debt Issuance
Costs. This ASU simplifies the presentation of debt issuance costs and requires that debt issuance costs related to a recognized
debt liability be presented in the balance sheet as a direct deduction from the carrying amount of that debt liability. In August
2015, the FASB issued ASU 2015-15, Imputation of Interest - Simplifying the Presentation of Debt Issuance Costs. This ASU
simplifies the presentation of debt issuance costs for line of credit arrangements. Both ASUs will be effective beginning in
2016. The adoption of these ASU is not expected to have a material effect on our consolidated financial statements.
In April 2015, the FASB issued ASU 2015-04, Retirement Benefits - Practical Expedient for the Measurement Date of an
Employer's Defined Benefit Obligation and Plan Assets. This ASU allows entities with a fiscal year end that does not coincide
with a month end to use the closest month end for measurement purposes. This ASU also allows entities that have a significant
event in an interim period that calls for a remeasurement of defined benefit plan assets and obligations to use the month end
date that is closest to the date of the significant event. This ASU will be effective beginning in 2016. The adoption of this ASU
is not expected to have a material effect on our consolidated financial statements.
In April 2015, the FASB issued ASU 2015-05, Goodwill and Other Internal Use Software - Customer's Accounting for
Fees Paid in a Cloud Computing Arrangement. This ASU clarifies when entities should account for fees paid in a cloud
computing arrangement as a software license or service contract. This ASU will be effective beginning in 2016. The adoption of
this ASU is not expected to have a material effect on our consolidated financial statements.
In July 2015, the FASB issued ASU 2015-11, Simplifying the Measurement of Inventory. This ASU requires inventory to
be measured at the lower of cost and net realizable value. This ASU applies to inventory measured using the first-in, first-out
(FIFO) or average cost methods only. This ASU will be effective beginning in 2017. The adoption of this ASU is not expected
to have a material effect on our consolidated financial statements.
In July 2015, the FASB issued ASU 2015-12, Plan Accounting: Defined Benefit Pension Plans (Topic 960), Defined
Contribution Pension Plans (Topic 962), Health and Welfare Benefit Plans (Topic 965). This ASU simplifies complexities
within employee benefit plan accounting including Fully Benefit-Responsive Investment Contracts, Plan Investment
Disclosures, and the Measurement Date Practical Expedient. This ASU will be effective beginning in 2016. The adoption of this
ASU is not expected to have a material effect on our consolidated financial statements.

48
In September 2015, the FASB issued ASU 2015-16, Simplifying the Accounting for Measurement-Period Adjustments.
This ASU simplifies the accounting for adjustments made to provisional amounts recognized in a business combination. The
amendments in this Update eliminate the requirement to retrospectively account for those adjustments. This ASU will be
effective beginning in 2016. MSA elected to early adopt this standard for the period ended December 31, 2015. The adoption of
this ASU could have a material effect on our consolidated financial statements to the extent that measurement-period
adjustments for business combinations are identified.
In November 2015, the FASB issued ASU 2015-17, Balance Sheet Classification of Deferred Taxes. This ASU simplifies
the presentation of deferred income taxes. The amendments in this Update require that deferred tax liabilities and assets be
classified as noncurrent in a classified statement of financial position. This ASU is effective for financial statements issued for
annual periods beginning after December 15, 2016, and interim periods within those annual periods. Early adoption is
permitted. MSA elected to early adopt this standard for the period ended December 31, 2015. We elected to apply the
amendments in this update retrospectively. As such, we have reclassified $23.8 million and $7.0 thousand dollars previously
reported in the 2014 Form 10-K as current deferred tax assets and other current liabilities on the Consolidated Balance Sheet,
respectively, to non-current deferred tax assets and non-current deferred tax liabilities on the Consolidated Balance Sheet as of
December 31, 2014.
In February 2016, the FASB issued ASU 2016-02, Leases. This ASU requires lessees to record a right of use asset and a
liability for virtually all leases. This ASU will be effective beginning in 2019. While the adoption of this ASU is expected to
have a material effect on our consolidated balance sheet, the Company continues to evaluate the impact that the adoption of this
ASU will have on the consolidated financial statements.
Note 2—Restructuring and Other Charges
During the years ended December 31, 2015, 2014 and 2013, we recorded restructuring charges of $12.3 million, $8.5
million, and $5.3 million, respectively. These charges were primarily related to reorganization activities.
In accordance with ongoing initiatives to right size our operations, headcount was reduced by 216 in 2015. Headcount
was reduced by 151 in the International segment, 34 in the European segment, 19 in the North American segment, and 12 in the
Corporate segment.
For the year ended December 31, 2015, International segment charges of $5.4 million were primarily related to staff
reductions in Australia, Japan, and China. European segment restructuring charges of $2.0 million related to a one-time benefit
for employees impacted by our European Principal Operating Company. The remaining $1.3 million of restructuring charges in
the European segment were primarily related to staff reductions in Central and Southern Europe. North American charges of
$2.0 million and Corporate segment charges of $1.6 million were primarily related to staff reductions. While the Company
made significant progress in optimizing the cost structure at the end of 2015, the Company is actively evaluating additional cost
reduction opportunities in 2016.
For the year ended December 31, 2014, European segment charges of $4.8 million were primarily related to severance
from staff reductions in Central and Southern Europe as well as reorganization costs in Central Europe. International segment
charges of $3.7 million for the year ended December 31, 2014 were primarily related to staff reductions in South Africa,
Australia, and Brazil and asset disposals in Australia and South Africa, as the Company continued to focus manufacturing
efforts in line with our core products and to respond to changing economic conditions.
For the year ended December 31, 2013, European segment charges of $3.0 million were primarily related to staff
reductions in Germany and Netherlands. International segment charges of $2.3 million for the year ended December 31, 2013
were primarily related to staff reductions in Australia and South Africa.

49
Activity and reserve balances for restructuring charges by segment were as follows:
(in millions) North
America Europe International Corporate Total
Reserve balances at January 1, 2013 $ 0.3 $ 2.5 $ 0.2 $ — $ 3.0
Restructuring charges — 3.0 2.3 — 5.3
Cash payments (0.3 ) (3.8 ) (2.5 ) — (6.6 )
Reserve balances at December 31, 2013 $ — $ 1.7 $ — $ — $ 1.7
Restructuring charges — 4.8 3.7 — 8.5
Asset disposals — (0.4 ) (1.7 ) — (2.1 )
Cash payments — (3.5 ) (1.8 ) — (5.3 )
Reserve balances at December 31, 2014 $ — $ 2.6 $ 0.2 $ — $ 2.8
Restructuring charges 2.0 3.3 5.4 1.6 12.3
Cash payments (0.9 ) (1.7 ) (3.9 ) (0.5 ) (7.0 )
Reserve balances at December 31, 2015 $ 1.1 $ 4.2 $ 1.7 $ 1.1 $ 8.1
Note 3—Inventories
The following table sets forth the components of inventory:
December 31,
(In thousands) 2015 2014
Finished products $ 74,929 $ 89,595
Work in process 8,979 $ 8,942
Raw materials and supplies 85,643 68,885
Inventories at current cost 169,551 167,422
Less: LIFO valuation (43,702 ) (44,468 )
Total inventories 125,849 122,954
Inventories stated on the LIFO basis represent 23% and 21% of total inventories at December 31, 2015 and 2014,
respectively.
Reductions in certain inventory quantities during the years ended December 31, 2015 and 2014 resulted in liquidations of
LIFO inventories carried at lower costs prevailing in prior years. The effect of LIFO liquidations during 2015 reduced cost of
sales by $1.4 million and increased net income by $0.9 million. The effect of LIFO liquidations during 2014 were
inconsequential to changes in cost of sales and net income.
Note 4—Property, Plant, and Equipment
The following table sets forth the components of property, plant and equipment:
December 31,
(In thousands) 2015 2014
Land $ 2,929 $ 3,573
Buildings 114,324 110,144
Machinery and equipment 345,064 335,318
Construction in progress 12,451 17,327
Total 474,768 466,362
Less accumulated depreciation (318,929 ) (315,010 )
Net property 155,839 151,352

50
Note 5—Reclassifications Out of Accumulated Other Comprehensive Loss
MSA Safety Incorporated Noncontrolling Interests
(In thousands) 2015 2014 2013 2015 2014 2013
Pension and other post-retirement benefits
Balance at beginning of period $ (125,570 ) $ (77,080 ) $ (132,031 ) $ — $ — $ —
Unrecognized net actuarial (losses) gains (8,002 ) (84,495 ) 72,008 — — —
Unrecognized prior service (cost) credit (604 ) 302 239 — — —
Tax benefit (expense) 4,173 29,832 (25,783 ) — — —
Total other comprehensive (loss) income before reclassifications, net of tax
(4,433 ) (54,361 ) 46,464
—
—
—
Amounts reclassified from accumulated other comprehensive loss:
Amortization of prior service cost (268 ) (251 ) (322 ) — — —
Recognized net actuarial losses 16,215 9,114 13,875 — — —
Tax benefit (5,333 ) (2,992 ) (5,066 ) — — —
Total amount reclassified from accumulated other comprehensive loss, net of tax
10,614
5,871
8,487
—
—
—
Total other comprehensive income (loss) 6,181 (48,490 ) 54,951
Balance at end of period $ (119,389 ) $ (125,570 ) $ (77,080 ) $ — $ — $ —
Foreign currency translation
Balance at beginning of period $ (41,160 ) $ (1,189 ) $ 4,959 $ (2,199 ) $ (1,602 ) $ (469 )
Foreign currency translation adjustments (47,650 ) (39,971 ) (6,148 ) (1,417 ) (597 ) (1,133 )
Balance at end of period $ (88,810 ) $ (41,160 ) $ (1,189 ) $ (3,616 ) $ (2,199 ) $ (1,602 )
The reclassifications out of accumulated other comprehensive loss are included in the computation of net periodic
pension and other post-retirement benefit costs (see Note 14—Pensions and Other Post-Retirement Benefits).
Note 6—Capital Stock
Preferred Stock - The Company has authorized 100,000 shares of $50 par value 4.5% cumulative preferred nonvoting
stock which is callable at $52.50. There are 71,340 shares issued and 52,878 shares held in treasury at December 31, 2015.
There were 33 shares of preferred stock repurchased and subsequently canceled during 2015. The Treasury shares at cost line of
the Consolidated Balance Sheet includes $1.8 million related to preferred stock. There were no treasury purchases of preferred
stock during the years ended December 31, 2014 or 2013. The Company has also authorized 1,000,000 shares of $10 par value
second cumulative preferred voting stock. No shares have been issued as of December 31, 2015 or 2014.

51
Common Stock - The Company has authorized 180,000,000 shares of no par value common stock. There were
37,372,474 and 37,448,310 shares outstanding at December 31, 2015 and December 31, 2014, respectively. Common stock
activity is summarized as follows:
Shares Dollars
(Dollars in thousands) Issued
Stock Compensation
Trust Treasury Common
Stock
Stock Compensation
Trust Treasury
Cost
Balances January 1, 2013 62,081,391 (745,430 ) (24,328,162 ) $ 112,135 $ (3,891 ) $ (267,987 )
Restricted stock awards — 96,686 — (505 ) 505 —
Restricted stock expense — — — 4,244 — —
Restricted stock forfeitures — — (7,365 ) (115 ) — —
Stock options exercised — 277,687 — 8,194 1,449 —
Stock option expense — — — 2,825 — —
Performance stock issued — 67,389 — (352 ) 352 —
Performance stock expense — — — 3,383 — —
Tax benefit related to stock plans — — — 2,246 — —
Treasury shares purchased for stock compensation programs —
—
(240,097 ) —
—
(11,785 )
Balances December 31, 2013 62,081,391 (303,668 ) (24,575,624 ) 132,055 (1,585 ) (279,772 )
Restricted stock awards — 72,291 13,936 (538 ) 377 161
Restricted stock expense — — — 4,372 — —
Restricted stock forfeitures — — (4,078 ) (346 ) — —
Stock options exercised — 150,962 39,781 5,678 788 460
Stock option expense — — — 2,355 — —
Performance stock issued — 80,415 — (420 ) 420 —
Performance stock expense — — — 2,705 — —
Performance stock forfeitures — — — (33 ) — —
Tax benefit related to stock plans — — — 2,573 — —
Treasury shares purchased for stock compensation programs —
—
(107,096 ) —
—
(5,654 )
Balances December 31, 2014 62,081,391 — (24,633,081 ) 148,401 — (284,805 )
Restricted stock awards — — 34,624 (404 ) — 404
Restricted stock expense — — — 3,461 — —
Restricted stock forfeitures — — (18,468 ) (426 ) — —
Stock options exercised — — 52,708 1,714 — 216
Stock option expense — — 2,572 — —
Stock option forfeitures — — — (118 ) — —
Performance stock issued — — 52,839 (616 ) — 616
Performance stock expense — — — 2,265 — —
Performance stock forfeitures — — — (155 ) — —
Employee stock purchase plan — — 11,517 352 — 136
Tax benefit related to stock plans — — — 596 — —
Treasury shares purchased for stock compensation programs —
—
(59,056 ) —
—
(2,781 )
Share repurchase program — — (150,000 ) — — (7,104 )
Balances December 31, 2015 62,081,391 — (24,708,917 ) $ 157,642 $ — $ (293,318 )

52
The Mine Safety Appliances Company Stock Compensation Trust was established to provide shares for certain benefit
plans, including the management and non-employee directors’ equity incentive plans. Shares held by the Stock Compensation
Trust, and the corresponding cost of those shares, are reported as a reduction of common shares issued. Differences between the
cost of the shares held by the Stock Compensation Trust and the market value of shares released for stock-related benefits are
reflected in common stock issued. The Company began issuing Treasury Shares for all Board of Director share based benefit
plans in April 2014. The Company subsequently began issuing Treasury Shares for all share based benefit plans when the stock
compensation trust was depleted in September 2014. Shares are issued from Treasury at the average Treasury Share cost on the
date of the transaction.
On May 12, 2015, the Board of Directors adopted a new stock repurchase program replacing the existing program. The
new program authorizes up to $100 million to repurchase MSA common stock in the open market and in private transactions.
The share purchase program has no expiration date. The maximum shares that may be purchased is calculated based on the
dollars remaining under the program and the respective month-end closing share price. We repurchased 150,000 shares since
the program was approved in May. We do not have any other share purchase programs.
Note 7—Segment Information
We are organized into seven geographic operating segments based on management responsibilities. The operating
segments have been aggregated (based on economic similarities, the nature of their products, end-user markets and methods of
distribution) into four reportable segments: North America, Europe, International, and Corporate.
The Corporate segment was established on January 1, 2015 to reflect the activities of centralized functions in our
corporate headquarters and to capture results in a manner that the chief operating decision maker reviews. The corporate
segment primarily consists of general and administrative expenses incurred in our corporate headquarters, costs associated with
corporate development initiatives, legal expense, interest expense, foreign exchange gains or losses, and other centrally-
managed costs. Additionally, effective January 1, 2015, we changed the allocation methodology applied to research and
development expense. The 2014 and 2013 segment results have been recast to conform with current period presentation.
The Company's sales are allocated to each country based primarily on the destination of the end-customer.
Reportable segment information is presented in the following table:

53
(In thousands) North
America Europe International Corporate Reconciling
Items Consolidated
Totals
2015
Sales to external customers $ 608,983 $ 293,156 $ 228,644 $ — $ — $ 1,130,783
Intercompany sales 133,355 207,357 18,831 — (359,543 ) —
Net income:
Continuing operations 87,092 6,843 10,137 (33,218 ) (1,264 ) 69,590
Discontinued operations — — 1,217 — — 1,217
Total assets 820,960 412,144 175,449 16,362 (97 ) 1,424,818
Interest income 619 60 840 6 — 1,525
Interest expense — — — 10,854 — 10,854
Noncash items:
Depreciation and amortization 20,048 7,737 3,899 — — 31,684
Pension expense (3,759 ) (7,527 ) (669 ) — — (11,955 )
Income tax provision 45,849 14,213 4,046 (19,804 ) 103 44,407
Capital expenditures 20,071 10,727 5,443 — — 36,241
Net property 89,418 41,922 24,498 1 — 155,839
2014
Sales to external customers 547,739 321,618 264,528 — — 1,133,885
Intercompany sales 116,795 113,914 18,449 — (249,158 ) —
Net income:
Continuing operations 77,687 22,808 16,977 (30,324 ) 299 87,447
Discontinued operations — — 1,059 — — 1,059
Total assets 819,095 236,801 188,360 20,865 (329 ) 1,264,792
Interest income 995 111 711 5 — 1,822
Interest expense — — — 9,851 — 9,851
Noncash items:
Depreciation and amortization 18,635 6,357 4,929 — — 29,921
Pension income (expense) 1,977 (6,234 ) (579 ) — — (4,836 )
Income tax provision 40,919 9,452 7,276 (15,972 ) (631 ) 41,044
Capital expenditures 18,377 10,859 4,347 — — 33,583
Net property 86,718 32,892 31,741 1 — 151,352
2013
Sales to external customers 533,161 293,092 285,805 — — 1,112,058
Intercompany sales 120,952 98,491 22,136 — (241,579 ) —
Net income:
Continuing operations 68,181 22,002 27,900 (31,962 ) (263 ) 85,858
Discontinued operations — — 2,389 — — 2,389
Total assets 764,411 258,057 192,754 18,419 629 1,234,270
Interest income 243 90 809 — — 1,142
Interest expense — — — 10,677 — 10,677
Noncash items:
Depreciation and amortization 19,639 5,357 5,768 — — 30,764
Pension expense (4,765 ) (6,328 ) (1,175 ) — — (12,268 )
Income tax provision 34,347 7,334 9,300 (16,101 ) 265 35,145
Capital expenditures 17,887 11,833 6,797 — — 36,517
Net property 84,104 33,162 35,488 1 — 152,755

54
Reconciling items consist primarily of intercompany eliminations and items not directly attributable to operating segments
Geographic information on sales to external customers, based on country of origin:
(In thousands) 2015 2014 2013
United States $ 593,539 $ 530,845 $ 528,178
Other 537,244 603,040 583,880
Total $ 1,130,783 $ 1,133,885 $ 1,112,058
Geographic information on net property, based on country of origin:
(In thousands) 2015 2014 2013
United States $ 88,368 $ 85,247 $ 82,274
China 13,504 15,128 16,010
Germany 7,596 17,654 16,882
Other 46,371 33,323 37,589
Total $ 155,839 $ 151,352 $ 152,755
The percentage of total sales by product group were as follows:
2015 2014 2013
Breathing Apparatus 27 % 19 % 21 %
Fixed Gas and Flame Detection 21 % 23 % 22 %
Portable Gas Detection 13 % 15 % 14 %
Head Protection 11 % 13 % 13 %
Fire & Rescue Helmets 5 % 5 % 5 %
Fall Protection 5 % 4 % 4 %
Other 18 % 21 % 21 %

55
Note 8—Earnings per Share
Basic earnings per share is computed by dividing net income, after the deduction of preferred stock dividends and
undistributed earnings allocated to participating securities, by the weighted average number of common shares outstanding
during the period. Diluted earnings per share assumes the issuance of common stock for all potentially dilutive share
equivalents outstanding not classified as participating securities. Participating securities are defined as unvested stock-based
payment awards that contain nonforfeitable rights to dividends.
(In thousands, except per share amounts) 2015 2014 2013
Net income attributable to continuing operations $ 69,590 $ 87,447 $ 85,858
Preferred stock dividends (41 ) (41 ) (41 )
Income from continuing operations available to common equity 69,549 87,406 85,817
Dividends and undistributed earnings allocated to participating securities (192 ) (546 ) (643 )
Income from continuing operations available to common shareholders 69,357 86,860 85,174
Net income attributable to discontinued operations $ 1,217 $ 1,059 $ 2,389
Preferred stock dividends (1 ) (1 ) (1 )
Income from discontinued operations available to common equity 1,216 1,058 2,388
Dividends and undistributed earnings allocated to participating securities (3 ) (7 ) (18 )
Income from discontinued operations available to common shareholders 1,213 1,051 2,370
Basic weighted-average shares outstanding 37,293 37,138 36,868
Stock options and other stock compensation 417 590 582
Diluted weighted-average shares outstanding 37,710 37,728 37,450
Antidilutive stock options 658 — 15
Earnings per share attributable to continuing operations:
Basic $1.86 $2.34 $2.31
Diluted $1.84 $2.30 $2.28
Earnings per share attributable to discontinued operations:
Basic $0.03 $0.03 $0.06
Diluted
$0.03 $0.03 $0.06

56
Note 9—Income Taxes
(In thousands) 2015 2014 2013
Components of income before income taxes*
U.S. income $ 60,753 $ 58,209 $ 48,621
Non-U.S. income 50,273 68,986 71,512
Income before income taxes $ 111,026 $ 127,195 $ 120,133
Provision for income taxes*
Current
Federal $ 21,253 $ 23,659 $ 18,656
State 2,389 1,349 1,492
Non-U.S. 22,979 21,101 18,453
Total current provision 46,621 46,109 38,601
Deferred
Federal 3,813 (3,650 ) (3,582 )
State (213 ) 317 (483 )
Non-U.S. (5,814 ) (1,732 ) 609
Total deferred provision (2,214 ) (5,065 ) (3,456 )
Provision for income taxes $ 44,407 $ 41,044 $ 35,145
*The components of income before income taxes and the provision for income taxes relate to continuing operations.
MSA’s European reorganization continued during 2015. The reorganization is designed to drive optimal performance by
aligning certain strategic planning and decision making into a single location enabled by a common IT platform. During 2015,
the Company incurred $7.7 million of charges associated with exit taxes related to our European reorganization.
Included in discontinued operations is tax expense of $0.6 million in 2015, $0.6 million in 2014 and $1.4 million in 2013.
Cash flows from operations in the Consolidated Statement of Cash Flows include a deferred income tax provision
(benefit) from discontinued operations of $0.5 million, $(0.3) million and $0.2 million in 2015, 2014 and 2013, respectively.
Reconciliation of the U.S. federal income tax rates for continuing operations to our effective tax rate:
2015 2014 2013
U.S. federal income tax rate 35.0 % 35.0 % 35.0 %
State income taxes—U.S. 1.3 0.8 0.6
Taxes on non-U.S. income (2.1 ) (2.2 ) (4.5 )
Taxes on non-U.S. income - European reorganization 6.9 — —
Research and development credit (1.1 ) (0.7 ) (1.5 )
Manufacturing deduction credit (1.6 ) (1.0 ) (1.1 )
Valuation allowances 1.7 (0.6 ) 0.5
Other (0.1 ) 1.0 0.3
Effective income tax rate 40.0 % 32.3 % 29.3 %

57
Components of deferred tax assets and liabilities:
December 31,
(In thousands) 2015 2014
Deferred tax assets
Book expenses capitalized for tax $ 5,476 $ 6,336
Post-retirement benefits 17,838 23,335
Inventory reserves 2,487 3,147
Vacation allowances 816 932
Net operating losses and tax credit carryforwards 7,394 7,479
Post employment benefits 3,488 2,382
Foreign tax credit carryforwards 8,266 11,231
Stock options 10,587 10,157
Product Liability 6,253 3,918
Basis of capital assets 912 1,009
Warranties 3,666 3,210
Reserve for doubtful accounts 2,320 1,948
Accrued payroll 4,172 4,319
Other 7,782 5,801
Total deferred tax assets 81,457 85,204
Valuation allowances (5,153 ) (3,763 )
Net deferred tax assets 76,304 81,441
Deferred tax liabilities
Property, plant and equipment (10,938 ) (9,269 )
Pension (18,947 ) (22,195 )
Intangibles (43,789 ) (30,180 )
Other (1,047 ) (2,053 )
Total deferred tax liabilities (74,721 ) (63,697 )
Net deferred taxes $ 1,583 $ 17,744
At December 31, 2015, we had net operating loss carryforwards of approximately $45.0 million, all of which are in non-
U.S. tax jurisdictions. Net operating loss carryforwards without a valuation allowance of $0.1 million will expire in 2020. The
remainder either have a valuation allowance or may be carried forward for a period of at least six years. The change in
valuation allowance for the year of $1.4 million is primarily due to our inability to recognize deferred tax assets on certain
foreign entities that continue to generate losses.
No deferred U.S. income taxes have been provided on undistributed earnings of non-U.S. subsidiaries, which amounted
to $408.5 million as of December 31, 2015. These earnings are considered to be reinvested for an indefinite period of time.
Because we currently do not have any plans to repatriate these funds, we cannot determine the impact of local taxes,
withholding taxes and foreign tax credits associated with the future repatriation of such earnings and, therefore, cannot
reasonably estimate the associated tax liability. In cases where we intend to repatriate a portion of the undistributed earnings of
our foreign subsidiaries, we provide U.S. income taxes on such earnings.
A reconciliation of the change in the tax liability for unrecognized tax benefits for the years ended December 31, 2015
and 2014 is as follows:

58
(In thousands) 2015 2014
Beginning balance $ 9,857 $ 5,888
Adjustments for tax positions related to the current year 8,203 4,072
Adjustments for tax positions related to prior years (4,887 ) 3
Statute expiration (103 ) (106 )
Ending balance $ 13,070 $ 9,857
The total amount of unrecognized tax benefits, if recognized, would reduce our future effective tax rate. We have
recognized tax benefits associated with these liabilities in the amount of $2.1 million and $5.2 million at December 31, 2015
and 2014, respectively.
We recognize interest related to unrecognized tax benefits in interest expense and penalties in operating expenses. Our
liability for accrued interest and penalties related to uncertain tax positions was $0.8 million at December 31, 2014. During
2015, we increased interest related to uncertain tax positions by $0.1 million. Our liability for accrued interest and penalties
related to uncertain tax positions was $0.9 million at December 31, 2015.
We file a U.S. federal income tax return along with various state and foreign income tax returns. Examinations of our
U.S. federal returns have been completed through 2010, with the 2011 tax year closed by statute. Various state and foreign
income tax returns may be subject to tax audits for periods after 2009.
Note 10—Stock Plans
The 2008 Management Equity Incentive Plan provides for various forms of stock-based compensation for eligible key
employees through May 2018. Management stock-based compensation includes stock options, restricted stock, restricted stock
units and performance stock units. The 2008 Non-Employee Directors’ Equity Incentive Plan provides for grants of stock
options and restricted stock to non-employee directors through May 2018. Stock options are granted at market prices and expire
after ten years. Stock options are exercisable beginning three years after the grant date. Restricted stock and restricted stock
units are granted without payment to the company and generally vest three years after the grant date. Restricted stock and
restricted stock units are valued at the market value of the stock on the grant date. Performance stock units with a market
condition are valued at an estimated fair value using the Monte Carlo model. The final number of shares to be issued for
performance stock units may range from zero to 200% of the target award based on achieving the specified performance targets
over the performance period. In general, unvested stock options, restricted stock and performance stock units are forfeited if the
participant’s employment with the company terminates for any reason other than retirement, death or disability. We issue
Treasury shares for stock option exercises and grants of restricted stock and performance stock. Please refer to Note 6 for
further information regarding stock compensation share issuance. As of December 31, 2015, there were 1,178,625 and 154,315
shares, respectively, reserved for future grants under the management and non-employee directors’ equity incentive plans.
Stock-based compensation expense was as follows:
(In thousands) 2015 2014 2013
Restricted stock $ 3,035 $ 4,026 $ 4,129
Stock options 2,454 2,355 2,825
Performance stock 2,110 2,672 3,383
Total compensation expense before income taxes 7,599 9,053 10,337
Income tax benefit 2,896 3,293 3,810
Total compensation expense, net of income tax benefit $ 4,703 $ 5,760 $ 6,527
We did not capitalize any stock-based compensation expense, and all expense is recorded in SG&A expense in 2015,
2014, or 2013.
Stock option expense is based on the fair value of stock option grants estimated on the grant dates using the Black-
Scholes option pricing model and the following weighted average assumptions for options granted in 2015, 2014 and 2013.

59
2015 2014 2013
Fair value per option $ 15.63 $ 17.26 $ 14.17
Risk-free interest rate 1.8 % 2.1 % 1.2 %
Expected dividend yield 2.3 % 2.4 % 2.8 %
Expected volatility 39 % 41 % 39 %
Expected life (years) 6.7 6.6 6.1
The risk-free interest rate is based on the U.S. Treasury Constant Maturity rates as of the grant date converted into an
implied spot rate yield curve. Expected dividend yield is based on the most recent annualized dividend divided by the 1 year
average closing share price. Expected volatility is based on the ten year historical volatility using daily stock prices. Expected
life is based on historical stock option exercise data.
A summary of option activity follows:
Shares
Weighted Average
Exercise Price Exercisable at
Year-end
Outstanding January 1, 2013 1,784,660 $ 33.05
Granted 188,407 49.03
Exercised (277,687 ) 34.72
Outstanding December 31, 2013 1,695,380 34.55 1,178,657
Granted 138,519 51.69
Exercised (190,743 ) 36.31
Expired (1,071 ) 45.68
Forfeited (23,524 ) 38.82
Outstanding December 31, 2014 1,618,561 35.74 1,147,712
Granted 170,683 48.64
Exercised (64,752 ) 38.59
Expired (1,109 ) 44.36
Forfeited (28,708 ) 49.71
Outstanding December 31, 2015 1,694,675 $ 36.69 1,280,665
For various exercise price ranges, characteristics of outstanding and exercisable stock options at December 31, 2015 were
as follows:
Stock Options Outstanding
Range of Exercise Prices Shares
Weighted-Average
Exercise Price Remaining Life
$17.83 – $29.33 533,382 $ 21.67 3.52
$33.55 – $40.88 461,108 36.88 3.92
$41.26 – $51.69 700,185 47.99 5.94
$17.83 – $51.69 1,694,675 36.69 4.62
Stock Options Exercisable
Range of Exercise Prices Shares
Weighted-Average
Exercise Price Remaining Life
$17.83 – $29.33 533,382 $ 21.67 3.52
$33.55 – $40.88 461,108 36.88 3.92
$41.26 – $48.95 286,175 45.63 2.62
$17.83 – $48.95 1,280,665 $ 32.50 3.46

60
Cash received from the exercise of stock options was $1.9 million, $6.9 million and $9.6 million for the years ended
December 31, 2015, 2014 and 2013, respectively. The tax (provision) benefit we realized from these exercises was $(0.1)
million, $1.0 million and $0.5 million for the years ended December 31, 2015, 2014 and 2013, respectively.
Stock options become exercisable when they are vested. The aggregate intrinsic value of stock options exercisable at
December 31, 2015 was $14.0 million. The aggregate intrinsic value of all stock options outstanding at December 31, 2015 was
$11.5 million.
A summary of restricted stock and unit activity follows:
Shares
Weighted Average Grant Date Fair Value
Unvested at January 1, 2013 417,843 $ 31.92
Granted 92,448 48.98
Vested (197,465 ) 27.42
Forfeited (9,407 ) 40.23
Unvested at December 31, 2013 303,419 39.79
Granted 83,543 51.91
Vested (108,245 ) 34.94
Forfeited (9,974 ) 44.42
Unvested at December 31, 2014 268,743 45.34
Granted 83,725 48.06
Vested (111,834 ) 39.01
Forfeited (22,925 ) 45.84
Unvested at December 31, 2015 217,709 $ 49.70
A summary of performance stock unit activity follows:
Shares
Weighted Average Grant Date Fair Value
Unvested at January 1, 2013 137,672 $ 35.85
Granted 53,357 57.58
Vested (45,809 ) 26.08
Performance adjustments 4,169 25.84
Unvested at December 31, 2013 149,389 46.32
Granted 46,242 57.42
Vested (91,696 ) 39.19
Performance adjustments 41,428 39.42
Forfeited (1,402 ) 48.85
Unvested at December 31, 2014 143,961 52.42
Granted 87,256 41.99
Vested (66,200 ) 41.75
Performance adjustments 16,447 41.45
Forfeited (9,820 ) 51.51
Unvested at December 31, 2015 171,644 $ 50.24
The 2015 performance adjustments above relate to the final number of shares issued for the 2012 Management
Performance Units, which were 133.6% of the target award based on Total Shareholder Return during the three year
performance period, and vested in the first quarter of 2015.

61
During the years ended December 31, 2015, 2014 and 2013, the total intrinsic value of stock options exercised (the
difference between the market price on the date of exercise and the option price paid to exercise the option) was $0.5 million,
$3.7 million and $4.0 million, respectively. The fair values of restricted stock vested during the years ended December 31,
2015, 2014 and 2013 were $5.3 million, $5.8 million and $9.7 million, respectively. The fair value of performance stock units
vested during the year ended December 31, 2015 was $2.0 million.
On December 31, 2015, there was $4.4 million of unrecognized stock-based compensation expense. The weighted
average period over which this expense is expected to be recognized was approximately two years.
Note 11—Short and Long-Term Debt
Short-Term Debt
Short-term borrowings with banks, which excludes the current portion of long-term debt, was insignificant and $0.1
million at December 31, 2015 and 2014, respectively. The average month-end balance of total short-term borrowings during
2015 was $0.2 million. The maximum month-end balance of $0.6 million occurred in February 2015. The weighted average
interest rate on short-term borrowings was 14% at December 31, 2014.
Long-Term Debt
December 31,
(In thousands) 2015 2014
2006 Senior notes payable through 2021, 5.41% $ 40,000 $ 46,667
2010 Senior notes payable through 2021, 4.00% 100,000 100,000
Senior revolving credit facility maturing in 2020 326,626 105,000
Total 466,626 251,667
Amounts due within one year 6,667 6,667
Long-term debt $ 459,959 $ 245,000
In connection with the Company's acquisition of Latchways (Note 13), the Company entered into an a credit agreement,
effective August 31, 2015. The credit agreement established a senior unsecured credit facility consisting of a $125.0 million
senior revolving credit facility. On December 11, 2015, the Company repaid the outstanding indebtedness under, and
terminated, the credit agreement dated August 31, 2015. The credit agreement was repaid with the proceeds of a borrowing
under a new credit agreement dated December 11, 2015. The new credit agreement amended and restated the Company’s
existing credit agreement dated March 7, 2014. Under the new credit agreement dated December 11, 2015, funds may be
borrowed on an unsecured, revolving credit basis in a maximum outstanding amount not to exceed $575.0 million. The new
credit agreement has a term expiring on December 11, 2020. At December 31, 2015, $244.9 million of the existing $575.0
million senior revolving credit facility was unused including letters of credit.
On January 22, 2016, the Company entered into multi-currency note purchase and private shelf agreement, pursuant to
which MSA issued notes in an aggregate original principal amount of £54.9 million (approximately $80.0 million). The Notes
are repayable in annual installments of £6.1 million (approximately $8.9 million), commencing January 22, 2023, with a final
payment of any remaining amount outstanding on January 22, 2031. The interest rate on these notes is fixed at 3.4%. The note
purchase agreement requires MSA to comply with specified financial covenants including a requirement to maintain a
minimum fixed charges coverage ratio of not less than 1.50 to 1.00 and a consolidated leverage ration not to exceed 3.25 to
1.00; in each case calculated on the basis of the trailing four fiscal quarters. In addition, the note purchase agreement contains
negative covenants limiting the ability of MSA and its subsidiaries to incur additional indebtedness or issue guarantees, create
or incur liens, make loans and investments, make acquisitions, transfer or sell assets, enter into transactions with affiliated
parties, make changes in its organizational documents that are materially adverse to lenders or modify the nature of MSA's or
its subsidiaries' business.
Approximate maturities on our long-term debt over the next five years are $6.7 million in 2016, $26.7 million in 2017,
$26.7 million in 2018, $26.7 million in 2019, $353.1 million in 2020, and $26.7 million thereafter. The revolving credit
facilities require the Company to comply with specified financial covenants. In addition, the credit facilities contain negative
covenants limiting the ability of the Company and its subsidiaries to enter into specified transactions. The Company was in
compliance with all covenants at December 31, 2015.
The Company had outstanding bank guarantees and standby letters of credit with banks as of December 31, 2015, totaling
$7.9 million, of which $3.5 million relate to the senior revolving credit facility. The letters of credit serve to cover customer

62
requirements in connection with certain sales orders and insurance companies. No amounts were drawn on these arrangements
at December 31, 2015. The Company is also required to provide cash collateral in connection with certain arrangements. At
December 31, 2015, the Company has $2.4 million of restricted cash in support of these arrangements.
Note 12—Goodwill and Intangible Assets
Changes in goodwill during the years ended December 31, 2015 and 2014 were as follows:
(In thousands) 2015 2014
Net balance at January 1 $ 252,520 $ 260,134
Additions (Note 13) 97,959 —
Currency translation (10,141 ) (7,614 )
Net balance at December 31 $ 340,338 $ 252,520
At December 31, 2015, goodwill of $197.9 million, $140.7 million and $1.7 million related to the North American,
European and International reporting segments, respectively.
Changes in intangible assets, net of accumulated amortization, during the years ended December 31, 2015 and 2014 were
as follows:
(In thousands) 2015 2014
Net balance at January 1 $ 31,323 $ 35,029
Additions (Note 13) 67,645 500
Amortization expense (4,811 ) (2,979 )
Impairment losses (Note 15) (723 ) —
Currency translation (3,366 ) (1,227 )
Net balance at December 31 $ 90,068 $ 31,323 (In millions) December 31, 2015 December 31, 2014
Intangible Assets: Weighted Average Useful Life (years)
Gross Carrying Amount
Accumulated Amortization and Reserves
Net Carrying Amount
Gross Carrying Amount
Accumulated Amortization and Reserves
Net Carrying Amount
Customer relationships 15 $ 50.5 $ (0.7 ) $ 49.8 — $ — $ —
Distribution agreements 20 24.6 (6.2 ) 18.4 27.5 $ (6.5 ) $ 21.0
Technology related assets 10 17.5 (8.3 ) 9.2 11.5 (6.6 ) 4.9
Patents, trademarks and copyrights
15 16.5
(4.6 ) 11.9
13.5
(8.6 ) 4.9
License agreements 5 5.4 (5.3 ) 0.1 6.8 (6.7 ) 0.1
Other 15 3.9 (3.2 ) 0.7 7.0 (6.6 ) 0.4
Total 15 $ 118.4 $ (28.3 ) $ 90.1 66.3 (35.0 ) 31.3
Intangible asset amortization expense over the next five years is expected to be approximately $8.0 million in 2016, $7.5
million in 2017, $6.1 million in 2018, $6.0 million in 2019, and $6.0 million in 2020.

63
Note 13—Acquisitions
On October 21, 2015, MSA Safety Incorporated acquired Latchways plc and its affiliated companies, Latchways Australia
Pty Limited ("LA"), Latchways Inc. ("LI"), HCL Group Plc ("HCL"), Height Solutions Limited ("HSL"), and Sigma 6 d.o.o.
('Sigma 6"), collectively referred to as ("Latchways"), for $190.9 million. There is no contingent consideration.
The acquisition was funded through cash on hand and borrowings on our $125.0 million unsecured senior revolving credit
facility. Please refer to Note 11, Short-Term and Long-Term Debt for further details.
Latchways is a global provider of innovative fall protection systems based in the United Kingdom. Latchways solutions
are found throughout the aerospace, power transmission, utility and telecommunication sectors, and Latchways products are
integrated with major roofing and tower systems. In addition to providing us with greater access to the fall protection market,
we believe that the acquisition significantly enhances our long-term corporate strategy in fall protection by providing us with
world-class research and development talent and an industry-leading product line. While Latchways products will be sold
globally, its operations will most significantly impact our European segment.
The following table summarizes the preliminary fair values of the Latchways assets acquired and liabilities assumed at the
date of acquisition:
(In millions)
October 21, 2015
Current assets (including cash of $10.6 million) $ 35.7
Property, plant and equipment 9.5
Trade name and acquired technology 14.6
Customer-related intangibles 53.0
Goodwill 98.0
Total assets acquired 210.8
Total liabilities assumed 19.9
Net assets acquired $ 190.9
The amounts in the table above are subject to change upon completion of the valuation of the assets acquired and
liabilities assumed. This valuation is expected to be completed by mid-2016.
Assets acquired and liabilities assumed in connection with the acquisition have been recorded at their fair values. Fair
values were determined by management, based, in part on an independent valuation performed by a third party valuation
specialist. The valuation methods used to determine the fair value of intangible assets included the excess earnings approach for
customer relationships and technology related intangible assets; the relief from royalty method for trade name; and the cost
method for assembled workforce which is included in goodwill. A number of significant assumptions and estimates were
involved in the application of these valuation methods, including sales volumes and prices, costs to produce, tax rates, capital
spending, discount rates, and working capital changes. Cash flow forecasts were generally based on Latchways pre-acquisition
forecasts coupled with estimated MSA sales synergies. Identifiable intangible assets with finite lives are subject to amortization
over their estimated useful lives. The identifiable intangible assets acquired in the Latchways transaction will be amortized over
an estimated amortization period of 15 years. Estimated future amortization expense related to these identifiable intangible
assets is approximately $4.5 million in each of the next five years. The step up to fair value of acquired inventory as part of the
purchase price allocation totaled $1.6 million. Estimated depreciation of this step up in inventory value is expected to be
approximately $0.7 million in 2016. Estimated future depreciation expense related to Latchways property, plant and equipment
is approximately $0.9 million in each of the next five years.
Goodwill is calculated as the excess of the purchase price over the fair value of net assets acquired and represents the
future economic benefits arising from other assets acquired that could not be individually identified and separately recognized.
Among the factors that contributed to a purchase price in excess of the fair value of the net tangible and intangible assets
acquired were the acquisition of an assembled workforce, the expected synergies and other benefits that we believe will result
from combining the operations of Latchways with our operations. Goodwill related to the Latchways acquisition has been
recorded in our reportable segments as follows: $96.6 million in the European segment and $1.4 million in North American
segment. Goodwill is not expected to be tax deductible.

64
Our results for the year ended December 31, 2015, include transaction costs of $5.0M, of which $2.8M is expected to be
non-deductible for tax purposes. Integration costs related to the Latchways acquisition totaled $2.5 million ($1.6 million after
tax). These costs are reported in selling, general and administrative expenses.
The operating results of Latchways have been included in our consolidated financial statements from the acquisition date
through December 31, 2015. Our results for the year ended December 31, 2015 include Latchways sales and net loss of $10.1
million and ($0.7) million, respectively. Excluding transaction and integration costs, Latchways had no impact on our 2015
fourth quarter net income.
The following unaudited pro forma information presents our combined results as if the acquisition had occurred at the
beginning of 2014. The unaudited pro forma financial information was prepared to give effect to events that are (1) directly
attributable to the merger; (2) factually supportable; and (3) expected to have a continuing impact on the combined company’s
results. There were no material transactions between us and Latchways during the periods presented that are required to be
eliminated. Transactions between Latchways companies during the periods presented have been eliminated in the unaudited pro
forma condensed combined financial information. Pro forma adjustments were also made to the 2015 information to remove
the effects of one-time transaction and integration costs. The unaudited pro forma financial information does not reflect any
cost savings, operating synergies or revenue enhancements that the combined company may achieve as a result of the
acquisitions or the costs to integrate the operations or the costs necessary to achieve cost savings, operating synergies or
revenue enhancements.
Pro forma financial information (Unaudited)
(In millions, except per share amounts) 2015 2014
Net sales $ 1,172 $ 1,192
Income from continuing operations 77.8 94.8
Basic earnings per share from continuing operations 2.09 2.55
Diluted earnings per share from continuing operations 2.06 2.51
The unaudited pro forma condensed combined financial information is presented for information purposes only and is not
intended to represent or be indicative of the combined results of operations or financial position that we would have reported
had the acquisitions been completed as of the date and for the periods presented, and should not be taken as representative of
our consolidated results of operations or financial condition following the acquisitions. In addition, the unaudited pro forma
condensed combined financial information is not intended to project the future financial position or results of operations of the
combined company.
The unaudited pro forma financial information was prepared using the acquisition method of accounting under existing
GAAP. MSA has been treated as the acquirer.

65
Note 14—Pensions and Other Post-retirement Benefits
We maintain various defined benefit and defined contribution plans covering the majority of our employees. Our principal
U.S. plan is funded in compliance with the Employee Retirement Income Security Act (ERISA). It is our general policy to fund
current costs for the international plans, except in Germany and Mexico, where it is common practice and permissible under tax
laws to accrue book reserves.
We provide health care benefits and limited life insurance for certain retired employees who are covered by our principal
U.S. defined benefit pension plan until they become Medicare-eligible.
Information pertaining to defined benefit pension plans and other post-retirement benefits plans is provided in the
following table:
Pension Benefits Other Benefits
(In thousands) 2015 2014 2015 2014
Change in Benefit Obligations
Benefit obligations at January 1 $ 519,194 $ 440,359 $ 26,851 $ 26,732
Service cost 11,517 9,425 444 538
Interest cost 18,314 19,340 863 1,107
Participant contributions 105 130 255 259
Plan amendments 604 (302 ) — —
Actuarial (gains) losses (21,073 ) 88,069 (3,998 ) (200 )
Benefits paid (19,261 ) (19,193 ) (1,441 ) (1,585 )
Settlements (2,094 ) (717 ) — —
Currency translation (16,126 ) (17,917 ) — —
Benefit obligations at December 31 491,180 519,194 22,974 26,851
Change in Plan Assets
Fair value of plan assets at January 1 445,299 434,569 — —
Actual return on plan assets (4,754 ) 30,209 — —
Employer contributions 4,058 4,077 1,186 1,326
Participant contributions 105 130 255 259
Settlements (2,094 ) (717 ) — —
Benefits paid (16,979 ) (16,507 ) (1,441 ) (1,585 )
Reimbursement of German benefits (2,282 ) (2,686 ) — —
Administrative Expenses Paid 6 — — —
Currency translation (4,271 ) (3,776 ) — —
Fair value of plan assets at December 31 419,088 445,299 — —
Funded Status
Funded status at December 31 (72,092 ) (73,895 ) (22,974 ) (26,851 )
Unrecognized transition losses 12 16 — —
Unrecognized prior service cost (credit) 525 10 (1,524 ) (1,858 )
Unrecognized net actuarial losses 188,531 192,692 2,117 6,450
Net amount recognized 116,976 118,823 (22,381 ) (22,259 )
Amounts Recognized in the Balance Sheet
Noncurrent assets 62,072 75,017 — —
Current liabilities (5,033 ) (5,380 ) (1,382 ) (1,457 )
Noncurrent liabilities (129,131 ) (143,532 ) (21,592 ) (25,394 )
Net amount recognized (72,092 ) (73,895 ) (22,974 ) (26,851 )
Amounts Recognized in Accumulated Other Comprehensive Loss
Net actuarial losses 188,531 192,692 2,425 6,450
Prior service cost (credit) 525 10 (1,523 ) (1,858 )
Unrecognized net initial obligation 12 16 — —
Total (before tax effects) 189,068 192,718 902 4,592
Accumulated Benefit Obligations for all Defined Benefit Plans 453,382 479,764 — —

66
Pension Benefits Other Benefits
(In thousands) 2015 2014 2013 2015 2014 2013
Components of Net Periodic Benefit Cost
Service cost $ 11,517 $ 9,425 $ 11,132 $ 444 $ 538 $ 687
Interest cost 18,314 19,340 17,934 863 1,107 1,050
Expected return on plan assets (34,130 ) (32,944 ) (30,884 ) — — —
Amortization of transition amounts 2 2 3 — — —
Amortization of prior service cost (credit) 66 84 102 (335 ) (335 ) (424 )
Recognized net actuarial losses 15,545 8,639 13,323 27 182 552
Settlement loss 641 290 658 — — —
Termination benefits — — — — — —
Net periodic benefit cost 11,955 4,836 12,268 999 1,492 1,865
Actuarial gains and losses are amortized over the average future working lifetime of the active population in the plan
using the projected unit credit method. This approximates 10 years.
Amounts included in accumulated other comprehensive income expected to be recognized in 2016 net periodic benefit
costs.
(In thousands) Pension Benefits Other Benefits
Loss recognition $ 12,254 $ 11
Prior service cost (credit) recognition 61 (335 )
Transition obligation recognition 2 —
Pension Benefits Other Benefits
2015 2014 2015 2014
Assumptions used to determine benefit obligations
Average discount rate 3.92 % 3.63 % 4.20 % 3.85 %
Rate of compensation increase 3.06 % 3.03 % — —
Assumptions used to determine net periodic benefit cost
Average discount rate 3.63 % 4.54 % 3.85 % 4.62 %
Expected return on plan assets 8.17 % 8.20 % — —
Rate of compensation increase 3.03 % 3.06 % — —
Discount rates were determined using various corporate bond indexes as indicators of interest rate levels and movements
and by matching our projected benefit obligation payment stream to current yields on high quality bonds.
The expected return on assets for the 2015 net periodic pension cost was determined by multiplying the expected returns
of each asset class (based on historical returns) by the expected percentage of the total portfolio invested in that asset class. A
total return was determined by summing the expected returns over all asset classes.
Pension Plan Assets at
December 31,
2015 2014
Equity securities 67 % 65 %
Fixed income securities 24 26
Pooled investment funds 5 5
Insurance contracts 3 3
Cash and cash equivalents 1 1
Total 100 % 100 %

67
The overall objective of our pension investment strategy is to earn a rate of return over time to satisfy the benefit
obligations of the pension plans and to maintain sufficient liquidity to pay benefits and meet other cash requirements of our
pension funds. Investment policies for our primary U.S. pension plan are determined by the plan’s Investment Committee and
set forth in the plan’s investment policy. Asset managers are granted discretion for determining sector mix, selecting securities
and timing transactions, subject to the guidelines of the investment policy. An aggressive, flexible management of the portfolio
is permitted and encouraged, with shifts of emphasis among equities, fixed income securities and cash equivalents at the
discretion of each manager. No target asset allocations are set forth in the investment policy. For our non-U.S. pension plans,
our investment objective is generally met through the use of pooled investment funds and insurance contracts.
The following table summarizes our pension plan assets measured at fair value on a recurring basis by fair value
hierarchy level (See Note 17):
December 31, 2015
(In thousands)
Quoted Prices in Active
Markets for Identical
Assets (Level 1)
Significant Observable
Inputs (Level 2)
Significant Unobservable
Inputs (Level 3)
Total Fair
Value
Equity securities $ 225,191 $ 55,428 $ — $ 280,619
Fixed income securities 29,903 70,164 — 100,067
Pooled investment funds — 19,345 — 19,345
Insurance contracts — — 13,681 13,681
Cash and cash equivalents 5,376 — — 5,376
Total 260,470 144,937 13,681 419,088
December 31, 2014
(In thousands)
Quoted Prices in Active
Markets for Identical
Assets (Level 1)
Significant Observable
Inputs (Level 2)
Significant Unobservable
Inputs (Level 3)
Total Fair
Value
Equity securities $ 233,156 $ 54,614 $ 248 $ 288,018
Fixed income securities 41,447 72,412 505 114,364
Pooled investment funds — 22,623 — 22,623
Insurance contracts — — 15,069 15,069
Cash and cash equivalents 5,225 — — 5,225
Total 279,828 149,649 15,822 445,299
Equity securities consist primarily of publicly traded U.S. and non-U.S. common stocks. Equities are valued at closing
prices reported on the listing stock exchange.
Fixed income securities consist primarily of U.S. government and agency bonds and U.S. corporate bonds. Fixed income
securities are valued at closing prices reported in active markets or based on yields currently available on comparable securities
of issuers with similar credit ratings. When quoted prices are not available for identical or similar bonds, the bond is valued
under a discounted cash flow approach that maximizes observable inputs, such as current yields of similar instruments, and may
include adjustments, for certain risks that may not be observable, such as credit and liquidity risks.
Pooled investment funds consist of mutual and collective investment funds that invest primarily in publicly traded non-
U.S. equity and fixed income securities. Pooled investment funds are valued at net asset values calculated by the fund manager
based on fair value of the underlying securities. The underlying securities are generally valued at closing prices reported in
active markets, quoted prices of similar securities, or discounted cash flows approach that maximizes observable inputs such as
current value measurement at the reporting date.
Insurance contracts are valued in accordance with the terms of the applicable collective pension contract. The fair value
of the plan assets equals the discounted value of the expected cash flows of the accrued pensions which are guaranteed by the
counterparty insurer.

68
Cash equivalents consist primarily of money market and similar temporary investment funds. Cash equivalents are valued
at closing prices reported in active markets.
The preceding methods may produce fair value measurements that are not indicative of net realizable value or reflective
of future fair values. Although we believe the valuation methods are appropriate and consistent with other market participants,
the use of different methodologies or assumptions to determine the fair value of certain financial instruments could result in a
different fair value measurement at the reporting date.
The following table presents a reconciliation of Level 3 assets:
(In thousands) Insurance Contracts Other
Balance January 1, 2014 $ 13,512 $ 780
Net realized and unrealized gains included in earnings 1,345 (180 )
Net purchases, issuances and settlements 212 505
Transfers into Level 3 — (352 )
Balance December 31, 2014 15,069 753
Net realized and unrealized gains included in earnings (1,526 ) (64 )
Net purchases, issuances and settlements 138 (184 )
Transfers out of Level 3 — (505 )
Balance December 31, 2015 13,681 —
We expect to make net contributions of $6.2 million to our pension plans in 2016 which are primarily associated with our
European and International segments.
For the 2015 beginning of the year measurement purposes (net periodic benefit expense), 6.5% increase in the costs of
covered health care benefits was assumed decreasing by 0.5% for each successive year to 4.5% in 2019 and thereafter. For the
2015 end of the year measurement purposes (benefit obligation), 6.5% increase in the costs of covered health care benefits was
assumed decreasing by 0.5% for each successive year to 4.5% in 2020 and thereafter. A one-percentage-point change in
assumed health care cost trend rates would have increased or decreased the other post-retirement benefit obligations and current
year plan expense by approximately $1.1 million and $1.0 million, respectively.
Expense for defined contribution pension plans was $6.8 million in 2015, $6.5 million in 2014 and $5.8 million in 2013.
Estimated pension benefits to be paid under our defined benefit pension plans during the next five years are $20.2 million
in 2016, $21.0 million in 2017, $22.0 million in 2018, $22.7 million in 2019, $24.3 million in 2020, and are expected to
aggregate $139.2 million for the five years thereafter. Estimated other post-retirement benefits to be paid during the next 5 years
are $1.4 million in 2016, $1.5 million in 2017, $1.7 million in 2018, $1.8 million in 2019, $1.8 million in 2020, and are
expected to aggregate $8.5 million for the five years thereafter.
Note 15—Other Income (Loss), Net
(In thousands) 2015 2014 2013
Interest income $ 1,525 $ 1,822 $ 1,142
Gain on asset dispositions, net 1,724 2,094 436
Land impairment loss — (50 ) (1,557 )
Disposal of non-core product lines (4,223 ) — —
Impairment of intangible assets (723 ) — —
Other, net 836 (1,101 ) (196 )
Total $ (861 ) $ 2,765 $ (175 )
During the year ended December 31, 2015, we recorded $4.2 million of losses associated with the disposal of net assets
related to the Safety Works business in our North American Segment. A discounted cash flow valuation was also performed and
showed that the book value of intangible assets used to support certain non-core product sales exceeded their fair value by $0.7
million in our North American Segment. Additionally, we recognized a $2.0 million gain on the sale of property in Australia as
the Company continues to right-size operations and optimize its global footprint.
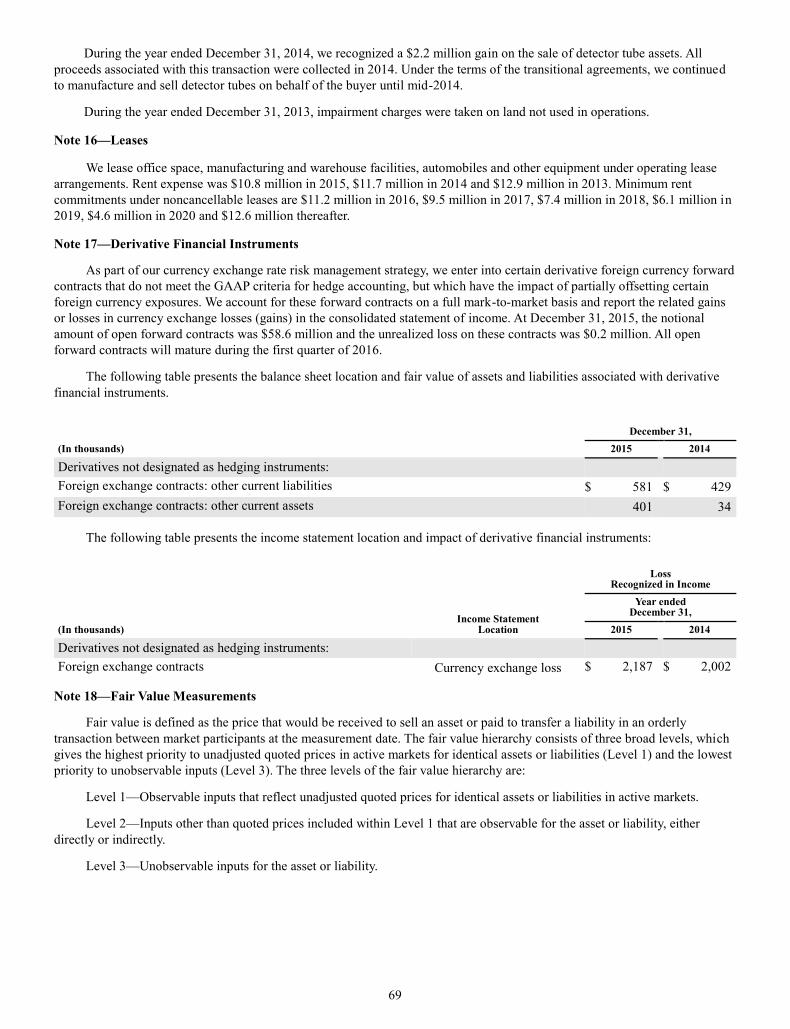
69
During the year ended December 31, 2014, we recognized a $2.2 million gain on the sale of detector tube assets. All
proceeds associated with this transaction were collected in 2014. Under the terms of the transitional agreements, we continued
to manufacture and sell detector tubes on behalf of the buyer until mid-2014.
During the year ended December 31, 2013, impairment charges were taken on land not used in operations.
Note 16—Leases
We lease office space, manufacturing and warehouse facilities, automobiles and other equipment under operating lease
arrangements. Rent expense was $10.8 million in 2015, $11.7 million in 2014 and $12.9 million in 2013. Minimum rent
commitments under noncancellable leases are $11.2 million in 2016, $9.5 million in 2017, $7.4 million in 2018, $6.1 million in
2019, $4.6 million in 2020 and $12.6 million thereafter.
Note 17—Derivative Financial Instruments
As part of our currency exchange rate risk management strategy, we enter into certain derivative foreign currency forward
contracts that do not meet the GAAP criteria for hedge accounting, but which have the impact of partially offsetting certain
foreign currency exposures. We account for these forward contracts on a full mark-to-market basis and report the related gains
or losses in currency exchange losses (gains) in the consolidated statement of income. At December 31, 2015, the notional
amount of open forward contracts was $58.6 million and the unrealized loss on these contracts was $0.2 million. All open
forward contracts will mature during the first quarter of 2016.
The following table presents the balance sheet location and fair value of assets and liabilities associated with derivative
financial instruments.
December 31,
(In thousands) 2015 2014
Derivatives not designated as hedging instruments:
Foreign exchange contracts: other current liabilities $ 581 $ 429
Foreign exchange contracts: other current assets 401 34
The following table presents the income statement location and impact of derivative financial instruments:
(In thousands) Income Statement
Location
Loss Recognized in Income
Year ended December 31,
2015 2014
Derivatives not designated as hedging instruments:
Foreign exchange contracts Currency exchange loss $ 2,187 $ 2,002
Note 18—Fair Value Measurements
Fair value is defined as the price that would be received to sell an asset or paid to transfer a liability in an orderly
transaction between market participants at the measurement date. The fair value hierarchy consists of three broad levels, which
gives the highest priority to unadjusted quoted prices in active markets for identical assets or liabilities (Level 1) and the lowest
priority to unobservable inputs (Level 3). The three levels of the fair value hierarchy are:
Level 1—Observable inputs that reflect unadjusted quoted prices for identical assets or liabilities in active markets.
Level 2—Inputs other than quoted prices included within Level 1 that are observable for the asset or liability, either
directly or indirectly.
Level 3—Unobservable inputs for the asset or liability.

70
The valuation methodologies we used to measure financial assets and liabilities were limited to the pension plan assets
described in Note 14 and the derivative financial instruments described in Note 17. See Note 14 for the fair value hierarchy
classification of pension plan assets. We estimate the fair value of the derivative financial instruments, consisting of foreign
currency forward contracts, based upon valuation models with inputs that generally can be verified by observable market
conditions and do not involve significant management judgment. Accordingly, the fair values of the derivative financial
instruments are classified within Level 2 of the fair value hierarchy.
With the exception of fixed rate long-term debt, we believe that the reported carrying amounts of our financial assets and
liabilities approximate their fair values. The reported carrying amount of long-term debt (including the current portion) was
$140.0 million and $146.7 million at December 31, 2015 and 2014, respectively. The fair value of this debt was $145.2 million
and $153.4 million at December 31, 2015 and 2014, respectively. The fair value of this debt was determined by evaluating like
rated companies with publicly traded bonds and recent market transactions. The fair value of this debt was determined using
Level 2 inputs as described above.
Note 19—Contingencies
Product Liability
The Company categorizes the product liability losses of its subsidiary MSA LLC into two main categories: single incident
and cumulative trauma.
Single incident product liability claims involve discrete incidents that are typically known to us when they occur and
involve observable injuries which provide an objective basis for quantifying damages. MSA LLC estimates its liability for
single incident product liability claims based on expected settlement costs for reported claims and an estimate of costs for
unreported claims (claims incurred but not reported or IBNR). The estimate for IBNR claims is based on experience, sales
volumes, and other relevant information. The reserve for single incident product liability claims, which includes reported and
IBNR claims, at December 31, 2015 and 2014 was $3.5 million in each year. Single incident product liability expense during
the year ended December 31, 2015 was $0.9 million and was not significant for the year ended December 31, 2014. Single
incident product liability exposures are evaluated on an ongoing basis and adjustments are made to the reserve as appropriate.
Cumulative trauma product liability claims involve exposures to harmful substances (e.g., silica, asbestos and coal dust)
that occurred many years ago and may have developed over long periods of time into diseases such as silicosis, asbestosis, or
coal worker’s pneumoconiosis. MSA LLC is presently named as a defendant in 1,988 lawsuits, some of which involve multiple
plaintiffs, in which plaintiffs allege to have contracted certain cumulative trauma diseases. These lawsuits mainly involve
respiratory protection products allegedly manufactured and sold by MSA LLC or its predecessors.
A summary of cumulative trauma product liability lawsuit activity follows:
2015 2014 2013
Open lawsuits, January 1 2,326 2,840 2,609
New lawsuits 340 542 489
Settled and dismissed lawsuits (678 ) (1,056 ) (258 )
Open lawsuits, December 31 1,988 2,326 2,840
As reflected in the roll-forward above, during the 2014 fourth quarter and extending into January 2015, MSA LLC
resolved a number of cumulative trauma cases, the vast majority of which were insured. The settlements were recorded in both
the insurance and product liability line under current liabilities, and in the insurance receivable in the other non-current asset
section of the consolidated balance sheet.
More than half of the open lawsuits at December 31, 2015 have had a de minimis level of activity over the last 5 years. It
is possible that these cases could become active again at any point due to changes in circumstances.

71
Cumulative trauma product liability litigation has been difficult to predict. In our past experience, it has typically not been
until very late in the legal process that we can reasonably determine whether it is probable that any particular case will
ultimately result in a liability. This uncertainty is caused by many factors; Cumulative trauma litigation is inherently
unpredictable. Complaints generally do not provide information sufficient to determine if a lawsuit will develop into an actively
litigated case. Even when a case is actively litigated, it is often difficult to determine if the lawsuit will be dismissed or
otherwise resolved until late in the lawsuit. Moreover, even if it is probable that such a lawsuit will result in a loss; it is often
difficult to estimate the amount of actual loss that will be incurred. These actual loss amounts are highly variable and turn on a
case-by-case analysis of the relevant facts, which are often not learned until late in the lawsuit. In addition, there are
uncertainties concerning the impact of bankruptcies of other companies that are co-defendants in claims, uncertainties
surrounding the litigation process from jurisdiction to jurisdiction and from case to case, and uncertainties regarding the impact
of potential changes in legislative or judicial standards.
Consequently, MSA LLC historically has been unable to estimate its cumulative trauma product liability exposure.
In 2014, MSA LLC engaged an outside valuation consultant to assist in assessing its ability to estimate MSA LLC's
cumulative trauma product liability exposure. This assessment was based on MSA LLC’s cumulative claims experience,
including recent claims trends, and the development of enhanced claims data analytics. The analysis focused on claims made or
resolved over the last several years as these claims are likely to best represent future claim characteristics. After review by the
valuation consultant, outside legal counsel, and Management, it was determined that MSA LLC could not estimate its liability
for reported or IBNR cumulative trauma product liability claims.
The cumulative product liability reserve totaled $74.9 million at December 31, 2014, comprising of $35.1 million in other
non-current liabilities and the remainder recorded in the insurance and product liability line in the other current liabilities
section of the consolidated balance sheet. These amounts relate to settlements that were reached in 2014 and 2015 that will be
paid out in 2015 and 2016.
In 2015, Management continued to work with the outside valuation consultant and outside legal counsel to develop a
method to provide a reasonable estimate for certain reported claims by using appropriate assumptions based on our unique
circumstances. As a result, we've established a reserve for these reported claims that we believe represents our best estimate of
potential loss at December 31, 2015.
The change in ability to estimate was driven by the maturation of MSA LLC’s defense efforts and an additional year of
claims experience. Management’s claims experience has now advanced to a level that enables us to develop a reserve of
potential loss. As a result, for certain reported claims, we estimated a liability of $7.1 million as of December 31, 2015. This
amount has been added to the product liability reserve and the insurance receivable (see below). The product liability reserve
for cumulative trauma totals $50.1 million, and is recorded in the insurance and product liability line within current liabilities in
the consolidated balance sheet.
To arrive at the estimate for certain reported claims, it was necessary to employ significant assumptions. In light of these
significant assumptions, and all of the uncertainties inherent in cumulative trauma product liability litigation noted above, there
can be no assurance that future experience with reported claims will follow MSA LLC’s past experience. Thus, the reserve of
$7.1 million as of December 31, 2015 should be viewed as simply an estimate of a possible outcome for those reported claims
where our experience allows us to reasonably make an estimate. Actual liabilities could vary greatly and we will need to adjust
the estimate from time to time based on relevant facts and circumstances. If actual experience is worse than projected, it is
likely that the estimate would increase, and these increases could potentially be material over time.
The uncertainties noted above relating to our cumulative trauma product liability litigation are particularly acute in the
case of IBNR claims, which by definition are potential claims that have not yet been filed. Management continues to be unable
to reasonably estimate, and therefore has not recorded any liability for, MSA LLC’s cumulative trauma IBNR claims. This
determination was made by Management after review with its valuation consultant and outside legal counsel.
Our aggregate cumulative trauma product liability losses and administrative and defense costs for the three years ended
December 31, 2015, totaled approximately $156.1 million, substantially all of which was insured.
Because litigation is subject to inherent uncertainties, and unfavorable rulings or developments could occur, there can be
no certainty that MSA LLC may not ultimately incur charges in excess of presently recorded liabilities. The estimate does not
purport to reflect MSA LLC’s overall claims exposure for either reported claims or future claims as noted above.

72
Although it is impossible to predict the ultimate outcome of current open claims, based on current information, our
experience in handling these matters, and our substantial insurance program, we do not believe that the resolution of these
claims will have a material adverse effect on our future financial condition or liquidity.
On February 26, 2016, a Kentucky state court jury in the James Couch claim rendered a verdict against subsidiary MSA
LLC of $7.2 million dollars. Judgment has not yet been entered on the verdict. The Company is currently evaluating all
available legal options. Outside legal counsel advises that the Company has strong grounds to appeal this decision.
Insurance Receivable
With some common contract exclusions, we maintain insurance for cumulative trauma product liability claims. We have
purchased insurance policies for the policy years from 1952-1986 from over 20 different insurance carriers that provide
coverage for cumulative trauma product liability losses and, in many instances, related defense costs (the "Occurrence-Based
Policies"). The available limits of these policies exceed the recorded insurance receivable balance. After 1986, the Company’s
insurance policies have significant per claim deductibles. Based on this, the Company does not expect to be materially
reimbursed for any claims alleging exposures that occurred entirely after this date.
In the normal course of business, we make payments to settle product liability claims and for related defense costs. We
record receivables for the amounts that are covered by insurance. Since December 31, 2014, the insurance receivable has
increased by $9.0 million as a result of the above noted settlements and related defense costs.
Various factors could affect the timing and amount of recovery of the insurance receivable, including the outcome of
negotiations with insurers, legal proceedings with respect to product liability insurance coverage and the extent to which
insurers may become insolvent in the future.
Insurance receivables at December 31, 2015 totaled $229.5 million, of which $2.0 million is reported in other current
assets and $227.5 million in other non-current assets. Insurance receivables at December 31, 2014 totaled $220.5 million, of
which $2.0 million is reported in other current assets and $218.5 million in other non-current assets.
A summary of insurance receivable balances and activity related to cumulative trauma product liability losses follows:
(In millions) 2015 2014 2013
Balance January 1 $ 220.5 $ 124.8 $ 130.0
Additions 17.3 98.2 34.0
Collections and settlements (8.3 ) (2.5 ) (39.2 )
Balance December 31 $ 229.5 $ 220.5 $ 124.8
Additions to insurance receivables in the above table represent insured cumulative trauma product liability losses and
related defense costs. Uninsured cumulative trauma product liability losses during the year ended December 31, 2015, 2014,
and 2013 were $1.0 million, $3.9 million and $1.7 million, respectively. Collections primarily represent agreements with
insurance companies to pay amounts due that are applicable to cumulative trauma claims. When there are contingencies
embedded in these agreements, we apply payments to the insurance receivable in the period when the contingency is met. In
cases where the payment stream covers multiple years and there are no contingencies, the present value of the payments is
recorded as a note receivable (current and long-term) in the balance sheet within prepaid expenses and other current assets and
other noncurrent assets.
MSA LLC believes that the increase in its insurance receivable balance that it has experienced since 2005 is primarily due
to disagreements among its insurance carriers, and consequently with MSA LLC, as to when the individual obligations of
insurance carriers to pay are triggered and the amount of each insurer’s obligation, as compared to other insurers. MSA LLC
believes that its insurers do not contest that they have issued policies to our subsidiaries or that these policies cover cumulative
trauma product liability claims. We believe that successful resolution of insurance litigation with various insurance carriers in
recent years demonstrates that we have strong legal positions concerning MSA LLC's rights to coverage.
The collectability of MSA LLC's insurance receivables is regularly evaluated and we believe that the amounts recorded
are probable of collection. These conclusions are based on analysis of the terms of the underlying insurance policies, experience
in successfully recovering cumulative trauma product liability claims from our insurers under other policies, the financial
ability of the insurance carriers to pay the claims, understanding and interpretation of the relevant facts and applicable law and
the advice of MSA LLC's outside legal counsel.

73
Insurance Litigation
MSA LLC is currently involved in insurance coverage litigation with a number of our insurance carriers regarding its
Occurrence-Based Policies.
In 2009, MSA LLC (as Mine Safety Appliances Company) sued The North River Insurance Company (North River) in the
United States District Court for the Western District of Pennsylvania, alleging that North River breached one of its insurance
policies by failing to pay amounts owed to MSA LLC and that it engaged in bad-faith claims handling. MSA LLC believes that
North River’s refusal to indemnify it under the policy for product liability losses and legal fees paid by MSA LLC is wholly
contrary to Pennsylvania law and MSA LLC is vigorously pursuing the legal actions necessary to collect all due amounts. A
trial date has not yet been scheduled.
In 2010, North River sued MSA LLC (as Mine Safety Appliances Company) in the Court of Common Pleas of Allegheny
County, Pennsylvania seeking a declaratory judgment concerning their responsibilities under three additional policies. MSA
LLC asserted claims against North River for breaches of contract for failures to pay amounts owed to MSA LLC. MSA LLC
also alleges that North River engaged in bad-faith claims handling. MSA LLC believes that North River’s refusal to indemnify
us under these policies for product liability losses and legal fees paid by MSA LLC is wholly contrary to Pennsylvania law and
MSA LLC is vigorously pursuing the legal actions necessary to collect all due amounts. Trial is currently scheduled for
September 2016.
In July 2010, MSA LLC (as Mine Safety Appliances Company) filed a lawsuit in the Superior Court of the State of
Delaware seeking declaratory and other relief from the majority of its excess insurance carriers concerning the future rights and
obligations of MSA LLC and its excess insurance carriers under various insurance policies. The reason for this insurance
coverage action is to secure a comprehensive resolution of its rights under the insurance policies issued by the insurers. Trial is
currently scheduled for May 2016.
MSA LLC has resolved claims against certain of its insurance carriers on some of their policies, including the
Occurrence-Based Policies through negotiated settlements. When a settlement is reached, MSA LLC dismisses the settling
carrier from relevant above noted lawsuit(s). Assuming satisfactory resolution, once disputes are resolved with each of the
remaining carriers responsible for the Occurrence-Based Policies, MSA LLC anticipates having commitments to provide future
payment streams which should be sufficient to satisfy its recorded receivables due from insurance carriers. In addition, MSA
LLC likely will retain some coverage through coverage-in-place agreements, although that coverage may not be immediately
accessible. When these insurance coverage matters are fully resolved, MSA LLC (and its coverage-in-place carriers, where
applicable) will be responsible for expenses related to cumulative trauma product liability claims.
Note 20—Discontinued Operations
Discontinued Operations - As of December 31, 2015, the Company was actively negotiating the sale of substantially all
of the assets and liabilities of its South African personal protective equipment distribution business and its Zambian operations
with a potential acquirer. The transaction closed on February 29, 2016. The Company received $15.9 million from the closing
of this transaction. The impact of the sale is not significant to net income or earnings per share. The operations of this business
qualify as a component of an entity under FASB ASC 205-20 "Presentation of Financial Statements - Discontinued Operations",
and thus the operations have been reclassified as discontinued operations and prior periods have been reclassified to conform to
this presentation.
Summarized financial information for discontinued operations is as follows:

74
Year ended December 31,
(In thousands) 2015 2014 2013
Discontinued Operations
Net sales $ 43,043 $ 47,516 $ 52,692
Other income, net 580 660 40
Cost and expenses:
Cost of products sold 34,764 38,259 41,181
Selling, general and administrative 6,680 7,650 7,389
Restructuring and other charges 14 — —
Currency exchange losses (gains), net 266 (116 ) (325 )
Income from discontinued operations before income taxes 1,899 2,383 4,487
Provision for income taxes 574 607 1,426
Income from discontinued operations, net of tax 1,325 1,776 3,061
The following assets and liabilities are included in the balance sheet line items noted below and are included in the
International Segment detail in Note 7.
December 31,
(In thousands) 2015 2014
Discontinued Operations assets and liabilities
Trade receivables, less allowance for doubtful accounts $ 4,832 $ 6,638
Inventories 8,499 11,829
Net property 449 342
Other assets 791 2,022
Total assets 14,571 20,831
Accounts payable 2,745 5,263
Accrued and other liabilities 748 991
Total liabilities 3,493 6,254
Net assets 11,078 14,577
The following summary provides financial information for discontinued operations related to net loss (income) related to
noncontrolling interests:
Year ended December 31,
(In thousands) 2015 2014 2013
Net loss (income) attributable to noncontrolling interests
Loss from continuing operations $ 2,971 $ 1,296 $ 870
Loss (income) from discontinued operations (108 ) (717 ) (672 )
Net loss 2,863 579 198
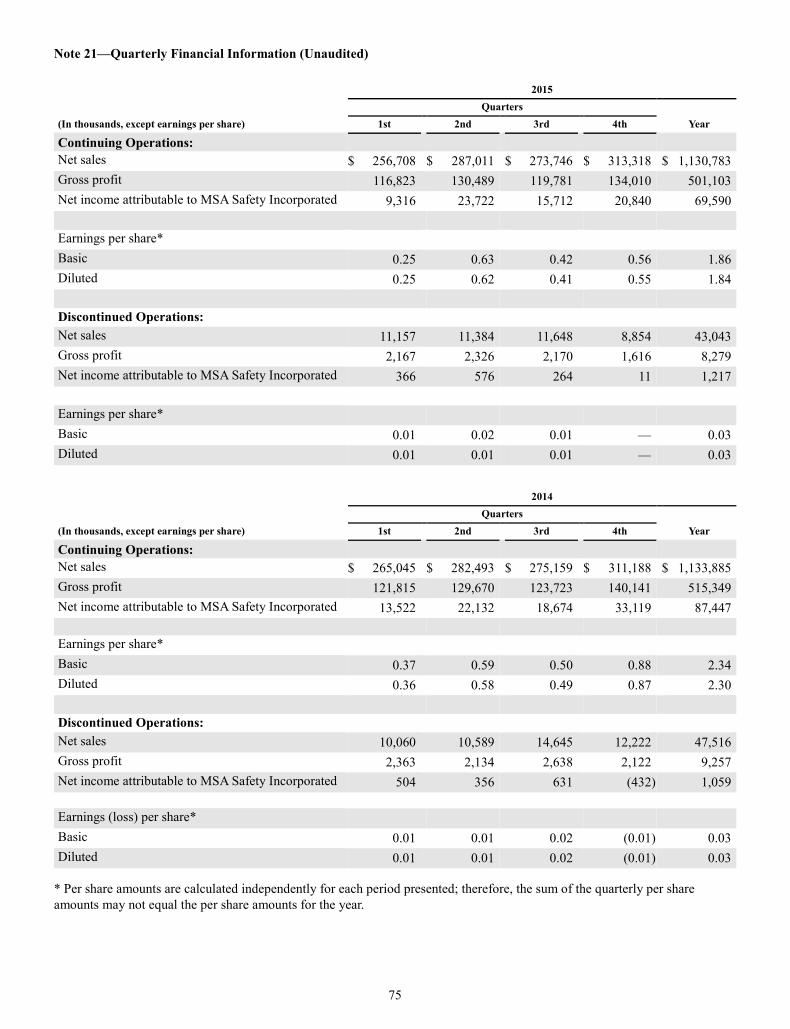
75
Note 21—Quarterly Financial Information (Unaudited)
2015
Quarters
Year (In thousands, except earnings per share) 1st 2nd 3rd 4th
Continuing Operations:
Net sales $ 256,708 $ 287,011 $ 273,746 $ 313,318 $ 1,130,783
Gross profit 116,823 130,489 119,781 134,010 501,103
Net income attributable to MSA Safety Incorporated 9,316 23,722 15,712 20,840 69,590
Earnings per share*
Basic 0.25 0.63 0.42 0.56 1.86
Diluted 0.25 0.62 0.41 0.55 1.84
Discontinued Operations:
Net sales 11,157 11,384 11,648 8,854 43,043
Gross profit 2,167 2,326 2,170 1,616 8,279
Net income attributable to MSA Safety Incorporated 366 576 264 11 1,217
Earnings per share*
Basic 0.01 0.02 0.01 — 0.03
Diluted 0.01 0.01 0.01 — 0.03
2014
Quarters
Year (In thousands, except earnings per share) 1st 2nd 3rd 4th
Continuing Operations:
Net sales $ 265,045 $ 282,493 $ 275,159 $ 311,188 $ 1,133,885
Gross profit 121,815 129,670 123,723 140,141 515,349
Net income attributable to MSA Safety Incorporated 13,522 22,132 18,674 33,119 87,447
Earnings per share*
Basic 0.37 0.59 0.50 0.88 2.34
Diluted 0.36 0.58 0.49 0.87 2.30
Discontinued Operations:
Net sales 10,060 10,589 14,645 12,222 47,516
Gross profit 2,363 2,134 2,638 2,122 9,257
Net income attributable to MSA Safety Incorporated 504 356 631 (432 ) 1,059
Earnings (loss) per share*
Basic 0.01 0.01 0.02 (0.01 ) 0.03
Diluted 0.01 0.01 0.02 (0.01 ) 0.03
* Per share amounts are calculated independently for each period presented; therefore, the sum of the quarterly per share
amounts may not equal the per share amounts for the year.

76
Item 9. Changes in and Disagreements with Accountants on Accounting and Financial Disclosure
None.
Item 9A. Controls and Procedures
(a) Evaluation of disclosure controls and procedures. Based on their evaluation as of the end of the period covered by this
Form 10-K, the Company’s principal executive officer and principal financial officer have concluded that the Company’s
disclosure controls and procedures (as defined in Rules 13a-15(e) and 15d-15(e) under the Securities Exchange Act of 1934 (the
“Exchange Act”)) are effective to ensure that information required to be disclosed by the Company in reports that it files or
submits under the Exchange Act is (i) recorded, processed, summarized and reported within the time periods specified in
Securities and Exchange Commission rules and forms and (ii) accumulated and communicated to our management, including
the principal executive officer and principle financial officer, as appropriate to allow timely decisions regarding required
disclosure.
Management has excluded Latchways from its assessment of internal control over financial reporting as of December 31,
2015 because it was acquired by the Company in a purchase business combination during the fourth quarter of 2015. Latchways
and its affiliates are wholly-owned by MSA.
(b) Changes in internal control. There were no changes in the Company’s internal control over financial reporting that
occurred during the Company’s most recent fiscal quarter, other than the Latchways acquisition, that have materially affected,
or are reasonably likely to materially affect, the Company’s internal control over financial reporting.
See Item 8. Financial Statements and Supplementary Data—“Management’s Report on Internal Control Over Financial
Reporting” and “Report of Independent Registered Public Accounting Firm.”
Item 9B. Other Information
None.

77
PART III
Item 10. Directors, Executive Officers and Corporate Governance
Item 11. Executive Compensation
Item 12. Security Ownership of Certain Beneficial Owners and Management and Related Stockholder Matters
Item 13. Certain Relationships and Related Transactions, and Director Independence
Item 14. Principal Accountant Fees and Services
With respect to this Part III, incorporated by reference herein pursuant to Rule 12b—23 are (1) “Election of Directors,”
(2) “Executive Compensation,” (3) “Other Information Concerning the Board of Directors,” (4) “Stock Ownership,” and
(5) “Selection of Independent Registered Public Accounting Firm,” appearing in the Proxy Statement filed pursuant to
Regulation 14A in connection with the registrant’s Annual Meeting of Shareholders to be held on May 10, 2016. The
information appearing in such Proxy Statement under the caption “Audit Committee Report” and the other information
appearing in such Proxy Statement and not specifically incorporated by reference herein is not incorporated herein. As to
Item 10 above, also see the information reported in Part I of this Form 10-K, under the caption “Executive Officers of the
Registrant,” which is incorporated herein by reference. As to Item 10 above, the Company has adopted a Code of Ethics
applicable to its principal executive officer, principal financial officer and principal accounting officer and other Company
officials. The text of the Code of Ethics is available on the Company’s website at www.MSAsafety.com. Any amendment to, or
waiver of, a required provision of the Code of Ethics that applies to the Company’s principal executive, financial or accounting
officer will also be posted on the Company’s Internet site at that address.
As to Item 12 above, the following table sets forth information as of December 31, 2015 concerning common stock
issuable under the Company’s equity compensation plans.
Plan Category
Number of securities to be issued upon
exercise of outstanding
options, warrants and rights
(a)
Weighted average exercise price of
outstanding options, warrants and rights
(b)
Number of securities remaining available for future issuance
under equity compensation plans (excluding securities
reflected in column (a)) (c)
Equity compensation plans approved by security holders 1,694,675 $ 36.69 1,332,940*
Equity compensation plans not approved by security holders None — None
Total 1,694,675 36.69 1,332,940
*Includes 1,178,625 shares available for issuance under the 2008 Management Equity Incentive Plan and 154,315 shares
available for issuance under the 2008 Non-Employee Directors’ Equity Incentive Plan.

78
PART IV
Item 15. Exhibits and Financial Statement Schedules
(a) 1. Financial Statements and Report of Independent Registered Public Accounting Firm (see Part II, Item 8 of this
Form 10-K).
The following information is filed as part of this Form 10-K.
Page
Management's Report on Responsibility for Financial Reporting and Management's Report on Internal Control Over Financial Reporting 35
Report of Independent Registered Public Accounting Firm 36
Consolidated Statement of Income—three years ended December 31, 2015 39
Consolidated Statement of Comprehensive Income—three years ended December 31, 2015 40
Consolidated Balance Sheet—December 31, 2015 and 2014 41
Consolidated Statement of Cash Flows—three years ended December 31, 2015 42
Consolidated Statement of Changes in Retained Earnings and Accumulated Other Comprehensive Income—three years ended December 31, 2015 43
Notes to Consolidated Financial Statements 44
(a) 2. The following additional financial information for the three years ended December 31, 2015 is filed with the report
and should be read in conjunction with the above financial statements:
Schedule II—Valuation and Qualifying Accounts
All other schedules are omitted because they are not applicable, not material or the required information is shown in the
consolidated financial statements and consolidated notes to the financial statements listed above.
(a) 3. Exhibits
Several of the following exhibits are incorporated herein by reference under Rule 12b-32 of the Securities Exchange Act
of 1934, as amended, as indicated next to the name of the exhibit. Several other instruments, which would otherwise be
required to be listed below, have not been so listed because those instruments do not authorize securities in an amount that
exceeds 10% of the total assets of the registrant and its subsidiaries on a consolidated basis. The registrant agrees to furnish a
copy of any instrument that was so omitted on that basis to the Commission upon request.
3(i) Amended and restated Articles of Incorporation, filed as Exhibit 3.1 to Form 8-K on March 7, 2014, is incorporated herein by reference.
3(ii) Amended and restated By-laws of the registrant, filed as Exhibit 3.2 to Form 8-K on March 7, 2014, is incorporated
herein by reference.
4(a) Second Amended and Restated Note Purchase and Private Shelf Agreement dated January 22, 2016 by and among
MSA Safety Incorporated, Mine Safety Appliances Company, LLC, and the Purchasers named therein, filed as Exhibit 4.1 to the January 28, 2016 Form 8-K, is incorporated herein by reference.
4(b) Form of Amended and Restated Guarantee Agreement entered into as of March 7, 2014 by each of General Monitors,
Inc., General Monitors Transnational, LLC and MSA International, Inc., in favor of the Note Purchasers under the Amended and Restated Note Purchase and Private Shelf Agreement dated as of March 7, 2014 (as confirmed and reaffirmed by such guarantors as of January 22, 2016), filed as Exhibit 4(b) to Form 10-K on February 25, 2015, is incorporated herein by reference.
4(c) Form of Amended and Restated Guarantee Agreement entered into as of March 7, 2014 by each of General Monitors,
Inc., General Monitors Transnational, LLC and MSA International, Inc., in favor of the Note Purchasers under the Amended and Restated Note Purchase and Private Shelf Agreement dated as of March 7, 2014 (as confirmed and reaffirmed by such guarantors as of January 22, 2016), filed as Exhibit 4(c) to Form 10-K on February 25, 2015, is incorporated herein by reference.

79
10(a)* MSA Safety Incorporated 2008 Management Equity Incentive Plan, as amended, filed as Exhibit 10.2 to Form 8-K on March 7, 2014 is incorporated herein by reference.
10(b)* Retirement Plan for Directors, as amended effective April 1, 2001, filed as Exhibit 10(a) to Form 10-Q on May 10,
2006, is incorporated herein by reference.
10(c)* Supplemental Pension Plan as of May 5, 1998, filed as Exhibit 10(d) to Form 10-Q on August 12, 2003, is
incorporated herein by reference.
10(d)* Supplemental Pension Plan as amended and restated effective January 1, 2005, filed as Exhibit 10.3 to Form 10-Q on
November 27, 2013, is incorporated herein by reference.
10(e)* 2008 Non-Employee Directors’ Equity Incentive Plan, as amended through November 27, 2013, filed as Exhibit 10(e)
to Form 10-K on February 24, 2014, is incorporated herein by reference.
10(f)* Executive Insurance Program as Amended and Restated as of January 1, 2006, filed as Exhibit 10(a) to Form 10-Q on
August 7, 2007, is incorporated herein by reference.
10(g)* Annual Incentive Bonus Plan as of May 5, 1998, filed as Exhibit 10(g) to Form 10-Q on August 12, 2003, is
incorporated herein by reference.
10(h)* Supplemental Executive Retirement Plan, effective January 1, 2008, filed as Exhibit 10.2 to Form 10-Q on April 30,
2009, is incorporated herein by reference.
10(i)* Form of Change-in-Control Severance Agreement between the registrant and its executive officers, filed as
Exhibit 10.1 to Form 10-Q on April 30, 2009, is incorporated herein by reference.
10(j)* 2003 Supplemental Savings Plan, effective January 1, 2003, filed as Exhibit 10(k) to Form 10-K on February 24,
2014, is incorporated herein by reference.
10(k)* 2005 Supplemental Savings Plan, effective January 1, 2005, filed as Exhibit 10.4 to Form 10-Q on April 30, 2009, is
incorporated herein by reference.
10(l)* CEO Annual Incentive Award Plan filed as Appendix A to the registrant’s definitive proxy statement dated March 29,
2005, is incorporated herein by reference.
10(m) Second Amended and Restated Credit Agreement dated as of December 9, 2015 by and among MSA Safety
Incorporated, the guarantors party thereto, the lenders party thereto, and PNC Bank, National Association, as administrative agent for the lenders, filed as Exhibit 10.1 to Form 8-K on December 11, 2015, is incorporated herein by reference.
16 Letter of PricewaterhouseCoopers LLP, dated November 24, 2014, regarding change in independent registered public
accounting firm, filed as of Exhibit 16.1 to Form 8-K filed on November 24, 2014, is incorporated herein by reference.
21 Affiliates of the registrant is filed herewith.
23.1 Consent of Ernst & Young LLP, independent registered public accounting firm is filed herewith.
23.2 Consent of PricewaterhouseCoopers LLP, independent registered public accounting firm is filed herewith.
31.1 Certification of William M. Lambert pursuant to Rule 13a-14(a) is filed herewith.
31.2 Certification of Kenneth D. Krause pursuant to Rule 13a-14(a) is filed herewith.
32 Certification of Chief Executive Officer and Chief Financial Officer pursuant to 18 U.S.C.(S)1350 is filed herewith.
101.INS XBRL Instance Document
101.SCH XBRL Taxonomy Extension Schema Document
101.CAL XBRL Taxonomy Extension Calculation Linkbase Document
101.DEF XBRL Taxonomy Extension Definition Linkbase Document
101.LAB XBRL Taxonomy Extension Label Linkbase Document
101.PRE XBRL Taxonomy Extension Presentation Linkbase Document
*The exhibits marked by an asterisk are management contracts or compensatory plans or arrangements.

80
SIGNATURES
Pursuant to the requirements of Section 13 or 15(d) of the Securities Exchange Act of 1934, the registrant has duly caused
this report to be signed on its behalf by the undersigned, thereunto duly authorized.
MSA SAFETY INCORPORATED
February 29, 2016 By /S/ WILLIAM M. LAMBERT
(Date) William M. Lambert Chairman, President and Chief Executive Officer
Pursuant to the requirements of the Securities Exchange Act of 1934, this report has been signed below by the following
persons on behalf of the registrant and in the capacities and on the dates indicated.
Signature Title Date
/S/ WILLIAM M. LAMBERT William M. Lambert
Chairman, President and Chief Executive Officer
February 29, 2016
/S/ KENNETH D. KRAUSE Kenneth D. Krause
Vice President, Chief Financial Officer and Treasurer
February 29, 2016
/S/ RANDALL J. KILLEEN Randall J. Killeen
Controller and Chief Accounting Officer February 29, 2016
/S/ ROBERT A. BRUGGEWORTH Robert A. Bruggeworth
Director February 29, 2016
/S/ ALVARO GARCIA-TUNON Alvaro Garcia-Tunon
Director February 29, 2016
/S/ THOMAS B. HOTOPP Thomas B. Hotopp
Director February 29, 2016
/S/ DIANE M. PEARSE Diane M. Pearse
Director February 29, 2016
/S/ REBECCA B. ROBERTS Rebecca B. Roberts
Director February 29, 2016
/S/ JOHN T. RYAN III John T. Ryan III
Director February 29, 2016
/S/ L. EDWARD SHAW, JR. L. Edward Shaw, Jr.
Director February 29, 2016
/S/ THOMAS H. WITMER Thomas H. Witmer
Director February 29, 2016

81
SCHEDULE II
MSA SAFETY INCORPORATED AND AFFILIATES
VALUATION AND QUALIFYING ACCOUNTS
THREE YEARS ENDED DECEMBER 31, 2015
2015 2014 2013
(In thousands)
Allowance for doubtful accounts:
Balance at beginning of year $ 7,821 $ 7,306 $ 7,402
Additions—
Charged to costs and expenses 1,676 1,249 763
Deductions—
Deductions from reserves, net (1)(2) 1,308 734 859
Balance at end of year 8,189 7,821 7,306
Income tax valuation allowance:
Balance at beginning of year $ 3,763 $ 4,938 $ 3,961
Additions—
Charged to costs and expenses (3) 1,390 — 977
Deductions—
Deductions from reserves (3) — 1,175 —
Balance at end of year 5,153 3,763 4,938
(1) Bad debts written off, net of recoveries.
(2) Activity for 2015, 2014 and 2013 includes currency translation (losses) of $(535), $(332) and $(121), respectively.
(3) Activity for 2015, 2014 and 2013 includes currency translation gains (losses) of $392, $(643) and $242, respectively.

EXHIBIT 21
MSA SAFETY INCORPORATED
SUBSIDIARIES OF THE REGISTRANT
DECEMBER 31, 2015
Name
State or OtherJurisdiction ofIncorporation
General Monitors, Inc. CaliforniaCompañia MSA de Argentina S.A. ArgentinaLatchways plc United KingdomLatchways Inc. TexasHCL Group plc United KingdomMSA Österreich GmbH AustriaMSA Belgium bvba BelgiumMSA do Brasil Ltda. BrazilMSA Canada Inc. CanadaMSA de Chile Ltda. ChileMSA (Suzhou) Safety Equipment R&D Co., Ltd ChinaMSA (China) Safety Equipment Co. Ltd. ChinaMSA International, Inc. DelawareMSA Gallet Holdings SAS FranceMSA Technologies and Enterprise Services SAS FranceMSA Production France SAS FranceMSA Produktion Deutschland GmbH GermanyMSA Europe Holdings GmbH GermanyMSA Europe GmbH SwitzerlandMSA Technologies and Enterprise Services GmbH GermanyMSA Safety Services GmbH GermanyMSA Safety Hungary Ltd. HungaryGeneral Monitors Ireland Limited IrelandMSA Italia S.R.L. ItalyMSA Japan Ltd. JapanMSA Safety Malaysia Sdn. Bhd. MalaysiaMSA de Mexico, S.A. de C.V. MexicoMSA Nederland, B.V. NetherlandsMSA Safety Poland sp. z o.o. PolandMSA S.E. Asia Pte. Ltd. SingaporeSamsac Holdings (Pty.) Limited South AfricaMSA Spain, S.R.U. SpainMine Safety Appliances Company, LLC PennsylvaniaMSA Worldwide, LLC PennsylvaniaMSA Advanced Detection, LLC PennsylvaniaMSA Technology, LLC PennsylvaniaMSA Innovation, LLC PennsylvaniaMSA Safety Development, LLC Pennsylvania
The above-mentioned subsidiary companies are included in the consolidated financial statements of the registrant filed as part of this annual report. The names of certain other subsidiaries, which considered in the aggregate as a single affiliate would not constitute a significant subsidiary, have been omitted.

EXHIBIT 23.1
CONSENT OF INDEPENDENT REGISTERED PUBLIC ACCOUNTING FIRM
We consent to the incorporation by reference in the following Registration Statements:
• Registration Statement (Form S-8 No. 33-43696) pertaining to the 1990 Non-Employee Directors’ Stock Option Plan,• Registration Statement (Form S-8 No. 333-51983) pertaining to the 1998 Management Share Incentive Plan,• Registration Statement (Form S-8 No. 333-121196) pertaining to the MSA Retirement Savings Plan,• Registration Statement (Form S-8 No. 333-157681) pertaining to the 2008 Non-Employee Directors’ Equity Incentive
Plan,• Registration Statement (Form S-8 Nos. 333-174601 and 333-157682) pertaining to the 2008 Management Equity
Incentive Plan, and• Registration Statement (Form S-8 No. 333-199880) pertaining to the Employee Stock Purchase Plan;
of our reports dated February 29, 2016, with respect to the consolidated financial statements and schedule of MSA Safety Incorporated and the effectiveness of internal control over financial reporting of MSA Safety Incorporated included in this Annual Report (Form 10-K) of MSA Safety Incorporated for the year ended December 31, 2015.
/s/ Ernst & Young LLP
Pittsburgh, PennsylvaniaFebruary 29, 2016
EXHIBIT 23.2
CONSENT OF INDEPENDENT REGISTERED PUBLIC ACCOUNTING FIRM
We hereby consent to the incorporation by reference in the Registration Statements on Form S-8 (Nos. 33-43696, 333-51983, 333-121196, 333-157681, 333-157682, 333-174601 and 333-199880) of MSA Safety Incorporated of our report dated February 25, 2015, except for the effects of the change in presentation of deferred taxes discussed in Note 1, and the effects of the change in the composition of reportable segments discussed in Note 7, as to which the date is February 29, 2016, relating to the consolidated financial statements and financial statement schedule, which appears in this Form 10-K.
/s/ PricewaterhouseCoopers LLP
Pittsburgh, PennsylvaniaFebruary 29, 2016
EXHIBIT 31.1
CERTIFICATION OF CHIEF EXECUTIVE OFFICER PURSUANT TO RULE 13a-14(a)
I, William M. Lambert, certify that:
1. I have reviewed this annual report on Form 10-K of MSA Safety Incorporated;
2. Based on my knowledge, this report does not contain any untrue statement of a material fact or omit to state a material fact necessary to make the statements made, in light of the circumstances under which such statements were made, not misleading with respect to the period covered by this report;
3. Based on my knowledge, the financial statements, and other financial information included in this report, fairly present in all material respects the financial condition, results of operations and cash flows of the registrant as of, and for, the periods presented in this report;
4. The registrant’s other certifying officer and I are responsible for establishing and maintaining disclosure controls and procedures (as defined in Exchange Act Rules 13a-15(e) and 15d-15(e)) and internal control over financial reporting (as defined in Exchange Act Rules 13a-15(f) and 15d-15(f)) for the registrant and have:
(a) Designed such disclosure controls and procedures, or caused such disclosure controls and procedures to be designed under our supervision, to ensure that material information relating to the registrant, including its consolidated subsidiaries, is made known to us by others within those entities, particularly during the period in which this report is being prepared;
(b) Designed such internal control over financial reporting, or caused such internal control over financial reporting to be designed under our supervision, to provide reasonable assurance regarding the reliability of financial reporting and the preparation of financial statements for external purposes in accordance with generally accepted accounting principles;
(c) Evaluated the effectiveness of the registrant’s disclosure controls and procedures and presented in this report our conclusions about the effectiveness of the disclosure controls and procedures, as of the end of the period covered by this report based on such evaluation; and
(d) Disclosed in this report any change in the registrant’s internal control over financial reporting that occurred during the registrant’s most recent fiscal quarter (the registrant’s fourth fiscal quarter in the case of an annual report) that has materially affected, or is reasonably likely to materially affect, the registrant’s internal control over financial reporting; and
5. The registrant’s other certifying officer and I have disclosed, based on our most recent evaluation of internal control over financial reporting, to the registrant’s auditors and the audit committee of the registrant’s board of directors (or persons performing the equivalent functions):
(a) All significant deficiencies and material weaknesses in the design or operation of internal control over financial reporting which are reasonably likely to adversely affect the registrant’s ability to record, process, summarize and report financial information; and
(b) Any fraud, whether or not material, that involves management or other employees who have a significant role in the registrant’s internal control over financial reporting.
February 29, 2016
/s/ WILLIAM M. LAMBERT William M. Lambert
Chief Executive Officer

EXHIBIT 31.2
CERTIFICATION OF CHIEF FINANCIAL OFFICER PURSUANT TO RULE 13a-14(a)
I, Kenneth D. Krause, certify that:
1. I have reviewed this annual report on Form 10-K of MSA Safety Incorporated;
2. Based on my knowledge, this report does not contain any untrue statement of a material fact or omit to state a material fact necessary to make the statements made, in light of the circumstances under which such statements were made, not misleading with respect to the period covered by this report;
3. Based on my knowledge, the financial statements, and other financial information included in this report, fairly present in all material respects the financial condition, results of operations and cash flows of the registrant as of, and for, the periods presented in this report;
4. The registrant’s other certifying officer and I are responsible for establishing and maintaining disclosure controls and procedures (as defined in Exchange Act Rules 13a-15(e) and 15d-15(e)) and internal control over financial reporting (as defined in Exchange Act Rules 13a-15(f) and 15d-15(f)) for the registrant and have:
(a) Designed such disclosure controls and procedures, or caused such disclosure controls and procedures to be designed under our supervision, to ensure that material information relating to the registrant, including its consolidated subsidiaries, is made known to us by others within those entities, particularly during the period in which this report is being prepared;
(b) Designed such internal control over financial reporting, or caused such internal control over financial reporting to be designed under our supervision, to provide reasonable assurance regarding the reliability of financial reporting and the preparation of financial statements for external purposes in accordance with generally accepted accounting principles;
(c) Evaluated the effectiveness of the registrant’s disclosure controls and procedures and presented in this report our conclusions about the effectiveness of the disclosure controls and procedures, as of the end of the period covered by this report based on such evaluation; and
(d) Disclosed in this report any change in the registrant’s internal control over financial reporting that occurred during the registrant’s most recent fiscal quarter (the registrant’s fourth fiscal quarter in the case of an annual report) that has materially affected, or is reasonably likely to materially affect, the registrant’s internal control over financial reporting; and
5. The registrant’s other certifying officer and I have disclosed, based on our most recent evaluation of internal control over financial reporting, to the registrant’s auditors and the audit committee of the registrant’s board of directors (or persons performing the equivalent functions):
(a) All significant deficiencies and material weaknesses in the design or operation of internal control over financial reporting which are reasonably likely to adversely affect the registrant’s ability to record, process, summarize and report financial information; and
(b) Any fraud, whether or not material, that involves management or other employees who have a significant role in the registrant’s internal control over financial reporting.
February 29, 2016
/s/ KENNETH D. KRAUSE Kenneth D. Krause
Chief Financial Officer

EXHIBIT 32
CERTIFICATION
Pursuant to 18 U.S.C. (S) 1350, the undersigned officers of MSA Safety Incorporated (the “Company”), hereby certify, to the best of their knowledge, that the Company’s Annual Report on Form 10-K for the year ended December 31, 2015 (the “Report”) fully complies with the requirements of Section 13 (a) or 15 (d), as applicable, of the Securities Exchange Act of 1934 and that the information contained in the Report fairly presents, in all material respects, the financial condition and results of operations of the Company.
February 29, 2016 /s/ WILLIAM M. LAMBERT William M. Lambert Chief Executive Officer
/s/ KENNETH D. KRAUSE Kenneth D. Krause Chief Financial Officer

Board of DirectorsJohn T. Ryan III (3) (4) (5) (6)
Retired (2008); formerly Chief Executive Officer and
Chairman of the Company (Retired, as Chairman, May 2015)
Robert A. Bruggeworth (1) (2)
President and Chief Executive Officer, Qorvo, Inc. (high-
performance RF components and compound semiconductors
manufacturer); Director, Qorvo, Inc.
Alvaro Garcia-Tunon (1) (4) (6)
Retired (2012); formerly Executive Vice President and
Chief Financial Officer, Wabtec Corporation (supplier of technology-
based products and services for rail, transit and other global
industries); Director, Matthews International Corp.;
Director, Allison Transmission Holdings, Inc.
Thomas B. Hotopp (2) (5)
Retired (2003); formerly President of the Company
William M. Lambert (3)
Chairman (as of May 2015), President and Chief Executive Officer
of the Company; Director, Kennametal Inc.
Diane M. Pearse (1) (4) (6)
Chief Executive Officer, Hickory Farms Holdings, LLC
(a specialty foods company)
Rebecca B. Roberts (2)
Retired (2011); formerly President of Chevron Pipe Line Company;
Director, Black Hills Corporation; Director, Enbridge Inc.
L. Edward Shaw, Jr. (4) (5) (6)
Retired (2010); formerly Senior Managing Director, Breeden
Capital Management LLC (investment management and multidisciplinary
professional services firm); Director, HealthSouth Corporation
Thomas H. Witmer (1) (2) (3) (5)
Lead Director; Retired (1998); formerly President and Chief Executive Officer,
Medrad, Inc. (manufacturer of medical devices)
(1) Member of the Audit Committee
(2) Member of the Compensation Committee
(3) Member of the Executive Committee
(4) Member of the Finance Committee
(5) Member of the Nominating and Corporate Governance Committee
(6) Member of the Law Committee
OfficersWilliam M. Lambert
Chairman, President and Chief Executive Officer
Kenneth D. Krause
Vice President, Chief Financial Officer and Treasurer
Joakim Birgersson
Corporate Vice President and General Manager, Europe
Steven C. Blanco
Corporate Vice President and General Manager,
Northern North America
Kerry M. Bove
Senior Vice President and Chief Strategy Officer
Ronald N. Herring, Jr.
Senior Vice President and President, MSA International
Douglas K. McClaine
Senior Vice President, Secretary and General Counsel
Dr. Thomas Muschter
Vice President, Global Product Leadership
Paul R. Uhler
Senior Vice President, Global Human Resources
Nishan J. Vartanian
Senior Vice President and President, MSA Americas
Markus H. Weber
Vice President; Chief Information Officer
Directors and Corporate Officers

Business of MSAMSA is in the business of developing, manufacturing and selling
innovative products that enhance the safety and health of workers and
protect facility infrastructures throughout the world. Critical to MSA’s
mission is a clear understanding of customer processes and safety
needs. MSA dedicates significant resources to research which allows
the company to develop a keen understanding of customer safety
requirements for a diverse range of markets, including the fire service,
construction, public utilities, mining, the oil, gas and petrochemical
industry, HVAC, hazardous materials remediation, and the military.
MSA’s principal products, each designed to serve the needs of these
target markets, include respiratory protective equipment, portable
gas detection instruments and sensors, fixed gas and flame detection
systems, fall and head protection products, as well as products for eye,
face and hearing protection, and thermal imaging cameras.
MSA was founded in 1914 by John T. Ryan and George H. Deike, two
mining engineers who had firsthand knowledge of the terrible human
loss that was occurring in underground coal mines at that time. Their
knowledge of the mining industry provided the foundation for the
development of safety equipment to better protect underground
miners. While the range of markets served by MSA has expanded
greatly over the years, the founding philosophy of understanding
customer safety needs and designing innovative safety equipment
solutions that address those needs remains unchanged.
MSA is headquartered in Cranberry Township, Pennsylvania, with
operations employing 4,600 associates throughout the world.
A publicly held company, MSA’s stock is traded on the New York Stock
Exchange under the symbol MSA.
About the CoverMore than five years
in the making, the
G1 Self-Contained
Breathing Apparatus
(SCBA) represents the
single largest new
product development
effort in MSA’s history.
With two patents
issued and 12 patents
pending (as of the printing of this report), the
G1 SCBA is truly a market “game changer.” Quite
simply, it is the most technologically advanced,
streamlined, balanced, and customizable SCBA that
MSA has ever produced. Firefighters and industrial
workers rely on SCBA to provide respiratory
protection in life-threatening environments. In its
first full year of availability, the G1 unit is already
generating unprecedented demand, as demonstrated
by an $80 million global SCBA backlog at the
beginning of 2015. Even more impressive is the fact
that more than half of all incoming orders for the G1
SCBA are from fire departments using competitive
models. Appropriately so, it was named MSA’s Product
of the Year for 2015 and has rightfully earned its place
on the cover of our 2015 Annual Report.
Our MissionThat men and women may work in safety and that they, their families and their communities may live in health throughout the world.
Our VisionTo be the world’s leading provider of safety solutions that protect workers when life is on the line. We pursue this vision with an unsurpassed commitment to integrity, customer service and product innovation that creates exceptional value for all MSA stakeholders.
Organization
William M. Lambert was elected Chairman of the Board, succeeding John T. Ryan III, who was elected as the company’s chairman in 1991 and served in that capacity for 24 years. Mr. Lambert, who is the fifth chairman in MSA’s century-long history, joined MSA in 1981, became an MSA director in 2007 and was elected President and Chief Executive Officer in May, 2008.
Kenneth D. Krause was elected Vice President, Chief Financial Officer and Treasurer, ensuring continuity of experienced financial leadership. A 10-year veteran of MSA, Mr. Krause most recently served as Vice President, Strategic Finance and Treasurer.
Also in 2015 MSA took several steps to build a solid foundation for the company’s second century in business, including modernizing the company’s 100-year-old business structure. This involved changing MSA’s geographic reporting structure from three regions to two – MSA International and MSA Americas – and changing the areas of responsibility for three of our executive leaders.
Kerry M. Bove was promoted to Senior Vice President and Chief Strategy Officer. In this newly created role, Mr. Bove oversees MSA’s strategic plan execution, mid-course corrections, the execution of M&A activities, and the implementation of strategic marketing strategies. A 36-year veteran of MSA, Mr. Bove most recently served as Vice President and President, MSA International, responsible for MSA’s operations in Asia, Australia, Africa, and Latin America.
Ronald N. Herring, Jr. was promoted to Senior Vice President and President, MSA International. In this capacity, Mr. Herring oversees the company’s business in Europe, Russia, the Caspian Sea region, the Middle East, India, China, Japan, South East Asia, Australia, and Africa. Mr. Herring joined MSA in 1983 and most recently served as Vice President and President, MSA Europe, responsible for MSA’s business throughout Europe as well as in Russia, the Caspian Sea region, the Middle East, and India.
Nishan J. Vartanian was promoted to Senior Vice President and President, MSA Americas. In this role, Mr. Vartanian is responsible for MSA’s business in Spanish-speaking Latin America, Brazil, Mexico, and North America. A 30-year veteran of MSA, Mr. Vartanian most recently served as Vice President and President, MSA North America, responsible for the company’s operations in the U.S., Canada and Mexico.
While Mr. Herring and Mr. Vartanian were officially appointed to these new roles in 2015, they spent the latter half of the year in transition. They began their full-time responsibilities as Senior Vice President and President, MSA International and Senior Vice President and President, MSA Americas, respectively, at the beginning of 2016.
Section 302 Certifications and NYSE CEO CertificationIn June 2015, the Company’s Chief Executive Officer submitted
to the New York Stock Exchange the annual certification as to
compliance with the Exchange’s Corporate Governance Listing
Standards required by Section 303A.12(a) of the Exchange’s Listed
Company Manual. The certification was unqualified.
The Company’s reports filed with the Securities and Exchange
Commission during the past year, including the Annual Report on
Form 10-K for the year ended December 31, 2015, have contained
the certifications of the Company’s Chief Executive Officer and Chief
Financial Officer regarding the quality of the Company’s public
disclosure required by Section 302 of the Sarbanes-Oxley Act.
Shareholders’ InquiriesAdditional copies of the company’s 2015 Annual Report, including
Form 10-K, as filed with the Securities and Exchange Commission,
may be obtained by shareholders after March 31, 2016. Printed
and electronic versions are available. Requests should be directed
to the Chief Financial Officer, who can be reached at one of the
following:
Phone: 724-741-8270
Fax: 866-538-7488
Internet: www.MSAsafety.com
U.S. Mail: MSA
Chief Financial Officer
1000 Cranberry Woods Drive
Cranberry Township, PA 16066
Kenneth D. KrauseWilliam M. Lambert Kerry M. Bove Ronald N. Herring, Jr. Nishan J. Vartanian

Game Changer2015 Annual Report
1000 Cranberry Woods Drive
Cranberry Township, PA 16066
724-776-8600
www.MSAsafety.com


