Page 1
GAMIFICATION IN MARKETING: ASPECTS INFLUENCING INTENTION OF ENGAGEMENT AND BRAND ATTITUDE
Natalia Szyszka
Dissertation
Master in Marketing
Supervised by João Manuel de Frias Viegas Proença
Maria Antónia Rodrigues
2019
Page 2
ii
Acknowledgements
I would like to express my special appreciation and thanks to prof. Maria Antónia Rodrigues
and prof. João Proença for their support and attention during the entire process. I would
also like to thank prof. Luciano Moreira, prof. Miguel Pereira and prof. Pedro Campos for
their help and availability.
I especially thank my family for motivating me, encouraging and supporting all my choices.
Page 3
iii
Abstract
Gamification is the application of game elements and mechanics in non-game context in
order to boost loyalty, engagement and motivation. Nowadays this technique is more and
more commonly used in various contexts. The market offers a number of gamified services
that people use every day for multiple purposes, sometimes for pure pleasure, fun or because
the applications support their goals and help them to progress in skills development. The
goal of this dissertation is to study gamification in marketing context and to examine what
aspects of gamification influence engagement and brand attitude. This study derives from
technology acceptance and motivations literature and tests a model based on TAM and TRA
adapted for marketing context. We used a quantitative methodology in order to examine
users of Duolingo who regularly interact with the service to learn a language. The results of
the statistical analysis reveal that perceived usefulness, perceived social influence and
perceived enjoyment have a significant influence on intention of engagement. Additionally,
we also concluded that perceived usefulness, perceived ease of use, perceived enjoyment and
intention of engagement have a significant effect on brand attitude. This work can be useful
for designers who create gamified experiences and contributes technology acceptance and
marketing literature.
Keywords: gamification, brand attitude, usefulness, ease of use, engagement, playfulness,
social influence
Page 4
iv
Resumo
A gamificação é a aplicação de elementos e mecânicas de jogo em contextos de não-jogo,
promovendo a fidelização, o envolvimento e a motivação. Esta técnica é, hoje em dia, cada
vez mais utilizada em diferentes contextos. O mercado oferece um grande número de
serviços gamificados usados pelas pessoas todos os dias com diferentes objetivos. Quer para
lazer ou diversão ou porque as aplicações ajudam a alcançar os seus objetivos e a desenvolver
as suas capacidades. O objetivo desta dissertação é estudar a gamificação num contexto de
marketing e examinar que aspetos da gamificação influenciam o envolvimento e a atitude
perante a marca. Este estudo emerge da bibliografia de aceitação da tecnologia e motivações,
testando um modelo baseado no TAM e TRA adaptado para um contexto de marketing.
Usamos uma metodologia quantitativa para examinar utilizadores da Duolingo que
regularmente interagem com o serviço de forma a aprenderem uma língua. Os resultados da
análise estatística revelam que a perceção de utilidade, perceção da influência social e
perceção de diversão têm uma influência significativa na intenção de
envolvimento. Adicionalmente, concluímos que a perceção de utilidade, perceção de
facilidade de utilização, perceção de diversão e intenção de envolvimento tem um efeito
significativo na atitude perante a marca. Este trabalho pode ser útil para designers que criam
experiências gamificadas e contribui para a teoria da aceitação de tecnologia e marketing.
Palavras-chave: gamificação, atitude perante a marca, utilidade, facilidade de
utilização, envolvimento, diversão, influência social
Page 5
v
Table of Contents
Chapter I Introduction ..................................................................................................................... 1
1.1. Research objectives and questions ...................................................................................... 2
Chapter II Literature Review ........................................................................................................... 3
2.1 Game and gamification definition ........................................................................................ 3
2.2 Game elements ........................................................................................................................ 6
2.3 Gamification and motivation ................................................................................................ 7
2.4 Perceived usefulness and ease of use ................................................................................... 9
2.5 Perceived social influence .................................................................................................... 10
2.6 Perceived enjoyment ............................................................................................................ 11
2.7 Intention of engagement and brand attitude .................................................................... 13
2.8. The summary of literature review ..................................................................................... 14
Chapter III the Research ................................................................................................................ 15
3.1 Research model and hypothesis.......................................................................................... 15
3.2 Research methodology and data collection....................................................................... 18
3.3 Platform of study- Duolingo ............................................................................................... 19
3.4 Questionnaire ........................................................................................................................ 22
Chapter IV Results and findings ................................................................................................... 23
4.1 Sample characteristics .......................................................................................................... 23
4.2 Factor Analysis ...................................................................................................................... 24
4.3 Data analysis .......................................................................................................................... 28
4.4 Results: First multiple regression analysis: ........................................................................ 30
4.5 Results: Second multiple regression analysis .................................................................... 32
Chapter V Discussion and conclusions ........................................................................................ 35
5.1 Discussion of results ............................................................................................................ 35
5.2 Conclusions and limitation .................................................................................................. 38
Page 6
vi
Reference List ................................................................................................................................... 40
Appendix A. Questionnaire Statements ....................................................................................... 45
Appendix B. Factor analysis I ........................................................................................................ 47
Appendix C. Factor analysis II ...................................................................................................... 49
Appendix D. Factor analysis III .................................................................................................... 50
Appendix E. Multiple regression I ................................................................................................ 52
Appendix F. Multiple regression II ............................................................................................... 53
Page 7
vii
Index of figures
Figure 1. Research model used in our study ................................................................................ 16
Figure 2. Screenshots from Duolingo groups ............................................................................. 20
Figure 3. Linearity and homogeneity I ......................................................................................... 52
Figure 4. Standardized residual normality plot I ......................................................................... 52
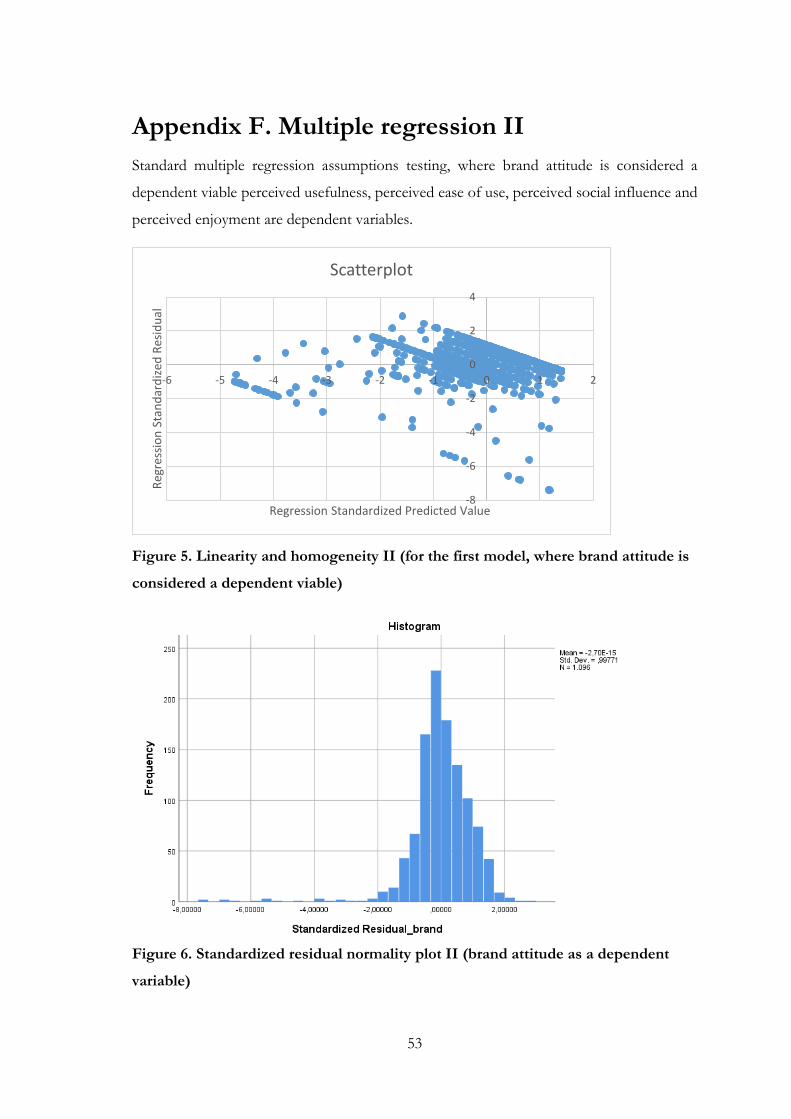
Figure 5. Linearity and homogeneity II ....................................................................................... 53
Figure 6. Standardized residual normality plot II ...................................................................... 53
Page 8
viii
Index of tables
Table 1. Definitions of game ........................................................................................................... 4
Table 2. Game elements identified in Duolingo ......................................................................... 21
Table 3. Sources of measurement for variables used in section 3 of the questionnaire........ 22
Table 4. KMO and Bartlett's Test I – concerning independent variables ............................... 24
Table 5. Rotated component matrix I .......................................................................................... 26
Table 6. KMO and Bartlett's Test II............................................................................................. 26
Table 7. Component matrix- factor loadings I ............................................................................ 27
Table 8. KMO and Bartlett's Test III ........................................................................................... 27
Table 9 Component matrix- factor loadings II ........................................................................... 28
Table 10. Reliability Statistics ......................................................................................................... 29
Table 11. Model summary. (Dependent variable: intention of engagement; predictors:
enjoyment, perceived social influence, usefulness, ease of use) ............................................... 30
Table 12. ANOVA global model significance. (Dependent variable: continued use
intention) ........................................................................................................................................... 30
Table 13. Regression coefficients: dependent variable: intention of engagement ................ 31
Table 14. Regression coefficients. Final model with: dependent variable: intention of
egagement ......................................................................................................................................... 31
Table 15. Model summary. Dependent variable: brand attitude; predictors: enjoyment,
perceived social influence, usefulness, ease of use, intention of engagement. ....................... 32
Table 16. ANOVA global model significance. (Dependent variable: brand attitude) ........... 32
Table 17. Regression coefficients: dependent variable: brand attitude .................................... 33
Table 18. Regression coefficients. Final model with: dependent variable: brand attitude ... 33
Table 19. Summary of results ........................................................................................................ 34
Table 20. Total variance explained (independent virables) ....................................................... 47
Table 21. Communalities (independent virables), ....................................................................... 48
Table 22. Correlations (variable brand attitude) .......................................................................... 49
Table 23. Communalities (variable brand attitude) ..................................................................... 49
Table 24. Total variance explained (variable brand attitude);. .................................................. 49
Table 25. Correlations (variable intention of engagement) ....................................................... 50
Table 26. Communalities (variable intention of engagement) .................................................. 50
Table 27. Total variance explained (variable intention of engagement) .................................. 51
Page 9
1
Chapter I Introduction
Development of technology and internet over the years has completely changed our world.
Technology became essential in business, education, healthcare and entertainment. Access
to information and education became available online and started expanding very quickly. A
dynamic development and growth impacted customers’ expectations and business became
more challenging for the marketers who are forced to provide creative solutions and
outstanding values. Customers became sensitive to design, ease of use and also certain
playfulness and amusement when using products or services. This changing environment has
brought a design focused on creating appealing and entertaining experiences to customers
(Hall & Toke, 2018).
A successful development of numerous applications that involve game features has given a
rise to a new trend: gamification, which became a common practice (Yang, Asaad, &
Dwivedi, 2017). Gamification refers to a use of game elements to engage customers, to
improve employee task performance, to increase usefulness and to reinforce motivation.
Gamification has been applied to various contexts, for example to education, fitness,
wellbeing, healthcare, travelling, sustainable consumption and consumer behaviour,
crowdsourcing and data-collection (Hamari & Koivisto, 2015).
According to Hamari and Koivisto (2015), users perceive gamified services to be more
advantageous, pleasant and helpful in capturing attention. Mentioned above advantages
encourage people to use gamified services. Additionally considering the psychological and
social gains from the traditional form of games, gamification positively influences motivation
and supports learning and development for individuals (Coronado, 2014).
The major difficulty at this moment is that most of the studies are quite theoretical and they
lack empirical evidence. A majority of studies focuses on the excellent outcomes of using
gamification and they typically advocate that gamified systems present significantly better
results than non-gamified ones. Commonly gamification is considered an effective tool to
engage and motivate users (Rapp, Hopfgartner, Hamari, Linehan, & Cena, 2019).
The concept of gamification has been consequently promoted to eventually become an
essential part for organizations to create customer loyalty and drive their marketing (Burke,
Page 10
2
2012). The concept has been examined in human-computer interaction studies and in design
contexts, but it is considered a powerful tool in marketing settings. Interestingly, marketing
literature is not very rich in sources which would focus on gamification. At this point,
literature is missing studies that explain customers’ perception of gamification in the
marketing context and its effects on brand (Yang, Asaad, & Dwivedi, 2017). Marketeers
consider gamification a powerful tool to become closer to their customers, but the factors
that influence positive results are not always clear. The concept is often applied in services
therefore it is necessary to bring it in line with marketing and services literature (Huotari &
Hamari, 2017) and gather insights into factors influencing success of gamification (Hamari,
Koivisto, & Sarsa, 2014).
1.1. Research objectives and questions
This study aims to examine customer´s perception of gamification in marketing context. The
objective is to understand what aspects result in engagement and regular use of a gamified
service as well as positive feelings about the brand.
This dissertation addresses users of a successful gamified service and it aims to answer the
following questions:
1. What aspects influence intention of engagement with a gamified service?
2. What aspects influence brand attitude towards a gamified service brand?
3. Does intention of engagement influence brand attitude?
In order to answer these questions, we will examine the effect of enjoyable experiences,
usefulness, ease of use and perceived social influence on intention of engagement and brand
attitude and we will explore the relationship between engagement and the attitude towards a
brand.
Page 11
3
Chapter II Literature Review
A literature review was the first stage of development of this study and it helped to
understand the relevant theory and existing concepts. This chapter integrates the definition
of games and gamification, game design elements and the most important variables
considered further in the study: perceived ease of use, usefulness, enjoyment, social influence,
brand attitude and continuous use intention.
2.1 Game and gamification definition
Game industry has been very successful over the years thus it gave the foundation to the
accumulative interest in applying game mechanics and design in other contexts. A common
association with games is fun, playful activity with purely hedonic characteristics. Table 1
presents various definitions collected by Juul (2003), who gathered seven existing definitions,
analysed their similarities and differences and based on this proposed his idea of game. The
author concluded, that definitions from diverse researchers sound a little different, but they
have much in common because they consider similar aspects articulated in different ways.
While some authors mention conflicts, others refer to goals. Some discuss rules while others
reference formal systems. Juul (2003) derived from all of them and proposed the following
definition: “A game is a rule-based formal system with a variable and quantifiable outcome,
where different outcomes are assigned different values, the player exerts effort in order to
influence the outcome, the player feels attached to the outcome, and the consequences of
the activity are optional and negotiable” (Juul, 2003, p. 5).
Author Definition
Johan Huizinga 1950 "[...] a free activity standing quite consciously outside ”ordinary”
life as being ”not serious”, but at the same time absorbing the
player intensely and utterly. It is an activity connected with no
material interest, and no profit can be gained by it. It proceeds
within its own proper boundaries of time and space according to
fixed rules and in an orderly manner. It promotes the formation
of social groupings which tend to surround themselves with
secrecy and to stress their difference from the common world by
disguise or other means."
Page 12
4
Roger Caillois 1961 “[...] an activity which is essentially: Free (voluntary), separate [in
time and space], uncertain, unproductive, governed by rules,
make-believe.”
Bernard Suits 1978 "To play a game is to engage in activity directed towards bringing
about a specific state of affairs, using only means permitted by
rules, where the rules prohibit more efficient in favour of less
efficient means, and where such rules are accepted just because
they make possible such activity.”
Avedon & Sutton
Smith 1981
"At its most elementary level then we can define game as an
exercise of voluntary control systems in which there is an
opposition between forces, confined by a procedure and rules in
order to produce a disequilibria outcome.”
Chris Crawford 1981 "I perceive four common factors: representation ["a closed
formal system that subjectively represents a subset of reality"],
interaction, conflict, and safety ["the results of a game are always
less harsh than the situations the game models"]."
David Kelley 1988 "A game is a form of recreation constituted by a set of rules that
specify an object to be attained and the permissible means of
attaining it."
Katie Salen & Eric
Zimmerman 2003
"A game is a system in which players engage in an artificial
conflict, defined by rules, that results in a quantifiable outcome.”
Table 1. Definitions of game adapted from Juul (2003).
Besides playful activities, literature also identifies serious games, which are created for a
different purpose than entertainment. Serious games are fully developed computer or video
games that are not used for entertainment reasons but to teach or train people. They are
used commonly in education, management, healthcare or military (Susi, Johannesson, &
Backlund, 2007). Deterding et al. (2011) indicate that “Gamification may easily be confused
with serious games, which are games made for non-entertainment purposes”. In the contrary
to serious games, gamification applies only single elements from games (i.e. ranks or
achievements) and implements them into non-game applications to enhance marketing
activities, but this will be further explored later in this dissertation.
Page 13
5
The term gamification was originally created by Nick Pelling in 2002, but it started gaining
more popularity in academia only several years later, around 2010 (Liu, Santhanam, &
Webster, 2017). The ancestries of the concept of gamification and the curiosity in the topic
go back to 1982. At that time, Thomas Malone studied why computer games were attractive
to users and what game features could be applied to non-game interfaces with the same big
success (Malone, 1982). In his work Malone (1982) concluded that challenge, fantasy,
multiple layers of complexity, productive and involving metaphors can be incorporated to
non-game interfaces to make them more successful and significantly improve attractiveness.
With time gamification has been gaining more and more attention but there is not only one
definition of this concept, but more (Huotari & Hamari, 2017) One of the best known
definitions states that: “Gamification is the use of game design elements in non-game
contexts” (Deterding, Dixon, Khaled & Nacke, 2011) and another states: “Gamification is
application of game characteristics or features to non-game context” (Robson , Plangger,
Kietzmann, McCarthy, & Pitt, 2015).
In the context of services marketing, Hamari and Huotari (2017) propose that: “Gamification
refers to a process of enhancing a service with affordances for gameful experiences in order
to support users’ overall value creation”. This point of view draws attention to the task that
gamification performs instead of the elements that it´s built of. The same authors also state
that “gamification is a form of service packaging where a core service is enhanced by a rule-
based service system that provides feedback and interaction mechanisms to the user with an
aim to facilitate and support the users’ overall value creation” (Huotari & Hamari, 2011).
Gamification is used as a tool to increase customer’s satisfaction, benefits, loyalty and
engagement. Gamified experiences can also strongly influence behaviours and encourage
desired actions (Blohm & Leimeister, 2013) therefore nowadays plenty of organizations use
gamification to stimulate customer motivation, improve employee performance, inspire and
promote healthy lifestyle and fitness or motivate pupils and students to learn. (Deloitte,
2013).
Although most of the existing studies draw attention to successful stories of gamification,
there is also a discussion about the side effects and misuse of the technique. Hyrynsalmi,
Kimppa, & Smed ran a comprehensive literature review to understand the side effects of
gamification. They found out that applying game elements to provoke desired behaviour may
Page 14
6
be unethical, harmful or cause addictions if used inappropriately (Hyrynsalmi, Kimppa, &
Smed, 2017). It is remarkable that literature is missing critical observations on gamification
and its´ negative side effects, for example demotivation. It is definitely worth to understand
what are the benefits and drawbacks of this concept (Rapp, Hopfgartner, Hamari, Linehan,
& Cena, 2019; Leclercq , Hammedi & Poncin, 2018).
2.2 Game elements
Game elements are the key features for gamification design and they can be defined as
construction blocks or the games (Deterding, Dixon, Khaled & Nacke, 2011). Game design
elements are visual illustrations of feedback, points, ranks or badges situated in some specific
context, with opportunity to progress by collecting different levels and achievement (Mekler,
Brühlmann, Tuch & Opwis, 2017).
Points are one of the elementary components, which can be collected by users over time,
when executing specific activities and tasks. They are customarily used as a motivation tool
to reach desired goals and levels (Sailer , Hense, Mayr, & Mandl, 2017). Points are easy to
evaluate, therefore they facilitate the task of keeping the score and of comparing progress
between participants. Points are perfect means for providing feedback, which is a key
component of good game design (Hall & Toke, 2018).
Werbach and Hunter (2012) define badges as “a visual representation of an achievement with
the gamified process”. Badges are the rewards for accomplishments representing users’
uniqueness. According to Hamari, Koivistoand and Sarsa (2014) badges are one of the most
commonly used elements and they can increase user activity and motivate the users to choose
specific challenges in order to earn desired recognition. Gaining badges might also symbolize
being a part of a social group with specific attributes and status (Werbach & Hunter, 2012).
Performance graphs and feedback presented on a progress bar are used to control the stages
and achievements. They provide tracking of player's own performance over time focusing
on presenting the improvement. According to motivation theory, this element supports
mastery orientation, which encourages further progress (Sailer , Hense, Mayr, & Mandl,
2017).
Page 15
7
A leader board ranks players depending on their success. It usually is a chart which presents
a comparison of achievements of users who take part in a competition or a list that ranks the
users according to a certain variable, for example, the number of points they gained. Leader
boards are meant to motivate users to progress, however the real motivational power of
leader boards is debateable. A leader board works as a good motivator whenever there are
just a few points missing to progress to the next level, but creating a social pressure may have
a negative influence on users who are on the bottom of the leader board. The effectiveness
of this element is more likely to exist whenever the competitors are on a similar level.
Otherwise there is a risk that users will feel discouraged and the effect will be negative and
hold users or player from active participation (Sailer , Hense, Mayr, & Mandl, 2017).
Another widely held game element is self-representation with avatar, which is a personalized
character. This element is commonly used in various kind of applications and services. By
default avatars are designed or chosen by the users and they give players a chance to adopt
or create their identity and are a way of self-expression in the context (Sailer , Hense, Mayr,
& Mandl, 2017).
One additional element of the game is a narrative context which refers to the stories in the
background. The narrative context is not related to the achievements of players, it only gives
the game a character or a meaning providing for example a story in the background of the
core activity. It may be an element of augmented reality, which helps to stimulate some
activity, for example running (Deterding, Dixon, Khaled, & Nacke, 2011; Sailer , Hense,
Mayr, & Mandl, 2017).
2.3 Gamification and motivation
Motivation is a crucial element for people´s actions, it is an impulse, which provokes doings
and influences behavioural decisions. People who feel a desire and head towards a specific
goal or achievement are motivated, while people who do not feel this energy nor impulse are
considered unmotivated (Deci & Ryan, 2000). One cannot generalize the strength of
motivation, because it deepens on each person. People not only have various amounts of
motivation but also different source of motivation. A person who decides to learn a language
may be motivated to study in order to gain new skills because he or she sees a potential utility
Page 16
8
in it or because learning could result in receiving a good grade or gaining points (Deci &
Ryan, 2000)
According to self-determination theory (SDT) by Edward L. Deci and Richard Ryan it is
possible to distinguish between divergent types of motivation based on the reasons that drive
the actions. The psychological, innate needs which foster behaviours are the following:
competence- the need to produce desired outcomes; autonomy- the need to feel in charge
of one´s behaviour; and relatedness- the desire to be connected with others. Subsequently,
the SDT distinguishes between intrinsic and extrinsic motivations. With extrinsic motivation
a person tends to perform a task, or participate in some activity in order to get rewarded or
to avoid negative consequences, for example, a punishment from the external world. Intrinsic
motivation, on the other hand, has to do with willingness to perform an activity purely
because of enjoyment or fun (Deci & Ryan, 1885). Users’ engagement in games is associated
with intrinsic and extrinsic motivations that drive people for action. Gamified services are
able to incorporate both kinds of stimulation to capture users’ attention depending on the
desired outcome (Coronado, 2014).
Firms apply gamification in order to influence stakeholders. They intend to engage and
manage employees and customers to achieve desired goals and boost desired behaviours.
(Liu, Santhanam, & Webster, 2017; Hamari & Koivisto, 2015). Through application of
gamification to services organizations can build an emotional connection with players and
encourage them to work towards desired goals (Robson , Plangger, Kietzmann, McCarthy,
& Pitt, 2015).
Successful gamification helps to provide positive emotional outcomes through stimulation
of motivational mechanisms. Effective gamified services support positive emotional
outcomes and thanks to this, stimulate the creation of habits which result in repetitive
actions. This suggests that engagement and continued use is a matter of habit which are
created over time (Robson , Plangger, Kietzmann, McCarthy, & Pitt, 2015).
In the context of gamification and motivation is also important to look into technology
adoption and acceptance literature. The literature focused on technology adoption identifies
two groups of services and systems, based on the purpose of their use and depending on the
tasks they have to perform. The first group are services, which aim to support achievement
of goals, which are external to the service itself. They are considered utilitarian (Davis, 1989;
Page 17
9
van der Heijden, 2004). On the other hand, the services which are used for fun and
enjoyment are known as hedonic services (van der Heijden, 2004). Hamari and Koivisto
(2015) emphasize that gamified services can influence motivation and engagement thanks to
the hedonic and utilitarian benefits they deliver, therefore they can be powerful marketing
tools.
According to Robson et al. (2015) all firms desire to motivate and involve their stakeholders
and their target group could be various, for example customers, employees, voters or
students and many others. Gamification is a method that helps them to achieve this through
application of mechanisms from gaming industry to create and ambience can motivate and
engage people in non-game settings (Robson et al., 2015).
2.4 Perceived usefulness and ease of use
Perceived usefulness and ease of use, have their roots in technology acceptance literature.
Perceived usefulness is traditionally seen as the evaluation of the utility of a specific system,
especially in work environment where it is expected to perform specific tasks (Davis &
Venkatesh, 2000) The evaluation of usefulness focuses on assessing whether the system can
help to complete a task or a job, for example making the process easier, faster and more
efficient (Davis, 1989).
According to studies on technology acceptance, perceived ease of use reflects “the degree to
which a person believes that using a particular system would be free of effort” (Davis, 1989).
Perceived usefulness has been found the most important determinant of acceptance in work
environment (Davis, 1989). An application or a service, which is considered free from
obstacles, becomes more interesting to users through promotion of a sense of efficiency, this
means they are more likely to continue using it (Hamari & Koivisto, 2015).
Perceived ease of use is an important factor that influences peoples' intention or attitude,
and has a significant influence on customer satisfaction (Yang, Asaad, & Dwivedi, 2017). It
is confirmed, that ease of use plays an important role at the early stage of adoption, when
one needs to put the efforts to learn and use a technology. User´s evaluation of the difficulty
in acquiring this new technology is essential for acceptance and further engagement (Davis,
Bagozzi, & Warshaw, 1992; Venkatesh V. , 2000).
Page 18
10
A recent study which addressed school students, focused on attitudes towards playing
educational games reveals that ease of use does not contribute to student’s attitude towards
the games (Camilleri & Camilleri, 2019), however in work environment, ease of use plays a
key role for adoption and use of a system (Davis, Bagozzi, & Warshaw, 1992). This adds to
the discussion on ease of use, as there are various contradicting studies.
Engaging customers with gamified activities can be useful to increase brand awareness,
change customers’ brand attitude and influence the intention of purchase. There is also an
evidence that perceived usefulness affects brand attitude and can predict people´s attitude
towards a new system or technology. More and more companies are applying gamification
to influence their consumers' attitudes and behaviours (Yang, Asaad, & Dwivedi, 2017).
2.5 Perceived social influence
In the technology adoption literature, the social influence is described as a subjective norm,
which corresponds to an individual’s perception of how important others consider some
specific behaviour or action, whether they recognize it and if they expect someone to
perform it (Ajzen, 1991; Hamari & Koivisto, 2015). Subjective norm has been confirmed to
be reliable predictor of human behaviour and attitudes (Ajzen, 1991)
Davis and Venkatesh (2000) examined perceived social influence in a workplace
environment. They observed people´s behaviour and attitude towards a mandatory use of a
system and towards a voluntary use of a system. The authors concluded that social influence
has a significant impact on both when considering a mandatory use of a system with
utilitarian goal. This means that people are likely to use the system because it is clearly
expected from them and it serves an external goal. On the other hand, the authors concluded,
that social influence does not significantly impact attitude and intentions of use when the
system is voluntary. This suggests that people do not rely on the social aspects when
evaluating whether they want to use a system, in such case they rely more on their intrinsic
motivations. Additionally, over time and with experience, social influence becomes a less and
less important factor influencing continued use and usefulness (Davis & Venkatesh, 2000).
Lewis, Argwal and Sambamurthy (2003) also examined the influence of social aspects on the
beliefs about the system and the use intention in a work environment. In line with Davis and
Page 19
11
Venkatesh, they concluded that social influence has direct impact on the attitudes and the
behavioural intentions which are influenced by attitude.
In gamification context, Hamari and Koivisto (2015) exminded users of Fitocracy, an online
gamified fitness service in order to understand what benefits motivate users to get engaged
in gamification. The authors concluded that perceived social influence positively affects
attitude, but not necessairly behaviour. This suggests that there could be a value- action gap
which means that people express their enthusiasm about certain ideas or services because
they find it desirable, but this attitude does not reflect in their actions. In other words, people
express their support for certain ideas or behaviours but they do not act in accordance. Yang,
Asaad, and Dwivedi (2017) suggest that there is a relationship between social influence and
attitude, but it does not impact continued use intention.
Another study completed by Hamari and Koivisto (2013) was focused on examining how
social factors predict attitude towards gamification and intention to continue using gamified
services. Once again, they considered Fitocracy, the fitness tracking application. The results
revealed that “social factors are strong predictors for how gamification is perceived and
whether the user intends to continue using the service and/or recommending it to others”.
The results indicate that attitude towards a gamification service is a solid determinant of
user´s intention.
When interacting with the community, a customer hypothetically gets recognized by other
users (Cheung, Chiu, & Lee, 2011; Hamari & Koivisto, 2015). As a consequence, a service
becomes potentially more attractive when the user feels recognized (Hamari & Koivisto,
2015). Existing literature confirms, that people naturally seek for recognition and acceptance
from the ones around them. Using a specific service and repeating particular behaviour can
sometimes help them to gain such positive feeling. A service which provides desired social
outcomes generates a positive sensation and, therefore, also the intention to continue using
it (Hamari & Koivisto, 2015). This thesis assumes that the social aspect directly influences
attitude and the intention of continued use.
2.6 Perceived enjoyment
Enjoyment refers to a positive feeling of pleasure when performing activities. According to
Davis, Bagozzi, & Warshaw (1992) enjoyment is an intrinsic compensation obtained thanks
Page 20
12
to the use of technology. These authors found that enjoyment significantly affects adoption
intention, therefore they provided a solid evidence that enjoyment is an important factor that
motivates people to practice some behaviours or ideas or quit them. Hernik and Jaworska
(2018) believe that having a pleasant experience while learning is one of the crucial conditions
for a successful learning process. They completed a study at the University of Western
Pomerania, where they compared amusing classes and traditional ones and they concluded
that students were happier and more engaged when classes were entertaining. It is evidenced,
that good emotions can positively influence people´s physical and psychological state,
therefore people usually aim to perform tasks which they find interesting and which help
them to maximize enjoyment (Hernik & Jaworska, 2018; Ryan, Rigby & Przybylski, 2006;
Harwood & Garry, 2015)
Van der Heijden (2004) studied differencies in acceptance of utilitarian and hedonic
information systems and he confirmed that ease of use and enjoyment have more significant
influence on adoption of hedonic systems, while perceived usefulness is more valuable for
utilitarian ones. This is because utilitarian services aim to make the goal more efficiently
achievable while hedonic services focus on providing intrinistic rewards and through
enjoyment they promote engagement (van der Heijden, 2004).
Previous study focused on task performance proves that gamification positively influences
work, motivation and engagement through feeling of accomplishment and enjoyment.
(Cardador, Northcraft, & Whicker, 2017). It was concluded, that gamification has the power
to engage because it incorporates “something borrowed – from video games, something cool
– namely tasks that are more game-like, and thus more enjoyable” (Cardador, Northcraft, &
Whicker, 2017) thanks to enjoyable experiences it generates positive effects on engagement
with specific objects, for example brands or activities (Harwood & Garry, 2015; Cardador,
Northcraft, & Whicker, 2017).
Yang et al. (2017) suggest that “perceived enjoyment of a new marketing system is closely
related to the attitude towards that system, and people's attitude towards that system is also
possibly related to their attitude towards the brand embedded in that system”. This suggests
that positive feelings towards marketing systems are linked with attitude and that this is likely
to generate a positive attitude towards a brand of the system.
Page 21
13
2.7 Intention of engagement and brand attitude
Attitude is a lasting overall evaluation of an object, people, events, issues and products. It
influences consumers’ behaviour, intentions and opinions (Madichie, 2012). The attitudes
can be positive or negative and they can last for a long time and be influenced by various
factors. The aspects that impact the attitude are for example communication, quality and
experience and they can be altered over time (Madichie, 2012). Marketeers need to recognize
consumers’ attitudes in different contexts and to plan what measures to employ in order to
make sure that users will adopt positive attitude towards an offer (Madichie, 2012). The
psychology literature maintains that beliefs and attitudes related to a defined technology
strongly influence intention to use it.
Attitude towards brands is a well-studied subject in marketing literature. According to
Machado, Lencastre, Carvalho and Costa (2012) brand attitude is a relatively simple
unidimensional construct, based just on the affect attached to a brand. The traditional
understanding of brand attitude assumes that the attitude is based on three different
dimensions: Affective- emotions and feelings towards the brand; Behavioural- intentions to
act towards the brand; Cognitive- beliefs and thoughts about the brand (Seitz & Aldebasi,
2016). Literature also specifies, that brand attitude can be considered an affective reaction of
audience to brand, which includes that the stakeholders feel that the brand is good or bad,
favourable or not, wise or foolish (Najmi, Atefi, & Mirbagheri, 2012).
Literature indicates that engagement is related to user experience which delivers feelings of
challenge, feedback, novelty, interactivity, user control. Nowadays, there are applications that
evidence that when there is gamification involved, the collaboration level and willingness to
engage and share information is very high (Coronado, 2014). Yang et al. (2017) examined the
influence of attitude on engagement. Traditionally, the literature is focusd on the contraty,
however the study found positive effect of the intention of engagement on brand attitude in
the context of gamification marketing.
Gamification in marketing is considered a very promising tool to engage and manage
customers (Harwood & Garry, 2015). According to Lucassen and Jansen (2014) maketeers
have very high hopes for gamification, considering it an interesting addition to the marketing
activities and brands because it increases brand awareness, improves attitudes and
engagement through a positive interaction. According to the research of the same authors,
Page 22
14
marketeers believe that gamification can help them to be closer to their customers and users
of services, build loyalty and collaboration. However, is not clear how to build successful
gamification. Lucassen and Jansen (2014) call attention to the fact that marketing literature
lacks in studies focused on adoption of gamification in marketing, it does not provide
answers on how to create successful experiences in various contexts and how do specific
mechanisms really influence marketing outcomes.
Engaged customers are very desired by companies, as they demonstrate a stronger brand
trust, loyalty and satisfaction. They are more likely to contribute to the development of
services or goods, be a source of positive word of mouth that can attract other customers
(Leclercq , Hammedi, & Poncin, 2018).
2.8. The summary of literature review
Game industry has been very successful during many years and this is what inspired designers
to apply game elements and mechanics to non-game reality. Application of game elements
like points, badges, leader boards, progress bars and others helps to improve attractiveness
of services and applications and motivates users to perform specific tasks, take desired
actions, progress and compete with others. Gamification positively influences usefulness and
ease of use because it combines both hedonic and utilitarian aspects. Gamified services are
able to increase the user’s activity and motivations to work towards goals and also make
processes more appealing interesting and enjoyable thanks to the entertaining elements.
The technology acceptance literature and human-computer interaction studies are quite rich
in sources and analysis of benefits and mechanics of gamification. Technology acceptance
literature is a good source of information about the influence of perceived usefulness, ease
of use, social influence and enjoyment on adoption and attitudes towards new systems. There
is a lack of studies that would evaluate the same factors in marketing context considering
gamified service brands. There is a lot of opportunities to develop new concepts around
gamification in marketing setting. It is worth to look into the marketing outcomes of using
gamification, from the perspective of relationship marketing, customer loyalty and
engagement. Gamification is widely applied by multiple organizations and recognized by
marketers however there is a lack of studies that would prove that gamification is beneficial
for marketing outcomes.
Page 23
15
Chapter III Research
This chapter includes the description of the methodology, research model and hypothesis to
explore, as well as the description of the platform of study, a language learning service that
was examined in this dissertation. This chapter also contains the description of the process
of data collection, the characteristics of a sample and conducted analysis.
3.1 Research model and hypothesis
In this dissertation we aim to identify the variables that influence customers’ intention to
engage with the gamified service and to explore the relationship between the engagement
and the attitude.
From the historical point of view the antecedents of the Technology Acceptance Model
(TAM) are in the Theory of Reasoned Action (TRA), a model that emerged in psychology
and was proposed by Fishbein and Ajzen (1975). According to these authors before people
take any actions, they do consider their consequences and implications. Human activity is
rational and logic and the information that people can capture is evaluated and creates
attitudes and behavioural decisions.
According to TAM, there are two major predictors of intention of use: perceived usefulness
and perceived ease of use. According to Davis (1989) perceived usefulness is the belief that
using a specific system improves work performance, and on the other hand, perceived ease
of use is a belief that using the system is free from effort (Davis, 1989). Both elements are
included in the model considered in our study. They allow to understand the user’s
perception on usefulness and ease of use of the gamified system. TAM was criticized by latter
researches for omitting some important factors, among them social influence (Davis &
Venkatesh, 2000). Social aspects in the literature focused on technology adoption are usually
considered as perceived social influence and it refers to what others think about the target
behaviour (Hamari & Koivisto, 2015).
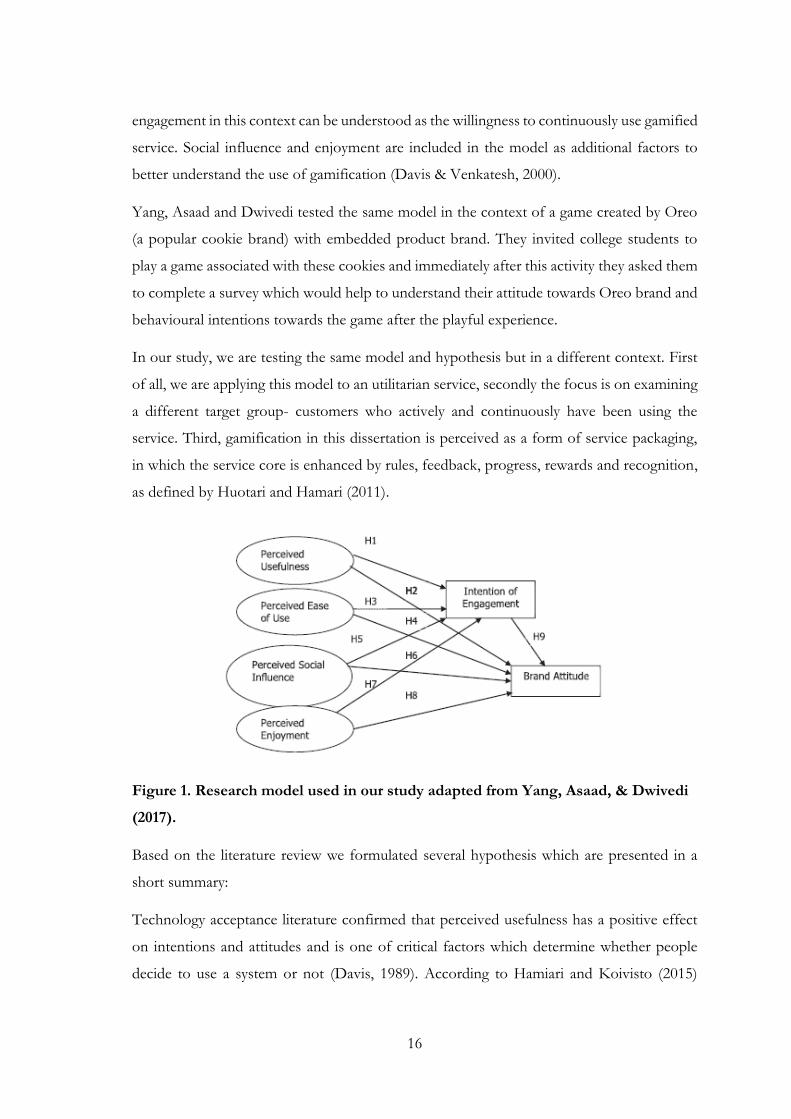
The research model used in this dissertation was defined by Yang, Asaad and Dwivedi (2017).
It is based both on TAM and TRA, however it intends to examine gamification in the
marketing context. Instead of the attitude towards a system, this model incorporates brand
attitude and the intention to use is replaced by intention of engagement. Intention of
Page 24
16
engagement in this context can be understood as the willingness to continuously use gamified
service. Social influence and enjoyment are included in the model as additional factors to
better understand the use of gamification (Davis & Venkatesh, 2000).
Yang, Asaad and Dwivedi tested the same model in the context of a game created by Oreo
(a popular cookie brand) with embedded product brand. They invited college students to
play a game associated with these cookies and immediately after this activity they asked them
to complete a survey which would help to understand their attitude towards Oreo brand and
behavioural intentions towards the game after the playful experience.
In our study, we are testing the same model and hypothesis but in a different context. First
of all, we are applying this model to an utilitarian service, secondly the focus is on examining
a different target group- customers who actively and continuously have been using the
service. Third, gamification in this dissertation is perceived as a form of service packaging,
in which the service core is enhanced by rules, feedback, progress, rewards and recognition,
as defined by Huotari and Hamari (2011).
Figure 1. Research model used in our study adapted from Yang, Asaad, & Dwivedi
(2017).
Based on the literature review we formulated several hypothesis which are presented in a
short summary:
Technology acceptance literature confirmed that perceived usefulness has a positive effect
on intentions and attitudes and is one of critical factors which determine whether people
decide to use a system or not (Davis, 1989). According to Hamiari and Koivisto (2015)
Page 25
17
Usefulness predicts intention of engagement especially for utilitarian systems. Gamification
has the power to increase brand awareness and influence the attitude ( Lucassen & Jansen,
2014), therefore we assume that the same would apply to marketing context and we assume
that:
H1. Perceived usefulness positively influences intention of engagement.
H2. Perceived usefulness positively influences brand attitude.
People are more likely to use a technology whenever they consider it easy. Consequently, the
literature confirms that ease of use influences attitudes and behavioural intentions (Davis,
1989). It is also confirmed that ease of use plays an important role at the initial stage of use
and has influence on further engagement (Davis, Bagozzi, & Warshaw, 1992) and It is
significant for overall satisfaction (Yang, Asaad, & Dwivedi, 2017). Consequently we propose
the following hypothesis:
H3. Perceived ease of use positively influences intention of engagement.
H4. Perceived ease of use positively influences brand attitude.
It is confirmed that perceived social influence is a reliable predictor of human behaviour and
attitude (Ajzen, 1991). People are likely to perform specific actions when they believe that
one or more people around them expect them to do so, especially in the work environment
and with mandatory systems (Davis & Venkatesh, 2000; Lewis, Agarwal, & Sambamurthy,
2003). Although the aspect of social influence seems arguable, considering that some studies
did not confirm its´ significance on engagement and continued use (Yang, Asaad, & Dwivedi,
2017; Hamari & Koivisto, 2015) we consider the object of our study as a utilitarian service,
therefore we propose the following hypothesis:
H5. Perceived social influence positively influences intention of engagement
H6. Perceived social influence positively effects brand attitude
Page 26
18
An important motivation for playing games is pleasure. If users do not enjoy certain activity
they will avoid it and whenever it is entertaining, they will more likely engage and use it. Users
will be more eager to continue using a system which satisfies their hedonic needs than a
system which does not gratify them in this dimension (van der Heijden, 2004). Pleasant
experiences generate positive emotions and it´s confirmed that this helps to positively
influence people´s physical and psychological state, therefore people usually aim to perform
tasks which they find interesting and which help them to maximize enjoyment (Hernik &
Jaworska, 2018; Ryan, Rigby & Przybylski, 2006; Harwood & Garry, 2015) therefore we
propose that:
H7. Perceived enjoyment influence positively effects intention of engagement
H8. Perceived enjoyment positively influences brand attitude
In general, literature is focused on measuring the impact of attitude on behavioural intention
and it confirms that attitude is a predictor of behavioural intentions. In this dissertation we
evaluate brand attitude based on the overall evaluation of the service usage (Ajzen, 1991).
Yang, Asaad, and Dwivedi (2017) proposed that intention of engagement in marketing
activities creates emotional ties between the brand and the user, therefore we assume that:
H9. Intention of engagement positively influences brand attitude
3.2 Research methodology and data collection
The first step before data collection was a comprehensive literature review. The analysis of
the literature gives the opportunity to understand established models and existing concepts
and helps to understand current debates, theories and gaps. Based on the analysis of existing
studies, one can notice that most of the literature is focused on design and human computer
interaction. There is only one study, which examined gamification in relation to brand
attitude and intention of engagement and it was focused on a retail brand. There is a lack of
studies in various contexts.
Next it was decided that the study will have a quantitative approach, which is the best option
to answer the research questions of this dissertation. Data collection run through an online
questionnaire. According to Bhattacherjee (2012) survey research has several advantages. It
Page 27
19
is a perfect tool to measure unobserved data like preferences, characteristics, attitudes,
behaviours and beliefs. Secondly this choice enables to obtain a large sample size from a big
population, for example entire country or world and collect data remotely. Third, they are
preferred by some respondents due to their discrete and convenient character.
In order to reach users of the platform, the questionnaire was available online in multiple
groups on Facebook, for example: Duolingo English Spanish, Duolingo Norwegian
Learners, Duolingo Italian Learners, Duolingo Greek Learners, Duolingo Hebrew Learners,
Duolingo Polish Learners, etc.
3.3 Platform of study- Duolingo
At some point of the work it was necessary to decide what service or application should be
considered in the study and at that time Duolingo was considered a good example to
examine. Firstly, Duolingo is confirmed to be a gamified learning platform (Huynh, Zuo, &
Iida, 2016). Additionally, according to their website, Duolingo is the most popular language-
learning platform and the most downloaded education application in the world (Duolingo,
n.d.). Besides this, the interest in Duolingo in this dissertation emerged from active
observation of Duolingo groups on Facebook. These groups, which one can find in social
media, have a lot of inter-user dynamics. Members of these virtual spaces are Duolingo users
who seek for support and who want to share their experience, progress and achievements.
It is worth to notice, that many of these groups have more than 25 posts a day with multiple
comments and discussions. The content suggests that people are really engaged, they use the
platform for a long time, and they are motivated to gain rewards and enjoy the experience of
Duolingo and competition. Seeing many cases like below on Figure 2 confirmed that
Duolingo is worthy of attention. The screenshots presented in this dissertation (Figure 2)
show only a small sample of the messages one can see in the online groups every day. They
evidence that users of Duolingo are very engaged, they are able to study for 500 days in a
row, without missing a day and they are determined to compete with others and to complete
their goals with much determination.
Page 28
20
Figure 2. Screenshots from Duolingo groups. Source: Facebook
According to their website, Duolingo is a free science-based language learning platform that
has organically become the most popular way to learn languages online. It has currently 300
million users worldwide and offers 90 total language courses for more than 30 distinct
languages. The company has raised US$108.3 million in total and is currently valued at
US$700 million. It´s mission is making language education free, fun and accessible for
everyone in the world (Duolingo, n.d.). The service was founded by Luis Von Ahn, a serial
entrepreneur and computer science professor, and his student Severin Hacker. The system
allows users to learn foreign languages while helping Duolingo in translation. The service
became publicly available in 2012 and gained quickly over 300000 users (Huynh, Zuo, & Iida,
2016). Duolingo applies machine learning to provide personalized adaptive lessons based
on the users progress. Duolingo content is free and completely interactive and game-like:
users compete with friends, have streaks, get points, level up and earn a virtual currency
through learning (Duolingo, n.d.). A study conducted at the City University of New York
has shown that 34 hours on Duolingo are equivalent to a university semester of language
classes (Grego & Vesselinov, 2012).
Page 29
21
The authors of Duolingo efficiently apply gamification into their system in order to capture
user’s engagement and motivation. They have used the following game-elements in their
system: rewards, badges, leader boards and levels. Detailed description of the elements is
presented in Table 2.
Game
element Obtaining way Purpose Description
Experience
point and
level
It is necessary to
complete activity, such
as lesson or a part of a
section
It´s a reward and it
delivers feedback to
control daily activity and
compare to other
learners
Experience point stands for
language level. It is evaluated
based on the work one has
put into learning
Badge
It is necessary to
complete all lessons in
one category
It encourages users to
complete lessons to pass
to next levels
Badge is a reward for
completing a series of tasks
and gaining new skills
Leader
board
The more XP one
accumulates, the better
result one can have
when compared to
others
Driving motivation by
encouraging competition
Leader board provides
users´ feedback on their
performance compared to
others
Winning
streak
To achieve certain XP
level by midnight each
day
It motivates users to
study regularly every day
Streak visualizes regularity of
learning. It begins at 0 and it
rises each day if the user
keeps studying, otherwise it
drops to 0 again
Golden
badge
Users must improve
their weakest points
It helps to memorize, to
review program, test the
knowledge
Duolingo recommends to
complete all lessons in a skill
and after that come back to
review them
Lingot
User must complete a
new skill, progress to
the next level, or keep
the streak
Additional reward to
increase motivation,
virtual currency
One can buy support tools
in Duolingo store using the
Lingots
Table 2. Game elements identified in Duolingo. Adapted from Huynh (2018, p. 18)
Page 30
22
3.4 Questionnaire
The questionnaire that was released to Duolingo users to collect the data included 15
questions. The first part of the questionnaire was meant to gather the demographic
information like age, gender, education level and employment status. The second part of the
questionnaire was determined to understand the frequency and intensity of the use of
Duolingo while allowing to eliminate respondents who do not use Duolingo or those who
use it less than once a week. The last part of the questionnaire was constructed to understand
the user’s perception about ease of use, usefulness, enjoyment, perceived social influence,
brand attitude and intention of engagement. All of the items mentioned above were evaluated
with 4 questions. Only Usefulness was evaluated based on 5 questions. Each variable was
measured with a 5-point Likert scale (1- I totally disagree, 2- I agree, 3- Neutral, 4- I agree,
5- I totally agree). All the measurements, were adapted from previously published sources
(Table 3) therefore it is safe to consider them relevant. The questionnaire details can be found
in Appendix A.
Before the official release of the questionnaire 10 people were invited to test it and identify
possible errors related to the textual interpretation of the questions. The suggestions were
analysed and contributed to improve the final version of the questionnaire.
Perceived Usefulness (Davis, 1989)
Perceived ease of use (Davis, 1989)
Perceived social influence (Ajzen, 1991)
Enjoyment (van der Heijden, 2004)
Intention of engagement (Davis & Venkatesh, 2000)
Brand Attitude (Ajzen, 1991)
Table 3. Sources of measurement for variables used in section 3 of the
questionnaire
Page 31
23
Chapter IV Results and Findings
This chapter includes details of the analysis that were conducted in this dissertation: factor
analysis, reliability analysis using Cronbach’s Alpha and standard multiple regression analysis.
At the end of this part of our work, we present the results of hypothesis testing.
4.1 Sample Characteristics
The total number of answers to the questionnaire was 1504, and 1096 of them were
considered valid for our study. The observations that were eliminated were considered not
relevant for the study because of a low frequency of use (less often than once a week) or due
to interrupted use of the service (people who used to learn using Duolingo, but they no
longer do it).
The demographic questions helped to understand that the users who submitted their answers
were from 85 different countries, but the biggest group of respondents was from the United
States of America (USA) (30 %) and the United Kingdom (UK) (15%). Other Nationalities
captured in the study were from various continents: Europe, South America, Asia, Africa
and Australia.
58% of the respondents were female and 42% male. The biggest group of respondents are
users who are 50 years old or more (25%). The second largest group are those between 25-
29 years old (16%) followed by the third largest group within an age range of 20-24 (15%).
Most of the users have higher education degree (63%), followed by users with secondary
education or high school (20%) and other educational backgrounds in last (17%). Based on
the collected data, we conclude that the vast majority of our sample are older and
professionally active, with 48 % of respondents being employed, 19% being students and
9% being working students.
We found that 54% of respondents have been using the application for more than 18 months
and also 54 % of respondents use the application from 5 to 9 times a week. This documents
the fact that Duolingo is able to keep users engaged considering a long term perspective,
with continuous use on a regular basis.
Page 32
24
4.2 Factor analysis
After the data collection, all analysis have been executed using SPSS. It was necessary to run
factor analyses in order to confirm that the measures used in the questionnaire are reliable
and indeed measure the desired construct (Field, 2009).
Examining the correlation matrix was an essential step which helped to confirm that factor
analysis are reasonable for our data. A correlation matrix is a set of correlation coefficients
among all the variables being considered in the study. Factoring is only useful if there is a
significant number of large correlations between all the variables being considered (Field,
2009). It was confirmed that there is a number of correlating factors between 0,3 and 0,8,
therefore it was reasonable to continue with the analysis.
In this study, we ran three separate analysis to confirm whether the measures of dependent
and independent variables are reliable. The procedures are explained next in this chapter.
Firstly we ran a factor analysis of independent variables and it was conducted on 17 items.
The results indicated only three factors, therefore it was decided to force four factors.
A principal component analysis (PCA) was conducted on 17 items with orthogonal rotation
(varimax). The Kaiser–Meyer–Olkin measure verified the sampling adequacy for the analysis,
KMO = 0,935 (excellent, according to Kaiser (1974)). Bartlett’s test of sphericity χ²(135) =
3888,90, p < 0,001, indicated that correlations between items were sufficiently large for PCA
and we concluded that factor analysis is a suitable statistical method to confirm the
measurements (Field, 2009).
Kaiser-Meyer-Olkin Measure of Sampling Adequacy. 0,935
Bartlett's Test of Sphericity Approx. Chi-
Square
13888,90
df 136
Sig. 0,000
Table 4. KMO and Bartlett's Test I – concerning independent variables
Page 33
25
Further, we looked into the eigenvalues, which helped to extract the components (Appendix
B). Four components had eigenvalues over Kaiser’s criterion of 1 and one component had
eigenvalue equal to 0,847. A combination of these four factors explained 74,929% of the
variance.
The factor loading is a Pearson correlation between a factor and a variable (Field, 2009).
Table 5 shows the rotated factor loadings for each variable onto each factor. The items that
cluster on the same components suggest that component 1 represents usefulness,
component 2 stands for social influence, component 3 enjoyment and component 4 ease of
use.
Component
1 2 3 4
Usefulness [Using Duolingo enables me to accomplish more with
regards to learning]
0,813
Usefulness [I feel more effective with regards to learning when using
Duolingo.]
0,789
Usefulness [I find Duolingo useful.] 0,719
Usefulness [Using Duolingo is useful for purposes of exercise.] 0,679
Usefulness [Using Duolingo makes it easier for me to start learning] 0,632
Social influence [People who I appreciate would encourage me to use
Duolingo.]
0,863
Social influence [People who are important to me would think
positively of me using Duolingo.]
0,835
Social influence [My friends would think using Duolingo is a good idea.] 0,810
Social influence [People who influence my attitudes would recommend
Duolingo]
0,762
Enjoyment [I find the experience of learning and the related Duolingo
use enjoyable.]
0,771
Enjoyment [I find the experience of learning and the related Duolingo
use interesting.]
0,764
Enjoyment [I find the experience of learning and the related Duolingo
use pleasant.]
0,752
Enjoyment [I find the experience of learning and the related Duolingo
use exciting.]
0,750
Page 34
26
Ease of use [The interaction with Duolingo is clear and
understandable.]
0,794
Ease of use [Using Duolingo interface does not require a lot of mental
effort.]
0,789
Ease of use [I find Duolingo easy to use.] 0,762
Ease of use [I find it easy to get the interface of Duolingo to do what I
want it to do.]
0,738
Table 5. Rotated component matrix I
Extraction Method: Principal Component Analysis. Rotation Method: Varimax with Kaiser Normalization
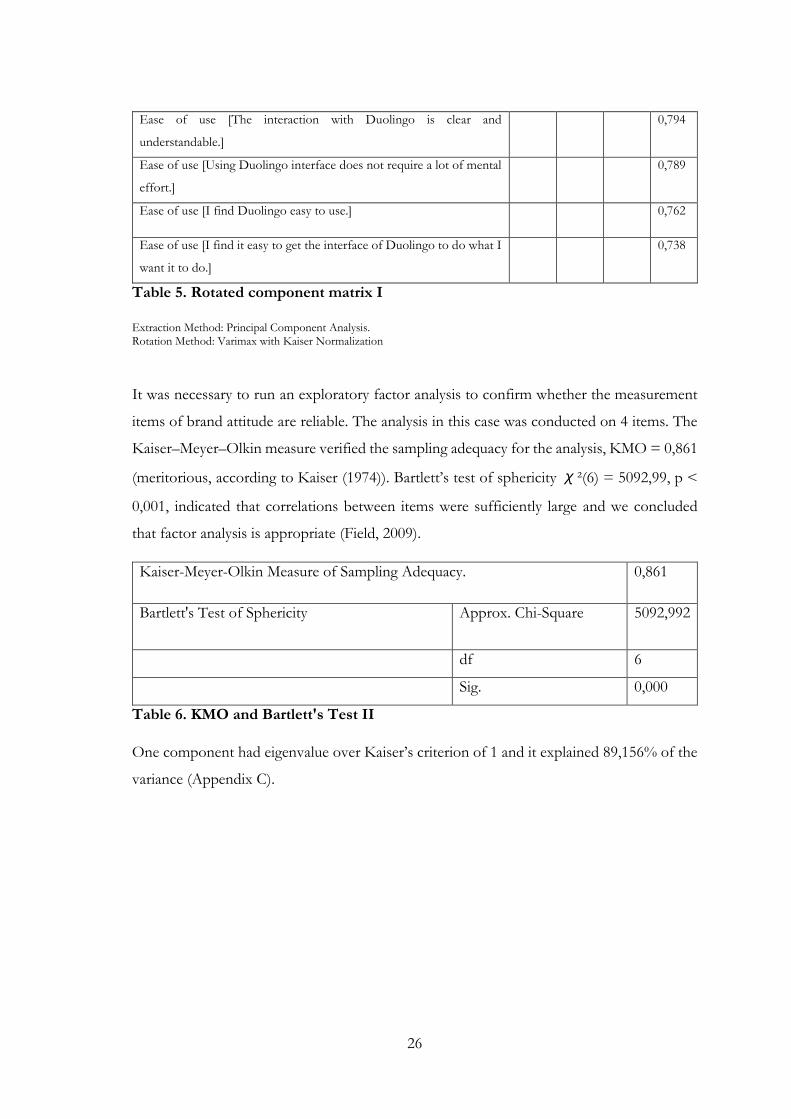
It was necessary to run an exploratory factor analysis to confirm whether the measurement
items of brand attitude are reliable. The analysis in this case was conducted on 4 items. The
Kaiser–Meyer–Olkin measure verified the sampling adequacy for the analysis, KMO = 0,861
(meritorious, according to Kaiser (1974)). Bartlett’s test of sphericity χ²(6) = 5092,99, p <
0,001, indicated that correlations between items were sufficiently large and we concluded
that factor analysis is appropriate (Field, 2009).
Kaiser-Meyer-Olkin Measure of Sampling Adequacy. 0,861
Bartlett's Test of Sphericity Approx. Chi-Square 5092,992
df 6
Sig. 0,000
Table 6. KMO and Bartlett's Test II
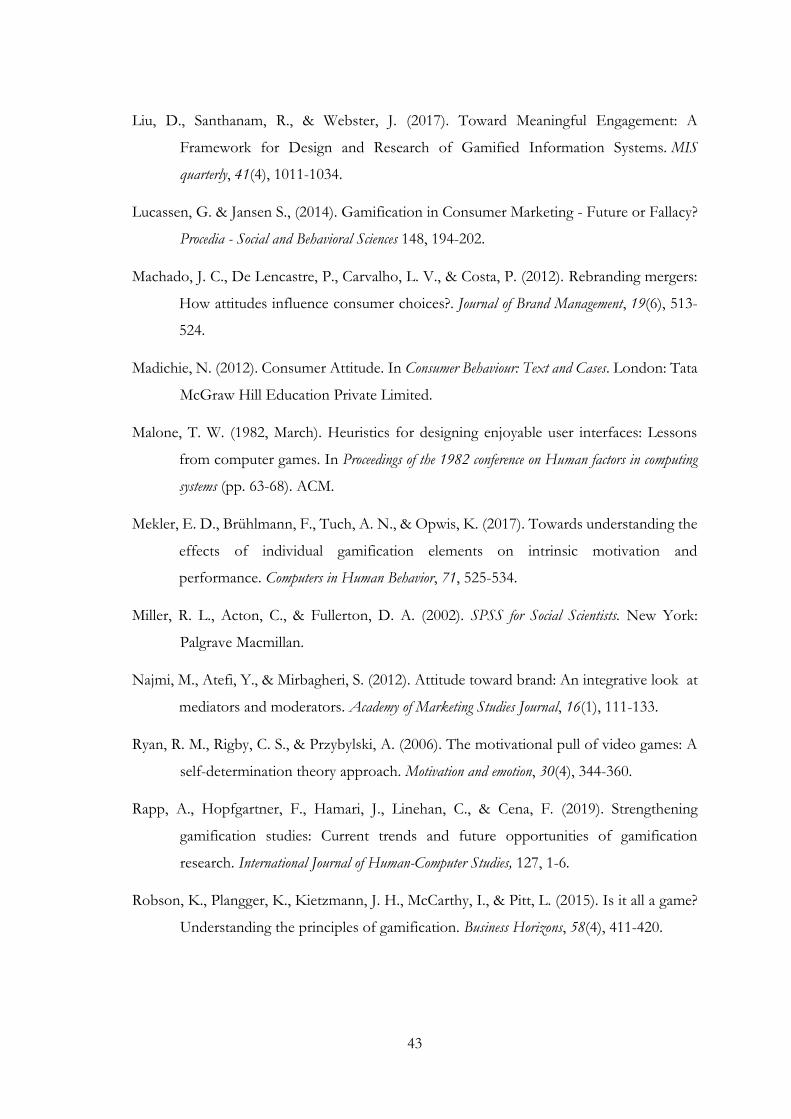
One component had eigenvalue over Kaiser’s criterion of 1 and it explained 89,156% of the
variance (Appendix C).
Page 35
27
Table 7 shows the factor loadings. It is confirmed that for a sample bigger than 1000, the
loading should be greater than 0,162 (Field, 2009), therefore all of the loadings are in a fair
range. The items confirm, that component 1 represents brand attitude.
Brand Attitude [All things considered, I find using
Duolingo to be a wise thing to do.]
0,925
Brand Attitude [All things considered, I find using
Duolingo to be a good idea.]
0,958
Brand Attitude [All things considered, I find using
Duolingo to be a positive thing.]
0,948
Brand Attitude [All things considered, I find using
Duolingo to be favorable.]
0,945
Table 7. Component matrix- factor loadings I
Extraction Method: Principal Component Analysis.
The third factor analysis was done to test the reliability of measure of intention of
engagement. Firstly, a correlation analysis confirmed that it is reasonable to advance with
further tests because all correlations were found significant. . A PCA was conducted on 4
items with no rotation. The Kaiser–Meyer–Olkin measure verified the sampling adequacy
for the analysis, KMO = 0,665(mediocre, according to Kaiser (1974)). Bartlett’s test of
sphericity χ²(6) = 2467,590, p < 0,001, indicated that correlations between items were
sufficiently large for PCA and we conclude that factor analysis is also appropriate in this case
(Field, 2009).
Kaiser-Meyer-Olkin Measure of Sampling
Adequacy.
0,665
Bartlett's Test of Sphericity Approx. Chi-Square 2467,590
df 6
Sig. 0,000
Table 8. KMO and Bartlett's Test III
Page 36
28
Further analysis of indicated that one component had eigenvalue over Kaiser’s criterion of 1
and the explained 69,445% of the variance (Appendix D).
Table 9 shows the factor loadings. All of them are in a desired range (above 0,162). The
analysis confirms that the factor measures intention of engagement.
Intention of Engagement [I predict that I will keep using Duolingo
in the future at least as much as I have used it lately.]
0,826
Intention of Engagement [I intend to use Duolingo at least as often
within the next three months as I have previously used.]
0,797
Intention of Engagement [I predict that I will use Duolingo more
frequently rather than less frequently.]
0,855
Intention of Engagement [It is likely that I will use Duolingo more
often rather than less often during the next couple months.]
0,854
Table 9 Component matrix- factor loadings II
Extraction Method: Principal Component Analysis
We concluded that the factor analysis confirmed the reliability of measures of variables.
4.3 Data analysis
After factor analysis, the overall validity of the questionnaire was evaluated with Cronbach’s
alpha (Alpha). This measure is the most common measure of scale reliability and helps to
understand whether the items in the questionnaire truly reflect the construct that they are
supposed to measure (Field, 2009). All of the convergent validity metrics were greater than
the thresholds cited in relevant literature (Cronbach’s alpha >0.7) and this indicates a good
reliability (Field, 2009). Only well-established measurement items were used thus we can
conclude that the convergent requirements of validity and reliability for the model were met.
Page 37
29
Item Cronbach's Alpha N of Items
Perceived usefulness 0,902 5,000
Perceived ease of use 0,858 4,000
Perceived social influence 0,879 4,000
Perceived enjoyment 0,905 4,000
Intention of engagement 0,853 4,000
Brand attitude 0,959 4,000
Table 10. Reliability Statistics
In this dissertation, the goal is to understand what aspects of gamification contribute to
intention of engagement and the brand attitude. According to literature, multiple regression
analysis allows to test to which extent each independent variable can predict the value of the
dependent variable (Miller, Acton, & Fullerton, 2002), therefore multiple regression analysis
was considered a good method to apply to this dissertation.
Due to the fact that the model contains two different dependent variables, it was necessary
to split it in two parts and to do two separate analysis:
1. Analysis of the first model - considering intention of engagement as a dependent
variable and perceived usefulness, ease of use, perceived social influence and
enjoyment as independent variables.
2. Analysis of the second model - The second analysis considered brand attitude as a
dependent variable and perceived usefulness, ease of use, perceived social influence,
enjoyment and intention of engagement as independent variables.
In order to carry out a multiple regression analysis it was necessary to test several
assumptions. Firstly, the assumption of independence of residuals was tested with Durbin-
Watson statistics. The result fell within a desired range, a value close to 2 which indicates
non-autocorrelation, therefore the assumption of no autocorrelation of residuals has been
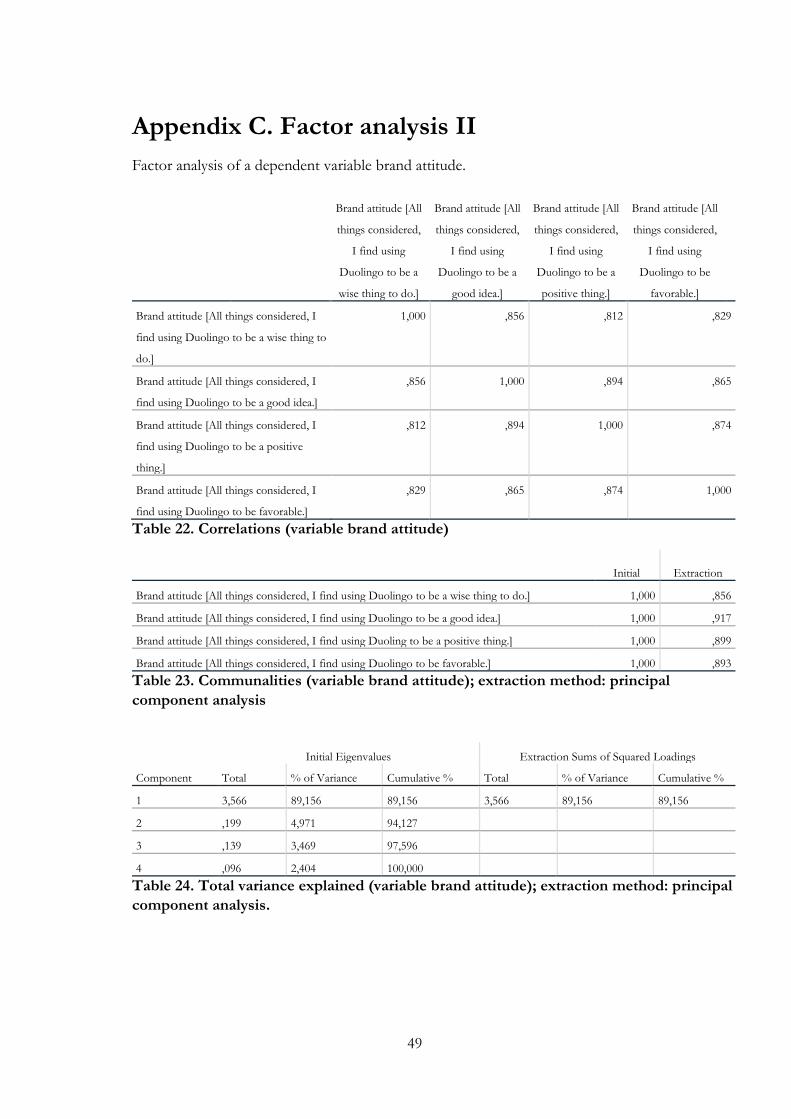
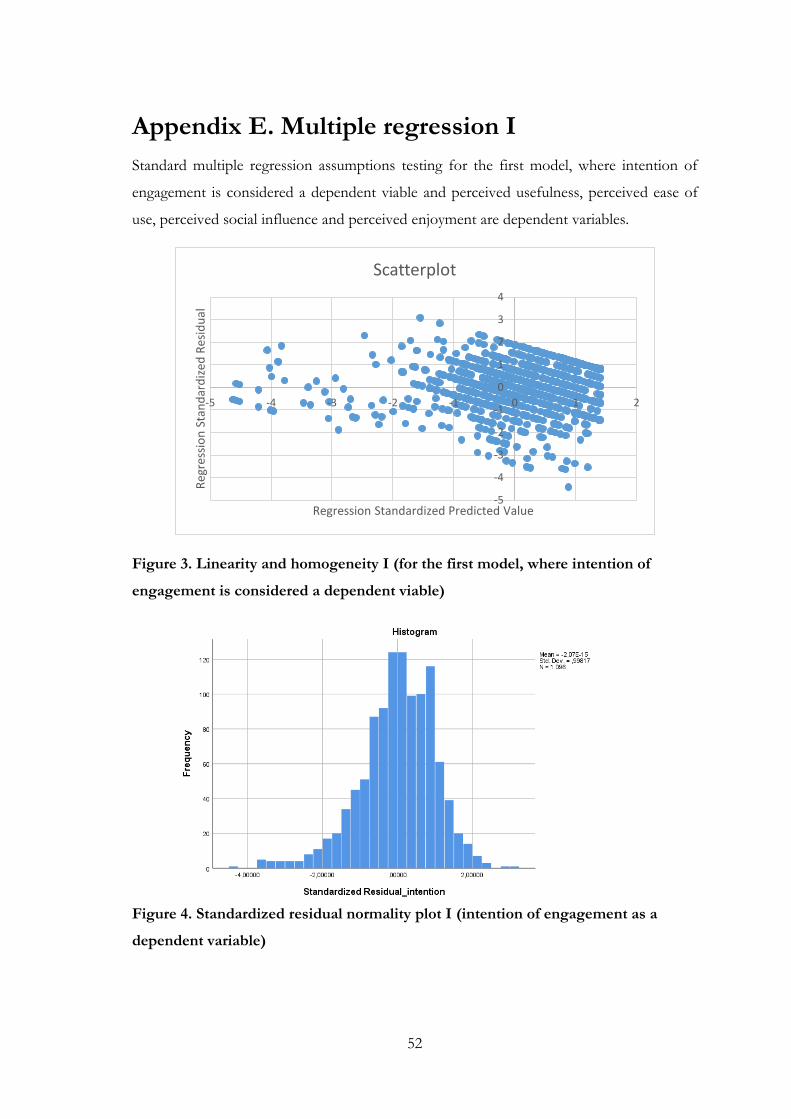
met (Field, 2009). Linearity and homogeneity were assessed visually in a scatterplot. The
scatterplots of standardized residual on standardized predicted value did not funnel out or
curve. Therefore, we can conclude that the assumptions of linearity and homoscedasticity
have been met as well. The assumption of normality of residuals was tested visually on a
histogram and the data seems to be approximately normal. As a result we can say that the
assumptions of normality, linearity, homogeneity and independence of residuals are met.
Page 38
30
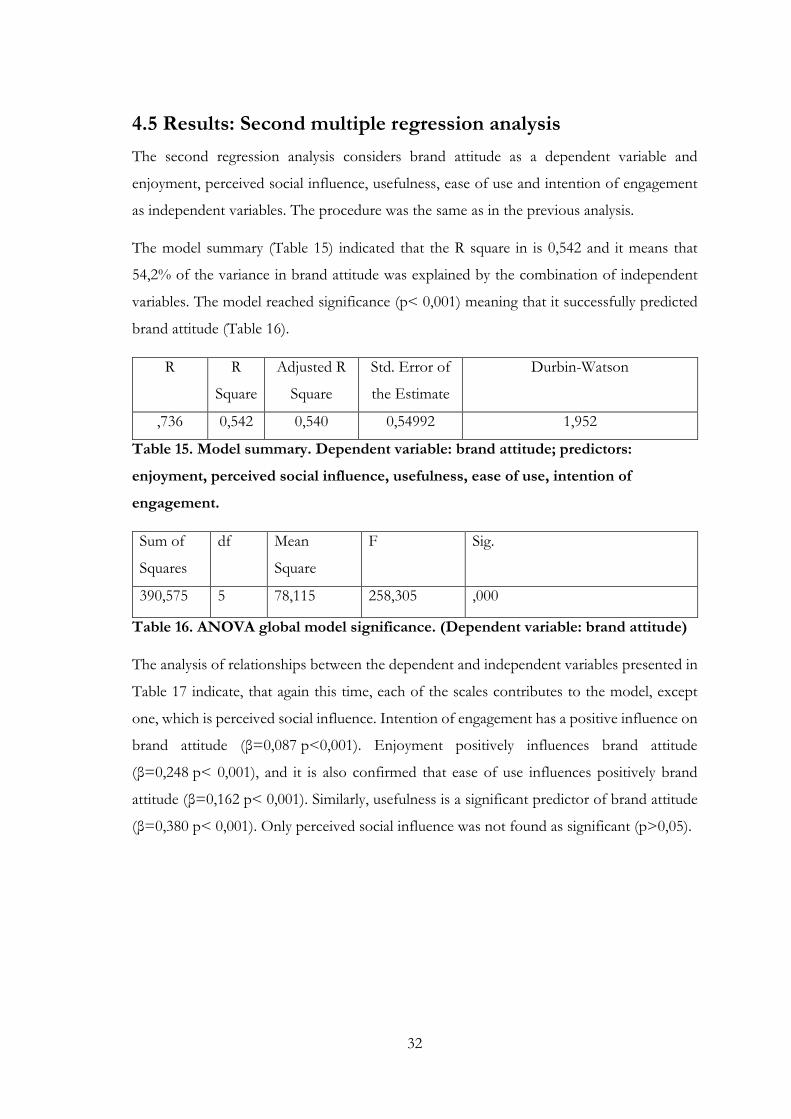
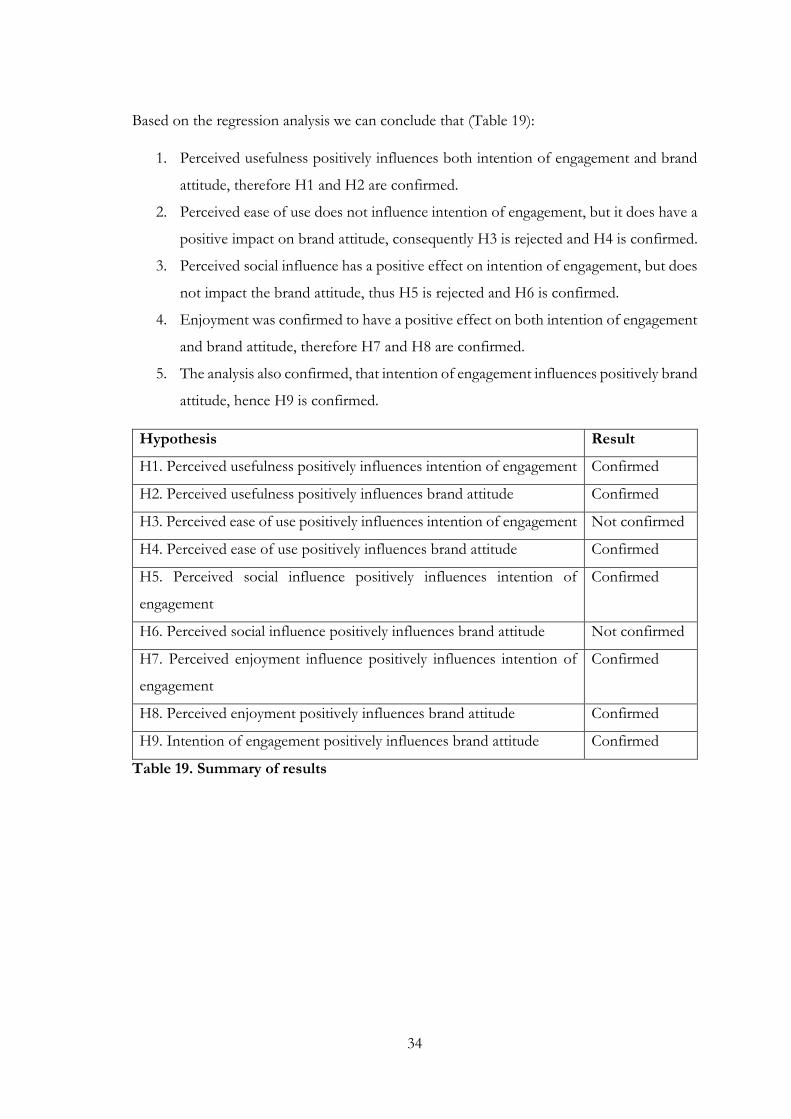
4.4 Results: First multiple regression analysis:
The first analysis considered continued use intention as a dependent variable, and
eenjoyment, perceived social influence, usefulness, ease of use as predictors.
In order to evaluate whether a model which predicts continued use intention is successful,
the model summary has been analysed (Field, 2009) and the details are presented in Table
11. The adjusted R square indicates how well the model can be generalised in a population.
The R square is 0,375 and it means that 37,5% of the variance in continued use intention is
explained by the combination of independent variables. The model reached significance (p<
0,001), meaning that it successfully predicted continued use intention (Table 12).
R R
Square
Adjusted R
Square
Std. Error of
the Estimate
Durbin-Watson
,612 0,375 0,372 0,66679 1,917
Table 11. Model summary. (Dependent variable: intention of engagement;
predictors: enjoyment, perceived social influence, usefulness, ease of use)
Sum of
Squares
df Mean
Square
F Sig.
290,620 4 72,655 163,362 0
Table 12. ANOVA global model significance. (Dependent variable: continued use
intention)
The next step was regression analysis, Table 13 presents the summary or regression
coefficients. The results indicate, that enjoyment positively influences continued use
intention (β=0,326, p<0,001). Also usefulness has a positive significant influence on
intention of engagement. (β=0,316, p< 0,001), and besides this, perceived social influence
affects positively continued use intention (β=0,109, p<0,001). Perceived ease of use does not
significantly influence intention of engagement (p>0,05).
Page 39
31
Unstandardized
Coefficients Standardized
Coefficients t Sig.
B Std. Error
(Constant) 0,585 0,133 4,406 0,000
Perceived
Enjoyment
0,326 0,042 0,295 7,833 0,000
Perceived
Ease of use
0,027 0,034 0,025 0,802 0,423
Perceived
Usefulness
0,316 0,044 0,281 7,178 0,000
Perceived
Social
influence
0,109 0,031 0,098 3,486 0,001
Table 13. Regression coefficients: dependent variable: intention of engagement
Based on the results presented above (Table 13) we conclude that ease of use is not a
significant variable and we ultimately present the readjusted model, including only significant
factors in the Table 14.
Unstandardized
Coefficients
Standardized
Coefficients t Sig.
B Std. Error Beta
(Constant) 0,617 0,127 4,863 0,000
Perceived
usefulness
0,327 0,042 0,291 7,806 0,000
Perceived
enjoyment
0,333 0,040 0,302 8,232 0,000
Perceived
social
influence
0,110 0,031 0,099 3,529 0,000
Table 14. Regression coefficients. Final model with: dependent variable: intention
of egagement
Page 40
32
4.5 Results: Second multiple regression analysis
The second regression analysis considers brand attitude as a dependent variable and
enjoyment, perceived social influence, usefulness, ease of use and intention of engagement
as independent variables. The procedure was the same as in the previous analysis.
The model summary (Table 15) indicated that the R square in is 0,542 and it means that
54,2% of the variance in brand attitude was explained by the combination of independent
variables. The model reached significance (p< 0,001) meaning that it successfully predicted
brand attitude (Table 16).
R R
Square
Adjusted R
Square
Std. Error of
the Estimate
Durbin-Watson
,736 0,542 0,540 0,54992 1,952
Table 15. Model summary. Dependent variable: brand attitude; predictors:
enjoyment, perceived social influence, usefulness, ease of use, intention of
engagement.
Sum of
Squares
df Mean
Square
F Sig.
390,575 5 78,115 258,305 ,000
Table 16. ANOVA global model significance. (Dependent variable: brand attitude)
The analysis of relationships between the dependent and independent variables presented in
Table 17 indicate, that again this time, each of the scales contributes to the model, except
one, which is perceived social influence. Intention of engagement has a positive influence on
brand attitude (β=0,087 p<0,001). Enjoyment positively influences brand attitude
(β=0,248 p< 0,001), and it is also confirmed that ease of use influences positively brand
attitude (β=0,162 p< 0,001). Similarly, usefulness is a significant predictor of brand attitude
(β=0,380 p< 0,001). Only perceived social influence was not found as significant (p>0,05).
Page 41
33
Unstandardized
Coefficients
Standardized
Coefficients
t Sig.
B Std. Error Beta
(Constant) 0,626 0,111 5,666 0,000
Continued use intention 0,087 0,025 0,090 3,489 0,001
Perceived Enjoyment 0,248 0,035 0,233 7,033 0,000
Perceived Ease of use 0,162 0,028 0,155 5,804 0,000
Perceived Usefulness 0,380 0,037 0,351 10,227 0,000
Perceived Social
influence
0,040 0,026 0,037 1,546 0,122
Table 17. Regression coefficients: dependent variable: brand attitude
Based on the results obtained from the above mentioned analysis (Table 17) we conclude
that perceived social influence is not a significant variable. We ultimately present the
readjusted model, including only significant factors in Table 18.
Unstandardized
Coefficients
Standardized
Coefficients t Sig.
B Std. Error Beta
(Constant) 0,675 0,106 6,370 0,000
Perceived Continued use
intention
0,091 0,025 0,095 3,669 0,000
Perceived Enjoyment 0,255 0,035 0,240 7,291 0,000
Perceived Ease of use 0,164 0,028 0,157 5,876 0,000
Perceived Usefulness 0,390 0,036 0,361 10,697 0,000
Table 18. Regression coefficients. Final model with: dependent variable: brand
attitude
Page 42
34
Based on the regression analysis we can conclude that (Table 19):
1. Perceived usefulness positively influences both intention of engagement and brand
attitude, therefore H1 and H2 are confirmed.
2. Perceived ease of use does not influence intention of engagement, but it does have a
positive impact on brand attitude, consequently H3 is rejected and H4 is confirmed.
3. Perceived social influence has a positive effect on intention of engagement, but does
not impact the brand attitude, thus H5 is rejected and H6 is confirmed.
4. Enjoyment was confirmed to have a positive effect on both intention of engagement
and brand attitude, therefore H7 and H8 are confirmed.
5. The analysis also confirmed, that intention of engagement influences positively brand
attitude, hence H9 is confirmed.
Hypothesis Result
H1. Perceived usefulness positively influences intention of engagement Confirmed
H2. Perceived usefulness positively influences brand attitude Confirmed
H3. Perceived ease of use positively influences intention of engagement Not confirmed
H4. Perceived ease of use positively influences brand attitude Confirmed
H5. Perceived social influence positively influences intention of
engagement
Confirmed
H6. Perceived social influence positively influences brand attitude Not confirmed
H7. Perceived enjoyment influence positively influences intention of
engagement
Confirmed
H8. Perceived enjoyment positively influences brand attitude Confirmed
H9. Intention of engagement positively influences brand attitude Confirmed
Table 19. Summary of results
Page 43
35
Chapter V Discussion and conclusions
This is the last section of this dissertation and it provides findings, discussion of the results,
limitations and opportunities for further development of the study.
5.1 Discussion of results
This dissertation examined several aspects of gamification in a language learning service on
the intention of engagement and brand attitude in a learning service context. In this work
the observations were focused on:
1. The effects of perceived ease of use, perceived usefulness, enjoyment and perceived
social influence on the intention of engagement with gamification in an utilitarian
service;
2. The effects of perceived ease of use, perceived usefulness, enjoyment, perceived
social influence and the intention of engagement on the brand attitude of a gamified
service.
A total of 1504 users of Duolingo filled out an online questionnaire and 1096 responses were
considered in the statistical analysis. The results of multiple regression indicate that all
hypothesis were confirmed except H3 and H6. For an easier reading hypothesis will be
discussed one by one in the following paragraphs.
H1. Perceived usefulness positively influences intention of engagement; H2.
Perceived usefulness positively influences brand attitude.
Perceived usefulness was found to positively influence users´ intention of engagement. This
finding is in line with TAM literature, which indicates that perceived usefulness is a predictor
of continued use intention (Davis, Bagozzi, & Warshaw, 1992; Venkatesh V. , 2000; Davis
F., 1989) and intention of engagement (Yang, Asaad, & Dwivedi, 2017). This implies that
users who find gamification useful are more likely to engage in using the service than user´s
who do not consider it useful. Usefulness is an important predictor of users’ behaviour. In
case of Duolingo, the service is useful for acquiring new language skills. It is confirmed that
Duolingo provides and efficient way of studying (Grego & Vesselinov, 2012) and
consequently the users consider it useful and want to continue using it.
Page 44
36
In the same way perceived usefulness was found be a significant positive predictor of brand
attitude. This is in line with previous studies, which also found perceived usefulness relevant
for attitude towards a system (Yang, Asaad, & Dwivedi, 2017; Davis F., 1989; Hamari &
Koivisto, 2015). The result implies that people who find the service useful also tend to have
more positive attitude towards a brand embedded in this service. We can infer that
gamification which is useful is more likely to produce a positive effect on brand attitude.
H3. Perceived ease of use positively influences intention of engagement; H4.
Perceived ease of use positively influences brand attitude.
Contrary to the original assumptions supported by previous studies that described ease of
use as an important factor when predicting willingness to use a system (Davis, 1989), our
findings revealed that ease of use was not a significant predictor of intention of engagement.
Our findings, however, are in line with a study of van der Heijden (2004) who concluded
that ease of use is not a critical factor in utilitarian system use. Duolingo, examined in this
study, is a language learning application with utilitarian purpose, as it is helps users to develop
their language skills. Also Yang, Asaad, and Dwivedi (2017) confirmed that perceived ease
of use has a potential to influence attitude, however this does not mean that users will be
interested in engaging with the service in a long term perspective. Ease of use is an important
factor at the initial stage of use, when a service or system is unknown. Over time users get
to know it better and better and understand the real benefits that the use provides them.
H5. Perceived social influence positively influences intention of engagement; H6.
Perceived social influence positively effects brand attitude
Perceived social influence was found to influence positively the intention of engagement.
This finding is in line with prior studies (Ajzen, 1991; Davis & Venkatesh, 2000; Lewis,
Agarwal, & Sambamurthy, 2003; Hamari & Koivisto, 2013). On the other hand, perceived
social influence in our analysis is not considered a significant predictor of brand attitude.
This outcome contradicts previous findings. The reason of such disproportion can be the
nature of the service and the motivation for using it. The use of a system can be voluntary
or mandatory (Davis & Venkatesh, 2000). Duolingo is a utilitarian service and its’ use is
voluntary. When using a system voluntarily, users are more likely to have intrinsic motivation
rather than to be affected by external social influence (Davis & Venkatesh, 2000). In today’s
world it seems obligatory to speak foreign languages, very often even more than one. This
Page 45
37
pressure quite frequently comes from the external world, people feel that they need to learn
languages especially to be able to develop a successful career. This could indicate that people
get engaged because they feel social pressure, but their attitude towards the system is intrinsic.
Our results, we can conclude, to be in line with Davis and Venkatesh (2000) who stated that
social influence does not significantly impact attitude when using a system is voluntary.
H7. Perceived enjoyment influence positively effects intention of engagement; H8.
Perceived enjoyment positively influences brand attitude
Perceived enjoyment was found to have statistically significant positive correlation with
intention of engagement and brand attitude. This implies that gamification enhances
enjoyment and users, who perceive the service as playful activity, are more likely to engage
and have positive feelings about the brand associated to the service. This finding is in line
with previous studies, which suggest that enjoyment is a fundamental aspect which
contributes to successful engagement. (Hernik & Jaworska, 2018; Ryan, Rigby & Przybylski,
2006; Harwood & Garry, 2015; Davis F., 1989).
H9. Intention of engagement positively influences brand attitude
Traditionally, literature examines this relationship in a reversed version, considering that the
attitude influences intention of engagement. However, in this dissertation we can conclude
that intention of engagement is a positive significant predictor of brand attitude. Customers
who have been loyal to the service and have been using it for extended periods of time with
satisfying results are likely to have positive attitude towards the brand. We can say that
because of the continuous use, users understand if a service helps them achieve a given goal
or simply provides a mean of entertainment. This engagement it is what helps users generate
a positive feeling and attitude towards a brand based on their experience. This makes users
willing to share their experiences with others. In a more general perspective, when a user is
engaged and has a positive attitude, he or she is likely to spread a positive word of mouth
that can be beneficial for a brand.
Page 46
38
5.2 Conclusions and limitation
The present study looked into customer´s perception of gamification in marketing context.
We examined the effect of enjoyable experiences, usefulness, ease of use, and perceived
social influence on intention of engagement and brand attitude. Additionally it looked into
the relationship between engagement and the attitude towards a brand.
A quantitative research focused on users of a successful gamification service – Duolingo -
helped to find out what are the most important benefits and motivators for the users and
how do they reflect in their behaviour and their attitude towards the brand. Factor analysis
confirmed measurement scales used in the questionnaire and regression analysis was a helpful
statistical method which facilitated the evaluation of relationships between dependent and
independent variables.
The results of this dissertation confirm that an effective gamification is able to support
customer engagement and positive brand attitude. The results contribute to the literature by
identifying the most influential aspects in the context of a voluntary use of a utilitarian
service.
To the contrary of several previous studies, social influence was not considered a predictor
of brand attitude. This finding is particularly important because it indicates that it is crucial
to understand what motivates people and what the main purpose behind the use of
gamification is. Users who are driven by intrinsic motivations evaluate a brand or service
with their own criteria. This finding calls attention of designers and marketers to the
importance of the task that gamification has and in what context is it going to be used.
This dissertation helps to understand that, when creating a gamified service, it is crucial to
realize what its’ key role is, and then make sure that it really is useful for the players. It is
particularly important that we examined users who have been involved in a gamified service
on a regular basis during a certain period of time. Our findings help to understand that the
significant factors for engagement and positive attitude towards a brand are perceived
enjoyment and perceived usefulness.
This work can be useful for designers and marketers who create gamification and are
interested in knowing what are the most important aspects that have an impact on
effectiveness of gamification. This dissertation also contributes to gamification literature by
providing insights on the topic in learning services and marketing context, which has not
Page 47
39
been studied until now. Additionally, our findings contribute to literature regarding TAM,
proving that this model can be applied to different subjects, not only to technology. Overall,
this study strengthens the empirical evidence in favor of gamification as a powerful tool to
engage and create positive association in customers’ minds.
One source of limitation in this study is that it was focused on a single service brand, while
the market offers several options. It would be interesting to examine what makes Duolingo
the most successful of gamified language learning services when compared to other
providers. Another good opportunity for further research is to examine how demographic
characteristics influence results of the study. In the sample, we gathered answers from 85
different countries. It could be insightful to compare results from various countries or
regions. Another interesting path would be to examine what are the factors that make users
stop using this service and why gamification stops being engaging after a certain period of
time. An additional path, which could contribute to literature, is to examine what game
elements are particularly important for the users and how do they reinforce engagement and
attitudes.
Page 48
40
Reference List
Ajzen, I. (1991). The theory of planned behavior. Organizational behavior and human decision
processes, 50(2), 179-211.
Bhattacherjee, A. (2012). Social Science Research: Principles, Methods, and Practices. USF Tampa
Bay Open Access Textbooks, Tampa, FL.
Blohm, I., & Leimeister, J. M. (2013). Gamification: Design of IT-based enhancing services
for motivational support and behavioral change. Business and Information Systems
Engineering, 5(4), 275–278.
Burke, B. (2012). Gamification 2020: What is the future of gamification. Gartner, Inc.,
November, 5.
Camilleri, A. C., & Camilleri, M. A. (2019). The Students’ Perceived Use, Ease of Use and
Enjoyment of Educational Games at Home and at School. In Camilleri, AC &
Camilleri, MA (2019). The Students’ Perceived Use, Ease of Use and Enjoyment of
Educational Games at Home and at School. 13th Annual International Technology,
Education and Development Conference. Valencia, Spain (March, 2019). International
Academy of Technology, Education and D.
Cardador, M. T., Northcraft, G. B., & Whicker, J. (2017). A theory of work gamification:
Something old, something new, something borrowed, something cool?. Human
Resource Management Review, 27(2), 353-365.
Cheung, C. M., Chiu, P. Y., & Lee, M. K. (2011). Online social networks: Why do students
use facebook?. Computers in Human Behavior, 27(4), 1337-1343.
Coronado, J. E., & Vasquez, A. (2014). Gamification: an effective mechanism to promote
civic engagement and generate trust. In Proceedings of the 8th International Conference on
Theory and Practice of Electronic Governance (pp. 514-515).
Davis, F. D. (1989). Perceived usefulness, perceived ease of use, and user acceptance of
information technology. MIS Quarterly, 13(3), 319-340.
Venkatesh, V., & Davis, F. D. (2000). A theoretical extension of the technology acceptance
model: Four longitudinal field studies. Management science, 46(2), 186-204.
Page 49
41
Davis, F. D., Bagozzi, R. P., & Warshaw, P. R. (1992). Extrinsic and intrinsic motivation to
use computers in the workplace 1. Journal of applied social psychology, 22(14), 1111-1132.
Deci, E. L., & Ryan, R. M. (1885). Intrinsic motivation and self-determination in human
behaviour. New York, NY: Plenum
Ryan, R. M., & Deci, E. L. (2000). Intrinsic and extrinsic motivations: Classic definitions and
new directions. Contemporary educational psychology, 25(1), 54-67.
Deloitte. (2013). Tech trends 2013: Elements of postdigital. Retrieved 6 June, 2019 from
https://www2.deloitte.com/content/dam/Deloitte/us/Documents/technology/u
s-cons-tech-trends-2013.pdf.
Deterding, S., Dixon, D., Khaled, R., & Nacke, L. (2011, September). From game design
elements to gamefulness: defining gamification. In Proceedings of the 15th international
academic MindTrek conference: Envisioning future media environments (pp. 9-15). ACM.
Duolingo. (n.d.). About Us. Retrieved 6 June, 2019, from https://www.duolingo.com/press
Field, A. (2009). Discovering statistics using SPSS. London: SAGE Publications Ltd.
Fishbein, M. A., & Ajzen, I. (1975). Belief, attitude, intention and behaviour: An introduction to theory
and research. Reading, Addison-Wesley.
Hall, D., & Toke, Z. (2018). Gamification: Gamified Elements’ Impact on Online Trust. (Master
Dissertation) Lund University School of Economics and Management.
Hamari, J., & Koivisto, J. (2013). Social Motivations To Use Gamification: An Empirical
Study Of Gamifying Exercise. Proceedings of the 21st European Conference on Information
Systems (Vol. 105), Utrecht, The Netherlands.
Hamari, J., & Koivisto, J. (2015). Why do people use gamification services?. International
Journal of Information Management, 35(4), 419-431.
Hamari, J., Koivisto, J., & Sarsa, H. (2014, January). Does Gamification Work?-A Literature
Review of Empirical Studies on Gamification. In R. Sprague et al. (Ed.), 47th Hawaii
Int. Conference on System Sciences, (pp. 3025– 3034). Hawaii, USA.
Harwood, T., & Garry, T. (2015). An investigation into gamification as a customer
engagement experience environment. Journal of Services Marketing, 29(6/7), 533-546.
Page 50
42
Hernik, J., & Jaworska, E. (2018). The effect of enjoyment on learning. In Proceedings of
INTED2018 the 12th International Technology, Education and Development Conference 5th-
7th March 2018. Valencia, Spain.
Huotari, K., & Hamari, J. (2011). Gamification from the perspective of service marketing.
In ACM Conference on Human Factors in Computing Systems (Gamification
workshop) Vancouver, Canada.
Huotari, K., & Hamari, J. (2017). A definition for gamification: anchoring gamification in the
service marketing literature. Electronic Markets, 27(1), 21-31.
Huynh, P. D. (2018). Understanding the Effects of Game in Educational Environment using
Game Refinement Measure. (Master thesis), School of Information Science, Japan
Advanced Institute of Science and Technology.
Huynh, D., Zuo, L., & Iida, H. (2016, December). Analyzing Gamification of “Duolingo”
with focus on its Course Structure. In International Conference on Games and Learning
Alliance (pp. 268-277). Springer, Cham.
Hyrynsalmi, S., Smed, J., & Kimppa, K. K. (2017). The Dark Side of Gamification: How we
should stop worrying and study also the negative impacts of bringing game design
elements to everywhere. In Proceedings of the 1st International GamiFIN Conference: Pori,
Finland, May 9-10. 2017 (pp. 96-104).
Juul, J. (2003). The game, the player, the world: Looking for a heart of gameness. In Level
Up: Digital Games Research Conference Proceedings, 30-45. Utreht.
Kaiser, H. F. (1974). An index of factorial simplicity. Psychometrika, 39(1), 31-36.
Leclercq, T., Hammedi, W., & Poncin, I. (2018). The boundaries of gamification for engaging
customers: Effects of losing a contest in online co-creation communities. Journal of
Interactive Marketing, 44, 82-101.
Lewis, W., Agarwal, R., & Sambamurthy, V. (2003). Sources of Influence on Beliefs about
Information Technology Use: An Empirical Study of Knowledge Workers. MIS
quarterly 27(4), 657-678.
Page 51
43
Liu, D., Santhanam, R., & Webster, J. (2017). Toward Meaningful Engagement: A
Framework for Design and Research of Gamified Information Systems. MIS
quarterly, 41(4), 1011-1034.
Lucassen, G. & Jansen S., (2014). Gamification in Consumer Marketing - Future or Fallacy?
Procedia - Social and Behavioral Sciences 148, 194-202.
Machado, J. C., De Lencastre, P., Carvalho, L. V., & Costa, P. (2012). Rebranding mergers:
How attitudes influence consumer choices?. Journal of Brand Management, 19(6), 513-
524.
Madichie, N. (2012). Consumer Attitude. In Consumer Behaviour: Text and Cases. London: Tata
McGraw Hill Education Private Limited.
Malone, T. W. (1982, March). Heuristics for designing enjoyable user interfaces: Lessons
from computer games. In Proceedings of the 1982 conference on Human factors in computing
systems (pp. 63-68). ACM.
Mekler, E. D., Brühlmann, F., Tuch, A. N., & Opwis, K. (2017). Towards understanding the
effects of individual gamification elements on intrinsic motivation and
performance. Computers in Human Behavior, 71, 525-534.
Miller, R. L., Acton, C., & Fullerton, D. A. (2002). SPSS for Social Scientists. New York:
Palgrave Macmillan.
Najmi, M., Atefi, Y., & Mirbagheri, S. (2012). Attitude toward brand: An integrative look at
mediators and moderators. Academy of Marketing Studies Journal, 16(1), 111-133.
Ryan, R. M., Rigby, C. S., & Przybylski, A. (2006). The motivational pull of video games: A
self-determination theory approach. Motivation and emotion, 30(4), 344-360.
Rapp, A., Hopfgartner, F., Hamari, J., Linehan, C., & Cena, F. (2019). Strengthening
gamification studies: Current trends and future opportunities of gamification
research. International Journal of Human-Computer Studies, 127, 1-6.
Robson, K., Plangger, K., Kietzmann, J. H., McCarthy, I., & Pitt, L. (2015). Is it all a game?
Understanding the principles of gamification. Business Horizons, 58(4), 411-420.
Page 52
44
Sailer , M., Hense, J. U., Mayr, S. K., & Mandl, H. (2017). How gamification motivates: A :
An experimental study of the effects of specific game design elements on
psychological need satisfaction. Computers in Human Behavior, 69, 371-380.
Seitz, V., & Aldebasi, N. M. (2016). The effectiveness of branded mobile apps on user’s
brand attitudes and purchase intentions. Review of Economic and Business Studies, 9(1),
141–154.
Susi, T., Johannesson, M., & Backlund, P. (2007). Serious Games – An Overview. Sweden:
University of Skövde.
van der Heijden, H. (2004). User Acceptance of Hedonic Information Systems. MIS
Quarterly, 28 (4), 695-704.
Venkatesh, V. (2000). Determinants of Perceived Ease of Use: Integrating Control, Intrinsic
Motivation, and Emotion into the Technology Acceptance Model. Information System
Research, 11(4), pp. 342-365.
Vesselinov, R., & Grego, J. (2012). Duolingo effectiveness study. City University of New York,
USA, 28.
Werbach, K., & Hunter, D. (2012). The Gamification Toolkit: Dynamics, Mechanics and Components
for the Win. Philadelphia: Wharton Digital Press.
Yang, Y., Asaad, Y., & Dwivedi, Y. K. (2017). Examining the impact of gamification on
intention of engagement and brand attitude in the marketing context. Computers in
Human Behavior 73, 459–469.
Page 53
45
Appendix A. Questionnaire Statements
Brand Attitude (Ajzen, 1991)
1. All things considered, I find using Duolingo to be a wise thing to do.
2. All things considered, I find using Duolingo to be a good idea.
3. All things considered, I find using Duolingo to be a positive thing.
4. All things considered, I find using Duolingo to be favorable.
Intention of Engagement (Davis & Venkatesh, 2000)
1. I predict that I will keep using Duolingo in the future at least as much as I have
used it lately.
2. I intend to use Duolingo at least as often within the next three months as I have
previously used.
3. I predict that I will use Duolingo more frequently rather than less frequently.
4. It is likely that I will use Duolingo more often rather than less often during the next
couple months.
Perceived Enjoyment (van der Heijden, 2004)
1. I find the experience of learning and the related Duolingo use enjoyable.
2. I find the experience of learning and the related Duolingo use pleasant.
3. I find the experience of learning and the related Duolingo use exciting.
4. I find the experience of learning and the related Duolingo use interesting.
Perceived Ease of use (Davis, 1989)
1. Using Duolingo interface does not require a lot of mental effort.
2. The interaction with Duolingo is clear and understandable.
3. I find Duolingo easy to use.
4. I find it easy to get the interface of Duolingo to do what I want it to do.
Perceived Usefulness (Davis, 1989)
1. Using Duolingo makes it easier for me to start learning.
2. Using Duolingo is useful for purposes of exercise.
3. Using Duolingo enables me to accomplish more with regards to learning.
4. I feel more effective with regards to learning when using Duolingo.
Page 54
46
5. I find Duolingo useful.
Perceived Social influence (Ajzen, 1991)
1. People who influence my attitudes would recommend Duolingo.
2. People who are important to me would think positively of me using Duolingo.
3. People who I appreciate would encourage me to use Duolingo.
4. My friends would think using Duolingo is a good idea.
Page 55
47
Appendix B. Factor analysis I
Factor analysis of independent variables conducted on 17 items.
Comp.
Initial Eigenvalues
Extraction Sums of Squared
Loadings
Rotation Sums of Squared
Loadings
Total
% of
Variance
Cumulative
% Total
% of
Variance
Cumulative
% Total
% of
Variance
Cumulative
%
1 8,616 50,685 50,685 8,616 50,685 50,685 3,463 20,371 20,371
2 1,958 11,517 62,202 1,958 11,517 62,202 3,110 18,297 38,668
3 1,317 7,745 69,947 1,317 7,745 69,947 3,106 18,269 56,937
4 ,847 4,982 74,929 ,847 4,982 74,929 3,059 17,992 74,929
5 ,571 3,360 78,289
6 ,530 3,121 81,409
7 ,478 2,811 84,220
8 ,448 2,635 86,855
9 ,391 2,298 89,153
10 ,316 1,861 91,013
11 ,311 1,827 92,840
12 ,261 1,533 94,373
13 ,236 1,389 95,762
14 ,221 1,302 97,064
15 ,187 1,100 98,164
16 ,172 1,009 99,173
17 ,141 ,827 100,000
Table 20. Total variance explained (independent virables), extraction method: principal
component analysis.
Page 56
48
Initial Extraction
Enjoyment [I find the experience of learning and the related Duolingo use enjoyable.] 1,000 ,837
Enjoyment [I find the experience of learning and the related Duolingo use pleasant.] 1,000 ,826
Enjoyment [I find the experience of learning and the related Duolingo use exciting.] 1,000 ,707
Enjoyment [I find the experience of learning and the related Duolingo use interesting.] 1,000 ,811
Ease of use [Using Duolingo interface does not require a lot of mental effort.] 1,000 ,648
Ease of use [The interaction with Duolingo is clear and understandable.] 1,000 ,791
Ease of use [I find Duolingo easy to use.] 1,000 ,826
Ease of use [I find it easy to get the interface of Duolingo to do what I want it to do.] 1,000 ,685
Usefulness [Using Duolingo makes it easier for me to start learning] 1,000 ,660
Usefulness [Using Duolingo is useful for purposes of exercise.] 1,000 ,626
Usefulness [Using Duolingo enables me to accomplish more with regards to learning] 1,000 ,818
Usefulness [I feel more effective with regards to learning when using Duolingo.] 1,000 ,782
Usefulness [I find Duolingo useful.] 1,000 ,779
Social influence [People who influence my attitudes would recommend Duolingo] 1,000 ,620
Social influence [People who are important to me would think positively of me using Duolingo.] 1,000 ,781
Social influence [People who I appreciate would encourage me to use Duolingo.] 1,000 ,820
Social influence [My friends would think using Duolingo is a good idea.] 1,000 ,722
Table 21. Communalities (independent virables), extraction method: principal component
analysis.
Page 57
49
Appendix C. Factor analysis II
Factor analysis of a dependent variable brand attitude.
Brand attitude [All
things considered,
I find using
Duolingo to be a
wise thing to do.]
Brand attitude [All
things considered,
I find using
Duolingo to be a
good idea.]
Brand attitude [All
things considered,
I find using
Duolingo to be a
positive thing.]
Brand attitude [All
things considered,
I find using
Duolingo to be
favorable.]
Brand attitude [All things considered, I
find using Duolingo to be a wise thing to
do.]
1,000 ,856 ,812 ,829
Brand attitude [All things considered, I
find using Duolingo to be a good idea.]
,856 1,000 ,894 ,865
Brand attitude [All things considered, I
find using Duolingo to be a positive
thing.]
,812 ,894 1,000 ,874
Brand attitude [All things considered, I
find using Duolingo to be favorable.]
,829 ,865 ,874 1,000
Table 22. Correlations (variable brand attitude)
Initial Extraction
Brand attitude [All things considered, I find using Duolingo to be a wise thing to do.] 1,000 ,856
Brand attitude [All things considered, I find using Duolingo to be a good idea.] 1,000 ,917
Brand attitude [All things considered, I find using Duoling to be a positive thing.] 1,000 ,899
Brand attitude [All things considered, I find using Duolingo to be favorable.] 1,000 ,893
Table 23. Communalities (variable brand attitude); extraction method: principal
component analysis
Component
Initial Eigenvalues Extraction Sums of Squared Loadings
Total % of Variance Cumulative % Total % of Variance Cumulative %
1 3,566 89,156 89,156 3,566 89,156 89,156
2 ,199 4,971 94,127
3 ,139 3,469 97,596
4 ,096 2,404 100,000
Table 24. Total variance explained (variable brand attitude); extraction method: principal
component analysis.
Page 58
50
Appendix D. Factor analysis III
Intention of
engagement [I
predict that I will
keep using
Duolingo in the
future at least as
much as I have
used it lately.]
Intention of
engagement [I
intend to use
Duolingo at least
as often within the
next three months
as I have
previously used.]
Intention of
engagement [I
predict that I will
use Duolingo more
frequently rather
than less
frequently.]
Intention of
engagement [It is
likely that I will use
Duolingo more
often rather than
less often during
the next couple
months.]
Intention of engagement [I predict that I
will keep using Duolingo in the future at
least as much as I have used it lately.]
1,000 0,712 0,553 0,502
Intention of engagement [I intend to use
Duolingo at least as often within the
next three months as I have previously
used.]
0,712 1,000 0,460 0,509
Intention of engagement [I predict that I
will use Duolingo more frequently rather
than less frequently.]
0,553 0,460 1,000 0,816
Intention of engagement [It is likely that
I will use Duolingo more often rather
than less often during the next couple
months.]
0,502 0,509 0,816 1,000
Table 25. Correlations (variable intention of engagement)
Initial Extraction
Intention of engagement [I predict that I will keep using Duolingo in the future at least as much as I
have used it lately.]
1,000 ,683
Intention of engagement [I intend to use Duolingo at least as often within the next three months as I
have previously used.]
1,000 ,634
Intention of engagement [I predict that I will use Duolingo more frequently rather than less
frequently.]
1,000 ,731
Intention of engagement [It is likely that I will use Duolingo more often rather than less often during
the next couple months.]
1,000 ,729
Table 26. Communalities (variable intention of engagement); Extraction Method:
principal component analysis
Page 59
51
Component
Initial Eigenvalues Extraction Sums of Squared Loadings
Total % of Variance Cumulative % Total % of Variance Cumulative %
1 2,778 69,449 69,449 2,778 69,449 69,449
2 ,752 18,809 88,258
3 ,306 7,660 95,918
4 ,163 4,082 100,000
Table 27. Total variance explained (variable intention of engagement); extraction
method: principal component analysis.
Page 60
52
Appendix E. Multiple regression I
Standard multiple regression assumptions testing for the first model, where intention of
engagement is considered a dependent viable and perceived usefulness, perceived ease of
use, perceived social influence and perceived enjoyment are dependent variables.
Figure 3. Linearity and homogeneity I (for the first model, where intention of
engagement is considered a dependent viable)
Figure 4. Standardized residual normality plot I (intention of engagement as a
dependent variable)
-5
-4
-3
-2
-1
0
1
2
3
4
-5 -4 -3 -2 -1 0 1 2
Reg
ress
ion
Sta
nd
ard
ized
Res
idu
al
Regression Standardized Predicted Value
Scatterplot
Page 61
53
Appendix F. Multiple regression II
Standard multiple regression assumptions testing, where brand attitude is considered a
dependent viable perceived usefulness, perceived ease of use, perceived social influence and
perceived enjoyment are dependent variables.
Figure 5. Linearity and homogeneity II (for the first model, where brand attitude is
considered a dependent viable)
Figure 6. Standardized residual normality plot II (brand attitude as a dependent
variable)
-8
-6
-4
-2
0
2
4
-6 -5 -4 -3 -2 -1 0 1 2
Reg
ress
ion
Sta
nd
ard
ized
Res
idu
al
Regression Standardized Predicted Value
Scatterplot