Gamma Ray Imaging of Small Animals Using Position-Sensitive Photomultiplier Tubes A thesis submitted in partial fulfillment of the requirements for the degree of Bachelor of Science in Physics from the College of William and Mary in Virginia, By, Julie Cella Williamsburg, Virginia April 16 th , 2004
Transcript
Gamma Ray Imaging of Small Animals Using Position-Sensitive Photomultiplier Tubes
A thesis submitted in partial fulfillment of the requirements for the degree of Bachelor of
Science in Physics from the College of William and Mary in Virginia,
By, Julie Cella
Williamsburg, Virginia April 16th, 2004
2
Acknowledgments
I would like to thank the generous support and guidance offered by my advisor Dr.
Robert Welsh of the Physics Department and Dr. Eric Bradley and Dr. Margaret Saha of
the Biology Department. I would also like to thank the kind advice and assistance
offered by Jianguo Qian of Applied Science and Kevin Smith (William and Mary, ’03).
In addition, I would like to acknowledge our collaborators at Jefferson Lab, Stan
Majewski, Vladimir Popov, Mark F. Smith, Andrew G. Weisenberger, and Randy Wojcik.
This research would not be possible without the support of NIH, Department of Energy,
National Science Foundation, The Jeffress Trust, and in particular The HHMI Science
Education Program for their support of my summer research, additional semester grants,
and travel grant.
3
Abstract This thesis is an interdisciplinary investigation of small animals consisting of two
parts. First, a comparison of NaI(Tl) and CsI(Tl) pixilated scintillating crystals will be
presented based on results of resolution tests performed using 5” diameter Hamamatsu
5800 PSPMTs. Second, application of the gamma ray detectors will be assessed using a
biological model. The biological model chosen to analyze is the efficacy of potassium
iodide as a blocking agent to the uptake of radioiodine by the thyroid. The blocking dose
of potassium iodide is tested and the implications discussed.
4
Table of Contents 1. Introduction……………………………………………………….5
2. SPECT Demands and Resolution Tests……………………….….7
2a. CsI (Tl) Crystal……………………………………………….8
2b. NaI (Tl) Crystal………………………………………………10
2c. Conclusion of Resolution Tests……………………………...12
3. Thyroid Blocking with Potassium Iodide as a Biological Model...12
3a. Reasons to Study KI blocking………………………………..13
3b. Summary of Previous Literature on Efficacy of KI Blocking..15
4. KI Blocking Study………………………………………………..18
4a. Data Analysis Method I: “Background Subtract”…………….20
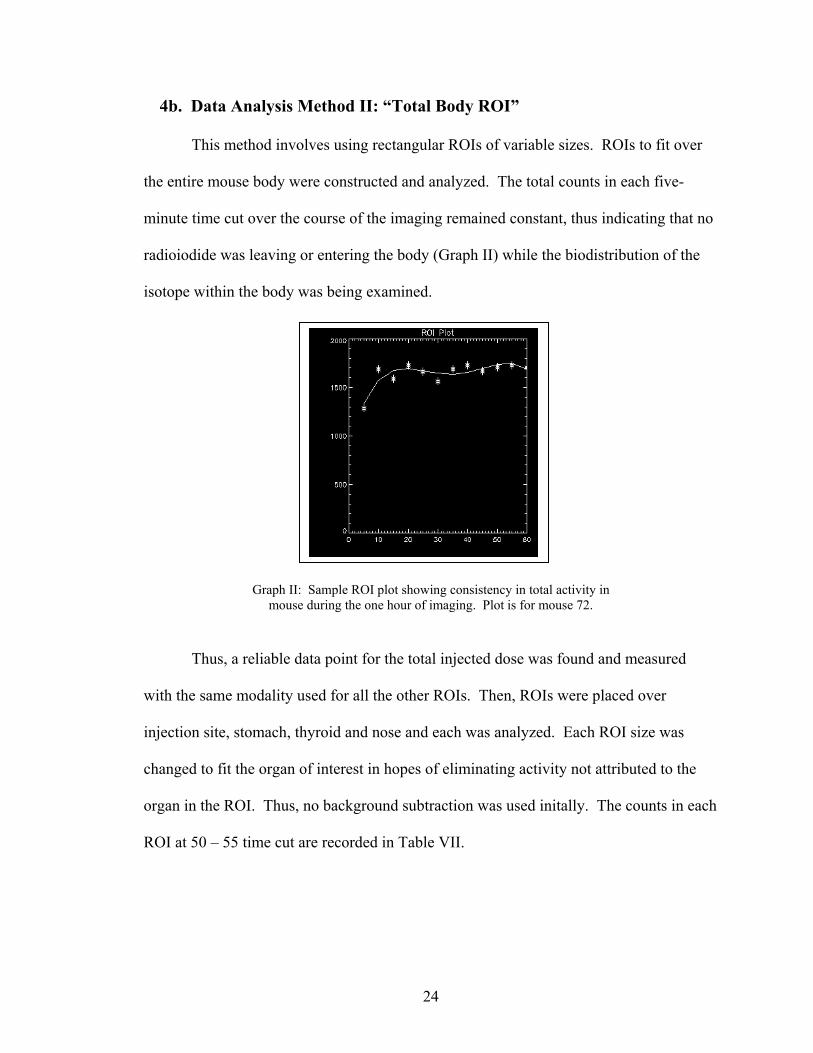
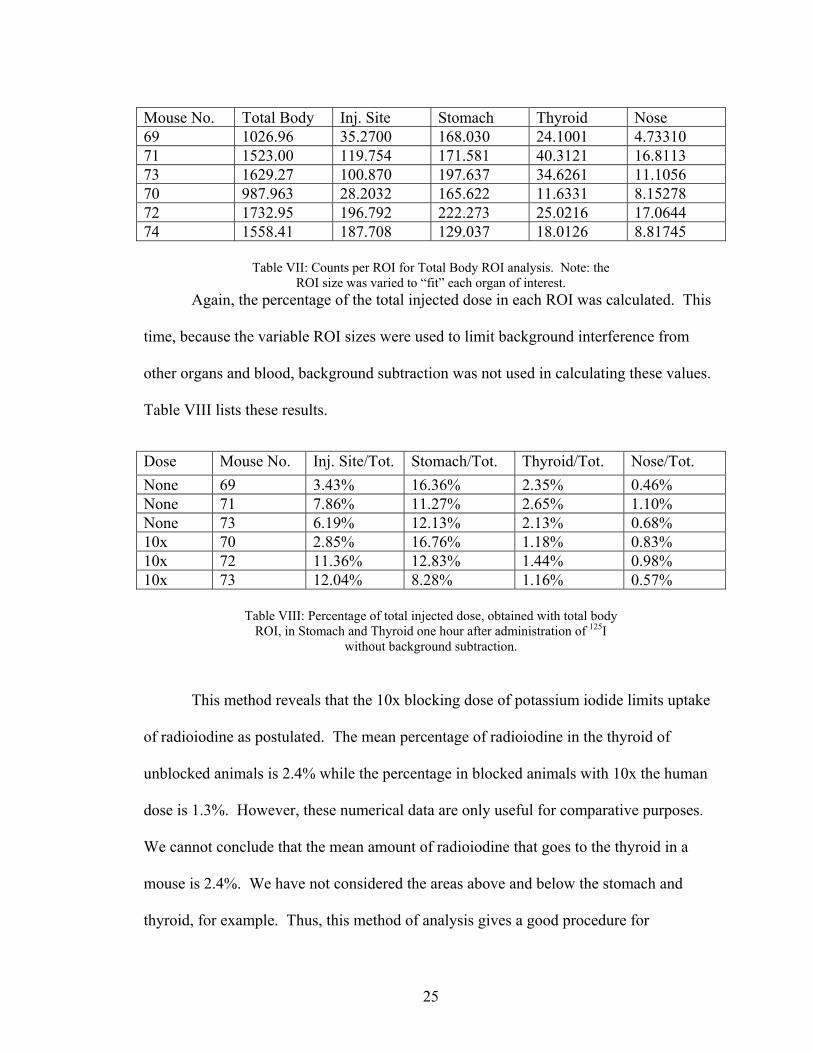
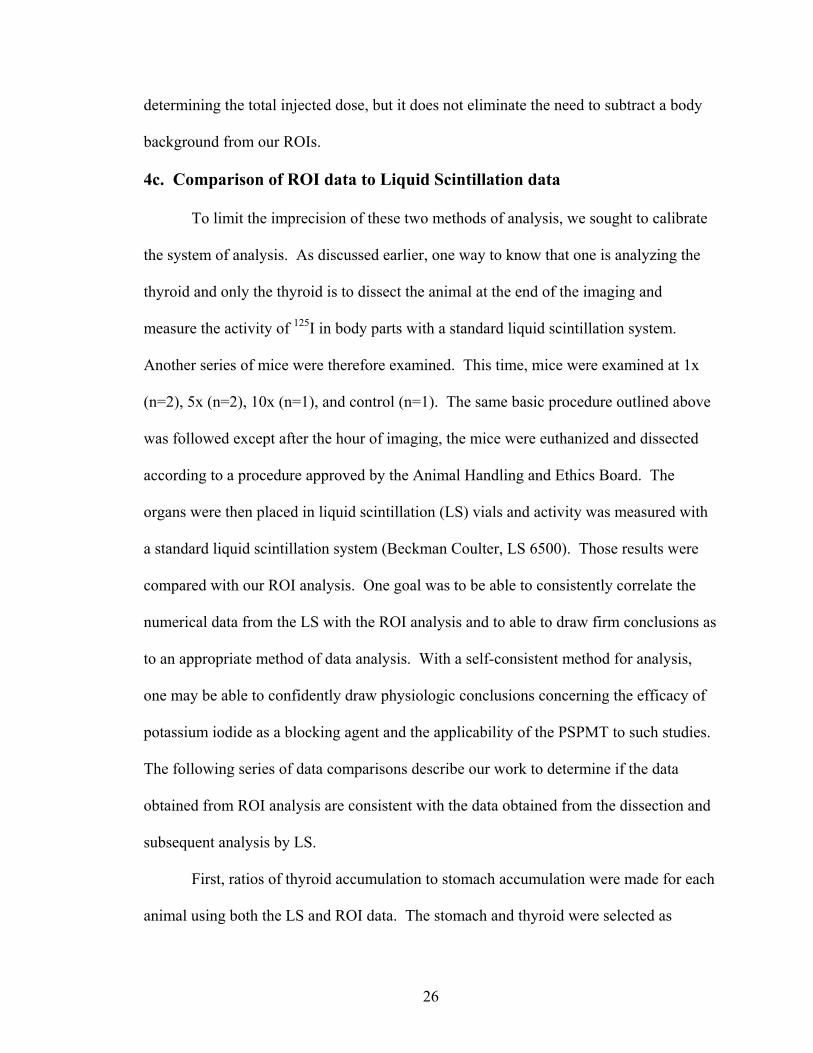
4b. Data Analysis Method II: “Total Body ROI”…………………24
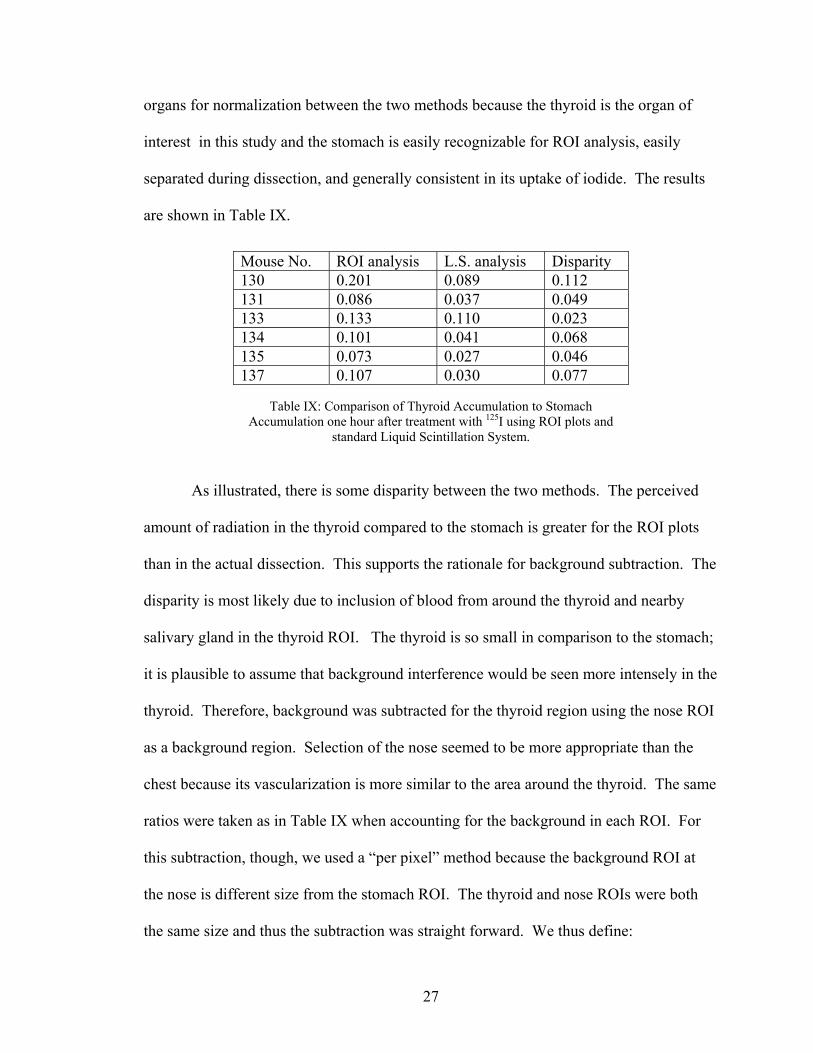
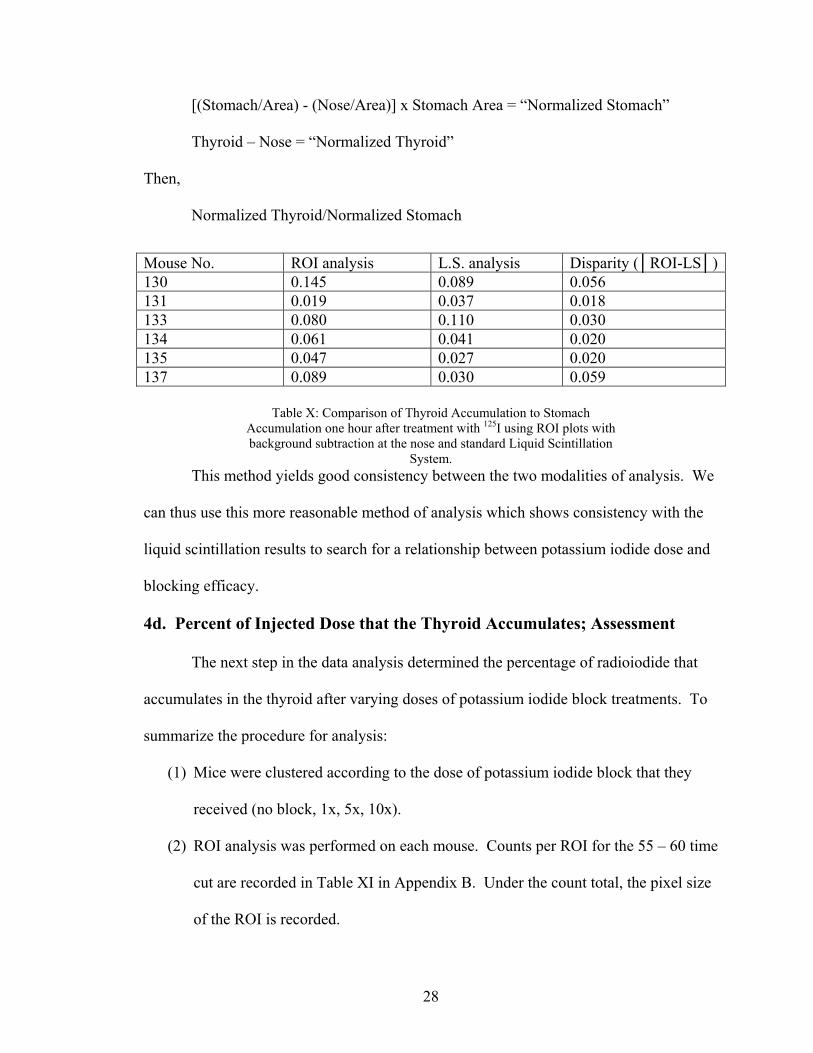
4c. Comparison of ROI data to Liquid Scintillation data…………26
4d. Percent of Injected Dose that the Thyroid Accumulates
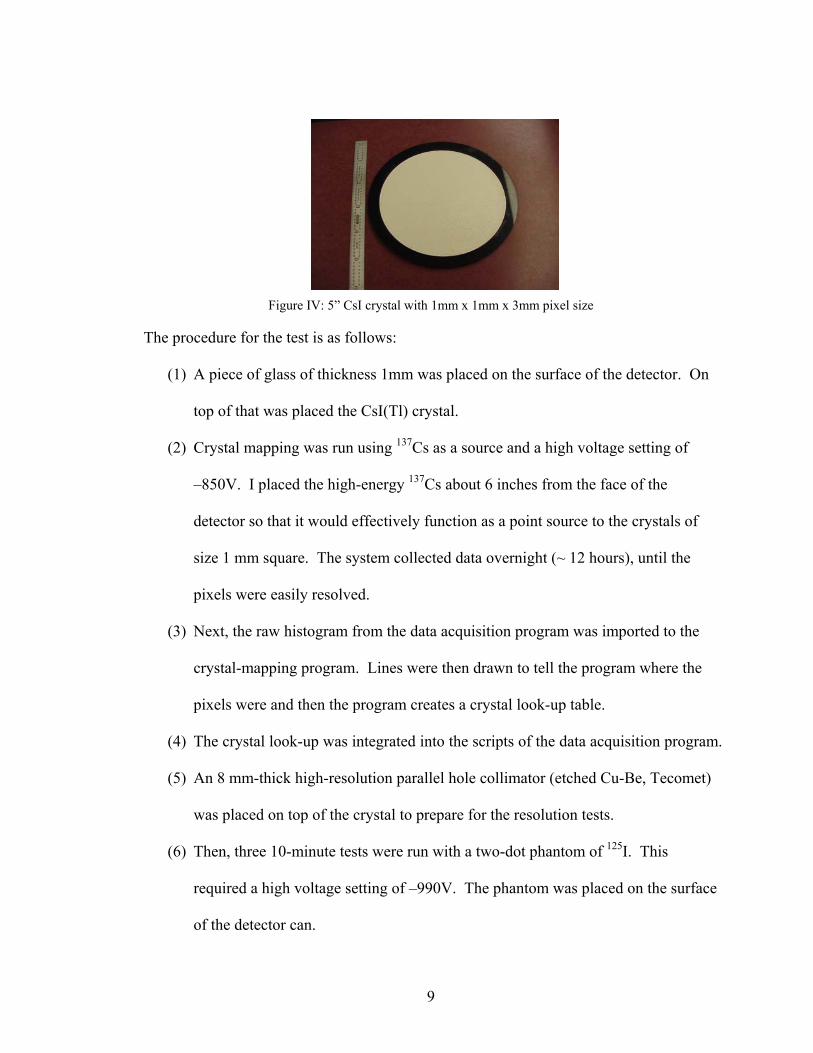
was placed on top of the crystal to prepare for the resolution tests.
(6) Then, three 10-minute tests were run with a two-dot phantom of 125I. This
required a high voltage setting of –990V. The phantom was placed on the surface
of the detector can.
10
(7) Calculations were made of the full width at half max for each trial and averaged
the results.
(8) The process was repeated with no glass on the detector face.
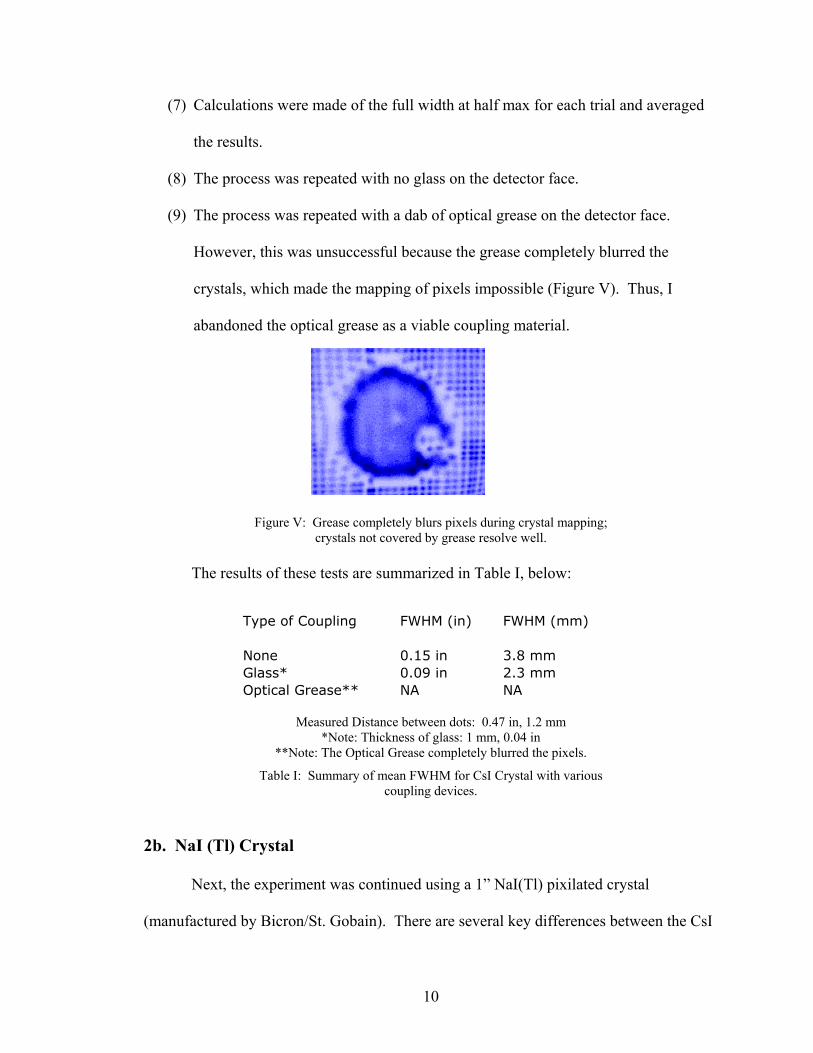
(9) The process was repeated with a dab of optical grease on the detector face.
However, this was unsuccessful because the grease completely blurred the
crystals, which made the mapping of pixels impossible (Figure V). Thus, I
abandoned the optical grease as a viable coupling material.
Figure V: Grease completely blurs pixels during crystal mapping;
crystals not covered by grease resolve well.
The results of these tests are summarized in Table I, below:
Measured Distance between dots: 0.47 in, 1.2 mm
*Note: Thickness of glass: 1 mm, 0.04 in **Note: The Optical Grease completely blurred the pixels.
Table I: Summary of mean FWHM for CsI Crystal with various coupling devices.
2b. NaI (Tl) Crystal
Next, the experiment was continued using a 1” NaI(Tl) pixilated crystal
(manufactured by Bicron/St. Gobain). There are several key differences between the CsI
Type of Coupling FWHM (in) FWHM (mm)
None 0.15 in 3.8 mmGlass* 0.09 in 2.3 mmOptical Grease** NA NA
11
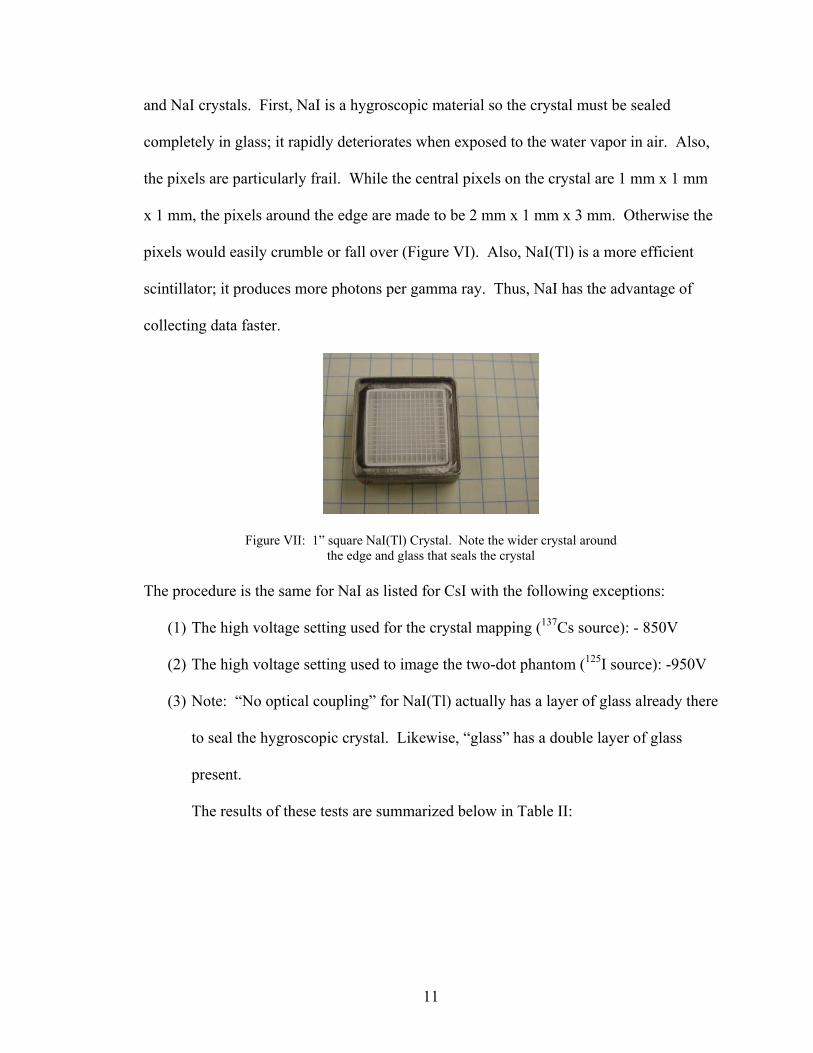
and NaI crystals. First, NaI is a hygroscopic material so the crystal must be sealed
completely in glass; it rapidly deteriorates when exposed to the water vapor in air. Also,
the pixels are particularly frail. While the central pixels on the crystal are 1 mm x 1 mm
x 1 mm, the pixels around the edge are made to be 2 mm x 1 mm x 3 mm. Otherwise the
pixels would easily crumble or fall over (Figure VI). Also, NaI(Tl) is a more efficient
scintillator; it produces more photons per gamma ray. Thus, NaI has the advantage of
collecting data faster.
Figure VII: 1” square NaI(Tl) Crystal. Note the wider crystal around the edge and glass that seals the crystal
The procedure is the same for NaI as listed for CsI with the following exceptions:
(1) The high voltage setting used for the crystal mapping (137Cs source): - 850V
(2) The high voltage setting used to image the two-dot phantom (125I source): -950V
(3) Note: “No optical coupling” for NaI(Tl) actually has a layer of glass already there
to seal the hygroscopic crystal. Likewise, “glass” has a double layer of glass
present.
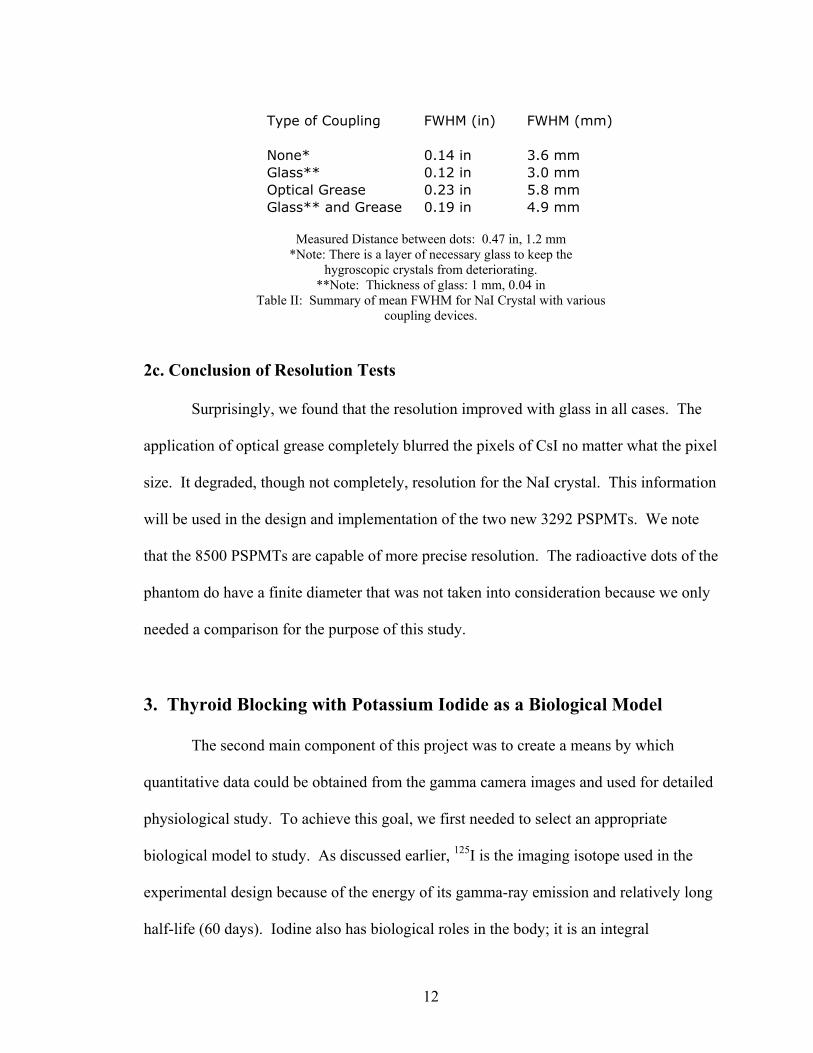
The results of these tests are summarized below in Table II:
12
Measured Distance between dots: 0.47 in, 1.2 mm
*Note: There is a layer of necessary glass to keep the hygroscopic crystals from deteriorating.
**Note: Thickness of glass: 1 mm, 0.04 in Table II: Summary of mean FWHM for NaI Crystal with various
coupling devices.
2c. Conclusion of Resolution Tests
Surprisingly, we found that the resolution improved with glass in all cases. The
application of optical grease completely blurred the pixels of CsI no matter what the pixel
size. It degraded, though not completely, resolution for the NaI crystal. This information
will be used in the design and implementation of the two new 3292 PSPMTs. We note
that the 8500 PSPMTs are capable of more precise resolution. The radioactive dots of the
phantom do have a finite diameter that was not taken into consideration because we only
needed a comparison for the purpose of this study.
3. Thyroid Blocking with Potassium Iodide as a Biological Model
The second main component of this project was to create a means by which
quantitative data could be obtained from the gamma camera images and used for detailed
physiological study. To achieve this goal, we first needed to select an appropriate
biological model to study. As discussed earlier, 125I is the imaging isotope used in the
experimental design because of the energy of its gamma-ray emission and relatively long
half-life (60 days). Iodine also has biological roles in the body; it is an integral
Type of Coupling FWHM (in) FWHM (mm)
None* 0.14 in 3.6 mmGlass** 0.12 in 3.0 mmOptical Grease 0.23 in 5.8 mmGlass** and Grease 0.19 in 4.9 mm
13
component of hormones produced by the thyroid. Thus, the thyroid has a mechanism to
transport iodide into the tissue where the iodine is then organified into hormone.
Injection of 125I iodide into a euthyroid species would therefore result in the accumulation
of that 125I in the thyroid. Given the basic nature of iodide metabolism in the body and
iodide’s easy commercial availability, it seemed a logical choice for this study. We chose
to examine the biodistribution of radioiodine in the body and the block of its uptake by
potassium iodide. Stable potassium iodide administration is the accepted prophylaxis to
block the thyroid from accumulating and organifing radioiodide.
3a. Reasons to Study KI blocking
Radioiodine accumulation by the thyroid, while a relatively simple metabolic
process, is a non-trivial study in current biological research. There are several important
reasons to study radioiodide accumulation by the thyroid and the efficacy of stable
potassium iodide as a block to that uptake. First, there is a risk of exposure to
radioisotopes in the event of a nuclear power plant accident as was seen in Poland as a
result of the Chernobyl reactor accident and at Three Mile Island. Also, with the increase
in nuclear medicine, the risk of radiation exposure extends to hospitals handling
radioactive isotopes. Exposure to 137Cs occurred at an abandoned Brazilian hospital[1].
There is also the danger of exposure to radiation resulting from an act of terrorism.
In addition to the dangers associated with accidental exposure, there is reason to
study radioiodide accumulation in the thyroid from planned procedures. Many treatments
for cancer in particular now use radiation therapies that involve tagging a ligand with a
radioisotope of iodine. Some iodine detaches from the ligand due to the molecule’s
instability and the body is exposed to more radioiodine when it metabolizes the
14
compound. 131I is incorporated into metaiodobenzylguanidine (MIBG) and used to treat
children with neuroblastoma[2,3]. One consequence of improved survival rates among
patients receiving this therapy is that side effects of the treatment, the accumulation of
131I in the thyroid, must be analyzed further. Also, 125I is linked to fibrinogen and
administered to patients after hip surgery[4].
Radioiodide in the body can cause health problems. The most drastic
consequence is radiation-induced thyroid cancer[1]. The correlation between radioiodide
exposure and thyroid cancer has been studied[5,6] in an attempt to determine at what dose
radioiodine becomes carcinogenic. The FDA asserts exposure should not exceed 500
cGray for adults and 5 cGray for children and pregnant or lactating women[7]. Adverse
effects besides cancer include hypothyroidism, thyroiditis, and thyroid nodules and
adenomas[3]. Due to the risks incurred by exposure, every effort should be taken to
determine an appropriate prophylaxis to protect the thyroid. Currently, the dose
recommended is 130 mg of KI for adults and its protective effect lasts 24 hours[7].
Aside from testing the effectiveness of the blocking dose in the event of
radioiodine exposure, iodide kinetics in the body have become increasingly important in
research. Since the cloning of the rat and human forms of the protein in 1996, the sodium
iodide symporter (NIS) has become an important tool in research as a reporter gene in
gene therapy[8]. NIS is the transporter responsible for concentrating iodine in the tissue
of the thyroid gland, the stomach, and the lactating breast. Thus, if NIS is present in a
gene vector, the vector’s location, efficiency in the target tissue, and proliferation or
degradation can be monitored, non-invasively and in vivo, by imaging with radioiodide[9].
Dingli proposes that the properties of NIS make it close “to being the ideal reporter
15
gene”[9]. Thus, our ability to image NIS in thyroid tissue responsibly would be extremely
important step to imaging NIS activity in gene vectors.
For these reasons, we chose to study the efficacy of potassium iodide as a
blocking agent to accumulation of radioiodide by the thyroid.
3b. Summary of Previous Literature on Efficacy of KI Blocking
Before beginning our current investigation, I performed a thorough search of
current literature. Several questions guided the direction of the research. One goal was
to determine different strategies for investigating how radioiodine distributed throughout
the body and how results of KI block efficacy were represented. Next, I was concerned
with what the results of these studies were so that this study could be compared with
others. Finally, we investigated uses of gamma-ray imaging to study biodistribution in
general and biodistribution of iodide in particular as a means for visualization.
There are several ways to study distribution of radioactive ligands in lab animals.
One of the most common methods is to inject the isotope into the animal, allow a set
amount of time post-injection to elapse, and then sacrifice the animal. After the animal is
euthanized, the organs and an aliquot of blood can be excised and counted
scintigraphically using a standard gamma-counting well[10, 11, 12]. This method is effective
because it ensures that one is counting the organs of interest, the blood provides a reliable
method of normalization, and the efficiency of the system is easily determined by
counting a stock of the isotope. However, the method involves the sacrifice of the animal
and as a result requires a large number of animals and prohibits the possibility of
longitudinal study.
16
Another method of study is urinary analysis of excreted iodide[13, 14]. Excess
iodide is either accumulated in the stomach and passed through the bowels or excreted by
the kidneys as a component of urine. Thus, by knowing kidney efficiencies and counting
the activity in the urine, one can determine how much iodide the animal accumulates by
knowing how much is excreted. This method of investigation has no way of determining
precisely where the iodide is being acquired in the body; it can only measure the
clearance rate of the injected radioiodine.
There are a few other studies that use methods specifically to study uptake of
radioiodine by the thyroid. Yu and Shaw developed a cuff to shield the body of the
mouse only exposing the neck to a probe to count activity. They determined after 24
hours, the activity in the neck was equal to the activity in the actual thyroid (a sub-set of
animals were analyzed both pre-dissection with the collar and post-dissection by counting
the actual thyroid). So, at 24 hours post-injection, the activity in the neck was determined
and assumed to be the activity in the thyroid[15]. This is an effective means to study
biodistribution after distributions are static. However, one aspect of our goal is the ability
to study time-dependent behavior which is excluded from such a study. Also, the means
of measuring the injected dose involves a different geometry than measuring the
accumulation in the neck. Another strategy to determine KI block efficacy is
retrospective study performed using human subjects who had undergone treatment for
cancer. As discussed above, these patients are exposed to radioiodide as a result of their
treatment for the cancer. This study did not try to measure the accumulation in the
thyroid; rather it assessed patient health years after the treatment[3]. Finally, a computer
17
simulation was developed based on a compartmentalization model of iodide in the
body[16].
While the methods of investigation varied widely, the representations of their
findings fall into two main categories. Most studies represent accumulation by the
thyroid as a percentage of the injected dose that they measure in the thyroid and, where
applicable, on a per-gram of tissue basis[17]. This allows for easy comparison of
accumulation between treatment groups. The other method described is to determine the
“protective effect” of the KI therapy. The protective effect is defined as the percent of
accumulation in the thyroid eliminated by the potassium iodide block[13, 16]. The former
method is a general way to study biodistribution while the later is a more specific way to
study iodide distribution relevant to blocking dose effectiveness.
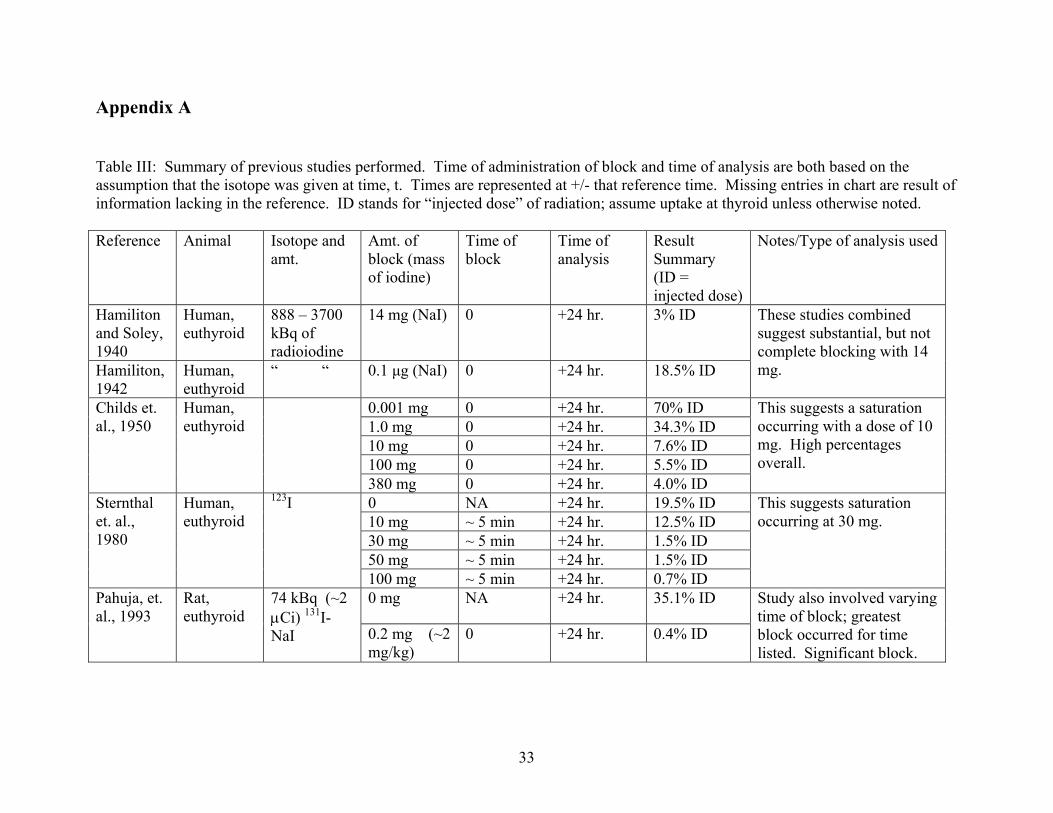
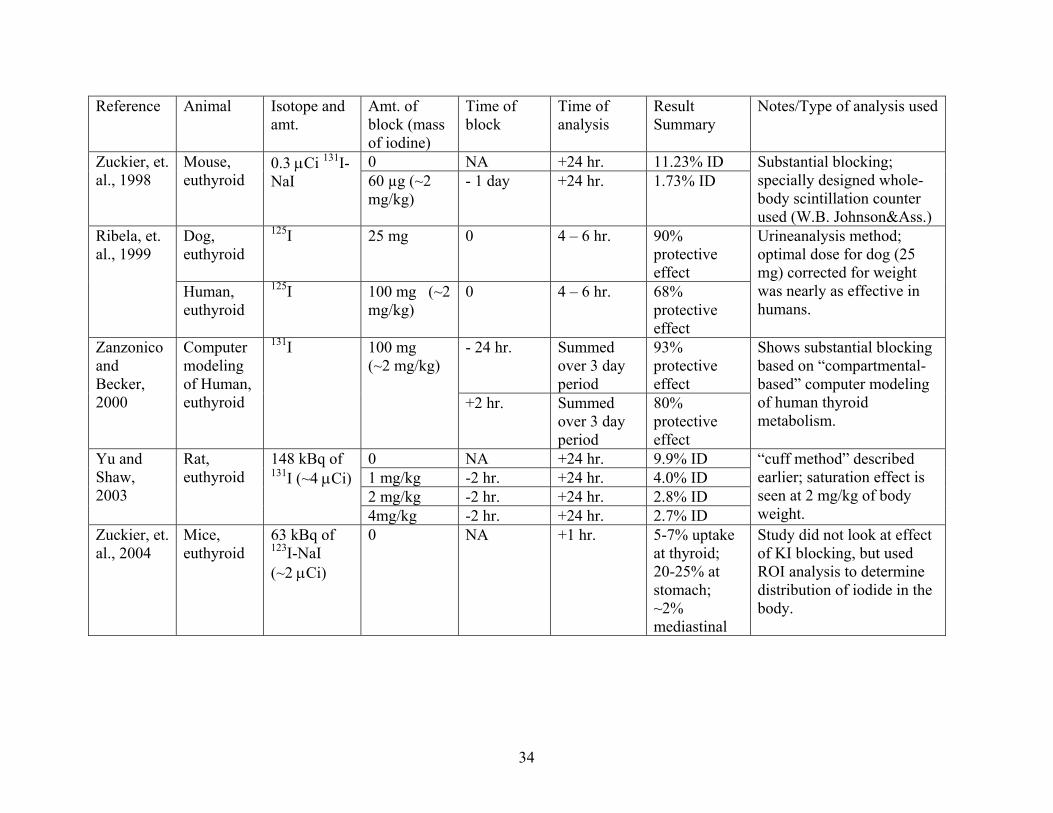
A concise and useful summary of all the results is a difficult task because of the
myriad of ways in which the relevant studies were conducted, results displayed, and
animals used. However, Table III (Appendix A) is a representation of the results. As
demonstrated in Table I, the amount of activity the thyroids of the animals/humans were
exposed to varied greatly in addition to the amount of KI blocking used. No clear
blocking dose is seen to be effective across the studies. What does seem to be apparent is
that a plateau effect is seen in the studies done with variable blocking doses[15, 18, 19].
There is a dose that “saturates” the thyroid against further protection by potassium iodide.
Furthermore, the effectiveness of the block cannot be determined unless it is correlated to
the dose of radiation that the thyroid is receiving and whether that dose is safe. In order
to do this, the isotope of iodine used must be considered owing to the different energy
spectra emitted by the various isotopes of iodine.
18
There have also been a few studies done on patients receiving treatments of
radioiodine-tagged ligands. One study was a retrospective study of children who
received treatment for neuroblastoma with 131I-MIBG. Patients were examined an
average of 2.3 years after undergoing treatment and 52.4% displayed some amount of
thyroid dysfunction[3]. Another study done on patients undergoing the same treatment
noted 40% of patients suffering hypothyroidism after a follow-up at 11 months[2]. In both
studies the patients underwent a standard protocol of KI blocking which entails 100 mg
of KI administered 2 days before and up to 4 weeks after surgery. These data indicate
that the KI block administered to the patients is not enough to protect the thyroid. Even if
the same physical amount of iodide accumulation is proven safe for 125I, the higher
energy of 131I must be taken into consideration. Thus, blocking must be particularly
effective when 131I is administered to a patient. Combined with the variability in the
studies outlined above this suggests that further investigation of the efficacy of KI as a
blocking agent is warranted.
4. KI Blocking Study
To begin our investigation, an appropriate dose of KI to administer to the mice
was established. The FDA recommends a 130 mg KI per 60 kg of body mass [7]. This
will be referred to as the “human dose.” This corresponds to a dose of ~ 2.2 mg KI per
kg body mass or 2.2 µg KI per gram body mass. Thus, for the mice in this study, a “1x”
animal is given 2.2 µg KI times the mass of the animal.
The KI solution was prepared by dissolving 100 mg of KI in 10 mL of water.
Each “KI-group” mouse (n=3) in the first series of the study was given a 10x dose of
potassium iodide by administering the appropriated aliquot of the KI solution orally one
19
hour before the start of imaging. This corresponds to 70 µg KI for each 30 gram mouse,
or ~ 70 µL. A control group (n=3) was also tested. About fifteen minutes before the
administration of the radioisotope, the mouse was anesthetized interperitoneally with an
anesthetic, pentobarbital. As stated, one hour after the blocking dose was given, 12 µCi
of 125I in 100 µL of 0.9% saline was injected intramuscularly into the right femoral bicep
(right leg muscle). The animals were then imaged for one hour and returned to their
cages. The imaging software, KMAX, records both spatial and temporal information
from the imaging period as event files. Summed five-minute time cuts of the data are
then made with the data analysis package, IDL. The time cuts are then viewed and
certain regions are highlighted with Region of Interest (ROI) boxes. Each ROI is then
summed and analyzed and a plot is returned indicating counts per ROI versus time. The
assumption that only small changes in a given ROI will occur throughout a five-minute
period had previously been tested in other studies.
As discussed earlier, while it is valuable to be able to image parts of the body for
diagnostic and visualization purposes; in a physiological study it is important to have
quantitative data to support findings. Thus, a rigorous method of data analysis was
developed and assessed. I proposed two methods to analyze the data from this study to
develop a standard procedure for data analysis in similar future biological study.
Furthermore, we wish to compare our findings to previous data on the effectiveness of
potassium iodide as a blocking agent for uptake of radioiodide by the thyroid. In this
case the objective was to elucidate the percentage of the total injected radioiodide that
lodges in the thyroid after one hour of imaging.
20
4a. Data Analysis Method I: “Background Subtract”
The first method was to assume that the entire injected dose of radioiodide was
located at the injection site at the start of imaging. This value was inferred by placing a
standard 10 pixel square ROI encompassing the injection site and using the counts in that
ROI from the 0 -5 minute time-cut. I assumed that amount of activity was the “total
injected dose.” Next, I found the activity in the thyroid, stomach, and chest regions again
using the 10 pixel square ROI for the 55 – 60 minute time-cut. Each of these values
represents the activity in thyroid, stomach, and chest at one hour. The chest values were
subtracted from the thyroid and stomach counts with the intent to remove “body-
background” counts from the ROIs introduced by normal vascularization of areas above
and below the stomach or thyroid as well as the areas around the organs. 10 x 10 ROIs
are a useful standard size, but some organs of interest are somewhat smaller than such an
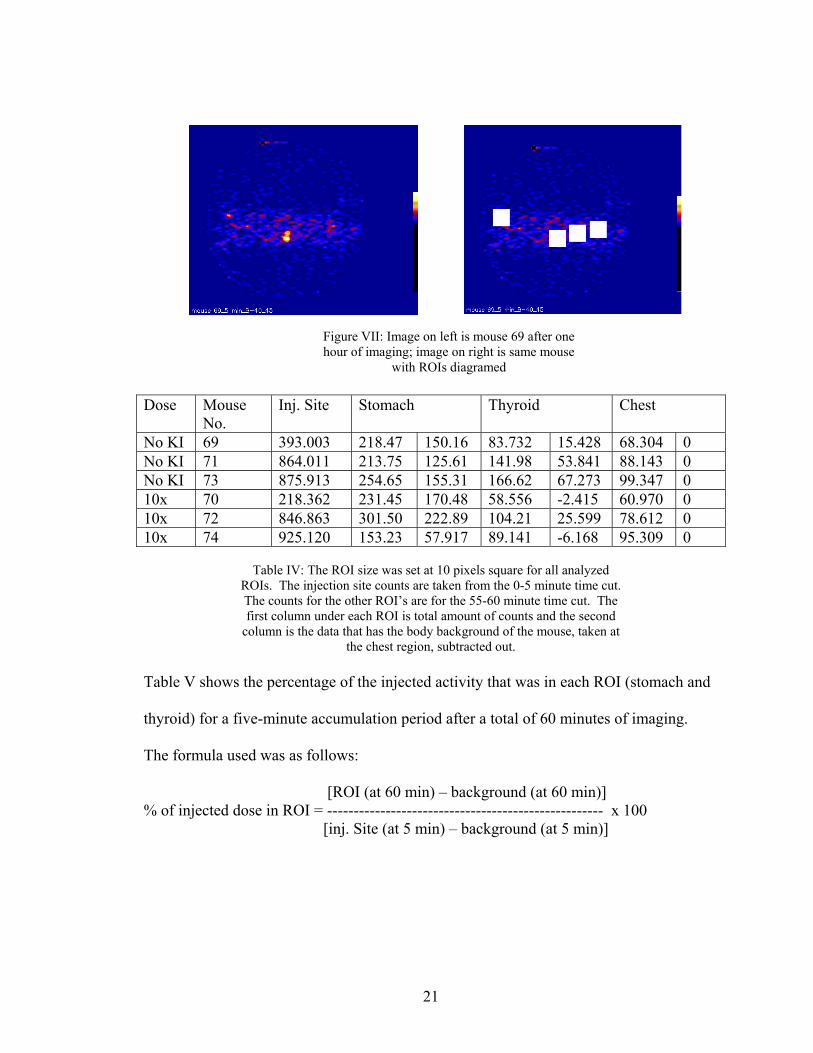
ROI. Figure VII shows a mouse after one hour of imaging with and without ROI present
for comparison. After background subtraction, the remaining activity in each ROI could
be attributed to the NIS-symporter accumulating iodide in the tissue of the thyroid or the
lumen of the stomach. The activity in each tissue was divided by the “total injected
dose” to recover a percentage. Listed in Table IV are the counts in each ROI.
21
Table IV: The ROI size was set at 10 pixels square for all analyzed
ROIs. The injection site counts are taken from the 0-5 minute time cut. The counts for the other ROI’s are for the 55-60 minute time cut. The first column under each ROI is total amount of counts and the second
column is the data that has the body background of the mouse, taken at the chest region, subtracted out.
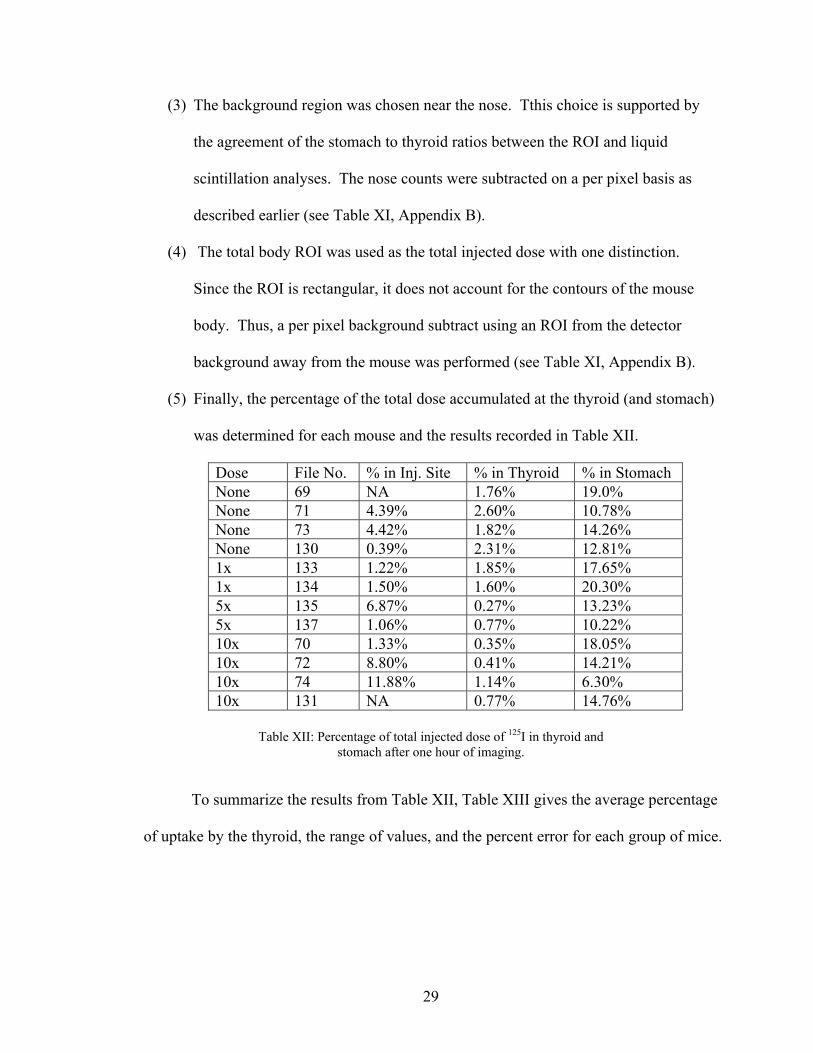
Table V shows the percentage of the injected activity that was in each ROI (stomach and
thyroid) for a five-minute accumulation period after a total of 60 minutes of imaging.
The formula used was as follows:
[ROI (at 60 min) – background (at 60 min)] % of injected dose in ROI = ---------------------------------------------------- x 100 [inj. Site (at 5 min) – background (at 5 min)]
Dose Mouse No.
Inj. Site Stomach Thyroid Chest
No KI 69 393.003 218.47 150.16 83.732 15.428 68.304 0 No KI 71 864.011 213.75 125.61 141.98 53.841 88.143 0 No KI 73 875.913 254.65 155.31 166.62 67.273 99.347 0 10x 70 218.362 231.45 170.48 58.556 -2.415 60.970 0 10x 72 846.863 301.50 222.89 104.21 25.599 78.612 0 10x 74 925.120 153.23 57.917 89.141 -6.168 95.309 0
Figure VII: Image on left is mouse 69 after one hour of imaging; image on right is same mouse
with ROIs diagramed
22
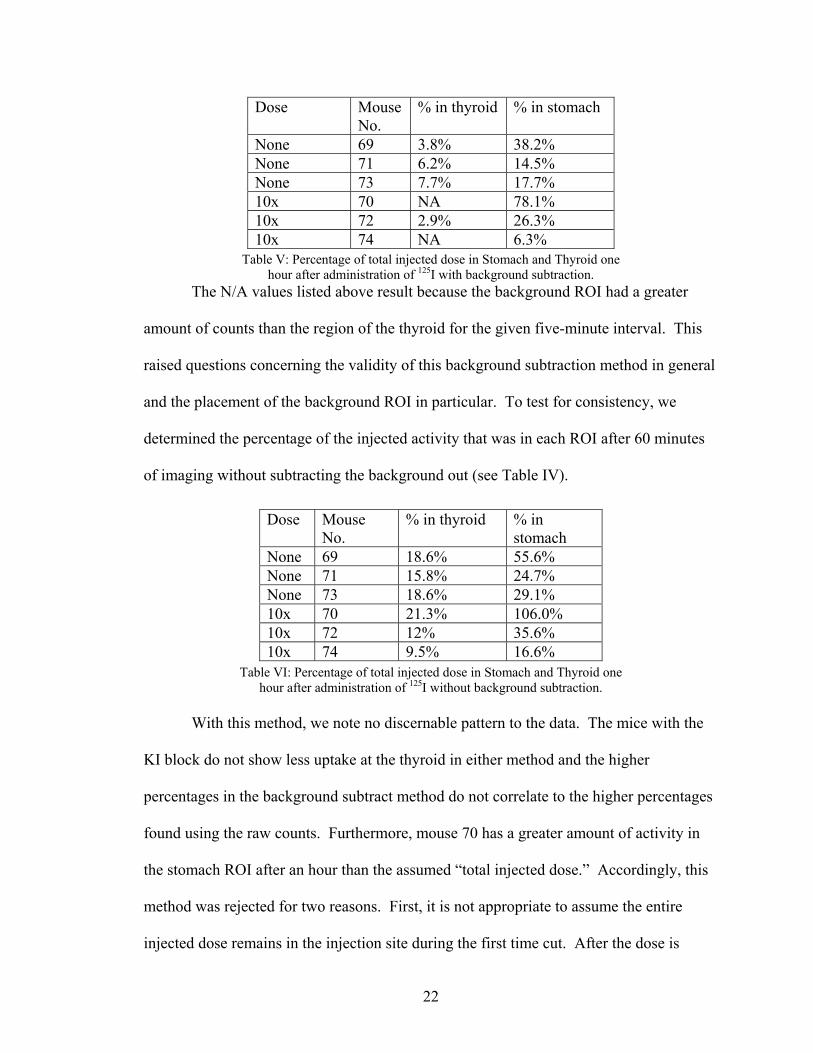
Table V: Percentage of total injected dose in Stomach and Thyroid one hour after administration of 125I with background subtraction.
The N/A values listed above result because the background ROI had a greater
amount of counts than the region of the thyroid for the given five-minute interval. This
raised questions concerning the validity of this background subtraction method in general
and the placement of the background ROI in particular. To test for consistency, we
determined the percentage of the injected activity that was in each ROI after 60 minutes
of imaging without subtracting the background out (see Table IV).
Table VI: Percentage of total injected dose in Stomach and Thyroid one hour after administration of 125I without background subtraction.
With this method, we note no discernable pattern to the data. The mice with the
KI block do not show less uptake at the thyroid in either method and the higher
percentages in the background subtract method do not correlate to the higher percentages
found using the raw counts. Furthermore, mouse 70 has a greater amount of activity in
the stomach ROI after an hour than the assumed “total injected dose.” Accordingly, this
method was rejected for two reasons. First, it is not appropriate to assume the entire
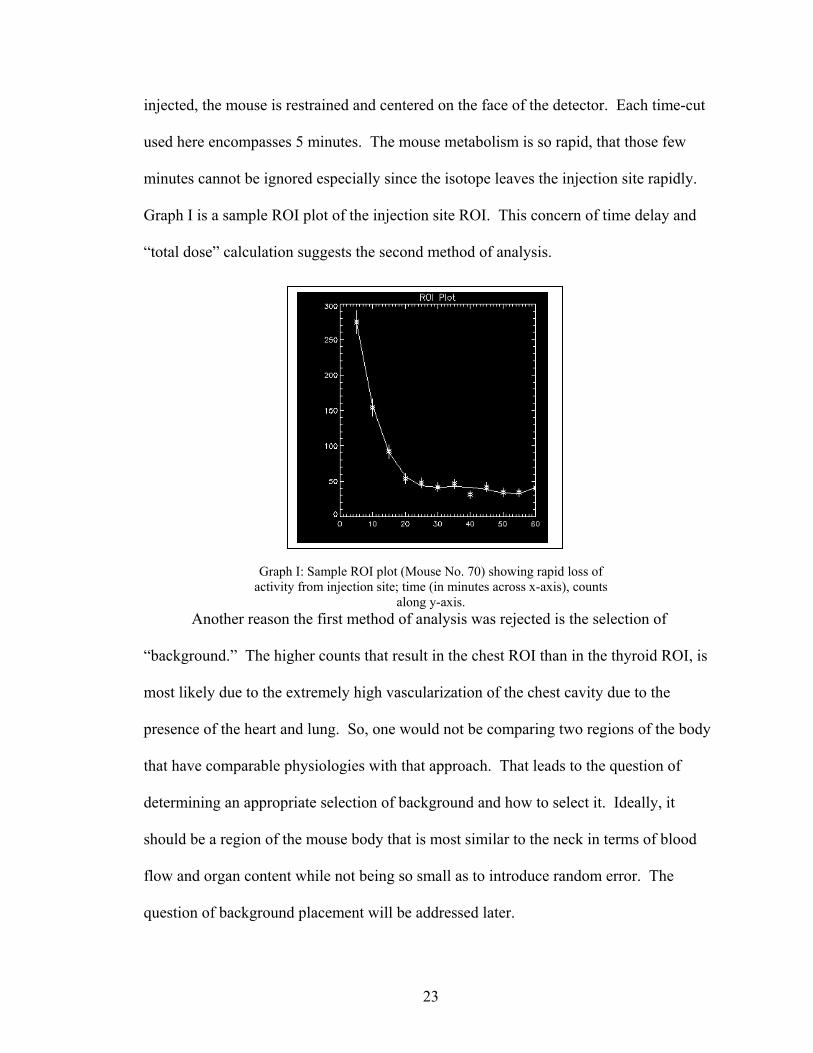
injected dose remains in the injection site during the first time cut. After the dose is
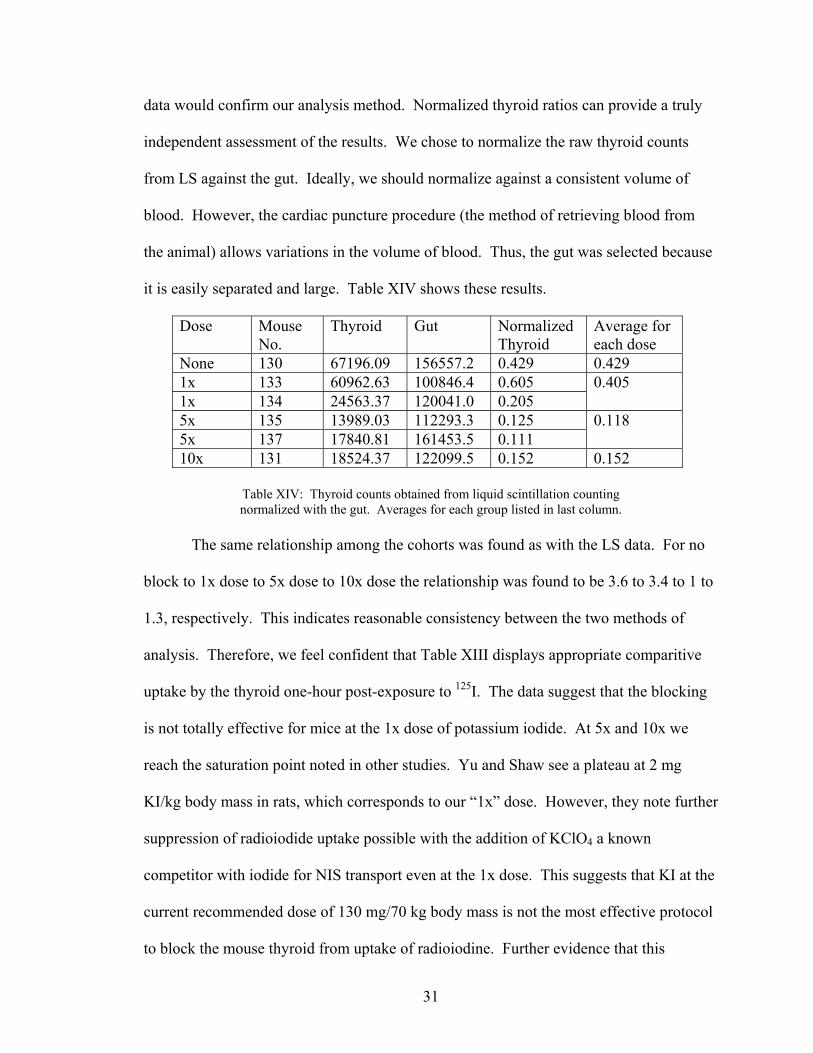
Table XIV: Thyroid counts obtained from liquid scintillation counting normalized with the gut. Averages for each group listed in last column.
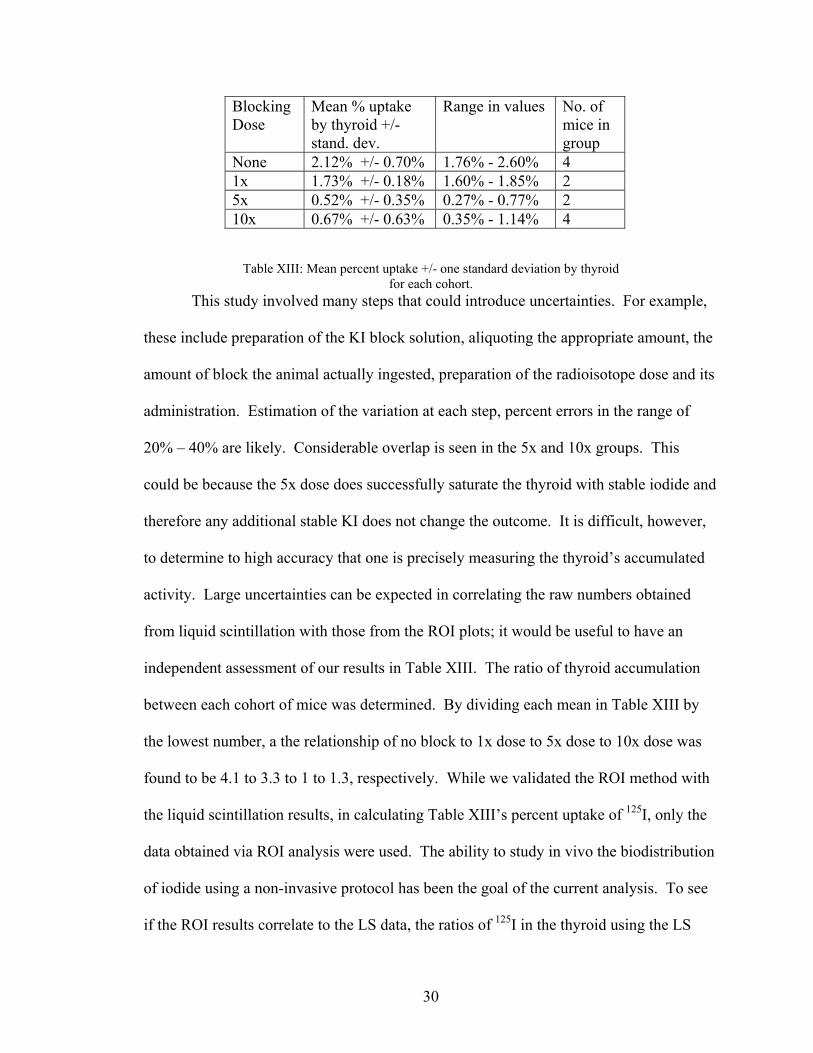
The same relationship among the cohorts was found as with the LS data. For no
block to 1x dose to 5x dose to 10x dose the relationship was found to be 3.6 to 3.4 to 1 to
1.3, respectively. This indicates reasonable consistency between the two methods of
analysis. Therefore, we feel confident that Table XIII displays appropriate comparitive
uptake by the thyroid one-hour post-exposure to 125I. The data suggest that the blocking
is not totally effective for mice at the 1x dose of potassium iodide. At 5x and 10x we
reach the saturation point noted in other studies. Yu and Shaw see a plateau at 2 mg
KI/kg body mass in rats, which corresponds to our “1x” dose. However, they note further
suppression of radioiodide uptake possible with the addition of KClO4 a known
competitor with iodide for NIS transport even at the 1x dose. This suggests that KI at the
current recommended dose of 130 mg/70 kg body mass is not the most effective protocol
to block the mouse thyroid from uptake of radioiodine. Further evidence that this
32
blocking dose may not be totally effective in humans is illustrated by the thyroid damage
observed in patients undergoing 131I-MIBG treatment. Our current set-up and analysis
method will permit us to continue study on other potential methods to protect the thyroid
from radioiodine exposure. We believe the ROI method of analysis is reliable because of
its good correlation the LS data. Furthermore, it measures the total injected dose and
fraction taken up in the thyroid using the same modality and geometry and allows for
non-invasive, in vivo study. Investigation may be useful to determine a more effective
prophylaxis for humans in the event of planned or accidental exposure to radioiodine.
5. Conclusion
The interdisciplinary investigation discussed in this thesis encompassed two
aspects. The first portion was a detector development study. Findings of improved
spatial resolution with the addition of glass as a method of optical coupling may be
applied in future detector design. Specifically, this result can be applied in the set-up of
the two new H8500 Hamamatsu PSPMT detectors. The second part of this study focused
on the application of the imaging system to physiologic study of small animals. This
work suggests that further work may be indicated to determine an optimal means to block
uptake of radioiodine by the thyroid.
33
Appendix A Table III: Summary of previous studies performed. Time of administration of block and time of analysis are both based on the assumption that the isotope was given at time, t. Times are represented at +/- that reference time. Missing entries in chart are result of information lacking in the reference. ID stands for “injected dose” of radiation; assume uptake at thyroid unless otherwise noted. Reference Animal Isotope and
amt. Amt. of block (mass of iodine)
Time of block
Time of analysis
Result Summary (ID = injected dose)
Notes/Type of analysis used
Hamiliton and Soley, 1940
Human, euthyroid
888 – 3700 kBq of radioiodine
14 mg (NaI) 0 +24 hr. 3% ID
Hamiliton, 1942
Human, euthyroid
“ “ 0.1 µg (NaI) 0 +24 hr. 18.5% ID
These studies combined suggest substantial, but not complete blocking with 14 mg.
0.001 mg 0 +24 hr. 70% ID 1.0 mg 0 +24 hr. 34.3% ID 10 mg 0 +24 hr. 7.6% ID 100 mg 0 +24 hr. 5.5% ID
Childs et. al., 1950
Human, euthyroid
380 mg 0 +24 hr. 4.0% ID
This suggests a saturation occurring with a dose of 10 mg. High percentages overall.
0 NA +24 hr. 19.5% ID 10 mg ~ 5 min +24 hr. 12.5% ID 30 mg ~ 5 min +24 hr. 1.5% ID 50 mg ~ 5 min +24 hr. 1.5% ID
Sternthal et. al., 1980
Human, euthyroid
123I
100 mg ~ 5 min +24 hr. 0.7% ID
This suggests saturation occurring at 30 mg.
0 mg NA +24 hr. 35.1% ID Pahuja, et. al., 1993
Rat, euthyroid
74 kBq (~2 µCi) 131I-NaI 0.2 mg (~2
mg/kg) 0 +24 hr. 0.4% ID
Study also involved varying time of block; greatest block occurred for time listed. Significant block.
34
Reference Animal Isotope and amt.
Amt. of block (mass of iodine)
Time of block
Time of analysis
Result Summary
Notes/Type of analysis used
0 NA +24 hr. 11.23% ID Zuckier, et. al., 1998
Mouse, euthyroid
0.3 µCi 131I-NaI 60 µg (~2
mg/kg) - 1 day +24 hr. 1.73% ID
Substantial blocking; specially designed whole-body scintillation counter used (W.B. Johnson&Ass.)
Dog, euthyroid
125I 25 mg 0 4 – 6 hr. 90% protective effect
Ribela, et. al., 1999
Human, euthyroid
125I 100 mg (~2 mg/kg)
0 4 – 6 hr. 68% protective effect
Urineanalysis method; optimal dose for dog (25 mg) corrected for weight was nearly as effective in humans.
- 24 hr. Summed over 3 day period
93% protective effect
Zanzonico and Becker, 2000
Computer modeling of Human, euthyroid
131I 100 mg (~2 mg/kg)
+2 hr. Summed over 3 day period
80% protective effect
Shows substantial blocking based on “compartmental-based” computer modeling of human thyroid metabolism.
0 NA +24 hr. 9.9% ID 1 mg/kg -2 hr. +24 hr. 4.0% ID 2 mg/kg -2 hr. +24 hr. 2.8% ID
Yu and Shaw, 2003
Rat, euthyroid
148 kBq of 131I (~4 µCi)
4mg/kg -2 hr. +24 hr. 2.7% ID
“cuff method” described earlier; saturation effect is seen at 2 mg/kg of body weight.
Zuckier, et. al., 2004
Mice, euthyroid
63 kBq of 123I-NaI (~2 µCi)
0 NA +1 hr. 5-7% uptake at thyroid; 20-25% at stomach; ~2% mediastinal
Study did not look at effect of KI blocking, but used ROI analysis to determine distribution of iodide in the body.
35
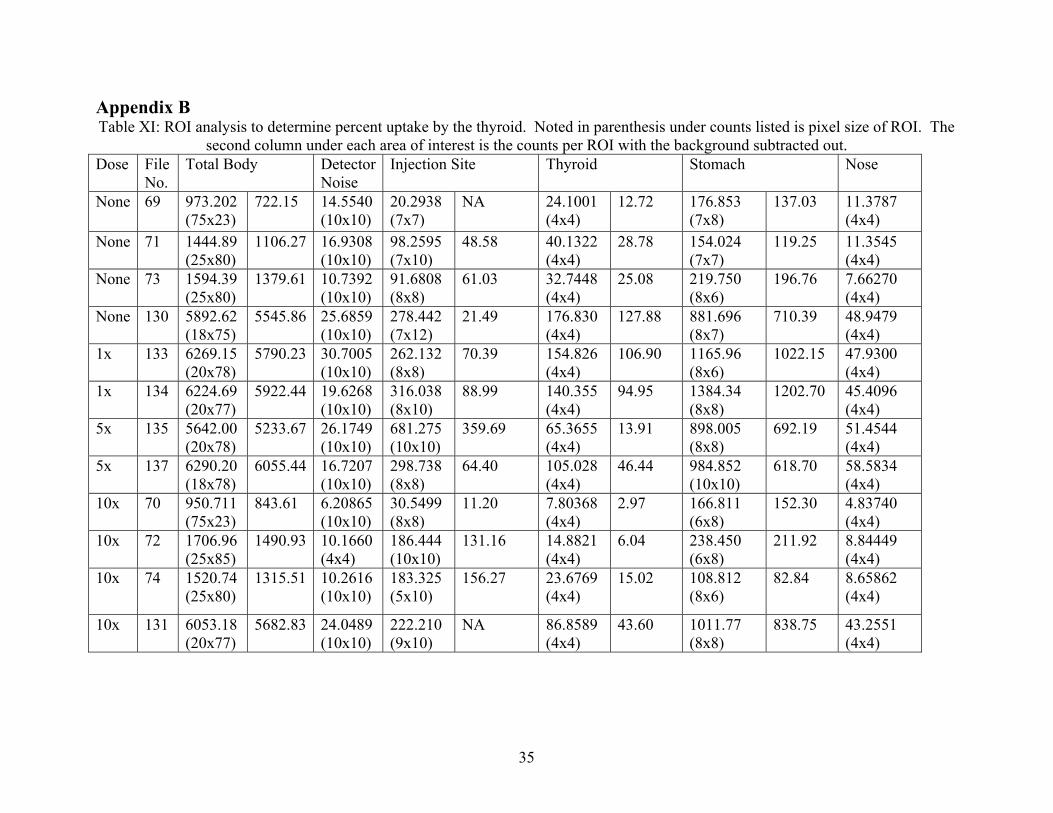
Appendix B Table XI: ROI analysis to determine percent uptake by the thyroid. Noted in parenthesis under counts listed is pixel size of ROI. The
second column under each area of interest is the counts per ROI with the background subtracted out. Dose File
No. Total Body Detector
Noise Injection Site Thyroid Stomach Nose
None 69 973.202 (75x23)
722.15 14.5540 (10x10)
20.2938 (7x7)
NA
24.1001 (4x4)
12.72 176.853 (7x8)
137.03 11.3787 (4x4)
None 71 1444.89 (25x80)
1106.27 16.9308 (10x10)
98.2595 (7x10)
48.58 40.1322 (4x4)
28.78 154.024 (7x7)
119.25 11.3545 (4x4)
None 73 1594.39 (25x80)
1379.61 10.7392 (10x10)
91.6808 (8x8)
61.03 32.7448 (4x4)
25.08 219.750 (8x6)
196.76 7.66270 (4x4)
None 130 5892.62 (18x75)
5545.86 25.6859 (10x10)
278.442 (7x12)
21.49 176.830 (4x4)
127.88 881.696 (8x7)
710.39 48.9479 (4x4)
1x 133 6269.15 (20x78)
5790.23 30.7005 (10x10)
262.132 (8x8)
70.39 154.826 (4x4)
106.90 1165.96 (8x6)
1022.15 47.9300 (4x4)
1x 134 6224.69 (20x77)
5922.44 19.6268 (10x10)
316.038 (8x10)
88.99 140.355 (4x4)
94.95 1384.34 (8x8)
1202.70 45.4096 (4x4)
5x 135 5642.00 (20x78)
5233.67 26.1749 (10x10)
681.275 (10x10)
359.69 65.3655 (4x4)
13.91 898.005 (8x8)
692.19 51.4544 (4x4)
5x 137 6290.20 (18x78)
6055.44 16.7207 (10x10)
298.738 (8x8)
64.40 105.028 (4x4)
46.44 984.852 (10x10)
618.70 58.5834 (4x4)
10x 70 950.711 (75x23)
843.61 6.20865 (10x10)
30.5499 (8x8)
11.20 7.80368 (4x4)
2.97 166.811 (6x8)
152.30 4.83740 (4x4)
10x 72 1706.96 (25x85)
1490.93 10.1660 (4x4)
186.444 (10x10)
131.16 14.8821 (4x4)
6.04 238.450 (6x8)
211.92 8.84449 (4x4)
10x 74 1520.74 (25x80)
1315.51 10.2616 (10x10)
183.325 (5x10)
156.27 23.6769 (4x4)
15.02 108.812 (8x6)
82.84 8.65862 (4x4)
10x 131 6053.18 (20x77)
5682.83 24.0489 (10x10)
222.210 (9x10)
NA 86.8589 (4x4)
43.60 1011.77 (8x8)
838.75 43.2551 (4x4)
36
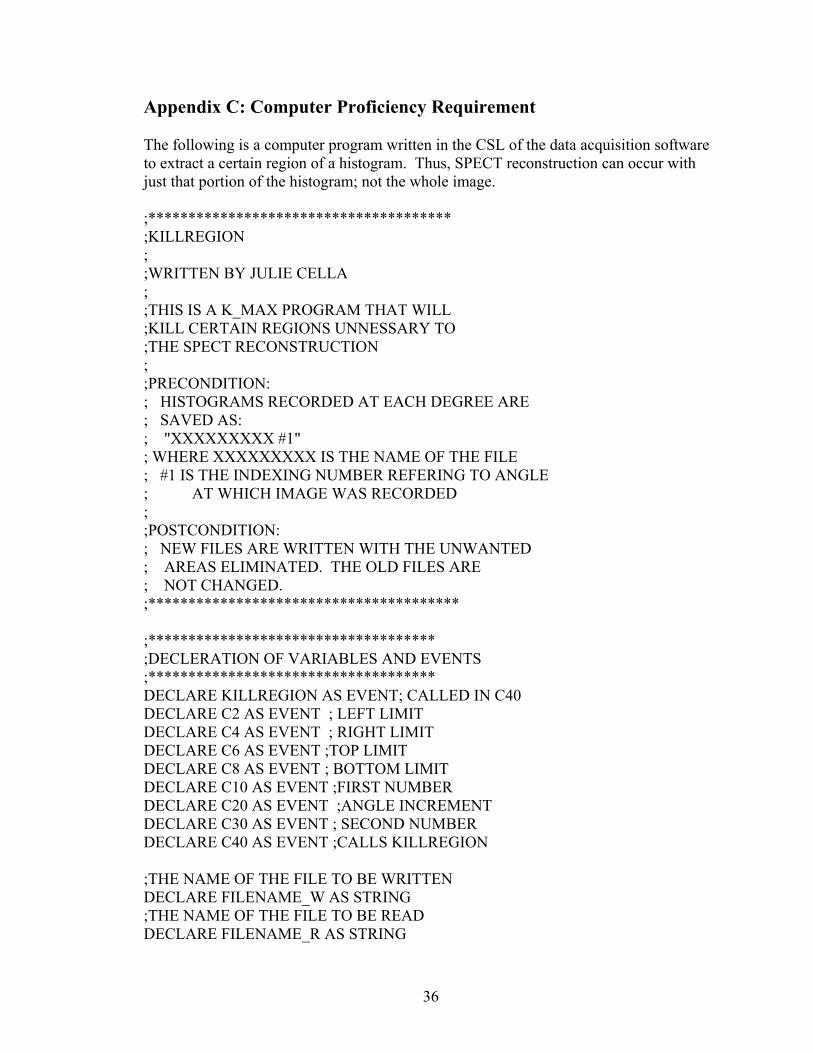
Appendix C: Computer Proficiency Requirement The following is a computer program written in the CSL of the data acquisition software to extract a certain region of a histogram. Thus, SPECT reconstruction can occur with just that portion of the histogram; not the whole image. ;************************************** ;KILLREGION ; ;WRITTEN BY JULIE CELLA ; ;THIS IS A K_MAX PROGRAM THAT WILL ;KILL CERTAIN REGIONS UNNESSARY TO ;THE SPECT RECONSTRUCTION ; ;PRECONDITION: ; HISTOGRAMS RECORDED AT EACH DEGREE ARE ; SAVED AS: ; "XXXXXXXXX #1" ; WHERE XXXXXXXXX IS THE NAME OF THE FILE ; #1 IS THE INDEXING NUMBER REFERING TO ANGLE ; AT WHICH IMAGE WAS RECORDED ; ;POSTCONDITION: ; NEW FILES ARE WRITTEN WITH THE UNWANTED ; AREAS ELIMINATED. THE OLD FILES ARE ; NOT CHANGED. ;*************************************** ;************************************ ;DECLERATION OF VARIABLES AND EVENTS ;************************************ DECLARE KILLREGION AS EVENT; CALLED IN C40 DECLARE C2 AS EVENT ; LEFT LIMIT DECLARE C4 AS EVENT ; RIGHT LIMIT DECLARE C6 AS EVENT ;TOP LIMIT DECLARE C8 AS EVENT ; BOTTOM LIMIT DECLARE C10 AS EVENT ;FIRST NUMBER DECLARE C20 AS EVENT ;ANGLE INCREMENT DECLARE C30 AS EVENT ; SECOND NUMBER DECLARE C40 AS EVENT ;CALLS KILLREGION ;THE NAME OF THE FILE TO BE WRITTEN DECLARE FILENAME_W AS STRING ;THE NAME OF THE FILE TO BE READ DECLARE FILENAME_R AS STRING
37
DECLARE WL AS INTEGER DECLARE WR AS INTEGER DECLARE WB AS INTEGER DECLARE WT AS INTEGER ;AN INDEXING NUMBER DECLARE NUMBER AS INTEGER ;THE ANGLE INCREMENT OF NEXT HISTOGRAM DECLARE DELTA AS INTEGER ;THE FIRST ANGLE DECLARE FIRST_NUMBER AS INTEGER ;THE LAST ANGLE DECLARE LAST_NUMBER AS INTEGER ;A PLACE HOLDER FOR THE CREATION OF SUFFIX DECLARE SUFFIX AS STRING DECLARE MYTEXT AS STRING DECLARE NUMBER2 AS INTEGER ; FOR READING THE PIXELS OVER TO THE NEW IMAGE DECLARE XCHAN AS INTEGER DECLARE YCHAN AS INTEGER ; FOR SPECIFING THE REGION TO "KILL" DECLARE XRANGE AS INTEGER DECLARE YRANGE AS INTEGER ;**************************************** ;MAIN CODE ;**************************************** ON GO DO END ON KILLREGION DO RECORDLN "________________________" SET TEXT TO FIRST_NUMBER PROMPT WITH "PLEASE ENTER START NUMBER" IF (OK) THEN SET FIRST_NUMBER TO TEXT END IF PROMPT WITH "PLEASE ENTER FINISH NUMBER" IF (OK) THEN
38
SET LAST_NUMBER TO TEXT END IF PROMPT WITH "PLEASE ENTER DELTA" IF (OK) THEN SET DELTA TO TEXT END IF SET NUMBER TO FIRST_NUMBER REPEAT ;*********INSERT FILE NAMES BELOW**** SET FILENAME_R TO "spect__C_A" SET FILENAME_W TO "spect__C_A_fixed" ;************************************ CONCAT_STR FILENAME_W " " CONCAT_STR FILENAME_R " " SET SUFFIX TO NUMBER CONCAT_STR FILENAME_W SUFFIX CONCAT_STR FILENAME_R SUFFIX NUMBER2 = NUMBER + DELTA ;OPENENING THE READ FILE; GETTING INFO OPEN FILENAME_R GET CURSORS IN WL WR WB WT ;MAKING NEW HISTOGRAM FOR WRITE DATA NEW HISTOGRAM FILENAME_W 128 128 SET AXES TO FALSE SET CURSORS TO WL WR WB WT ;THIS CODE WILL TRANSFER THE DATA OVER TO THE NEW FILE FOR XCHAN = 0 TO 127 FOR YCHAN = 0 TO 127 {FILENAME_W}[XCHAN, YCHAN] = {FILENAME_R}[XCHAN, YCHAN] END FOR END FOR CLOSE FILENAME_R SET TEXT TO LEFT_LIMIT SET MYTEXT TO "left limit//" CONCAT_STR MYTEXT TEXT SET_CONTROL 2, 0, MYTEXT SET TEXT TO RIGHT_LIMIT SET MYTEXT TO "right limit//"
39
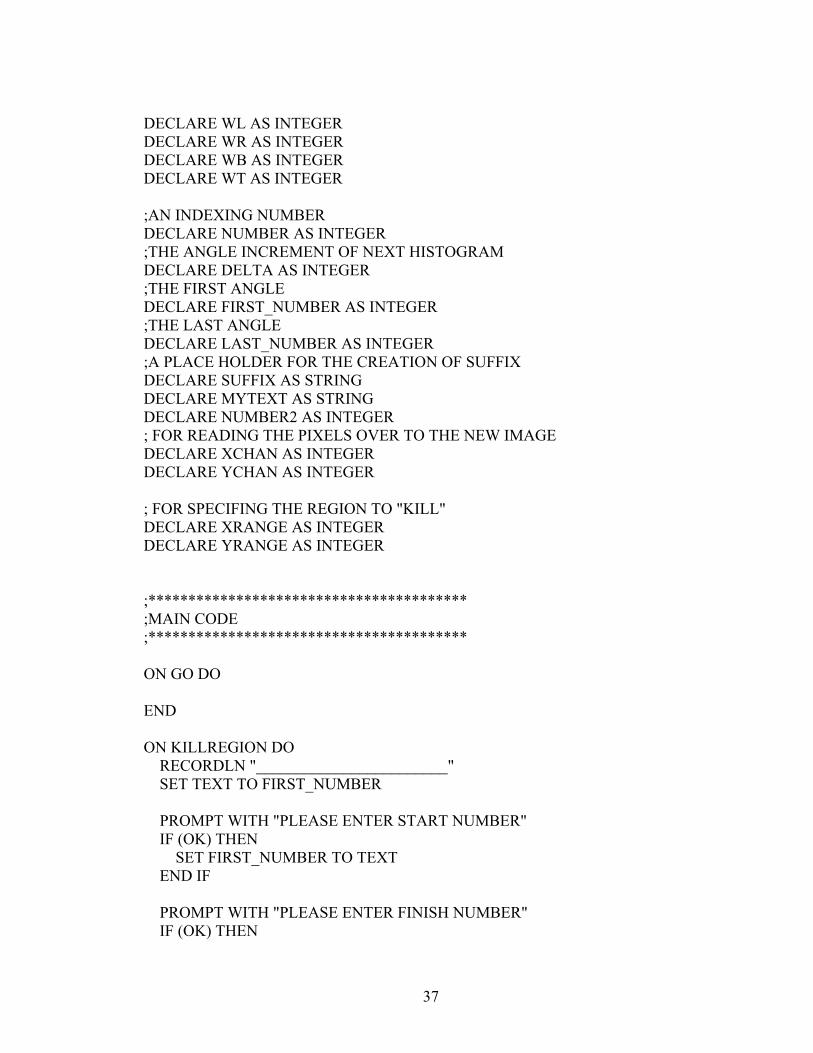
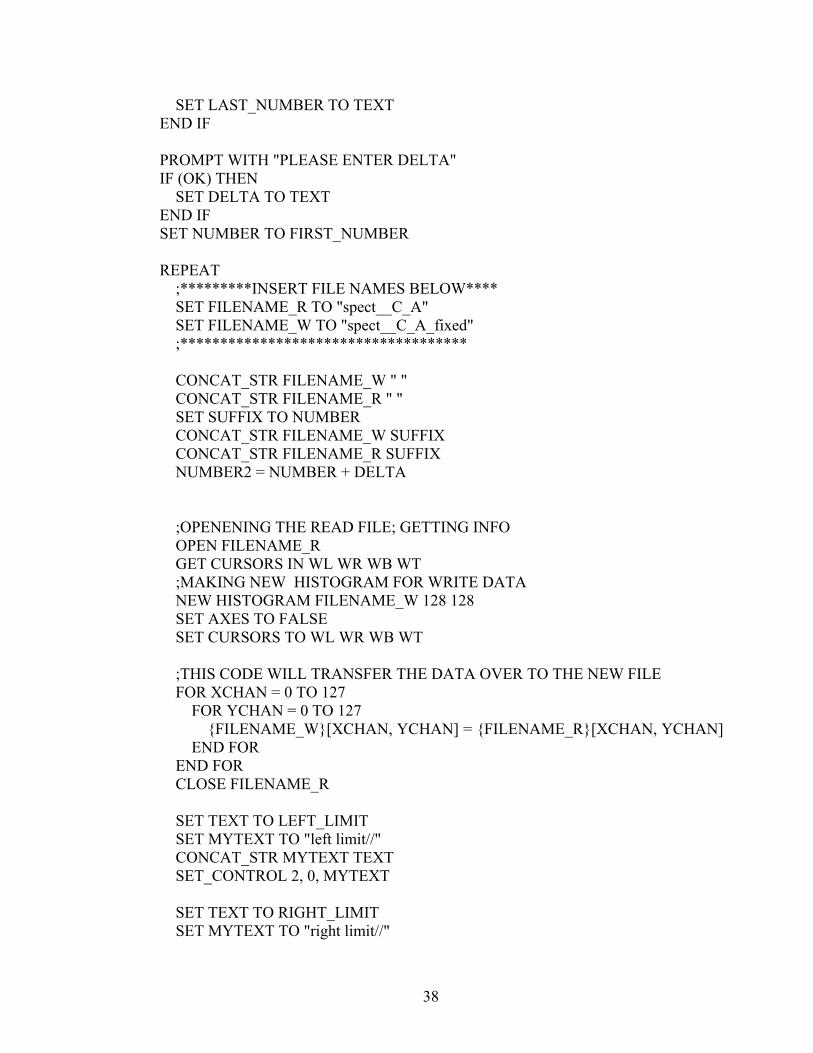
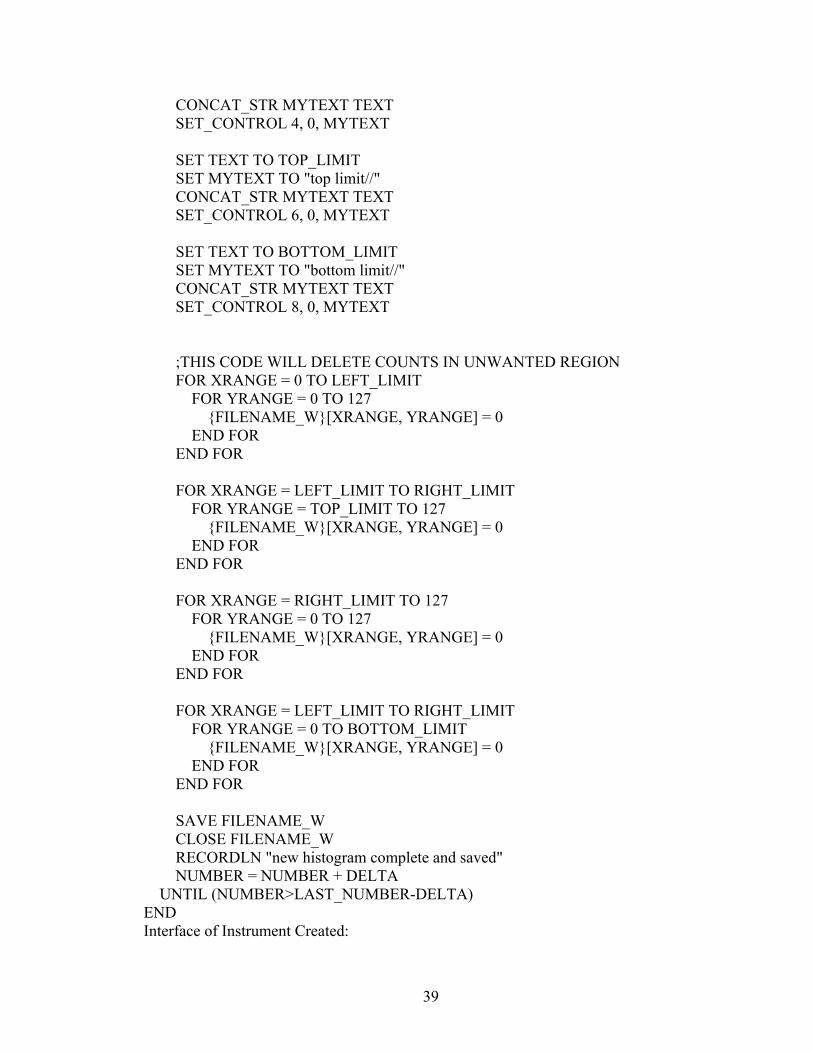
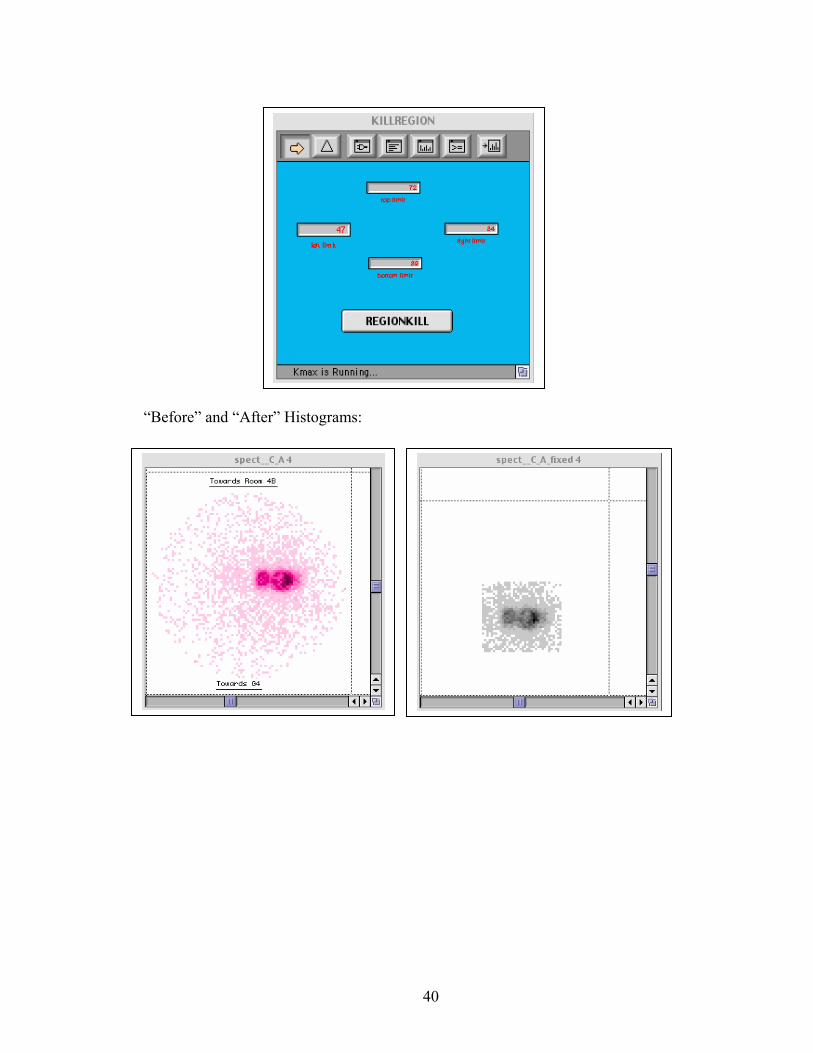
CONCAT_STR MYTEXT TEXT SET_CONTROL 4, 0, MYTEXT SET TEXT TO TOP_LIMIT SET MYTEXT TO "top limit//" CONCAT_STR MYTEXT TEXT SET_CONTROL 6, 0, MYTEXT SET TEXT TO BOTTOM_LIMIT SET MYTEXT TO "bottom limit//" CONCAT_STR MYTEXT TEXT SET_CONTROL 8, 0, MYTEXT ;THIS CODE WILL DELETE COUNTS IN UNWANTED REGION FOR XRANGE = 0 TO LEFT_LIMIT FOR YRANGE = 0 TO 127 {FILENAME_W}[XRANGE, YRANGE] = 0 END FOR END FOR FOR XRANGE = LEFT_LIMIT TO RIGHT_LIMIT FOR YRANGE = TOP_LIMIT TO 127 {FILENAME_W}[XRANGE, YRANGE] = 0 END FOR END FOR FOR XRANGE = RIGHT_LIMIT TO 127 FOR YRANGE = 0 TO 127 {FILENAME_W}[XRANGE, YRANGE] = 0 END FOR END FOR FOR XRANGE = LEFT_LIMIT TO RIGHT_LIMIT FOR YRANGE = 0 TO BOTTOM_LIMIT {FILENAME_W}[XRANGE, YRANGE] = 0 END FOR END FOR SAVE FILENAME_W CLOSE FILENAME_W RECORDLN "new histogram complete and saved" NUMBER = NUMBER + DELTA UNTIL (NUMBER>LAST_NUMBER-DELTA) END Interface of Instrument Created:
40
“Before” and “After” Histograms:
41
References
1. Balk SJ, Miller RW, Shannon MW. Radiation disasters and children. Pediatrics. 2003; 111: 1455-1467.
Thyroidal uptake and radiation dose after repetitive I-131-MIBG treatments: influence of potassium iodide for thyroid blocking. Med Pediatr Oncol. 2002; 38: 41-46.
3. van Santen HM, de Kraker J, van Eck BLF, de Vijlder JJM, Vulsma T. High
incidence of thyroid dysfunction despite prophylaxis with potassium iodide during 131I-metaiodobenzylguanidine treatment in children with neuroblastoma. Cancer. 2002; 94: 2081-2089.
4. Castronovo FP Jr. 125I-fibrinogen: thyroid blocking with 2.5 mg potassium
iodide twice daily in patients after hip surgery. J Nucl Biol Med. 1994; 38: 55-60.
5. Jacob P, Kenigsberg Y, Goulko G, Buglova E, Gering F, Golovneva A, Kruk J, Demidchik EP. Thyroid cancer risk in Belarus after comparison with external exposures. Radiat Environ Biophys. 2000; 39: 25-31.
6. Gilbert ES, Tarone R, Bouville A, Ron E. Thyroid cancer rates and 131I doses
form Nevada atmospheric nuclear bomb tests. Journal of the National Cancer Institute. 1998; 90: 1654-1660.
7. US Food and Drug Administration, Center for Drug Evaluation and Research.
Guidance Document: Potassium Iodide as a Thyroid Blocking Agent in Radiation Emergencies. Available at: http://www.fda.gov/cder/guidance/4825fnl.htm. Accessed January 30, 2004.
8. Zuckier LS, Dohan O, Li Y, Chang CJ, Carrasco N, Dadachova E. Kinetics of
Perrhenate Uptake and Compartive Biodistribution of Perrhenate, Pertechnetate, and Iodide by NaI Symporter-Expressing Tissues In Vivo. The Journal of Nuclear Medicine. 2004; 45: 500-507.
9. Dingli D, Russell SJ, Morris JC III. In vivo imaging and tumor therapy with the
sodium iodide symporter. Journal of Cellular Biochemistry. 2003; 90: 1079-1086.
10. He J, Liu G, Zhang S, Rusckowski M, Hnatowich D. Pharmacokinetics in mice
of four oligomerconjugated polymers for amplification targeting. Cancer and Biotherapy and Radiopharmaceuticals. 2003; 18: 941-947.
42
11. Pahuja DN, Rajan MGR, Borkar AV, Samuel AM. Potassium Iodate and its comparison to Potassium Iodide as a blocker of 131I uptake by the thyroid in rats. Health Physics. 1993; 65: 545-549.
12. Zuckier LS, Li Y, Chang CJ. Evaluation in a mouse model of a thyroid-blocking
protocol for 131I antibody therapy (Short Communication). Cancer Biotherapy and Radiopharmaceuticals. 1998; 13: 457-460.
13. Ribela MT, Marone MM, Bartolini P. Use of radioiodine urinalysis for effective
thyroid blocking in the first few hours post exposure. Health Physics. 1999; 76: 11-16.
14. Takamura N, Hamada A, Yamaguchi N, Matsushita N, Tarasiuk I, Ohashi T,
Aoyagi K, Mine M, Yamashita S. Urinary iodine kinetics after oral loading of potassium iodine. Endocrine Journal. 2003; 50: 589-593.
15. Yu MD, Shaw SM. Potential interference of agents on radioiodide thyroid uptake
in the euthyroid rat. The Journal of Nuclear Medicine. 2003; 44: 832-838.
16. Zanzonico PB, Becker DV. Effects of time of administration and dietary iodine levels on potassium iodide (KI) blockade of thyroid irradiation by 131I from radioactive fallout. Health Physics. 2000; 78: 660-667.
17. Chu T, Li R, Hu S, Liu X, Wang X. Preparation and biodistribution of
technetium-99m-labeled 1-(2-nitroimidaxole-1-yl)-propanhydroxyiminoamide (N21PA) as a tumor hypoxia marker. Nuclear Medicine and Biology. 2004; 31: 199-203.
18. Childs DS, Keating FR, Rall JE, Williams MMD, Power MH. The effect of
varying quantities of inorganic iodide (carrier) on the urinary excretion and thyroidal accumulation of radioiodine in exophtalmic goiter. J Clin Invest. 1950; 29: 726-738.
19. Sternthal E, Lipworth L, Stanley B, et al. Suppression of thyroid radioiodine
uptake by various doses of stable iodide. New England Journal of Medicine. 1980; 19: 1083-1088.
43
Bibliography Bacher K, Brans B, Monsieurs M, De Winter F, Dierckx RA, Thierens H. Thyroid
uptake and radiation dose after 131I-lipiodol treatment: is thyroid blocking by potassium iodide necessary? European Journal of Nuclear Medical Molecular Imaging. 2002; 29: 1311-1316.
Becker DV, Braverman LE, Dunn JT, Gaitan E, Gorman C, Maxon H, Schneider AB,
Van Middlesworth L, Wolff J. The use of iodine as a thyroidal blocking agent in the event of a reactor accident. Report of the Environmental Hazards Committee of the American Thyroid Association. Journal of the American Medicine Assoication. 1984; 252: 659-661.