52
Hydrocide Hydrocide Why our rivers are dying and the agenda for change
| Date post: | 15-Jul-2015 |
| Category: |
Documents |
| Upload: | manushiindia |
| View: | 3,568 times |
| Download: | 0 times |

HydrocideHydrocide
Why our rivers are dying and the agenda for changeg g

Background: Cleaning Ganga a national missiona national mission
1985: Ganga Action Plan launched1985: Ganga Action Plan launchedGAP I: Rs 433 crore spent GAP II: Rs 615 crore sanctioned in 59 townsGAP II: Rs 615 crore sanctioned in 59 towns
(Till 2007: Rs 254 crore spent)GAP II (tributaries): Rs 1120 crore sanctioned
(Till 2007: Rs 740 crore spent)
3 i t i t ti di i3 main components: interception; diversionand treatment of domestic sewage
Identification of industrial hotspots setting upIdentification of industrial hotspots, setting up for effluent treatment plants
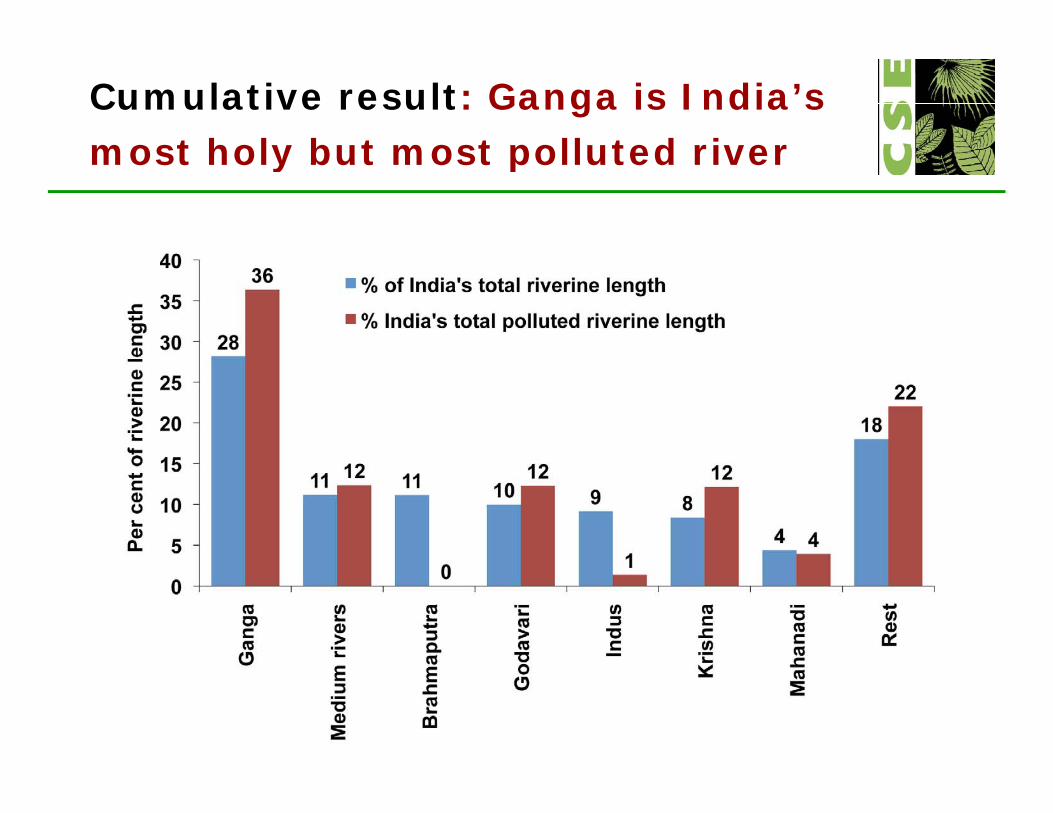
Cumulative result: Ganga is India’s most holy but most polluted rivermost holy but most polluted river
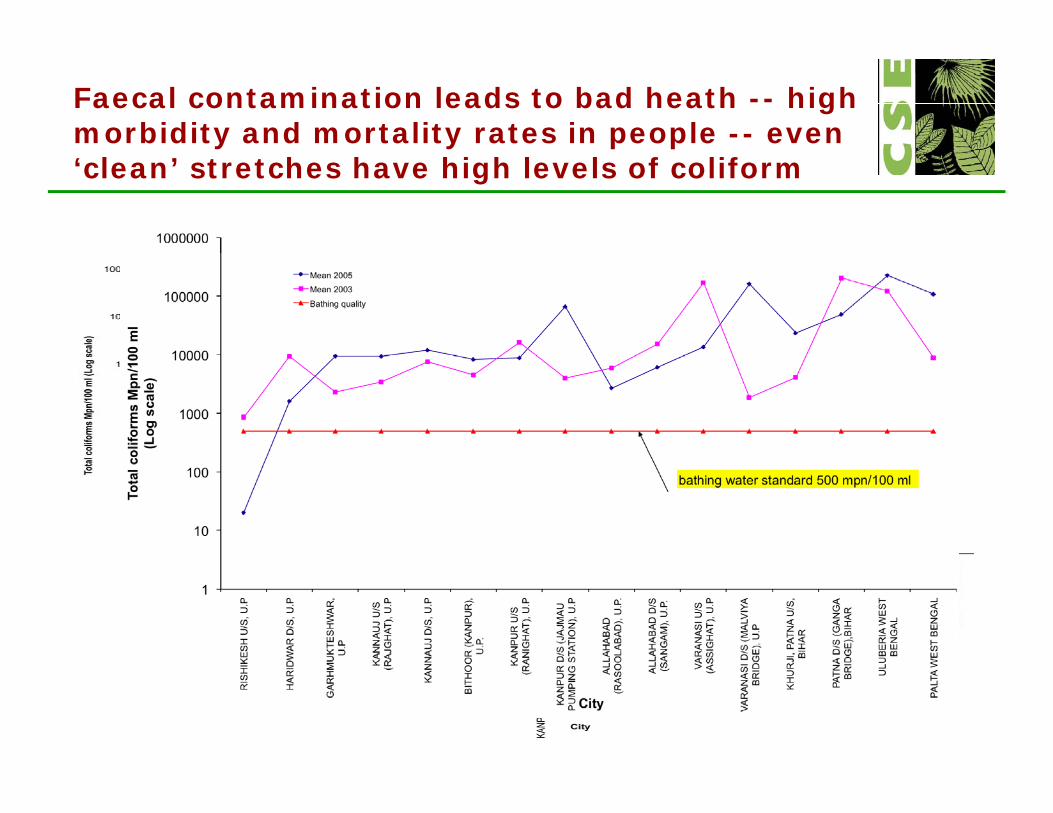
Faecal contamination leads to bad heath -- high morbidity and mortality rates in people -- even ‘clean’ stretches have high levels of coliform

Re-formulated programme: Recognises different stretches have different problems

Upstream shocks: minimum water flows being affected by hydroelectric projectsbeing affected by hydroelectric projects
Less waterLess water means less assimilative capacity in the river to clean
A ‘living’ river must havemust have water to flow
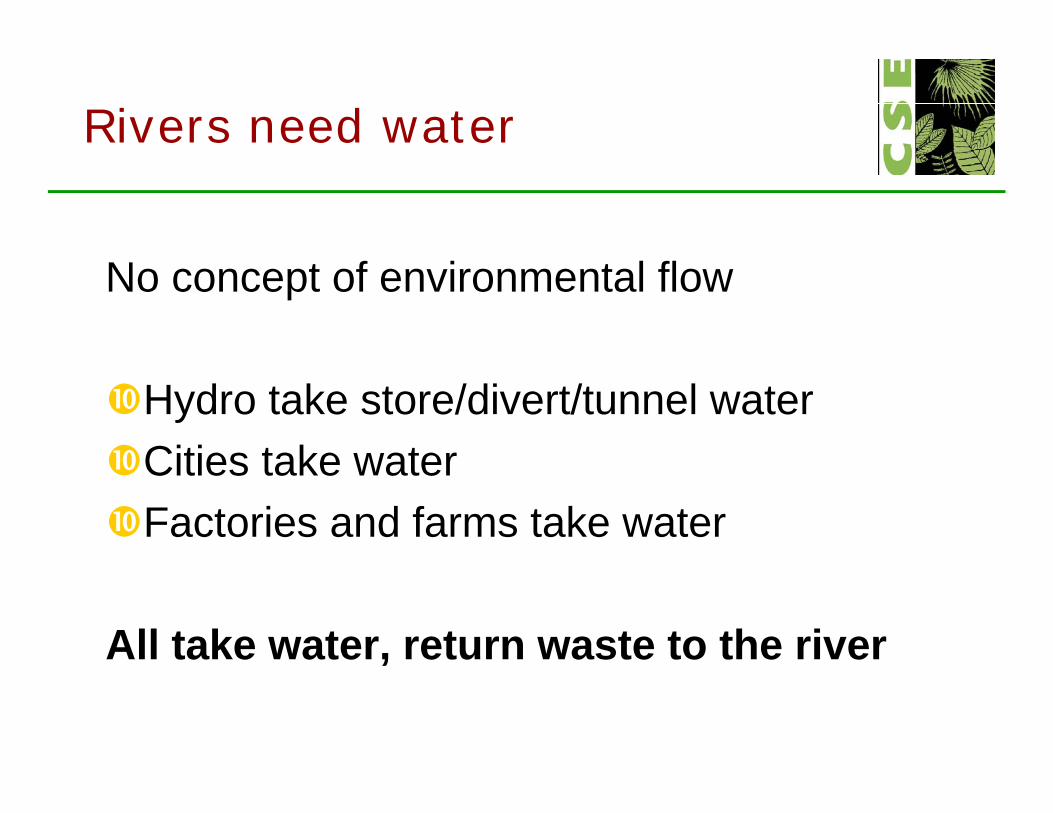
Rivers need water
No concept of environmental flow
Hydro take store/divert/tunnel waterCities take waterCities take waterFactories and farms take water
All take water, return waste to the river,
Understand the political economy of political economy of defecationdefecation
Urban drinking water and sanitation challengeCities are sourcing their water from further and further away – costs
them money to pump; high losses in water transportation (roughly 20-50%)
Cities are worried about water not about their wasteWaste not treated goes into water of others – cities have to invest in
cleaning water (Agra – chlorine) Can’t clean then they look for newcleaning water (Agra – chlorine). Can t clean then they look for new source
Costs of water supply means cities can subsidise some and not all. pp ySubsidise the rich
Current system: bring water (from distance); treat, pump, pipe to home, take sewage pump pipe treat and take sewage, pump, pipe, treat and dispose…river will be clean
Should work. But:It i it l i t i t di idIt is capital intensive – creates divide
between the rich and poor in a city. The state can subsidise some but not allstate can subsidise some but not all. Subsidises rich
It is resource intensive uses waterIt is resource intensive – uses water, creates waste. Adds to stress.
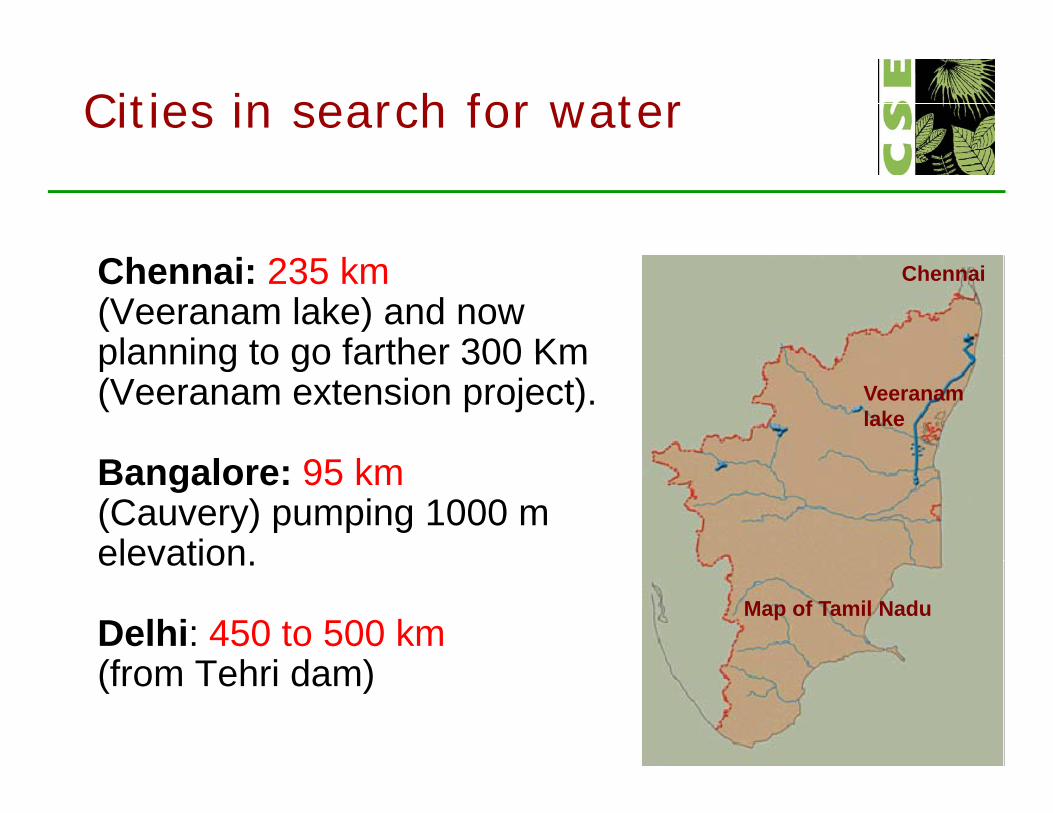
Cities in search for water
Chennai: 235 km(Veeranam lake) and now planning to go farther 300 Km
Chennai
planning to go farther 300 Km (Veeranam extension project). Veeranam
lake
Bangalore: 95 km(Cauvery) pumping 1000 m elevationelevation.
Delhi: 450 to 500 km(f T h i d )
Map of Tamil Nadu
(from Tehri dam)
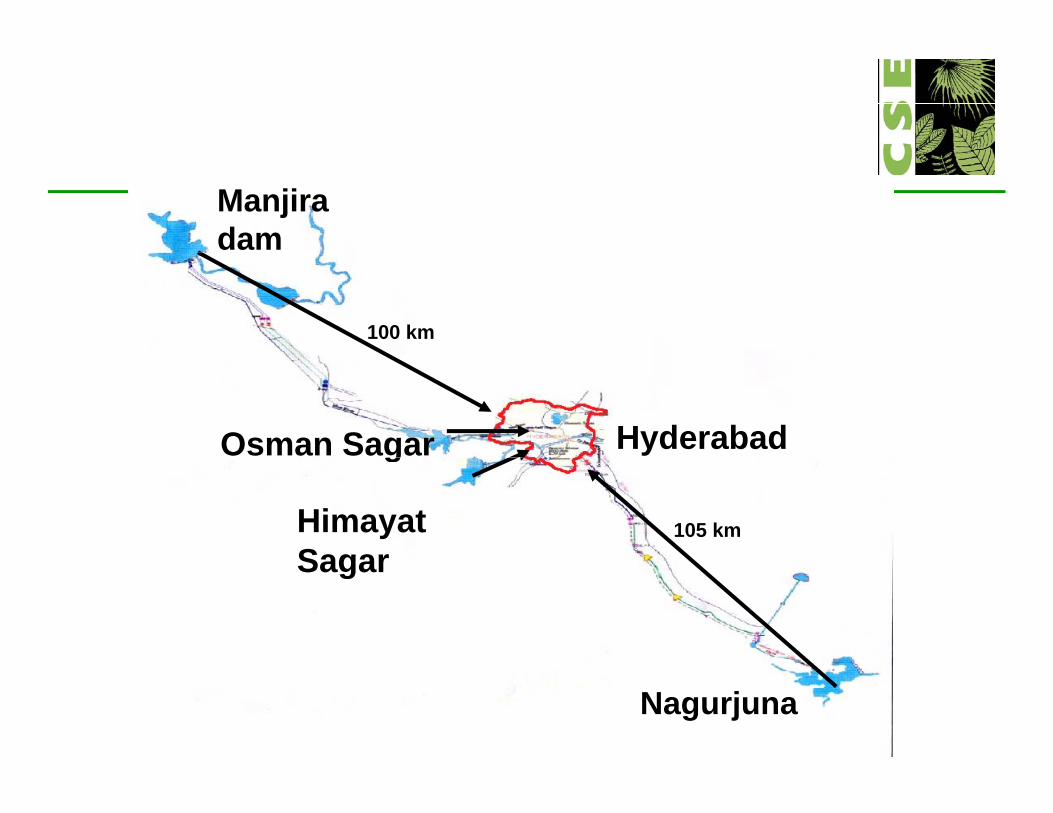
Manjira dam
100 km
Hyderabad Osman Sagar
105 kmHimayat Sagar
g
Sagar
Nagurjuna
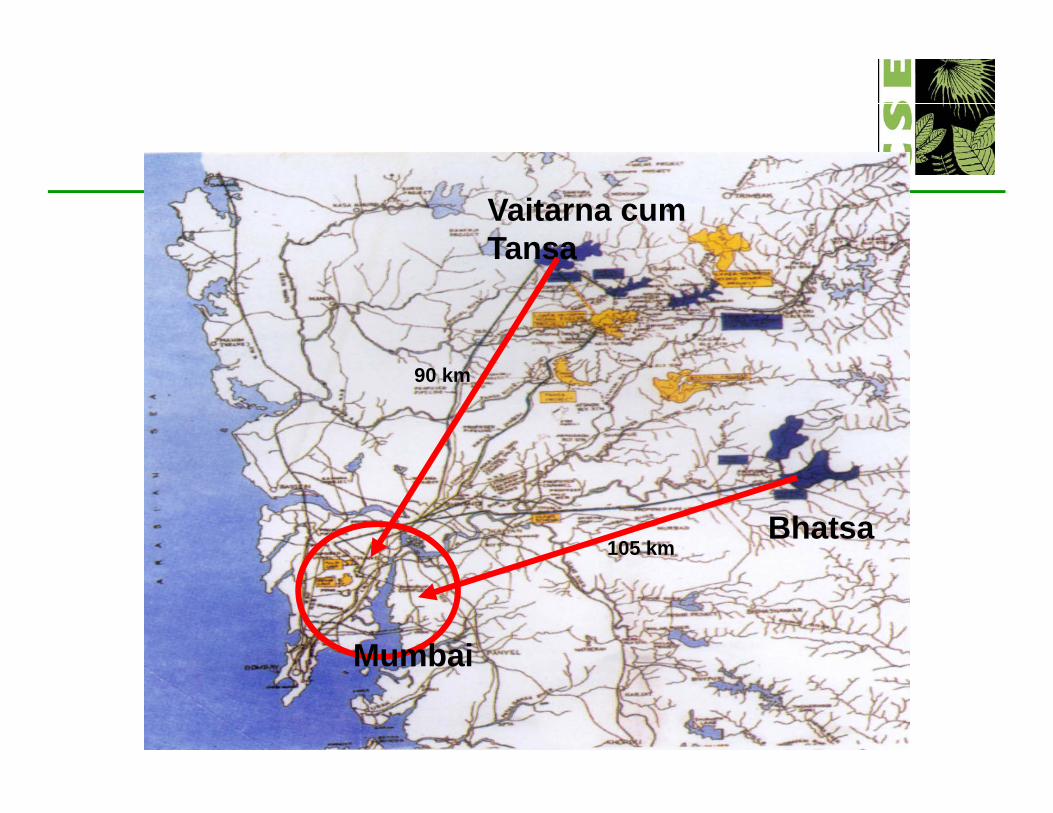
Vaitarna cum TansaTansa
90 km
105 kmBhatsa
MumbaiMumbai

INDORE
30 km
INDORE
YASHWANT SAGAR
INDORE
Narmada river
70 km

Jodhpur
204 k204 km
Rajivgandhi lift canal
JODHPURJODHPUR
Need planning for city water-waste and plans for all waste treatmentand plans for all waste treatment
With increasing use of water in cities, there is increased t 80% f t l h twaste -- 80% of water leaves our homes as waste
But cities do not plan for waste disposalAlmost all cities do not have underground drainage; onlyAlmost all cities do not have underground drainage; only
part of the cities drainage is collected or conveyed in underground drains
In this way sewage is not intercepted and cannot be treatedIn this way sewage is not intercepted and cannot be treatedCities do not charge for water or for waste that is
generated. They cannot pay for O&M charges. System d t kdoes not work
Cities treat partially; then this is mixed with untreated waste. Result is pollutionp
Inefficiencies are highg
Huge distribution losses in water supply –between 20-50 per cent.
Losses add to costs, which recovery is difficult;
Because cost is high cannot recover from consumer;
Cannot invest in efficiencies and clean water for all.
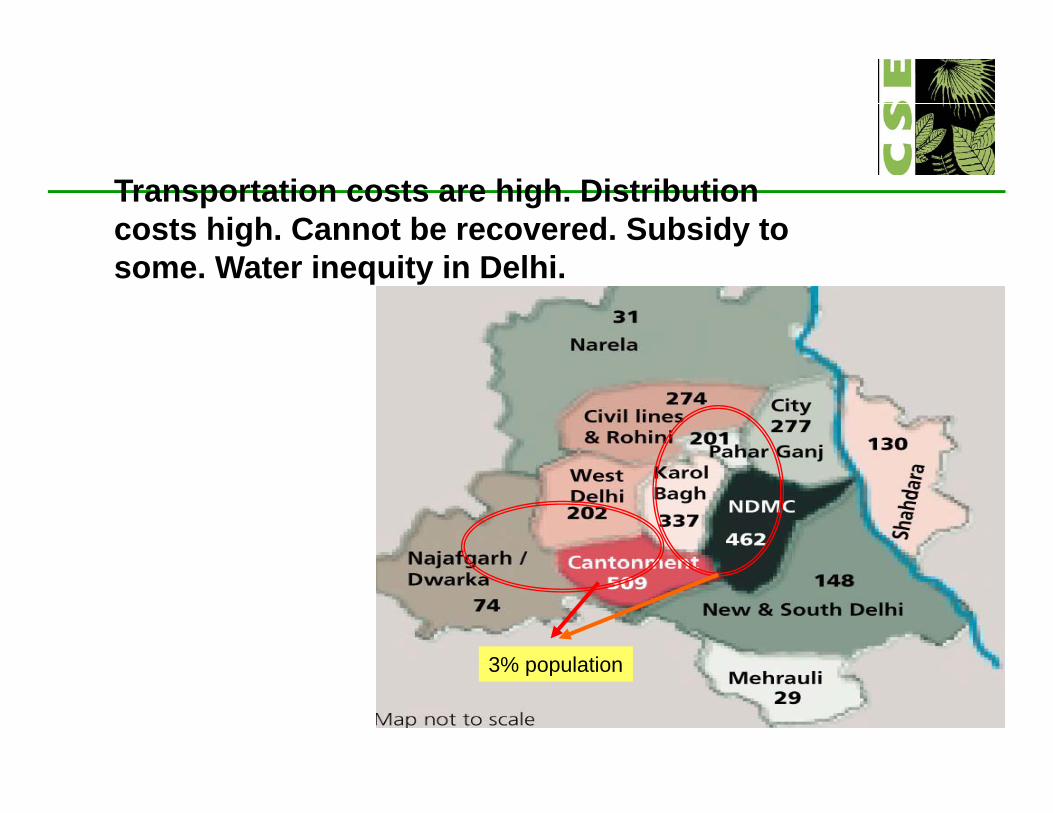
Transportation costs are high. Distribution costs high. Cannot be recovered. Subsidy to some. Water inequity in Delhi.
3% population3% population

Add: waste to these sums
The more water we use = the more waste we generate. The more waste we generate = more money to collect, to g y ,
convey, to treat and to disposeThe more waste we do not treat = polluted water and
increased burden of health costsincreased burden of health costs.
Simple sums: but we can’t add up
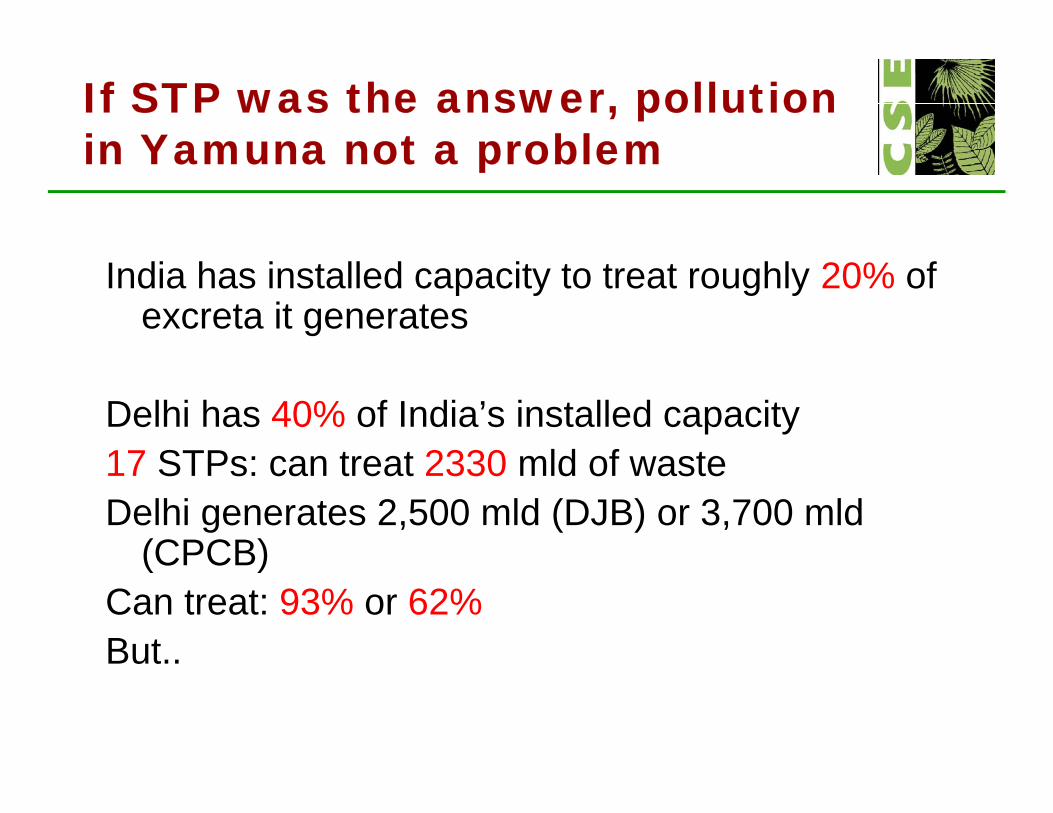
If STP was the answer, pollution in Yamuna not a problemin Yamuna not a problem
India has installed capacity to treat roughly 20% of excreta it generates
Delhi has 40% of India’s installed capacity17 STPs: can treat 2330 mld of waste17 STPs: can treat 2330 mld of wasteDelhi generates 2,500 mld (DJB) or 3,700 mld
(CPCB)(CPCB) Can treat: 93% or 62%But..But..

Underutilised: where there is waste; no STP; where there is STP; no waste

Drainage exists; but does not work. Drainage does not exist; does not work
Cannot transport waste to the sewage plant. Sewage plant cannot treat.
5,600 km of drains in city; 130 km of trunk sewers; in poor , y; ; pstate.
Then:Large parts of the city does not have official undergroundLarge parts of the city does not have official-underground
drainage system Large parts of the city lives in unauthorised-illegal colonies

Unequal cities are pollutedq p
Half (or more) of the city is unconnected to the official underground drainage system;
But “Illegal or unauthorised or unconnected” these will have excretaThi t fl i t ( t t ) d iThis excreta flows into open (storm water) drainsThese same drains also carry treated effluents from sewage treatment
plants to the riverThis ‘legal’ treated effluent is mixed with ‘illegal’ untreated effluentThis legal treated effluent is mixed with illegal untreated effluent
Result: pollution
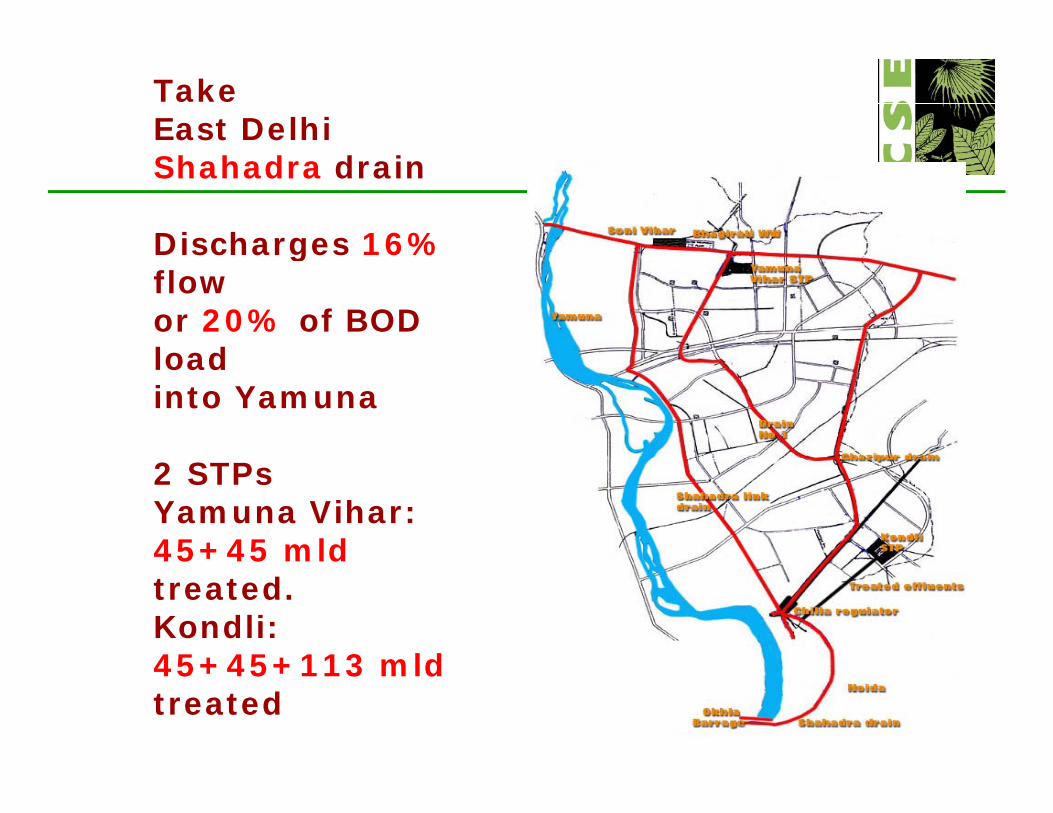
Take East DelhiShahadra drain
Discharges 16%Discharges 16%flow or 20% of BOD loadloadinto Yamuna
2 STPsYamuna Vihar: 45+45 mld 45+45 mld treated. Kondli:45+45+113 mld45+45+113 mldtreated
But
Treated effluents from Yamuna Vihar discharged into drain
Drain carries effluents of un sewered coloniesDrain carries effluents of un-sewered coloniesTreated and untreated effluent then picked up at
KondliKondliTreated againDischarged into drain which carries effluents of g
unsewered colonies – in Delhi and Noida. Are we surprised: River stays polluted
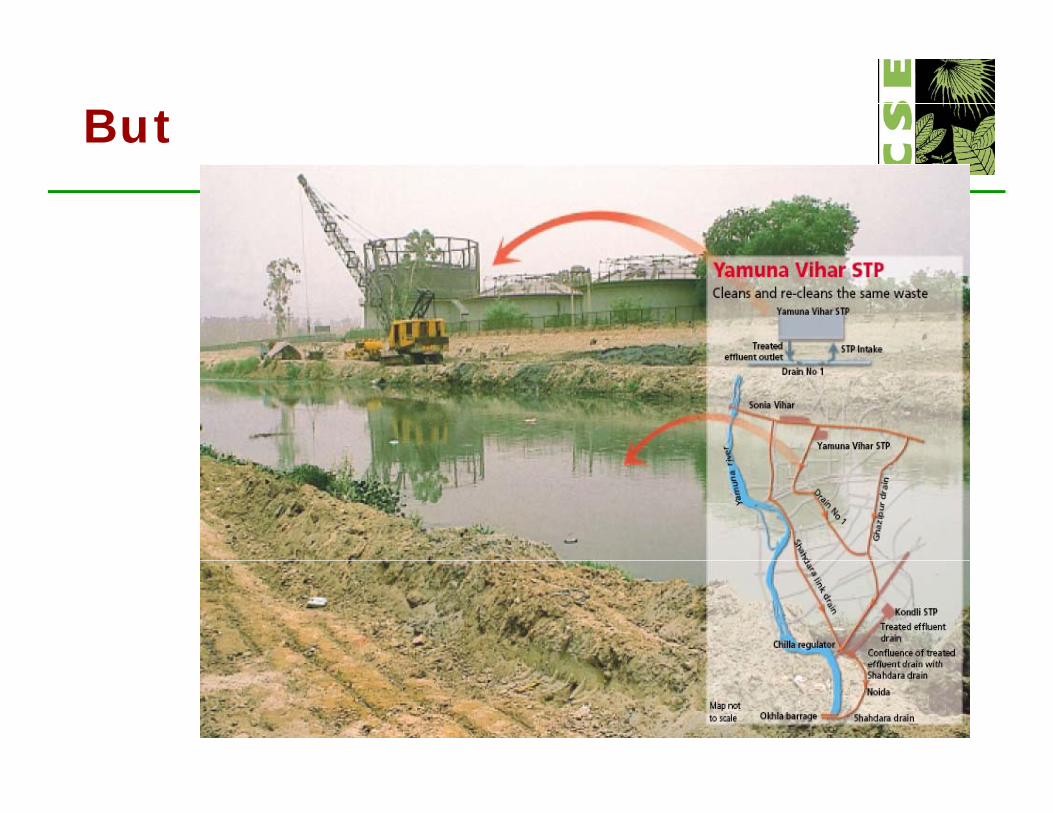
But
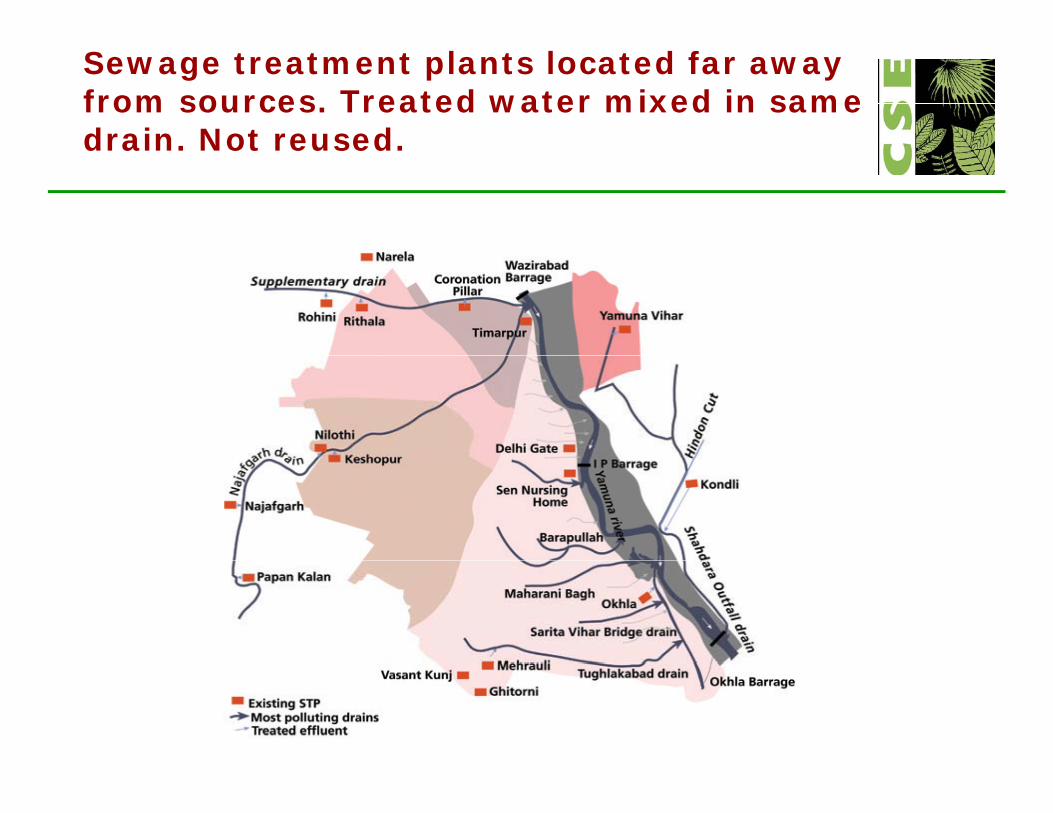
Sewage treatment plants located far away from sources. Treated water mixed in same drain. Not reused.drain. Not reused.
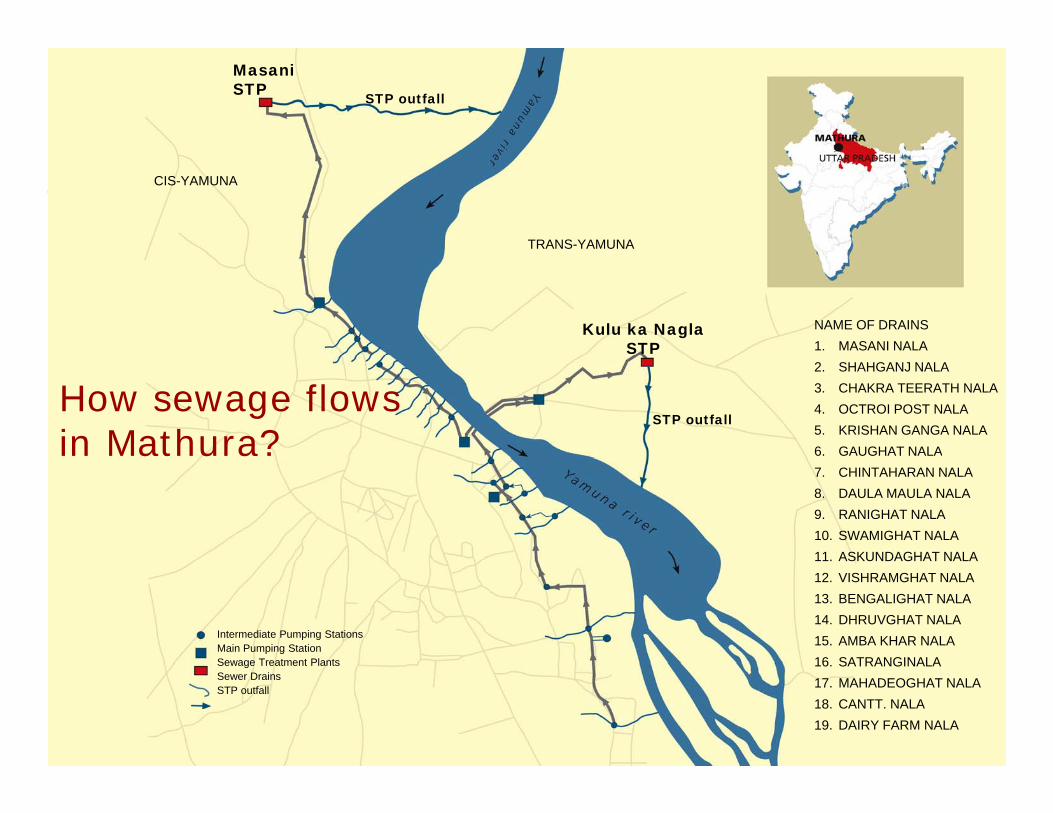
Masani STP STP outfall
CIS-YAMUNA
TRANS-YAMUNA
NAME OF DRAINS1. MASANI NALA
Kulu ka NaglaSTP
2. SHAHGANJ NALA3. CHAKRA TEERATH NALA4. OCTROI POST NALA5. KRISHAN GANGA NALA6. GAUGHAT NALA
STP outfallHow sewage flows in Mathura?
7. CHINTAHARAN NALA8. DAULA MAULA NALA9. RANIGHAT NALA10. SWAMIGHAT NALA11. ASKUNDAGHAT NALA11. ASKUNDAGHAT NALA12. VISHRAMGHAT NALA13. BENGALIGHAT NALA14. DHRUVGHAT NALA15. AMBA KHAR NALA16 SATRANGINALA
Intermediate Pumping StationsMain Pumping StationSewage Treatment Plants 16. SATRANGINALA
17. MAHADEOGHAT NALA18. CANTT. NALA19. DAIRY FARM NALA
Sewage Treatment PlantsSewer DrainsSTP outfall

Can we pay full cost? Can we design system for all? design system for all?
It costs Rs 5-6 per 1000 litres to supply treated water to us
We pay Rs 2 20 per 1000 litresWe pay Rs 2.20 per 1000 litresCost will increase if pollution increases. Upstream
cities will do the same as Delhicities will do the same as DelhiWill cost Rs 30-40 per 1000 litres to take back our
sewage; treat it; dispose it. (Hardly pay)Cost will increase as river gets more polluted. No
assimilative capacity.

Cost of system is high. Cannot pay. C t b idi ll O l i hCannot subsidise all. Only rich
This is the political economy of defecation.
The rich use water. Are connected to sewage system. Waste is collected. Even treated.
B t the cannot pa for f ll costsBut they cannot pay for full costs..The poor use little water. Not connected to sewage
system. Waste flows in open drains. Not treated. But if system not designed for all. Not affordable by all.
Will not work.

Maths of national excreta
2009 CPCB estimated sewage from class I and II cities =
Total sewage = 36 000 mldTotal sewage = 36,000 mldCapacity to treat: 7,000 mld (20% of sewage)Sewage actually treated: 5000 mld (72% ofSewage actually treated: 5000 mld (72% of
capacity created)Gap: 31,000 mld of sewage p , g= 14% of sewage generated actually treated
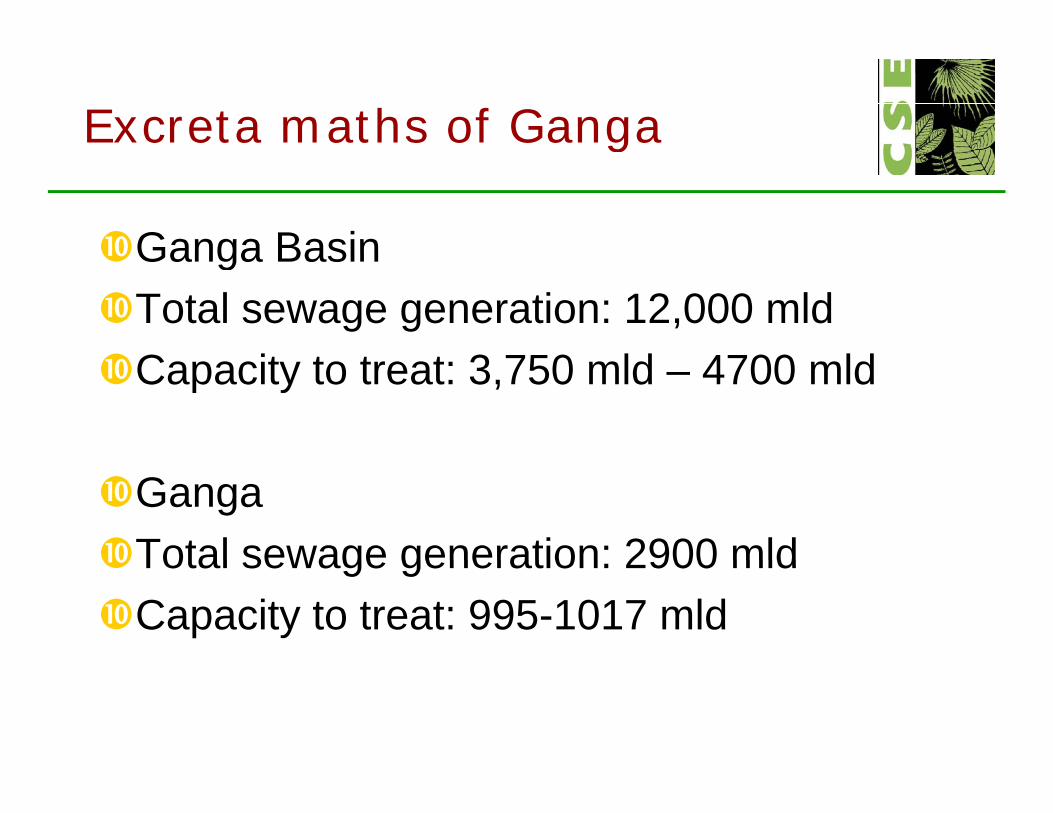
Excreta maths of Gangag
Ganga BasinGanga Basin Total sewage generation: 12,000 mldC it t t t 3 750 ld 4700 ldCapacity to treat: 3,750 mld – 4700 mld
GangaTotal sewage generation: 2900 mldTotal sewage generation: 2900 mldCapacity to treat: 995-1017 mld
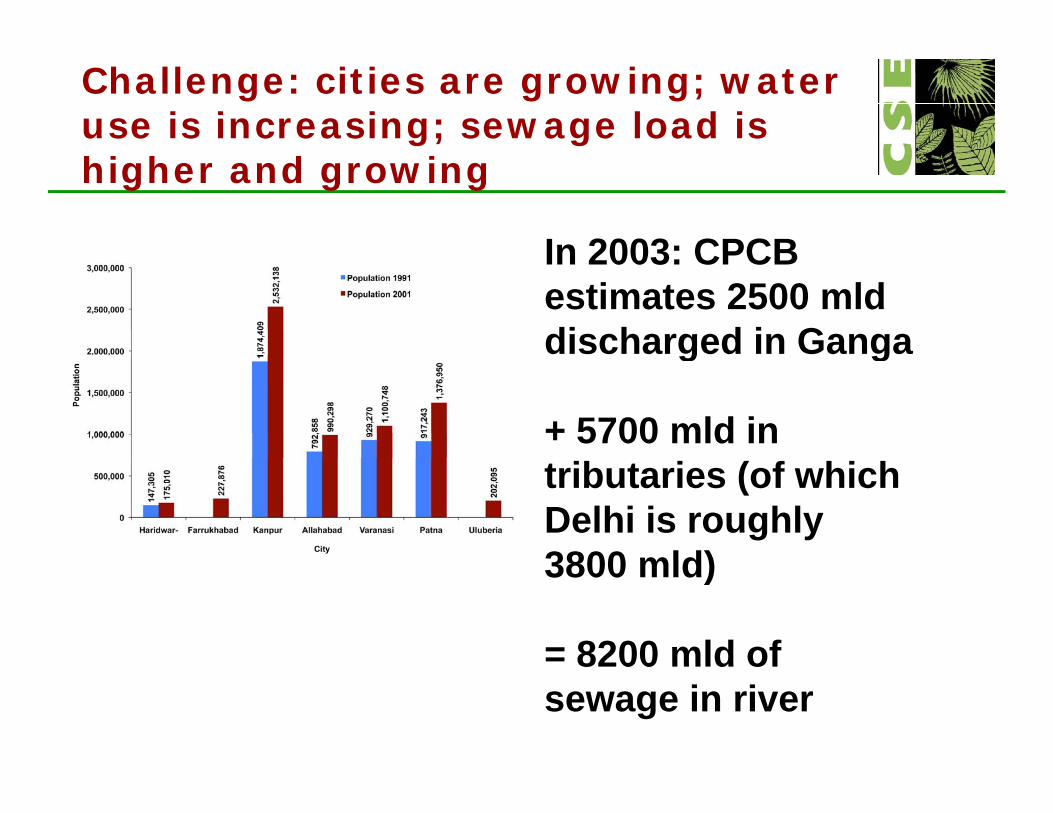
Challenge: cities are growing; water use is increasing; sewage load is higher and growing
In 2003: CPCBIn 2003: CPCB estimates 2500 mld discharged in Gangag g
+ 5700 mld in tributaries (of which Delhi is roughly 3800 mld)3800 mld)
= 8200 mld of 8200 mld of sewage in river

Treatment capacity created: GAP I+2: 995 mld on Ganga river
2300 ld+ 1300 mld on tributaries = 2300 mld

+ Yamuna (not under GAP/YAP funding) = 2310 mld =4700 mldfunding) = 2310 mld =4700 mld
Total STP capacit created on Ganga and trib tariesTotal STP capacity created on Ganga and tributaries
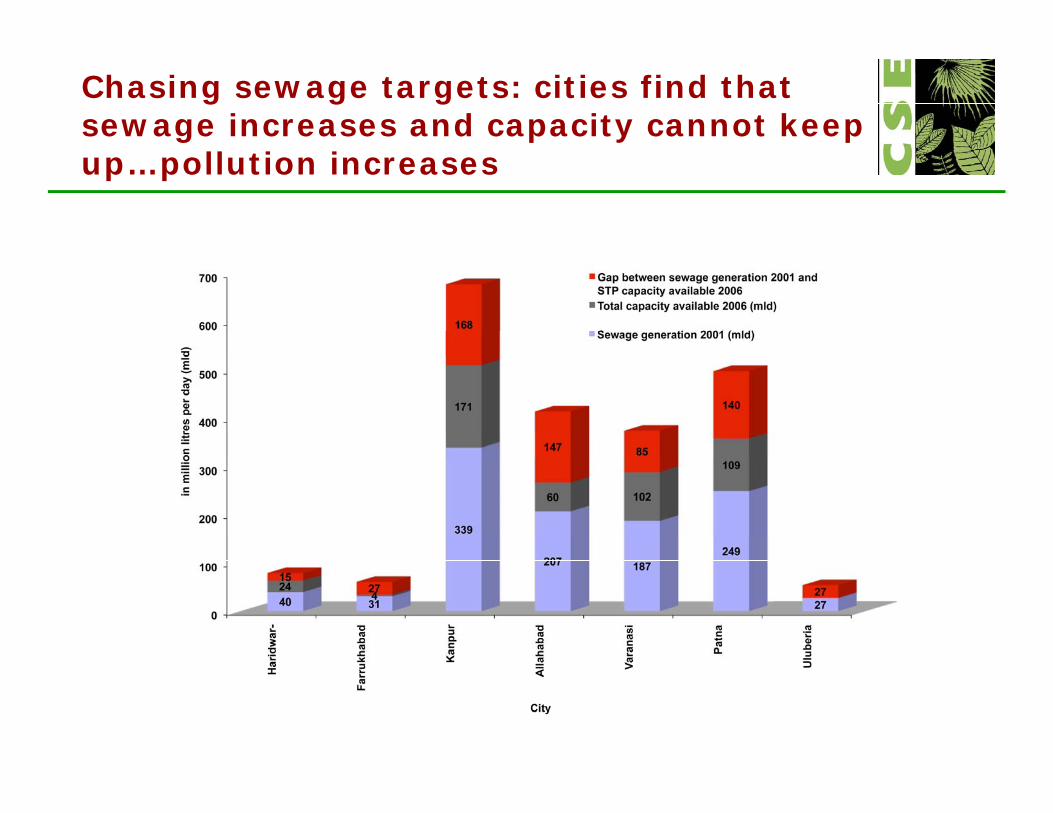
Chasing sewage targets: cities find that sewage increases and capacity cannot keep
ll i iup…pollution increases

More hardware being built..g
..Not the simple answer to pollution..Not the simple answer to pollution1.Cannot catch up with growing pollution2 Do not have the drainage in city to convey2.Do not have the drainage in city to convey
waste3 f3.Do not have plan for treated waste
disposal4.Cities cannot pay for waste disposal –
more the water used; more waste; more under-recovery..
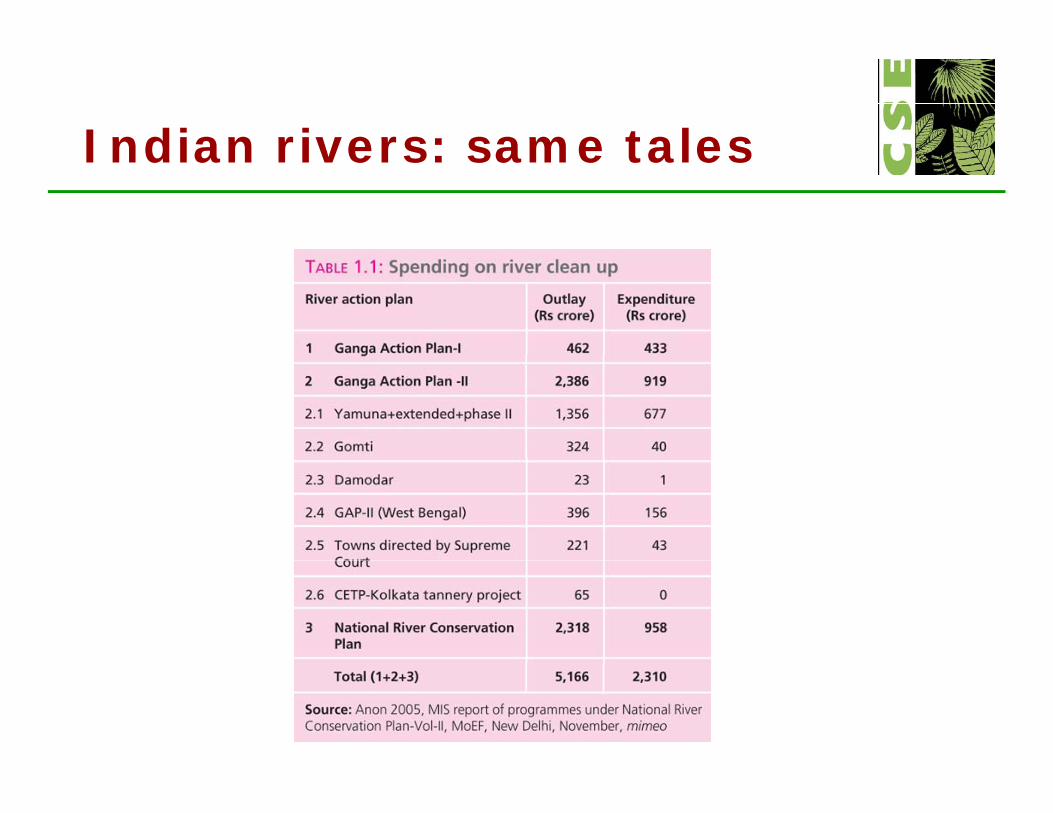
Indian rivers: same talesIndian rivers: same tales
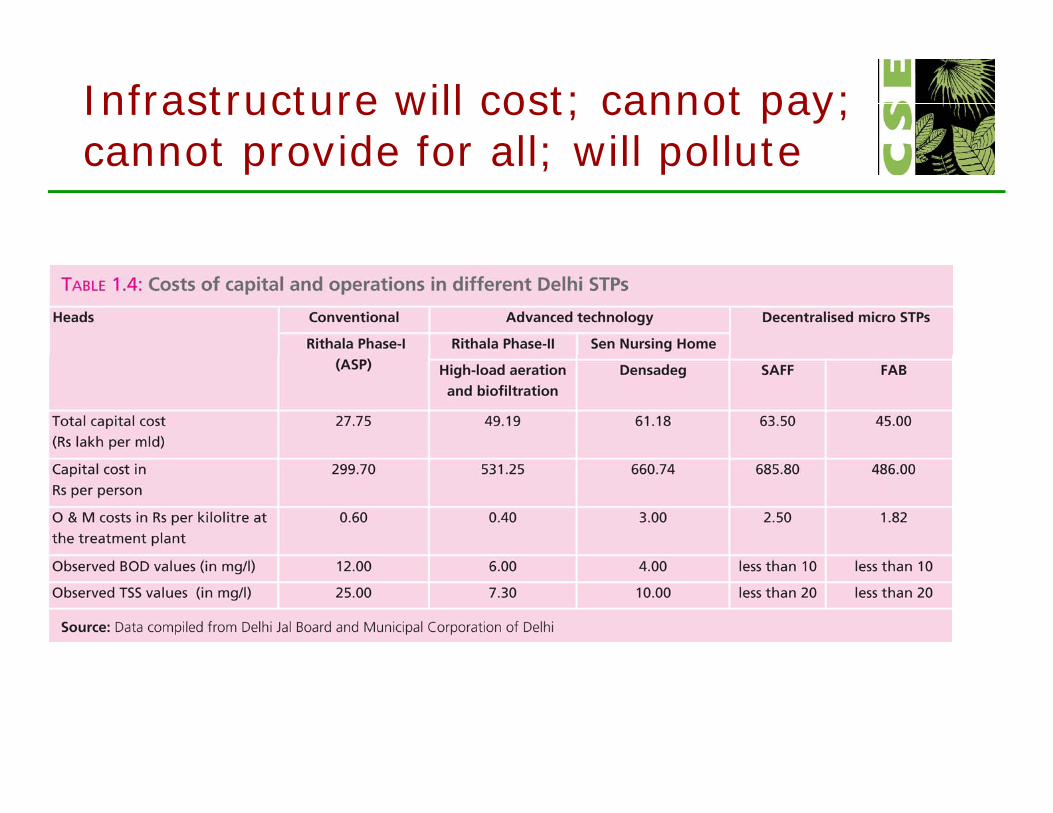
Infrastructure will cost; cannot pay; cannot provide for all; will pollutecannot provide for all; will pollute
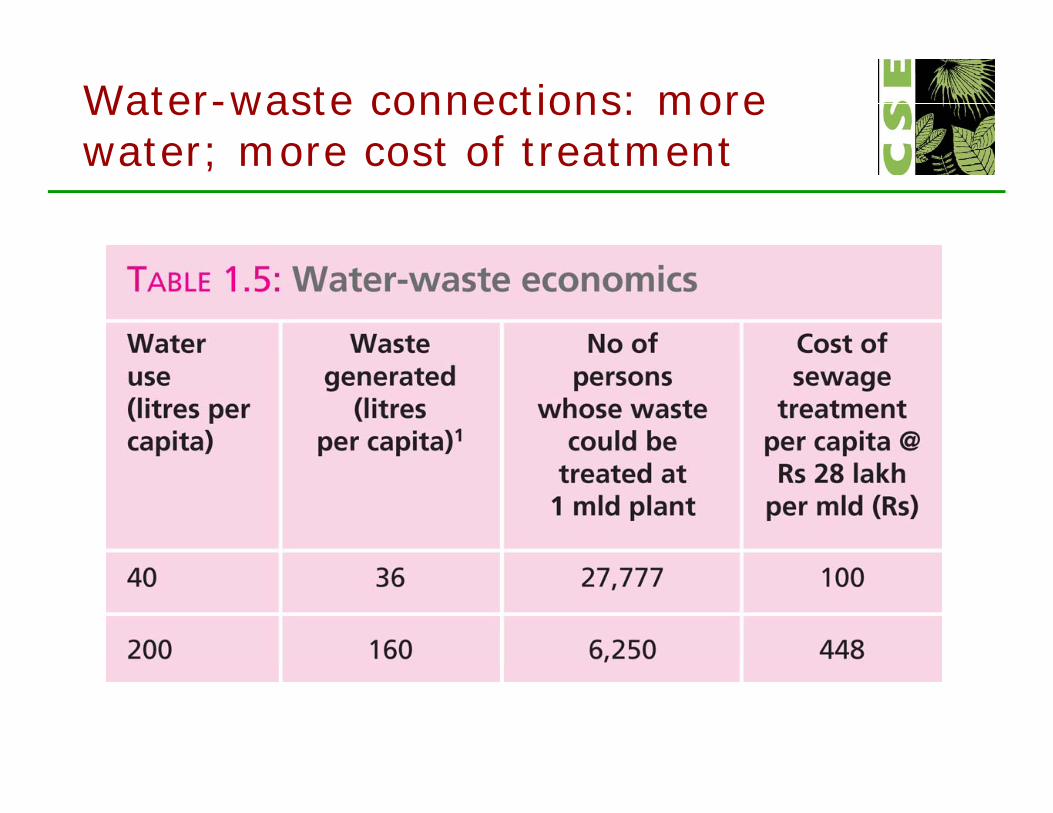
Water-waste connections: more water; more cost of treatmentwater; more cost of treatment

Agenda 1: mandate minimum environmental flow in all stretchesenvironmental flow in all stretches
Rivers need water to assimilate the wasteEven if we treat to existing standards -- 30 BOD, it
is much higher than 3 BOD the standard foris much higher than 3 BOD -- the standard for bathing quality water
But increasingly we take water from rivers, returnBut increasingly we take water from rivers, return waste to it
We trap the river between the barrages (Delhi, Kanpur) and then want it to flow
Need a plan for what is minimum flow and how it will be ensuredit will be ensured

Agenda: Cumulative impact assessmentassessment
No overall planning for hydro-projects –Central projects/state projectsNo assessment of water availability and power generation potentialp g pNeed to stop all projects till cumulative impacts/water availability is studiedimpacts/water availability is studied

Action agenda 2: Monitoringg g
1. Quality of water in many places ‘too1. Quality of water in many places too clean’ to be true
2. Need to review our monitoring across2. Need to review our monitoring across the river; check how representative is station; check quality of sampling; q y p ganalysis;
3. Need to review indicators -- BOD --difficult to check with electricity
4. Set up community water monitors across p ythe river

Take monitoring at Hardwarg
• Monitoring stations at Haridwar under the Ganga Action Plan
• Done by Pollution Control Research Institute (PCRI)Done by Pollution Control Research Institute (PCRI) of BHEL
• Two locations• H id U t (S t i hi A h ) th i i• Haridwar Upstream (Saptrishi Ashram) on the main river• Haridwar downstream (Mayapur regulator) on the Ganga
canal• S li thl b i f H DO BOD t t l• Sampling on a monthly basis for pH, DO, BOD, total
coliform and faecal coliform, nitrite, nitrate, colour, odour, temperature

Ganga at HaridwarGanga at HaridwarBifurcates into the UppergBifurcates into the Upper Ganga Canal
After the BhimgodaAfter the Bhimgoda regulator, flow in the river is lean
Upper Ganga canal
Ganga river

No monitoring after the disposal of untreated waste
Under GAP, the wastewater drains falling into the Upper Ganga Canal are
untreated waste
intercepted, sewage conveyed to the 18 mld STP at Jagjeetpur. STP receives about 40-50 mld most of which bypassed into the Ganga

MoEF’s monitoring stationMoEF s monitoring station
MoEF’s monitoring pointMoEF’s monitoring station
No monitoring after STP outfall into the main riverAbout 30 mld sewage is bypassed by the STP
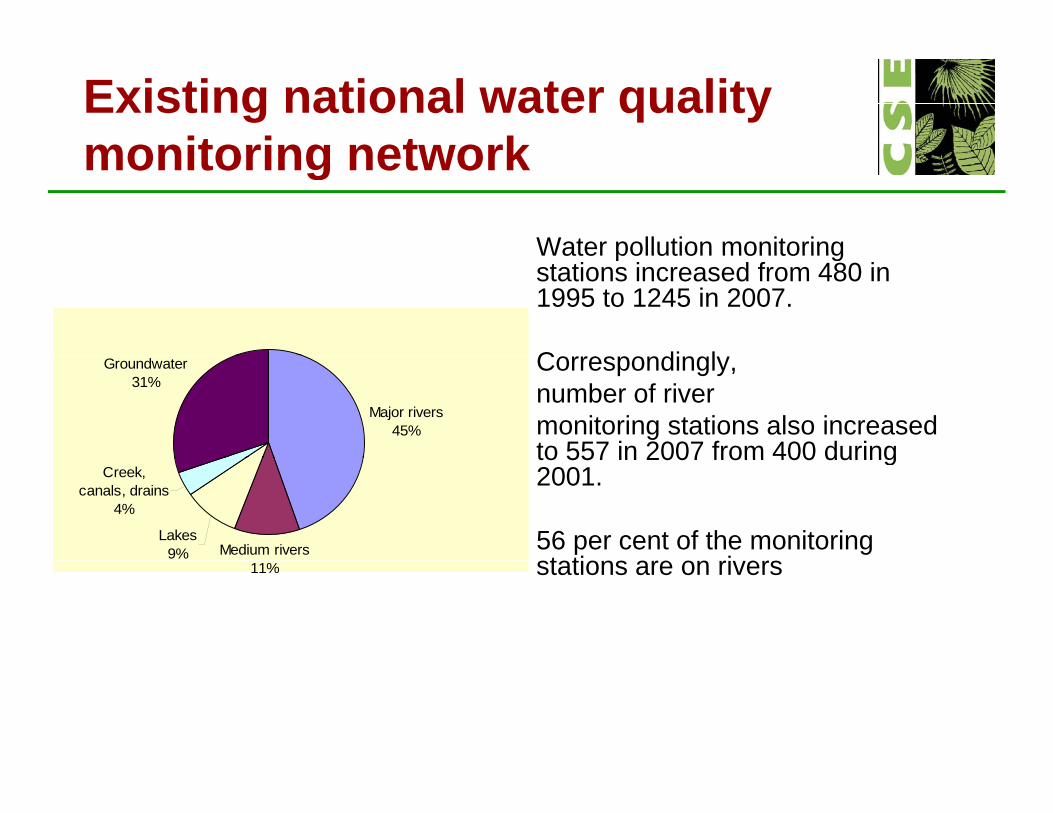
Existing national water quality monitoring networkmonitoring network
Water pollution monitoringWater pollution monitoring stations increased from 480 in 1995 to 1245 in 2007.
C di lCorrespondingly,number of rivermonitoring stations also increased to 557 in 2007 from 400 during
Major rivers 45%
Groundwater31%
to 557 in 2007 from 400 during 2001.
56 per cent of the monitoring t ti i
Medium riversLakes
9%
Creek, canals, drains
4%
stations are on rivers11%
How adequate?
C tl th i t f th i G (2 550Currently the main stem of the river Ganga (2,550 km) is monitored at 34 locations This accounts for 6 per cent of the river monitoring stations. p g
There are 141 stations in the Ganga and its tributaries constitute almost one fourth of thetributaries constitute almost one-fourth of the river monitoring stations.
In 2001, Ganga was monitored at 27 locations along the main river
Agenda 3: Design to treat allsewagesewage
1. We need strategy for affordable sewage treatment;
2 As building conveyance drainage always a2. As building conveyance drainage always a problem should use open drains as treatment areas – plan for drains, not just wish them p jaway
3. We need to plan for water treatment and also t t d t di htreated water discharge

Agenda 4: Plan for treated effluent
1. Once sewage is treated; reuse-recycle so that not added to the untreated sewage in drain
2 Or put treated effluent into river for dilution2. Or put treated effluent into river for dilution –treat close to the river as possible -- need to check the assimilative capacity of p yriver/waterway
3. Promote reuse so treat close to the source as ibl B ild h th i t Whpossible. Build where there is waste. Where you
build plan for disposal or reuse. Will reduce costs of pumping; interception; treatmentp p g; p ;

Next steps: Agenda for actionp g
1. Review of monitoring stations; indicators; putting data in public domain
2. Review of city plans for different stretches of river (water-waste and affordable sol tions) No clearance toaffordable solutions). No clearance to single hardware projects
3 Mandate minim m flo in ri er3. Mandate minimum flow in riverNo ‘soft solutions’ will work


