62
GAO United States General Accounting Office Report to Congressional Requesters December 2000 UNEMPLOYMENT INSURANCE Role as Safety Net for Low-Wage Workers Is Limited GAO-01-181

GAOUnited States General Accounting Office
Report to Congressional Requesters
December 2000 UNEMPLOYMENTINSURANCE
Role as Safety Net forLow-Wage Workers IsLimited
GAO-01-181

Contents
Letter 3
Appendixes Appendix I: Scope and Methodology 36
Appendix II: State Responses to GAO Questionnaire on UIEligibility 50
Appendix III: Comments From the Department of Labor 53
Appendix IV: GAO Contacts and Staff Acknowledgments 55
Related GAO Products 56
Tables Table 1: Unemployment Rates for Low-Wage and Higher-WageWorkers, March 1992-March 1995 14
Table 2: UI Rate of Receipt for Low-Wage and Higher-WageUnemployed Workers Aged 18-64, March 1992-March 1995 15
Table 3: UI Rate of Receipt for Low-Wage and Higher-Wage Workers,by Number of Weeks Worked, Combining SIPP Data for Years1992-95 15
Table 4: UI Rate of Receipt for Low-Wage and Higher-WageFull-Time and Part-Time Workers With at Least 35 Weeksof Employment Prior to Unemployment, Combining SIPPData for Years 1992-95 16
Table 5: UI Rate of Receipt by State Recipiency Rate, CombiningSIPP Data for Years 1992-95 17
Table 6: UI Rate of Receipt for Low-Wage and Higher-WageWorkers Unemployed in March 1995, by Industry 19
Table 7: Comparison of States’ Employment History Requirementsfor UI Benefits for Two Unemployed Workers in 2000 26
Table 8: Eligibility for UI After Quitting Job for CompellingPersonal Circumstances 27
Table 9: Eligibility for UI Benefits for Unemployed WorkersSeeking Part-Time Work or Limited Shifts 28
Table 10: UI Benefits in 2000 for Unemployed Worker Who HadWorked Part-Time for 26 Weeks at $5.15 per Hour 31
Table 11: Classification of Jobs Held by Unemployed Workers inthe 27-Month Period 40
Table 12: Data From CPS, BAM, and SIPP for Low-Wage Workers inthe Employed Labor Force and Workers Paid UI, 1992-99 45
Page 1 GAO-01-181 Unemployment Insurance

Contents
Figures Figure 1: Average Recipiency Rate for the Past 5 Decades 10Figure 2: Industry Sector of Workers Unemployed in March 1995 18Figure 3: Average UI Rate of Receipt by Industry, March 1995 20Figure 4: Industry Sector Employment of Low-Wage and
Higher-Wage Workers, 1997 23Figure 5: Union Membership of Low-Wage and Higher-Wage
Workers, 1997 24Figure 6: Comparison of Data Elements Available Among
Sources With Nationwide Information on UI Participation 37Figure 7: Formulation Demonstrating the Use of CPS and BAM
Data to Infer How the Rate of UI Receipt and theUnemployment Rate Relate Across Wage Groups for 1996Through 1999 47
Abbreviations
AFDC Aid to Families With Dependent ChildrenBAM Benefit Accuracy MeasurementCPS Current Population SurveyFUTA Federal Unemployment Tax ActSIPP Survey of Income and Program ParticipationTANF Temporary Assistance for Needy FamiliesUI unemployment insurance
Page 2 GAO-01-181 Unemployment Insurance
Page 3
United States General Accounting Office
Washington, D.C. 20548
Page 3
Letter
December 29, 2000
The Honorable Daniel Patrick MoynihanThe Honorable John D. Rockefeller IVThe Honorable Bob GrahamUnited States Senate
The Honorable Benjamin L. CardinThe Honorable Sander M. LevinHouse of Representatives
Since 1935, the welfare and unemployment insurance (UI) programs haveoperated side-by-side as major parts of the nation’s social safety net. Thewelfare program provides cash assistance to needy families without meansof support, while UI provides cash assistance to people temporarilyunemployed. In 1996, federal legislation fundamentally changed the welfareprogram, putting time limits on how long most people can receive cashassistance and generally requiring recipients to engage in work activities toqualify for income support. Since that time, the welfare rolls have droppeddramatically, and large numbers of welfare recipients have started working,many in low-wage jobs. With this radical shift, the UI program is left as amore significant element of the social safety net, particularly for low-income families formerly assisted by the welfare program.
In contrast to the welfare program, which focuses on assistance to needyfamilies with children, UI is a social insurance program intended topartially replace lost earnings for people with prior work experience whobecome involuntarily unemployed and who are able, available, and activelyseeking work. Premiums are paid in advance by employers as a payroll taxon wages earned by their employees. Although state law varies, this payrolltax is applied to, at a minimum, the first $7,000 of most employees’ annualearnings. State law specifies the factors (for example, minimum earnings oremployment period) that qualify a person to collect UI benefits.
You expressed concerns about the ability of low-wage workers to qualifyfor UI benefits and asked us to examine the adequacy of the UI system as asafety net for low-wage workers and, in particular, former welfarerecipients who lose employment through no fault of their own. In responseto your concerns, we addressed four questions: (1) what is the overall trendin usage of the UI program among the unemployed and what are thereasons for this trend; (2) how likely are low-wage workers to receive UIbenefits, compared with other workers; (3) what factors might reduce the
GAO-01-181 Unemployment InsuranceGAO-01-181 Unemployment Insurance
likelihood that low-wage workers receive UI benefits; and (4) are statesrestructuring their policies and practices to better ensure that low-wageworkers, and former welfare recipients, are included in the safety net of theUI program?
To conduct our study, we used a combination of methods. To determine thelong-term trends in the usage of the UI program, we analyzed data from theDepartment of Labor. To compare the likelihood that low-wage workersreceive UI benefits with that of other workers, we examined data from theSurvey of Income and Program Participation (SIPP), a national databasemaintained by the Bureau of the Census. For our purposes, SIPP data wereavailable only for the 4-year period 1992 through 1995; to extend ouranalysis through the rest of the decade, we supplemented SIPP data withUI administrative data from the Department of Labor and with data from anational database jointly maintained by the Bureau of Labor Statistics andthe Bureau of the Census—the Current Population Survey (CPS). Todetermine factors that may affect the likelihood a person will receive UIbenefits, we reviewed the available literature. We also surveyed UI programdirectors for the 50 states on eligibility criteria that may affect low-wageworkers in general and former welfare recipients in particular. To obtaindetailed information on state policies and practices, we talked withofficials in the four most populous states—California, Florida, New York,and Texas—as well as collected data on other states nationwide. A fullerdescription of our methodology is included in appendix I.
Results in Brief Since 1950, the percentage of unemployed people who apply for benefitsunder the UI program has gradually declined. According to the Departmentof Labor’s data, about one-half of the unemployed filed claims for UI in the1950s, while only about one-third filed for UI in the 1990s. Various factorshave been cited as contributing to this decline, with several factorspersisting over the entire 50-year period. Because labor practicesencouraged by manufacturing industries and unions (such as providinginformation about UI benefit requirements) tend to increase the likelihoodthat unemployed workers will apply for UI benefits, the reduction in bothmanufacturing and union membership over this time is seen as a majorfactor in the decline in the use of UI. Another commonly cited reason forthe decline is tighter state eligibility criteria that prevent workers withcertain characteristics—for example, those who have worked for arelatively short period of time—from collecting UI benefits.
Page 4 GAO-01-181 Unemployment Insurance

In the last decade, unemployed low-wage workers1 appeared far less likelyto receive UI benefits than other unemployed workers, even though low-wage workers were twice as likely to be unemployed. In March 1995, forexample, only about 18 percent of unemployed low-wage workers werecollecting UI benefits, while about 40 percent of the higher-wageunemployed collected benefits. The relative difference in UI receiptremained even among workers who worked for similar periods duringrecent employment or who lived in states where more unemployed applyfor UI benefits. The prior jobs of the low-wage unemployed were twice aslikely as the jobs of other workers to be in the retail trade and servicesindustries—industries where workers are much less likely to receive UIbenefits than are workers from other industries such as manufacturing,mining, or construction. Although this data analysis was limited to the 4-year period 1992 through 1995, other data suggest that these patternspersisted throughout the rest of the decade.
Many factors may explain why low-wage workers receive UI benefits lessfrequently than other workers. These factors include tendencies tovoluntarily quit work, for example, to look for a better paying job. Fewerlow-wage workers are in manufacturing jobs and they are less apt to beunion members—two factors that may explain some differences in UIreceipt. Moreover, compliance with some state eligibility requirements canbe particularly difficult under certain circumstances for low-wageworkers—especially former welfare recipients, who are often singlemothers with intermittent employment histories. Such circumstancesinclude:
• State earnings requirements are more difficult to meet for low-wageworkers than for higher-wage workers, even when the low- and higher-wage workers were employed for the same period of time. For example,a worker who was laid off from a job in 2000 after 20 weeks of work for20 hours each week at the federal minimum wage of $5.15 per hourwould not be eligible for UI in 13 states, while another worker with the
1Throughout this report, we refer to unemployed people as low-wage or higher-wageworkers. To classify an unemployed person as such, we first determined whether theunemployed person had had a job within a 27-month period before the time ofunemployment. If so, we divided these people into two groups—those who had earned $8.00per hour or less (low-wage) and those who made over $8.00 per hour (higher-wage) in thelast month of their most recent job. The $8.00 hourly rate is approximately the amountnecessary to support a family of four at the poverty level in a full-time job for one year; it isbased on 1999 dollars and is adjusted for inflation.
Page 5 GAO-01-181 Unemployment Insurance
same work history earning $10.00 per hour would be eligible in all butone state.
• Voluntarily quitting a job for personal financial problems oftendisqualifies claimants from UI benefits, but some limitations can beespecially hard for low-income single parents. For example, if a workercurrently available for work had quit his or her job because child carewas temporarily unavailable, the worker would not qualify for UIbenefits in 32 states. If the same worker had quit his or her last job tocare for a sick child, 26 states would disqualify the worker frombenefits.
• An otherwise qualified claimant may be disqualified if the claimant islooking only for part-time work, even if the person’s job history (likemany former welfare recipients) includes only part-time employment.An unemployed retail worker, previously in a part-time job, looking for ajob with the same 30-hour work week, would be ineligible for UI in 30states.
• A claimant’s most recent earnings will not count toward UI eligibility inmost states because of the time lag allowed to process wage records. Asa result, a claimant who is otherwise eligible for benefits may need towait 3 to 6 months, a significant delay for someone with little savings orother financial support. Currently, only 11 states allow accelerateddetermination of a person’s most recent earnings if needed for theperson to qualify for benefits.
Page 6 GAO-01-181 Unemployment Insurance

While in the 4 years since welfare reform many former welfare recipientshave joined the labor force, often in low-wage jobs, nationwide few stateshave adjusted their UI programs to eliminate practices that may presentdifficulties to low-wage workers, particularly these new workers. Forexample, during this time only one state lowered its minimum earningsrequirements, while 29 states kept the same requirements and 19 statesraised theirs. Further, only two states added provisions to shorten the timelag for processing wage records for UI claimants whose most recentearnings are needed to qualify for UI benefits; according to our survey of UIdirectors, only one state is likely to adopt such provisions in the nearfuture. Because the UI program appears to provide only limited protectionfor low-wage workers, the role of UI as a safety net for all workerswarrants attention, particularly in light of the recent sweeping changes tothe national welfare policy. Although the Advisory Council onUnemployment Compensation2 in 1995 and, more recently, a workgroupthat includes state UI directors and the Department of Labor have madeproposals that would expand the availability of the UI program for low-wage workers, consensus has been difficult to achieve, in part, because ofconcerns about increased benefit costs and effects on state autonomy inmanaging the UI program.
Background In 1935, as part of the Social Security Act, Congress established twoprograms—Aid to Dependent Children and the federal-state system ofunemployment insurance—to provide income support to two differentgroups of unemployed people. Aid to Dependent Children added federalsupport to state systems of pensions for widows with children. The UIprogram, on the other hand, aimed to provide workers with partialreplacement of wages lost during temporary periods of unemployment dueto economic causes. Historically, the majority of people who file for UIbenefits have been men.
2The advisory council was established under the Emergency Unemployment CompensationAct of 1991. It consisted of 11 members—5 appointed by the President and 3 each by theSenate and the House of Representatives.
Page 7 GAO-01-181 Unemployment Insurance

As administered in subsequent years (when it became known as Aid toFamilies With Dependent Children or AFDC), the welfare program evolvedinto an open-ended entitlement program, providing cash assistance topeople with children, usually single parents, who earned little income. Overtime, as more women with children joined the labor force, AFDC recipientswith older children were expected to look for work. More recently, severalstates experimented with stricter work requirements (the so-called “workfirst” philosophy) and time limits on the receipt of aid. In 1996, federallegislation known as the Personal Responsibility and Work OpportunityReconciliation Act ended AFDC, alternatively providing block grants to thestates as part of a new program called Temporary Assistance for NeedyFamilies (TANF). The legislation put a maximum 5-year limit on theavailability of federal cash assistance under TANF3 and required adults towork or participate in work-related activities after receiving assistance for24 months as a condition for continuing to receive benefits. BetweenAugust 1996 and December 1999, the number of TANF families declined byapproximately 2.1 million, and many new workers entered the labor force.
Unlike the Aid to Dependent Children program, the UI program has alwaysoperated as a social insurance program. It is administered as a federal-statepartnership. To finance the program, the states levy and collect payrolltaxes from employers. The funds collected are managed in a trust fundadministered by the federal government. In almost all industries, federalstandards require coverage on all work for employers who pay wages of$1,500 or more in any calendar quarter. Today UI coverage is nearlyuniversal, extending to almost all wage and salaried workers.4
Employers pay the premiums for the UI program through federal and statepayroll taxes that are assessed on employers but based on employees’earnings. Employers pay taxes on wages earned by even the lowest-paidworker. Additionally, if a worker held jobs with two different employersduring the year, the wages from each job are taxed separately.
The federal payroll tax, established by the Federal Unemployment Tax Act(FUTA), is currently set at 6.2 percent of the first $7,000 of an employee’ssalary. In states with UI programs that meet specified federal guidelines,
3In 1999, 21 states had shorter time limits on the receipt of cash assistance.
4Self-employed individuals and agricultural workers on small farms are generally notcovered under UI.
Page 8 GAO-01-181 Unemployment Insurance
employers receive a 5.4 percent credit toward their FUTA tax payment,resulting in a net federal tax of 0.8 percent. These federal taxes finance thestate and federal administrative costs of the UI program, as well as thefederal portion of the Extended Benefit program, advances to states withinsolvent trust funds, and other related federal costs.
The actual rate of the state tax paid by individual employers depends uponthe employer’s “experience rating”—a measure related to the amount of UIbenefits collected by a firm’s employees. Depending upon the employer andthe state, the state payroll tax may range from 0 to 10 percent. By federallaw, state taxes are assessed against at least the first $7,000 of anemployee’s salary. However, among the states, the wage base against whichstate taxes are assessed varies widely, from $7,000 (in 9 states) to $27,500 inHawaii. The wage base is less than $11,000 in 32 states, thereby requiringthe same tax whether, for example, employees earn $11,000 per year or$110,000 per year. Revenues from state UI taxes finance the payment ofregular UI benefits and the state portion of the Extended Benefit program.
Benefit coverage under the UI program is related to an individual’s workhistory. Generally, state law provides that unemployed workers must fulfillthree general conditions: (1) they must have been “substantially attached”to the labor market; (2) they must have left their prior job involuntarily(such as by employer layoff) or have quit their job for “good cause” only;and (3) they must be currently “able and available” for work, and, in moststates, actively seeking work. State law provides specific requirements forclaimants to meet these general conditions.
50-Year Decline inApplication for UIBenefits Attributed toEconomic and PolicyFactors
Overall, the percentage of the total unemployed population applying for UIbenefits has gradually declined in the past 50 years. Several factorsgenerally are cited as contributing to the decline in UI participation,although the significance of each is disputed. Three major factors havepersisted over most of this period—reduction in manufacturing jobs,decline in union membership, and increasingly strict state UI eligibilityrequirements.
Page 9 GAO-01-181 Unemployment Insurance

Long-Term Decline in UIClaims
Over the past 50 years, the percentage of unemployed filing for UI benefitshas generally, but gradually, declined. The measure most commonly usedby the Department of Labor to assess the effect of the UI program—thestandard recipiency rate5—shows that while about 50 percent of theunemployed filed for UI in the 1950s, only about 35 percent of theunemployed filed for UI in the 1990s. Although this rate has fluctuatedconsiderably—for example, in 1980 the rate was 44 percent, then dipped to29 percent in 1984, but by 1991 had increased to 39 percent—it indicates ageneral decline over the past 5 decades. In 1999, the recipiency rate was 37percent. Figure 1 presents the average recipiency rate, by decade, since1950.
Figure 1: Average Recipiency Rate for the Past 5 Decades
Source: GAO analysis of Department of Labor data for state UI programs.
5This rate actually measures the percentage of unemployed who apply for UI benefits understate UI programs. It is calculated using the number of claims filed weekly with the stateprograms divided by the total number of unemployed as counted in the Bureau of theCensus’ CPS. By using the total number of claims for UI benefits, the rate includes thoseclaims that eventually resulted in benefits as well as those claims that were denied. For afurther discussion of this rate, see app. I.
0
10
20
30
40
50
60
1990-991980-891970-791960-691950-59
49.2
43.141.4
33.9 34.9
Percentage
Decade
Page 10 GAO-01-181 Unemployment Insurance
Of the past 5 decades, the last decade—1990 through 1999—had the moststable rate of UI claims, showing the least annual variation. Over thisdecade, an average of 35 percent of the unemployed filed for UI benefits—varying from a high of 39 percent in 1991 to a low of 31 percent in 1993,then increasing to 37 percent in 1999. Overall, the average recipiency rate inthe 1990s was 1 percentage point higher than that of the 1980s.
Certain Economic andPolicy Factors ParallelLong-Term UI Decline
Although there is no agreement about the causes of the general decline inthe rate of UI filing,6 certain factors are commonly considered significant,including (1) the decrease in the number of workers employed inmanufacturing jobs; (2) the decline of union membership in the workforce;(3) increasingly tighter state requirements for UI eligibility; (4) federaltaxation of UI benefits beginning in 1979; (5) population shifts, starting inthe 1970s, of workers from northeastern states to southern states, whereunemployed workers are less likely to apply for UI benefits; and (6)changes in the survey methodology of the CPS during the 1980s thatincreased the number of unemployed who were counted (changing thedenominator used in calculating the recipiency rate).7 Of these factors, thefirst three affect the entire period of decline.
Over the past 50 years, the number of workers in manufacturing jobs hasdeclined in the United States, as has the number of workers who are unionmembers. Studies suggest that the steady decline in workers inmanufacturing jobs and in union membership has adversely affected theoverall participation in the UI program.8 According to these studies, boththe manufacturing industry and unions traditionally have encouraged laborpractices that are treated favorably in UI programs. For example, unionmembers are more likely to be laid off than fired—a practice that makesworkers eligible for UI benefits. Manufacturing firms tend to have layoffs oflarge numbers of employees who are handled as a group by UI program
6For a general discussion of various factors involved in the decline during the past 30 years,see Department of Labor Unemployment Insurance Occasional Paper 99-7, Analysis ofUnemployment Insurance Recipiency Rates (Washington, D.C.: Employment and TrainingAdministration, June 1999).
7In its comments, the Department of Labor noted that the increasing number of part-timeand multiple job holders is another possible factor in the general decline in the rate of UIfiling.
8Department of Labor, Analysis of Unemployment Insurance Recipiency Rates.
Page 11 GAO-01-181 Unemployment Insurance
officials. Further, both manufacturing workers and union members aremore apt to be better informed about UI benefits.
In the past 5 decades, many states have tightened their UI regulations,increasing limitations on eligibility for UI benefits and thereby decreasingthe participation in the UI program. In general, in order to demonstrate thata person is an active member of the labor force, states have a series of testsdealing with a claimant’s recent work history, his or her reasons fortermination from the last job, and evidence that the claimant is stillavailable for work. For example, most states require that in order toestablish that a person worked a sufficient amount of time to qualify for UIbenefits, he or she must have earned a minimum amount of wages over ayear’s time (a so-called “base period”). Over the years, many states haveincreased these earnings amounts, thereby limiting who can be eligible forUI benefits.9
Other limitations affect program participation as well. For instance, whenthe UI program was first established, people who quit their jobs forcompelling personal reasons, such as pressing family obligations like lackof child care, were not disqualified from receiving UI benefits. Increasingly,however, states have enacted laws that specifically limit the generallyacceptable reasons (“good cause”) for quitting a job to those related towork or to the employer.10 The number of states with such statutoryrestrictions grew from 16 in 1948 to 28 in 1979, and by 1995, 38 statesrestricted “good cause” for quitting to work-related circumstances. Underthese restrictions, states generally allow a worker to collect UI benefits if aworker quit because of actions taken by an employer—if, for example, anemployer requires the employee to work a night shift even though theemployee had been hired specifically to work only during daytime hours.On the other hand, most states disqualify a claimant for UI if he or she quita job because of a temporary lack of child care.
9A number of studies have presented evidence on state trends to increase minimum earningsrequirements, such as Unemployment Insurance: Program’s Ability to Meet ObjectivesJeopardized (GAO/HRD-93-107, Sept. 28, 1993).
10Although most states have this general restriction, states also have created statutoryexceptions to it. For example, Texas will not disqualify someone who had to leave work tocare for a seriously ill child, provided a doctor certifies that the child is seriously ill.
Page 12 GAO-01-181 Unemployment Insurance

Unemployed Low-Wage Workers WereLess Likely to ReceiveUI Than OtherUnemployed Workersin the 1990s
Unemployed low-wage workers were less likely to collect UI benefits thanother unemployed workers in the early 1990s, and the most recent evidencesuggests that this trend continued throughout the decade. Unemployedworkers were more apt to receive UI benefits if they worked longer than 35weeks, worked full-time rather than part-time, or lived in a state thattended to have less strict eligibility criteria. However, even when low-wageworkers and other workers shared characteristics that favored UI receipt—for example, when they worked more than 35 weeks—low-wage workerswere less likely to collect UI. In March 1995, almost two-thirds ofunemployed low-wage workers worked immediately before becomingunemployed in jobs in the retail trade or services industries,11 industrieswhose workers were the least likely to participate in the UI program. Incontrast, only one-third of unemployed higher-wage workers held their lastjob in these industries. Although SIPP data were limited to the 4-yearperiod between 1992 and 1995,12 other evidence suggests that thesepatterns remained throughout the entire decade.
Significantly Lower UI Rateof Receipt Among Low-Wage Unemployed Workers
From 1992 to 1995, low-wage workers were twice as likely to be out ofwork as higher-wage workers but only half as likely to receive UI benefits.Table 1 compares the unemployment rates of low-wage workers with thoseof other workers in the early 1990s. During this period, low-wage workersmade up about 50 percent of the unemployed former workers,13 eventhough they were only about 30 percent of the total labor force. Table 2
11“Services industries,” as used in this report, refers to business services, personal andentertainment services, medical services, educational and social services, and professionalservices.
12The SIPP is administered in person to participants every 4 months over a 3-year period.The participants who are surveyed for this period are referred to in total as a “panel.” Forexample, 1993 SIPP panel participants first reported data in October 1992 and concluded inDecember 1995. Our analysis required that we use data covering an extended period of time.At the time we conducted our research, the only completed SIPP panels from the 1990swere those beginning in 1990, 1991, 1992, and 1993. The latest data available from thesepanels were for December 1995 from the 1993 SIPP panel. As a result, our research withSIPP data was limited to the period January 1990 through March 1995.
13Our calculations of “unemployed former workers” specifically excluded people who didnot have a job in the 27-month period before the month that they were unemployed. Thesepeople would include all new entrants into the labor force, as well as some reentrants. Low-wage workers made up about 40 percent of the total unemployed population.
Page 13 GAO-01-181 Unemployment Insurance

shows the rates at which low-wage workers received UI benefits whileunemployed, as compared with the rates of higher-wage workers.14
Table 1: Unemployment Rates for Low-Wage and Higher-Wage Workers, March1992−March 1995
Note: Differences between low-wage workers and higher-wage workers are statistically significant atthe .01 level.aWe calculated the unemployment rate by dividing the number of unemployed workers by the numberof workers in the labor force. For example, the low-wage unemployment rate was calculated by dividingthe number of low-wage workers unemployed by the total number of low-wage workers in the laborforce.bThe overall unemployment rates we calculated differ from the standard unemployment rates providedby the Bureau of Labor Statistics. For these 4 years, standard rates were 7.5 percent for 1992, 6.9percent for 1993, 6.1 percent for 1994, and 5.6 percent for 1995. These rates differ because ourcalculations excluded workers who were younger than 18 or older than 64, and because there weretechnical differences between the database we used for our calculation (SIPP) and that used for thestandard unemployment rates (CPS).
Source: GAO analysis of the 1990, 1991, 1992, and 1993 SIPP panels.
14The UI rate of receipt we have constructed is not comparable to the Department of Labor’sstandard recipiency rate. Our rate of receipt measures the number of people who haveactually received a UI payment as a percentage of the unemployed in the labor force. Thestandard recipiency rate, on the other hand, effectively measures the percentage ofunemployed who apply for UI benefits.
Unemployment rate a (percent)
Low-wage workers Higher-wage workers Overall b
March 1992 10.3 4.6 6.8
March 1993 10.2 4.1 6.9
March 1994 9.2 3.9 6.7
March 1995 7.8 3.2 5.7
Page 14 GAO-01-181 Unemployment Insurance
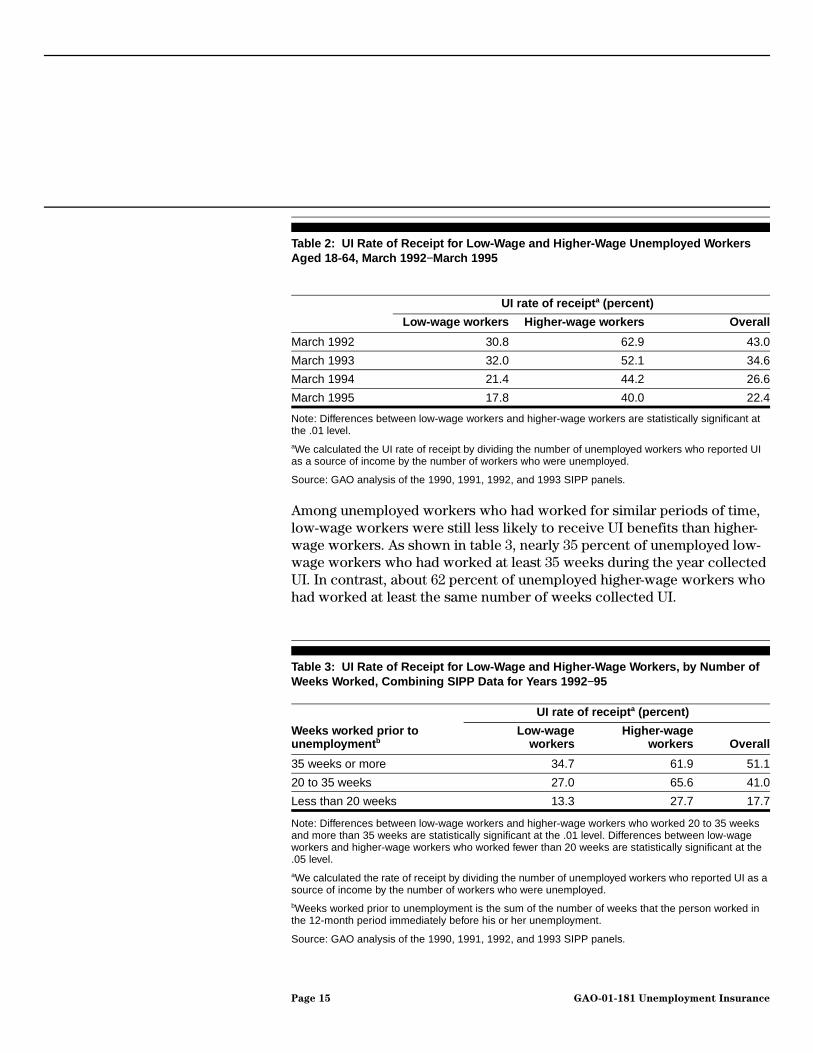
Table 2: UI Rate of Receipt for Low-Wage and Higher-Wage Unemployed WorkersAged 18-64, March 1992 −March 1995
Note: Differences between low-wage workers and higher-wage workers are statistically significant atthe .01 level.aWe calculated the UI rate of receipt by dividing the number of unemployed workers who reported UIas a source of income by the number of workers who were unemployed.
Source: GAO analysis of the 1990, 1991, 1992, and 1993 SIPP panels.
Among unemployed workers who had worked for similar periods of time,low-wage workers were still less likely to receive UI benefits than higher-wage workers. As shown in table 3, nearly 35 percent of unemployed low-wage workers who had worked at least 35 weeks during the year collectedUI. In contrast, about 62 percent of unemployed higher-wage workers whohad worked at least the same number of weeks collected UI.
Table 3: UI Rate of Receipt for Low-Wage and Higher-Wage Workers, by Number ofWeeks Worked, Combining SIPP Data for Years 1992 −95
Note: Differences between low-wage workers and higher-wage workers who worked 20 to 35 weeksand more than 35 weeks are statistically significant at the .01 level. Differences between low-wageworkers and higher-wage workers who worked fewer than 20 weeks are statistically significant at the.05 level.aWe calculated the rate of receipt by dividing the number of unemployed workers who reported UI as asource of income by the number of workers who were unemployed.bWeeks worked prior to unemployment is the sum of the number of weeks that the person worked inthe 12-month period immediately before his or her unemployment.
Source: GAO analysis of the 1990, 1991, 1992, and 1993 SIPP panels.
UI rate of receipt a (percent)
Low-wage workers Higher-wage workers Overall
March 1992 30.8 62.9 43.0
March 1993 32.0 52.1 34.6
March 1994 21.4 44.2 26.6
March 1995 17.8 40.0 22.4
UI rate of receipt a (percent)
Weeks worked prior tounemployment b
Low-wageworkers
Higher-wageworkers Overall
35 weeks or more 34.7 61.9 51.1
20 to 35 weeks 27.0 65.6 41.0
Less than 20 weeks 13.3 27.7 17.7
Page 15 GAO-01-181 Unemployment Insurance

Even when comparing full-time workers with substantial work histories,differences remained. Table 4 looks at unemployed people who hadworked at least 35 weeks, grouped into those who had worked full-timeand those who had worked part-time. As can be seen, among the peoplewho had worked full-time for at least 35 weeks, a considerable differencecontinues between the percentages of low-wage and higher-wageunemployed workers who collected UI benefits.
Table 4: UI Rate of Receipt for Low-Wage and Higher-Wage Full-Time and Part-TimeWorkers With at Least 35 Weeks of Employment Prior to Unemployment, CombiningSIPP Data for Years 1992-95
Note: Differences between low-wage workers and higher-wage workers are statistically significant atthe .01 level.aFull-time employment is defined as 35 hours per week or more.
Source: GAO analysis of the 1990, 1991, 1992, and 1993 SIPP panels.
Although some states had greater participation among the unemployed intheir UI programs—most of these tending to use less strict eligibilitycriteria that allow a greater percentage of unemployed to collect benefits—low-wage unemployed workers continued to be less likely to collect UIbenefits than other unemployed workers, regardless of the states in whichthey lived. To group states, we used the Department of Labor standardrecipiency rate as a rough gauge of the relative rates at which theunemployed used the state UI programs. As can be seen in table 5, eventhough states with high recipiency rates were more likely to pay UIbenefits, low-wage workers in those states were still only about half aslikely as higher-wage unemployed workers to collect UI benefits.
Employment status
UI rate of receipt (percent)
Low-wage workers Higher-wage workers
Full-timea 41.0 63.3
Part-time 23.3 53.9
Page 16 GAO-01-181 Unemployment Insurance
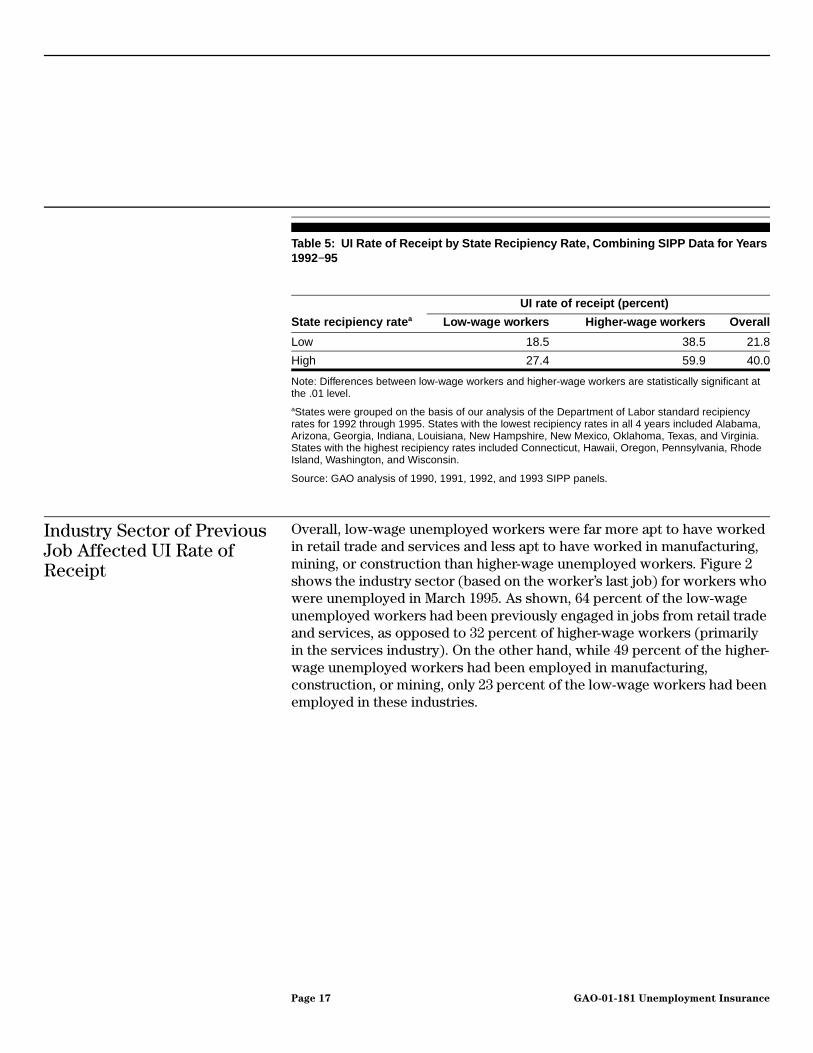
Table 5: UI Rate of Receipt by State Recipiency Rate, Combining SIPP Data for Years1992−95
Note: Differences between low-wage workers and higher-wage workers are statistically significant atthe .01 level.aStates were grouped on the basis of our analysis of the Department of Labor standard recipiencyrates for 1992 through 1995. States with the lowest recipiency rates in all 4 years included Alabama,Arizona, Georgia, Indiana, Louisiana, New Hampshire, New Mexico, Oklahoma, Texas, and Virginia.States with the highest recipiency rates included Connecticut, Hawaii, Oregon, Pennsylvania, RhodeIsland, Washington, and Wisconsin.
Source: GAO analysis of 1990, 1991, 1992, and 1993 SIPP panels.
Industry Sector of PreviousJob Affected UI Rate ofReceipt
Overall, low-wage unemployed workers were far more apt to have workedin retail trade and services and less apt to have worked in manufacturing,mining, or construction than higher-wage unemployed workers. Figure 2shows the industry sector (based on the worker’s last job) for workers whowere unemployed in March 1995. As shown, 64 percent of the low-wageunemployed workers had been previously engaged in jobs from retail tradeand services, as opposed to 32 percent of higher-wage workers (primarilyin the services industry). On the other hand, while 49 percent of the higher-wage unemployed workers had been employed in manufacturing,construction, or mining, only 23 percent of the low-wage workers had beenemployed in these industries.
State recipiency rate a
UI rate of receipt (percent)
Low-wage workers Higher-wage workers Overall
Low 18.5 38.5 21.8
High 27.4 59.9 40.0
Page 17 GAO-01-181 Unemployment Insurance

Figure 2: Industry Sector of Workers Unemployed in March 1995
Note: Although only the 1995 data are presented here, the distributions are similar for March 1992,1993, and 1994. The “other” industry category includes finance, agriculture, forestry, fishing,transportation, utilities, wholesale trade, and public administration.aThe total for low-wage workers does not equal 100 percent because of rounding.
Source: GAO analysis of 1993 SIPP panel.
Wide variation exists among industry sectors in the rates at whichunemployed workers collected UI benefits. In general, workers formerlyassociated with the retail trade or services industries were far less likely toreceive UI benefits than were workers most recently employed inmanufacturing, construction, or mining. Table 6 compares the rates amongindustries for workers unemployed in March 1995. As shown, 16 percent offormer retail employees and 13 percent of former services employeescollected UI benefits, while 39 percent of unemployed manufacturingworkers and 58 percent of unemployed construction and mining workerscollected benefits. Even with these variations among sectors, differencesremained in the rates of UI receipt for unemployed low-wage workers andother workers in individual industry sectors. Among former servicesworkers, though, both low-wage and higher-wage workers were far lesslikely to collect UI than were higher-wage workers in the other industrysectors.
Low-Wage Workers a
Services27%
Retail Trade37%
Manufacturing16%
MiningandConstruction
7%
Other14%
Higher-Wage Workers
Services25%
Retail Trade7%
Manufacturing22%
Mining andConstruction
27%
Other19%
Page 18 GAO-01-181 Unemployment Insurance

Table 6: UI Rate of Receipt for Low-Wage and Higher-Wage Workers Unemployed inMarch 1995, by Industry
Note: Differences between low-wage workers and higher-wage workers in retail trade and the miningand construction industries are statistically significant at the .05 level. Differences between low-wageworkers and higher-wage workers in the manufacturing industry are statistically significant at the .1level. Differences between low-wage workers and higher-wage workers in the services industry are notstatistically significant.
Source: GAO analysis of 1993 SIPP panel.
Compared with all other industry sectors, the retail trade and servicesindustries—where most unemployed low-wage workers had held their lastjob—had the lowest UI rate of receipt. (See fig. 3.)
Industry
UI rate of receipt (percent)
Low-wage workers Higher-wage workers Overall
Retail trade 12.0 42.6 16.2
Services 8.8 16.2 13.2
Manufacturing 24.9 51.1 39.4
Construction and mining 27.4 66.3 57.9
Page 19 GAO-01-181 Unemployment Insurance
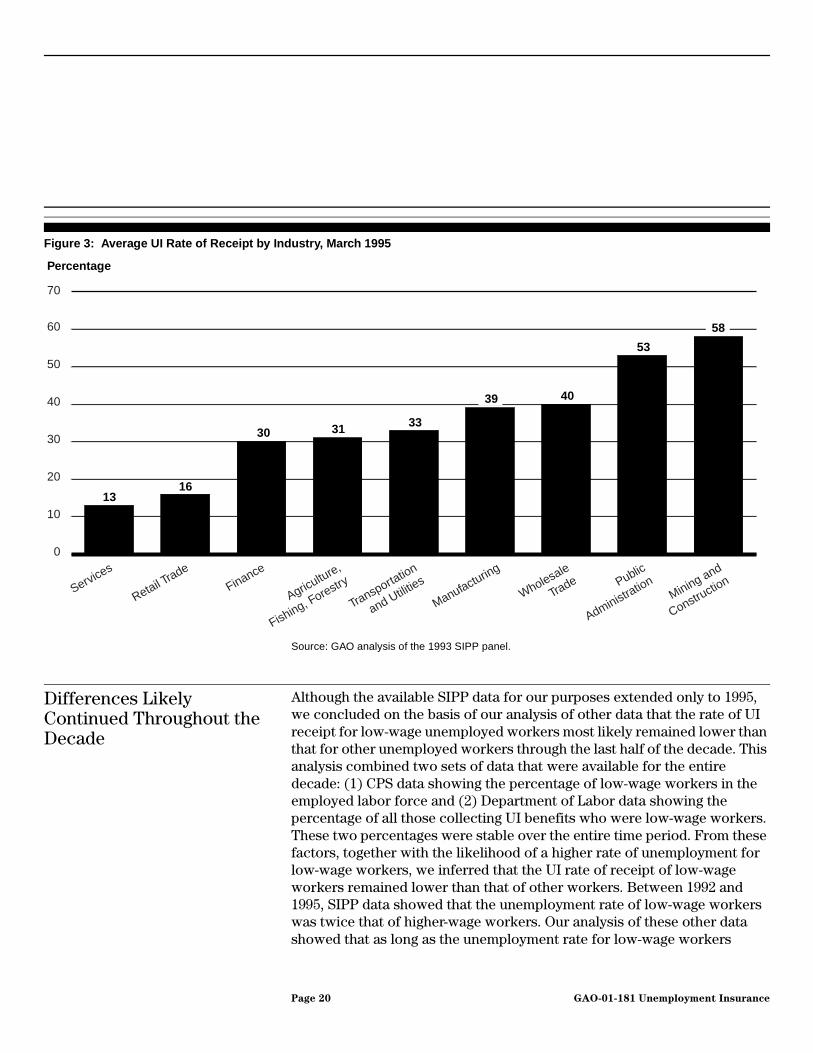
Figure 3: Average UI Rate of Receipt by Industry, March 1995
Source: GAO analysis of the 1993 SIPP panel.
Differences LikelyContinued Throughout theDecade
Although the available SIPP data for our purposes extended only to 1995,we concluded on the basis of our analysis of other data that the rate of UIreceipt for low-wage unemployed workers most likely remained lower thanthat for other unemployed workers through the last half of the decade. Thisanalysis combined two sets of data that were available for the entiredecade: (1) CPS data showing the percentage of low-wage workers in theemployed labor force and (2) Department of Labor data showing thepercentage of all those collecting UI benefits who were low-wage workers.These two percentages were stable over the entire time period. From thesefactors, together with the likelihood of a higher rate of unemployment forlow-wage workers, we inferred that the UI rate of receipt of low-wageworkers remained lower than that of other workers. Between 1992 and1995, SIPP data showed that the unemployment rate of low-wage workerswas twice that of higher-wage workers. Our analysis of these other datashowed that as long as the unemployment rate for low-wage workers
0
10
20
30
40
50
60
70
Mining and
ConstructionPublic
Administration
Wholesale
Trade
Manufacturing
Transportation
and Utilities
Agriculture,
Fishing, ForestryFinance
Retail Trade
Services
Percentage
1316
30 31 33
39 40
53
58
Page 20 GAO-01-181 Unemployment Insurance
continued to be substantially higher than that for other workers,15 the rateof UI receipt for low-wage unemployed workers would still have beenlower than that for other unemployed workers in the last half of the 1990s.(See app. I for our analysis.)
From other economic factors, it appears likely that the unemployment rateof low-wage workers remained higher than the unemployment rate(calculated for all workers) throughout the decade (even though theunemployment rate declined from 5.6 percent in 1995 to 4.2 percent in1999) and that, therefore, the rate of UI receipt for low-wage workersremained lower than that for other workers. For example, low-wageworkers were clustered in the same industries in the later 1990s that theywere in during the early 1990s—about the same percentage (nearly 70percent) of low-wage workers were employed in services and retailindustries in 1997 as in 1992. In addition, while many welfare recipientsjoined the labor force and became employed during the latter half of the1990s, many in low-wage jobs, it appears that they experienced higher thanaverage unemployment rates. According to Department of Health andHuman Services data, about 30 percent of those with jobs during the latesummer 1998 were no longer employed by January 1999.16 Unemploymentrates for former welfare recipients entering the labor force in 1996 and 1997have been estimated as 35 percent and 33 percent, respectively.17 Giventhese data, we believe that low-wage workers continued to experiencehigher than average unemployment rates in the last 5 years of the decade.
15Our calculations using CPS and Department of Labor data for the 4-year period 1996through 1999 indicated that, as long as low-wage workers’ unemployment rate exceededthat for other workers by at least 18 percent, the low-wage workers’ UI rate of receipt wouldbe lower than that for other workers throughout the rest of the decade.
16This calculation is based on data collected from states for the purpose of determiningTANF High Performance Bonuses. States may report data from UI wage records, surveys, oradministrative records.
17Unemployment rates are based on Displacement and Wage Effects of Welfare Reform,Timothy J. Bartik, W.E. Upjohn Institute for Employment Research (Jan. 1999). These rateswere calculated with March CPS data for female household heads aged 16 through 44 whohad collected welfare benefits in the previous year.
Page 21 GAO-01-181 Unemployment Insurance

Economic and PolicyFactors InfluencingGeneral UI DeclineHave SignificantImpact on Low-WageWorkers
Many factors may explain the relatively lower rate of UI receipt among low-wage workers. These factors could include the possibility that low-wageworkers are more likely to quit work to look for another (perhaps better-paying) job or to be fired for cause than other workers. Both of thesecircumstances would generally make claimants ineligible for UI benefits.However, certain major factors commonly cited by experts as contributingto the general decline in use of the UI program—fewer workers inmanufacturing jobs or with union membership, and tighter state eligibilityrequirements—have particular significance for low-wage workers.
Low-Wage Workers LessLikely to Work inManufacturing Jobs or to BeUnion Members
As a group, low-wage workers are much less likely than other workerseither to be employed in manufacturing or to be union members. They arealso less likely to be employed in other industries such as construction andmining that, like the manufacturing industry, tend to use layoffs toterminate employees. Rather, they are likely to work in retail trade orservices, industries that historically have handled job separationsdifferently (generally, there are fewer employee layoffs) and had less unionmembership than industries such as manufacturing. In 1997, about 70percent of low-wage workers were employed in retail trade and services,while 18 percent worked in manufacturing, mining, or construction.
Figure 4 compares the employment of low-wage workers with that of otherworkers by major industry sectors in 1997. For example, 32 percent of thelow-wage workers held jobs in retail trade during 1997, but only 9.5 percentof other workers were employed in retail trade jobs. Figure 5 compares theunion membership of these two groups.
Page 22 GAO-01-181 Unemployment Insurance

Figure 4: Industry Sector Employment of Low-Wage and Higher-Wage Workers, 1997
Note: The services industry combines the following industries: business services, personal andentertainment services, medical services, educational and social services, and professional services.
Source: Data are based on Jared Bernstein, Economic Policy Institute, and Heidi Hartman, Institute forWomen’s Policy Research, “Defining and Characterizing the Low-Wage Labor Market,” The Low-WageLabor Market, Department of Health and Human Services (Dec. 1999), which analyzed data from the1997 CPS Outgoing Rotations.
0
5
10
15
20
25
30
35
40
Public
Administration
Transportation
and UtilitiesFinance
Wholesale
Trade
Agriculture and
ForestryMining and
Construction
Manufacturing
Services
Retail Trade
Percentage
32
10
36 35
13
20
4
7
31
3 4 4
7
4
9
2
6
Low-Wage
Higher-Wage
Page 23 GAO-01-181 Unemployment Insurance

Figure 5: Union Membership of Low-Wage and Higher-Wage Workers, 1997
Source: Data are based on Jared Bernstein, Economic Policy Institute, and Heidi Hartman, Institute forWomen’s Policy Research, “Defining and Characterizing the Low-Wage Labor Market,” The Low-WageLabor Market, Department of Health and Human Services (Dec. 1999), which analyzed data from the1997 CPS Outgoing Rotations.
Certain Eligibility Criteriaand Time Lags in ProcessingWage Records PresentHurdles for Low-WageWorkers
Certain state eligibility criteria are particularly challenging to low-wageworkers, especially to those who have not held jobs for steady periods oftime, such as many former welfare recipients. Unemployed people witheconomic and financial characteristics commonly associated with formerwelfare recipients—single parents with dependent children who most oftenhave an intermittent work history of low-wage (and frequently part-time)work—can be particularly vulnerable to these state requirements. Thesestate criteria include requirements for minimum amounts of earnings aswell as disqualification for benefits if workers leave jobs because ofpersonal financial circumstances. In addition, the time allotted in manystates for processing wage records may require that a claimant waitbetween 3 and 6 months before receiving benefits to which he or she isentitled.
0
5
10
15
20
25
Higher-WageLow-Wage
Percentage
6
18
Page 24 GAO-01-181 Unemployment Insurance
Initially, to apply for UI benefits an unemployed person must have had“substantial attachment to the labor force” in prior work. Most states18 useprevious earnings—recorded on a quarterly basis in state wage records—tomeasure whether a claimant has had sufficient employment history. For themost part, states require that a claimant have earned a certain minimumamount over a specified four calendar quarters (the “base period”). Theminimum amount for the base period ranges from $130 in Hawaii to $3,400in Florida.
As a practice, the use of earnings to measure employment history treatslow-wage workers differently from higher-paid workers, even if theirparticipation in the workforce is similar. For example, a worker in Floridaearning the minimum wage of $5.15 per hour must work 660 hours toqualify for UI, while a worker earning $10.00 per hour would need to worka little over one-half as long to qualify for benefits. Although the currentstate earnings requirements appear fairly minimal (a full-time workerearning minimum wage for 40 hours per week would need to work 16.5weeks to qualify for UI in Florida), they can have a negative impact onworkers with a less stable job history.
In table 7, we compare the effect of state earnings and employmentrequirements on two unemployed part-time workers who both lost theirjobs in 2000—one earned minimum wage and the other earned $10.00 perhour. The comparison demonstrates that a part-time, low-wage worker isless likely to qualify for UI benefits. In fact, in eight states, working 20hours a week for 6 months at the minimum wage would be insufficient toqualify an unemployed worker for benefits.
18Three states—Michigan, New Jersey, and Ohio—count the number of weeks worked,requiring a minimum of 20 weeks of work for UI benefits. Washington requires anunemployed person to have worked for 680 hours during the base period to apply for UI.
Page 25 GAO-01-181 Unemployment Insurance

Table 7: Comparison of States’ Employment History Requirements for UI Benefitsfor Two Unemployed Workers in 2000
aWashington requires claimants to have worked 680 hours to receive benefits.
Source: GAO analysis of Department of Labor summary of state UI laws.
Next, to be eligible for UI benefits in most states, a person must havebecome unemployed involuntarily—that is, the person was either laid offor quit a job for “good cause.” Generally, if a person leaves a job for reasonsother than good cause, he or she is disqualified from UI benefits. However,much variation exists among the states about the factual circumstancesthat may constitute “good cause.” Even though many states have laws thatrestrict good cause to work-related circumstances, administrativedecisions and specific statutory exceptions lead to different interpretationsof “work-related circumstances.”
Certain temporary family crises—such as the sudden loss of child care orthe serious illness of a dependent child—may cause workers in marginalfinancial circumstances to quit their jobs. We surveyed the UI directors ofthe 50 states19 about three hypothetical situations involving retail workerswho quit their jobs for compelling personal reasons. In all cases, it wasassumed that the workers were otherwise eligible for UI and that they wereable to work when they applied for benefits.
Table 8 shows that most states would deny benefits to those currentlyavailable for work who had to quit their jobs because child care was
Work history
Worker 1: prior job paidminimum wage ($5.15 perhour)
Worker 2: prior job paid$10.00 per hour
Worked for 20 weeks, 20hours per week
Ineligible for UI in 13 states:AL, CO, FL, IN, KS, ME, NC,NH, ND, OH, VA, WA, WV
Ineligible for UI in 1 state:WAa
Worked for 26 weeks, 20hours per week
Ineligible for UI in 8 states:FL, IN, ME, NC, ND, NH, VA,WA
Ineligible for UI in 1 state:WAa
Worked for 40 weeks, 20hours per week
Eligible for UI in all states Eligible for UI in all states
19Individual state responses to the survey questions discussed in this report are included inappendix II.
Page 26 GAO-01-181 Unemployment Insurance
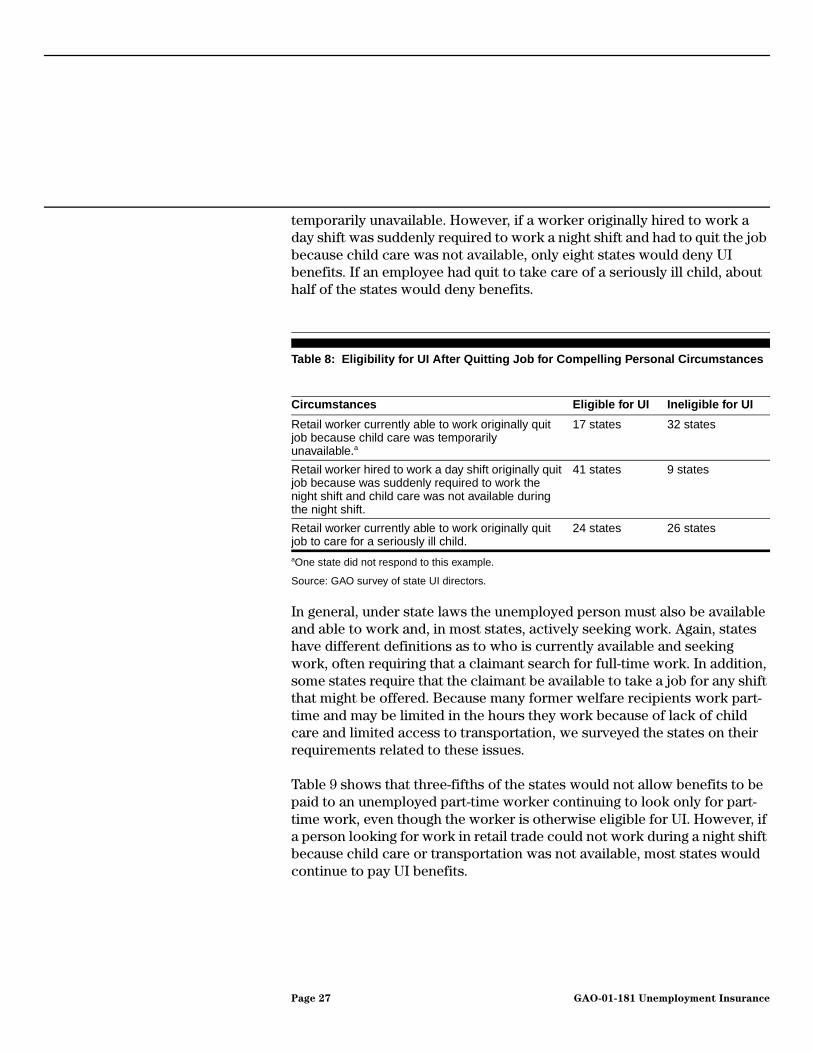
temporarily unavailable. However, if a worker originally hired to work aday shift was suddenly required to work a night shift and had to quit the jobbecause child care was not available, only eight states would deny UIbenefits. If an employee had quit to take care of a seriously ill child, abouthalf of the states would deny benefits.
Table 8: Eligibility for UI After Quitting Job for Compelling Personal Circumstances
aOne state did not respond to this example.
Source: GAO survey of state UI directors.
In general, under state laws the unemployed person must also be availableand able to work and, in most states, actively seeking work. Again, stateshave different definitions as to who is currently available and seekingwork, often requiring that a claimant search for full-time work. In addition,some states require that the claimant be available to take a job for any shiftthat might be offered. Because many former welfare recipients work part-time and may be limited in the hours they work because of lack of childcare and limited access to transportation, we surveyed the states on theirrequirements related to these issues.
Table 9 shows that three-fifths of the states would not allow benefits to bepaid to an unemployed part-time worker continuing to look only for part-time work, even though the worker is otherwise eligible for UI. However, ifa person looking for work in retail trade could not work during a night shiftbecause child care or transportation was not available, most states wouldcontinue to pay UI benefits.
Circumstances Eligible for UI Ineligible for UI
Retail worker currently able to work originally quitjob because child care was temporarilyunavailable.a
17 states 32 states
Retail worker hired to work a day shift originally quitjob because was suddenly required to work thenight shift and child care was not available duringthe night shift.
41 states 9 states
Retail worker currently able to work originally quitjob to care for a seriously ill child.
24 states 26 states
Page 27 GAO-01-181 Unemployment Insurance

Table 9: Eligibility for UI Benefits for Unemployed Workers Seeking Part-Time Workor Limited Shifts
aTwo states did not respond to this example.bThree states did not respond to this example.
Source: GAO survey of state UI directors.
Finally, even if the unemployed worker is eligible to receive benefits, thetime it takes to process wage records may cause serious delays before theworker can collect UI benefits. In most states, a claimant for UI must haveworked in two calendar quarters and have state wage records that showearnings in each of the quarters. However, the time it takes to add quarterlyemployee wage information to the state wage records generally means thatthe complete wage records will not be available until the next quarter afterthe information is received.
Two factors cause delays in processing state wage records, which arecompiled from quarterly employee wage reports. First, the wage report isnot due to most states until a month after the end of the quarter in whichthe wages are earned. For example, the wage report for the last calendarquarter of the year (ending on December 31) is due to the state January 31.Second, after the state receives the wage report, it needs time to process it.While many states require that employers with more than 250 employeesfile wage reports on magnetic media, smaller companies often file on paperdocuments, which may take 3 to 6 weeks longer to process. Therefore,although some wage data may be available after the first month of the nextquarter (February 1 in the example), all wage data may not be availableuntil the beginning of the next quarter (April 1).
Circumstances Eligible for UI Ineligible for UI
Unemployed retail worker previously in part-time jobis looking for job with same 30-hour work week.
20 states 30 states
Unemployed retail worker is not available to workevenings or weekends because of lack of childcare.a
38 states 10 states
Unemployed retail worker is not available to worknights because public transportation is generally notavailable at night.b
41 states 6 states
Page 28 GAO-01-181 Unemployment Insurance
To allow for these processing delays, most states specify that wages thatcount for UI must have been earned within the first four quarters of the lastfive completed quarters. These four quarters are called the “standard baseperiod.” In many states unemployed workers whose only work was in themost recent 6 months may have to wait between 3 and 6 more months tohave their earnings counted toward UI eligibility. For example, if a workerstarts a job in a retail store in October but gets laid off February 1, 39 stateswould not apply the worker’s total earnings toward UI eligibility until afterJuly 1.20
Currently, only 11 states will count the worker’s earnings immediatelytoward UI eligibility. If a worker does not have sufficient earnings in thestandard base period, most of these states will allow what is known as an“alternative base period” and count the earnings in the last four completedquarters (so that the worker’s January earnings would be counted in thesecond calendar quarter starting in April). In these states, if the wagerecords have not yet been processed, state officials most commonly make a“wage request” of an employer to verify a claimant’s most recent earnings.
Little Change to UISince Welfare Reform
Since welfare reform in 1996, the welfare rolls have dropped and largenumbers of people have joined the labor force, many in low-wage jobs. Yet,most states have made little change to their UI benefit coverage provisionsthat would assist low-wage workers. Specifically, states have made fewalterations to eligibility criteria, such as minimum earnings requirements,and other practices that in their current form may make it more difficult forlow-wage workers to qualify for UI. Recently, however, a grouprepresenting the Department of Labor, state UI directors, and others hasoffered proposals to expand benefit coverage for UI claimants that addresssome of the issues related to low-wage workers.
20In California, the worker’s complete wage records might not be available until August 1, 6months after he or she was first unemployed. However, in California the worker also wouldbe eligible to receive benefits as of April 1 based solely on one quarter’s earnings.
Page 29 GAO-01-181 Unemployment Insurance

UI Benefit CoverageProvisions and ProcessingLags Remain LargelyUnchanged
For the low-wage worker with an unstable job history, little has changed instate laws in recent years to increase the likelihood of UI coverage.21 Infact, in some states UI benefits for such workers became less accessible.For example, a former welfare recipient started her first job October 1 as aretail clerk paid at $5.15 per hour. After working 26 weeks for 20 hours eachweek, she was laid off because of slow sales. During that period, sheearned $2,678 and worked 520 hours. In 1996, she would have beenineligible for benefits in five states—Indiana, Maine, New Hampshire,North Dakota, and Virginia—because these states require a claimant tohave earned more than this worker’s total wages, and also in Washingtonbecause she had not worked a sufficient number of hours. In 2000, shewould be ineligible in eight states—those listed above plus Florida andNorth Carolina—because these states raised their minimum earningsrequirements. During the period 1996 through 2000, 19 states increased thetotal earnings required for UI eligibility, 1 state lowered its requirement,and the remaining 29 kept the same minimum earnings level.
If the worker in the previous example resided in a state where she waseligible for UI, the benefits available to her would most likely be about thesame in 2000 as in 1996. In 12 states, she would receive additional benefitsif she had dependents. The states vary as to both weekly benefit amountsand how long a claimant may receive the weekly amount. Table 10illustrates the benefit coverage of UI if this worker filed in 2000 in the fourmost populous states.
21In its comments, the Department of Labor pointed out that although the states have notmade many changes, the national minimum wage increased twice between 1996 and 2000,rising from $4.25 to $4.75 on October 1, 1996, and increasing to $5.15 on September 1, 1997.Labor notes that these increases made it more likely that low-wage workers met stateeligibility requirements.
Page 30 GAO-01-181 Unemployment Insurance
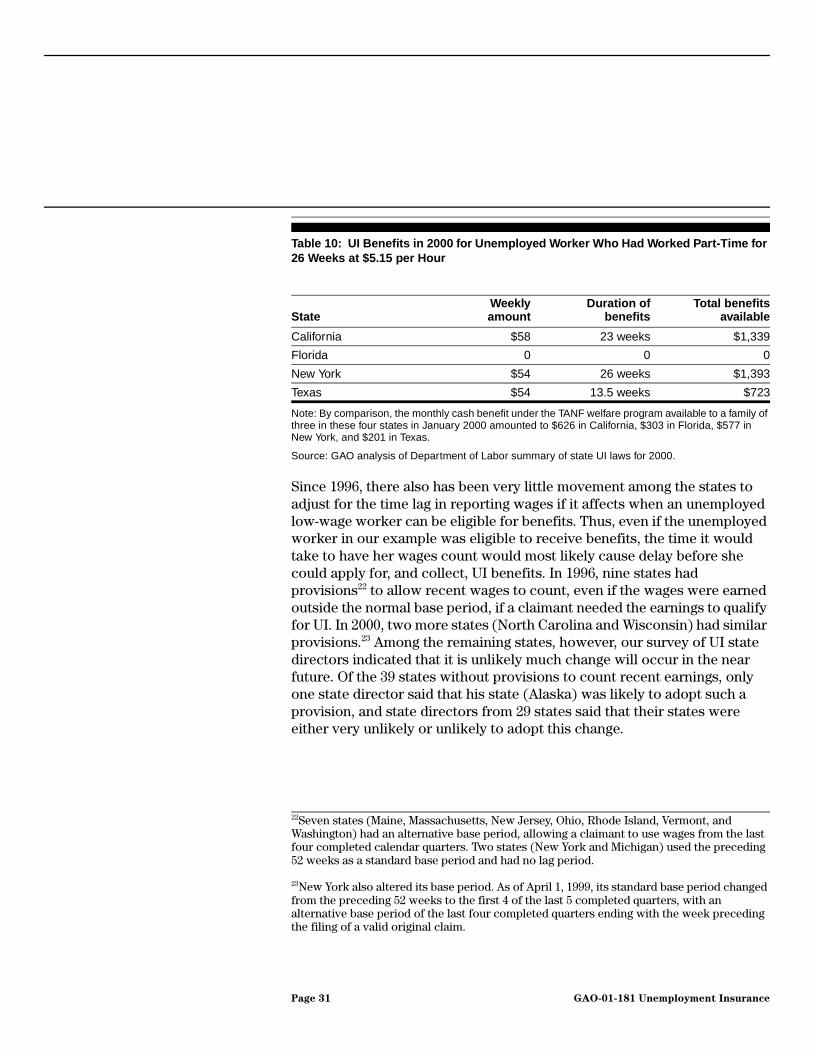
Table 10: UI Benefits in 2000 for Unemployed Worker Who Had Worked Part-Time for26 Weeks at $5.15 per Hour
Note: By comparison, the monthly cash benefit under the TANF welfare program available to a family ofthree in these four states in January 2000 amounted to $626 in California, $303 in Florida, $577 inNew York, and $201 in Texas.
Source: GAO analysis of Department of Labor summary of state UI laws for 2000.
Since 1996, there also has been very little movement among the states toadjust for the time lag in reporting wages if it affects when an unemployedlow-wage worker can be eligible for benefits. Thus, even if the unemployedworker in our example was eligible to receive benefits, the time it wouldtake to have her wages count would most likely cause delay before shecould apply for, and collect, UI benefits. In 1996, nine states hadprovisions22 to allow recent wages to count, even if the wages were earnedoutside the normal base period, if a claimant needed the earnings to qualifyfor UI. In 2000, two more states (North Carolina and Wisconsin) had similarprovisions.23 Among the remaining states, however, our survey of UI statedirectors indicated that it is unlikely much change will occur in the nearfuture. Of the 39 states without provisions to count recent earnings, onlyone state director said that his state (Alaska) was likely to adopt such aprovision, and state directors from 29 states said that their states wereeither very unlikely or unlikely to adopt this change.
StateWeeklyamount
Duration ofbenefits
Total benefitsavailable
California $58 23 weeks $1,339
Florida 0 0 0
New York $54 26 weeks $1,393
Texas $54 13.5 weeks $723
22Seven states (Maine, Massachusetts, New Jersey, Ohio, Rhode Island, Vermont, andWashington) had an alternative base period, allowing a claimant to use wages from the lastfour completed calendar quarters. Two states (New York and Michigan) used the preceding52 weeks as a standard base period and had no lag period.
23New York also altered its base period. As of April 1, 1999, its standard base period changedfrom the preceding 52 weeks to the first 4 of the last 5 completed quarters, with analternative base period of the last four completed quarters ending with the week precedingthe filing of a valid original claim.
Page 31 GAO-01-181 Unemployment Insurance

Proposals for UI Reform In the past 5 years, the Advisory Council on Unemployment Compensationand a stakeholder workgroup that includes state UI directors, unionrepresentatives, business representatives, and Department of Laborofficials have made proposals that would expand the availability of the UIprogram for low-wage workers, among other reforms. According to Labor,the changing U.S. economy and its labor force have led to the currentmovement for reform. The UI program was designed over 60 years ago andworked well for a certain type of worker within the U.S. economy at thattime. Since then, the U.S. economy and the composition of its labor forcehave changed, while the UI program has been slow to adapt to thesechanges. Labor noted that this has resulted in a larger portion of the laborforce more closely resembling a category of worker that UI was notdesigned to assist. More recently, the reform of the welfare system hasfurther increased the number of workers in this category.
In 1995, the advisory council made a series of proposals regarding low-wage workers as part of a larger set of recommendations about the needsof today’s labor market. Subsequently, the Department of Labor organized adialogue with state, employer, and union representatives to continue thedebate on possible UI reform. As a result of this dialogue, a stakeholderworkgroup of federal, state, and private sector officials recently proposedreforms for the UI program. Reform proposals applicable to low-wageworkers from these two groups include the following:
• Shorten the lag time in qualifying earnings for UI eligibility. The advisorycouncil recommended that all states use a “moveable” base period toconsider earnings necessary to qualify a claimant for benefits. Underthis proposal, the minimum earnings requirement could be met byearnings from the last four completed quarters, rather than from the firstfour of the last five completed quarters. Although initially thestakeholder workgroup considered a proposal to provide incentivefunding to the states for “alternative” base periods similar to theadvisory council’s moveable base period, ultimately it suggested thatstates try to use technology advances to process the UI reports fasterand, where at all possible, to use the latest wage earnings available forall claimants.
• Set minimum standards for UI earnings requirements. The advisorycouncil recommended that all states set their laws so that required baseperiod earnings do not exceed 800 times the state’s minimum wage. Inits dialogue, the Department of Labor asked for comments on a proposalthat would set the minimum earnings requirements to 400 times theminimum wage (this figure was selected so that someone who had
Page 32 GAO-01-181 Unemployment Insurance
worked for 20 weeks for 20 hours at minimum wage would be eligiblefor benefits in every state). However, the final proposals from thestakeholder workgroup did not include any recommendation on thisissue.
• Do not disqualify claimants seeking part-time work. Both the advisorycouncil and the stakeholder workgroup proposed that states should notreject claimants simply because they are looking for part-time, ratherthan full-time, work.
• Do not disqualify claimants who quit a job to care for a dependent.Although neither group ultimately recommended this proposal, theDepartment of Labor originally offered it for comment. The proposalwould have provided financial incentives to states to pay UI benefits toclaimants who had to quit their jobs to care temporarily for a child orother family member.
State objections to these proposals focus on the expansion of benefits, andthe states argue that (1) the costs of the proposals are burdensome and (2)the proposals violate the traditional roles of the federal and stategovernments in the operation of the UI program. Regarding the first issue,the states point to, for example, the extra costs of obtaining the mostrecent earnings records for UI claimants. In response to proposed statelegislation, Texas estimated the extra administrative costs at $153,000annually for making special requests to employers for recent wageinformation. The proposal from the stakeholder workgroup wouldeliminate the requirement that states make these special requests, insteadcalling for federal funding of improved technology to accelerate stateprocessing of UI wage records. However, the largest cost cited by statesrelates to the increased number of claimants receiving UI benefits. Ifalternative base provisions were implemented, Texas estimated that theannual costs to the unemployment insurance trust fund would be $24million per year in benefits paid to potential claimants; California officialsestimated their costs at $33 million per year.
From the standpoint of the states, the second objection—changes to thetraditional roles of the state and federal governments—raises more difficultproblems. While the federal government has imposed some specificrequirements, these requirements are viewed as minor conditions only; forexample, UI claimants cannot be denied benefits if they refuse work as aunion strikebreaker. In contrast, the proposals discussed here—forexample, the earnings requirements or allowable reasons for quitting ajob—pertain to issues that state officials consider integral to the operation
Page 33 GAO-01-181 Unemployment Insurance
of the state’s UI program that, until now, have been generally under thecontrol of the state.
Conclusion Despite interest in ensuring that the UI program is meeting the needs oflow-wage workers, little action has been taken at the state or federal levelsto expand UI availability to this group. In part, this reflects the difficulty ofaddressing the cost implications of expanded eligibility and balancingstates’ autonomy in operating their UI programs. Yet, as a safety net, the UIprogram continues to offer only minimal protection for low-wage workers.Even though employers in many states pay the same UI payroll taxes foremployees earning minimum wage as they pay for employees earning farmore than that amount, low-wage workers are much less likely than higher-wage workers to be included in the UI safety net. In the event of aneconomic downturn, many low-wage workers may find that, unlike higher-wage workers, they will be unable to qualify for UI benefits. While thesituation deserves attention on its own merits, the sweeping changes innational welfare policy heighten its importance. A UI program thatsupports all workers who lose their jobs through no fault of their ownduring times of economic hardship can play an important role in helpingmany former welfare recipients maintain their places in the labor force andout of the welfare system.
Agency Comments In its review of a draft of this report, the Department of Labor generallyagreed with our findings and conclusion. It made three major comments:(1) that the changing U.S. economy and its labor force have led to thecurrent movement for UI reform; (2) that nonmonetary eligibility criteriasuch as voluntarily quitting a job may explain some of the differencesbetween the UI rate of receipt for low-wage and other workers; and (3) thatthe increases in the national minimum wage between 1996 and 2000 mayhave made some unemployed low-wage workers eligible for UI. We concurwith these comments and have modified our report as appropriate. Laboralso made technical comments, which we have included in our reportwhere appropriate. (Labor’s comments appear in app. III.)
As agreed with your offices, unless you publicly announce its contentsearlier, we plan no further distribution of this report until 30 days after itsissue date. At that time, we will send copies to the Honorable Alexis M.Herman, Secretary of Labor; the Honorable Donna E. Shalala, Secretary of
Page 34 GAO-01-181 Unemployment Insurance

Health and Human Services; appropriate congressional committees; andother interested parties. We will also make copies available upon request.
Please call me at (202) 512-7215 or Gale Harris at (202) 512-7235 if you oryour staffs have any questions about this report. Other GAO contacts andstaff acknowledgments are listed in appendix IV.
Sigurd R. NilsenDirector, Education, Workforce, and
Income Security Issues
Page 35 GAO-01-181 Unemployment Insurance
Appendix I
AppendixesScope and Methodology AppendixI
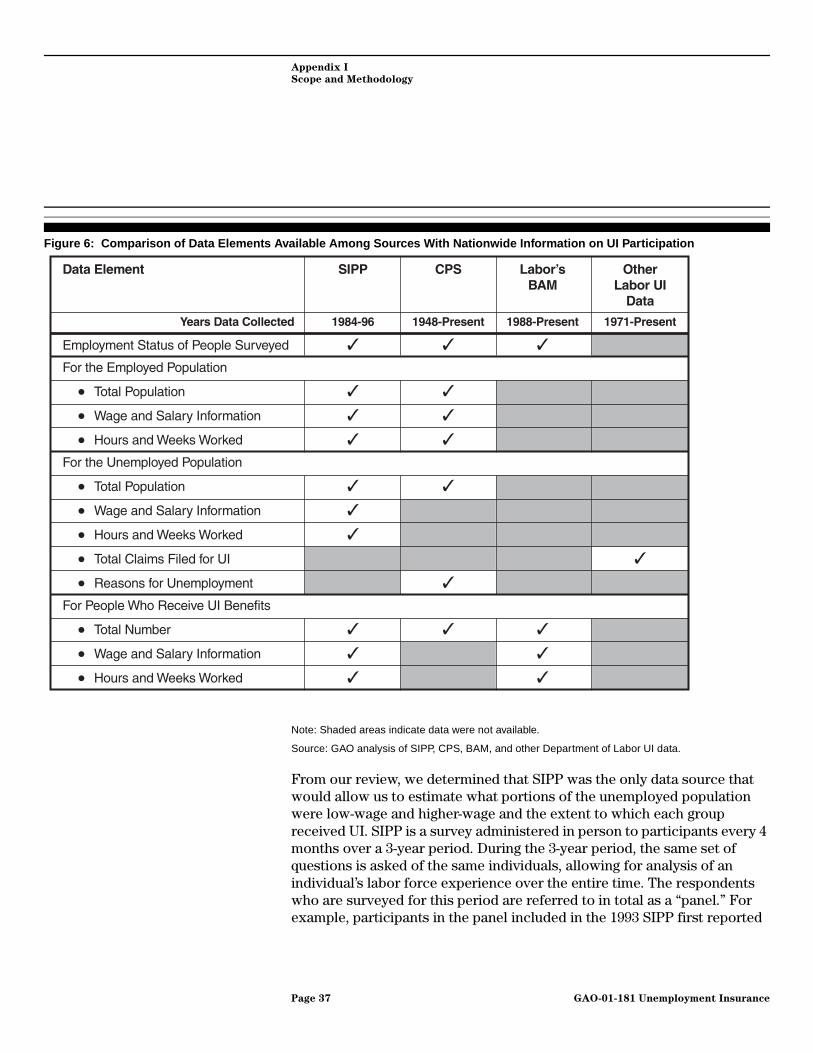
We used a variety of data sources to examine the role of unemploymentinsurance (UI) as part of the safety net for low-wage workers. To show thegeneral trends of UI participation among all unemployed, we summarizeddata compiled by the Department of Labor. To measure the use of UI bylow-wage workers as opposed to other workers, we used data from theSurvey of Income and Program Participation (SIPP), a survey conducted bythe Bureau of the Census. To determine the specific eligibility criteria usedcurrently in state UI programs, we surveyed the directors of theseprograms. Finally, to assess whether states have changed their policies andpractices to better ensure that low-wage workers are included in the UIsafety net, we reviewed data from the Department of Labor as well as datafrom a national survey of UI directors, and we visited the four mostpopulous states to talk with state officials about their UI system. Weperformed our work between January 2000 and September 2000 inaccordance with generally accepted government auditing standards.
Estimating theUnemployment Rateand UI Rate of Receiptof Low-Wage Workers
To compare low-wage workers’ experience with UI with that of otherworkers, we estimated the unemployment rates and the UI rates of receiptfor the two groups of workers. To do this, we needed information on (1) theemployment status of individuals; (2) specific characteristics of theemployed population; (3) specific characteristics of the unemployedpopulation; and (4) detailed information on unemployed people whocollected UI. We talked with experts at the Department of Labor and theBureau of the Census and reviewed academic research and other relatedliterature to determine what data sources could be used for our study.
We considered four data sources with information on the use of the UIprogram nationwide—SIPP, the Current Population Survey (CPS), theBenefit Accuracy Measurement program (BAM), and general Departmentof Labor UI administrative data. SIPP is a longitudinal survey that collectsinformation on labor force participation and income sources over a 3-yearperiod. CPS, a national survey conducted by the Bureau of the Census forthe Bureau of Labor Statistics, is a longitudinal survey that collects data onemployment status and other demographic characteristics over a 1-yearperiod. BAM is a Department of Labor program that collects information inorder to evaluate the accuracy of state UI payments, and it includesspecific data on demographic characteristics of people who collect UIbenefits. Labor also maintains other administrative databases that collectinformation related to unemployment and the UI program. Figure 6compares various data elements that are available among these foursources.
Page 36 GAO-01-181 Unemployment Insurance
Appendix I
Scope and Methodology
Figure 6: Comparison of Data Elements Available Among Sources With Nationwide Information on UI Participation
Note: Shaded areas indicate data were not available.
Source: GAO analysis of SIPP, CPS, BAM, and other Department of Labor UI data.
From our review, we determined that SIPP was the only data source thatwould allow us to estimate what portions of the unemployed populationwere low-wage and higher-wage and the extent to which each groupreceived UI. SIPP is a survey administered in person to participants every 4months over a 3-year period. During the 3-year period, the same set ofquestions is asked of the same individuals, allowing for analysis of anindividual’s labor force experience over the entire time. The respondentswho are surveyed for this period are referred to in total as a “panel.” Forexample, participants in the panel included in the 1993 SIPP first reported
Page 37 GAO-01-181 Unemployment Insurance
Appendix I
Scope and Methodology
data beginning in October 1992, and they continued to report data at 4-month intervals through December 1995.
Our data analysis required that we use SIPP data that covered an entire 3-year period. At the time we conducted our research, the only completedSIPP panels with data from the 1990s were those started in fiscal years1990, 1991, 1992, and 1993. The latest data available from these panels werefor December 1995 from the 1993 SIPP panel. As a result, our researchusing SIPP data was limited to the period January 1990 through March1995.1
General Methodology forSIPP Analysis
To estimate the unemployment rates and the UI rates of receipt for low-wage and higher-wage workers using the 1990 through 1993 SIPP panels,we took the following steps:
Step 1: We created a sample from each SIPP panel of 18- to 64-year-
olds who were not self-employed.
We limited our sample in each SIPP panel to those between the ages of 18and 64. We also excluded those who were self-employed and for whomthere were incomplete data during the 3-year period. Our sample includeddata on the wages and salaries of respondents as well as the number ofhours and weeks worked.2
Step 2: We used March of the last year of each SIPP panel to
determine employment status.
Because of the design of our analysis, we chose to focus on theemployment status in one month, March, from the last year of each panel.3
Because seasonal employment can greatly affect employment status atcertain times of the year (such as summer and winter), we examined data
1Although the SIPP database contained data through December 1995, because of the designof our analysis (described more fully later in this app.), we used data through March 1995.
2Our final unweighted samples were 17,088 cases for 1992, 12,266 cases for 1993, 15,953cases for 1994, and 15,448 cases for 1995.
3Therefore, from the 1990 SIPP panel, we focused on March 1992; from the 1991 SIPP panel,we focused on March 1993; from the 1992 SIPP panel, we used data from March 1994; andfrom the 1993 SIPP panel, we used data from March 1995.
Page 38 GAO-01-181 Unemployment Insurance
Appendix I
Scope and Methodology
from March, a month less likely to be affected by seasonal employment.SIPP records data on a monthly basis. Since it is possible for an individualto be both employed and unemployed in the same month, to address thisissue, we consulted with officials at the Bureau of the Census.4 Weconsidered a person as employed if he or she had a job for the entire monthor, if the person missed work during this period, it was not because he orshe was laid off and he or she spent no time looking for a job.5 Weconsidered a person as unemployed if he or she was out of work for theentire month or, if the person did work for part of the month, he or shespent the rest of the time laid off or looking for another job.6 We did notinclude those who were out of the labor force.7
Step 3: We “looked back” 27 months for the most recent job.
To determine the wage level of an unemployed person, we identified themost recent job held by that person. To do this, we reviewed the workhistory to determine whether the person had had a job during the periodcovered by the SIPP panel. Starting in March of the last panel year (themonth we used to determine unemployment), we looked back on a month-by-month basis to determine the most recent month in which that personwas identified as employed. By using March of the last panel year we could,where necessary, look back for a period of 27 months to identify prioremployment. In some cases, a respondent did not have a job during theentire 27-month period. If a respondent had not held a job at all during thistime, we excluded the person from our sample.
4See Paul Ryscavage, The Survey of Income and Program Participation: Measuring Spells ofUnemployment and Their Outcomes, No. 84 (Washington, D.C.: Bureau of the Census, Dec.28, 1988).
5We specifically defined employed on the basis of the following SIPP categories: (1) with ajob entire month, worked all weeks; (2) with a job entire month, missed 1 or more weeks, notime on layoff; (3) with a job 1 or more weeks, no time spent looking for work and no timeon layoff.
6We specifically defined unemployed on the basis of the following SIPP categories: (1) nojob during the month, spent entire month looking for work or on layoff; (2) no job during themonth, spent 1 or more weeks looking for work or on layoff; (3) with a job 1 or more weeks,spent 1 or more weeks looking for work or on layoff; and (4) with a job entire month, missed1 or more weeks of work, spent time on layoff.
7We define labor force as either (1) employed people or (2) unemployed people who areseeking employment.
Page 39 GAO-01-181 Unemployment Insurance
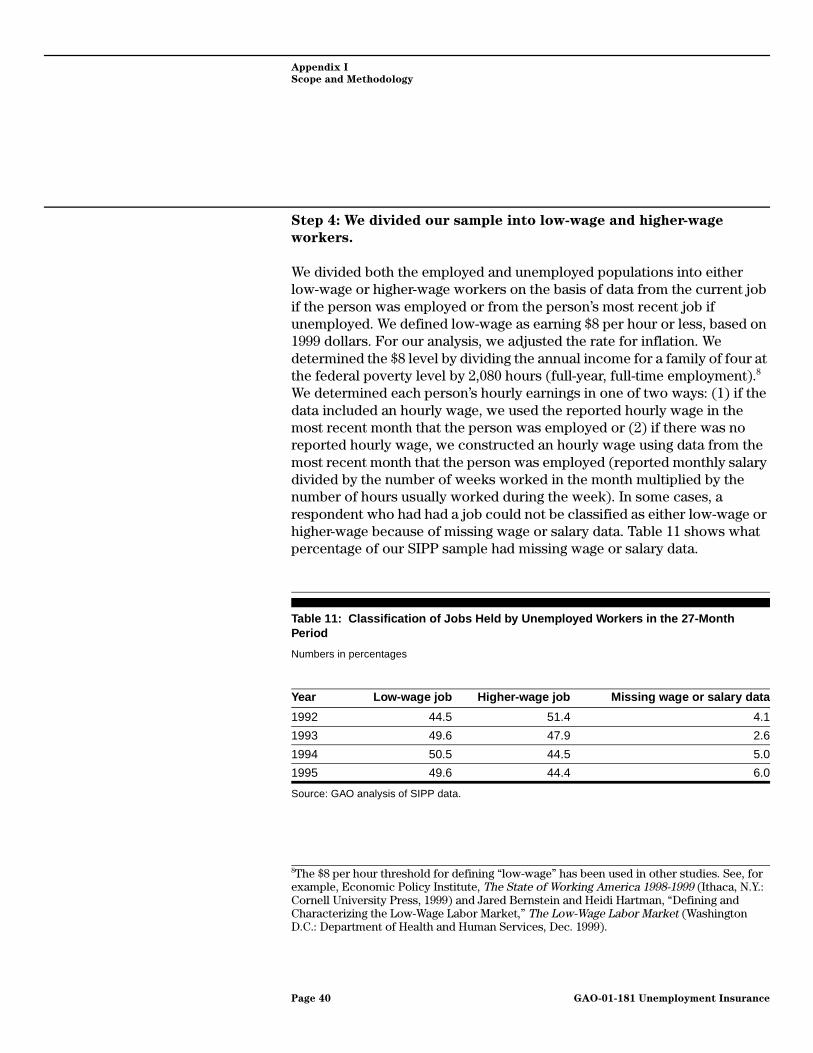
Appendix I
Scope and Methodology
Step 4: We divided our sample into low-wage and higher-wage
workers.
We divided both the employed and unemployed populations into eitherlow-wage or higher-wage workers on the basis of data from the current jobif the person was employed or from the person’s most recent job ifunemployed. We defined low-wage as earning $8 per hour or less, based on1999 dollars. For our analysis, we adjusted the rate for inflation. Wedetermined the $8 level by dividing the annual income for a family of four atthe federal poverty level by 2,080 hours (full-year, full-time employment).8
We determined each person’s hourly earnings in one of two ways: (1) if thedata included an hourly wage, we used the reported hourly wage in themost recent month that the person was employed or (2) if there was noreported hourly wage, we constructed an hourly wage using data from themost recent month that the person was employed (reported monthly salarydivided by the number of weeks worked in the month multiplied by thenumber of hours usually worked during the week). In some cases, arespondent who had had a job could not be classified as either low-wage orhigher-wage because of missing wage or salary data. Table 11 shows whatpercentage of our SIPP sample had missing wage or salary data.
Table 11: Classification of Jobs Held by Unemployed Workers in the 27-MonthPeriod
Numbers in percentages
Source: GAO analysis of SIPP data.
8The $8 per hour threshold for defining “low-wage” has been used in other studies. See, forexample, Economic Policy Institute, The State of Working America 1998-1999 (Ithaca, N.Y.:Cornell University Press, 1999) and Jared Bernstein and Heidi Hartman, “Defining andCharacterizing the Low-Wage Labor Market,” The Low-Wage Labor Market (WashingtonD.C.: Department of Health and Human Services, Dec. 1999).
Year Low-wage job Higher-wage job Missing wage or salary data
1992 44.5 51.4 4.1
1993 49.6 47.9 2.6
1994 50.5 44.5 5.0
1995 49.6 44.4 6.0
Page 40 GAO-01-181 Unemployment Insurance
Appendix I
Scope and Methodology
Step 5: We determined whether the unemployed worker reported UI
as a source of income.
We then identified whether each respondent had received UI benefits whileout of work. If an unemployed former worker reported UI as a source ofincome in March of the last panel year, we classified the person asreceiving UI. Otherwise, we classified the person as not receiving UI.
Step 6: We identified additional characteristics of the unemployed
population.
We further analyzed the unemployed population by identifying theindustries in which they had worked, whether they had worked full-time,and how long they had worked before becoming unemployed. To identifythe kinds of industries low-wage and higher-wage unemployed workers hadworked, we used the industry code of the most recent job. Our workpresents data for nine industry groups: (1) retail trade; (2) manufacturing;(3) finance; (4) mining and construction; (5) agriculture, fishing, andforestry; (6) wholesale trade; (7) transportation and utilities; (8) publicadministration; and (9) services. We developed these groups by combiningdetailed CPS industry codes. For example, the services sector combinesfive types of service industries: business services, personal andentertainment services, medical services, education and social services,and professional services.
Next, we identified whether the unemployed former worker had beenemployed full-time or part-time. We defined full-time employment asworking 35 or more hours each week and part-time employment asworking fewer than 35 hours per week.
To determine the number of weeks worked by the person in the yearimmediately before he or she became unemployed, we created a subsamplefrom our original SIPP sample. The subsample included only those whowere unemployed in March of the last panel year and who had had a jobduring the 15 months prior to unemployment (as compared with the 27-month look-back period for our original sample). After identifying the mostrecent job in the 15-month period, we counted how many weeks eachperson had worked during the 12 months before becoming unemployed.We classified the unemployed low-wage and higher-wage workers intothree categories: (1) those who had worked more than 35 weeks during theyear, (2) those who had worked between 20 and 35 weeks during the year,
Page 41 GAO-01-181 Unemployment Insurance

Appendix I
Scope and Methodology
and (3) those who had worked fewer than 20 weeks during the year. Toincrease the size of this subsample, we combined all four SIPP panels.
Calculating theUnemployment Rate
We calculated the overall unemployment rate by dividing the number ofunemployed by the total number of people in the labor force, as follows:
The unemployment rates for low-wage and higher-wage workers werecalculated on the basis of their representation in the labor force. Forexample, the unemployment rate for low-wage workers was calculated bydividing the number of unemployed low-wage workers by the number oflow-wage workers in the labor force.
In calculating an unemployment rate for higher-wage workers, we includedthe cases with missing wage or salary data in such a way as to calculate themost conservative estimates, that is, estimates that would minimize anydifferences between the low-wage and higher-wage unemployment rates.To calculate this rate, we assumed that all those with missing wage datawere actually higher-wage unemployed workers. With that assumption, thegroup with missing wage data was added to the higher-wage unemployedgroup when we calculated the higher-wage unemployment rate.
The unemployment rate we calculated using the SIPP data differs for avariety of reasons from the standard unemployment rate published by the
Page 42 GAO-01-181 Unemployment Insurance

Appendix I
Scope and Methodology
Bureau of Labor Statistics from CPS data. These two rates differ in partbecause each rate measures different populations. Specifically, our rateincludes only those in the labor force who are between the ages of 18 and64, whereas the standard rate includes all those who are 16 years old andolder. Also, our analysis excludes those who are self-employed, while thestandard rate includes self-employed workers. Another key contrast resultsfrom technical differences between the two databases used to calculatethese rates. SIPP, for example, records data for each month, but the CPSrecords data for a 1-week period. Therefore, while employment status inSIPP measures whether or not a person was employed during the entiremonth, the CPS measures whether the person was employed during theweek that included the 12th of the month.
Calculating the UI Rate ofReceipt
We calculated the overall UI rate of receipt by dividing the number ofunemployed workers who had collected UI benefits during March by thetotal number of unemployed workers in that month.
In calculating the UI rates of receipt, we included the respondents withmissing wage data in such a way as to present the most conservativeestimates; that is, we allocated the missing wage data so that our estimateswould minimize the difference between the receipt rates for the twogroups. Therefore, to calculate the UI rate of receipt for low-wage workers,we assumed that all workers with missing wage data who were paid UIbenefits were low-wage unemployed workers. Conversely, to calculate thehigher-wage UI rate of receipt, we assumed that all those with missingwage data who were not paid UI benefits were higher-wage unemployedworkers.
Page 43 GAO-01-181 Unemployment Insurance
Appendix I
Scope and Methodology
The UI rate of receipt we constructed using SIPP data is not comparable tothe Department of Labor’s standard UI recipiency rate. Our UI rate ofreceipt measures the number of people who have actually received a UIcheck as a percentage of the unemployed in the labor force. Labor’sstandard recipiency rate, on the other hand, measures the number ofpeople who file a claim for UI as a percentage of the unemployed in thelabor force.9 By measuring the number of people who file a claim forbenefits, Labor’s rate includes those who eventually receive UI as well asthose who do not.
Because the UI program differs from state to state, we analyzed whetherthere were differences in the UI rates of receipt for the low-wage andhigher-wage unemployed that lived in different states. For purposes ofcomparison, we created two groups of states—those with high standardrecipiency rates and those with low standard recipiency rates based onLabor’s standard recipiency rates from 1992 through 1995. States thatconsistently were in the 15 states with the highest standard UI recipiencyrates were in one group and states that were consistently the lowest 15were in the other. To increase the size of the sample for each of the twogroups of states, we combined all four SIPP panels.
For each unemployment rate and UI rate of receipt presented in theanalysis, we tested whether the differences between low-wage and higher-wage workers were statistically significant. To do this, we compared thesampling errors for the two estimates and, if the sampling errors for thelow-wage and higher-wage workers did not overlap, we concluded thateach difference is statistically significant. Unless otherwise noted,statistical significance was tested at the .01 level, thereby allowing us toconclude that there is only a 1 percent chance that the difference betweenthe rates is due to sampling error.
Data Analysis for the Rest ofthe 1990s
Although SIPP data are unavailable for the latter half of the 1990s, otherrelevant data are available from the CPS and from the Department ofLabor’s BAM database. From the CPS data, it is possible to calculate theproportion of low-wage (or higher-wage) workers in the employed laborforce. From the BAM data we can determine the proportion of low-wage(or higher-wage) workers who received UI, compared with the total
9Labor’s overall standard recipiency rate was 34 percent in 1992, 31 percent in 1993, 33percent in 1994, and 35 percent in 1995.
Page 44 GAO-01-181 Unemployment Insurance
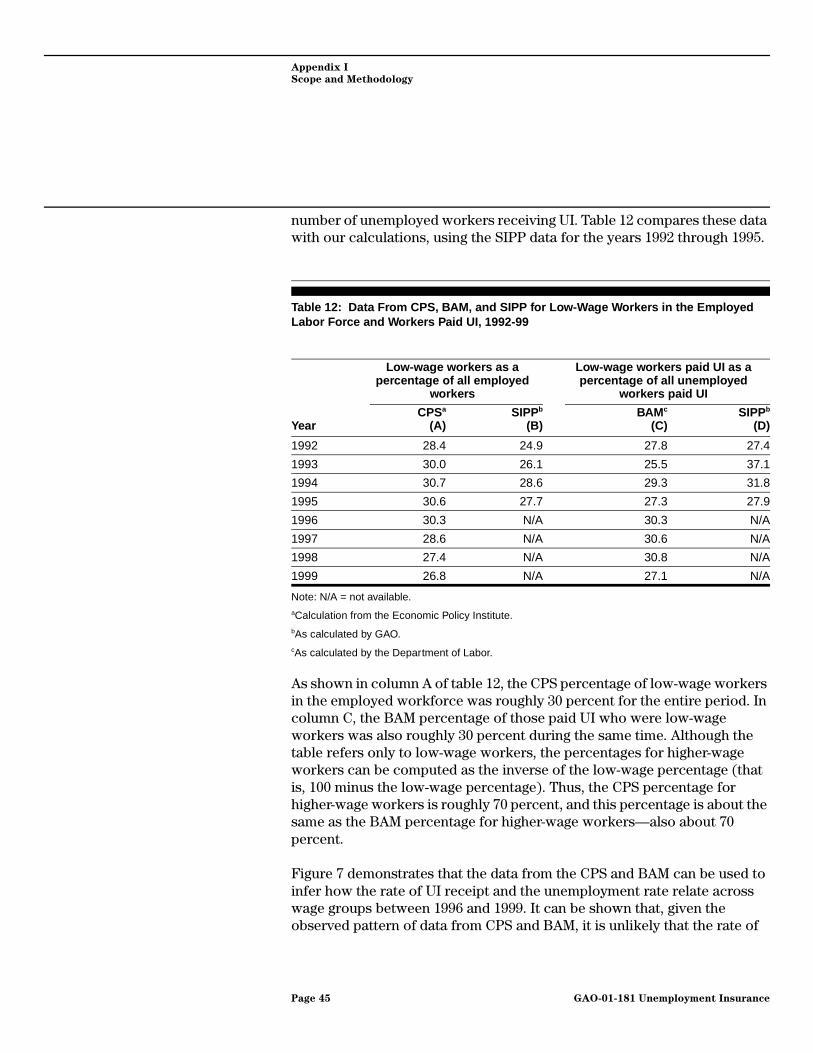
Appendix I
Scope and Methodology
number of unemployed workers receiving UI. Table 12 compares these datawith our calculations, using the SIPP data for the years 1992 through 1995.
Table 12: Data From CPS, BAM, and SIPP for Low-Wage Workers in the EmployedLabor Force and Workers Paid UI, 1992-99
Note: N/A = not available.aCalculation from the Economic Policy Institute.bAs calculated by GAO.cAs calculated by the Department of Labor.
As shown in column A of table 12, the CPS percentage of low-wage workersin the employed workforce was roughly 30 percent for the entire period. Incolumn C, the BAM percentage of those paid UI who were low-wageworkers was also roughly 30 percent during the same time. Although thetable refers only to low-wage workers, the percentages for higher-wageworkers can be computed as the inverse of the low-wage percentage (thatis, 100 minus the low-wage percentage). Thus, the CPS percentage forhigher-wage workers is roughly 70 percent, and this percentage is about thesame as the BAM percentage for higher-wage workers—also about 70percent.
Figure 7 demonstrates that the data from the CPS and BAM can be used toinfer how the rate of UI receipt and the unemployment rate relate acrosswage groups between 1996 and 1999. It can be shown that, given theobserved pattern of data from CPS and BAM, it is unlikely that the rate of
Year
Low-wage workers as apercentage of all employed
workers
Low-wage workers paid UI as apercentage of all unemployed
workers paid UI
CPSa
(A)SIPPb
(B)BAM c
(C)SIPPb
(D)
1992 28.4 24.9 27.8 27.4
1993 30.0 26.1 25.5 37.1
1994 30.7 28.6 29.3 31.8
1995 30.6 27.7 27.3 27.9
1996 30.3 N/A 30.3 N/A
1997 28.6 N/A 30.6 N/A
1998 27.4 N/A 30.8 N/A
1999 26.8 N/A 27.1 N/A
Page 45 GAO-01-181 Unemployment Insurance
Appendix I
Scope and Methodology
UI receipt for low-wage workers would exceed that of higher-wage workersduring this period. Essentially, for this to have occurred, the unemploymentrates across the wage groups would have to have converged dramaticallyduring this period—in sharp contrast to the experience of earlier years.Whereas between 1992 and 1995 the unemployment rate for low-wageworkers exceeded that of higher-wage workers by well over 100 percent, aslong as the unemployment rate for low-wage workers exceeded that ofhigher-wage workers by as little as 18 percent throughout the rest of thedecade, the rate of receipt for low-wage workers remained less than that ofhigher-wage workers for each year between 1996 through 1999.
In figure 7, RR (lw) equals the UI rate of receipt for low-wage workers andUR (lw) equals the unemployment rate of low-wage workers. For higher-wage workers, the UI rate of receipt is RR (hw) and the unemployment rateis UR (hw).
Page 46 GAO-01-181 Unemployment Insurance
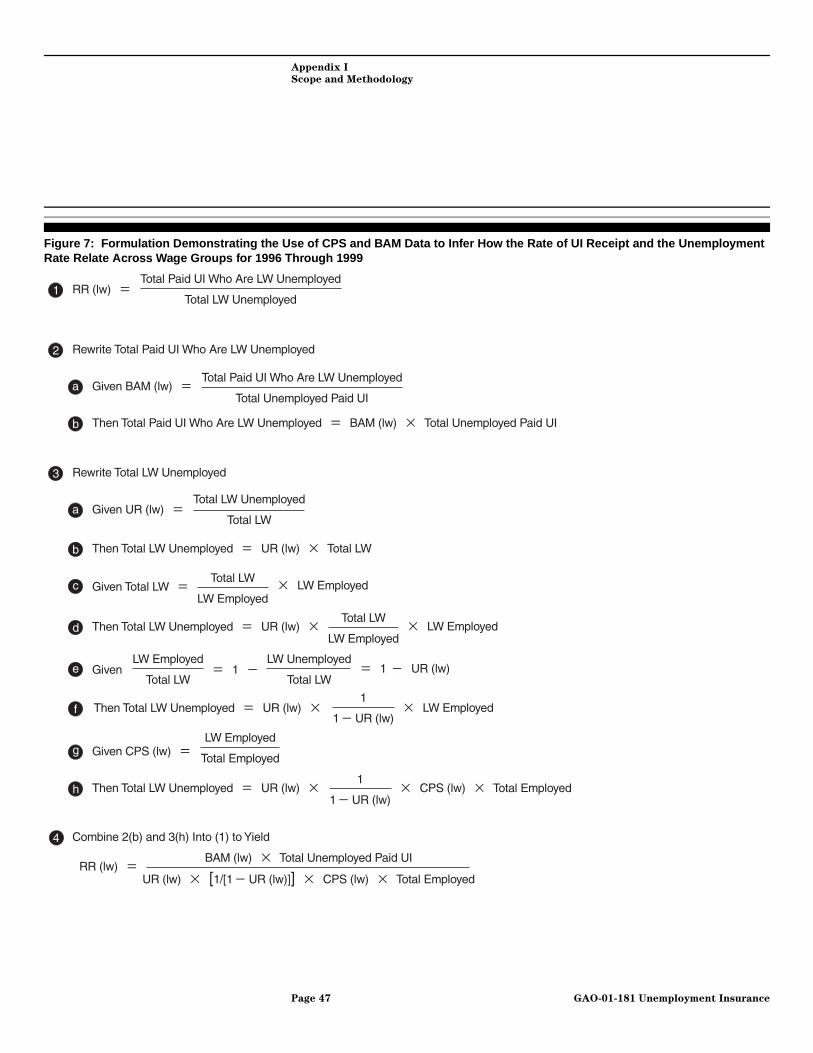
Appendix I
Scope and Methodology
Figure 7: Formulation Demonstrating the Use of CPS and BAM Data to Infer How the Rate of UI Receipt and the UnemploymentRate Relate Across Wage Groups for 1996 Through 1999
Page 47 GAO-01-181 Unemployment Insurance
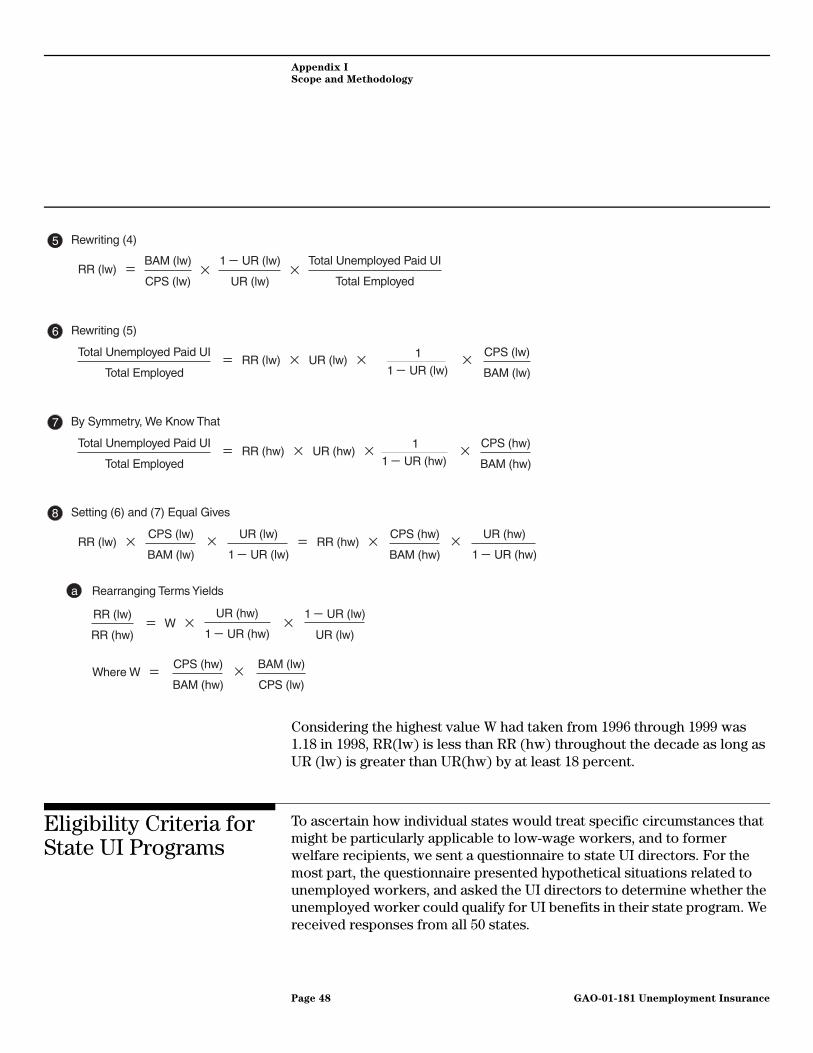
Appendix I
Scope and Methodology
Considering the highest value W had taken from 1996 through 1999 was1.18 in 1998, RR(lw) is less than RR (hw) throughout the decade as long asUR (lw) is greater than UR(hw) by at least 18 percent.
Eligibility Criteria forState UI Programs
To ascertain how individual states would treat specific circumstances thatmight be particularly applicable to low-wage workers, and to formerwelfare recipients, we sent a questionnaire to state UI directors. For themost part, the questionnaire presented hypothetical situations related tounemployed workers, and asked the UI directors to determine whether theunemployed worker could qualify for UI benefits in their state program. Wereceived responses from all 50 states.
Page 48 GAO-01-181 Unemployment Insurance
Appendix I
Scope and Methodology
Status of State UIPrograms
To assess whether state UI programs had changed in the 4-year periodsince welfare reforms, we reviewed the Department of Labor’s compilationof legislative changes in state UI laws from all 50 states.
To examine the current status of the state UI programs, we includedquestions about the operation of UI programs in our survey of the state UIdirectors. We also visited four states—California, Texas, New York, andFlorida—to talk with officials about the state UI program. We chose thesestates not only because they were the most populous states but alsobecause they presented contrasts in how they manage their UI programs.
Page 49 GAO-01-181 Unemployment Insurance

Appendix II
State Responses to GAO Questionnaire on UIEligibility AppendixII
In June 2000, we sent a questionnaire to the UI directors for the 50 states. Inthis appendix, we present the questions that we discuss in our report anddata on how each state responded.
Question 2: Does your state have an alternative base period?
Question 4: (If the state had no alternative base period) In your opinion,how likely or unlikely is it that your state will adopt an alternative baseperiod in the near future?
Questions 5, 6, and 7 dealt with personal circumstances for quitting a job.For each question, the respondent was asked to assume that (a) the workerhas quit a job as a stockroom clerk with a retail chain store; (b) theworker’s reasons for leaving the job are compelling and not the fault of theworker; (c) the worker is otherwise eligible to receive UI benefits.
Question 5: The worker quits because child care suddenly becomesunavailable and the employer cannot reschedule the worker’s hours.Subsequently, child care becomes available. The worker files for UI.
Alternative base period No alternative base period
11 states: MA, ME, MI, NC, NJ, NY, OH, RI, VT, WA, WI 39 states: AK, AL AR, AZ, CA, CO, CT, DE, FL, GA, HI, IA, ID, IL,IN, KS, KY, LA, MD, MN, MO, MS, MT, ND, NE, NH, NM, NV, OK,OR, PA, SC, SD,TN, TX, UT, VA, WV, WY
Very unlikely Unlikely As likely as unlikely Likely Don’t know
9 states: AZ, DE, KY, LA,MD, MO, NE, NH, UT
20 states: AL, AR, CO,FL, GA, HI, ID, IL, KS,MS, MT, NV, OK, OR, PA,SD, TN, TX, WV, WY
7 states: CA, CT, IA, IN,MN, NM, VA
1 state: AK 2 states: ND, SC
Immediately eligibleEligible after waiting for afixed period Ineligible No response
13 states: AK, AR, AZ, CA, HI,IA, KS, MA, NY, OR, PA, RI, VA
4 states: MD, NE, WA, WY 32 states: AL, CO, CT, DE, FL,GA, ID, IL, IN, KY, LA, ME, MI,MN, MO, MS, MT, NC, ND, NH,NJ, NM, NV, OH, OK, SC, SD,TN, TX, UT, VT, WI
1 state: WV
Page 50 GAO-01-181 Unemployment Insurance
Appendix II
State Responses to GAO Questionnaire on UI
Eligibility
Question 6: The worker was originally hired to work during the day shift.However, the employer requires that the worker change work hours to anight shift, and the worker quits because child care is unavailable duringthe night shift.
Question 7: The worker quits to care for a sick child (physician certifiesneed). Subsequently, the worker is available to resume work. The workerfiles for UI.
Questions 8, 9, and 10 dealt with the requirement that a worker be “able andavailable” for work. For each question, it is assumed that the worker’sprevious job was a stockroom clerk in a retail chain store, that the workerwas laid off this job, and that the worker is otherwise eligible to receive UI.
Question 8: In her prior job, the worker was employed part-time, for 30hours a week. When she applies for UI and is asked whether she isavailable for work, she indicates that she is looking for work with the samehours as those of her previous job and is not able to work more hours thanpreviously.
Eligible Ineligible
41 states: AK, AL, AR, AZ, CA, CT, DE, FL, HI, IA, IL, IN, KS, KY,LA, MA, MD, MN, MO, MS, MT, NC, ND, NE, NH, NJ, NM, NY, OK,PA, RI, SC, SD, TN, TX, UT, VT, WA, WI, WV, WY
9 states: CO, GA, ID, ME, MI, NV, OH, OR, VA
Immediately eligible Eligible after waiting a fixed period Ineligible
22 states: AK, AR, AZ, CA, CT, HI, IA, IL,KS, MA, MD, ME, NY, OK, OR, PA, RI, TX,UT, VA, WA, WI
2 states: NC, NE 26 states: AL, CO, DE, FL, GA, ID, IN, KY,LA, MI, MN, MO, MS, MT, ND, NH, NJ, NM,NV, OH, SC, SD, TN, VT, WV, WY
Eligible Ineligible
20 states: AR, CO, DE, FL, HI, IA, KS, LA, MA, MN, ND, NE, NV,NY, OK, PA, SD, TN, VT, WY
30 states: AK, AL, AZ, CA, CT, GA, ID, IL, IN, KY, MD, ME, MI, MO,MS, MT, NC, NH, NJ, NM, OH, OR, RI, SC, TX, UT, VA, WA, WI,WV
Page 51 GAO-01-181 Unemployment Insurance
Appendix II
State Responses to GAO Questionnaire on UI
Eligibility
Question 9: The worker is available to work full-time during the weekdays.However, she cannot work evenings or weekends because of the lack ofaffordable child care at that time. As a result, the worker is unable to takejobs that require that she work evenings or weekends.
Question 10: The worker is available to work full-time but always relies onpublic transportation to get to work. The worker is therefore unable to takejobs that require work during a night shift because public transportation isgenerally not available during night hours.
Eligible Ineligible No response
38 states: AK, AR, AZ, CA, CT, DE, FL, GA,HI, IA, IL, IN, KS, LA, MA, MD, MN, MO, MS,NC, ND, NE, NH, NJ, NM, NV, NY, OK, PA,RI, SC, SD, TN, UT, VT, WA, WI, WY
10 states: AL, CO, ID, KY, ME, MI, MT, OH,OR, TX
2 states: VA, WV
Eligible Ineligible No response
41 states: AK, AR, AZ, CA, CT, DE, FL, GA,HI, IA, IL, IN, KS, KY, LA, MA, MD, MI, MN,MO, MS, MT, NC, ND, NE, NH, NJ, NM, NV,NY, OK, OR, PA, RI, SC, SD, TN, UT, VT,WA, WI
6 states: AL, CO, ID, ME, OH, TX 3 states: VA, WV, WY
Page 52 GAO-01-181 Unemployment Insurance
Appendix III
Comments From the Department of Labor AppendixIII
Page 53 GAO-01-181 Unemployment Insurance

Appendix III
Comments From the Department of Labor
Page 54 GAO-01-181 Unemployment Insurance
Appendix IV
GAO Contacts and Staff Acknowledgments AppendixIV
GAO Contacts Gale C. Harris, (202) 512-7235Nancy M. Peters, (202) 512-9065
Staff Acknowledgments In addition, Michelle C. Verbrugge, Richard Kelley, Grant M. Mallie, Joan K.Vogel, and Andrew M. Davenport made key contributions to this report.
Page 55 GAO-01-181 Unemployment Insurance
Related GAO Products
Welfare Reform: States’ Implementation and Effects on the WorkforceDevelopment System (GAO/T-HEHS-99-190, Sept. 9, 1999).
Welfare Reform: States’ Implementation Progress and Information onFormer Recipients (GAO/T-HEHS-99-116, May 27, 1999).
Welfare Reform: Information on Former Recipients’ Status (GAO/HEHS-99-48, Apr. 28, 1999).
Welfare Reform: States’ Experiences in Providing Employment Assistanceto TANF Clients (GAO/HEHS-99-22, Feb. 26, 1999).
Welfare Reform: States Are Restructuring Programs to Reduce WelfareDependence (GAO/HEHS-98-109, June 17, 1998).
Unemployment Insurance: Program’s Ability to Meet ObjectivesJeopardized (GAO/HRD-93-107, Sept. 28, 1993).
Page 56 GAO-01-181 Unemployment Insurance
(205510) Letter
Ordering Information The first copy of each GAO report is free. Additional copies ofreports are $2 each. A check or money order should be made out tothe Superintendent of Documents. VISA and MasterCard creditcards are accepted, also.
Orders for 100 or more copies to be mailed to a single address arediscounted 25 percent.
Orders by mail:U.S. General Accounting OfficeP.O. Box 37050Washington, DC 20013
Orders by visiting:Room 1100700 4th St. NW (corner of 4th and G Sts. NW)U.S. General Accounting OfficeWashington, DC
Orders by phone:(202) 512-6000fax: (202) 512-6061TDD (202) 512-2537
Each day, GAO issues a list of newly available reports andtestimony. To receive facsimile copies of the daily list or any listfrom the past 30 days, please call (202) 512-6000 using a touchtonephone. A recorded menu will provide information on how to obtainthese lists.
Orders by Internet:For information on how to access GAO reports on the Internet,send an e-mail message with “info” in the body to:
or visit GAO’s World Wide Web home page at:
http://www.gao.gov
To Report Fraud,Waste, or Abuse inFederal Programs
Contact one:
• Web site: http://www.gao.gov/fraudnet/fraudnet.htm
• e-mail: [email protected]
• 1-800-424-5454 (automated answering system)


United StatesGeneral Accounting OfficeWashington, D.C. 20548-0001
Official BusinessPenalty for Private Use $300
Address Correction Requested
Bulk RatePostage & Fees Paid
GAOPermit No. GI00


