Accessible Version PEDESTRIANS AND CYCLISTS Cities, States, and DOT Are Implementing Actions to Improve Safety Report to Congressional Requesters November 2015 GAO-16-66 United States Government Accountability Office
Transcript
Accessible Version
PEDESTRIANS AND CYCLISTS
Cities, States, and DOT Are Implementing Actions to Improve Safety
Report to Congressional Requesters
November 2015
GAO-16-66
United States Government Accountability Office
United States Government Accountability Office
Highlights of GAO-16-66, a report to congressional requesters
November 2015
PEDESTRIANS AND CYCLISTS Cities, States, and DOT Are Implementing Actions to Improve Safety
Why GAO Did This Study Walking and biking are becoming increasingly popular modes of transportation: nearly a million more people reported walking or biking to work in 2013 than in 2005. While total traffic fatalities declined from 2004 through 2013 (the most recent year for which data are available), this was not matched by a similar decline in pedestrian and cyclist fatalities. GAO was asked to review pedestrian and cyclist safety data and challenges in addressing this issue. This report examines: (1) trends in pedestrian and cyclist fatalities and injuries from 2004 through 2013 and characteristics of these fatalities and injuries; (2) safety initiatives selected states and cities have implemented and their views on challenges in addressing this issue; and (3) actions taken by DOT to help improve safety.
GAO analyzed DOT data on pedestrian and cyclist fatalities and injuries from 2004 through 2013. GAO also reviewed relevant documents and reports, and interviewed officials from DOT; three states (California, Florida, New York); the District of Columbia; six cities (Austin, Texas; Jacksonville, Florida; Minneapolis, Minnesota; New York City, New York; Portland, Oregon; San Francisco, California); and 22 non-governmental organizations with an interest in pedestrian and cyclist safety. States and cities were selected based on number of fatalities, walking and cycling activity, and recommendations from non-governmental organizations. Non-governmental organizations were selected to reflect a range of expertise. DOT reviewed a draft of this report and provided a technical comment, which was incorporated.
What GAO Found Pedestrian and cyclist fatalities and injuries represent a growing percentage of all traffic fatalities and injuries. For example, pedestrian fatalities comprised 10.9 percent of all traffic deaths nationwide in 2004, but 14.5 percent in 2013. Cyclists represented 1.7 percent of all United States traffic deaths in 2004, but 2.3 percent in 2013. Estimates of pedestrian and cyclist injuries also grew during this same time frame. In 2013, most traffic crashes that resulted in a pedestrian’s or cyclist’s death involved men, occurred in urban areas, happened in clear weather conditions, and most frequently took place between 6:00 p.m. and 9:00 p.m. Various factors—working separately or in combination—may have contributed to these fatalities and injuries, including increased walking and cycling trips; alcohol use; distracted road users; or road design practices.
Officials from states and cities in GAO’s review reported that they have implemented a number of efforts, but face challenges in addressing pedestrian and cyclist safety. For example, states and cities reported collecting and analyzing data on walking and cycling activity and crashes to develop safety efforts. Officials said that a variety of engineering standards have been used to design more walking or cycling facilities, such as sidewalks or bike lanes. State and city officials also reported implementing education and enforcement initiatives. In addition, three jurisdictions reported that they implemented Vision Zero programs, which are comprehensive initiatives to integrate data collection, engineering, education, and enforcement actions. However, state and city officials GAO interviewed most often cited challenges with prioritization, data, engineering, and funding in addressing pedestrian and cyclist safety. Prioritizing safety in this area can be difficult according to officials because of, for example, differing state and city perspectives on transportation investments. Limited or no walking and cycling trip data or incomplete and unreliable crash data also hinder efforts, according to many officials. Problems with existing roadways, such as wide lanes that may encourage drivers to speed and limited pedestrian and cyclist facilities, were also indicated as safety challenges. Officials also noted that funding issues can limit the ability to address pedestrian and cyclist safety. These challenges may be interrelated: according to some officials, limited data on walking and cycling trips can hinder the development of a performance-based approach, which could assist jurisdictions in prioritizing pedestrian and cycling safety.
The U.S. Department of Transportation (DOT) has implemented and is planning to take further actions to help improve pedestrian and cyclist safety. For example, the Mayors’ Challenge—part of DOT’s Safer People, Safer Streets initiative—encourages officials to prioritize pedestrian and cyclist safety. On data collection, DOT is leading a pilot project on trip-counting technologies and updating guidance for states on data to include in crash reports. On engineering efforts, DOT issued a memorandum supporting flexibility in the design of pedestrian and cyclist facilities, as well as guidance to help reduce motorist speed. DOT oversees 13 funding programs that can award funds—$676.1 million in 2013—to be used toward pedestrian and cyclist safety. Given the increase in walking and cycling activity and the percentage of pedestrian and cyclist fatalities and injuries, it will be important that efforts such as these continue.
View GAO-16-66. For more information, contact Susan Fleming at (202) 512-2834 or [email protected].
Background 3 Pedestrians and Cyclists Represent a Growing Percentage of All
Traffic Fatalities and Injuries, and Various Factors May Have Contributed to Fatalities and Injuries 7
Selected States and Cities Reported Having Implemented Pedestrian and Cyclist Safety Efforts, but Face Various Challenges 16
DOT Is Implementing Actions That May Help Improve Pedestrian and Cyclist Safety 25
Agency Comments 34
Appendix I: Objectives, Scope, and Methodology 36
Appendix II: Comments from the Department of Transportation 41
Appendix III: GAO Contacts and Staff Acknowledgments 43
Appendix IV: Accessible Data 44
Data Table 44 Agency Comment Letters 46
Tables
Table 1: United States Pedestrian, Cyclist, and All Traffic Fatalities and Estimated Injuries, 2004 through 2013 8
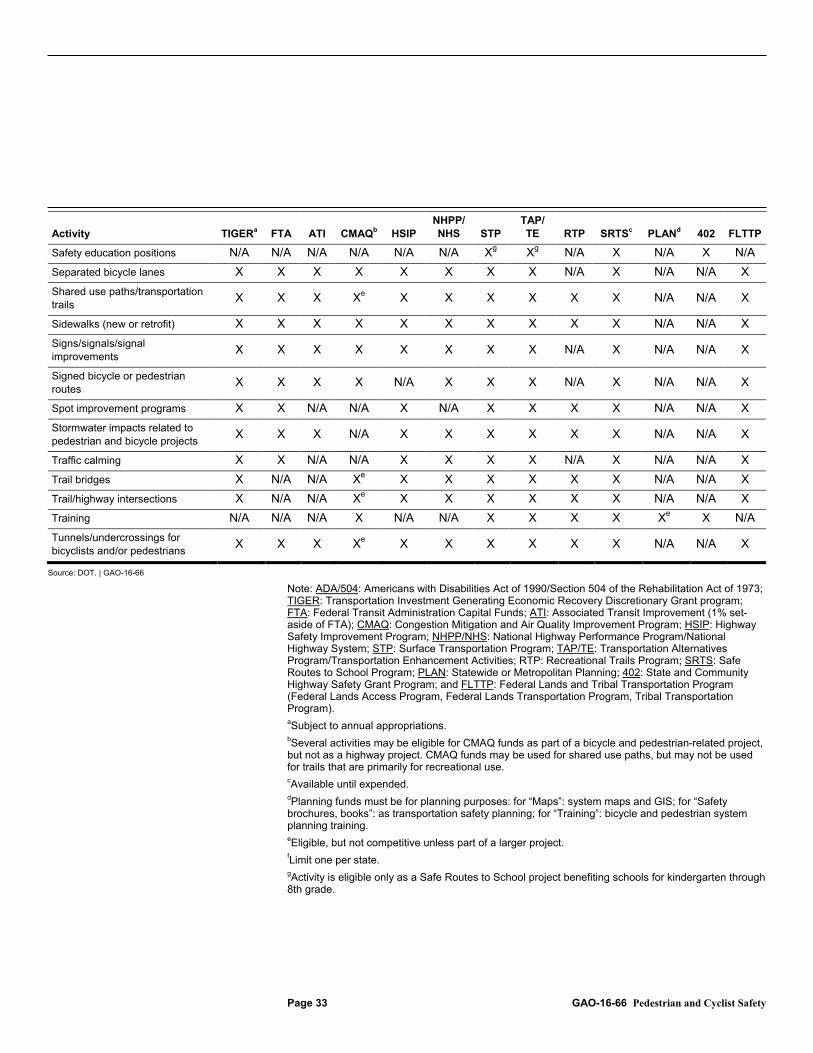
Table 2: DOT Funding Programs That Can Be Used for Pedestrian and Bicycle Projects as of October 2015 32
Data Table for Figure 2: Pedestrian and Cyclist Fatalities as a Percentage of All Traffic Fatalities, 2004 through 2013 44
Data Table for Figure 3: Pedestrian Fatalities by Gender, Age, Type of Area, Light Condition, and Time of Day, 2013 44
Data Table for Figure 4: Cyclist Fatalities by Gender, Age, Type of Area, Light Condition, and Time of Day, 2013 45
Figures
Figure 1: Examples of Cyclist Road Markings and Facilities 6 Figure 2: Pedestrian and Cyclist Fatalities as a Percentage of All Traffic
Fatalities, 2004 through 2013 9
Contents
Figure 3: Pedestrian Fatalities by Gender, Age, Type of Area, Light Condition, and Time of Day, 2013 11
Figure 4: Cyclist Fatalities by Gender, Age, Type of Area, Light Condition, and Time of Day, 2013 13
Page ii GAO-16-66 Pedestrian and Cyclist Safety
Abbreviations AASHTO American Association of State Highway and Transportation Officials ACS American Community Survey BAC blood alcohol concentration DOT Department of Transportation FARS Fatality Analysis Reporting System FHWA Federal Highway Administration g/dL grams per deciliter ITE Institute of Transportation Engineers MMUCC Model Minimum Uniform Crash Criteria MPO metropolitan planning organization NACTO National Association of City Transportation Officials NASS-GES National Automotive Sampling System–General Estimates
System NHTSA National Highway Traffic Safety Administration
Page iii GAO-16-66 Pedestrian and Cyclist Safety
This is a work of the U.S. government and is not subject to copyright protection in the United States. The published product may be reproduced and distributed in its entirety without further permission from GAO. However, because this work may contain copyrighted images or other material, permission from the copyright holder may be necessary if you wish to reproduce this material separately.
Page 1 GAO-16-66 Pedestrian and Cyclist Safety
441 G St. N.W. Washington, DC 20548
November 19, 2015
The Honorable Peter A. DeFazio Ranking Member Committee on Transportation and Infrastructure House of Representatives
The Honorable Eleanor Holmes Norton Ranking Member Subcommittee on Highways and Transit Committee on Transportation and Infrastructure House of Representatives
The Honorable Rick Larsen House of Representatives
Walking and biking are becoming increasingly popular modes of transportation; nearly a million more people reported walking or biking to work in 2013 than in 2005, according to data from the U.S. Census Bureau. However, while overall traffic fatalities steadily declined from 2004 through 2013 (the most recent year for which data are available), this was not matched by a similar decline in pedestrian and cyclist fatalities.1 You asked us to review pedestrian and cyclist fatality and injury data and challenges to improving the safety of these vulnerable road users. This report examines: (1) the trends in pedestrian and cyclist fatalities and injuries from 2004 through 2013 and other characteristics of these fatalities and injuries; (2) pedestrian and cyclist safety efforts implemented by selected states and cities and their views on challenges in addressing this issue; and (3) actions taken by the U.S. Department of Transportation (DOT) to improve pedestrian and cyclist safety.
To conduct this work, we analyzed characteristics of pedestrian and cyclist fatalities, injuries, and trips over the last decade using 2004 through 2013 data from DOT’s National Highway Traffic Safety Administration’s (NHTSA) Fatality Analysis Reporting System (FARS) and
1The term “pedestrian” includes any person traveling by foot and any mobility impaired person using a wheelchair. We use the term “cyclist” to refer to pedalcyclists and other cyclists, meaning a person on a vehicle that is powered solely by pedals.
Letter
National Automotive Sampling System–General Estimates System (NASS-GES), and 2005 (the first year of available data) through 2013 data from the U.S. Census Bureau.
Page 2 GAO-16-66 Pedestrian and Cyclist Safety
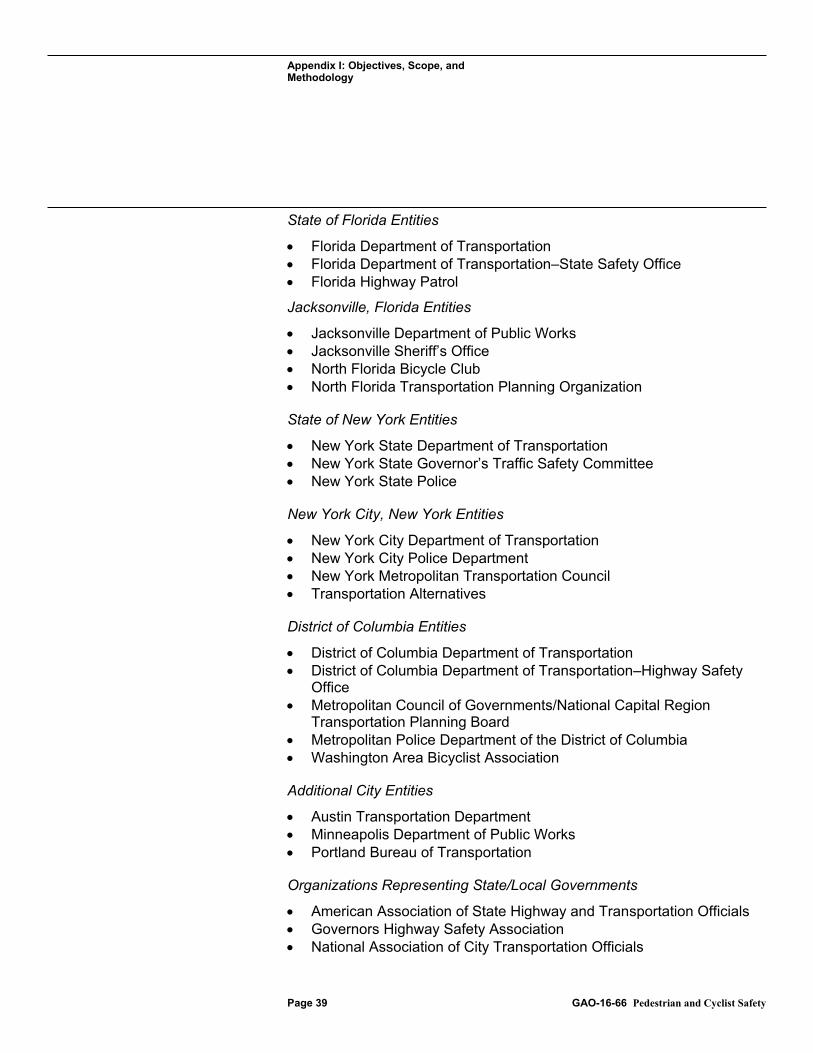
2 We determined that the data were sufficiently reliable for the purposes of this report by reviewing related documentation and interviewing knowledgeable agency officials. We also reviewed DOT documents, highway design guides, reports, and other relevant documents. We interviewed transportation officials in three states, the District of Columbia, and six cities on efforts implemented and challenges faced in addressing pedestrian and cyclist safety using a semi-structured set of interview questions. We also interviewed representatives of 22 relevant non-governmental organizations, including organizations involved in transportation engineering and design, cycling and walking organizations, and organizations representing state and local governments, regional and local planners, and law enforcement and other issues. The states (California, Florida, and New York); District of Columbia; and cities (Austin, Texas; Jacksonville, Florida; Minneapolis, Minnesota; New York City, New York; Portland, Oregon; San Francisco, California) were selected based on criteria that included both high and low numbers of pedestrian and cyclist fatalities, high percentages of populations reporting walking or cycling to work, and recommendations from non-governmental organizations. We selected non-governmental organizations with an interest in pedestrian and cyclist safety to reflect a range of expertise on this issue. These interviews are not generalizable to all transportation agencies or non-governmental organizations; however, the information provided a range of perspectives on efforts and challenges associated with pedestrian and cyclist safety. We also interviewed officials from NHTSA and from DOT’s Federal Highway Administration (FHWA) on actions taken to address pedestrian and cyclist safety. Appendix I provides further detail on the objectives, scope, and methodology for this review.
We conducted this performance audit from January 2015 to November 2015 in accordance with generally accepted government auditing standards. Those standards require that we plan and perform the audit to obtain sufficient, appropriate evidence to provide a reasonable basis for
2FARS is a census of all fatal traffic crashes in the United States that provides uniformly coded, national data on police-reported fatalities. NASS-GES consists of data collected from an annual sample of about 50,000 police accident reports and is statistically weighted to be nationally representative of all police-reported crashes that occur in the United States each year. For more information, see appendix I.
our findings and conclusions based on our audit objectives. We believe that the evidence obtained provides a reasonable basis for our findings and conclusions based on our audit objectives.
Walking and cycling as a means of commuting to work has generally increased in recent years. According to the U.S. Census Bureau’s American Community Survey (ACS), in 2013, an estimated 4 million Americans reported commuting to work in the past week by walking and approximately 860,000 reported using a bicycle.
Page 3 GAO-16-66 Pedestrian and Cyclist Safety
3 These numbers have risen since 2005, the first year of available data: in 2005, an estimated 3.3 million people reported their primary method of commuting to work in the past week was by walking and approximately 530,000 reported using a bicycle.4 The percentage of the population who reported commuting to work in the previous week by walking or cycling can vary from location to location. For example, in 2013, an estimated 2.7 percent of California residents reported that they primarily traveled to work by walking, while 6.4 percent of New York State residents reported primarily walking to work.5 The percentage of Americans commuting to work by walking or cycling may be higher than reported by the ACS. The ACS asks respondents to choose the primary means of how they traveled to work—and not recreation or other trips—in the previous week, and notes that if a respondent used more than one transportation mode they are to select the mode used for most of the distance. Some entities we spoke with indicated that by allowing respondents to select only a single transportation mode, ACS undercounts trips in which more than one mode is used. For example, if an individual commuted to work from home by cycling 1 mile to a subway station, riding a subway for 10 miles, and then walking 0.25 miles to his office, that individual would select the “Subway” response on the ACS even though three transportation modes were used.
While officials from some of the entities we spoke with noted that pedestrian and cyclist safety is generally considered to be primarily a
3The 90 percent confidence intervals are (3,859,900, 4,146,000) and (714,800, 1,000,800) respectively. This is the interval that would contain the actual population values for 90 percent of the ACS samples that the U.S. Census Bureau could have drawn. 4The 90 percent confidence intervals are (3,194,100, 3,460,400) and (399,200, 665,500) respectively. 5The 90 percent confidence intervals are (2.6%, 2.8%) and (6.2%, 6.6%) respectively.
Background
local government issue, multiple federal, state, and local government agencies, as well as non-governmental organizations, contribute efforts to improve safety in this area. The federal government—primarily through DOT’s NHTSA and FHWA—sets national transportation policies pertaining to highway safety, awards transportation funding to states for distribution to projects and localities, collects and reports crash data, and provides guidance and technical assistance to state and local agencies. For example, in 2015 FHWA issued the Separated Bike Lane Planning and Design Guide to assist transportation agencies in planning and designing separated bike lanes.
Page 4 GAO-16-66 Pedestrian and Cyclist Safety
6 Additionally, NHTSA’s National Center for Statistics and Analysis collects and analyzes data to support the agency’s motor vehicle and highway safety activities. State agencies—such as state DOTs, highway safety offices, and police—plan, design, and construct transportation facilities (such as roadways); distribute federal and state funds to local agencies to construct pedestrian and cyclist facilities (such as sidewalks or bike lanes); and assist in education and enforcement efforts. Additionally, state DOTs are required, under FHWA’s Highway Safety Improvement Program, to create a strategic highway safety plan, a statewide coordinated safety plan that provides a framework for reducing highway fatalities and serious injuries on all public roads. In addition, each year each state is required to develop a highway safety plan, which is separate from but coordinated with the strategic highway safety plan. Local agencies—such as city DOTs, local police departments, or metropolitan planning organizations (MPO)—can use federal, state, and local funding to design and construct pedestrian and cyclist facilities, enforce traffic laws, and educate the public on traffic safety. Other entities also contribute toward pedestrian and cyclist safety, including non-governmental organizations that focus on developing best practices and proposing standards for transportation; biking and walking; engineering and design; planning; and law enforcement. For example, the American Association of State Highway and Transportation Officials (AASHTO) has published guidance—such as the Guide for the Planning, Design, and Operation of Pedestrian Facilities and the Guide for the Development of Bicycle Facilities—to assist transportation engineers in designing
6FHWA, Separated Bike Lane Planning and Design Guide, FHWA-HEP-15-025 (May 2015).
pedestrian and cyclist facilities.
Page 5 GAO-16-66 Pedestrian and Cyclist Safety
7 According to DOT officials, states adopt standards based on these guides or equivalent guides.
Different transportation facilities can be used to accommodate pedestrians, cyclists, motorists and others. For example, there are several types of pedestrian facilities that allow pedestrians to safely walk to their destination and cross roadways when necessary, including sidewalks, crosswalks, and crossing signals. There are several types of cyclist facilities, which are generally differentiated by the separation of cyclists from motorists (see fig. 1). For example, “shared lane markings” may be used to emphasize to motorists that a travel lane is to be used by motorists and cyclists (e.g., when the lane is too narrow for a car to drive side-by-side with a bicyclist). On the other hand, a “separated bike lane” provides a barrier—such as a raised curb or planter—to physically separate cyclists from motor vehicle traffic.
7AASHTO, Guide for the Planning, Design, and Operation of Pedestrian Facilities, GPF-1 (Washington, D.C.: July 2004) and AASHTO, Guide for the Development of Bicycle Facilities, GBF-4 (Washington, D.C.: 2012).
Figure 1: Examples of Cyclist Road Markings and Facilities
Page 6 GAO-16-66 Pedestrian and Cyclist Safety
Page 7 GAO-16-66 Pedestrian and Cyclist Safety
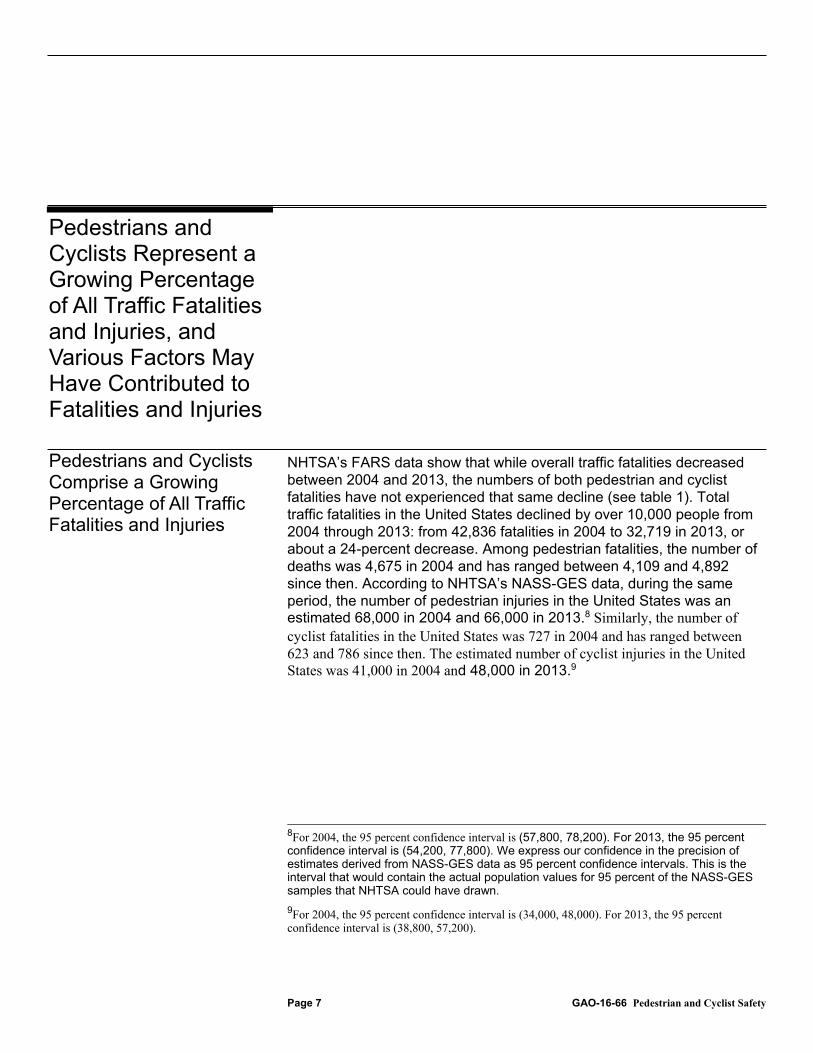
NHTSA’s FARS data show that while overall traffic fatalities decreased between 2004 and 2013, the numbers of both pedestrian and cyclist fatalities have not experienced that same decline (see table 1). Total traffic fatalities in the United States declined by over 10,000 people from 2004 through 2013: from 42,836 fatalities in 2004 to 32,719 in 2013, or about a 24-percent decrease. Among pedestrian fatalities, the number of deaths was 4,675 in 2004 and has ranged between 4,109 and 4,892 since then. According to NHTSA’s NASS-GES data, during the same period, the number of pedestrian injuries in the United States was an estimated 68,000 in 2004 and 66,000 in 2013.8 Similarly, the number of cyclist fatalities in the United States was 727 in 2004 and has ranged between 623 and 786 since then. The estimated number of cyclist injuries in the United States was 41,000 in 2004 and 48,000 in 2013.9
8For 2004, the 95 percent confidence interval is (57,800, 78,200). For 2013, the 95 percent confidence interval is (54,200, 77,800). We express our confidence in the precision of estimates derived from NASS-GES data as 95 percent confidence intervals. This is the interval that would contain the actual population values for 95 percent of the NASS-GES samples that NHTSA could have drawn. 9For 2004, the 95 percent confidence interval is (34,000, 48,000). For 2013, the 95 percent confidence interval is (38,800, 57,200).
Pedestrians and Cyclists Represent a Growing Percentage of All Traffic Fatalities and Injuries, and Various Factors May Have Contributed to Fatalities and Injuries
Pedestrians and Cyclists Comprise a Growing Percentage of All Traffic Fatalities and Injuries
Table 1: United States Pedestrian, Cyclist, and All Traffic Fatalities and Estimated Injuries, 2004 through 2013
Sources: FARS for fatalities; NASS-GES for estimated injuries. | GAO-16-66
Note: Estimated injury totals are derived from NASS-GES data and have sampling error associated with them. For total injuries, the estimates have a sampling error of no larger than plus or minus 306,400 at the 95 percent level of confidence. For pedestrian injuries, the estimates have a sampling error of no larger than plus or minus 12,100 at the 95 percent level of confidence. For cyclist injuries, the estimates have a sampling error of no larger than plus or minus 9,800 at the 95 percent level of confidence.
Further, pedestrian and cyclist fatalities and injuries represent a growing percentage of all traffic fatalities and injuries. Specifically, NHTSA’s FARS data show that pedestrian fatalities comprised 10.9 percent of all traffic deaths nationwide in 2004, but represented 14.5 percent of all traffic fatalities in 2013 (see fig. 2). Data from NHTSA’s NASS-GES show that pedestrian injuries represented an estimated 2.4 percent of all traffic injuries in 2004, but an estimated 2.9 percent in 2013.10 Likewise, cyclist fatalities comprised 1.7 percent of all United States traffic deaths in 2004, but represented 2.3 percent of all traffic fatalities in 2013. Cyclists represented an estimated 1.5 percent of traffic injuries in 2004, and increased to an estimated 2.1 percent of all traffic injuries in 2013.11
10For 2004, the 95 percent confidence interval is (2.0%, 2.9%). For 2013, the 95 percent confidence interval is (2.2%, 3.5%). 11For 2004, the 95 percent confidence interval is (1.2 %, 1.8%). For 2013, the 95 percent confidence interval is (1.6%, 2.6%).
Figure 2: Pedestrian and Cyclist Fatalities as a Percentage of All Traffic Fatalities,
Page 9 GAO-16-66 Pedestrian and Cyclist Safety
2004 through 2013
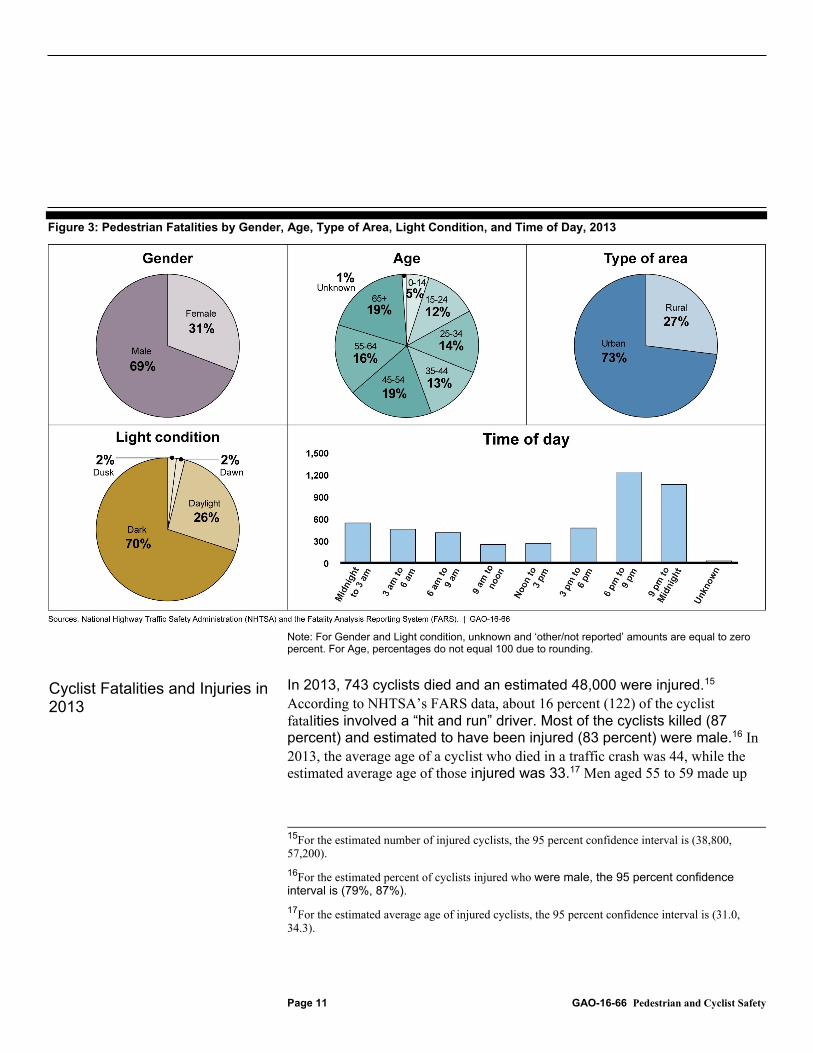
In 2013, 4,735 pedestrians died and an estimated 66,000 were injured.12 NHTSA’s FARS data further show that about one-fifth of these pedestrian fatalities (18.7 percent, or 885 persons) involved a “hit and run,” where the driver of the vehicle fled the scene. The average age of a pedestrian killed in a traffic crash was 46, while the estimated average age of a pedestrian injured was 36.13 More than two-thirds (69 percent) of the pedestrians who died in traffic crashes in 2013 were male. Men aged 50 to 54 made up the largest number of pedestrian fatalities (336). Children 14 and under comprised 236 pedestrian fatalities in 2013. People 65 and older represented 19
12For the estimated number of injured pedestrians, the 95 percent confidence interval is (54,200, 77,800). 13For the estimated average age of injured pedestrians, the 95 percent confidence interval is (33.0, 38.5).
Pedestrian Fatalities and Injuries in 2013
percent (896) of the pedestrian fatalities in 2013 and an estimated 10 percent of pedestrians injured.
Page 10 GAO-16-66 Pedestrian and Cyclist Safety
14
Most traffic crashes that resulted in a pedestrian death occurred in urban areas, happened in clear weather conditions, and most frequently took place between 6:00 p.m. and 9:00 p.m. Most pedestrian fatalities (73 percent) occurred in urban, rather than rural, areas. Additionally, most of the fatalities that occurred in both urban and rural areas (2,692) took place on an “other principal arterial road” (i.e., a major street or highway, often with multi-lane or freeway design, that serves high-volume traffic corridor movement) or local road (i.e., a road with a primary purpose of feeding larger roads and providing direct access with little or no through traffic). Most pedestrian deaths (69 percent) occurred at a non-intersection location, such as in the middle of a block. Pedestrian fatalities occurred most frequently (26 percent) between the hours of 6:00 p.m. and 9:00 p.m., or 9:00 p.m. to midnight (23 percent). Most pedestrian fatalities (70 percent) occurred while it was dark outside. Furthermore, of the fatalities occurring when dark, about 50 percent occurred when a form of artificial light, such as a streetlight, was present. Most pedestrian deaths (3,840) occurred when there were no adverse weather conditions such as rain or snow. Figure 3 summarizes some of the characteristics of the pedestrian deaths that occurred in 2013.
14For the estimated percentage of pedestrians injured who were age 65 and older, the 95 percent confidence interval is (6.2%, 14%).
Figure 3: Pedestrian Fatalities by Gender, Age, Type of Area, Light Condition, and Time of Day, 2013
Page 11 GAO-16-66 Pedestrian and Cyclist Safety
Note: For Gender and Light condition, unknown and ‘other/not reported’ amounts are equal to zero percent. For Age, percentages do not equal 100 due to rounding.
In 2013, 743 cyclists died and an estimated 48,000 were injured.15 According to NHTSA’s FARS data, about 16 percent (122) of the cyclist fatalities involved a “hit and run” driver. Most of the cyclists killed (87 percent) and estimated to have been injured (83 percent) were male.16 In 2013, the average age of a cyclist who died in a traffic crash was 44, while the estimated average age of those injured was 33.17 Men aged 55 to 59 made up
15For the estimated number of injured cyclists, the 95 percent confidence interval is (38,800, 57,200). 16For the estimated percent of cyclists injured who were male, the 95 percent confidence interval is (79%, 87%). 17For the estimated average age of injured cyclists, the 95 percent confidence interval is (31.0, 34.3).
Cyclist Fatalities and Injuries in 2013
the largest number of cyclist fatalities (91). Children 14 and under comprised 52 cyclist fatalities in 2013. People 65 and older represented 13 percent (100) of the cyclist fatalities in 2013 and an estimated 5 percent of cyclists injured.
Page 12 GAO-16-66 Pedestrian and Cyclist Safety
18
Most traffic crashes that resulted in a cyclist death in 2013 occurred in urban areas, happened in clear weather conditions, and most frequently took place between 6:00 p.m. and 9:00 p.m. Similar to pedestrians, most cyclist fatalities (68 percent) occurred in urban areas and on a principal arterial or local road. Additionally, most cyclist fatalities (57 percent) occurred at a non-intersection location. In 2013, cyclist deaths occurred most frequently (22 percent) between the hours of 6:00 p.m. and 9:00 p.m. Unlike pedestrians, more cyclists (405) died during daylight rather than in the dark. Of the cyclists killed when it was dark outside, about 50 percent of these fatalities occurred when a form of artificial light, such as a streetlight, was present. Most (80 percent) cyclist fatalities occurred during clear weather conditions. Figure 4 summarizes some of the characteristics of the cyclist fatalities that occurred in 2013.
18For the estimated percentage of injured cyclists aged 65 and older, the 95 percent confidence interval is (2.8%, 6.4%).
Figure 4: Cyclist Fatalities by Gender, Age, Type of Area, Light Condition, and Time of Day, 2013
Page 13 GAO-16-66 Pedestrian and Cyclist Safety
Note: For Gender and Light condition, unknown amounts are equal to zero percent.
Several factors—working separately or in combination—may have contributed to pedestrian or cyclist fatalities and injuries. Such factors include increased walking and cycling trips; alcohol use; distracted walking, cycling, and driving; and historical road design and engineering practices. While these factors were highlighted in the documents we reviewed and by some of the federal, state, or local officials we interviewed, other factors may also have contributed to a pedestrian or cyclist fatality or injury.
A greater number of people walking or cycling may have contributed to recent occurrences of a pedestrian or cyclist fatality or injury. As noted above, the U.S. Census Bureau’s ACS data for 2013 indicated that a greater number of people nationwide primarily walked or biked to work: some one million more people reported primarily commuting on foot or by bicycle since 2005. Potentially even more people may be walking or
Various Factors May Have Contributed to Pedestrian and Cyclist Fatalities and Injuries
Increased Walking and Cycling Trips
biking in general, as ACS data do not include recreational or other trips. This greater number of commuters may have had increased exposure to crashes, and thus an increased potential for fatalities and injuries. Conversely, however, a 2003 study indicates that when the numbers of pedestrians or cyclists in a particular location—such as a city block—increases, motorists may begin to expect to see pedestrians and cyclists in the roadway and the number of fatalities and injuries in that area decreases.
Page 14 GAO-16-66 Pedestrian and Cyclist Safety
19 According to the 2003 study, the greater number of pedestrians and cyclists in a concentrated area causes motorists to change their behavior. For example, motorists may drive at slower speeds or become more visually aware of pedestrians or cyclists sharing the roadway. As a result, the study argues, safety improves as more walking and cycling takes place and the number of fatalities and injuries may decrease.
While some data reliability issues limit the conclusions that can be drawn,20 available data suggest that alcohol use has been a contributing factor in traffic fatalities and injuries, including those involving pedestrians and cyclists. For example, according to NHTSA’s FARS data, in 2013, a blood alcohol concentration (BAC) level of 0.01 or higher by any party involved in a pedestrian or cyclist traffic death—pedestrians, cyclists, or motorists—was present in 49 percent of pedestrian fatalities and 34 percent of cyclist fatalities.21 Among the 2013 pedestrian fatalities, the motorist had a BAC of 0.08 or higher—which is considered alcohol impaired22—15 percent of the time, the pedestrian had a BAC of 0.08 or higher 34 percent of the time, and 6 percent of the time both the pedestrian and motorist had a BAC of 0.08 or higher. Among the 2013 cyclist deaths, the driver—according to DOT officials—had a BAC of 0.08 or higher 12 percent of the time, the cyclist 20 percent of the time, and either the driver or cyclist had a BAC of 0.08 or higher 29 percent of the time (there were some instances where both the rider and driver were impaired).
19Jacobsen, P.L., “Safety in numbers: more walkers and bicyclists, safer walking and bicycling,” Injury Prevention, vol. 9, no. 3 (2003). 20Blood alcohol concentration test results are not available for all drivers and nonoccupants (such as pedestrians or cyclists) involved in fatal crashes. 21BAC is measured as a mass of alcohol per volume of blood. In the United States, the standard measurement is represented as grams per deciliter (g/dL). 22Driving with a BAC at or above 0.08 is considered illegal per se in all fifty states. See http://www.ghsa.org/html/stateinfo/laws/impaired_laws.html (September 2015).
Alcohol Use
Distracted driving, walking, and cycling also may have contributed to pedestrian and cyclist fatalities and injuries. According to NHTSA, a distraction is a specific type of inattention that occurs when a driver diverts his or her attention from driving to focus on some other activity instead, such as using a cellular phone, text messaging, or eating. Nationwide, according to NHTSA FARS data, in 2013, 3,154 people died in motor vehicle crashes that were reported to have involved distracted driving, of whom 480 (15 percent) were pedestrians, cyclists, or other non-motorists. In 411 crashes involving a fatality in 2013 (14 percent of the 2,910 fatal distraction-affected crashes in that year), the motorist was distracted with a cell phone. Similar to motorists, when pedestrians and cyclists use cell phones or are otherwise distracted, they may be less aware of their surroundings and more likely to be involved in a crash.
According to FHWA officials, the purpose and goal of street design in the United States for decades was, in general, to move motor vehicles from their origins to their destinations as expeditiously as possible, and this design may have overlooked the needs of pedestrians and cyclists. Design efforts such as widening lanes or minimizing sharp curves may have contributed to motorist safety, but may also have contributed to declines in pedestrian and cyclist safety. Wider, straighter highways could lead to motorist speeding, which not only increases the likelihood of crashes with a pedestrian or cyclist, but also the probability that those crashes will cause death or a serious injury. More recently, however, transportation agencies are beginning to focus on ensuring that roads provide safe mobility for all travelers, not just motor vehicles. To do so, as discussed in the next section, transportation agencies may install facilities specific to pedestrian and cyclist use, such as separated bike lanes, which can make road users feel safer. For example, according to FHWA’s Separated Bike Lane Planning and Design Guide, since separated bike lanes are physically separated from vehicular traffic, almost all cyclists report feeling safer as a result of the separation.
Page 15 GAO-16-66 Pedestrian and Cyclist Safety
23
NHTSA collects and reports on other factors—such as failing to yield to another road user already in the roadway or improperly being in a roadway—that may have contributed to pedestrian or cyclist fatalities. For
23FHWA, Separated Bike Lane Planning and Design Guide, FHWA-HEP-15-025 (May 2015).
Distracted Driving, Walking, and Cycling
Historical Road Design and Engineering Practices
Other Factors
example, according to NHTSA FARS data, of the pedestrian deaths that occurred in 2013, 25 percent of those involved in the crash (i.e., pedestrians or motorists) were considered to have failed to yield to the other road user, 16 percent were improperly in the roadway, 16 percent were not visible to the driver, 15 percent were improperly crossing a roadway or intersection, 14 percent were under the influence of alcohol or drugs, and 13 percent were darting or running into the road. Similarly, of the related factors that contributed to cyclist deaths in 2013, 31 percent of the cyclists failed to yield to another road user; 11 percent failed to obey traffic signs, signals, or an officer; and 11 percent were not visible to the driver.
Page 16 GAO-16-66 Pedestrian and Cyclist Safety
Officials from the states and city governments included in our review highlighted a number of efforts aimed at collecting data, addressing engineering concerns, educating the public, and enforcing traffic laws, among other efforts to enhance pedestrian and cyclist safety.
· Data: Officials from all of our selected state and city governments told us their jurisdiction had conducted counts of walking and cycling activity or analyzed count and crash data to identify problems and develop actions to address safety problems. For example, several cities included in our review had efforts underway to count the number of pedestrians and cyclists using roadway facilities. These counts can be performed manually—in the field using trained personnel or video observation—or through automated counting equipment embedded in the roadway. For example, Portland operates several fixed, 24-hour counting stations on bridges that connect the east and west sides of the city over the Willamette River. These counting stations gather bike data in 15 minute increments every day of the year. Several state and city officials we spoke with have also analyzed crash data, such as
Selected States and Cities Reported Having Implemented Pedestrian and Cyclist Safety Efforts, but Face Various Challenges
Reported Efforts to Improve Safety Include Data Collection, Engineering, Education, and Enforcement
pre-crash maneuvers, the location (e.g., intersection or non-intersection), the time and date, and weather conditions.
Analysis of count or crash data has been used as the foundation for planning other safety activities, such as installing new transportation facilities, educating the public on safety issues, or enforcing traffic laws, according to most of the state and local officials we interviewed. For example, officials from the Portland Bureau of Transportation told us that they designed a program to address the safety concerns along 10 corridors, which includes public outreach and short-term safety improvements, based on the agency’s analysis of crash trends. The analysis identified these 10 arterial roadways, typically four- to five-lane roadways, which account for 3 percent of the roadway network, but 51 percent of pedestrian fatalities. Similarly, in 2013, the city of Minneapolis analyzed trip data and crash data from between 2000 and 2010 to better understand the causal factors behind nearly 3,000 crashes and to tailor education, engineering, and enforcement efforts to meet the city’s goal of reducing cyclist-motorist crashes by 10 percent annually.
Page 17 GAO-16-66 Pedestrian and Cyclist Safety
24
· Engineering: Most state and city officials—specifically those from planning agencies or departments of transportation—we interviewed told us that their jurisdictions consult a variety of engineering standards to help them determine the characteristics and technical details of pedestrian and cyclist facilities. For example, several officials said that they use guidance and highway design documents—such as AASHTO’s Pedestrian and Bike Guides, the National Association of City Transportation Officials’ (NACTO) Urban Bikeway Design Guide, and the Institute of Transportation Engineers’ (ITE) Designing Walkable Urban Thoroughfares: A Context Sensitive Approach—when designing pedestrian or cyclist facilities.25 Moreover, according to an official from one non-governmental organization we interviewed, there are several types of pedestrian and cyclist facilities within each design guide to select from, each representing varying
24City of Minneapolis Public Works Department, Understanding Bicyclist-Motorist Crashes in Minneapolis, Minnesota (January 2013). 25AASHTO, Guide for the Planning, Design, and Operation of Pedestrian Facilities, GPF-1 (July 2004); AASHTO, Guide for the Development of Bicycle Facilities, GPF-4 (2012); NACTO, Urban Bikeway Design Guide (2011); and ITE, Designing Walkable Urban Thoroughfares: A Context Sensitive Approach, RP-036A (2010).
costs for installation and maintenance. Additionally, several states and cities in our review have adopted “Complete Streets” policies that require transportation planners to consider designing roadway improvements to be used by all anticipated road users—including people walking, cycling, driving, or taking public transportation—and to enhance economic development opportunities for communities. Several state and city officials reported having installed pedestrian and cyclist facilities—such as marked crosswalks, pedestrian crossing islands, and separated bike lanes—within their jurisdictions. According to these officials, such facilities have contributed to improved traffic safety. For example, New York City Department of Transportation officials indicated that by 2014, 7 miles of separated or protected bicycle lanes installed on six avenues between 2007 and 2011 had yielded a 20 percent decline in overall injuries and a 2 percent decline in cyclist injuries even as bicycle volumes increased.
Page 18 GAO-16-66 Pedestrian and Cyclist Safety
26
· Education: Most state and city officials we interviewed told us about educational and outreach efforts to help raise public awareness of pedestrian and cyclist safety issues. For example, two states included in our review (California and Florida) have collaborative public health campaigns with universities and other agencies to educate the public about walking and cycling safety. In several jurisdictions, there have been concerted efforts to train public employees, drivers of buses, garbage trucks, or taxis about pedestrian and cyclist safety. Several state and city officials we interviewed also described distributing pamphlets; developing media advertising campaigns; or conducting outreach to some limited English-speaking populations to provide the public with information on pedestrian and cycling infrastructure, laws, and safety. Officials from several states and cities described having their law enforcement officers attend “bike rodeos” to teach safe riding and walking tips and to distribute helmets and other safety equipment to children and other participants. Additionally, officials from several law enforcement agencies noted that their officers undergo specific training on pedestrian and cyclist safety and traffic laws.
· Enforcement: According to officials from all of the state and city law enforcement agencies we interviewed, their agencies use crash data to identify high-frequency crash areas (e.g., corridors and intersections) and to target traffic enforcement campaigns in these
26This analysis was based on 5 years of data pre-installation and 3 years of data post-installation of the bicyclist lanes, according to New York City Department of Transportation officials.
locations. As part of enforcement campaigns, officers may warn violators for a period of time, before issuing citations. New York City also recently criminalized “failure to yield” from a traffic violation punishable by a fine to a more serious penalty. If a driver fails to yield to a pedestrian or cyclist with the right of way and causes an injury or fatality, the driver may be charged with a misdemeanor and could face jail time. Other cities may have similar laws as well, though the decision to prosecute traffic offenses that result in fatalities depends on the circumstances and evidence, according to some city officials we interviewed.
Of the cities included in our review, two cities—New York City and San Francisco—and the District of Columbia have implemented comprehensive efforts to address traffic safety, known as “Vision Zero” or sometimes referred to as a “Toward Zero Deaths” policy.
Page 19 GAO-16-66 Pedestrian and Cyclist Safety
27 Under these programs, a jurisdiction commits to the idea of eliminating fatalities within its traffic system, including pedestrian, cyclist, and motorist fatalities. Vision Zero or Toward Zero Deaths policies are comprehensive in scope, in that they target areas for improvement and implement activities to integrate data collection, engineering, education, and enforcement efforts. For example, New York City instituted its Vision Zero program in February 2014 and implemented several actions to use crash data to prioritize areas and corridors for improvements (data); redesign problematic intersections and corridors and lower the citywide speed limit (engineering); hold town hall meetings and other public workshops and launch public information campaigns (education); and install speed cameras and increase law enforcement activity (enforcement). According to the New York City officials we interviewed, the first year of the Vision Zero program (2014) showed a reduction over the prior 3-year average for both overall and pedestrian fatalities (7 percent and 13 percent, respectively).
27This information is as of September 2015.
Officials from the 21 state and city entities and the 22 non-governmental organizations we interviewed most often cited difficulties with prioritization, data, funding, and engineering as challenges to addressing cyclist and pedestrian safety. These challenges may be interrelated. For example, according to some officials we interviewed, it is difficult to prioritize pedestrian and cyclist safety efforts, in part, due to differing state and local perspectives about necessary transportation investments and competing public safety needs. Moreover, some officials also described limited data on walking and cycling trips as a challenge, which can hinder the development of a performance-based approach that could assist jurisdictions in prioritizing and linking transportation investments to outcomes such as pedestrian and cycling safety.
In 14 state and city interviews and 16 non-governmental organization interviews, officials and representatives told us about difficulties with prioritizing pedestrian and cyclist safety. For example, some of these officials described differing state and city perspectives about necessary investments in transportation, competing public safety needs, a lack of political will, or a lack of a performance-based approach. Several of the state and city officials we spoke with noted that pedestrian and cyclist safety may not be a priority for their agencies. For example, officials from one state DOT told us that the DOT’s district offices have different priorities, with some promoting more comprehensive efforts—such as Toward Zero Deaths policies—and others placing relatively less focus on pedestrian and cyclist safety issues. Officials from two law enforcement agencies we spoke with stated that they choose to focus more on other crimes over enforcement of pedestrian and cyclist laws. A local cycling advocacy group official told us that transportation planners may value larger-scale projects that move people regionally, rather than the 1- to 3-mile commutes typically taken by cyclists and pedestrians.
In 13 state and city interviews and in 20 non-governmental organization interviews, officials described data problems such as incomplete or unreliable pedestrian or cyclist crash data and limited or no walking and cycling activity data. Specifically, officials from several states, cities and non-governmental organizations told us that crash data collected by law enforcement may be incomplete or unreliable because officers may not be able to readily identify all causal factors, their crash data collection forms may be too complicated or ill-suited for capturing pedestrian and cyclist information, or officers may not fully investigate crashes that involve pedestrians or cyclists. For example, officials from a local cycling advocacy organization told us police reports oftentimes suffer from systematic bias because officers tended to rely on motorists’ accounts of
Page 20 GAO-16-66 Pedestrian and Cyclist Safety
Officials Reported Issues with Prioritization, Data, Engineering, and Funding of Pedestrian and Cyclist Safety as Key Challenges
Prioritization Challenges
Data Challenges
what led up to a crash when compiling their reports or were unable to interview the cyclist because he was being transported to a hospital. Crash data may also fail to include crashes that occurred outside of public roadways—including private parking lots or off-road trails—as well as data on injured persons who present directly to a hospital and do not contact the police, according to officials from one state DOT agency. Officials from one local cycling advocacy organization noted that crash data may also fail to identify cyclist facilities, for example whether the crash occurred on a sidewalk or in a bike lane. DOT officials also noted this issue, stating that basic information about a crash, such as the presence or absence of sidewalks, may not always be available. These data quality issues could be due to limited or insufficient training on data collection, or the hit-and-run nature of many crashes involving pedestrians and cyclists, according to some officials we interviewed. Differences in the definitions of terms—specifically differences in how injury and fatality data are captured and reported at the federal and city level—may affect the comparability of data. Incomplete and unreliable crash data makes it difficult for states, cities, and others to plan and implement efforts to address crashes, according to one non-governmental organization official.
Additionally, while officials from most states and cities included in our review told us about counting efforts under way, these efforts are voluntary and—where counting does occur—not standardized across jurisdictions. For example, officials from one state DOT told us that some of the agency’s districts and some cities within the state count the number of pedestrian and cyclist trips within the district or city, while others do not. Officials from another state DOT told us that count data is collected differently from city to city and is not consistent for local and state roads. Moreover, count data of pedestrian and cyclist trips generally exhibits more variability than those of motor vehicles for a number of reasons. For example, pedestrian and bicycle trips tend to be shorter than automobile trips and are often made for different purposes, and motor vehicles tend to be easier to detect than pedestrians and bicycles. Challenges such as these limit the ability to compare data from jurisdiction to jurisdiction or to combine those data to create a regional or statewide perspective, according to an official from a non-governmental organization representing regional governments. Also, while several state and city officials we spoke with indicated that they use the U.S. Census Bureau’s ACS trip data, they also told us that they found this information to be problematic because walking and cycling activity is generally undercounted. Further, one non-governmental organization official also pointed to a lack of guidance on best practices for performing pedestrian
Page 21 GAO-16-66 Pedestrian and Cyclist Safety
and cyclist counts, a gap that poses a challenge for jurisdictions undertaking such efforts.
Limited data on walking and cycling trips also makes it challenging to develop a performance-based approach to addressing pedestrian and cyclist safety. Several state, city, and non-governmental organization officials noted the lack of a performance-based approach to implementing or assessing pedestrian and cyclist safety efforts. Specifically, though states and cities may use available crash data as previously discussed (e.g., fatalities and estimated injuries) to determine how and where to target safety efforts, officials from several non-governmental organizations noted that states and cities lacked performance measures, such as crash rates, to indicate progress in advancing safety. The Moving Ahead for Progress in the 21st Century Act of 2012 transformed surface transportation programs by including provisions for both DOT and its grantees to move toward a national performance-based approach to link surface transportation programs to performance.
Page 22 GAO-16-66 Pedestrian and Cyclist Safety
28 We have previously reported that implementing a national performance-based approach for surface transportation can be challenging, as data may not be available for measuring performance in some areas.29
In interviews with 16 states and cities and 15 non-governmental organizations, problems with existing roadways or issues in engineering new facilities were cited as challenges to pedestrian and cyclist safety. Some of these officials described an array of problems with existing roadways. These include such things as wide, straight lanes that may encourage high motor vehicle speeds and a lack of pedestrian and cyclist facilities, such as few or no sidewalks. Further, several state and city officials noted that the lack of sidewalks within their jurisdictions may be particularly acute in rural and other areas outside city centers. According to officials from one city, these underserved areas are predominantly in low-income neighborhoods, leading to transportation equity issues between lower- and higher-income areas. Other types of problems with existing roadways reported to us included poorly lit and unmarked crosswalks, right-of-way constraints, and terrain issues.
28Pub. L. No. 112-141, 126 Stat. 405 (2012). 29GAO, Surface Transportation: DOT Is Progressing toward a Performance-Based Approach, but State and Grantees Report Potential Implementation Challenges, GAO-15-217 (Washington, D.C.: Jan. 16, 2015).
Engineering new facilities is also a challenge, according to some officials we interviewed. While many design guides on pedestrian and cyclist facilities are available, officials from several non-governmental organizations told us that some state and city governments may struggle with having too much flexibility, which could result in design inconsistency within a jurisdiction, or that they may not have the expertise to incorporate the guidance. On the other hand, officials also told us that sometimes it is the engineers who are reluctant to adopt or use newer design guides that may prove better for pedestrian and cyclist safety, because they have more experience with other standards.
In 16 state and city interviews and 14 non-governmental organization interviews, officials told us that funding issues—such as limited funding, the distribution of funds, and restrictive funding—posed challenges to improving pedestrian and cyclist safety. For example, officials from one state DOT told us that their cyclist and pedestrian safety programs are funded through a combination of federal and state sources, but that funding totals to about one percent of the overall agency budget. Officials from a second state DOT we interviewed also cited sufficient funding as problematic, with their state and cities choosing to allocate funds toward the maintenance of existing infrastructure that is generally in poor condition. Similarly, officials from another state DOT told us 3 percent of their state agency’s 5-year construction budget is set aside to address all forms of road safety improvements, making it difficult to fund pedestrian and cyclist safety efforts. Moreover, according to several city and non-governmental organization officials we interviewed, the cost of pedestrian or cyclist facilities and data collection can be expensive. For example, officials from one city DOT told us that it cost $8 million to install one mile of sidewalk on one side of the street. A 2013 report prepared for FHWA, estimated the typical costs of separated bikeway projects between $536,664 and $4,293,320 per mile, depending on site conditions, path width, and materials used.
Page 23 GAO-16-66 Pedestrian and Cyclist Safety
30 A 2014 National Cooperative Highway Research Program report said that the costs of counting equipment could range more than $3000 per unit, not including permitting and installation.31 Challenges with adequate funding may deter states and cities from constructing pedestrian
30UNC Highway Safety Research Center, Costs for Bicyclist and Pedestrian Infrastructure Improvements, (October 2013). 31National Cooperative Highway Research Program, Guidebook on Pedestrian and Bicyclist Volume Data Collection, NCHRP Report 797 (Washington, D.C.: 2014).
Funding Challenges
and cyclist facilities and having officers attend bike rodeos to perform safety outreach, according to several officials we interviewed.
The distribution of funds and the restrictive nature of some funding can also be challenging, according to officials from several state, city, and non-governmental organizations. Specifically, officials from several cities and non-governmental organizations told us that federal funding for pedestrian and cyclist safety would be more efficiently and effectively used if it went directly to city governments, since these entities typically have the best understanding of their local needs and can devise the most suitable interventions. Several state and non-governmental organization officials also noted that applying for federal funding could be confusing, a situation that can discourage some cities, such as those from rural areas, from seeking federal funds. Several non-governmental organization officials also told us that despite the availability of federal funds, accessing this funding may be restricted based on program or funding eligibility. For example, officials from one non-governmental organization told us that certain federal-aid highway funds (DOT’s Transportation Alternatives Program and the Congestion Mitigation and Air Quality Improvement Program) have restrictions on using funds on non-infrastructure projects, such as purchasing portable pedestrian and cyclist counting technology. According to DOT, restrictions are based on program eligibility, and as discussed below, there are other funding sources that cover different pedestrian and cyclist safety efforts.
State, city, and non-governmental organization officials reported facing other challenges, including some related to education and enforcement.
· In 11 state and city interviews and 8 non-governmental organization interviews, officials said that more overall education on pedestrian and cyclist safety issues was needed. Moreover, several of these officials said that reaching some populations—such as the elderly, children, the mentally ill, and those with limited English proficiency—is particularly difficult or will take concerted effort beyond generic outreach efforts like public service announcements or additional signage. Several city and non-governmental organization officials told us that there is a general lack of recognition that pedestrians and cyclists are legitimate road users, with officials from one city noting the tension that exists between cyclists and motorists sharing a roadway.
· In 8 state and city interviews and 8 non-governmental organization interviews, officials told us that law enforcement officers needed
Page 24 GAO-16-66 Pedestrian and Cyclist Safety
Other Challenges
additional training or that their pedestrian and cyclist laws were not being properly enforced. Officials from several cities and pedestrian and cyclist advocacy organizations discussed the need for law enforcement officers to have more knowledge regarding traffic laws and on how to properly document traffic crashes involving pedestrians or cyclists. As previously mentioned, officials from several state and city governments also described that traffic enforcement is not as much of a focus for officers as other crimes, such as homicide and burglaries.
DOT, primarily through NHTSA and FHWA, has implemented and is planning to take additional actions to help improve pedestrian and cyclist safety, including actions that could help address prioritization, data, funding, and engineering challenges identified by the state and city officials we interviewed. In general, officials from the states and cities we interviewed did not have recommendations on additional actions DOT could undertake to help improve pedestrian and cyclist safety. However, given that the number of pedestrian and cyclist commuting trips has increased in recent years and that pedestrian and cyclist fatalities and injuries represent a growing percentage of all traffic fatalities and injuries, it will be important that efforts to improve pedestrian and cyclist safety continue.
DOT has taken actions to help state and city officials prioritize and place a greater focus on pedestrian and cyclist safety. In March 2010, the Secretary of Transportation issued a policy statement on pedestrian and cyclist infrastructure and safety. Per this document, DOT’s policy is to incorporate safe and convenient walking and cycling facilities into transportation projects. The policy notes that “every transportation agency, including DOT, has the responsibility to improve conditions and opportunities for walking and bicycling and to integrate walking and bicycling into their transportation systems.” The policy also notes that “walking and bicycling foster safer, more livable, family-friendly communities; promote physical activity and health; and reduce vehicle emissions and fuel use.” Additionally, the policy encourages transportation agencies and local communities to consider installing walking and cycling facilities that go beyond minimum design standards, for example by planning for and installing facilities that accommodate increased usage by pedestrians and cyclists, rather than retrofitting those facilities in the future.
Page 25 GAO-16-66 Pedestrian and Cyclist Safety
DOT Is Implementing Actions That May Help Improve Pedestrian and Cyclist Safety
DOT Actions That May Help Address Prioritization Challenges
Additionally, in September 2014, the Secretary of Transportation launched the Safer People, Safer Streets initiative, a comprehensive and coordinated approach that builds off DOT’s existing work to improve pedestrian and cyclist safety. As part of this initiative, which is scheduled to last one and a half years, DOT has already or has plans to provide states and cities with new resources, issue new research, and highlight existing planning and analysis tools for state, city, and other transportation officials.
In January 2015, DOT launched the Mayors’ Challenge as part of the Safer People, Safer Streets initiative, which can also help state and local leaders prioritize pedestrian and cyclist safety. The Mayors’ Challenge is directed toward leaders of any political jurisdiction, including a town, city, county, tribal land, territory, or state. Participants in the Mayors’ Challenge—as of August 2015, according to DOT officials, there were over 230 participants—pledge to issue a public statement about the importance of pedestrian and cyclist safety, form a local action team to advance safety and accessibility goals, and take action in one or more of seven areas: (1) take a ‘complete streets’ approach to design road projects for all road users, (2) identify and address barriers to make streets safe and convenient for all road users, (3) gather and track walking and biking data, (4) design streets that are safe and convenient for all road users while also anticipating future walking and cycling demands, (5) create and complete walking and cycling networks during facility maintenance projects, (6) improve walking and biking laws and regulations, and (7) educate the public about and enforce proper road-use behavior. During the course of the Mayors’ Challenge, DOT plans to provide technical assistance and opportunities for peer exchange in each of the seven areas noted above. According to DOT officials, the Mayors’ Challenge was initially scheduled to conclude in March 2016 but due to additional cities joining and high interest, the Challenge will be extended. DOT officials told us that at the conclusion of the Mayors’ Challenge, participants will be invited to a capstone event to celebrate accomplishments and share best practices. DOT officials noted that the agency plans to perform additional research and encourage cities and states to implement additional actions to improve pedestrian and cyclist safety based on the lessons learned and challenges identified by the Mayors’ Challenge participants.
Both FHWA and NHTSA have taken actions to support state and city efforts to improve pedestrian and cyclist safety data collection and analysis. For example, in April 2015, FHWA announced the Bicycle-Pedestrian Count Technology Pilot Project, which provides technical
Page 26 GAO-16-66 Pedestrian and Cyclist Safety
DOT Actions That May Help Address Data Challenges
support and grants to 10 MPOs to purchase pedestrian and cyclist counting equipment. The pilot is intended to collect more and better data on pedestrian and cyclist activity to support planning and investment decisions, as well as targeted safety improvements. According to DOT officials, the pilot is scheduled to conclude in 2016, and at that time, FHWA will work with the 10 MPOs to identify best practices in counting pedestrian and cyclist activity, as well as strategies to address any challenges the MPOs identify. As another data collection activity, FHWA periodically conducts the National Household Travel Survey to help inform transportation planners and policy makers on travel and transportation patterns. The National Household Travel Survey collects data on daily trips taken in a 24-hour period and includes data points like the purpose of the trip (e.g., work, shopping), all modes of transportation used (e.g., car, bus, walk, bicycle), and how long the trip took. Some of the state and city officials we spoke with noted that the data within the National Household Travel Survey is helpful for their planning and other needs, and the data are generally more useful than the commuting to work data included in the American Community Survey. Data from the most recent National Household Travel Survey was issued in 2009, and DOT officials stated that FHWA is planning to begin a new round of the Survey in 2015 with a scheduled issuance in 2017.
In addition, NHTSA, FHWA, and others played key roles in developing the Model Minimum Uniform Crash Criteria (MMUCC), a voluntary set of minimum traffic crash data elements that can help states determine what crash data to collect on their police accident reports. MMUCC data elements have standardized definitions to promote comparability of these data within the highway safety community. Although the MMUCC includes some data elements that capture crashes involving pedestrians and cyclists, DOT officials told us that the MMUCC is currently being updated and that the newest edition—which could be issued sometime in 2016—could include additional data elements specific to traffic crashes involving pedestrians and cyclists.
Further, DOT has noted that improving the quality and availability of pedestrian and cyclist data—including crash and count data—is fundamental to the Secretary’s Safer People, Safer Streets initiative. As part of that initiative, DOT has committed to supporting improvement in data collection and analysis as a means to achieve performance-based design and decision making. DOT plans to host three training sessions with a focus on data needs and how better data can be used to develop policies. Also, DOT is updating its Traffic Monitoring Analysis System and Traffic Monitoring Guide—systems that help collect traffic data and report
Page 27 GAO-16-66 Pedestrian and Cyclist Safety
on traffic volume—to include pedestrian and cyclist counts. Additionally, DOT has established a Non-Motorized Toolkit, a web-based system that allows researchers and planners to share analytic tools on pedestrian and cyclist data analysis. By overseeing implementation of a pilot program, conducting surveys, and providing assistance and guidance in data collection, DOT is taking steps that could help address the data challenges identified by the state and city officials we interviewed. Such actions may also help DOT, states, and cities better collect trip count data, a step that could allow these entities to implement a performance-based approach for pedestrian and cyclist safety.
DOT has implemented actions that may help address engineering challenges. For example, FHWA has endorsed or issued its own guidance on engineering practices that can help improve pedestrian and cyclist safety. FHWA issued a memorandum in August 2013 expressing the agency’s support for using a flexible approach to pedestrian and cyclist facility design. In the memorandum, FHWA encourages state and local transportation agencies to appropriately use design guides—including the AASHTO, NACTO, and ITE design guides—and other resources to help fulfill the aims of the DOT 2010 policy statement and, potentially, improve the safety of pedestrians and cyclists. FHWA reinforced this design flexibility in an August 2015 document, in which the agency stressed that it supports a flexible approach to planning and designing pedestrian and bicycle facilities.
Further, FHWA and NHTSA have issued guidance that, in part, can help to reduce motorist speed and the likelihood of a crash with a pedestrian or cyclist. For example, FHWA’s 2015 Separated Bike Lane Planning and Design Guide notes that installing separated bike lanes has the potential to improve traffic safety for all street users—for example, by organizing all traffic modes and reducing pedestrian crossing distances—while also contributing to increased cycling volumes.
Page 28 GAO-16-66 Pedestrian and Cyclist Safety
32 Additionally, NHTSA’s 2013 Countermeasures that Work guidance provides transportation officials with information on, among other things, the effectiveness of reducing and enforcing speed limits.33 For example, Countermeasures that Work notes that reducing speed limits is a relatively low-cost change that can reduce all types of
32FHWA, Separated Bike Lane Planning and Design Guide, FHWA-HEP-15-025, (May 2015). 33NHTSA, Countermeasures that Work: A Highway Safety Countermeasure Guide for State Highway Safety Offices, Seventh Edition, 2013, DOT HS 811 727, (Washington, D.C.: April 2013).
DOT Actions That May Help Address Engineering Challenges
crashes and crash severity. In an August 2015 document, FHWA described additional sources the agency has developed to help state and city transportation officials set appropriate speed limits, including a 2012 FHWA guidance document (Methods and Practices for Setting Speed Limits) and a web-based tool (USLIMITS2) in which users input data, such as a roadway’s characteristics, to receive recommendations on speed limits for that roadway.
As part of the Safer People, Safer Streets initiative, DOT plans to promote engineering and design improvements to help ensure the availability of safe and efficient walking and cycling routes. The Department is doing this through actions in several areas as described below:
FHWA, NHTSA, the Federal Transit Administration, the Federal Railroad Administration, and the Federal Motor Carrier Safety Administration—performed road safety assessments in every state, as well as the District of Columbia and Puerto Rico. Road safety assessments help participants—such as staff from DOT modal administrations, as well as state and local transportation agencies—define their pedestrian and cyclist transportation safety concerns. Assessments also help to generate discussion and build relationships between pedestrian and cyclist safety stakeholders.
2. Roadway reconfiguration guidance: In November 2014, FHWA issued guidance on how to reconfigure lanes on a roadway to create space for other uses and travel modes like walking or cycling. This activity is known as a ‘road diet’. The FHWA Road Diet Informational Guide aims to help state and local transportation agencies determine if implementing a road diet is a good fit for a certain road.34 Additionally, FHWA suggested that states consider implementing road diets as part of the agency’s most recent iteration of its Every Day Counts effort. Every Day Counts, which began in 2010, is meant to help shorten roadway project time frames and accelerate use of technology and innovation by convincing states to adopt proven, rapidly deployable innovations. By including road diets in Every Day Counts, FHWA is sharing information on a quickly deployable project that can help to reduce crashes and injuries.
34FHWA, Road Diet Informational Guide, FHWA-SA-14-028 (Washington, D.C.: November 2014).
3. Separated bike lane design guidance: In May 2015, FHWA issued
Page 30 GAO-16-66 Pedestrian and Cyclist Safety
Separated Bike Lane Planning and Design Guide, which describes separated bike lanes, reviews planning considerations, offers flexible design recommendations, and outlines next steps for the development of this cyclist facility. The guide notes that this facility type is evolving and that there is a need for design flexibility.
4. Assisting state and local agencies in selecting countermeasures: FHWA’s PedSafe (Pedestrian Safety Guide and Countermeasure Selection System) and BikeSafe (Bicycle Safety Guide and Countermeasure Selection System) provide state and local transportation officials with information on countermeasures and other treatments that can be installed to help improve pedestrian and cyclist safety. Most recently updated in 2013 and 2014 respectively, the PedSafe and BikeSafe selection tools allow users to input a specific location, select the goal of the treatment (i.e., reduce traffic volumes or mitigate crashes), and describe the location (i.e., the roadway’s speed limit, traffic volume, etc.). The tool then provides the user with a list of recommended treatments, describes those treatments and factors to consider prior to installation, and provides case studies of where the treatment has been implemented.
5. Focus states and cities: Since 2004, FHWA has focused extra resources on the states and cities with the highest pedestrian fatalities. Beginning in 2015, the list of states and cities was revised to include cyclist fatalities. Under this effort, FHWA concentrates its technical assistance on evaluating, planning, and solving pedestrian and cyclist safety issues in states with the highest pedestrian and cyclist fatalities. For example, FHWA provides free technical assistance and courses to each of these states and cities and free bi-monthly webinars on subjects of interest. According to DOT officials, NHTSA has collaborated with FHWA to provide funding to selected focus cities for implementation of pedestrian safety education and enforcement. These demonstration projects provide direct assistance to participating focus cities and produce best practices and lessons learned for other cities.
Additionally, FHWA oversaw implementation of the Nonmotorized Transportation Pilot Program, which provided over $25 million in funding to each of four communities—Columbia, Missouri; Marin County, California; Minneapolis area, Minnesota; and Sheboygan County, Wisconsin—to demonstrate how walking and cycling infrastructure and programs can increase rates of walking and cycling. Under the program, the communities implemented on- and off-road infrastructure and engaged in outreach, education, and marketing efforts. In the final report
on the pilot program, FHWA noted that the pilot resulted in increases and continual growth of nonmotorized travel activities—counts pointed to an increase of 22 percent for walking and 49 percent for cycling—slower driving speeds, safer conditions for pedestrians and cyclists, and improved awareness of pedestrian and cyclist issues.
By supporting multiple engineering design standards, offering guidance to state and city officials on how to reduce traffic speeds, providing further research and resources to states and cities, and implementing the nonmotorized transportation pilot program, DOT has taken actions that can help address the engineering challenges raised by the state and city officials we interviewed.
DOT oversees multiple programs that can award funds to be used toward pedestrian and cyclist safety. According to DOT, federal surface transportation law provides flexibility to states and MPOs to fund pedestrian and cyclist improvements from 13 funding programs (see table 2). In 2013, according to DOT, it obligated $676.1 million for 2,424 new pedestrian or cyclist facilities and programs. According to DOT officials, many pedestrian and cyclist facilities are not built as standalone projects but as part of an overall road project. Depending on the specific requirements of each program, the funds can be used toward different transportation projects, including construction of pedestrian and cyclist facilities, development of safety education programs, and expansion of police officer patrols. According to DOT officials, DOT makes state and city transportation agencies aware of these funding programs—and their potential applicability toward pedestrian and cyclist facilities and safety efforts—by regularly updating an FHWA website listing each of the 13 funding programs, what actions each program can fund, and links to more information on each program. FHWA also produced a document in August 2015 to clarify misconceptions about the applicability of federal funds for pedestrian and cyclist projects. As noted above, some state and city officials we spoke with told us that while federal funds can be used toward pedestrian and cyclist projects, the funds may be prioritized toward other projects first, such as improving or maintaining motorist facilities. However, by making state and city officials aware of its funding programs—and through other actions like the Safer People, Safer Streets program and the Mayors’ Challenge—DOT can help state and city officials address pedestrian and cyclist safety.
Page 31 GAO-16-66 Pedestrian and Cyclist Safety
DOT Actions That May Help Address Funding Challenges
Table 2: DOT Funding Programs That Can Be Used for Pedestrian and Bicycle Projects as of October 2015
Page 32 GAO-16-66 Pedestrian and Cyclist Safety
Activity TIGERa FTA ATI CMAQb HSIP NHPP/ NHS STP
TAP/ TE RTP SRTSc PLANd 402 FLTTP
Access enhancements to public transportation (includes benches, bus pads)
X X X X N/A N/A X X N/A N/A N/A N/A X
ADA/504 Self Evaluation/Transition Plan X N/A N/A N/A N/A N/A X X X N/A X N/A X
Bicycle and/or pedestrian plans X X N/A N/A N/A N/A X X N/A N/A X N/A X Bicycle lanes on road X X X X X X X X N/A X N/A N/A X Bicycle parking X X X X N/A X X X X X N/A N/A X Bike racks on transit X X X X N/A N/A X X N/A N/A N/A N/A X Bicycle share (capital and equipment; not operations) X X X X N/A X X X N/A N/A N/A N/A X
Bicycle storage or service centers X X X X N/A N/A X X N/A N/A N/A N/A X Bridges/overcrossings for bicyclists and/or pedestrians X X X Xe X X X X X X N/A N/A X
Bus shelters and benches X X X X N/A N/A X X N/A N/A N/A N/A X Coordinator positions (State or local) N/A N/A N/A Xf N/A N/A X Xg N/A X N/A N/A N/A
Crosswalks (new or retrofit) X X X Xe X X X X X X N/A N/A X Curb cuts and ramps X X X Xe X X X X X X N/A N/A X Counting equipment X X X N/A X X X X X X Xe N/A X Data collection and monitoring for bicyclists and/or pedestrians X X X N/A X X X X X X Xe N/A X
Helmet education (for bicyclists) N/A N/A N/A N/A N/A N/A X Xg N/A X N/A X N/A Historic preservation (bicycle and pedestrian and transit facilities) X X X N/A N/A N/A X X N/A N/A N/A N/A X
Landscaping, streetscaping (bicycle and/or pedestrian route; transit access); related amenities (benches, water fountains)
X X X N/A N/A N/A X X N/A N/A N/A N/A X
Lighting (pedestrian and bicyclist scale associated with pedestrian/bicyclist project)
X X X N/A X X X X X X N/A N/A X
Maps (for bicyclists and/or pedestrians) N/A X X X N/A N/A X X N/A X Xe N/A N/A
Paved shoulders for bicyclist and/or pedestrian use X N/A N/A Xe X X X X N/A X N/A N/A X
Police patrols N/A N/A N/A N/A N/A N/A Xg Xg N/A X N/A X N/A Recreational trails X N/A N/A N/A N/A N/A X X X N/A N/A N/A X Safety brochures, books N/A N/A N/A N/A N/A N/A Xg Xg N/A X Xe X N/A
Safety education positions N/A N/A N/A N/A N/A N/A Xg Xg N/A X N/A X N/A Separated bicycle lanes X X X X X X X X N/A X N/A N/A X Shared use paths/transportation trails X X X Xe X X X X X X N/A N/A X
Sidewalks (new or retrofit) X X X X X X X X X X N/A N/A X Signs/signals/signal improvements X X X X X X X X N/A X N/A N/A X
Signed bicycle or pedestrian routes X X X X N/A X X X N/A X N/A N/A X
Spot improvement programs X X N/A N/A X N/A X X X X N/A N/A X Stormwater impacts related to pedestrian and bicycle projects X X X N/A X X X X X X N/A N/A X
Traffic calming X X N/A N/A X X X X N/A X N/A N/A X Trail bridges X N/A N/A Xe X X X X X X N/A N/A X Trail/highway intersections X N/A N/A Xe X X X X X X N/A N/A X Training N/A N/A N/A X N/A N/A X X X X Xe X N/A Tunnels/undercrossings for bicyclists and/or pedestrians X X X Xe X X X X X X N/A N/A X
Source: DOT. | GAO-16-66
Note: ADA/504: Americans with Disabilities Act of 1990/Section 504 of the Rehabilitation Act of 1973; TIGER: Transportation Investment Generating Economic Recovery Discretionary Grant program; FTA: Federal Transit Administration Capital Funds; ATI: Associated Transit Improvement (1% set-aside of FTA); CMAQ: Congestion Mitigation and Air Quality Improvement Program; HSIP: Highway Safety Improvement Program; NHPP/NHS: National Highway Performance Program/National Highway System; STP: Surface Transportation Program; TAP/TE: Transportation Alternatives Program/Transportation Enhancement Activities; RTP: Recreational Trails Program; SRTS: Safe Routes to School Program; PLAN: Statewide or Metropolitan Planning; 402: State and Community Highway Safety Grant Program; and FLTTP: Federal Lands and Tribal Transportation Program (Federal Lands Access Program, Federal Lands Transportation Program, Tribal Transportation Program). aSubject to annual appropriations. bSeveral activities may be eligible for CMAQ funds as part of a bicycle and pedestrian-related project, but not as a highway project. CMAQ funds may be used for shared use paths, but may not be used for trails that are primarily for recreational use. cAvailable until expended. dPlanning funds must be for planning purposes: for “Maps”: system maps and GIS; for “Safety brochures, books”: as transportation safety planning; for “Training”: bicycle and pedestrian system planning training. eEligible, but not competitive unless part of a larger project. fLimit one per state. gActivity is eligible only as a Safe Routes to School project benefiting schools for kindergarten through 8th grade.
In addition to those noted above, as part of the Safer People, Safer Streets initiative, DOT has taken or plans to take additional actions that can help address pedestrian and cyclist safety in the following areas:
· Behavioral safety and education: DOT is providing guidance and tools to help individuals understand how their behaviors affect their own safety and the safety of others. For example, according to DOT officials, NHTSA is conducting research on the role of electronic distractions of drivers, pedestrians, and cyclists in crash risk. Additionally, NHTSA is reviewing enforcement and education techniques used in three pilot cities to help improve training for police officers and guidance for communities and in November 2014 released Pedestrian Safety Enforcement Operations: A How-To Guide for use by enforcement agencies in deploying pedestrian safety enforcement.
Page 34 GAO-16-66 Pedestrian and Cyclist Safety
35 Also, DOT officials noted that the agency is planning to conduct research on the risk associated with walking or cycling while impaired by alcohol. Finally, DOT plans to develop and broadly disseminate new education materials on pedestrian and cyclist safety.
· Vehicle safety: DOT is studying technologies that can make roads and vehicles safer, including those technologies that can warn road users about potential dangers or that can intervene to avoid a crash. For example, DOT is examining vehicle-to-pedestrian communication technologies that can help drivers see pedestrians and warn pedestrians that they are crossing or entering a roadway. Additionally, DOT is researching systems that can help drivers detect pedestrians and help them avoid or reduce the severity of a crash, such as warning systems and automated braking systems.
We provided a draft of this report to DOT for review and comment. In the response (reproduced in app. II), DOT highlighted efforts it has taken to improve pedestrian and cyclist safety. DOT also provided a technical comment, which we incorporated.
Additional DOT Actions That May Help Improve Pedestrian and Cyclist Safety
Agency Comments
this report earlier, we plan no further distribution until 30 days from the report date. At that time, we will send copies to interested congressional committees and the Secretary of Transportation. In addition, this report will be available at no charge on GAO’s website at http://www.gao.gov.
If you or your staff have any questions about this report, please contact me at (202) 512-2834 or [email protected]. Contact points for our Offices of Congressional Relations and Public Affairs may be found on the last page of this report. GAO staff who made major contributions to this report are listed in appendix III.
Susan Fleming Director, Physical Infrastructure
Page 35 GAO-16-66 Pedestrian and Cyclist Safety
As agreed with your offices, unless you publicly announce the contents of
Our work for this report focused on city, state, and federal actions taken to help improve pedestrian and cyclist safety. In particular, this report examines: (1) the trends in pedestrian and cyclist fatalities and injuries from 2004 through 2013 and other characteristics of these fatalities and injuries, (2) pedestrian and cyclist safety efforts implemented by selected states and cities and their views on challenges in addressing this issue, and (3) actions taken by the U.S. Department of Transportation (DOT) to improve pedestrian and cyclist safety.
To determine the characteristics of pedestrian and cyclist fatalities and injuries, we reviewed data produced by the National Highway Traffic Safety Administration (NHTSA) on pedestrian and cyclist fatalities and injuries from 2004 through 2013, the 10 most recent years for which these data are available. NHTSA data came from two sources: the Fatality Analysis Reporting System (FARS) and the National Automotive Sampling System–General Estimates System (NASS-GES). FARS is a census of all fatal traffic crashes in the United States that provides uniformly coded, national data on police-reported fatalities. NASS-GES consists of data collected from an annual sample of about 50,000 police accident reports and is statistically weighted to be nationally representative of all police-reported crashes that occur in the United States each year. We analyzed these data to determine the estimated number of injuries involving pedestrians and cyclists. We also analyzed the NASS-GES data to estimate characteristics of pedestrians and cyclists injured in crashes. We used agency technical documentation for NASS-GES and guidance from NHTSA statisticians to estimate the sampling error associated with our estimates derived from NASS-GES data. We express our confidence in the precision of estimates derived from NASS-GES data as 95 percent confidence intervals. This is the interval that would contain the actual population values for 95 percent of the NASS-GES samples that NHTSA could have drawn. To describe the number of people walking or cycling to work, we used data from the U.S. Census Bureau’s American Community Survey (ACS) from 2005 (the first year of available data) through 2013, the nine most recent years for which these data are available. We analyzed these data to determine the estimated number of people who commuted to work by walking or cycling. The American Community Survey (ACS) is a probability sample and estimates derived from ACS data have sampling error associated with them. We express our confidence in the precision of estimates as 90 percent confidence intervals. This is the interval that would contain the actual population values for 90 percent of the ACS samples that the U.S. Census Bureau could have drawn. To assess the reliability of the FARS and NASS-GES data, we reviewed relevant documentation and spoke
Page 36 GAO-16-66 Pedestrian and Cyclist Safety
Appendix I: Objectives, Scope, and Methodology
Appendix I: Objectives, Scope, and Methodology
with agency officials about data quality control procedures. To assess the reliability of the ACS data, we reviewed relevant documentation. For all three data sets, we determined that the data were sufficiently reliable for the purposes of this report, specifically to provide a high-level overview of pedestrian and cyclist fatalities, injuries, and trips within recent years.
To describe pedestrian and cyclist safety efforts implemented at the state and local level, we reviewed related reports and other documentation and interviewed officials from relevant non-governmental organizations with an interest in pedestrian and cyclist safety and selected states and cities. Specifically, we reviewed reports, highway design guides, and other publications to understand some of the actions taken by various entities to help improve pedestrian and cyclist safety. Further, we interviewed officials from a total of 22 relevant non-governmental organizations on safety trends and efforts implemented to address pedestrian and cyclist safety. These interviews were not meant to be comprehensive in scope, nor generalizable to all transportation agencies or non-governmental organizations. We selected the non-governmental organizations with an interest in pedestrian and cyclist safety to reflect a range of expertise on this issue. We grouped these entities into the following five categories: (1) organizations representing state/local governments, (2) pedestrian/cyclist advocacy organizations, (3) engineering/design/research organizations, (4) organizations representing regional or local planners, and (5) organizations representing law enforcement and other issues. Additionally, we selected and interviewed—via a set of semi-structured interview questions—a number of officials from three states, the District of Columbia, and six cities to collect information on efforts implemented and challenges faced in improving pedestrian and cyclist safety, as well as additional actions DOT could take to address this issue. We selected these states and cities based on criteria that included both high and low amounts of pedestrian and cyclist fatalities, high percentages of populations reporting walking or cycling to work, and recommendations from DOT and non-governmental organization officials. Based on these criteria, we chose to interview officials from the State of California, the State of Florida, the State of New York, and the District of Columbia. We also chose to interview officials from the following cities: Austin, Texas; Jacksonville, Florida; Minneapolis, Minnesota; New York City, New York; Portland, Oregon; and San Francisco, California. At the state-level, we chose to interview officials from the transportation agency, the highway safety office, and the state police or highway patrol. For the cities within the states we selected (e.g., San Francisco, California), we chose to interview officials from the transportation agency, the police department, the metropolitan planning organization, and a local pedestrian or cyclist
Page 37 GAO-16-66 Pedestrian and Cyclist Safety
Appendix I: Objectives, Scope, and Methodology
advocacy organization. For the remaining cities, we interviewed officials from the transportation agency. The non-governmental and state and local organizations we contacted are listed at the end of this section. The information obtained in these interviews is not meant to be comprehensive in scope, nor is the information generalizable to all entities at the federal, state, or local level. However, the information provided a range of perspectives on efforts and challenges associated with pedestrian and cyclist safety.
To determine the actions taken by DOT to help improve pedestrian and cyclist safety, we reviewed relevant guidance, reports, and other documentation produced by DOT, such as the Federal Highway Administration’s (FHWA) Separated Bike Lane Planning and Design Guide and NHTSA’s Countermeasures that Work: A Highway Safety Countermeasure Guide for State Highway Safety Offices.
Page 38 GAO-16-66 Pedestrian and Cyclist Safety
1 Additionally, we interviewed officials from FHWA, NHTSA, and the Office of the Secretary of Transportation on actions DOT has implemented or plans to implement to improve pedestrian and cyclist safety.
We interviewed officials from the following entities:
State of California Entities
· California Department of Transportation · California Highway Patrol · California Office of Traffic Safety
San Francisco, California Entities
· San Francisco Bicycle Coalition · San Francisco Municipal Transportation Agency · San Francisco Police Department · Metropolitan Transportation Commission
1FHWA, Separated Bike Lane Planning and Design Guide, FHWA-HEP-15-025 (May 2015) and NHTSA, Countermeasures that Work: A Highway Safety Countermeasure Guide for State Highway Safety Offices, Seventh Edition, 2013, DOT HS 811 727 (Washington, D.C.: April 2013).
State, Local, and Non-Governmental Organizations Contacted
Appendix I: Objectives, Scope, and Methodology
State of Florida Entities
· Florida Department of Transportation · Florida Department of Transportation–State Safety Office · Florida Highway Patrol
Jacksonville, Florida Entities
· Jacksonville Department of Public Works · Jacksonville Sheriff’s Office · North Florida Bicycle Club · North Florida Transportation Planning Organization
State of New York Entities
· New York State Department of Transportation · New York State Governor’s Traffic Safety Committee · New York State Police
New York City, New York Entities
· New York City Department of Transportation · New York City Police Department · New York Metropolitan Transportation Council · Transportation Alternatives
District of Columbia Entities
· District of Columbia Department of Transportation · District of Columbia Department of Transportation–Highway Safety
Office · Metropolitan Council of Governments/National Capital Region
Transportation Planning Board · Metropolitan Police Department of the District of Columbia · Washington Area Bicyclist Association
Additional City Entities
· Austin Transportation Department · Minneapolis Department of Public Works · Portland Bureau of Transportation
· American Association of State Highway and Transportation Officials · Governors Highway Safety Association · National Association of City Transportation Officials
Page 39 GAO-16-66 Pedestrian and Cyclist Safety
Appendix I: Objectives, Scope, and Methodology
Pedestrian/Cyclist Advocacy Organizations
· Alliance for Biking and Walking · League of American Bicyclists · National Center for Bicycling and Walking
Engineering/Design/Research Organizations
· American Road & Transportation Builders Association · Institute of Transportation Engineers · Insurance Institute for Highway Safety · National Cooperative Highway Research Program · Toole Design Group · University of North Carolina Highway Safety Research Center
Organizations Representing Regional or Local Planners
· Association of Metropolitan Planning Organizations · National Association of Development Organizations · National Association of Regional Councils · National Complete Streets Coalition
Organizations Representing Law Enforcement and Other Issues
· Mothers Against Drunk Driving · National Sheriffs’ Association
Page 40 GAO-16-66 Pedestrian and Cyclist Safety
Appendix II: Comments from the Department of Transportation
Page 41 GAO-16-66 Pedestrian and Cyclist Safety
Appendix II: Comments from the Department of Transportation
Appendix II: Comments from the Department of Transportation
Page 42 GAO-16-66 Pedestrian and Cyclist Safety
Appendix III: GAO Contacts and Staff Acknowledgments
In addition to the contact named above, the following individuals made important contributions to this report: Sara Vermillion, Assistant Director; Carl Barden, Leia Dickerson, Georgette Hagans, Terence Lam, Leslie Locke, Joshua Ormond, Daniel Paepke, Cheryl Peterson, Michelle Weathers, Elizabeth Wood, and Friendly Vang-Johnson.
Page 43 GAO-16-66 Pedestrian and Cyclist Safety
Appendix III: GAO Contacts and Staff Acknowledgments
Data Table for Figure 3: Pedestrian Fatalities by Gender, Age, Type of Area, Light Condition, and Time of Day, 2013
Female Male 31 69
Age "0-14 "15-24 "25-34 "35-44 "45-54 55-64 65+ Age Unknown Percentage 5 12 14 13 19 16 19 1
Rural Urban 27 73
Dawn Dusk Daylight Dark 2 2 26 70
Time of day FatalitiesMidnight to 3 am 543 3 am to 6 am 459 6 am to 9 am 411
Appendix IV: Accessible Data
Data Table
Appendix IV: Accessible Data
Page 45 GAO-16-66 Pedestrian and Cyclist Safety
Time of day Fatalities 9 am to Noon 251 Noon to 3 pm 266 3 pm to 6 pm 474 6 pm to 9 pm 1236 9 pm to Midnight 1067 Unknown 28
Data Table for Figure 4: Cyclist Fatalities by Gender, Age, Type of Area, Light Condition, and Time of Day, 2013
Female Male 13 87
Age "0-14 "15-24 "25-34 "35-44 "45-54 55-64 65+ Age Unknown Percentage 7 15 10 10 22 22 13 1
Rural Urban 32 68
Dawn Dusk Daylight Dark 2 2 52 43
Time of day Fatalities Midnight to 3 am 38 3 am to 6 am 38 6 am to 9 am 85 9 am to Noon 79 Noon to 3 pm 85 3 pm to 6 pm 130 6 pm to 9 pm 160 9 pm to Midnight 125 Unknown 3
Appendix IV: Accessible Data
Page 46 GAO-16-66 Pedestrian and Cyclist Safety
Susan Fleming
Director, Physical Infrastructure Issues
U .S. Government Accountability Office
44 1 G Street NW
Washington, DC 20548
Ms. Fleming,
The U .S. Department of Transportation (DOT) has invested significant resources toward improving pedestrian and bi cyclist safety through its strong leadership, sound technical assistance, and extensive outreach to State and local entities. Actions to improve pedestrian and bicyclist safety are critical as the number of people walking and riding bicycles is increasing across the country. Our Safer People, Safer Streets initiative has enabled the Department to enhance internal communications, as well as reach a broader audience with the tool s and resources that will save lives and prevent injuries. Highlights of our efforts include the following:
· Launching the Mayors' Challenge which is helping more than 230 local communities use DOT resources to address their most pressing safety concerns. Our technical assistance is empowering these communities to take critical safety actions, such as adopting a complete streets approach, removing barrier s to access, and improving safety laws and regulations.
· Promoting initiatives, tools, and resources about proven safety countermeasures such as road diets, pedestrian hybrid beacons, and medians/pedestrian crossing islands, all of which improve non-motorist safety.
Agency Comment Letters
Text of Appendix II: Comments from the Department of Transportation
Page 1
Appendix IV: Accessible Data
· Developing educational resources addressing vulnerable populations, and training courses and materials for law enforcement to conduct pedestrian and bicycle safety enforcement. The materials are written in various languages for English as a Second Language (ESL) teachers and student s and are also aimed at older populations, young adults, and children.
· Conducting a pedestrian or bicycle assessment, under DOT leadership, in each State that brought together diverse audiences and built collaboration to solve a specific problem in each participating community.
· Working with our State-level stakeholder s to analyze data and identify pedestrian and bicyclist safety issues as they make project funding decisions.
· Identifying policy options in our 2015 draft "Beyond Traffic: Trends and Choices 2045, " that can help build upon recent advances to ensure continued growth and improved safety in cycling and walking over the next 30 years.
The Department is committed to building upon its efforts to elevate the importance of protecting people who walk and bicycle. We will continue to seek solutions to the most challenging issues in pedestrian and bicyclist safety, whether it is improving safety data, ensuring access for all, or making safety improvement s to street crossings around transit.
We appreciate this opportunity to offer an additional perspective on the GAO draft report. Please contact Madeline M. Chulumovich, Director of Program Management and Improvement, at (202) 366-6512 with any questions or additional details about our comments.
Sincerely,
Jeff Marootian
Assistant Secretary for Administration
Page 47 GAO-16-66 Pedestrian and Cyclist Safety
Page 2
The Government Accountability Office, the audit, evaluation, and investigative arm of Congress, exists to support Congress in meeting its constitutional responsibilities and to help improve the performance and accountability of the federal government for the American people. GAO examines the use of public funds; evaluates federal programs and policies; and provides analyses, recommendations, and other assistance to help Congress make informed oversight, policy, and funding decisions. GAO’s commitment to good government is reflected in its core values of accountability, integrity, and reliability.
The fastest and easiest way to obtain copies of GAO documents at no cost is through GAO’s website (http://www.gao.gov). Each weekday afternoon, GAO posts on its website newly released reports, testimony, and correspondence. To have GAO e-mail you a list of newly posted products, go to http://www.gao.gov and select “E-mail Updates.”
The price of each GAO publication reflects GAO’s actual cost of production and distribution and depends on the number of pages in the publication and whether the publication is printed in color or black and white. Pricing and ordering information is posted on GAO’s website, http://www.gao.gov/ordering.htm.
Place orders by calling (202) 512-6000, toll free (866) 801-7077, or TDD (202) 512-2537.
Orders may be paid for using American Express, Discover Card, MasterCard, Visa, check, or money order. Call for additional information.
Connect with GAO on Facebook, Flickr, Twitter, and YouTube. Subscribe to our RSS Feeds or E-mail Updates. Listen to our Podcasts and read The Watchblog. Visit GAO on the web at www.gao.gov.
Katherine Siggerud, Managing Director, [email protected], (202) 512-4400, U.S. Government Accountability Office, 441 G Street NW, Room 7125, Washington, DC 20548
Chuck Young, Managing Director, [email protected], (202) 512-4800 U.S. Government Accountability Office, 441 G Street NW, Room 7149 Washington, DC 20548
GAO’s Mission
Obtaining Copies of GAO Reports and Testimony
Order by Phone
Connect with GAO
To Report Fraud, Waste, and Abuse in Federal Programs