Regional Effects of Agricultural Conservation Practices on Nutrient Transport NATIONAL WATER QUALITY ASSESSMENT PROGRAM (NAWQA) Ana Maria Garcia South Atlantic Water Science Center Richard Alexander (USGS), Dale Robertson (USGS), Jeff Arnold (USDA-ARS), Mike White (USDA-ARS), Lee Norfleet (USDA-NRCS)
Transcript
Regional Effects of Agricultural Conservation Practices on Nutrient Transport
NATIONAL WATER QUALITY ASSESSMENT PROGRAM (NAWQA)
Ana Maria Garcia South Atlantic Water Science Center
Richard Alexander (USGS), Dale Robertson (USGS), Jeff Arnold (USDA-ARS), Mike White (USDA-ARS), Lee Norfleet (USDA-
NRCS)
Are we measuring the environmental benefits of established conservation practices?
Conservation Effects
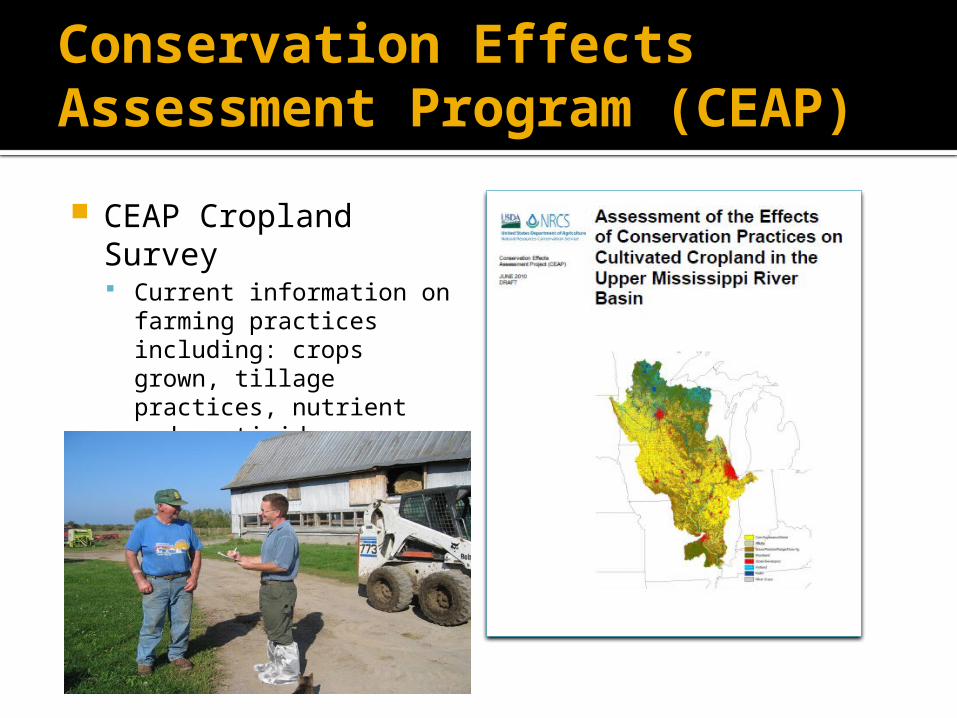
Conservation Effects Assessment Program (CEAP) CEAP Cropland
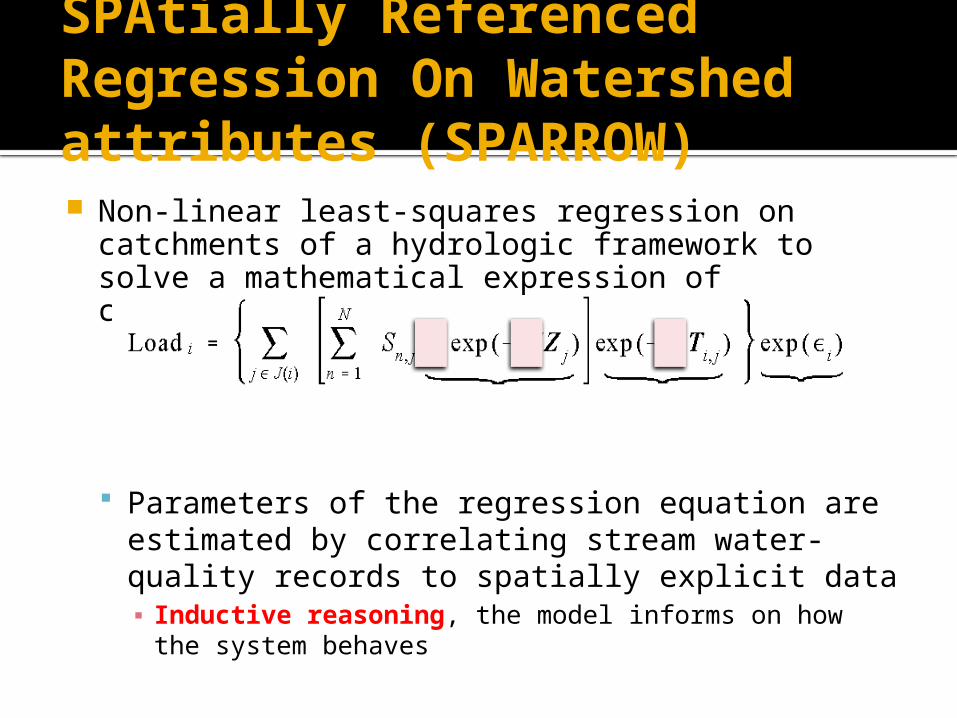
SPAtially Referenced Regression On Watershed attributes (SPARROW) Non-linear least-squares regression on
catchments of a hydrologic framework to solve a mathematical expression of constituent mass.
Parameters of the regression equation are estimated by correlating stream water-quality records to spatially explicit data ▪ Inductive reasoning, the model informs on how the
system behaves
Monitoring Data323 stations
Model Predictions3627 catchments
Source factors, such as manure applied to farmland
Transport factors such as tile-drainage
SPARROW modeling process
α
β
Measure of conservation tested as a transport factor
BASELINE SCENARIO
APEX model results that account for conservation practices as reported in the CEAP Cropland Survey.
NO PRACTICE SCENARIO
APEX model results as if no conservation practiceswere in use.
The difference between these two scenarios is a measure of conservation adoption intensity.
Area of cropland, UMRB (km2) 19.3 < 0.001 22.1 < 0.001
Land-to-water
delivery
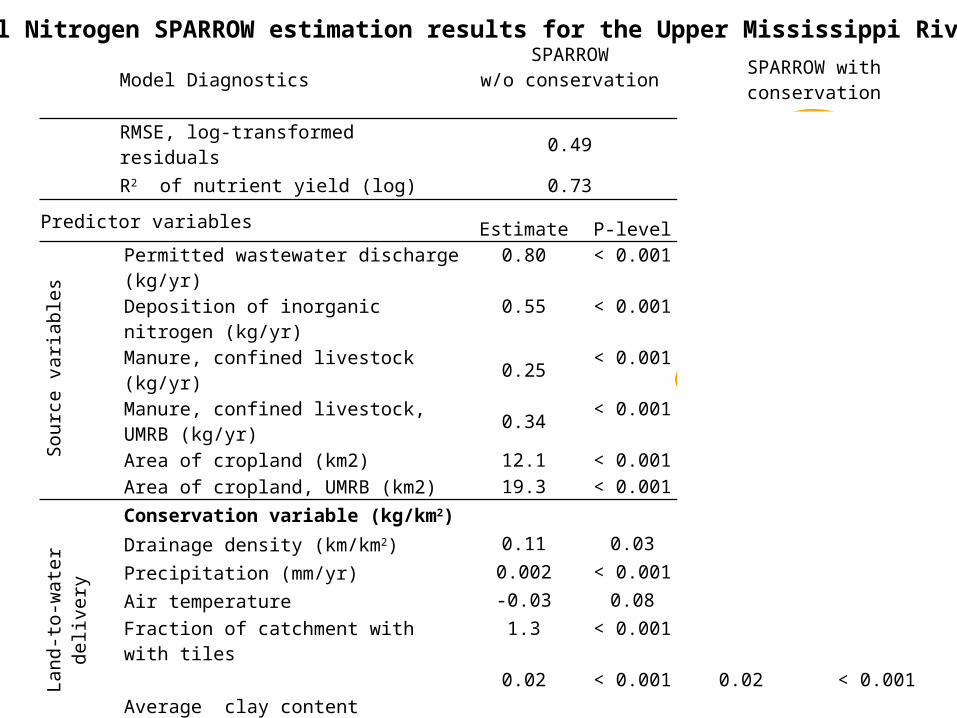
Conservation variable (kg/km2) -0.001 0.01
Drainage density (km/km2) 0.11 0.03 0.11 0.02
Precipitation (mm/yr) 0.002 < 0.001 0.002 < 0.001
Air temperature -0.03 0.08 -0.04 0.04
Fraction of catchment with with tiles 1.3 < 0.001 1.3 < 0.001
Average clay content 0.02 < 0.001 0.02 < 0.001
Stream loss (small streams) 0.43 < 0.001 0.44 < 0.001Stream loss (medium streams) 0.21 0.02 0.21 0.02Reservoir loss (m/yr) 5.3 < 0.001 5.4 < 0.001
Total Nitrogen SPARROW estimation results for the Upper Mississippi River Basin
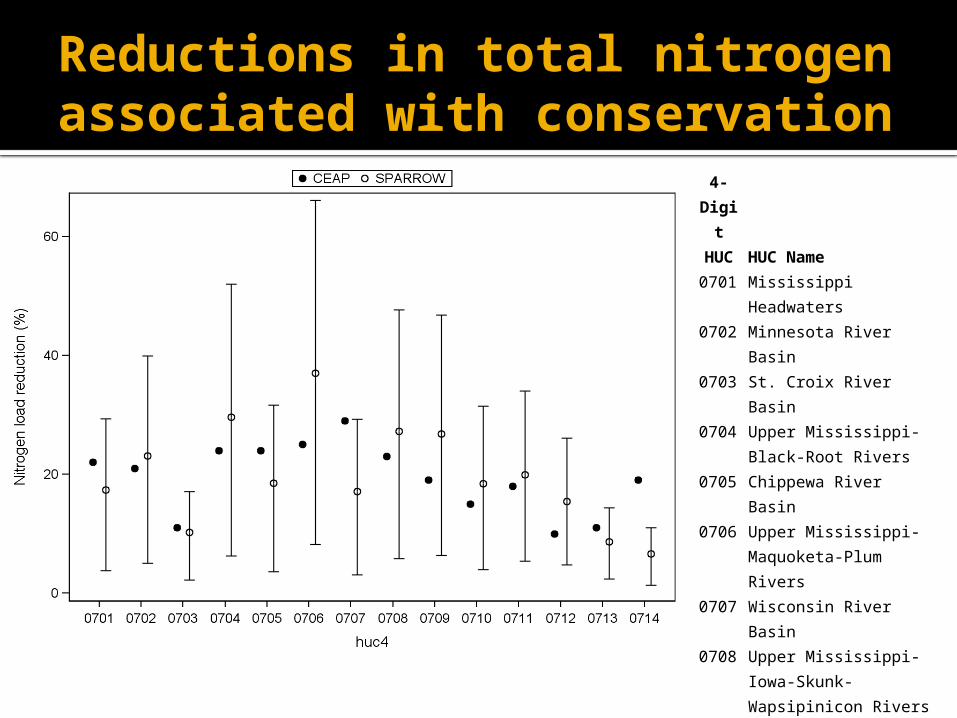
Reductions in total nitrogen associated with conservation
4-Digi
t HUC HUC Name0701
Mississippi Headwaters
0702
Minnesota River Basin
0703
St. Croix River Basin
0704
Upper Mississippi-Black-Root Rivers
0705
Chippewa River Basin
0706
Upper Mississippi-Maquoketa-Plum Rivers
0707
Wisconsin River Basin
0708
Upper Mississippi-Iowa-Skunk-Wapsipinicon Rivers
0709
Rock River Basin
0710
Des Moines River Basin
0711
Upper Mississippi-Salt Rivers
0712
Upper Illinois River Basin only
0713
Lower Illinois River Basin
0714
Upper Mississippi, Kaskaskia and Meramec Rivers
Model diagnostics SPARROW model w/o conservationSPARROW w/ conservation
Root mean square error (RMSE), log-transformed residuals 0.49 0.49
R2 of nutrient yield (log) 0.73 0.73
Data set used to represent model variable Estimate P-level Estimate P-level
Source variables
Permitted municipal wastewater discharge (kg/yr)
1.06 <0.001 1.06 <0.001
Area in urban land (km2) 57.10 <0.001 56.50 <0.001
Area in forest land (km2) 15.40 <0.001 15.40 <0.001
Manure from unconfined livestock production (kg/yr)
0.03 <0.001 0.03 0.003
Manure from confined livestock production (kg/yr)
0.04 <0.001 0.05 0.002
Manure from confined livestock production (kg/yr) - UMRB
0.12 <0.001 0.12 <0.001
Commercial fertilizer applied to cropland (kg/yr) 0.04 <0.001 0.04 <0.001Commercial fertilizer applied to cropland (kg/yr) - UMRB
0.02 <0.001 0.02 <0.001
Land-to-water
delivery
Conservation intensity measure (kg/km2) -0.001 0.279Soil permeability -0.69 <0.001 -0.68 <0.001Fraction of catchment with with tiles -1.10 <0.001 -1.10 <0.001
In-channel attenuation
Stream loss in small streams 0.26 <0.001 0.26 0.001Stream loss in medium streams 0.31 <0.001 0.31 0.002Reservoir loss (m/yr) 5.14 <0.001 5.16 <0.0010
Total Phosphorus SPARROW estimation results for the Upper Mississippi River Basin
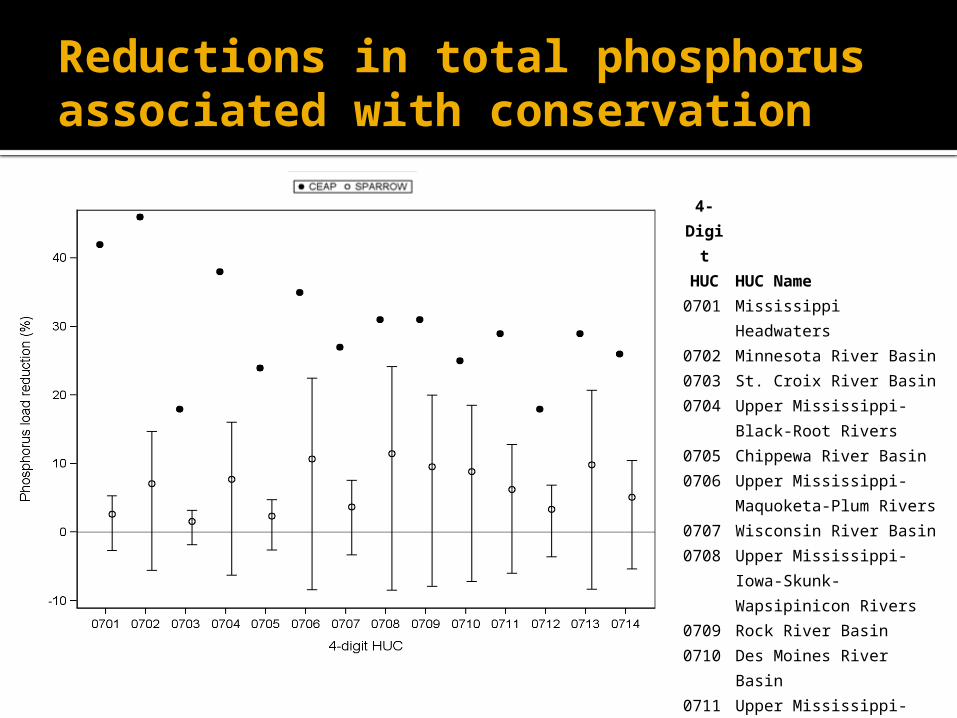
Reductions in total phosphorus associated with conservation
4-Digit HUC HUC Name0701 Mississippi Headwaters0702 Minnesota River Basin0703 St. Croix River Basin0704 Upper Mississippi-Black-
Root Rivers0705 Chippewa River Basin0706 Upper Mississippi-
Maquoketa-Plum Rivers0707 Wisconsin River Basin0708 Upper Mississippi-Iowa-
Skunk-Wapsipinicon Rivers
0709 Rock River Basin0710 Des Moines River Basin0711 Upper Mississippi-Salt
Rivers0712 Upper Illinois River Basin
only0713 Lower Illinois River Basin0714 Upper Mississippi,
Kaskaskia and Meramec Rivers
Inferences regarding nitrogen Conservation practice adoption signal is
mostly representative of soil management Results consistent with the hydrological
processes that could yield nitrogen reductions in streams. Increased hydraulic storage can lead to higher
denitrification rates when compared to equivalent areas without these practices.
Inferences regarding phosphorus The weak negative correlation between
conservation intensity and stream phosphorus loads may be potentially explained by the effects of several key factors. For phosphorus, the chemistry of agricultural
soils and more recent research on soluble phosphorus mobility and transport are leading to shifts in understanding.
Lags in response to nutrient management
Conclusions
The results provide some empirical evidence of regional-scale environmental benefit of conservation practices. environmental setting dictates the
effectiveness of conservation practices. These results present a corroboration of
some of the previous deductive work Application to other environmental setting