Gartner for Marketers 2@GartnerDigital gartner.com/[email protected]
Marketing budgets have increased
for the third consecutive year as the
marketing leader’s mandate broadens
and the CMO’s marketing tech spending
approaches the levels of the CIO’s
technology spend.
INTRODUCTION
Key Findings
• Marketing budgets continue their steady ascent in 2016, climbing to 12% of company revenue.
• CMO marketing tech spending is on track to exceed the CIO technology spend in 2017 as marketing looks after a growing number of customer touchpoints.
• Twenty-four percent of marketing leaders expect their 2017 digital advertising budget will rise significantly, suggesting that reports of advertising’s demise may be overstated.
• Marketing leaders who own or share P&L responsibility get budgets that are 20% higher, on average, than those without plans for a P&L, demonstrating how marketing leaders can earn greater authority through greater accountability.
Recommendations
• Confirm that your team’s priorities align up the ladder of leadership — from marketing up to the CMO and from the CMO to the CEO. Misalignment in the planning hierarchy is what causes distributed marketing teams to get out of sync with what matters most for the business.
• Measure your budget against benchmarks to be sure you’re not underfunding or overfunding your marketing operation relative to competitors or peers.
• Rebalance your in-house/outsource talent mix. Look for outsourced capabilities you can bring in-house to reduce costs and increase internal competencies. You’ll also want to determine whether there are any in-house activities that could be delivered more efficiently through outsourcing.
Gartner for Marketers 3@GartnerDigital gartner.com/[email protected]
For the third consecutive year, marketing
budgets are on the rise, climbing to 12%
of company revenue from 11% last year.
Survey findings show how marketing
organizations, through their spending
priorities, continue to lead the charge
in a data-driven, digitally led world.
SURVEY OBJECTIVE
This research is based on Gartner’s 2016-2017 CMO Spend Survey of 377 marketers in North America and the U.K. at companies with more than $250 million in annual revenue. It details:
• How much companies spend on marketing and how those budgets will change in 2017.
• What budgets reveal about marketing’s competing priorities to improve short-term performance and long-term customer experience.
• What new responsibilities have been assumed by marketing.
Gartner for Marketers 4@GartnerDigital gartner.com/[email protected]
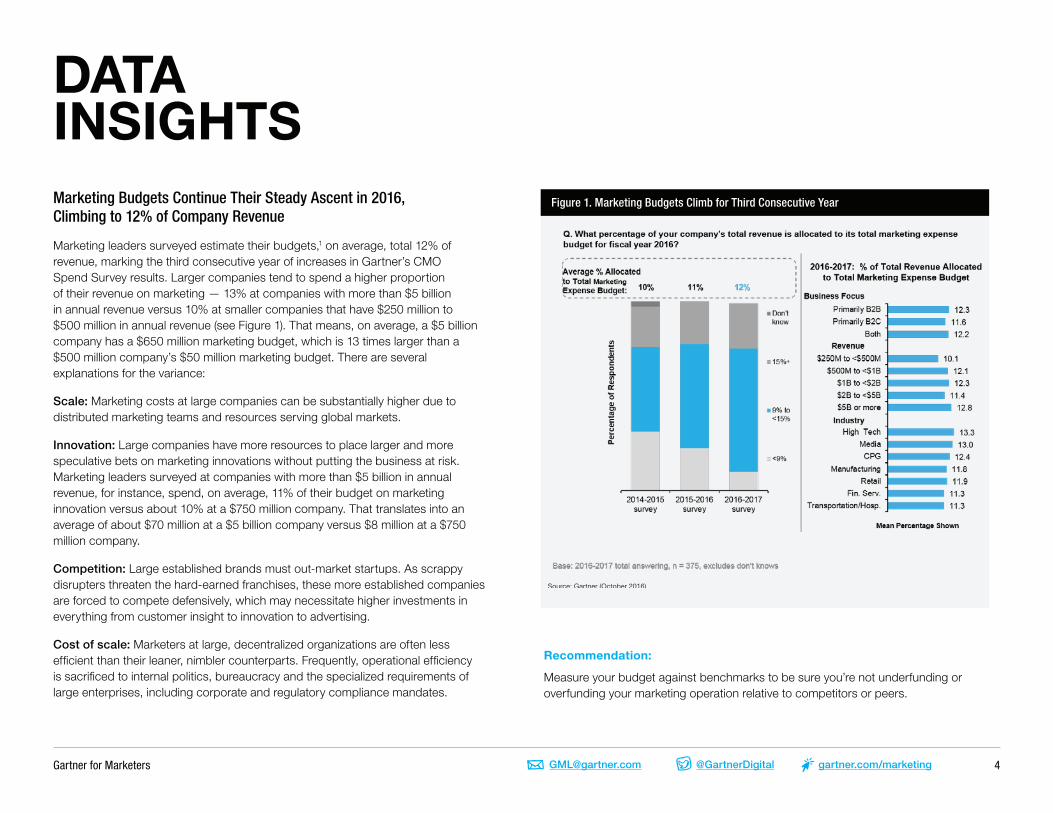
Marketing Budgets Continue Their Steady Ascent in 2016, Climbing to 12% of Company Revenue
Marketing leaders surveyed estimate their budgets,1 on average, total 12% of revenue, marking the third consecutive year of increases in Gartner’s CMO Spend Survey results. Larger companies tend to spend a higher proportion of their revenue on marketing — 13% at companies with more than $5 billion in annual revenue versus 10% at smaller companies that have $250 million to $500 million in annual revenue (see Figure 1). That means, on average, a $5 billion company has a $650 million marketing budget, which is 13 times larger than a $500 million company’s $50 million marketing budget. There are several explanations for the variance:
Scale: Marketing costs at large companies can be substantially higher due to distributed marketing teams and resources serving global markets.
Innovation: Large companies have more resources to place larger and more speculative bets on marketing innovations without putting the business at risk. Marketing leaders surveyed at companies with more than $5 billion in annual revenue, for instance, spend, on average, 11% of their budget on marketing innovation versus about 10% at a $750 million company. That translates into an average of about $70 million at a $5 billion company versus $8 million at a $750 million company.
Competition: Large established brands must out-market startups. As scrappy disrupters threaten the hard-earned franchises, these more established companies are forced to compete defensively, which may necessitate higher investments in everything from customer insight to innovation to advertising.
Cost of scale: Marketers at large, decentralized organizations are often less efficient than their leaner, nimbler counterparts. Frequently, operational efficiency is sacrificed to internal politics, bureaucracy and the specialized requirements of large enterprises, including corporate and regulatory compliance mandates.
DATA INSIGHTS defensively, which may necessitate higher investments in everything from customer insight to
innovation to advertising.
■ Cost of scale: Marketers at large, decentralized organizations are often less efficient than theirleaner, nimbler counterparts. Frequently, operational efficiency is sacrificed to internal politics,bureaucracy and the specialized requirements of large enterprises, including corporate andregulatory compliance mandates.
Figure 1. Marketing Budgets Climb for Third Consecutive Year
Source: Gartner (October 2016)
Recommendation:
■ Measure your budget against benchmarks to be sure you're not underfunding or overfundingyour marketing operation relative to competitors or peers.
Page 4 of 26 Gartner, Inc. | G00308956
Figure 1. Marketing Budgets Climb for Third Consecutive Year
Recommendation:
Measure your budget against benchmarks to be sure you’re not underfunding or overfunding your marketing operation relative to competitors or peers.
Gartner for Marketers 5@GartnerDigital gartner.com/[email protected]
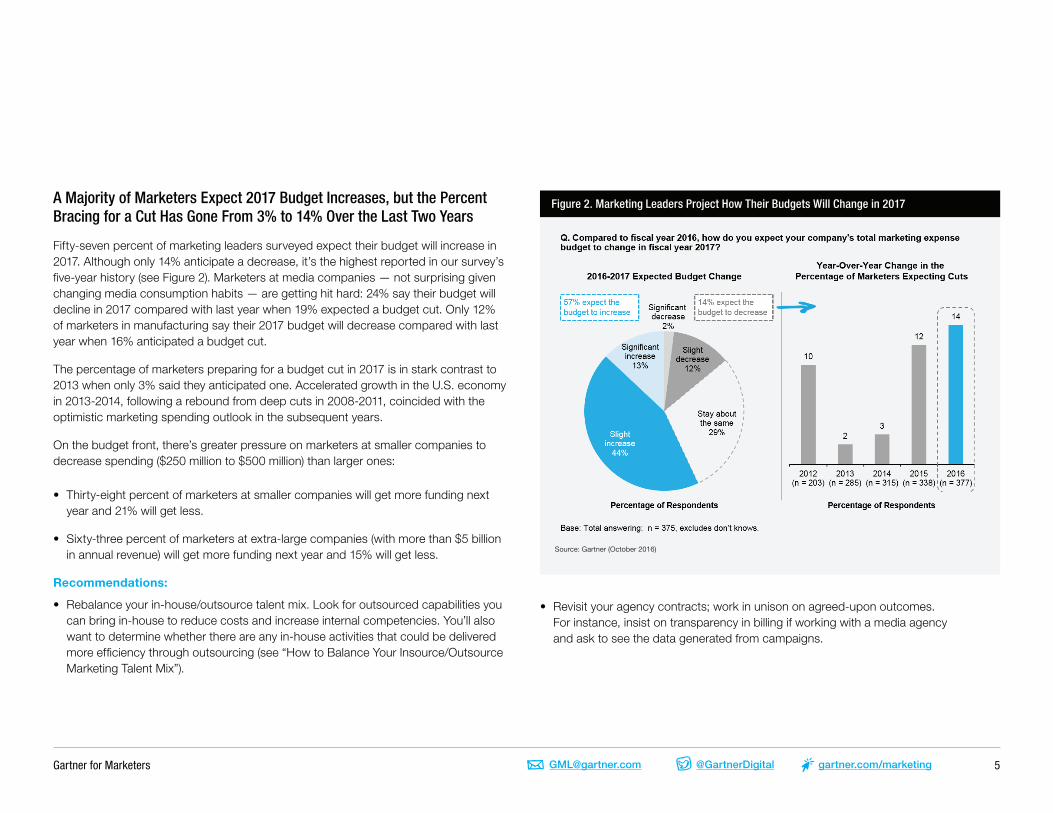
Figure 2. Marketing Leaders Project How Their Budgets Will Change in 2017A Majority of Marketers Expect 2017 Budget Increases, but the Percent Bracing for a Cut Has Gone From 3% to 14% Over the Last Two Years
Fifty-seven percent of marketing leaders surveyed expect their budget will increase in 2017. Although only 14% anticipate a decrease, it’s the highest reported in our survey’s five-year history (see Figure 2). Marketers at media companies — not surprising given changing media consumption habits — are getting hit hard: 24% say their budget will decline in 2017 compared with last year when 19% expected a budget cut. Only 12% of marketers in manufacturing say their 2017 budget will decrease compared with last year when 16% anticipated a budget cut.
The percentage of marketers preparing for a budget cut in 2017 is in stark contrast to 2013 when only 3% said they anticipated one. Accelerated growth in the U.S. economy in 2013-2014, following a rebound from deep cuts in 2008-2011, coincided with the optimistic marketing spending outlook in the subsequent years.
On the budget front, there’s greater pressure on marketers at smaller companies to decrease spending ($250 million to $500 million) than larger ones:
• Thirty-eight percent of marketers at smaller companies will get more funding next year and 21% will get less.
• Sixty-three percent of marketers at extra-large companies (with more than $5 billion in annual revenue) will get more funding next year and 15% will get less.
Recommendations:
• Rebalance your in-house/outsource talent mix. Look for outsourced capabilities you can bring in-house to reduce costs and increase internal competencies. You’ll also want to determine whether there are any in-house activities that could be delivered more efficiency through outsourcing (see “How to Balance Your Insource/Outsource Marketing Talent Mix”).
• Revisit your agency contracts; work in unison on agreed-upon outcomes. For instance, insist on transparency in billing if working with a media agency and ask to see the data generated from campaigns.
Figure 2. Marketing Leaders Project How Their Budgets Will Change in 2017
Source: Gartner (October 2016)
Recommendations:
■ Rebalance your in-house/outsource talent mix. Look for outsourced capabilities you can bringin-house to reduce costs and increase internal competencies. You'll also want to determinewhether there are any in-house activities that could be delivered more efficiency throughoutsourcing (see "How to Balance Your Insource/Outsource Marketing Talent Mix").
■ Revisit your agency contracts; work in unison on agreed-upon outcomes. For instance, insist ontransparency in billing if working with a media agency and ask to see the data generated fromcampaigns.
CMO Marketing Tech Spending Is on Track to Exceed the CIO Technology Spend
Paid media and labor often command the lion's share of the marketing expense budget. While laborstill gets the greatest slice of the pie, technology comes in a close second this year, ahead of paidmedia (see Figure 3). We changed the way this question was asked this year to improve theprecision of the findings, which means it's not easily comparable to last year's research. In 2015,
Gartner for Marketers 6@GartnerDigital gartner.com/[email protected]
CMO Marketing Tech Spending Is on Track to Exceed the CIO Technology Spend
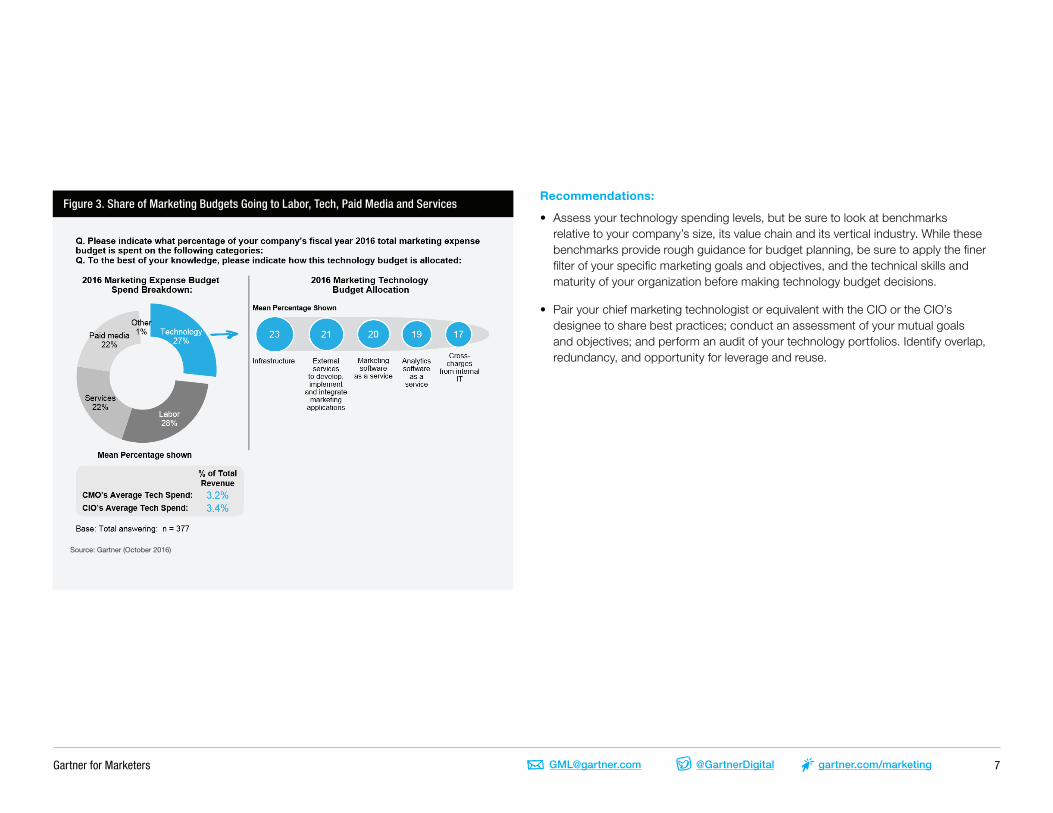
Paid media and labor often command the lion’s share of the marketing expense budget. While labor still gets the greatest slice of the pie, technology comes in a close second this year, ahead of paid media (see Figure 3). We changed the way this question was asked this year to improve the precision of the findings, which means it’s not easily comparable to last year’s research. In 2015, marketers were asked about three categories: services, labor and technology. In 2016, paid media was added, splitting the allocation of budget across four categories (see the Methodology section). Regardless of the change, the results reveal marketers’ extraordinary dependence on technology as the foundation for their efforts.
When we unpack technology spending, we see the highest percentage still allocated to infrastructure, which includes servers, storage and hosted/cloud computing resources rather than software as a service, professional services or internal cross charges. This represents a departure from the historical notion of infrastructure as a capital expense, reflecting the impact of infrastructure as a service (IaaS) on marketing’s independence from capital IT budgets.
Marketing leaders at smaller companies spend a smaller share of their budget on technology (24%) than all respondents, putting more instead into paid media (29%). These marketers at smaller companies may have a bias for paid media to drive awareness and find customers to grow their business.
Perhaps the most notable finding relates to a now-famous Gartner prediction that, by 2017, CMOs would spend more on technology than CIOs (see “By 2017 the CMO Will Spend More on IT Than the CIO”). This year’s data suggests that marketing leaders allocate 27% of their expense budget to technology, which equals 3.24% of overall revenue. Compare this with the CIO technology spend, at 3.4% of revenue (see “IT Key Metrics Data 2016: Executive Summary”).
This reveals a narrow gap between the CMO’s and the CIO’s technology spending — a gap that promises to close over the next year based on substantially different annual growth rates (12% for marketing versus 3.1% for IT in 2016). On this basis, we can conclude that this prediction is on track to come true.
What does this mean for marketing leaders? Marketing is now also responsible for critical customer-facing, revenue-generating systems and applications. It means that, if they haven’t already, they ought to appoint a chief marketing technologist in title or role equivalent to look after this growing technology estate. And, crucially, it means marketing has a responsibility to collaborate with enterprise IT, ensuring coordinated, efficient and harmonized technology spending on behalf of the business.
Gartner for Marketers 7@GartnerDigital gartner.com/[email protected]
Recommendations:
• Assess your technology spending levels, but be sure to look at benchmarks relative to your company’s size, its value chain and its vertical industry. While these benchmarks provide rough guidance for budget planning, be sure to apply the finer filter of your specific marketing goals and objectives, and the technical skills and maturity of your organization before making technology budget decisions.
• Pair your chief marketing technologist or equivalent with the CIO or the CIO’s designee to share best practices; conduct an assessment of your mutual goals and objectives; and perform an audit of your technology portfolios. Identify overlap, redundancy, and opportunity for leverage and reuse.
Figure 3. Share of Marketing Budgets Going to Labor, Tech, Paid Media and ServicesFigure 3. Share of Marketing Budgets Going to Labor, Tech, Paid Media and Services
Source: Gartner (October 2016)
Recommendations:
■ Assess your technology spending levels, but be sure to look at benchmarks relative to yourcompany's size, its value chain and its vertical industry. While these benchmarks provide roughguidance for budget planning, be sure to apply the finer filter of your specific marketing goalsand objectives, and the technical skills and maturity of your organization before makingtechnology budget decisions.
■ Pair your chief marketing technologist or equivalent with the CIO or the CIO's designee to sharebest practices; conduct an assessment of your mutual goals and objectives; and perform anaudit of your technology portfolios. Identify overlap, redundancy, and opportunity for leverageand reuse.
Gartner for Marketers 8@GartnerDigital gartner.com/[email protected]
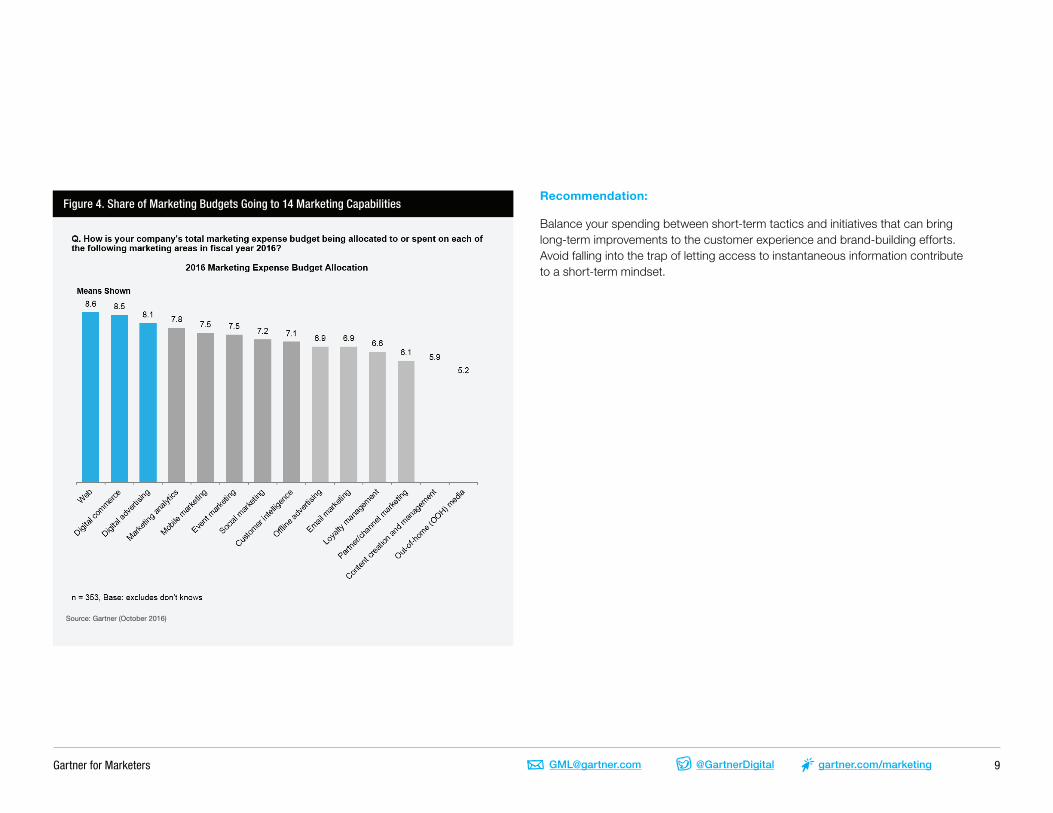
Marketing Leaders Spend More on Their Websites, Digital Commerce and Digital Advertising Than Other Categories in 2016
Although marketing budgets have, on average, increased, marketing leaders are still stretched to do more with their resources. In addition to asking marketing leaders how they allocate spend among labor, services, technology and paid media, we asked how they allocate spend across 14 categories of marketing activity. The top three categories in 2016 spend — web, digital commerce and digital advertising — show digital marketing’s muscle (see Figure 4). Spending on the website and digital commerce are complementary and potentially overlap as marketers invest in technologies and techniques to personalize customer experiences, and improve customer engagement and conversion. Not surprisingly, those marketing leaders we surveyed from media, including publishers and entertainment companies, spend the highest percentage — 14% — on the website; the average across all survey respondents is 9%.
Marketing leaders say they spend at least 8% of the budget on digital commerce, making it the second highest category in the marketing budget and No. 1 in many vertical industries in our survey. B2C marketers spend a higher percentage (9%) on digital commerce than B2B marketers (7%). Although some businesses are better suited for digital commerce than others, companies selling to consumers and businesses alike can digitize their content and buying processes. For example, manufacturers are establishing features such as online tool advisors, lengthy specifications sheets and online videos that give buyers more information before placing an order.2
Marketing leaders at retail and financial services companies surveyed spend the most, 9% each, on digital commerce; each exceeds the amount spent on the website. Company size is another variable. Marketing leaders spend 11% of the marketing budget on digital commerce at companies with $250 million to $500 million in annual revenue compared with 9% for all respondents. Costs for digital commerce and the website typically don’t rise linearly with revenue, requiring marketers at smaller companies to spend a larger share of the budget for each.
As a stand-alone spending category, marketing analytics secures the fourth highest share of budget. CPG marketing leaders are spending more, as a percentage of budget, on analytics compared with all respondents. This aligns to a broader investment pattern in data and analytics that Gartner has seen with CPG companies driven by a need to bolster consumer insight.
Almost 6% of the budget goes to content marketing, putting it second to last of the 14 categories listed in our survey. Because of a change in survey methodology — the survey examines all marketing, not only digital marketing — this year’s results show investments in content creation and management have actually doubled over last year from 0.3% of revenue to 0.7% of revenue. This suggests that multichannel marketing continues to be a content-hungry discipline (see the Methodology section).
Gartner for Marketers 9@GartnerDigital gartner.com/[email protected]
Recommendation:
Balance your spending between short-term tactics and initiatives that can bring long-term improvements to the customer experience and brand-building efforts. Avoid falling into the trap of letting access to instantaneous information contribute to a short-term mindset.
Figure 4. Share of Marketing Budgets Going to 14 Marketing CapabilitiesFigure 4. Share of Marketing Budgets Going to 14 Marketing Capabilities
Source: Gartner (October 2016)
Recommendation:
■ Balance your spending between short-term tactics and initiatives that can bring long-termimprovements to the customer experience and brand-building efforts. Avoid falling into the trapof letting access to instantaneous information contribute to a short-term mindset.
Digital Commerce Investments Remain a High Priority With Marketing Leaders as aWay to Meet Company Growth Objectives, Particularly in CPG
Out of seven vertical industries, consumer packaged goods (CPG) companies overindex on digitalcommerce as an area where marketers are making their top investments to meet 2017 company
Gartner for Marketers 10@GartnerDigital gartner.com/[email protected]
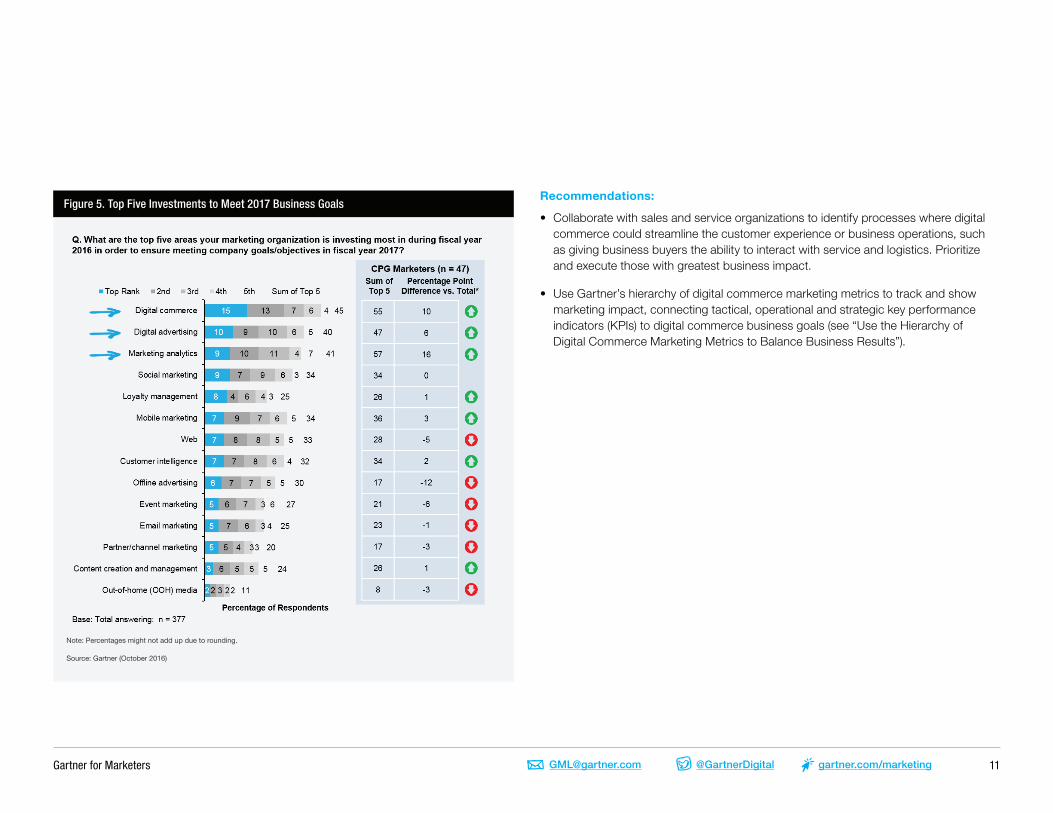
Digital Commerce Investments Remain a High Priority With Marketing Leaders as a Way to Meet Company Growth Objectives, Particularly in CPG
Out of seven vertical industries, consumer packaged goods (CPG) companies overindex on digital commerce as an area where marketers are making their top investments to meet 2017 company goals (see Figure 5). Spending on digital commerce gives CPG marketers the building blocks to make a long-overdue move: direct-to-consumer (DTC) distribution. Commodity pricing pressures and hypercompetition from unexpected places leave CPG marketers with little choice but to make a business case for digital commerce investments (see “Overcoming the Top 3 Roadblocks to Going Direct to Consumer Online”).
Without these digital commerce efforts, CPG marketers have limited ability to develop direct relationships with customers, drive loyalty and advocacy, or collect immediate insights. Instead, these marketers must negotiate with retail partners for physical and digital shelf space and for consumer-level sales data. A thirst for insights is also reflected in CPG marketers investing more in marketing analytics compared with all other survey respondents.
Investments in digital commerce can get complicated fast. Marketers at channel-centric organizations need to work with sales and customer service to integrate cross-functional data for better segmentation, targeting and tracking against sales and conversion metrics (see “Maturity Model for Digital Commerce”). In their pursuit to get closer to the customer, CPG marketers face potential channel conflict. These companies must balance the urgency to get more customer insights with the risk of channel conflicts.
When asked to identify their top five investments, CPG marketers underindex in the category of offline advertising. Although CPG brands are known for their investments in offline advertising, this survey response may suggest that CPGs are making a big push into digital spending. Such a shift could depress prices in offline advertising, yielding bargains for marketers in other sectors buying offline media.
Gartner for Marketers 11@GartnerDigital gartner.com/[email protected]
Recommendations:
• Collaborate with sales and service organizations to identify processes where digital commerce could streamline the customer experience or business operations, such as giving business buyers the ability to interact with service and logistics. Prioritize and execute those with greatest business impact.
• Use Gartner’s hierarchy of digital commerce marketing metrics to track and show marketing impact, connecting tactical, operational and strategic key performance indicators (KPIs) to digital commerce business goals (see “Use the Hierarchy of Digital Commerce Marketing Metrics to Balance Business Results”).
Figure 5. Top Five Investments to Meet 2017 Business GoalsFigure 5. Top Five Investments to Meet 2017 Business Goals
Note: Percentages might not add up due to rounding.
Source: Gartner (October 2016)
Recommendations:
■ Collaborate with sales and service organizations to identify processes where digital commercecould streamline the customer experience or business operations, such as giving businessbuyers the ability to interact with service and logistics. Prioritize and execute those with greatestbusiness impact.
Gartner for Marketers 12@GartnerDigital gartner.com/[email protected]
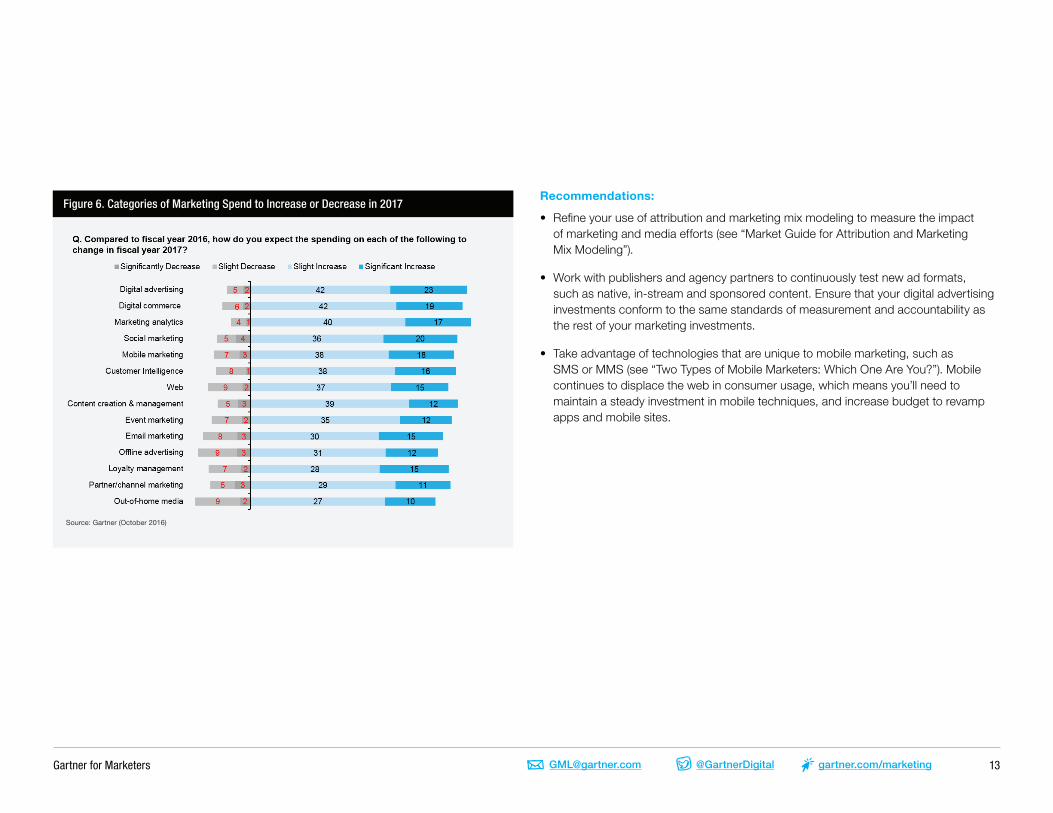
Nearly Two-Thirds of Marketing Leaders Plan to Increase Spending on Digital Advertising in 2017, Suggesting That Reports of Advertising’s Demise May Be Overstated
Despite concerns over ad effectiveness, opaque industry practices and the increasing use of ad blocking technologies by consumers, digital advertising (which includes search advertising) remains resilient. Out of 14 categories of marketing activity, 65% of marketing leaders surveyed told us they plan to increase their spending on digital advertising: 23% expect a significant increase and 42% anticipate a slight increase (see Figure 6). Contributing to the increase are:
• A continuing and consistent shift of offline media spending to digital channels.
• Decline of organic social in favor of paid social.
• The rising importance of video, which is more expensive than other digital techniques for both media and production. Survey respondents may be including video under their advertising budget rather than other categories of marketing spend.
We anticipate major publishers will experiment with new formats in video advertising, native advertising and sponsored content. The Interactive Advertising Bureau (IAB), an industry trade group, is preparing to debut new ad formats in 2017 designed to give consumers more control over the ads they see. The cost of these formats will oscillate until demand and available inventory stabilize.
Ten percent of marketers surveyed indicate they plan to cut spending in at least one of the following categories: website, email marketing, mobile marketing and offline advertising. Some cuts can be attributed to increased maturity and efficiency of programs rather than declining interest in these capabilities.
One theory for the decline in mobile marketing budgets is that companies have scaled back after making investments last year to comply with Google’s mobile-friendly requirements. Cuts in mobile marketing could also be the result of another issue that first surfaced in Gartner’s 2016 Digital Channel Survey. The majority of mobile marketers surveyed say they employ tactics that are extensions of web marketing, such as advertising, search and mobile-optimized sites, rather than technologies unique to mobile, such as low-frequency beacons (see “Digital Channel Survey 2016: Mobile and Social Continue to Migrate Into Marketing’s Infrastructure”). If mobile marketing is treated as a variation of web marketing, marketing leaders will have a difficult time maintaining or increasing budgets for mobile-only techniques.
Gartner for Marketers 13@GartnerDigital gartner.com/[email protected]
Recommendations:
• Refine your use of attribution and marketing mix modeling to measure the impact of marketing and media efforts (see “Market Guide for Attribution and Marketing Mix Modeling”).
• Work with publishers and agency partners to continuously test new ad formats, such as native, in-stream and sponsored content. Ensure that your digital advertising investments conform to the same standards of measurement and accountability as the rest of your marketing investments.
• Take advantage of technologies that are unique to mobile marketing, such as SMS or MMS (see “Two Types of Mobile Marketers: Which One Are You?”). Mobile continues to displace the web in consumer usage, which means you’ll need to maintain a steady investment in mobile techniques, and increase budget to revamp apps and mobile sites.
Figure 6. Categories of Marketing Spend to Increase or Decrease in 2017Figure 6. Categories of Marketing Spend to Increase or Decrease in 2017
Source: Gartner (October 2016)
Recommendations:
■ Refine your use of attribution and marketing mix modeling to measure the impact of marketingand media efforts (see "Market Guide for Attribution and Marketing Mix Modeling").
■ Work with publishers and agency partners to continuously test new ad formats, such as native,in-stream and sponsored content. Ensure that your digital advertising investments conform tothe same standards of measurement and accountability as the rest of your marketinginvestments.
■ Take advantage of technologies that are unique to mobile marketing, such as SMS or MMS (see"Two Types of Mobile Marketers: Which One Are You?"). Mobile continues to displace the webin consumer usage, which means you'll need to maintain a steady investment in mobiletechniques, and increase budget to revamp apps and mobile sites.
Gartner for Marketers 14@GartnerDigital gartner.com/[email protected]
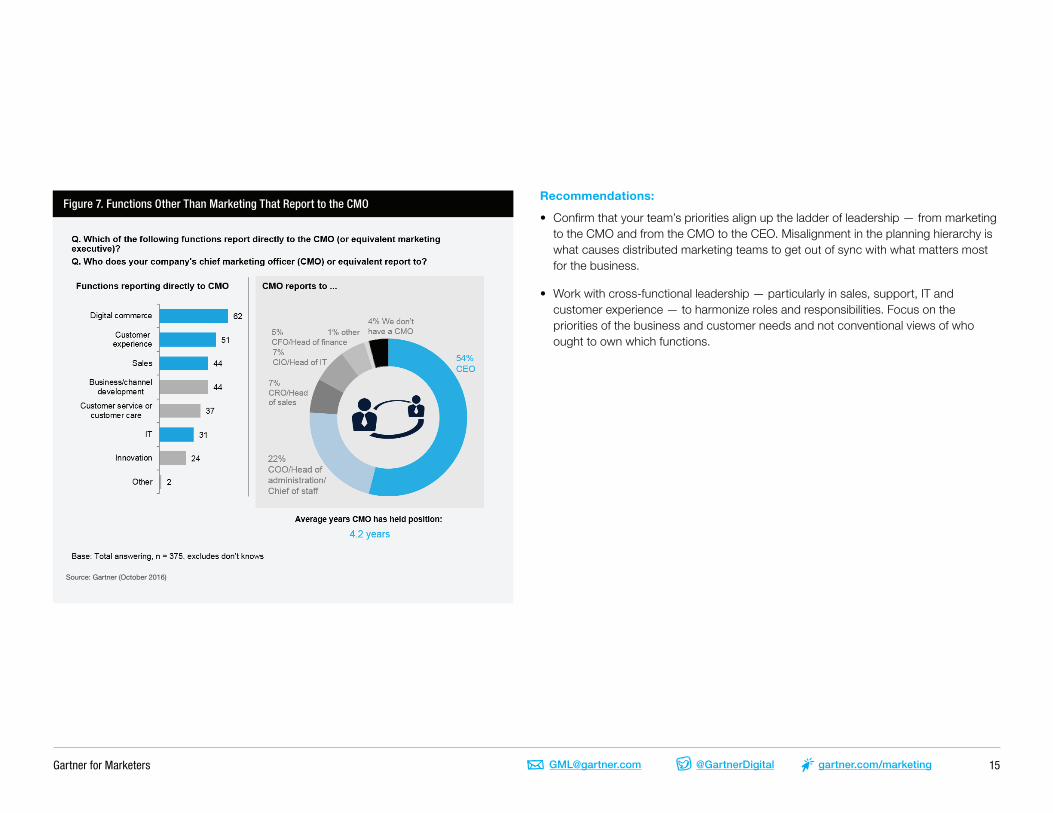
The CMO Takes on More Responsibility, as Some Sales, IT and Customer Experience Functions Now Report Into Marketing in 30% or More Organizations
Over the last several years, we’ve witnessed an expansion of the CMO mandate, from what was largely a promotional role to what is now often seen as the growth engine for the business. However, this year’s survey really drives this point home as CMOs are taking on more formal responsibility. In more than 30% of organizations, at least some aspects of sales, IT and customer experience report into the CMO (see Figure 7). Looking at this more closely, we see that 62% of companies say that digital commerce reports into the CMO. This is consistent with last year’s and this year’s findings on the continued importance of digital commerce as marketing accountability comes into focus.
Similarly, we see over half of companies with customer experience functions reporting into the CMO and, remarkably, 44% cited sales and 31% cited IT as now reporting into the CMO. It’s important to note that these respondents are likely accounting for fractional responsibility, not wholesale responsibility, for these functions. For example, in some cases, CMOs may take on an inside sales function and a digital commerce channel, while field sales maintains other reporting lines. Similarly, while we see anecdotal evidence of IT beginning to report into the CMO, this trend is immature. Thus, many of the 31% of respondents claiming that IT reports into the CMO are likely talking about fractional responsibilities — either a dotted-line reporting structure where the subset of the IT organization focused on marketing and digital innovation report into both the CIO and the CMO; or the technical team within marketing is under the direction of the chief marketing technologist.
In addition, marketing leaders have responsibility for marketing innovation projects. Marketing leaders surveyed say they set aside 10% of the marketing budget, on average, for innovation — about the same as those surveyed last year. Customer experience and digital commerce are the top two areas of innovation projects marketing leaders say they’re currently pursuing — 53% for customer experience and 51% for digital commerce.
Unsurprisingly, more than three-quarters of CMOs report into either the CEO, COO or another operating executive. Our survey also found the average tenure of CMOs is just over four years, with CMOs in smaller companies facing greater volatility than their counterparts in larger companies.
Gartner for Marketers 15@GartnerDigital gartner.com/[email protected]
Recommendations:
• Confirm that your team’s priorities align up the ladder of leadership — from marketing to the CMO and from the CMO to the CEO. Misalignment in the planning hierarchy is what causes distributed marketing teams to get out of sync with what matters most for the business.
• Work with cross-functional leadership — particularly in sales, support, IT and customer experience — to harmonize roles and responsibilities. Focus on the priorities of the business and customer needs and not conventional views of who ought to own which functions.
Figure 7. Functions Other Than Marketing That Report to the CMOFigure 7. Functions Other Than Marketing That Report to the CMO
Source: Gartner (October 2016)
Recommendations:
■ Confirm that your team's priorities align up the ladder of leadership — from marketing to theCMO and from the CMO to the CEO. Misalignment in the planning hierarchy is what causesdistributed marketing teams to get out of sync with what matters most for the business.
■ Work with cross-functional leadership — particularly in sales, support, IT and customerexperience — to harmonize roles and responsibilities. Focus on the priorities of the businessand customer needs and not conventional views of who ought to own which functions.
Customer Experience Functions Often Report Into the CMO While the ChiefCustomer Officer Reports Elsewhere, Leading to Potential Conflicts in Priorities
Of the 86% of companies surveyed that report they have a chief customer officer in title or roleequivalent, only one in 10 reports into the CMO (see figure 8). Most often, they report into an
Gartner for Marketers 16@GartnerDigital gartner.com/[email protected]
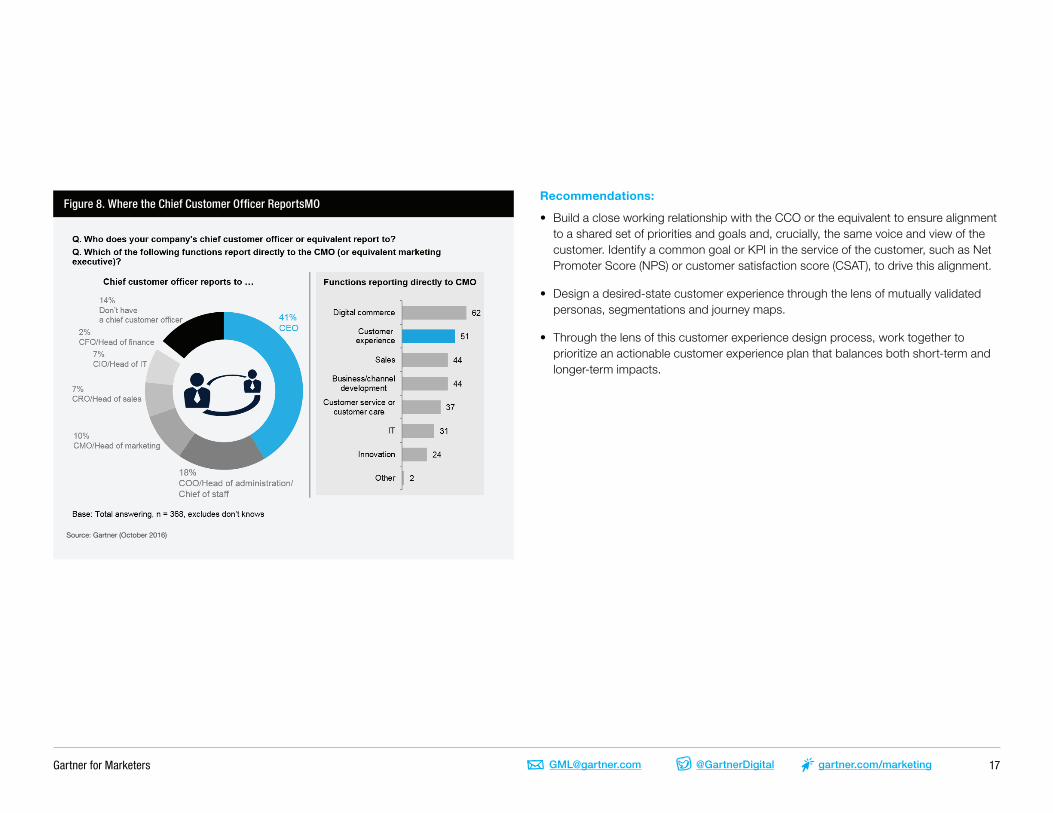
Customer Experience Functions Often Report Into the CMO While the Chief Customer Officer Reports Elsewhere, Leading to Potential Conflicts in Priorities
Of the 86% of companies surveyed that report they have a chief customer officer in title or role equivalent, only one in 10 reports into the CMO (see figure 8). Most often, they report into an operating role — either the CEO (41%) or the COO or its equivalent (18%). We’ve seen plenty of indications of marketing leadership stepping up to the customer experience imperative in both this and other surveys. According to these respondents, marketing has a high level of responsibility for everything from setting the strategy to designing the end-to-end customer experience. With this finding, we see that, more than half the time, customer experience functions are reporting into the CMO. This is likely fractional responsibility, reflecting the customer touchpoints the marketing organization owns and controls, such as web and mobile experiences, email and social channels, and in-store marketing. As customer journeys become increasingly self-directed and customer preferences migrate to digital channels, these marketing-controlled touchpoints will continue to expand. However, ownership of the overall customer experience — the chief customer officer — reports elsewhere.
This would seem to set up a conflict — and, in some organizations, it likely will. When accountability flows in one direction and authority in another, there’s bound to be tension. However, in this case, it might be a healthy tension. While marketing leaders are increasingly cognizant of longer-term customer experience goals, they’re often measured and motivated on the basis of shorter-horizon marketing performance goals. Independent reporting lines for the chief customer officer and his or her team ensure that there’s an empowered counterbalance between a marketer’s tendency to focus on short-term results and the longer-term strategic goal of retaining and growing the most profitable customer relationships.
Our survey found a higher percentage of chief customer officers report to the CMO at media companies (16%) and CPG companies (15%). The media sector, which includes entertainment companies, has pioneered digital interactions with customers in digital channels, from the website to email and now via social and mobile, creating a natural alliance between the CMO and chief customer officer in that segment.
Gartner for Marketers 17@GartnerDigital gartner.com/[email protected]
Recommendations:
• Build a close working relationship with the CCO or the equivalent to ensure alignment to a shared set of priorities and goals and, crucially, the same voice and view of the customer. Identify a common goal or KPI in the service of the customer, such as Net Promoter Score (NPS) or customer satisfaction score (CSAT), to drive this alignment.
• Design a desired-state customer experience through the lens of mutually validated personas, segmentations and journey maps.
• Through the lens of this customer experience design process, work together to prioritize an actionable customer experience plan that balances both short-term and longer-term impacts.
Figure 8. Where the Chief Customer Officer ReportsMOFigure 8. Where the Chief Customer Officer Reports
Source: Gartner (October 2016)
Recommendations:
■ Build a close working relationship with the CCO or the equivalent to ensure alignment to ashared set of priorities and goals and, crucially, the same voice and view of the customer.Identify a common goal or KPI in the service of the customer, such as Net Promoter Score(NPS) or customer satisfaction score (CSAT), to drive this alignment.
■ Design a desired-state customer experience through the lens of mutually validated personas,segmentations and journey maps.
■ Through the lens of this customer experience design process, work together to prioritize anactionable customer experience plan that balances both short-term and longer-term impacts.
Only a Quarter of IT Organizations Maintain Control Over Martech CapitalInvestments
More marketing leaders have a marketing capital budget for longer-term projects than in past years.Close to 90% surveyed say they have such a budget, up from 64% in 2012, revealing one more way
Gartner for Marketers 18@GartnerDigital gartner.com/[email protected]
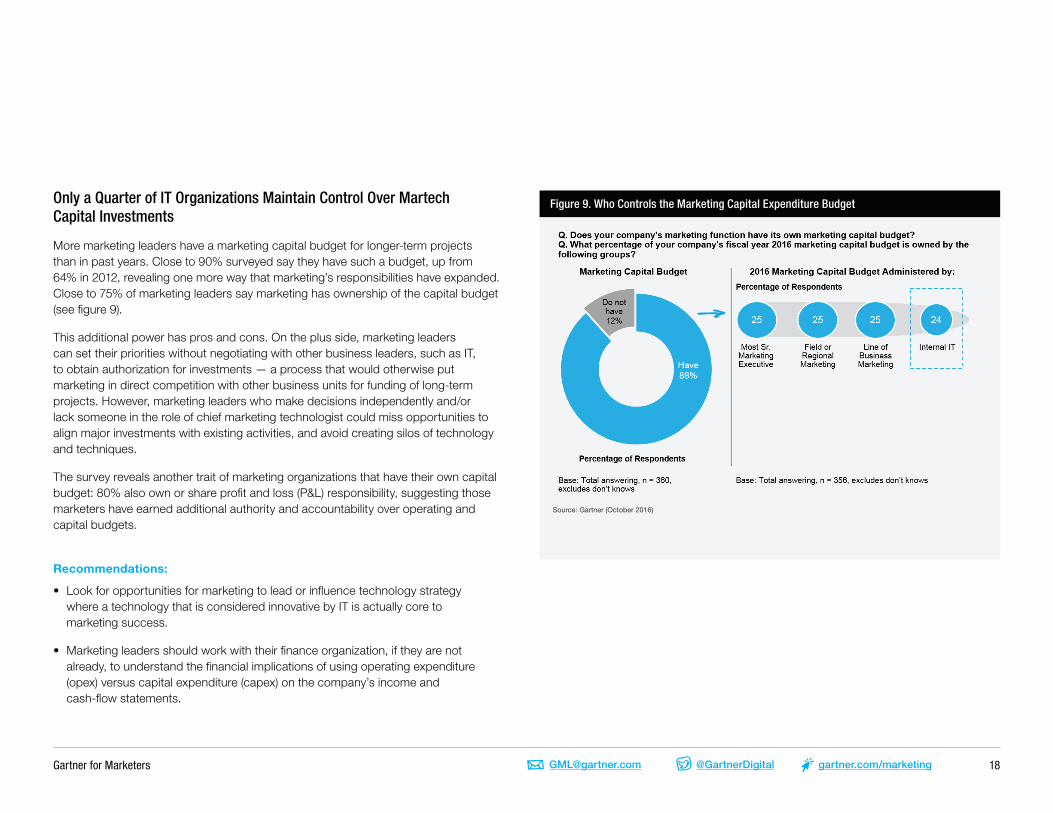
Only a Quarter of IT Organizations Maintain Control Over Martech Capital Investments
More marketing leaders have a marketing capital budget for longer-term projects than in past years. Close to 90% surveyed say they have such a budget, up from 64% in 2012, revealing one more way that marketing’s responsibilities have expanded. Close to 75% of marketing leaders say marketing has ownership of the capital budget (see figure 9).
This additional power has pros and cons. On the plus side, marketing leaders can set their priorities without negotiating with other business leaders, such as IT, to obtain authorization for investments — a process that would otherwise put marketing in direct competition with other business units for funding of long-term projects. However, marketing leaders who make decisions independently and/or lack someone in the role of chief marketing technologist could miss opportunities to align major investments with existing activities, and avoid creating silos of technology and techniques.
The survey reveals another trait of marketing organizations that have their own capital budget: 80% also own or share profit and loss (P&L) responsibility, suggesting those marketers have earned additional authority and accountability over operating and capital budgets.
Recommendations:
• Look for opportunities for marketing to lead or influence technology strategy where a technology that is considered innovative by IT is actually core to marketing success.
• Marketing leaders should work with their finance organization, if they are not already, to understand the financial implications of using operating expenditure (opex) versus capital expenditure (capex) on the company’s income and cash-flow statements.
Figure 9. Who Controls the Marketing Capital Expenditure Budget
that marketing's responsibilities have expanded. Close to 75% of marketing leaders say marketinghas ownership of the capital budget (see figure 9).
This additional power has pros and cons. On the plus side, marketing leaders can set their prioritieswithout negotiating with other business leaders, such as IT, to obtain authorization for investments— a process that would otherwise put marketing in direct competition with other business units forfunding of long-term projects. However, marketing leaders who make decisions independentlyand/or lack someone in the role of chief marketing technologist could miss opportunities to alignmajor investments with existing activities, and avoid creating silos of technology and techniques.
The survey reveals another trait of marketing organizations that have their own capital budget: 80%also own or share profit and loss (P&L) responsibility, suggesting those marketers have earnedadditional authority and accountability over operating and capital budgets.
Figure 9. Who Controls the Marketing Capital Expenditure Budget
Source: Gartner (October 2016)
Recommendations:
■ Look for opportunities for marketing to lead or influence technology strategy where atechnology that is considered innovative by IT is actually core to marketing success.
Gartner for Marketers 19@GartnerDigital gartner.com/[email protected]
Budgets of Marketing Leaders Who Own or Share P&L Responsibility Are 20% Higher, on Average, Than Those Without Plans for a P&L
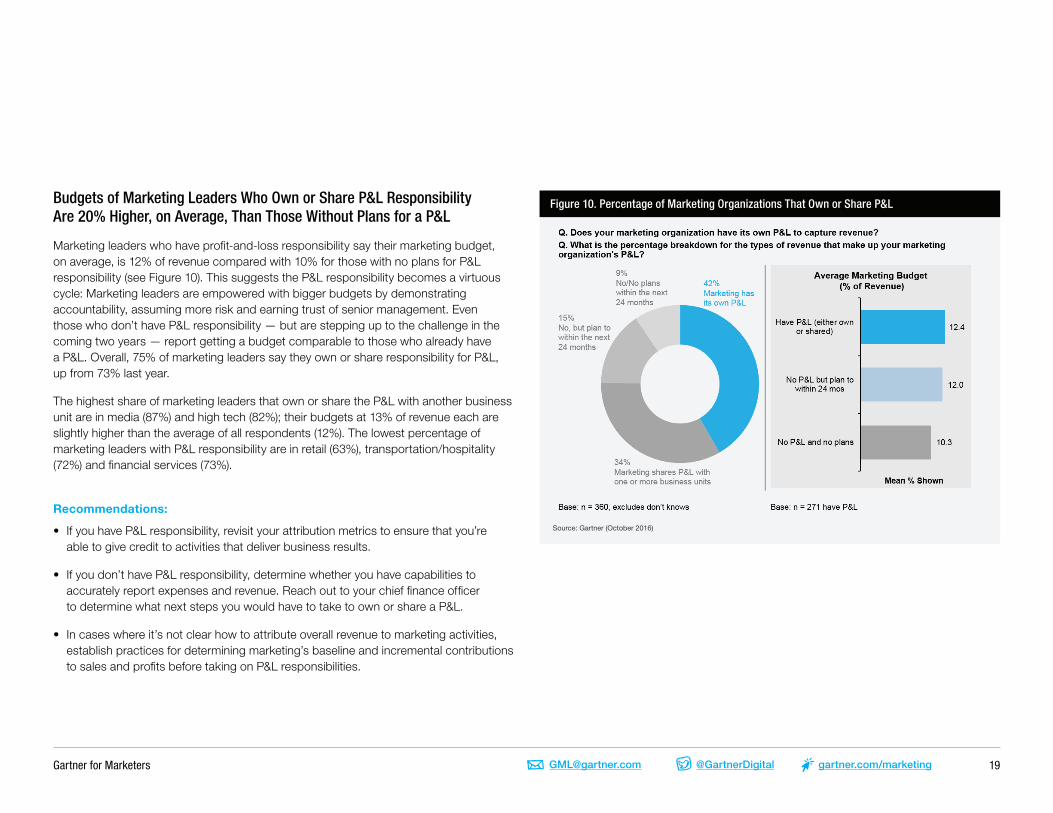
Marketing leaders who have profit-and-loss responsibility say their marketing budget, on average, is 12% of revenue compared with 10% for those with no plans for P&L responsibility (see Figure 10). This suggests the P&L responsibility becomes a virtuous cycle: Marketing leaders are empowered with bigger budgets by demonstrating accountability, assuming more risk and earning trust of senior management. Even those who don’t have P&L responsibility — but are stepping up to the challenge in the coming two years — report getting a budget comparable to those who already have a P&L. Overall, 75% of marketing leaders say they own or share responsibility for P&L, up from 73% last year.
The highest share of marketing leaders that own or share the P&L with another business unit are in media (87%) and high tech (82%); their budgets at 13% of revenue each are slightly higher than the average of all respondents (12%). The lowest percentage of marketing leaders with P&L responsibility are in retail (63%), transportation/hospitality (72%) and financial services (73%).
Recommendations:
• If you have P&L responsibility, revisit your attribution metrics to ensure that you’re able to give credit to activities that deliver business results.
• If you don’t have P&L responsibility, determine whether you have capabilities to accurately report expenses and revenue. Reach out to your chief finance officer to determine what next steps you would have to take to own or share a P&L.
• In cases where it’s not clear how to attribute overall revenue to marketing activities, establish practices for determining marketing’s baseline and incremental contributions to sales and profits before taking on P&L responsibilities.
Figure 10. Percentage of Marketing Organizations That Own or Share P&LFigure 10. Percentage of Marketing Organizations That Own or Share P&L
Source: Gartner (October 2016)
Recommendations:
■ If you have P&L responsibility, revisit your attribution metrics to ensure that you're able to givecredit to activities that deliver business results.
■ If you don't have P&L responsibility, determine whether you have capabilities to accuratelyreport expenses and revenue. Reach out to your chief finance officer to determine what nextsteps you would have to take to own or share a P&L.
■ In cases where it's not clear how to attribute overall revenue to marketing activities, establishpractices for determining marketing's baseline and incremental contributions to sales andprofits before taking on P&L responsibilities.
Methodology
This marks the fifth consecutive year that Gartner has surveyed marketing leaders on their spendingplans and priorities. This year's survey has been updated to add perspective on overall marketingbudget trends, roles and responsibilities. The changes this year include:
Gartner for Marketers 20@GartnerDigital gartner.com/[email protected]
This marks the fifth consecutive year that Gartner has surveyed marketing leaders on their spending plans and priorities. This year’s survey has been updated to add perspective on overall marketing budget trends, roles and responsibilities. The changes this year include:
• Total budget was broken into four categories this year with paid media broken out as a separate category of spend alongside labor, technology and services. In the past, the total budget was broken down into only three categories — labor, technology and services — and paid media was included under services. The result is that direct year-over-year comparisons are not possible without additional calculations.
• Estimated percentage of spend across 14 categories of marketing, such as digital advertising and events, is taken as a percentage of the entire marketing budget. In the past, the survey primarily focused on digital marketing tactics as a percentage of the digital marketing budget (a subcomponent of the total marketing budget). The result is that direct year-over-year comparisons are not possible without additional calculations.
• Search advertising is included under digital advertising instead of as a stand-alone category.
• Addition of an examination of the CMO’s role and increased responsibilities, including functions reporting to marketing.
METHODOLOGYThe research was conducted using a mixed methodology of online and CATI from July through August 2016. Of the 377 respondents, 56% were in the U.S., 14% were in Canada and 30% were in the U.K. Seventy percent of the respondents came from organizations with $1 billion or more in annual revenue.
The respondents came from a variety of industries: financial services (65 respondents), high tech (80 respondents), manufacturing (43 respondents), consumer products (47 respondents), media (33 respondents), retail (63 respondents), transportation and hospitality (38 respondents), and other industries (8 respondents).
The survey was developed collaboratively by a team of Gartner analysts who follow marketing and was reviewed, tested and administered by Gartner’s Research Data Analytics team.
Gartner for Marketers 21@GartnerDigital gartner.com/[email protected]
Content creation and management: The process and practice in marketing of creating, curating and cultivating text, video, images, graphics, e-books, white papers and interactive content assets that are distributed through media platforms and social media.
Customer experience: The practice of designing for and reacting to customer interactions to meet and exceed customer expectations to increase customer satisfaction, loyalty and advocacy. Because we’re viewing the customer experience from the perspective of the digital marketer, customer encompasses any potential buyer in the entire engagement life cycle of awareness, intention, desire, action and advocacy. Here, the word customer is used synonymously with prospect, audience and influencer.
Customer intelligence: The capture and analysis of customer metrics, such as loyalty and satisfaction, churn/retention, and share of wallet/customer profitability, to better understand and respond to customer interactions and needs.
Digital advertising: Paid media in digital channels that uses text, images, audio, video and/or interactive elements. It includes search, online display, video and social ads.
Digital business models: Plans to derive value from blurring the boundaries between the digital and physical worlds due to the convergence of people, business and things. Examples of digital business models include online marketplaces, services marketplaces and the sale of goods or services as subscription. In manufacturing, an example is the use of a platform that lets designers, scientists, engineers, makers and early adopters create ideas, test the ideas within the community, prototype and build the product in a microfactory, and market and sell the solution.
Digital commerce: The act of buying and selling goods and services using the web, mobile and social networks, and commerce infrastructure. It includes the marketing activities that support these transactions, including people, processes and technologies to execute offering development, content, analytics, promotion, pricing, customer acquisition and retention, and customer experience at all points throughout the customer journey.
DEFINITIONSDigital marketing: A set of techniques, enabled by technology, to target, acquire and retain customers, improve the processes to support customer engagement across multiple channels, align marketing and business goals, create new products and services, enter new markets, and allocate resources appropriately for future growth. Activities are internet- and online-channel-based, such as social, mobile, digital commerce and analytics.
Digital marketing budget: Spending on marketing activities that are internet- and online-channelbased, such as social, mobile and commerce. It includes labor costs, investments in software-as-aservice capabilities and external marketing services like digital agencies. It does not include capital to purchase software or the infrastructure to run it on.
Email marketing: The use of the email channel to deliver marketing messages, e.g., brand newsletters or contextually relevant, real-time and personalized communications in support of touchpoints throughout the customer life cycle.
Event marketing: Live events where audiences interact with a product or brand face to face. Loyalty management: The use of techniques and tools to support the acquisition and long-term retention of customers.
Marketing analytics: Encompasses techniques and tools to understand and improve user experience, prospect and customer acquisition, and behavior across channels, and to optimize marketing and advertising campaigns.
Marketing applications: Applications purchased for on-site use or as software-as- a-service (for example, marketing automation, digital commerce, digital marketing, customer analytics [like web, blog and mobile], campaign management or social media).
Marketing capital budget/Marketing capital expenditures budget: Anticipated l arge expenditures for assets that are capitalized and depreciated, such as marketing software that is installed and runs in your company’s data center, computer equipment and major tradeshow exhibits.
Gartner for Marketers 22@GartnerDigital gartner.com/[email protected]
Marketing expense budget: The anticipated annual costs, such as expenses spent on marketing— for example, salaries, advertising, research, campaigns, marketing consultants or agencies, and marketing software purchased as a service, or the depreciation and maintenance costs of capitalized marketing software. Does not include capital expenditure budget, for example, for marketing software that is installed and runs in your company’s data center or the infrastructure to run it that is capitalized.
Marketing services: The use of agencies and consultancies as well as new types of organizations, such as freelance marketplaces, that offer services and engagement options.
Mobile marketing: Marketing initiatives to enable customers and prospects to use their mobile devices to link to their offline and online experiences with a business. Includes mobile advertising, mobile messaging, mobile-optimized websites and mobile application.
Offline advertising: Major mass media for advertising preinternet (e.g., television, radio and print media).
Out-of-home media: Any type of communication that reaches an individual while they are out of the home, physical or electronic.
P&L: Shorthand for a profit and loss statement, which measures income and expenses over time. In this context we are asking whether marketing has responsibility for a profit center that recognizes revenue and associated expenses for certain sales.
Partner/channel marketing: Techniques that marketers in manufacturing use to manage relationships with marketing, sales, account managers and program managers. Examples include the use of collaboration platforms, campaign and lead management, sales enablement, and partner program management.
DEFINITIONSSocial marketing: A digital environment in which content is created, consumed, promoted, distributed, discovered or shared for purposes that are primarily related to communities and social activities.
Web: A company’s online presence to support overall marketing objectives. Includes search engine optimization (SEO).
Additional contribution: Karen Carter of Gartner’s Primary Research Management Design and Delivery team.
“ Digital Channel Survey 2016: Social Marketers Expand Tactics for Results”
“ CMO Spend Survey 2015-2016: Digital Marketing Comes of Age”
Evidence
1. Budgets include labor, marketing technology, external services and paid media for traditional activities (e.g., TV, radio and print advertising) and well as for digital marketing.
2. P. Demery, “Metalworking manufacturers sharpen their e-commerce strategies,” Vertical Web Media, 19 September 2016.
Gartner for Marketers 24@GartnerDigital gartner.com/[email protected]
Digital has redefined the role of marketing, adding new players and creating bigger complexities
Gartner for Marketers helps you get up to speed on and stay smarter in the eight marketing areas that matter most: social, mobile, multichannel and data-driven marketing, digital commerce, customer experience, marketing management, and emerging marketing technology & trends. Our clients say that they use our real-time, expert advice and objective research, data and tools to:
• Target the right audiences
• Choose the right channels
• Quickly shortlist marketing and technology providers
• Stay informed on market and competitors
• Save time and avoid costly mistakes
Gartner helps companies improve their business results through the use of technology. Our independent research and advice is trusted by business and technology leaders in more than 10,000 distinct enterprises around the world.