GAS APPLIANCE CHECK PROJECT Dr. Ben Croxford February 2007 A report on a project funded by the UK Health and Safety Executive. Dr Ben Croxford Bartlett School of Graduate Studies University College London 1-19 Torrington Place London WC1E 6BT [email protected]Bartlett School of Graduate Studies
Transcript
GAS APPLIANCE CHECK PROJECT
Dr. Ben Croxford
February 2007 A report on a project funded by the UK Health and Safety Executive. Dr Ben Croxford Bartlett School of Graduate Studies University College London 1-19 Torrington Place London WC1E 6BT [email protected]
Bartlett School of Graduate Studies
Gas Appliance Check Project
- i -
EXECUTIVE SUMMARY........................................................................................................... 1 OVERALL RESULTS .................................................................................................................. 1 HOUSING STOCK ANALYSIS....................................................................................................... 1 OCCUPANT ANALYSIS............................................................................................................... 2 HOUSEHOLD ANALYSIS............................................................................................................. 2 HOUSEHOLDER ANALYSIS......................................................................................................... 2 GAS APPLIANCE ANALYSIS........................................................................................................ 2 PROBLEM GAS APPLIANCE ANALYSIS ......................................................................................... 2 NATIONAL ESTIMATES .............................................................................................................. 2 CARBON MONOXIDE MEASUREMENTS........................................................................................ 3 CARBON MONOXIDE EXPOSURE RISK......................................................................................... 3 HEALTH EFFECTS..................................................................................................................... 3 CONCLUSION........................................................................................................................... 3
3.1 GEOGRAPHICAL COVERAGE OF THE SAMPLE................................................................. 8 3.2 NATIONAL AND LOCAL HOUSING STOCK ANALYSIS ......................................................... 8
3.2.1 Housing stock by type.......................................................................................... 8 3.2.2 Housing stock by age........................................................................................... 9 3.2.3 Housing stock by tenure ...................................................................................... 9 3.2.4 Location of gas meter .......................................................................................... 9
3.3 NATIONAL AND LOCAL SOCIO-ECONOMIC ANALYSIS ..................................................... 10 3.3.1 Age profile of households .................................................................................. 10 3.3.2 Occupants per household.................................................................................. 10 3.3.3 Benefits .............................................................................................................. 10
4 CP14 ANALYSIS............................................................................................................ 12 4.1 LOCAL ANALYSIS....................................................................................................... 13
4.1.1 CP14’s by house type........................................................................................ 13 4.1.2 CP14’s by age of housing.................................................................................. 13 4.1.3 CP14’s by tenure ............................................................................................... 14
4.2 HOUSEHOLDER ANALYSIS.......................................................................................... 14 4.2.1 CP14’s and older residents................................................................................ 14 4.2.2 Number of residents and CP14’s....................................................................... 14 4.2.3 CP14’s for households in receipt of benefits ..................................................... 15 4.2.4 Detailed analysis of CP14’s by age of household members and benefits......... 15
4.3 EXTRAPOLATIONS OF RESULTS TO HOUSING STOCK OF ENGLAND, SCOTLAND AND WALES 15 4.4 NOTES ON CP14 ANALYSIS ....................................................................................... 16
5 GAS APPLIANCE ANALYSIS ....................................................................................... 17 5.1 COOKER .................................................................................................................. 18
5.1.1 Cooker CO emissions (into the room) ............................................................... 19 5.1.2 Kitchen ventilation systems ............................................................................... 20
5.2 BOILER .................................................................................................................... 20 5.2.1 Boiler CO (flue gas concentration)..................................................................... 21
5.3 GAS FIRE, LIVING ROOM ............................................................................................ 22 5.3.1 Gas Fire, living room, CO emissions (into the room)......................................... 23
5.4 GAS FIRE, OTHER ..................................................................................................... 24 5.4.1 Gas Fire, other, CO emissions (into the room).................................................. 24
Gas Appliance Check Project
- ii -
5.5 GAS WATER HEATER ................................................................................................. 25 5.5.1 Water heater CO (flue gas concentrations) ....................................................... 25
9.5 CO EXPOSURE RISK: RESULTS.................................................................................. 34 9.6 EXAMPLE RISK ASSESSMENTS FROM INDIVIDUAL CASES .............................................. 35
10 APPENDICES................................................................................................................. 37 10.1 APPENDIX A: EXTRA INFORMATION FROM ANALYSIS.................................................... 37
10.1.1 Brand information for gas appliances............................................................ 37 10.1.2 Household details compared with national figures where available.............. 37 10.1.3 General Health .............................................................................................. 38 10.1.4 Analysis Notes............................................................................................... 38 10.1.5 NOTES on Gas suppliers .............................................................................. 39 10.1.6 NOTES on Maintenance................................................................................ 39 10.1.7 NOTES on Cookers....................................................................................... 39 10.1.8 NOTES on General Health ............................................................................ 39 10.1.9 NOTES on CP14 coding................................................................................ 39 10.1.10 NOTES on RIDDOR...................................................................................... 39 10.1.11 NOTES on Warm Front Reporting ................................................................ 40 10.1.12 NOTES on Replacement Cookers ................................................................ 40
10.2 APPENDIX B : HOUSING SURVEY QUESTIONNAIRE....................................................... 41 10.3 APPENDIX C : HOUSEHOLDER QUESTIONNAIRE .......................................................... 43
Gas Appliance Check Project
- iii -
FIGURES FIGURE 1 : AREA COVERED BY THE SURVEY, EXCLUDING 3 HOMES FROM MILTON KEYNES. ....................8 FIGURE 2 : DISTRIBUTION OF COOKER AGE ACROSS THE SAMPLE ............................................................19 FIGURE 3 : MEAN CARBON MONOXIDE CONCENTRATION MEASURED FROM COOKERS SPLIT BY THEIR AGE
RANGE. ..........................................................................................................................................19 FIGURE 4 : MEAN CARBON MONOXIDE CONCENTRATION MEASURED FROM COOKERS SPLIT BY
MAINTENANCE WITHIN THE LAST YEAR. ........................................................................................20 FIGURE 5 : DISTRIBUTION OF BOILER AGE ...............................................................................................20 FIGURE 6 : MEAN CARBON MONOXIDE CONCENTRATION MEASURED FROM BOILERS SPLIT BY THEIR AGE
RANGE. ..........................................................................................................................................21 FIGURE 7 : MEAN CARBON MONOXIDE CONCENTRATION MEASURED FROM BOILERS SPLIT BY IF THE
OWNERS HAD A MAINTENANCE CERTIFICATE OR NOT. ...................................................................21 FIGURE 8 : MEAN CARBON MONOXIDE CONCENTRATION MEASURED FROM BOILERS SPLIT BY AGE AND IF
THE OWNERS HAD A MAINTENANCE CERTIFICATE OR NOT. ............................................................22 FIGURE 9 : DISTRIBUTION OF GAS FIRE AGE.............................................................................................22 FIGURE 10 : MEAN CARBON MONOXIDE CONCENTRATIONS MEASURED FROM GAS FIRES (MAIN ROOM)
SPLIT BY THEIR AGE RANGE. ..........................................................................................................23 FIGURE 11 : MEAN CARBON MONOXIDE CONCENTRATIONS MEASURED FROM GAS FIRES (MAIN ROOM)
SPLIT BY MAINTENANCE IN THE LAST YEAR OR NOT.......................................................................23 FIGURE 12 : DISTRIBUTION OF GAS FIRE (OTHER) AGE.............................................................................24 FIGURE 13 : MEAN CARBON MONOXIDE CONCENTRATIONS MEASURED FROM GAS FIRE (OTHER) SPLIT BY
THEIR AGE RANGE. .........................................................................................................................24 FIGURE 14 : MEAN CARBON MONOXIDE CONCENTRATIONS MEASURED FROM GAS FIRE (OTHER) SPLIT BY
MAINTENANCE IN THE LAST YEAR OR NOT. ....................................................................................25 FIGURE 15 : DISTRIBUTION OF WATER HEATER AGE...............................................................................25 FIGURE 16 : MEAN CARBON MONOXIDE CONCENTRATIONS MEASURED FROM WATER HEATERS SPLIT BY
THEIR AGE RANGE. .........................................................................................................................26 FIGURE 17 : MEAN CARBON MONOXIDE CONCENTRATIONS MEASURED FROM WATER HEATERS SPLIT BY
MAINTENANCE IN THE PAST YEAR OR NOT. ....................................................................................26 FIGURE 18 : DISTRIBUTION OF GAS BILLS (DATA FROM 505 HOMES).......................................................38 FIGURE 19 : FREQUENCY DISTRIBUTION OF GENERAL HEALTH ................................................................38
Gas Appliance Check Project
- iv -
TABLES TABLE 1 : GAS APPLIANCE CHECK ENGINEERS ..........................................................................................7 TABLE 2 : HOUSING STOCK BY TYPE .........................................................................................................9 TABLE 3 : HOUSING STOCK BY AGE...........................................................................................................9 TABLE 4 : HOUSING STOCK BY TENURE.....................................................................................................9 TABLE 5 : GAS METER LOCATION.............................................................................................................9 TABLE 6 : HOUSEHOLD AGE PROFILE.......................................................................................................10 TABLE 7 : OCCUPANTS PER HOUSEHOLD .................................................................................................10 TABLE 8 : PRIORITY SERVICE REGISTER AWARENESS .............................................................................11 TABLE 9 : CARBON MONOXIDE AWARENESS (RESPONDENTS COULD TICK SEVERAL OF THESE ITEMS) .....11 TABLE 10 : BREAKDOWN OF OVERALL CP14’S ISSUED ...........................................................................12 TABLE 11 : TOTAL CP14’S ISSUED BROKEN DOWN BY HOUSE TYPE (SOME HOUSE TYPE INFORMATION
MISSING) ........................................................................................................................................13 TABLE 12 : CP14’S ISSUED BY AGE OF HOUSING .....................................................................................13 TABLE 13 : CP14S ISSUED BY TENURE.....................................................................................................14 TABLE 14 : TOTAL CP14’S ISSUED BROKEN DOWN BY AGE CATEGORY ...................................................14 TABLE 15 : TOTAL CP14’S ISSUED BROKEN DOWN BY NUMBERS OF RESIDENTS......................................14 TABLE 16 : TOTAL CP14’S ISSUED BROKEN DOWN BY BENEFITS RECEIPTS .............................................15 TABLE 17 : TOTAL CP14’S ISSUED BROKEN DOWN BY AGE AND BENEFIT RECEIPT ..................................15 TABLE 18 : ESTIMATE OF TOTAL NUMBERS OF CP14’S ACROSS ENGLAND, SCOTLAND AND WALES.......16 TABLE 19 : TOTAL CP14’S ISSUED BROKEN DOWN BY APPLIANCE TYPE (INCLUDING NCS DETAILS) .17 TABLE 20 : COOKER VENTILATION SYSTEM PREVALENCE .......................................................................20 TABLE 21 : QUESTIONNAIRE RESPONDENT SYMPTOM PREVALENCE ........................................................31 TABLE 22 : HEALTH SYMPTOMS AND CP14’S..........................................................................................32 TABLE 23 : HEALTH SYMPTOMS AND PROBLEM APPLIANCES...................................................................32 TABLE 24 : COMMENTS FROM HOMES OF RESPONDENTS REPORTING 3+ HEALTH SYMPTOMS BUT WITH NO
CP14’S ..........................................................................................................................................32 TABLE 25 : PREVALENCE OF CO RISK CATEGORIES ACROSS THE SAMPLE ...............................................34 TABLE 26 : PREVALENCE OF ANY HEALTH SYMPTOM REPORTED BY CO RISK CATEGORY ACROSS THE
SAMPLE..........................................................................................................................................34 TABLE 27 : BANDED HEALTH SYMPTOMS REPORTED BY GROUPED CO RISK CATEGORY ACROSS THE
SAMPLE..........................................................................................................................................34 TABLE 28 : GAS COOKER BRAND PREVALENCE........................................................................................37 TABLE 29 : BOILER BRAND PREVALENCE ................................................................................................37 TABLE 30 : GAS FIRE BRAND PREVALENCE..............................................................................................37 TABLE 31 : HOUSEHOLD GAS SUPPLIER ...................................................................................................38 TABLE 32 : HOMES WITH REPLACEMENT COOKERS PROVIDED.................................................................40
Gas Appliance Check Project
- 1 -
Executive Summary A large snap shot survey of every element of each gas appliance in nearly 600 homes was carried out over the summer of 2006. Experienced CORGI registered gas engineers carried out the checks along with surveys of the house and of the householder. The gas engineers followed the guidelines laid out in section 26(9) of the Gas Safety (Installation and Use) Regulations 1998 (OPSI 1998) in assessing whether gas appliances and/or their installations were At Risk (AR) or Immediately Dangerous (ID) as specified in the Gas Industry Unsafe Situations Procedure (CORGI 2005).. A flue gas analyser (FGA) was also used to measure concentrations of carbon monoxide (CO) and carbon dioxide (CO2) in the combustion products produced by the appliances and to provide an indication of the possible concentration of CO emitted into the room. Due to time and money pressures the full procedures used to carry out these measurements were not those specified in BS 7967-2: (2005) Carbon monoxide in dwellings and the combustion performance of gas-fired appliances – Part 2: Guide for using electronic portable combustion gas analysers in the measurement of carbon monoxide and the determination of combustion performance. The methods used for each appliance type and the implications of this and results from all the measurements taken can be found in the detailed appliance type analysis in section 5, and in the risk analysis section in Annex 1. The engineers found that:
• 22% of homes had a gas appliance installation that was rated either AR or ID, • In total 96 appliances were found to be ‘Immediately Dangerous’ and disconnected,
three of these situations were rated as particularly dangerous by the engineers, • Gas fires were found to be the most frequently problematic appliance. • 45% of occupants questioned had received no information on CO risks and only 3%
had heard of the Priority Service Register. The homes surveyed were mainly from the South and East areas of Greater London and as such do not necessarily constitute a representative sample of homes in the UK. The sample substantially over represented, terraced housing, and housing built “between the wars”. The sample had a much higher proportion of pensioners and a higher proportion of those on benefits than the UK as a whole. However the sample did cover a range of housing types, house ages, tenures, occupant densities, occupant ages, and socio-economic status allowing limited extrapolation of the results to the UK population. The following paragraphs sum up the detailed findings of the survey.
Overall results 597 homes were surveyed, 1414 appliances were checked, gas engineers issued warnings (CP14 notices under the CORGI unsafe situations procedure) for 153 individual appliances in 131 homes. Of these notices, 96 referred to Immediately Dangerous (ID) appliances.
Housing stock analysis Homes surveyed had a higher proportion of terraced housing, and housing built between the wars than the national average. Flats and detached houses were underrepresented by the survey. The survey aimed to include only owner occupied homes but 10% of homes surveyed were rented. This is a lower proportion of rented accommodation than found nationally.
Gas Appliance Check Project
- 2 -
Occupant analysis Half the homes were occupied by pensioners; a higher proportion than nationally. The distribution of number of occupants was very similar to the national profile. The sample was worse off than average as more people were in receipt of benefits in the sample than nationally.
Household analysis Most households had British Gas as their gas supplier, but a slightly higher proportion than nationally. Average gas bills were similar to national averages. One third of homes had their gas meter located outside their property. About half of homes had had their appliances checked when they moved into their current home.
Householder analysis Very few had heard of the Priority Service Register scheme for free appliance checks for pensioners and other eligible persons (3%). CO awareness was poor with 45% having received no information about the dangers of CO. This is important as the sample is likely to be skewed towards those with a concern about gas appliances and may suggest that the proportion of the general population unaware of CO risks and the PSR may be even higher than 45% and 97% respectively.
Gas appliance analysis Almost all homes had a gas boiler, predominant brands were Ideal, Vaillant and Potterton, average age was about 7.5 years. Four fifths of homes had a gas cooker, average age of these was about 8 years old, the main brand was Cannon. Gas fires were found in less than half of all homes, with an average age of 13 years. Main brands were Valor and Robinson Willey. Only a few homes had gas water heaters.
Problem gas appliance analysis 22% of all homes were found to have at least one gas appliance installation rated as At Risk (AR) or Immediately Dangerous (ID). Gas fires were found to be the appliance most likely to be rated as such (26% of all gas fires) then cookers, (7% of all cookers), boilers were least likely (5% of all boilers). The following all had a higher prevalence of problem gas appliances:
- Semi-detached housing, compared to other house types - Housing built between the wars, compared to other ages of homes - Younger households compared to those with members over the age of 65 - Larger households compared to 1 or 2 member households - Households in receipt of any benefits, compared to those receiving none - Younger households receiving benefits had more than twice the prevalence of problem gas appliances than those receiving no benefits with at least one member over 65. - Householders reporting more health symptoms related to CO exposure were found to be more likely to have a problem gas appliance installation - Tenure made no significant difference to prevalence of problem gas appliances.
National estimates To reach a national estimate for the prevalence of problem gas appliances, the data were broken down by different categories and a weighting applied to the proportion found in this survey compared to the proportion found nationally. This resulted in a range estimate of between 15% and 23% of homes that could have a gas appliance installation rated as AR or ID. The lowest estimate was based on the age of house, the highest based on proportion of homes with pensioners. The extrapolations are based on the relatively small sample of 597 homes in London and the South East and these may not represent features shown in other parts of the country or across all 22 million gas subscribers.
Gas Appliance Check Project
- 3 -
Carbon monoxide measurements In general older appliances were found to emit higher CO concentrations, either in the flue gases for the case of boilers and water heaters or into the room in the case of gas cookers and fires, some of the differences seen between groups of appliances of similar ages were statistically significant, no significant difference in CO measurements were seen between appliances that had maintenance and those that did not. Only boilers had sufficient numbers of maintenance certificates for these to be used in the analyses, for the case of other appliances, we used the owners’ assessment of whether maintenance had been carried out in the previous year. However, it has already been noted the procedure set down in BS 7967 (2005) for taking CO measurements was not followed. Further work would be needed to validate these findings.
Carbon monoxide exposure risk The analysis of the estimated CO exposure risk for households was carried out based on the judgement of the researcher and the manager of the gas engineers, for more details see Annex 1. 2% of all homes were assessed to have a “very high” risk, and a further 4% were estimated as having a “high” risk of exposure to concentrations of CO above WHO guideline levels. (A very high risk might be if a grill was found to be emitting concentrations of CO >500 ppm or more). It is important to also note that the survey was carried out on gas appliances in summer; when the appliances may not be used as much and windows are more likely to be open. Actual CO risk and exposure to an occupant depends on their appliance use, ventilation use, and their behaviour.
Health effects The gas engineers asked questions developed in conjunction with the Medical Toxicology unit at Guys and St Thomas’s hospital trust, about symptoms known to be related to carbon monoxide (CO) exposure and the findings are given in Annex 1. There does appear to be a link between those reporting health symptoms and the presence of AR or ID appliances. There is also a strong indication that those with higher assessed CO exposure risk are more likely to report health symptoms. Even though the numbers involved are small the differences seen between some groups are statistically significant. However in this report no attempt has been made to compensate the results for confounding factors such as smoking, diet or socio-economic status. The health symptom findings are currently being analysed in more detail, with medical colleagues.
Conclusion In general the risk from CO of a problem gas appliance installation to householders depends on the appliance and also on behavioural factors; how they use that appliance, and how they use available ventilation. However, a problem gas appliance installation is a health risk that can be avoided with regular servicing, awareness of the dangers of CO, and knowledge of how to use appliances correctly. A small number of homes (3 of 600) were found to have particularly dangerous situations in their homes which were identified and made safe, the identification of these, the replacement of 5 dangerous cookers in vulnerable households, and the identification of 96 immediately dangerous appliance installations can be considered an important achievement of this project. This project adds evidence to that from previous surveys conducted by the author and others, that there could be a large number of gas appliance installations with problems within UK homes. It also confirms widespread ignorance of CO risks in the home and suggests that better awareness of CO is essential to ensure householders use gas appliances safely and have them serviced regularly because many of the problems found would have been identified during a safety check and/or service.
Gas Appliance Check Project
- 4 -
1 Introduction This report is based on work carried out between April and August 2006 to investigate the prevalence of gas appliances in UK homes that could put the householder at risk of exposure to a high concentration of carbon monoxide (CO). CO is a colourless, odourless gas that is lethal at high concentrations, Penney estimates an exposure to a concentration of 500ppm will cause death after many hours (Penney 2002), sub-lethal levels can cause paralysis and brain damage, exposure to lower levels for differing amounts of time causes various symptoms including headaches, nausea, fatigue, and dizziness (WHO 1999). The symptoms experienced depend on the person, the CO concentration and the exposure time. The World Health Organisation (WHO) guidelines for ambient, outdoor air (WHO, 1999) relate the CO concentration in air to the carboxyhaemoglobin (COHb) level in the blood and its effect on health. They are designed to ensure that a COHb level of 2.5% is not exceeded even when a normal subject engages in light or moderate exercise. The relationship between the concentration of CO and duration of exposure for a typical adult and a COHb level of 2.5% are: 100 mg/m3 (87 ppm) for 15 minutes 60 mg/m3 (52 ppm) for 30 minutes 30 mg/m3 (26 ppm) for 1 hour 10 mg/m3 (9 ppm) for 8 hours. The Committee on Medical Effects of Air Pollutants (COMEAP) recommended that the same concentrations and averaging times should be used for guidelines for indoor air quality (Department of Health, 2000). The basis for this project was work carried out by the author that found a relatively high prevalence of problem gas appliances in two previous projects. These previous projects were conducted with a team including medical toxicologists and psychiatrists. The aim was to find if long term exposure to levels of CO below those normally considered dangerous could have measurable neurological effects. Across two projects we monitored CO concentrations in 56 and then 270 vulnerable homes. We were aiming to find individuals who had been exposed to CO concentrations above WHO guideline levels (WHO 1999), and compare these individuals with those with a lower exposure. The numbers of high exposure individuals assessed were insufficient to prove the hypothesis. One of the problems with this study was that we selected only “vulnerable” households as these were considered most likely to have older, poorly maintained appliances that could be sources of CO, these contained individuals who also frequently had circumstances that led them to be excluded from the neurological assessment, such as taking anti-depressants. In both of these previous projects, CO concentrations were measured every minute, to gain 15 minute averages, in the living room of each home for at least a week. In the first project it was found that 13 or 23% of the 56 homes exceeded one or more WHO guideline. In the second project, a similar proportion, 18% (50) of the 270 dwellings had CO concentrations that exceeded the 8-hour average guideline level, of these, 26 (9.4%) exceeded the 1 hour level of 26 ppm, and 10 (3.6%) of these exceeded the 30 minute guideline values of 52 ppm. In both of these projects in homes where one of these guidelines were exceeded, a gas engineer was sent to investigate the source. Poorly maintained or installed gas appliances were found to be the source in almost every case. The most commonly problematic appliances were found to be gas grills or gas fires. (Exceptions found were due to joss sticks, or behavioural issues, e.g. leaving the gas ring on for 24 hours). Details of these previous projects can be found in the following publications, [Croxford et al 2005, Croxford et al 2006, Volans et al, 2006].
Gas Appliance Check Project
- 5 -
These two projects indicated a high prevalence of problem gas appliances in a particular, vulnerable set of homes; this led to the question of whether this problem belonged only to vulnerable homes or could exist across a wider range of dwellings. The main aim for the current project was then to select, gain access to, and carry out checks on each element of each gas appliance in 600 typical homes. Each home was surveyed giving data useful for energy consumption assessment, (Appendix B); some of this data is used in this report. The engineers asked occupants a number of questions (Appendix C) to gather details about their gas supply and use, their health and their awareness of the risks of CO. Data relevant to gas safety gathered from these questionnaires are presented in later sections of this report. The project team consisted of the author, Ben Croxford from UCL, who was responsible for the whole project and the data analysis, Mark Johnson from Regional Renewal, responsible for recruiting homes for appliance checks, and the company Dawsetway who carried out the gas inspections. Colin Copestake was the project manager for Dawsetway, the CORGI registered, experienced gas engineers carrying out the surveys were Chris Snooks, John Taylor and Roger Thomas. The homes and occupants surveyed during this project represent a reasonable cross section of ages, socio-economic status, and house types typical for the areas to the east and south of London included in the survey. A profile of the sample is given. The geographical area selected was chosen for logistical reasons, allowing better management and engineers from one company to survey all of the homes selected. In this report the results are also analysed by a basic extrapolation to give an estimate of the prevalence of problem gas appliances across the UK. This is carried out by considering national data for the UK housing stock and applying weighting factors, an explanation of the assumptions made in carrying out this analysis is also given. Section 2 describes the methodology used in the survey and also some of the process leading to the development of the methodology. Section 3 presents an overview of the UK housing stock, then in more detail about the geographical area covered by the survey. Broad social data on the householders is also given. Section 4 presents the analysis of reports from the gas engineer of problem gas appliances gathered during the survey and presents the extrapolations of the local survey results to the UK population as a whole. Sections 5 presents an analysis of the appliances found, giving age distributions, percentage of each appliance that were considered dangerous and were disconnected, and CO measurements by age of appliance and maintenance status. Section 6 presents the conclusions from the survey and recommendations based on the findings. Annex 1 presents health symptom information from the householders, and a CO exposure risk assessment for homes in the survey, an investigation of the link between these two is also given. Notes on the analysis method, some socio-economic analyses, the monitoring methodology, and the two questionnaires used for the survey can be found in the Appendices.
Gas Appliance Check Project
- 6 -
2 Methodology The timescale allowed for this project required that a large proportion of the addresses selected would agree to accept an appliance check. Regional Renewal selected a large number of homes and ensured a pre-agreement for the appliance check to make this more likely. Addresses were regularly passed to Dawsetway who set up appointments for their gas engineers. It was important to match the amount of addresses available to the capacity of the gas engineers to arrange appointments; this would ensure that those who pre-agreed an appliance check would be contacted within 7 days. The gas engineers then visited each house, filling out each of the 2 forms in Appendix B and C. The engineer asked the householder the questions while carrying out the appliance checks. The gas engineer carried out all testing of appliances, the protocol of this procedure is described below. The gas engineers followed the guidelines laid out in section 26(9) of the Gas Safety (Installation and Use) Regulations (1998) in assessing whether gas appliances and/or the installations were At Risk (AR) or Immediately Dangerous (ID) as specified in the Gas Industry Unsafe Situations Procedure (CORGI 2005). A flue gas analyser (FGA) was also used to measure concentrations of carbon monoxide (CO) and carbon dioxide (CO2) in the combustion products produced by the appliances in flue gases for boilers and water heaters and to provide an indication of CO emissions into the room for cookers and gas fires. Due to time and money pressures the full procedures used to carry out these measurements were not those specified in BS 7967-2: (2005) Carbon monoxide in dwellings and the combustion performance of gas-fired appliances – Part 2: Guide for using electronic portable combustion gas analysers in the measurement of carbon monoxide and the determination of combustion performance. The methods used for each appliance type and the implications of this and results from all the measurements taken can be found in the detailed appliance type analysis in section 5, and in the risk analysis section in Annex 1. The measuring point selection followed the procedure described in section 5. In the majority of cases visual inspections and spillage tests were sufficient to identify problem gas appliance installations. The methods used reflected the usual procedures used by the three gas engineers when checking gas appliances for safety. Engineers finding appliances with extra dirt or dust would allow extra time for this to burn off before measuring emissions. However it is accepted that in some cases high initial measurements from appliances may have reduced after a length of time. Each element of each gas appliance was tested, except where the engineers found reason to condemn an appliance based on visual inspection, for example if sooting was present. If the appliance passed all spillage tests, if each element produced normal concentrations of CO after being started and running at full power for at least 5 minutes and there were no other adverse signs, then the element was passed as good. CO concentrations reported by the Flue Gas Analyser were noted on the form. If there was any cause for concern then further testing was carried out, after 5 minutes, concentrations were again noted. The gas engineer gave advice to the householder where relevant; frequently this was to ensure adequate ventilation when using the appliance and to recommend a full service. If a problem appliance or installation was found then a CP14 form was filled in, in accordance with the Gas Industry Unsafe Situations Procedure (CORGI 2005). In some cases the appliance was turned off or disconnected with the permission of the householder.
Gas Appliance Check Project
- 7 -
The three gas engineers carrying out the appliance checks used new Flue Gas Analysers (FGA) made by Kane or Testo. The analysers were used in accordance with manufacturers’ guidance, and all engineers had all relevant competencies according to CORGI regulations. Engineers, their CORGI registration numbers and analysers they used are listed in table 1. Table 1 : Gas appliance check engineers Name Corgi RegistrationNumber FGA used Chris Snooks 646119101 Testo t325M Roger Thomas 650252401 Kane 400 John Taylor (Apple Gas Heating) 601103101 Kane 400 The completed forms along with the printout from the flue gas analyser were stapled together and returned to base where the results were entered into a spreadsheet. All of the CP14 details were also entered into a separate spreadsheet; both spreadsheets were emailed to all of the project team at regular intervals. At the end of the project, extensive quality control checks were performed on the spreadsheet to ensure all entries on the spreadsheet could be matched with their original forms. This allowed spurious entries to be identified and checked. Examples of the checking can be found in Appendix A.
2.1 Sample selection Homes were selected from over 1200 addresses provided by Regional Renewal. These were selected by surveyors for Regional Renewal who have been carrying out survey work to find homes eligible for energy efficiency measures under the government’s Warm Front programme (DEFRA 2006). These surveyors currently assess over 1000 homes per week. Only addresses where occupants were willing to participate in the appliance check project were sent through to Dawsetway. The selection process was such that only a few houses from each street were considered, an attempt was also made to recruit different house types, however, in the areas selected the choice was limited. There is a small chance of self-selection bias in this process as the surveyors are more likely to choose “co-operative” people; if these “co-operative” people are more likely to have problem appliances then the sample will represent this.
Gas Appliance Check Project
- 8 -
3 Sample Analysis This section presents basic characteristics of the sample and compares these where possible with national data; results from this section are used to extrapolate later findings from the sample to across the UK.
3.1 Geographical coverage of the sample Homes from a total of about 80 post code sectors were surveyed. A post code sector is defined by the first 5 figures of the post code. For example RM8 2UZ is in the post code sector “RM8 2” near Romford. This post code sector had by far the most homes visited; a total of 231 of the 597. The area covered by the survey can be seen in figure 1; 3 homes from a tranche of 30 Milton Keynes addresses were also surveyed but these are not included on this map. Each point is the centre of the post code sector and represents all homes surveyed in that sector. As can be seen, most homes were to the East and South of central London.
Figure 1 : Area covered by the survey, excluding 3 homes from Milton Keynes.
3.2 National and local housing stock analysis All national data used in this section can be found on DCLG web site [DCLG 2006]. Each table below quotes the source from this website using their table numbers.
3.2.1 Housing stock by type The areas covered by the team included mainly old urban areas and as such there were a high percentage of terrace homes in the sample. Flats and detached houses are unfortunately very under-represented in the sample.
Gas Appliance Check Project
- 9 -
Table 2 : Housing Stock by type Type National UK prevalence Sample Prevalence % (n)Detached 22% 2% (12)Semi-detached 33% 20% (121)Terrace 27% 72% (420)*Mid-terrace - 50% (299)End-terrace - 22% (130)Flat 17% 4% (22)Maisonette - 2% (10) Source: [DCLG (2006) Table 117], * addition of numbers for mid and end terrace households.
3.2.2 Housing stock by age Again reflecting the area surveyed most of the homes were built between the wars, very few newer homes were surveyed. Homes built between the wars were over-represented in the sample. Table 3 : Housing Stock by age Type England prevalence Sample Prevalence % (n)pre 1919 19%* 14% (83)1919-1944 19%* 64%(382)Post 1945 62%** 21%(125)**1946-1984 48%** 1945-1975 13%(79)post 1975 8%(46)post 1984 14%* Total 21,613,000 100%(597)Source:* [DCLG (2006) Table 110] **addition of numbers for post 1945 years in both cases. Slight discrepancy in age ranges mean that for this report the following are considered equivalent “1919-1944” = “1919-1945”, and “Post 1945” = “1946-1984” + “post 1984” and “pre 1918” = “pre 1919”
3.2.3 Housing stock by tenure In the survey we aimed to survey only owner-occupied homes, however at the start of the project a few rented accommodations were included; these were left in the total dataset for comparison. Table 4 : Housing Stock by tenure Type National UK prevalence Sample Prevalence % (n)Owner occupied 71% 94% (559)Private rented 10%Social landlords 8% LA rented 11%Rented (All) 29%* 6% (35)Source: [DCLG (2006) Table 101] *addition of rented numbers
3.2.4 Location of gas meter We asked the householders whether their gas meter was inside or outside their property, most homes had their gas meter inside the property. Table 5 : Gas Meter Location Sample Prevalence % (n)Gas meter inside the property 66% (392)Gas meter outside the property 34% (201)
Gas Appliance Check Project
- 10 -
3.3 National and local socio-economic analysis The total population of the households included in the sample was 1474 people, of these, 421 were in the 65’s and over group. The percentage of “65’s and over” in the total population living in the surveyed homes was 29%, this is significantly higher than the 16% in the UK population as a whole [ONS 2006].
3.3.1 Age profile of households The sample has a much higher percentage of homes with at least one person over 65 than the national average. The data is compared using 2 age groupings, households with any members aged 65 or over, and households with no person aged 65 or over. Table 6 : Household age profile Age range National
Prevalence Sample Prevalence % (n)
Households with no person aged 65 or over
80%* 49% (293)
Households with any members aged 65 or over
20%* 50% (301)
Source:* DWP(2006) The definition is different for the sample and the national sample, official statistics include households with at least one pensioner, so females over 60 are eligible for pensions so DWP numbers are larger than for “households with any member over 65”.
3.3.2 Occupants per household The sample was found to closely match the UK distribution of households with different numbers of residents; table 7 shows a comparison between national distribution and the sample distribution. The sample has a similar distribution to that of all UK households. Table 7 : Occupants per household Residents per household (n)
% UK households with n residents [ONS 2006]
% household with n residents of total sample
1 29% 28%2 35% 33%3 16% 16%4 13% 12%5+ 7% 10%
3.3.3 Benefits Households were asked to place themselves in an income bracket of Low, Medium, High or Pensioner; this was considered to be not very accurate. They were also asked to indicate which of several benefits they were in receipt of. This measure was considered more accurate as an indicator of socio-economic status, so two groups were considered, those in receipt of no benefit and those in receipt of any benefit. In total the sample found 39.7% of households in receipt of any benefit. This included Council Tax Benefit and Child Tax Credit. Comparing with London (28% of households on means tested benefit) and national figures (24% of households on means tested benefits) this indicates the sample has a higher proportion of people on benefit (39.7%) than either) [GLA 2002]. This is perhaps an indication reflecting the geographical area and also that people who are at home more often are more likely to be included in this survey despite attempts made to reduce this bias.
Gas Appliance Check Project
- 11 -
3.4 Householder details Some personal questions were asked of each householder, these covered, priority service register, awareness of CO issues, a general health question, and some specific questions looking for prevalence of symptoms that could be related to CO exposure. The questionnaire can be found in Appendix C.
3.4.1 Priority Service Register We asked the householders if they were aware of the Priority Service Register (PSR) program to provide services to vulnerable consumers from OFGEM_a (2006). Under this scheme it is possible to receive free gas safety checks. Very few had heard of this program. Consumers eligible for the PSR (those of pensionable age, disabled or chronically sick) are entitled to certain services on request including third party billing, password schemes and quarterly meter readings. There also exists an entitlement to a free gas safety check for certain groups however this has a slightly narrower definition than for the PSR, including only owner occupier households where all the occupiers are of pensionable age, disabled or chronically sick or where they are living with an under 18 year old. Although gas safety checks are related to the PSR a customer does not have to be on the PSR to request it, but they do need to be eligible (OFGEM_b 2006). Table 8 : Priority Service Register awareness Sample Prevalence % (n)Total households aware of PSR 3% (17)Total households NOT aware of PSR 97% (577) % of households with member of 65 or over aware of PSR 5% (14)% of households in receipt of any benefit aware of PSR 4% (10)
3.4.2 Carbon monoxide awareness The gas engineers asked householders about their awareness of CO issues and on the basis of their answers completed the following question in the questionnaire; “Have you had any information on carbon monoxide from any of the following? (Tick all that apply)”, the options selected and their prevalence in the sample are given in table 9. Several people said more than one item such as Radio and News for example. It is notable that 45% had had no information at all on carbon monoxide. Also only 7 of 597 homes had a CO detector visible to the engineers. Table 9 : Carbon monoxide awareness (respondents could tick several of these items) CO information from where Sample prevalence % (n)Advert 4% (21)News 33% (195)Radio 17% (102)TV 16% (96)Gas Supplier 3% (16)Gas Installer 1% (8) Has CO detector 1% (7)No info 45% (262)Total respondents to this question 100% (587)
3.4.3 Appliances checked on move in? Roughly half of respondents stated that they had had their appliances checked when they moved into their home, 49% or 290 of the sample.
Gas Appliance Check Project
- 12 -
4 CP14 Analysis Under the Gas Industry Unsafe Situations procedure (CORGI 2005), gas engineers are required to make a notification where an appliance is considered At Risk (AR), Immediately Dangerous (ID) or Not to Current Standards (NCS). The details of how an appliance might be notified as such are given in [CORGI 2006]; a summary of this is given in the following paragraphs. If an unsafe appliance or installation is found by a gas engineer then they are obliged to fill in a form (CP14) and a copy of this is given to the householder so they are made aware of the situation. "The Gas Industry's Unsafe Situations Procedure (USP) gives guidance to gas installers on dealing with existing gas installations they come into contact with that are not safe, or do not meet current standards. Appliances are classified as: Immediately Dangerous (ID) - An "Immediately Dangerous appliance/installation is one, which, if operated or left connected to a gas supply, is an IMMEDIATE danger to life or property. Broadly, these will be installations that fail tightness tests, appliances that fail spillage tests or appliances which have serious flueing and/or ventilation, or combustion deficiencies, when measured against the appliance manufacturer's instructions, British Standards or other relevant standards/guidance documents. At Risk (AR) - An 'At Risk ' appliance/installation is one where one or more recognised faults exist and which, as a result, if operated, may in the future constitute a danger to life or property. Not to current standards (NCS) – “A not to current standard installation is one that is EXISTING (has already been installed) which is NOT in accordance with the current Regulations, Standards and Specifications or Codes of Practice. However it is currently operating safely and does NOT constitute either an Immediately Dangerous (ID) or At Risk (AR) situation." In all of the CP14 cases, appliances were condemned, or advice was given as to proper use. The procedure is specified but as every case is different there is an element of subjective judgement on the part of the gas engineer as to whether a given situation is dangerous enough to warrant a CP14 form to be filled out or what level of risk it should be notified under. In this report if a CP14 notice has been issued then there is an unsafe situation. A further indication of the severity of the situation is indicated if an appliance is At Risk or considered Immediately Dangerous, in these cases the appliance is generally disconnected from the supply. Installations rated as NCS were not included in the following analyses, see table 19 for more details, a total of 15 appliances fell into this category. Overall, across all 597 homes, 153 CP14 notices of AR or ID were made in 131 individual homes. A breakdown of these is given in table 10. Table 10 : Breakdown of overall CP14’s issued Numbers of CP14’s issued Sample prevalence % (n)0 78% (466)1 18% (110)2 3% (20)3 0% (1)At least one CP14 22% (131) Total 100% (597)
Gas Appliance Check Project
- 13 -
The individual CP14 forms have more detailed information about the appliance; these have been coded and are presented by appliance in table 19. Gas fires were found to be the most frequently dangerous appliance with 26% of living room gas fires being disconnected due to being AR or ID. Boilers were found to be AR or ID in 5% of cases. Some homes had more than one unsafe installation. Across all 1406 appliances checked, 11% or 153 were found to be AR or ID. More detailed analysis based on the appliance is given in section 5.
4.1 Local analysis The data from the CP14 forms is analysed with respect to various house and householder characteristics. In Annex 1 further analysis of the CP14 cases along with carbon monoxide measurements is made, based on the judgement of the researcher and the manager of the gas engineers used to assess the appliances, to assess the carbon monoxide risk to the household from each appliance.
4.1.1 CP14’s by house type As shown in table 11, the prevalence of CP14’s in the 3 most frequently encountered house types was found to be between 21% and 24%. The last column of each of the following tables represents homes where one or more CP14 notices were issued. (3 forms had no information on house type) Table 11 : Total CP14’s issued broken down by house type (some house type information missing) CP14 issued Total 0
Flat 22 86% (19) 14% (3)Maisonette 10 90% (9) 10% (1) Total 594 78% (465) 22% (129)* mid-terrace and end-terrace added together
4.1.2 CP14’s by age of housing A similar table showing breakdown of CP14’s with age of home is shown in table 12. The most frequently encountered (1919-1944) had the highest prevalence of poor or unsafe gas appliance installations. (7 cases had no age information) Table 12 : CP14’s issued by age of housing CP14 issued Total 0
4.1.3 CP14’s by tenure An analysis of CP14’s by tenure is given in table 13, the number of rented households was only 6% of the sample a similar prevalence of problem appliances was found in each group. (3 cases had no tenure information). Table 13 : CP14s issued by tenure CP14 issued Total 0
4.2 Householder analysis The distribution of CP14’s among different groups was analysed relative to various householder characteristics.
4.2.1 CP14’s and older residents An investigation was made as to whether older residents were more or less likely to have an unsafe appliance. As can be seen in table 14, homes with no members aged 65 and over were found to have more unsafe appliances than older households. (3 cases had no age information). Table 14 : Total CP14’s issued broken down by age category CP14s issued Total 0
% of row (n)
At least one CP14 % of row (n)
Householders with NO members aged 65 and over
293 76% (224) 24% (69)
Householders with at least one member aged 65 and over
301 80% (241) 20% (60)
Total 594 78% (465) 22% (129)
4.2.2 Number of residents and CP14’s As shown in table 15, homes with 3,4 and 5 or more residents were more likely to have at least one problem gas installation than those with 1 and 2 residents. (3 cases had no information) Table 15 : Total CP14’s issued broken down by numbers of residents CP14s issued Total 0
4.2.3 CP14’s for households in receipt of benefits We gathered an indicator of socio-economic status; are there any benefits received by the household. This was used to create 2 broad groups that can be considered better off and worse off. Table 16 indicates that households in receipt of any benefits were more likely to have problem appliances than those not receiving any benefits. (4 cases had no benefits information) Table 16 : Total CP14’s issued broken down by benefits receipts CP14s issued Total 0
% of row (n)At least one CP14 % of row (n)
Households in receipt of NO benefits 358 82% (292) 18% (66) Households in receipt of ANY benefit 237 73% (173) 27% (64) Total 595 78% (465) 22% (130)
4.2.4 Detailed analysis of CP14’s by age of household members and benefits
Analysing the previous two groups in further detail, combining into four groups; households with or without members over the age of 65 and in receipt of benefits or not, gives the following results shown in table 17. The group “receiving no benefits and with a householder over the age of 65” was found to be less than half as likely to have a problem appliance than the worst group, “those with no members over 65 and also in receipt of benefits”. (3 cases had information missing). Table 17 : Total CP14’s issued broken down by age and benefit receipt CP14s issued Total 0
% of row (n) At least one CP14 % of row (n)
NO benefits, NO members 65+ 208 78% (163) 22% (45)NO benefits, 1+ members 65+ 150 86% (129) 14% (21)ANY benefits, NO members 65+ 85 72% (61) 28% (24)ANY benefits, 1+ members 65+ 151 74% (112) 26% (39) Total 594 78% (465) 22% (129)
4.3 Extrapolations of results to housing stock of England, Scotland and Wales
The sample selected while large in terms of many previous surveys, compared to the total UK housing stock is tiny. Therefore it is also not likely to be representative. This section takes the prevalence of problem gas appliance installations among different types of housing, different age profiles and numbers of residents and attempts to estimate the possible prevalence of these across the country. Figures for total homes with mains gas are given for England, Wales and Scotland from the OFGEM website, UK wide prevalences are taken from the DCLG website and applied to this total to get extrapolated values for England, Scotland and Wales. For example if 27% of households receiving benefit have CP14s and 18% of those not receiving benefit have CP14’s, then, as there are more households not in receipt of benefits in UK than found in the survey, the extrapolated UK percentage will be nearer 18% than the overall average figure for the sample of 22%.
Gas Appliance Check Project
- 16 -
Table 18 lists extrapolated prevalences of problem gas appliances based on 7 different criteria. Each separate estimate cannot be considered accurate due to the sample size, and sample characteristics, however across the estimates there is a degree of consistency with a range between 15% and 23%. It seems probable that the true range across the UK is likely to fall within the range found here. Table 18 : Estimate of total numbers of CP14’s across England, Scotland and Wales Estimate basis Estimated
number of CP14’s (millions)
% CP14’s
Basic overall (see table 4.1) 4.6 22%Weighted by age of house (see table 4.1.2) 3.3 15%Weighted by benefit receivers (see table 4.2.3) 4.2 20%Weighted by tenure (see table 4.1.3) 4.5 21%Weighted by numbers of residents (see table 4.2.2) 4.6 22%Weighted by house type (see table 4.1.1) 4.9 23%Weighted by households with pensioners (see table 4.2.1)
4.9 23%
Total Households on gas in England, Scotland and Wales (Millions)
21.1
These extrapolations should be qualified further in that due to the restricted geographical area the types of housing stock available meant that the survey is under representative of flats and detached homes. The extrapolation using the house type is therefore weaker than other ones. The number of pensioners in this area meant the study is over representative of this group and the number of people on benefits is slightly over represented also. This might suggest that extrapolations based on these are slightly stronger with respect to these groups.
4.4 Notes on CP14 analysis Two appliances rated as ID in the dataset need further consideration. Case AA164, by the information on the CP14 form this gas fire was apparently discovered by FGA measurements alone and was rated as ID due to high emissions. We decided to leave this appliance in the dataset as the decision to rate it ID was made by a very able and experienced gas engineer, he inspected the appliance and based on the evidence he had available to him and his assessment of this appliance he rated it as ID and disconnected the appliance and filled the form in. His FGA measurements showed the gas fire to be emitting 135ppm CO into the room, he may well also have carried out a spillage test but we have no evidence of this. Based on the concentrations of CO measured, the fire was very likely to lift the concentration of CO in the room to above WHO guidelines, it was rated as being “A_Very High” risk, see Annex 1 for more details on risk. Case AA560, in this case the engineer condemned the boiler (rated ID), FGA measurements were 570ppm, but no CP14 or printout from the FGA was available. I think this boiler had been condemned previous to this current visit to check all gas appliances. As the boiler was ID this is recorded in the dataset. A D_low risk rating was assigned to this case as the FGA readings are greater than 108ppm, see Annex 1 for more details on risk assessment.
Gas Appliance Check Project
- 17 -
5 Gas Appliance Analysis All homes surveyed had at least one gas appliance. The gas engineer provided details for each gas appliance in each home, this included, make and model, estimated age, maintenance information, CO measurements and CP14 status. Table 19 presents data on CP14s issued for each appliance type, in this table we also include information on a number of installations that were rated as being not to current standards (NCS). Of the 1414 appliances 4% were found to be At Risk, 7% were rated Immediately Dangerous and 1% were found to be Not to Current Standards. Gas fires were the appliance most likely to be rated AR or ID, with 26% of those found in the living room and 23% of those in other rooms found to be AR or ID. 5% of all boilers and 7% of all cookers were rated as AR or ID. Table 19 : Total CP14’s issued broken down by appliance type (INCLUDING NCS details) Appliance N At Risk,
% of appliance type (AR) % (n)
Immediately Dangerous, % of appliance type (ID) %(n)
Not to Current Standards % of appliance type (NCS) %(n)
Totals 1414 4%(57) 7%(96) 1%(15) 11%(153) Individual appliance types are examined in more detail in this section including age range of appliance and measurements of CO concentration. The appliance age information is based on estimates by the householder or the gas engineer and should be considered indicative; the ranges chosen for analysis reflect the likelihood that the estimate will be less accurate for older appliances. The percentages given are percent of total appliances with an age entered in the spreadsheet. A flue gas analyser (FGA) was used to measure flue gas concentrations from boilers and water heaters and CO emissions into the room from cookers and gas fires as detailed below. Boilers and Water Heaters The appliance was lit in accordance to manufacturers instructions. As soon as the main burner came on the appliance was set to maximum and the probe supplied with the analyser inserted into the middle of the stream of products, in a position according to the following order of preference:
• maker’s sample point, • existing sample point in secondary flue, • in primary flue (open flue appliance) or into flue outlet (room sealed appliance).
Readings of CO, CO2 and CO/CO2 ratio were taken after 5 minutes.
Gas Appliance Check Project
- 18 -
Cookers Individual cooker elements were individually tested using a FGA,. A probe as specified in BS 7967-2 was made up and used to measure emissions from grills; ovens were tested in accordance with the British Standard method. For the hotplate burners, a standard pan brought by the gas engineer was placed on the hob and emissions were measured around the pan. Room measurements of CO as specified in BS 7967-2 (2005) were not made. Gas Fires FGA’s were used to indicate the concentration of CO emitted into the room. The measuring point for emissions was approximately 75mm up and 75 mm out from the heat exchanger part of the fire. For decorative flame effect (DFE) fires the measurements were made a similar distance, 75mm up and 75mm out, from the top of the combustion area, in both cases attempting to measure the CO emissions into the room. NOTE In measuring these CO emissions not only was the method specified in BS 7967-2 not followed but also the specified time allowed for an appliance’s emissions to stabilise was in some cases less than that specified in the British Standard, due to resource constraints of the project. The main use for these individual measurements of CO concentrations was to give an indication of relative source strength between similar types of appliance. See Annex 1 for details of the risk assessments for exposure to CO that are used in the risk analysis section. In each graph in this section, the height of the solid bar is the mean CO measured for each age group, the upper thinner “bar” represents a statistically calculated value that 95% of the data falls BELOW, (95% confidence level). This value is always greater than the mean. The length of the thin bar is a measure of the variability of the data, with a longer thin bar indicating that a greater range of CO measurements was found for that group. The graphs can be read to show statistically significant differences between groups. The term “statistically significant” refers to a calculation (unpaired t-test) of how likely the differences seen between two groups could happen by chance, if that calculated chance is less than 5% then the difference is “statistically significant”. The variability in the sample readings for each age group mean that very few of the apparent differences seen are statistically significant. However in most figures there is a clear trend, with increasing CO concentration measured with increasing age of appliance. The apparent difference seen between groups of cookers of different ages in figure 3 is only statistically significant between group B and groups E and F. We asked for each appliance if maintenance had been carried out in the last year and if they had a maintenance certificate. If the householders had a maintenance certificate then this was noted on the form and is used in the analyses. In the following sections only boilers had enough maintenance certificates for this to be used as a criterion for splitting the data, in the case of all other appliances we used the householders’ assessment of whether maintenance had been carried out. None of the differences seen between maintained and unmaintained appliance CO concentrations are statistically significant. (Further clarification on this point can be found in Appendix A Notes on Maintenance) The following subsections give details for each appliance.
5.1 Cooker Of the homes surveyed, 471 or 79% had a gas cooker. The distribution of age of appliance is given in figure 2. Eight percent (40/471) of those with cookers claimed to have had maintenance carried out in the past year, of these, 37 had a maintenance certificate. The average age of all cookers was found to be 8.3 years, with a standard deviation of 6.3 years (n=467).
Gas Appliance Check Project
- 19 -
0
10
20
30
40
50%
of s
ampl
e
A: 0
-1
B: 1
-3
C: 3
-5
D: 5
-10
E: 1
0-20
F: 2
0+
Cooker Age Ranges (yrs)
Figure 2 : Distribution of cooker age across the sample
5.1.1 Cooker CO emissions (into the room) The maximum CO measurement for any element is used as the CO measurement for that appliance. CO concentration in the room will depend on ventilation and also use of the appliance. The trend is clear in that increasing CO measurements are found from older cookers, but only the difference between age groups B:1-3 years and E:10-20 years, and F:20+ years are statistically significant. (CO measurements were made for 457 of 471 cookers).
0
10
20
30
40
50
60
70
A: 0
-1
B: 1
-3
C: 3
-5
D: 5
-10
E: 1
0-20
F: 2
0+
Figure 3 : Mean carbon monoxide concentration measured from cookers split by their age range. If the measurements are split into groups that have had maintenance and those that haven’t within the past year, it is clear the cookers with maintenance had lower emissions than those without, but the difference seen is not statistically significant, (p=0.33).
Gas Appliance Check Project
- 20 -
0
5
10
15
20
25
30
CO
(ppm
) Coo
ker
No Yes Figure 4 : Mean carbon monoxide concentration measured from cookers split by maintenance within the last year.
5.1.2 Kitchen ventilation systems Responses to questions concerning kitchen ventilation type are given below, we also asked how often they used it, most used their systems often or always, 3% or 15 people reported never using their ventilation system. There were a few cases where the kitchen had no direct ventilation to outside, either by modifications to the home, or by change of use of rooms. Table 20 : Cooker ventilation system prevalence Method Sample prevalence % (n, total = 471)Cooker Hood 49% (232)Window 94% (442)Extract fan 4% (21)Door 5% (23)No direct ventilation to outside 1% (5)
5.2 Boiler Most of the sample had a gas boiler, 94% or 565 people, with the average age of all boilers found to be 7.5 years, with a standard deviation of 7.9 years (n=562). The age distribution is given in figure 5.
0
10
20
30
40
50
% o
f sam
ple
A: 0
-1
B: 1
-3
C: 3
-5
D: 5
-10
E: 1
0-20
F: 2
0+
Boiler Age Range (yrs)
Figure 5 : Distribution of boiler age Of the total with boilers, 46% or (259/565) had had maintenance in the last year, of these, 80% (208/259) had maintenance certificates.
Gas Appliance Check Project
- 21 -
A significant portion, 9% (48/565), of the boilers were located in the bedroom or in a room used as a bedroom.
5.2.1 Boiler CO (flue gas concentration) For the boiler, the CO concentration is that of the flue gases measured at the flue monitoring point. Both room sealed and open flued boilers were found in the survey. The overall mean CO measurement was 46 ppm. The trend for all measurements is increasing CO concentration with increasing age of appliance, see figure 6. Figure 7 apparently indicates that boilers in homes with certificates of maintenance had higher flue gas CO concentrations than those with no maintenance, but this difference is not statistically significant as the variability of measurements is so high (p=0.32). (Total measurements from 516/565 boilers with a valid age range)
0
20
40
60
80
100
120
140
160
180
CO
(ppm
) Boi
ler
A: 0
-1
B: 1
-3
C: 3
-5
D: 5
-10
E: 1
0-20
F: 2
0+
Figure 6 : Mean carbon monoxide concentration measured from boilers split by their age range.
0
10
20
30
40
50
60
70
80
CO
(ppm
) Boi
ler
No Yes Figure 7 : Mean carbon monoxide concentration measured from boilers split by if the owners had a maintenance certificate or not. The graph in figure 8 investigates this further, it seems that in most age groups the difference in flue gas concentrations with or without maintenance is small, however the variability of two groups in particular is affecting the data. There were a few boilers with very high flue gas concentrations that also had a current maintenance certificate, (AA194 1491ppm 20+ Years, AA185 1253ppm 3-5 Years, AA431 919ppm 3-5 Years).
Gas Appliance Check Project
- 22 -
0
50
100
150
200
250
300
350
CO
(ppm
) Boi
ler
A: 0
-1
B: 1
-3
C: 3
-5
D: 5
-10
E: 1
0-20
F: 2
0+
YesNo
Figure 8 : Mean carbon monoxide concentration measured from boilers split by age and if the owners had a maintenance certificate or not. The presence of a maintenance certificate does not guarantee that the boiler has been checked for flue gas CO concentrations, in the case of boilers, there is no significant difference in these between boilers with and without maintenance certificates. See Appendix A: Notes on maintenance for more details. However there was a difference in numbers of CP14’s issued for boilers with and without maintenance certificates. Boilers without a certificate had more CP14’s issued than those with a maintenance certificate. 7% or (25/346) of boilers without certificates were rated AR or ID, and 2% or (5/209) of those with a maintenance certificate were rated AR or ID.
5.3 Gas fire, living room A total of 286 homes had at least one gas fire in their living room. Average age (where estimated) of all gas fires was found to be 13.1 years, with a standard deviation of 7.3 years (n=256). The age profile of fires is given below in figure 9.
0
10
20
30
40
50
% o
f sam
ple
A: 0
-1
B: 1
-3
C: 3
-5
D: 5
-10
E: 1
0-20
F: 2
0+
Gas Fire Age Range (yrs)
Figure 9 : Distribution of gas fire age Maintenance had been carried out on 24 of the fires, 16 of these had maintenance certificates. One fire had been maintained by the customer.
Gas Appliance Check Project
- 23 -
5.3.1 Gas Fire, living room, CO emissions (into the room) To record CO emissions into the room from gas fires, engineers used a FGA about 75mm out from and 75mm above the heat exchanger, so all gas fire measurements taken should be considered as indicative. (Total measurements 222 of 281 gas fires). The results seem to show a trend of increasing CO emissions with age, and a decrease if the appliance had been maintained. One appliance had been serviced by the customer, who was “in the trade”. Decorative flame effect fires were frequently rated as problem appliances, misplaced coals in some cases caused flames to be directed into the room, and increased CO spillage into the room.
0
5
10
15
20
25
CO
(ppm
) Fire
A: 0
-1
B: 1
-3
C: 3
-5
D: 5
-10
E: 1
0-20
F: 2
0+
Figure 10 : Mean carbon monoxide concentrations measured from Gas Fires (main room) split by their age range.
0
2
4
6
8
10
12
14
16
18
CO
(ppm
) Fire
CUSTOMER SERVICED No Yes
Figure 11 : Mean carbon monoxide concentrations measured from Gas Fires (main room) split by maintenance in the last year or not.
Gas Appliance Check Project
- 24 -
5.4 Gas fire, other Some homes had gas fires in rooms other than living rooms, in total this accounted for 9% of the dataset or 56 homes.
0
5
10
15
20
25
30
35
40
45
% o
f sam
ple
B: 1-3 D: 5-10 E: 10-20 F: 20+Gas Fire Other Age Range (yrs)
Figure 12 : Distribution of gas fire (other) age
5.4.1 Gas Fire, other, CO emissions (into the room) The CO emissions are again measurements taken about 75mm out from and 75mm above the heat exchanger. Again older fires had higher emissions, with those being maintained having much lower emissions. It can be seen that there were no fires in other rooms newer than 5 years old. (Total CO measurements from 41 of 56 gas fires).
05
101520253035404550
CO
(ppm
) Gas
Fire
oth
er
B: 1-3 D: 5-10 E: 10-20 F: 20+ Figure 13 : Mean carbon monoxide concentrations measured from gas fire (other) split by their age range.
Gas Appliance Check Project
- 25 -
0
5
10
15
20
25
CO
(ppm
) Gas
Fire
oth
er
N Y Figure 14 : Mean carbon monoxide concentrations measured from gas fire (other) split by maintenance in the last year or not.
5.5 Gas water heater Only 6% (36) of homes had a gas water heater. Ten had had maintenance in the last year and six of these had maintenance certificates.
0
5
10
15
20
25
30
35
% o
f sam
ple
A: 0
-1
B: 1
-3
C: 3
-5
D: 5
-10
E: 1
0-20
F: 2
0+
WH Age Ranges (yrs)
Figure 15 : Distribution of Water Heater age
5.5.1 Water heater CO (flue gas concentrations) The CO measurements for water heaters are for flue gas CO concentrations. In this case higher CO concentrations appear to have been found in younger water heaters, though it should be noted that there are very few cases in each age group so this finding cannot be extrapolated across all water heaters. (Total measurements 33 of 36 water heaters).
Gas Appliance Check Project
- 26 -
0
20
40
60
80
100
120
140
CO
(ppm
) Wat
er H
eate
r
A: 0
-1
B: 1
-3
C: 3
-5
D: 5
-10
E: 1
0-20
F: 2
0+
Figure 16 : Mean carbon monoxide concentrations measured from Water Heaters split by their age range. Figure 17 shows that CO concentrations appeared lower in the group that had maintenance in the last year.
0
10
20
30
40
50
60
CO
(ppm
) Wat
er H
eate
r
N Y Figure 17 : Mean carbon monoxide concentrations measured from Water Heaters split by maintenance in the past year or not.
Gas Appliance Check Project
- 27 -
6 Conclusions This report presents findings from a snapshot survey of nearly 600 homes over a large area of South and East London. The sample had a range of house types and a range of householders of different ages and socio-economic status. There is some bias in the sample with terraced homes, older people, and those on benefits over represented; also the size of the sample is small related to the numbers of UK households Awareness of the dangers of CO was poor with 45% of the sample having had no information. The most frequent source of information was from the News. CO detectors were noted in only 1% of homes. Only 3% of all homes were aware of the Priority Service Register scheme that allows free appliance checks for pensioners and other eligible persons. Poor quality and dangerous gas appliance installations, as recorded by CP14 forms, were found to be widespread across all housing types, and all households. A total of 1414 appliances were checked and 153 CP14 forms (AR or ID) were issued to 131 separate households. Looking in more detail we found that more than 20% of homes had at least one poor quality or dangerous appliance installation. Of these, gas fires were found to be the most frequently problematic with 26% of gas fires either rated as “At Risk” (AR) or “Immediately Dangerous” (ID), 7% of gas cookers and 5% of gas boilers were put in this category. Looking at the distribution of these poor or dangerous gas appliance installations we found that there were variations between various types of houses and different household circumstances. Houses built between the wars (26%) were more likely to have a problem gas appliance than homes of all other ages (13%). Little difference was found between tenures, in terms of prevalence of problem appliances (Owner occupied at 22%, all rented at 20%). Households with no members aged 65 and over (24%) were found to be more likely to have appliances given CP14 notices than older households (20%). Homes with 1 or 2 residents (18%) were less likely to have CP14s than those with more residents (27%); as the number of residents increased so did the likelihood of having poor appliances. Poorer households (those in receipt of ANY benefits) were much more likely to have problem gas installations (27%) than better off households (those in receipt of NO benefits) (18%). Although the sample size of detached homes (2%) was so small as to make the result statistically suspect, 33% were found to have a problem gas appliance installation compared to 22% of terraced housing (22%) Examining this in more detail we found that the group least likely to have problem gas appliances were older, better off households (14%). In contrast to this, the group most likely to have a problem gas appliance were worse off, younger households (28%). The householder questionnaire asked a very simple question about health symptoms considered to be related to carbon monoxide exposure. This showed a clear variation, the more symptoms reported by the householder the more likely the house to have a problem gas appliance, Table 22 (Annex 1). Nearly half (43%), of those reporting 2 or more symptoms had at least one appliance issued with a CP14 notice. The findings indicate that the question could be used as a screening tool to find householders with a high possibility of having a problem gas appliance. Further research is needed to confirm these indicative findings.
Gas Appliance Check Project
- 28 -
Examining the CO measurements made by the gas engineers, there is good evidence for the expected increase in concentrations of CO, both up the flue in the case of boilers and water heaters, and into the room with gas fires and cookers, with age of appliance. Some of the differences in age groups seen, are statistically significant. If the appliance had had no maintenance the CO concentrations measured appear to be higher, but none of the differences in concentrations seen between maintained and unmaintained appliances were found to be statistically significant. In the case of boilers, having a valid maintenance certificate was no guarantee of lower CO flue gas concentrations. CO flue gas concentrations of water heaters were found to be very variable reflecting the low number of gas water heaters found. A further level of analysis aiming to assess risk of the household to carbon monoxide exposure was carried out by the author, Annex 1. This was a risk assessment based on appliance CO measurements, type of appliance and ventilation situation in the home. Based on this risk assessment methodology, two percent of the sample was considered to have a very high risk of exposure to CO concentrations exceeding the WHO guidelines for CO mentioned in the introduction; a further 4% were assessed to have a high risk. The higher the assessed risk of a home, the more likely they were to report health symptoms. Those in these top two risk groups were 3 times more likely to report 2 or more health symptoms than those in the no risk category. It is important to note that the presence of a problem gas appliance installation does not mean an occupant is exposed to high concentrations of CO. How the appliance is used, and the ventilation available will affect exposure, however just the presence of a problem gas appliance is a risk to health. It is also important to remember that this study was carried out in the summer when the householders are less likely to use gas fires or central heating and are much more likely to ventilate their homes; winter exposure to CO would surely be higher. During this project, 3 situations found, were rated by the gas engineers as very dangerous and potentially life threatening, in each case the situation was made safe; 96 appliances were rated ID and disconnected and 5 dangerous cookers belonging to vulnerable households were replaced during the course of the project. This project adds evidence to that from previous surveys conducted by the author and others, that there could be a large number of gas appliance installations with problems within UK homes. It also confirms widespread ignorance of CO risks in the home and suggests that better awareness of CO is essential to ensure householders use gas appliances safely and have them serviced regularly because many of the problems found would have been identified during a safety check and/or service..
Gas Appliance Check Project
- 29 -
7 Acknowledgements The author would like to thank the following for their exceptional help during the course of this project. Julie Voce-Pascoe, Stephanie Trotter, Colin Copestake, David Orr, Mark Johnson, Avril Adams, Bianca Boeyden.
Gas Appliance Check Project
- 30 -
8 References BS 7967:2005, Carbon monoxide in dwellings (in 3 parts), British Standards Institute, http://www.bsonline.bsi-global.com [accessed November 2006] CORGI (2005), Gas Industry Unsafe Situations Procedure, USP1, CORGI. http://www.corgi-direct.com/Product.aspx?cID=1020 [Accessed August 2006] Croxford B, Hutchinson E, Leonardi GS, McKenna L, Riddington M, Volans G., Wilkinson P, (2005), Real time carbon monoxide measurements from 56 UK homes, Proceedings of Indoor Air 2005, Beijing. Croxford,B., Hutchinson,E., Leonardi,G.S., McKenna,L., Nicholson,L., Volans,G., Wilkinson,P. (2006). Real time carbon monoxide measurements from 270 UK homes. Indoor Environmental Quality (IEQ) - Problems, Research, and Solutions, Jetter,J. (ed.) Raleigh, North Carolina, USA:Air and Waste Management Association (A&WMA) and US EPA's Office of Research and Development DCLG (2006), Department for Communities and Local Government, Housing Statistics, http://www.communities.gov.uk/index.asp?id=1156006 [Accessed August 2006] Department of Health (2000). Committee on the Medical Effects of Air Pollutants. http://www.advisorybodies.doh.gov.uk/comeap/state.htm [Accessed September 2006] DEFRA (2006), Department for Environment, Food and Rural Affairs, http://www.defra.gov.uk/ENVIRONMENT/energy/hees/index.htm [Accessed September 2006] DWP (2006), Department of Work and Pensions, Energywatch (2006), Report for Energywatch by MRUK, Putting Priorities in Order:How well does the PSR serve priority consumers?, http://www.energywatch.org.uk/uploads/How_well_does_the_Priorty_Services_Register_serve_priority_consumers.pdf [Accessed August 2006] GLA (2002), London Divided: income inequality and poverty in the capital, Greater London Authority, London. http://www.london.gov.uk/mayor/economy/london_divided.jsp [Accessed August 2006] OFGEM_a(2006), The Office of Gas and Electricity Markets, http://www.ofgem.gov.uk/temp/ofgem/cache/cmsattach/13816_2306.pdf#search=%22Domestic%20Retail%20Market%20Report%22 [accessed Aug 2006] OFGEM_b(2006), Personal communication ONS (2006), Population Trends No 123 spring 2006, HMSO, London ONS (2006), Social Trends 36 January 2006, HMSO, London. http://www.statistics.gov.uk/downloads/theme_social/Social_Trends36/Social_Trends_36.pdf [Accessed August 2006] OPSI (1998) Office of Public Sector Information formerly HMSO, The Gas Safety (Installation and Use) Regulations 1998, http://www.opsi.gov.uk/si/si1998/19982451.htm [Accessed Jan 2007] Penney (2002), http://www.coheadquarters.com/ZerotoMillion1.htm [Accessed September 2006] Volans(Chair), London Carbon Monoxide Study Group, (2006), Neuropsychological effects of chronic exposure to carbon monoxide in the indoor air, Final Report to the Department of Health. WHO (1999), Environmental Health Criteria, No. 213: Carbon Monoxide (second edition), ISBN 92 4 157213 2 http://www.inchem.org/documents/ehc/ehc/ehc213.htm Checked November 2004
Gas Appliance Check Project
- 31 -
9 Annex 1: Household carbon monoxide risk and health
As described in the introduction CO is a lethal gas at high enough concentrations, it is also known to have various effects on health at lower concentrations. This section first considers health symptoms experienced by occupants in the sample, then CO exposure risk and then analyses the links between the two. All of the questions were asked to one person per household, the questions were asked by the gas engineer who was instructed not to lead the respondents. The engineer asked the questions while carrying out the tests as this was felt the householder would be less intimidated by answering any of them. It is worth highlighting that the questions were asked by a gas engineer not a medical professional. No attempt was made to control for other factors that might affect health, such as food/drink consumption or smoking.
9.1 General health Questionnaire respondents were asked to rate their “general health right now” on a scale of Good, OK, Not So Good, Poor, see Appendix C. It was felt that people were generally optimistic in answering this question, perhaps due to the fact that they were asked by a gas engineer rather than a GP. A total of 12% or 69 people reported their general health as being Poor or “Not so good”. When asked if they had visited their GP or hospital recently, 9% or 53 people said they had, however this often seemed unrelated to their “general health right now”.
9.2 Individual symptoms The following symptoms associated with CO exposure were investigated by the question, “Have you experienced any of these symptoms WITHIN the home in the last week? Tick if yes”, the symptoms were as given in table 21, along with their prevalence in the sample set. Four percent of the total sample had experienced at least 2 of the 6 symptoms, 2% had experienced at least 3 symptoms. This question was developed in conjunction with the team from the medical toxicology unit at Guys Hospital, who have extensive experience in diagnosing patients with effects of carbon monoxide exposure [Volans et al 2006]. Table 21 : Questionnaire respondent symptom prevalence Symptom Sample % (n, total = 593)headaches 7% (39)feeling faint 2% (9)feeling sick 3% (20)memory loss 2% (11)lack of concentration 2% (13)experienced confusion 1% ( 6) 2+ symptoms reported 4% (23)3+ symptoms reported 2% (11)
9.3 Health symptom reporting and CP14’s Table 22 presents a simple table showing that there seems to be a baseline level of about 7% of homes with no problem gas appliances reporting at least one of the above named health symptoms. Those with at least one CP14 rated appliance were found to be nearly 3 times more likely to have any health symptom, 18% of this group reported at least one symptom.
Gas Appliance Check Project
- 32 -
Table 22 : Health symptoms and CP14’s No symptoms reported
%(n) Any symptom reported %(n)
Total of each row
No CP14 issued
93% (434) 7% (30) 100% (464)
Any CP14 issued
82% (109) 18% (20) 100% (129)
Total of column
92% (543) 8% (50) 100% (593)
Table 23 investigates this in a slightly different way, with numbers of homes with problem gas appliance installations grouped by how many health symptoms were reported. While there may be questions about the reliability of the health questionnaire responses due to the form being based on householder responses rather than doctor diagnosis, it seems clear that respondents reporting more health symptoms, have a higher likelihood of having problems with their gas appliances. With each increasing health symptom reported there appears to be a higher likelihood of the home having at least one CP14 rated appliance. Table 23 : Health symptoms and problem appliances Number of symptoms reported
Total households reporting n symptoms
% of people reporting n symptoms with at least 1 CP14
0 543 20% (109)1 27 37% (10)2 12 42% (5)3+* 11* 45% (5)* Totals 593 22% (129)* Addition of 3 or more symptoms to give 3+ symptoms From Table 23 it can be seen that a total of 23 people reported two or more symptoms. Of these 10 had at least one CP14 rated appliance. The five respondents reporting three or more symptoms and having at least one CP14 all had at least one Immediately Dangerous (ID) appliance. Each of these appliances were found to have high CO measurements. Comments from the other 6 respondents reporting 3+ symptoms and not having any CP14’s issued are given in table 24. Case AA42 and AA73 seem unrelated to CO, but in 9 of the 11 cases where respondents have reported 3 or more symptoms, poor appliances could be linked to their symptoms. (Cookers rated by the engineers as OK, rather than good, were found in 4 of the households). Table 24 : Comments from homes of respondents reporting 3+ health symptoms but with no CP14’s Reference Comments AA32 Gas fire previously disconnected by Transco, Cooker only just OK, all rings
emitting elevated CO AA33 Hob only ok, 1 year old boiler AA42 Appliances all good AA50 Cooker only OK, but window only source of ventilation, apparently never opens
it though. AA73 Appliances all good, Diabetes and High blood pressure AA416 Grill only OK on 20 year old cooker, other appliances good
Gas Appliance Check Project
- 33 -
9.4 CO exposure risk: methodology For each CP14 case, and also for all of the highest CO emitting appliances a risk to the occupants was assessed by the author with advice from Colin Copestake from the gas engineers Dawsetway. This was based on the assumption that some situations are likely to be more risky than others, for example a single gas hob emitting a high concentration of CO may not be as dangerous as a gas fire emitting the same concentration because the occupants are likely to be exposed to the fire emissions for a longer time. If in addition to this, ventilation is available and used, in the case of the cooker, the risk is lower still. The overall risk assessment is based on the risk of the occupant being exposed to concentrations of CO higher than the WHO guidelines as given in the Introduction. The assessment of the risk level was carried out using the criteria as shown below. An attempt has been made to make an objective procedure to carry out this risk assessment. In some cases the appliance was shut down based on visual inspection and CO measurements were not taken, risk assessment in these cases is based on discussions with Colin Copestake. Actual risk depends on actual use of appliances, and ventilation so may differ but this method aims to gives a more understandable picture of any possible risks to health from CO generated by problem gas appliances across the sample. Some example risk assessments are given in section 9.6.
9.4.1 Cooker risk assessment A cooker is considered D_low risk if any element emitting above 26ppm and C_medium risk if any element emitting above 52ppm, B_high risk if over 104ppm and A_very high risk if over 208ppm these thresholds are based on the WHO guidelines listed in the Introduction section. This risk value was increased if the cooker was rated ID, if several elements were emitting at these concentrations, or if no ventilation method existed to outside.
9.4.2 Gas fire risk assessment A gas fire is considered D_low risk if spilling any CO, C_medium risk if above 26ppm, B_high risk above 52ppm, A_very high risk if spilling over 104ppm. These risk ratings again were raised if the fire was in the bedroom or if there were ventilation problems. Rating of C_medium given if fire spilling and rated ID but with no CO measurement.
9.4.3 Boiler risk assessment A boiler is considered D_low risk if spilling any CO, C_medium risk if above 26ppm, B_high risk above 52ppm, A_very high risk if spilling over 104ppm. Open flued boilers were rated at A_very high risk if flue gas CO concentration was greater than 1000ppm. If terminals were fitted too close to doorways or windows, then risk was rated D_low at 52ppm, C_medium at 104ppm, B_high at 208ppm, A_very high at 416ppm. If a boiler was rated ID for any reason, and CO flue gas concentration was above 108ppm then it was rated D_low even if the ID rating was not related to CO emissions into room. This low rating is assigned to indicate that this situation is likely to be more risky than no risk.
9.4.4 Overall risk assessment In the previous 3 sections, individual appliances are assigned a risk related to the chance of them producing CO concentrations in the home greater than those in the WHO guidelines quoted in the introduction. This risk level is applied to the home if there are no other appliances emitting CO. In a home where there are several appliances that have been assigned a risk level, the higher of the two risk levels is incremented by one level to give a rating for the home reflecting the greater likelihood of being exposed to higher CO concentrations.
Gas Appliance Check Project
- 34 -
9.5 CO exposure risk: Results The basic prevalence of each risk category assessed is given below. Table 25 : Prevalence of CO risk categories across the sample CO Risk category Prevalence in sample % (n)A_Very High 2% (13)B_High 4% (22)C_Medium 7% (42)D_Low 19% (111) Little or no risk 69% (409)Total 100% (597) The two categories judged highest risk make up 6% of the sample. The category titled “little or no risk” needs some clarification as this may include appliances that have reasonably high flue gas readings for example but have room sealed flues and the situation is not rated as dangerous by the gas engineer. There are few people in the sample who reported 2 or more health symptoms and only a few of these are placed in the highest CO exposure risk categories. However table 26 and table 27 suggest a link between experiencing an increased number of health symptoms and an increased household CO exposure risk. From Table 27, of those homes in the highest risk category, 9% of householders reported 2 or more health symptoms compared with 3% of those in the little or no risk category. Table 26 : Prevalence of any health symptom reported by CO risk category across the sample CO Risk Category 0
Health symptoms reported
1 or more health symptoms reported
A_Very High 77% (10) 23% (3)B_High 86% (19) 14% (3)C_Medium 81% (34) 17% (7)D_Low 90% (100) 9% (10) Little or no risk 93% (380) 7% (27)Total 91% (543) 8% (50) Table 27 : Banded health symptoms reported by grouped CO risk category across the sample CO Risk Category 0 or 1
Health symptoms reported
2 or more health symptoms reported
High or Very High (A or B)
91% (32) 9% (3)
Medium or Low (C or D)
93% (143) 5% (8)
No risk category given
97% (395) 3% (12)
Gas Appliance Check Project
- 35 -
Total 95% (570) 4% (23)
9.6 Example risk assessments from individual cases Individual cases are described below in more detail to give a better picture of how the risk assessment procedure was carried out. AA11, gas fire, model Radiation, found to have damaged heat exchanger so rated ID, FGA was used to measure combustion products approx 75mm above heat exchanger, CO emissions measured at 125ppm. Fire not in living room, home also had 6 months old boiler, so assessment is the fire not likely to be used very often but is dangerous, so there is a risk to the occupants of exposure to >100ppm CO that they are likely to be unaware of. Risk = B_High. AA83, gas fire Valor 70 Pag, known by gas engineers to soot up, FGA used to find CO emissions of 35ppm, also cooker emitting CO from grill, and 2 hobs at >30ppm, so risk of exposure to CO from cooker and fire, ventilation by window only so cases when cold window may not be opened, so rated CO exposure risk C_Medium. AA85 “dangerous” gas fire in bedroom, FGA found CO at 189ppm, risk of CO assessed as B_high, customer has Vaillant Turbomax 5 yrs old so may not use fire very much but there is a high risk of exposure to CO in the bedroom if it is used. AA95 Main fire in front room, damaged radiant so rated ID, FGA used to find CO at 45ppm, high risk of exposure to CO. AA142 Housewarmer Back Boiler and Fire, back boiler ok, but fire is rated ID and failed spillage test, rated B_high risk. AA156 Fire in living room, back plate not sealed properly, fire in other room spilling CO, cooker grill emitting 25ppm CO, combined CO exposure risk rated as B_high. AA164 fire in living room, heat exchanger found to be leaking CO by FGA, cracks not visible to eye but 135ppm CO reading by FGA. This case would not have been found without the FGA, opinion of as engineer is that over time this situation would get worse so rated ID and also rated B_high risk. AA275 eye level grill bad condition emitting CO at 66ppm, fire in living room not emitting hight CO, but incorrect radiant, and fire fitted onto wooden backing, both rated ID, combined situation rated C_medium CO risk. AA327 fire living room failed spillage test, CO measured at 22ppm, fire in other room, no purpose ventilation, both rated ID, CO risk to occupants, rated as C_Medium AA329 fire in living room, spilling @CO 36ppm , rated as C_medium AA514 back plate on fire in living room not sealed properly spilling CO into room, measured as 213ppm, rated risk A_Very High AA530 3 gas fires all in poor condition, front room and bedroom both spilling CO measured at 65 and 95 ppm, combined risk B_High AA19 Open flued boiler Glowworm 254ppm, 0.015% CO/CO2 rated ID, flue sooting up, rated risk to occupants B_High AA66 open flued Glowworm 20 years old, sever sooting, poor flame picture, FGA reading so high analyser switching off rated as ID, fire in living room bottom vent covered up by customer, cooker not in good condition emitting CO at ~30ppm combined situation rated as B_High risk to customer. AA102 Worcester 24CDi flue not correctly sealed inside or out, CO 28-80ppm, spillage not found so rated as D_Low risk AA122 boiler flue was spilling CO at 28ppm rated ID, risk assessed as C_medium AA138 air flue not sealed correctly on BAXI SOLO 3, CO measured as 53ppm assessed as D_Low risk AA149 room sealed Myson Apollo CO @ 329ppm 0.09% CO/CO2 ratio, rated ID by engineer but rated D_low CO risk to customer. AA150 room sealed Myson Apollo CO @ 386ppm 0.1% CO/CO2 ratio, rated ID by engineer but rated D_low CO risk to customer. AA160 3 of 4 hobs on cooker emitting ~80ppm CO, Boiler emitting 320ppm 0.016% CO/CO2 modulating up and down both rated ID, risk to customer rated as B_High
Gas Appliance Check Project
- 36 -
AA172 room sealed Myson Apollo CO @ starts up at 450ppm then reduces to ~200 ppm 0.005% CO/CO2 ratio, 21ppm CO with only pilot light running rated ID by engineer, broken window near boiler could lead to entrainment, but as room sealed, rated D_low CO risk to customer. AA185 Ideal Mexico, open flue CO@ 1253ppm ratio 0.0312% CO/CO2 risk to customer A_Very high AA194 Vaillant CINE 18, 0.032%CO/CO2 same after 15 mins, BG serviced appliance, BG called out checked and agreed there is a problem, the heat exchanger was blocked up, rated ID, room sealed though so risk to customer D_low! AA256 very dangerous installation of potterton open flued boiler in loft, with flue connecting into existing chimney, signs of spillage but risk to customer of CO D_low. AA315 boiler flue terminated next to air vent and no terminal guard, installation rated as AR 0ppm CO, so risk to customer of CO rated as None. AA356 Myson Apollo with dangerous flue, end plate missing, CO risk rated D_low AA382 Vaillant combi, products of combustion return to room, gas pipe undersized, front case missing, risk to customer of CO rated as D_Low AA387 flue elbow not correctly fitted to flue pipe Worcester 1 month old boiler rated ID, Gas fire lounge rated AR poor condition, coals incorrect, ventilation not good, cooker poor condition also, combined situation rated C_Medium risk of CO to customer AA427 cooker spilling CO at 22ppm front left hob, fornt right ring completely blocked, back right Hob “very high CO”, very dangerous boiler installation but low risk of CO from this, rated C_Medium risk to CO from cooker. AA431 4 year old Glowworm, serviced 3 weeks ago, CO @919ppm CO/CO2 0.023% after 10 minutes highest reading was 2280ppm rated ID, room sealed though so rated as D_low risk AA477 Baxi Boiler, screw/fixing for case missing leaving small hole to combustion chamber, serviced by BG, silicone sealant in hole but peeled off, CO at 41ppm, dangerous situation so rated AR, fire has no purpose ventilation but not spilling, rated AR, combined situation rated as C_medium AA501 Baxi Boiler, spillage around boiler, poor condition rated ID, CO at 14-23ppm, fire also spilling at 14ppm so rated combined situation as B_high risk to customer.
Gas Appliance Check Project
- 37 -
10 Appendices
10.1 Appendix A: Extra information from analysis
10.1.1 Brand information for gas appliances Table 28 : Gas cooker brand prevalence Cooker Brand Sample prevalence % (n)Belling 2% (10)Cannon 14% (82)Creda 2% (13)Diplomat 3% (15)Hygena 5% (29)Leisure 5% (30)Moffat 4% (21)Parkinson Cowan 8% (45)New World 8% (49)Stoves 4% (23)Whirlpool 2% (12) Table 29 : Boiler brand prevalence Brand Sample Prevalence % (n, total = 564)Baxi 7% (38)Biasi 3% (17)Glowworm 10% (59)Ideal 28% (159)Potterton 15% (87)Ravenheat 2% (10)Saunier 2% (11)Vaillant 18% (100)Worcester Bosch 6% (33) Major brands found are as below, there were many different brands found, so only the most prevalent ones are listed. Table 30 : Gas fire brand prevalence Brand Sample prevalence %
(n, total = 280) Baxi 8% (21)Cannon 7% (19)Robinson Willey 11% (30)Valor 17% (47)Unnamed flame effect gas fire (FEGF) 6% (16)No fire 317 Gas fire other: The most common brands were Valor and Baxi. Water Heater: The brand was mainly C&M or Main.
10.1.2 Household details compared with national figures where available
This section gives statistics about the households from data returned in the short questionnaire, see Appendix C.
Gas Appliance Check Project
- 38 -
10.1.2.1 Gas supplier Householders were asked who their gas supplier was; the following information was given. See notes later in this section about how these were amalgamated. Table 31 : Household gas supplier Gas Supplier National Prevalence % Sample Prevalence % (n)Atlantic - 1% (5)British gas 53%* 62% (373)Edf 5%* 9% (52)Npower 9%* 6% (38)Powergen 14%* 7% (44)Scottish power 9%* 4% (21)Southern electric 10%* 7% (40)*Source: [OFGEM_a 2006]
10.1.2.2 Gas bill information Residents were asked what their monthly gas bill was. The average reported was £39 per month, with a range from £2 to £90 (n=505). The distribution is shown in the graph below. Most people paid between £30 and £50 per month.
Figure 18 : Distribution of gas bills (Data from 505 homes)
10.1.3 General Health
0.00%
10.00%
20.00%
30.00%
40.00%
50.00%
60.00%
GOOD OK NOT SO GOOD POOR Figure 19 : Frequency distribution of general health
10.1.4 Analysis Notes The following subsections include notes on each of several topics that relate to “cleaning” of the data in the spreadsheet.
0
5
10
15
20
25
30
35
% o
f sam
ple
0 20 40 60 80 100Gas Bill(£/Month)
Gas Appliance Check Project
- 39 -
Different people carrying out the data entry put different data in different parts of the spreadsheet and in some cases they use “Y” in others “Yes”, or “YES” for example, all these need to be “cleaned” so that they all become exactly the same. In some cases the handwriting on the original form is difficult to read and so is interpreted based on replies of others, for example, if the cooker is called “Leisure Laureth” but the data entry person has coded it as Leisure Lavref then this is changed to the correct name. Other more specific cases are mentioned below.
10.1.5 NOTES on Gas suppliers Several suppliers have amalgamated so I have reduced the number of suppliers in the spreadsheet based on the amalgamations found in uswitch.com. http://www.uswitch.com/directory/energy/partner-chdzazprovider409/index-s/page-1/providers.html SEEBOARD now EDF Telecom Plus, Utility Warehouse, now NPOWER Via AGE CONCERN now PowerGen Staywarm now Powergen Lloyds TSB now Scottish Power Eastern is assumed to be EDF SEGAS assumed to be EDF
10.1.6 NOTES on Maintenance The engineers asked to see the gas maintenance certificate for each appliance and recorded this on the sheet if the occupiers could produce it. If they just said they had had maintenance this was also recorded but as no evidence exists it is much less reliable a response. Landlords Gas Safety Checks are only one aspect of the overall maintenance of a gas appliance/installation and are a useful awareness raising tool amongst the tenanted sector. However, the need for full maintenance of the appliances/installation is of paramount importance, this is emphasised with the separate duties under Reg. 36 (2) and (3) of GSIUR98. If carried out correctly, the Landlord Gas Safety Check incorporates checks on key safety aspects of appliances such as ventilation, flueing, operating input and safe functioning of the appliance and should highlight many of the key safety issues associated with an installation. This allows a landlord to arrange for appropriate remedial action at the earliest opportunity. The check is not only a visual examination of the appliance but a basic check of its safe operation. It rarely includes measurement of CO.
10.1.7 NOTES on Cookers Minimum age is the age entered where the gas engineer has indicated a range such as 5-10 or 10+.
10.1.8 NOTES on General Health A few cases said OK – NOT SO GOOD, both converted to NOT SO GOOD
10.1.9 NOTES on CP14 coding Some of the grading can be a bit subjective, in similar situations some engineers might say AR whilst others say ID, I’ve coded all as they call it. For example, sometimes “no purpose ventilation” for gas fire can be AR or ID. Cooker AA468 high emitting CO from grill and oven, AR, not ID, disconnected. Cooker AA471 high CO from grill 900 ppm not classed as Immediately Dangerous.
10.1.10 NOTES on RIDDOR What to do about unsafe situations is outlined in this book http://www.corgi-direct.com/Product.aspx?cID=1020 Certain gas installations that are found to be Immediately Dangerous need to be reported to the Incident Contact Centre, under RIDDOR. http://www.riddor.gov.uk/
Gas Appliance Check Project
- 40 -
“RIDDOR '95 means the Reporting of Injuries, Diseases and Dangerous Occurrences Regulations 1995, which came into force on 1 April 1996” 3 cases were reported, as being extremely dangerous AA427, AA256, AA19 In terms of RIDDOR reporting, the requirements under Regulation 6(2) are: ‘Whenever an employer or self-employed person who is a member of a class of persons approved by the Executive for the purposes of paragraph (3) of regulation 3 of the Gas Safety (Installation and Use) Regulations 1994 has in his possession sufficient information for it to be reasonable for him to decide that a gas fitting as defined in the said Regulations or any flue or ventilation used in connection with that fitting, by reason of its design, construction, manner of installation, modification or servicing, is or has been likely to cause death, or any major injury by reason of— (a) accidental leakage of gas; (b) inadequate combustion of gas; or (c) inadequate removal of the products of combustion of gas, he shall within 14 days send a report of it to the Executive on a form approved for the purposes of this regulation, unless he has previously reported such information. A failure to maintain an appliance is not RIDDOR reportable. However, if this was found in tenanted property - the engineer would need to inform HSE as there is a duty on landlords to maintain the gas appliances.
10.1.11 NOTES on Warm Front Reporting AA325 has 3 gas fires, pensioner on benefits, has been checked for Warm Front eligibility. AA175 needs new CH system, has been checked for Warm Front eligibility.
10.1.12 NOTES on Replacement Cookers In total 5 cookers have been replaced, 4 funded from project contingency budget by UCL, one has been funded via Regional Renewals. In all cases the gas engineer considered the problem dangerous enough to condemn the cooker. The personal circumstances of the household were of sufficient concern for the gas engineer to recommend replacement to the Dawsetway project manager and for the UCL Project Manager, Ben Croxford, to authorise payment from the contingency budget. Table 32 : Homes with replacement cookers provided Reference ID AA184 AA275 AA160 AA557 AA500
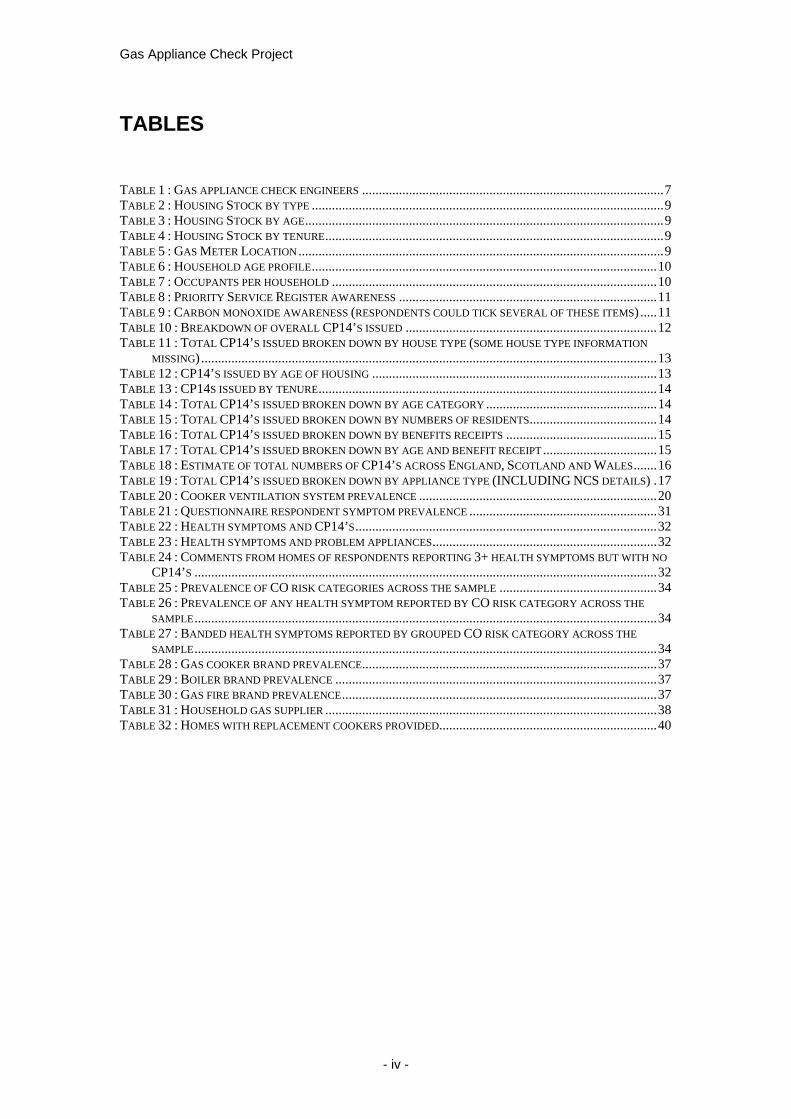

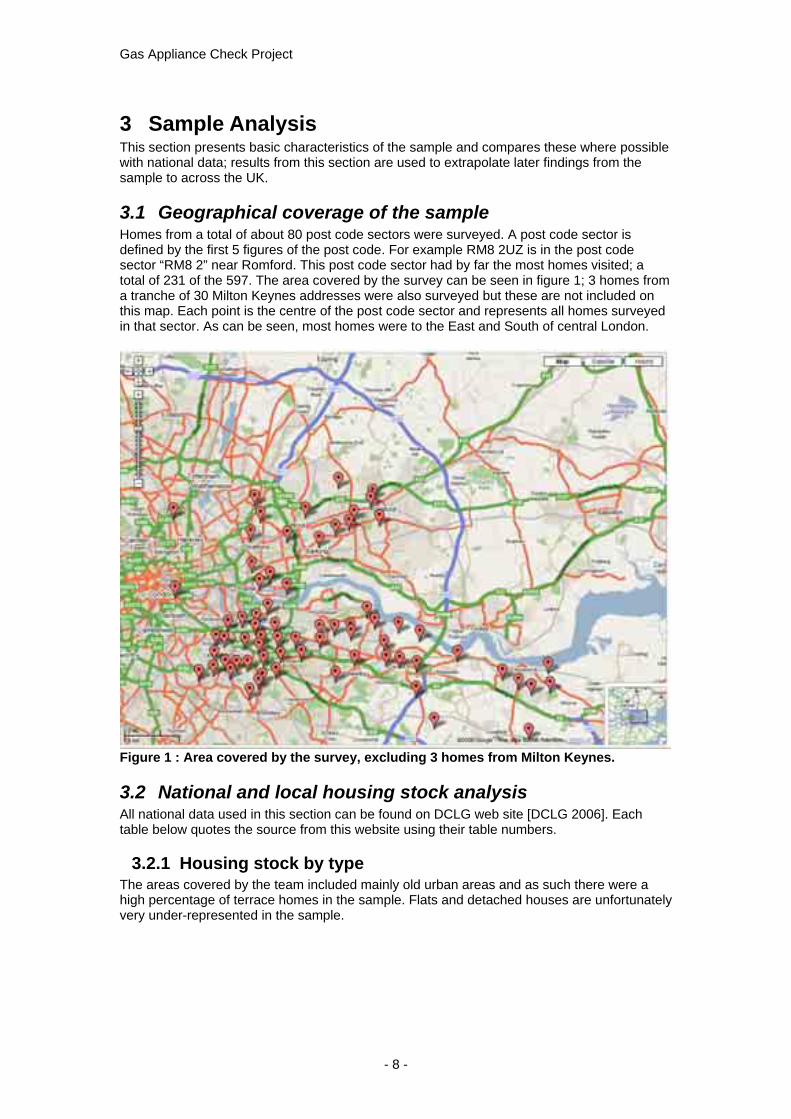
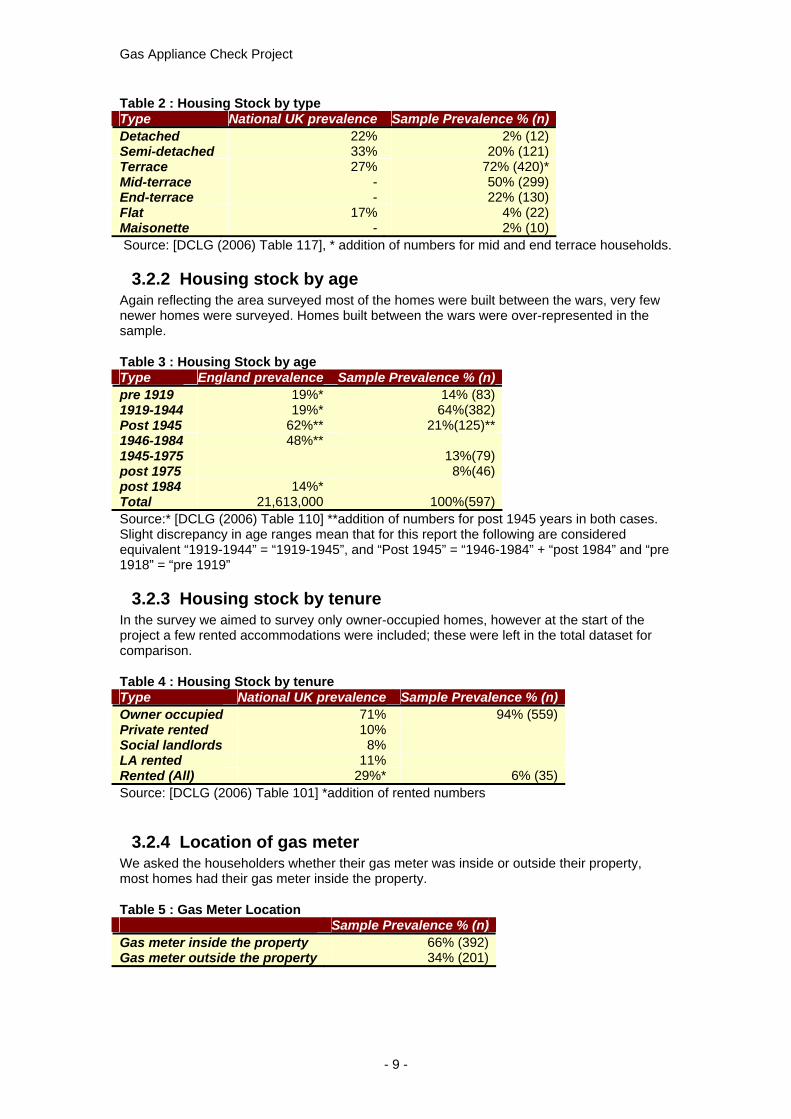
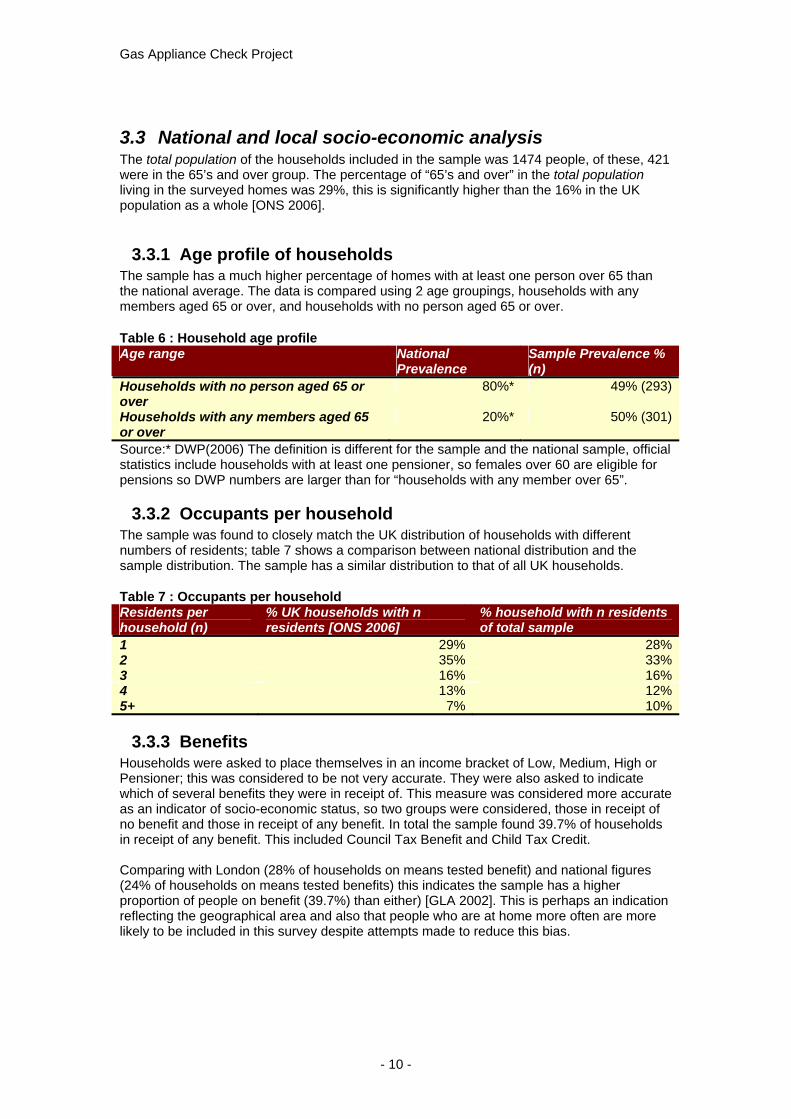
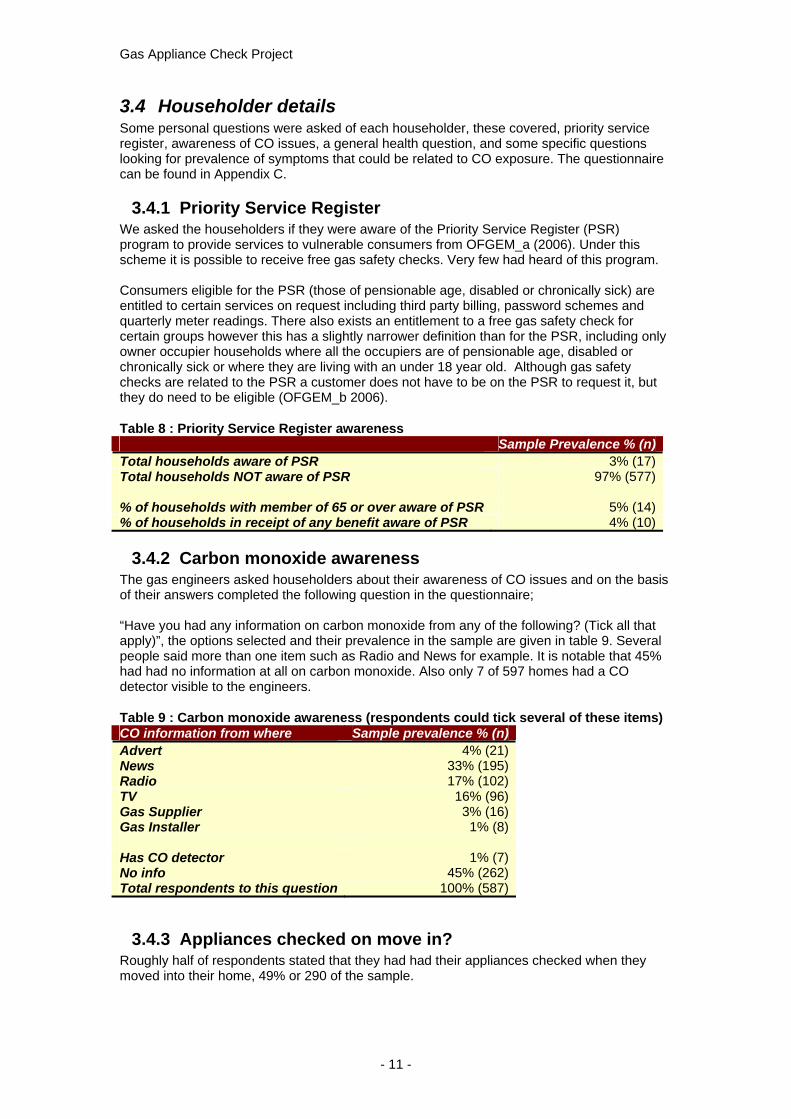
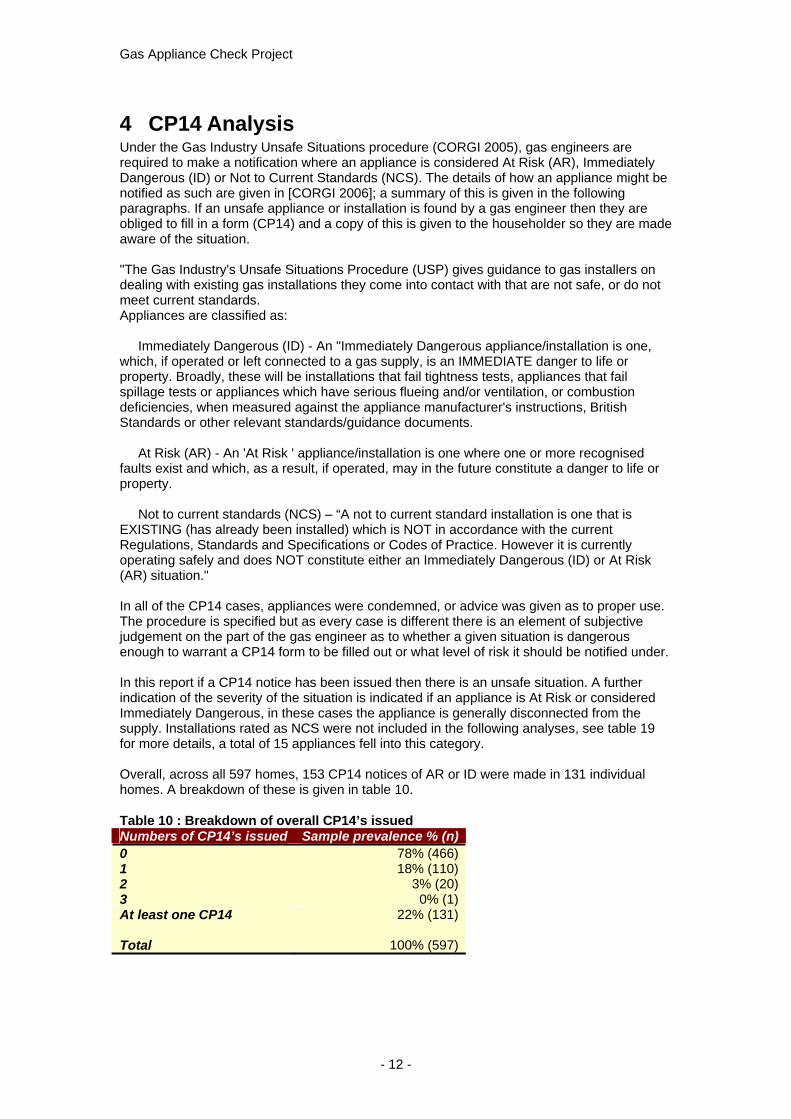
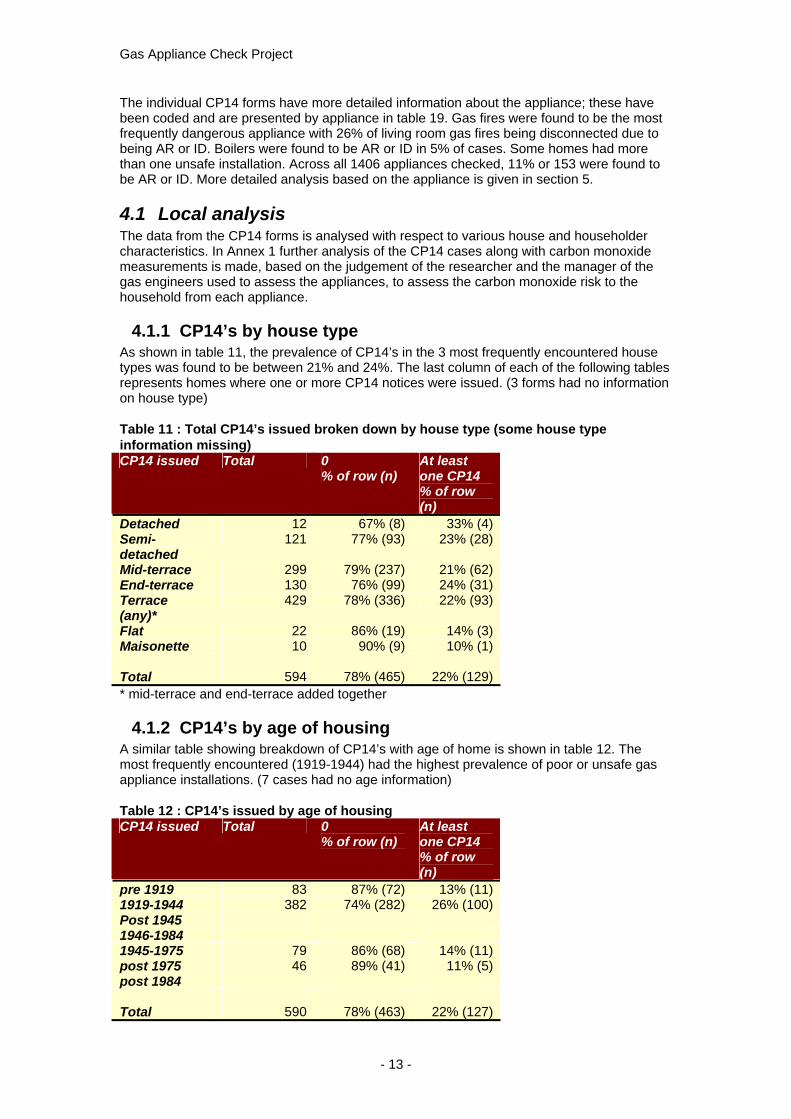
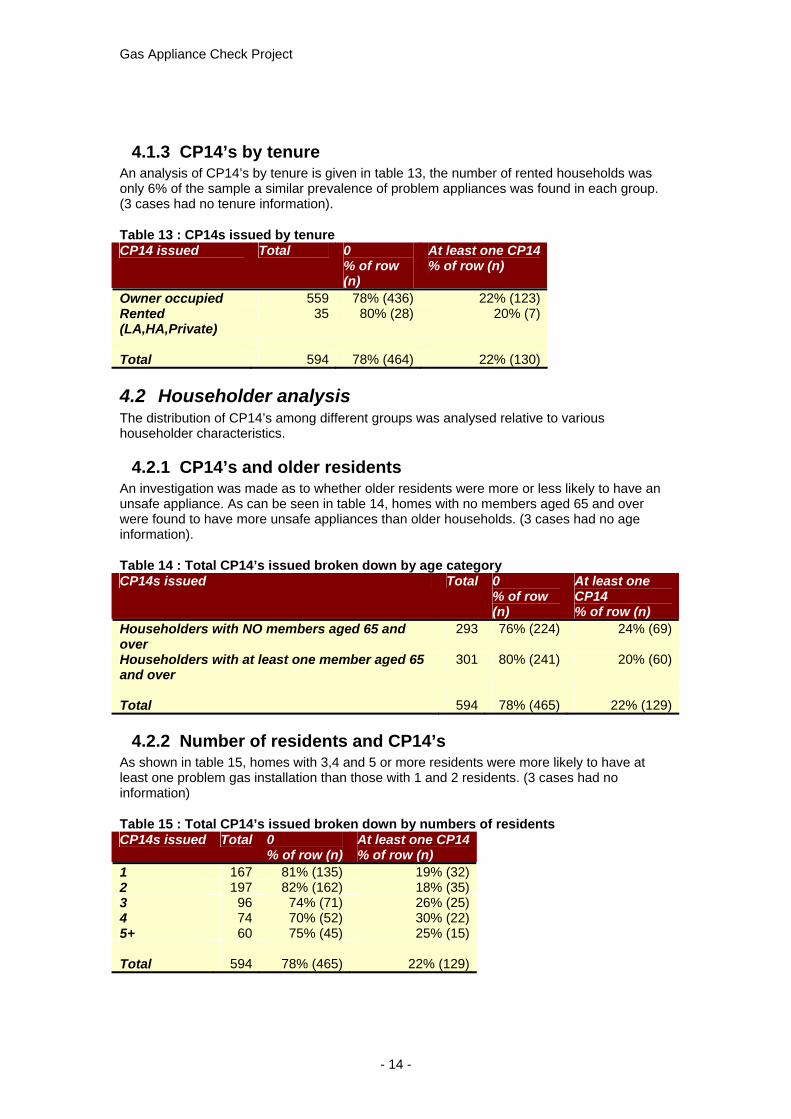
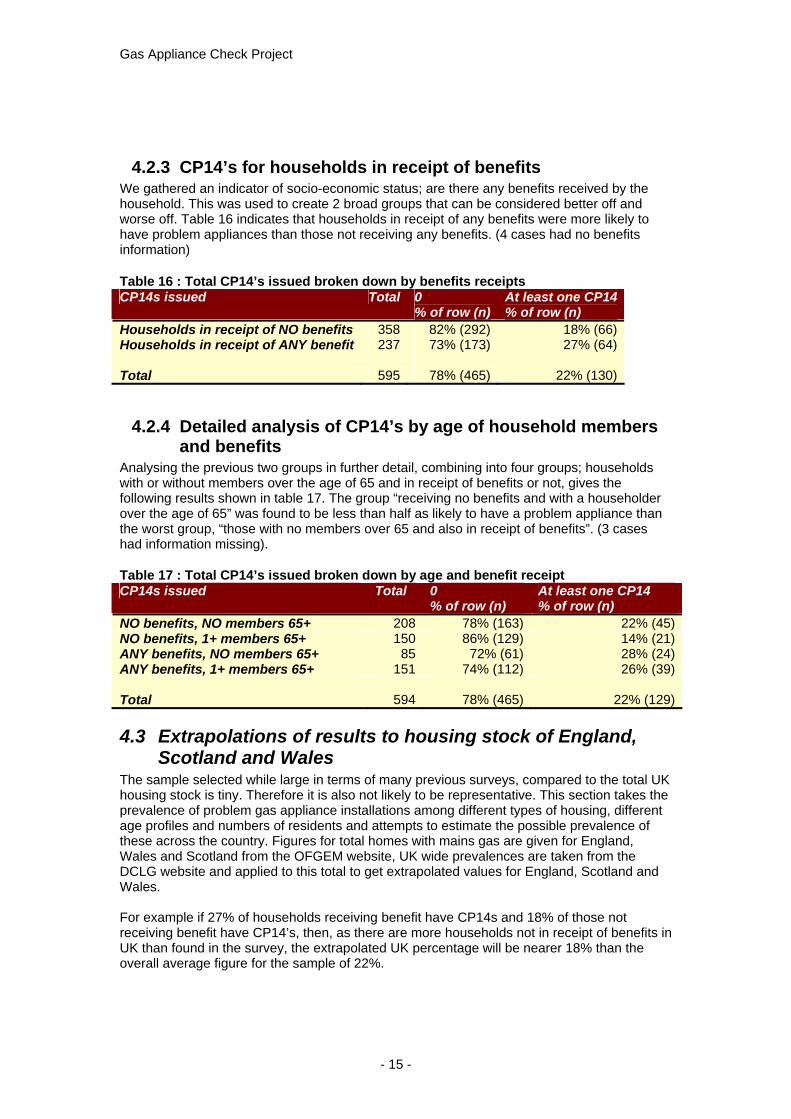
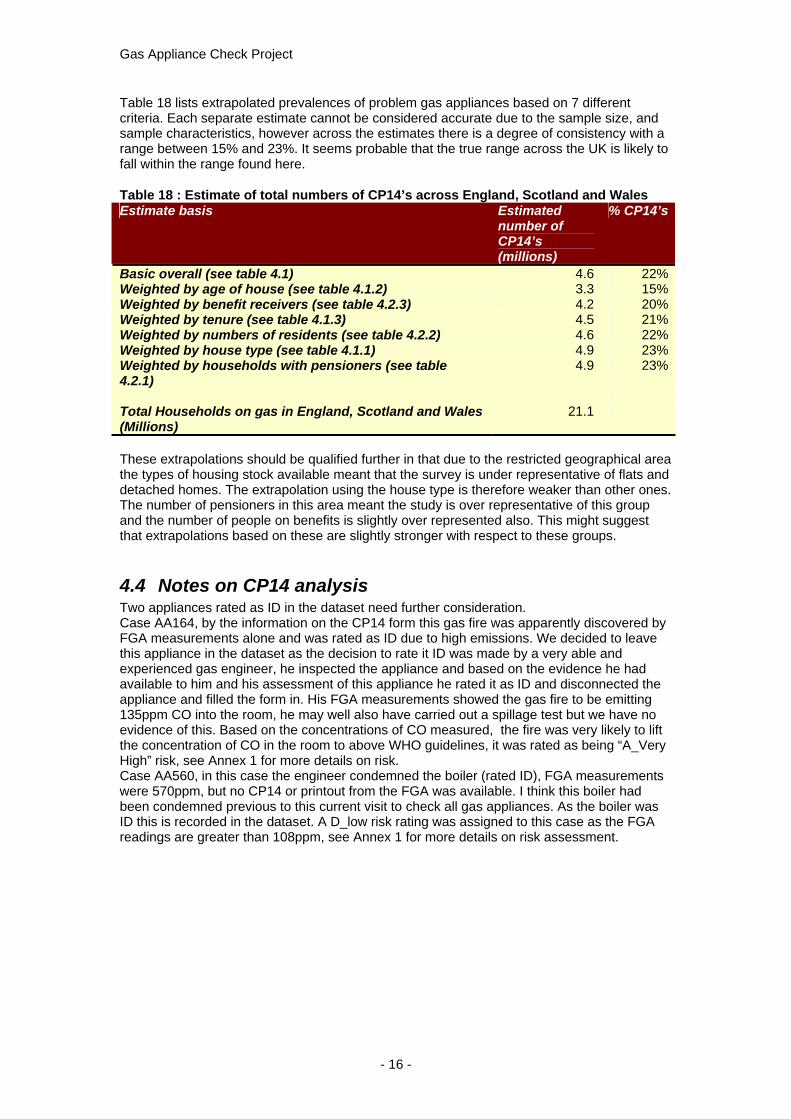
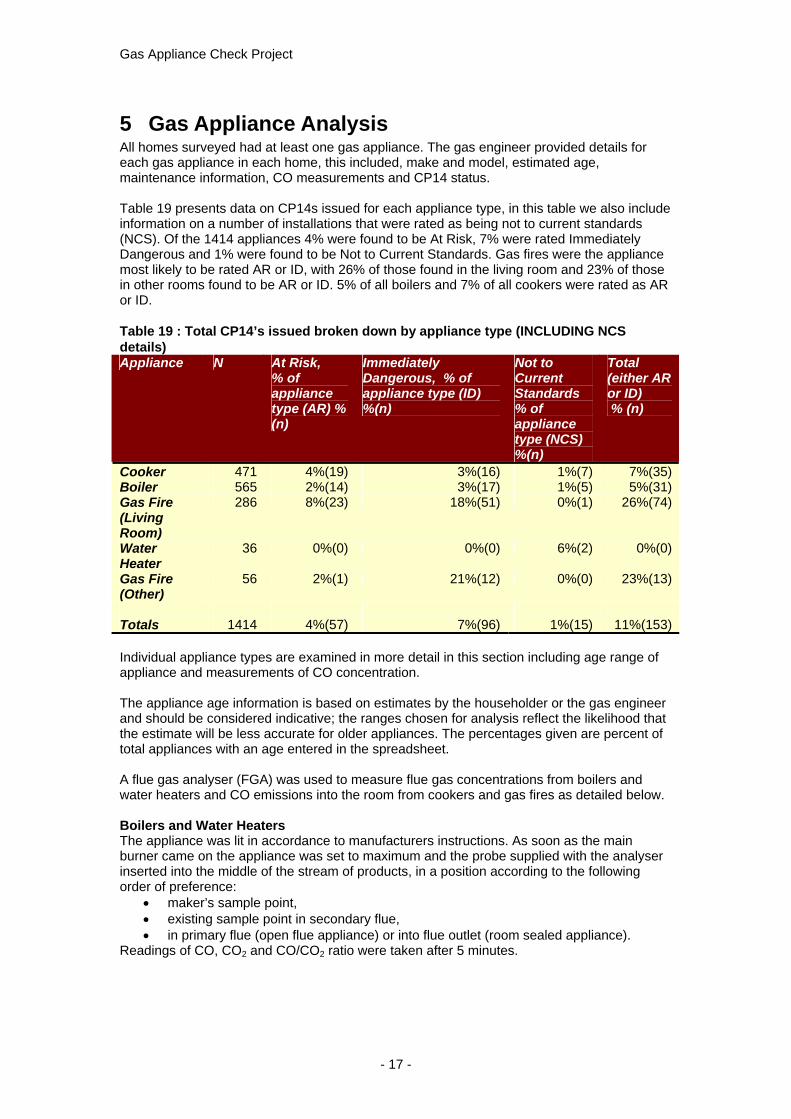
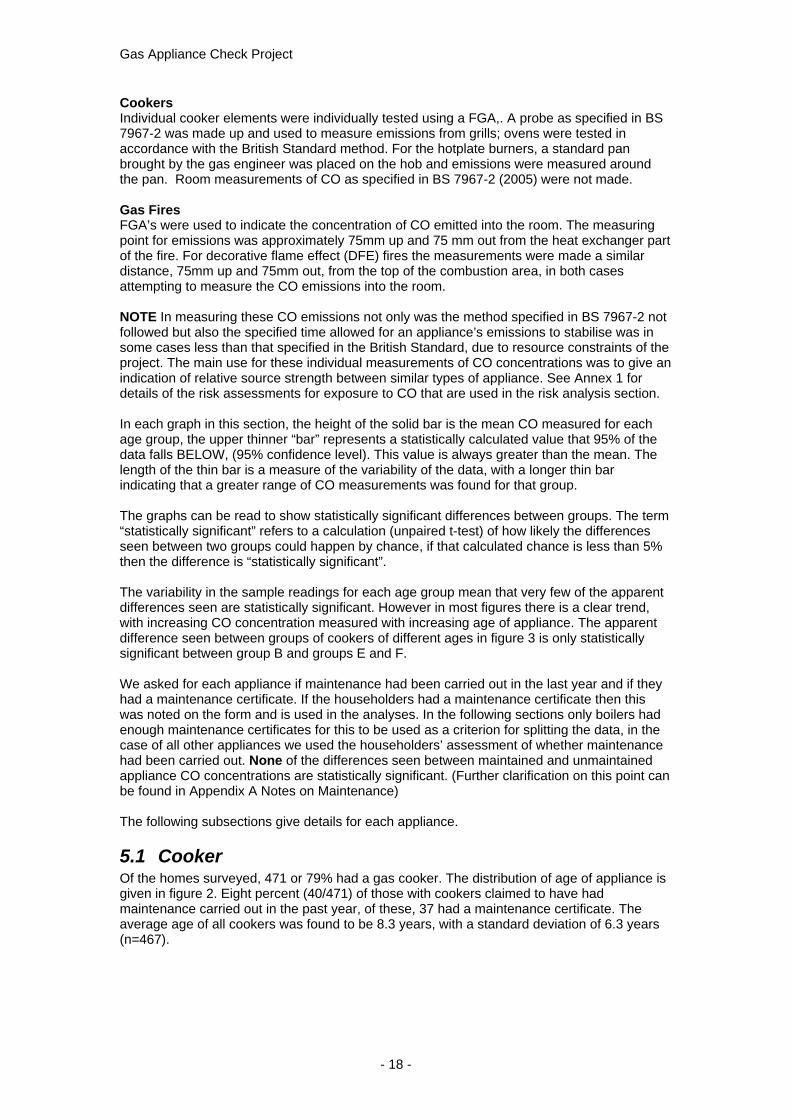
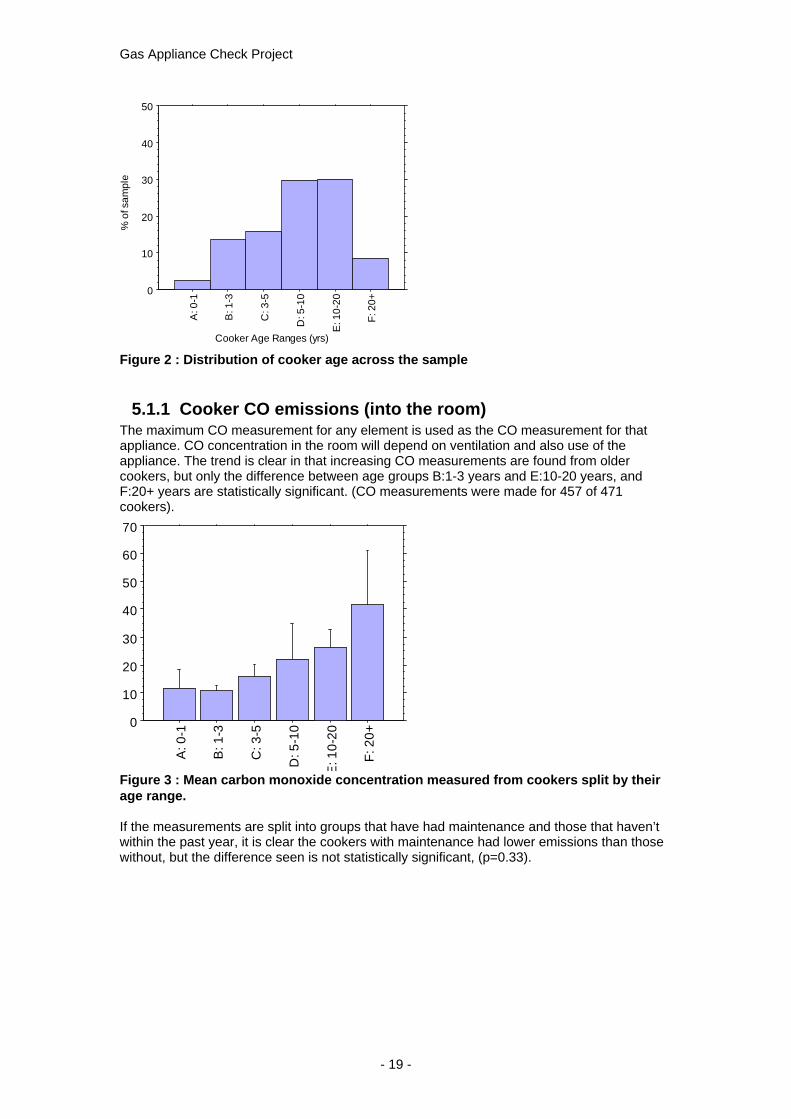
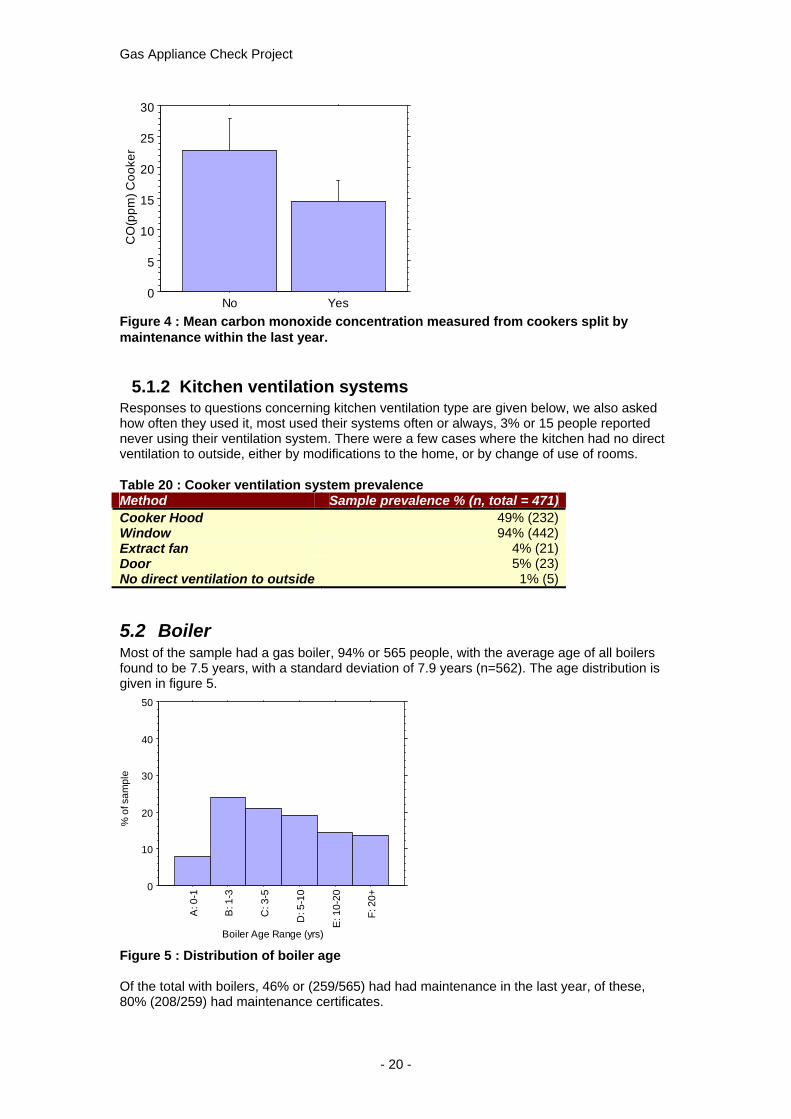
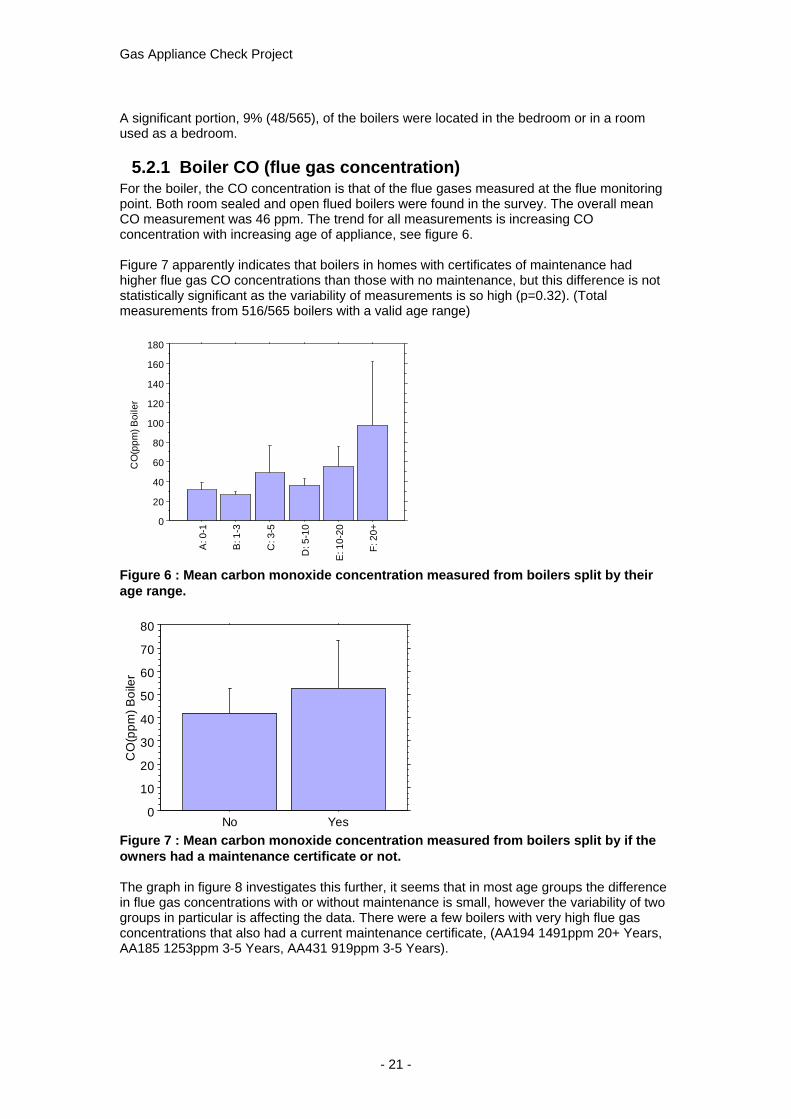
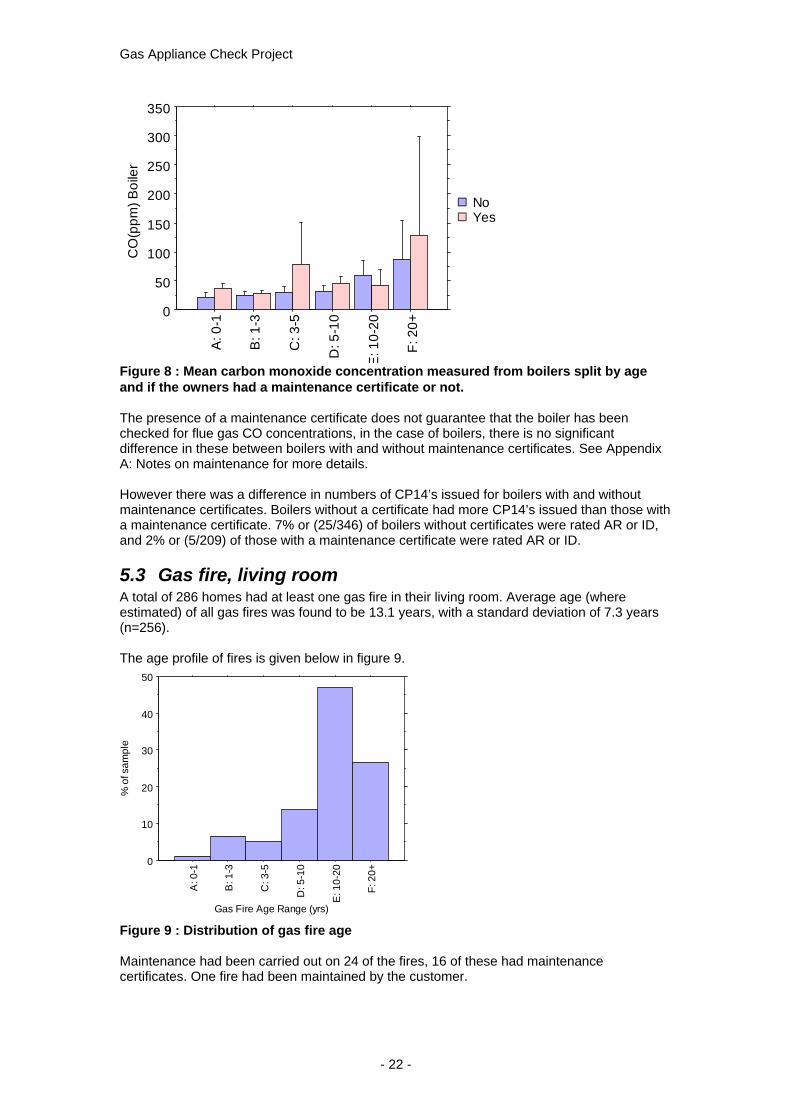
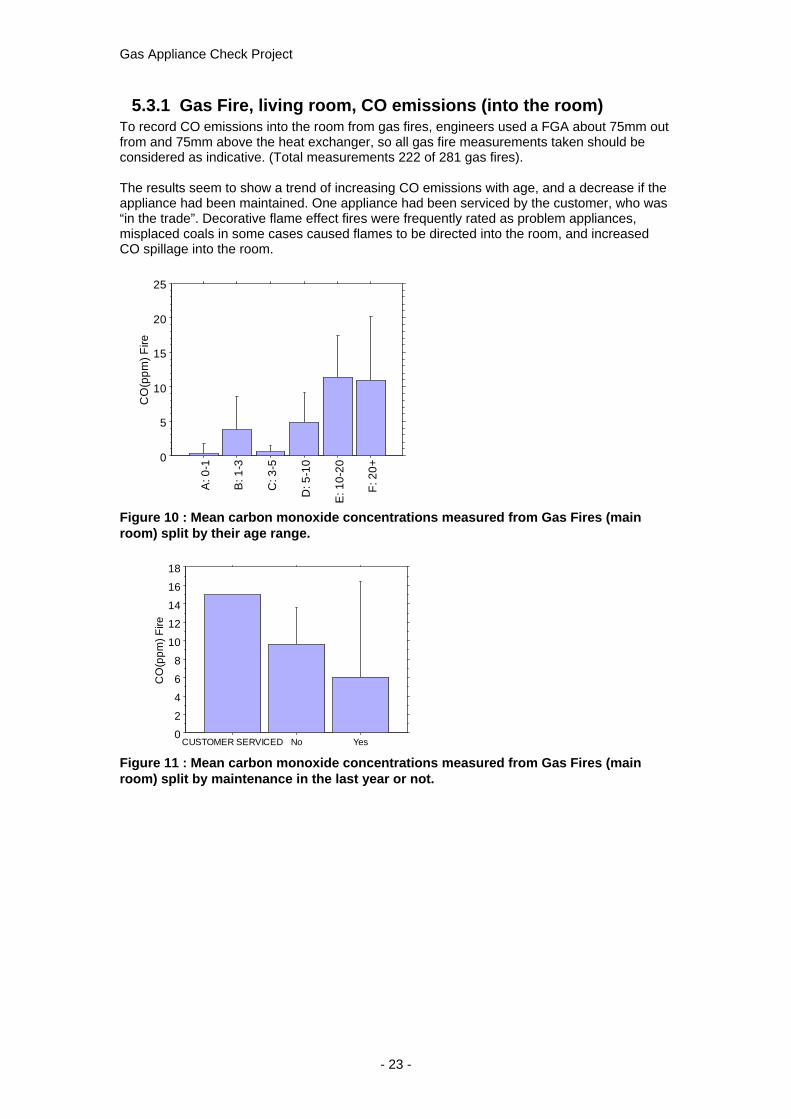
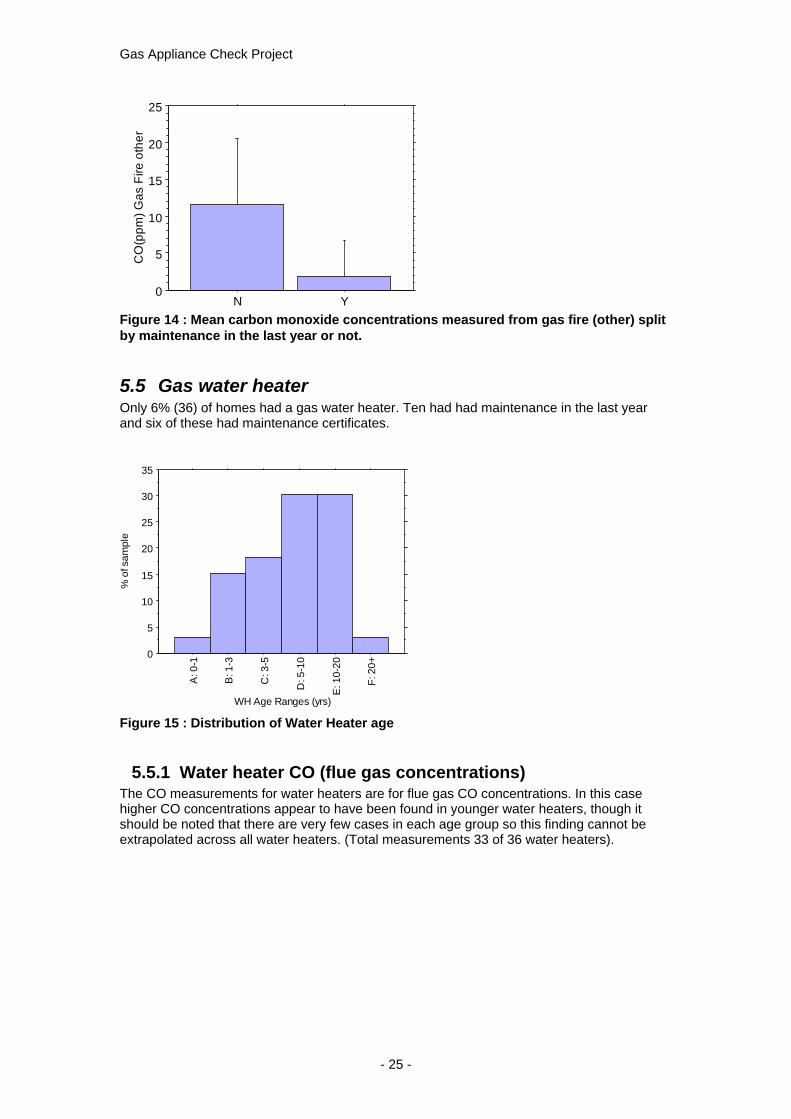
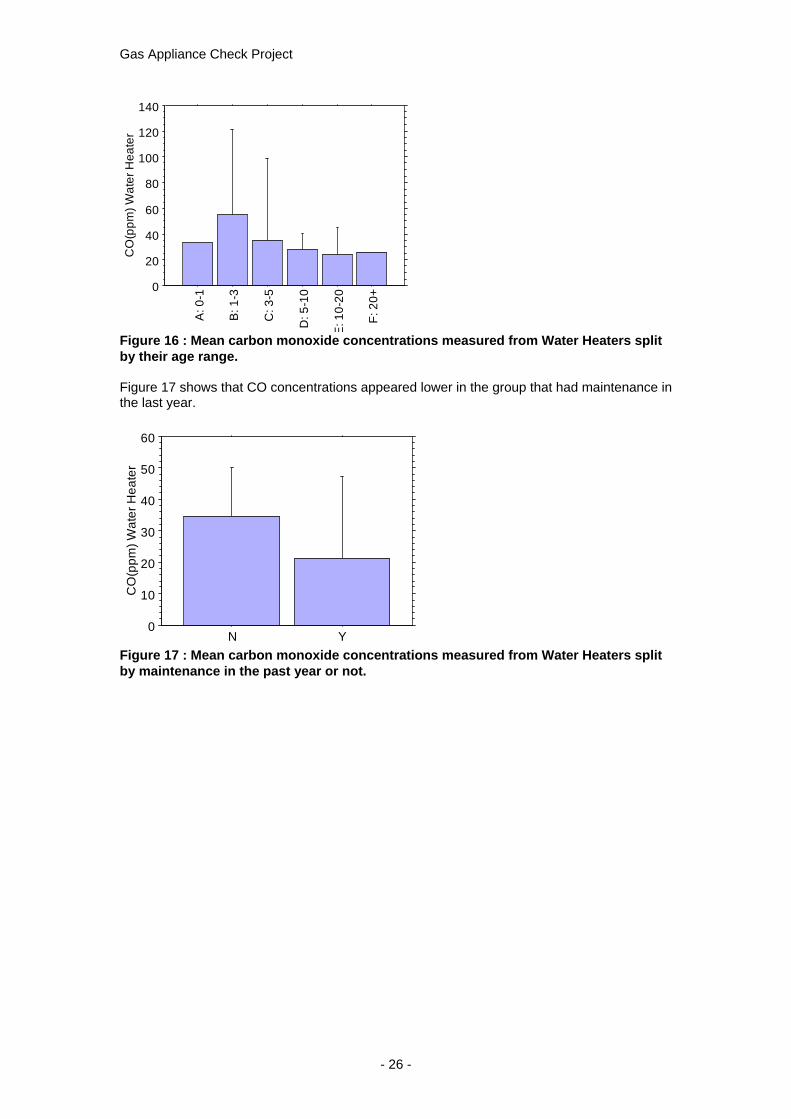
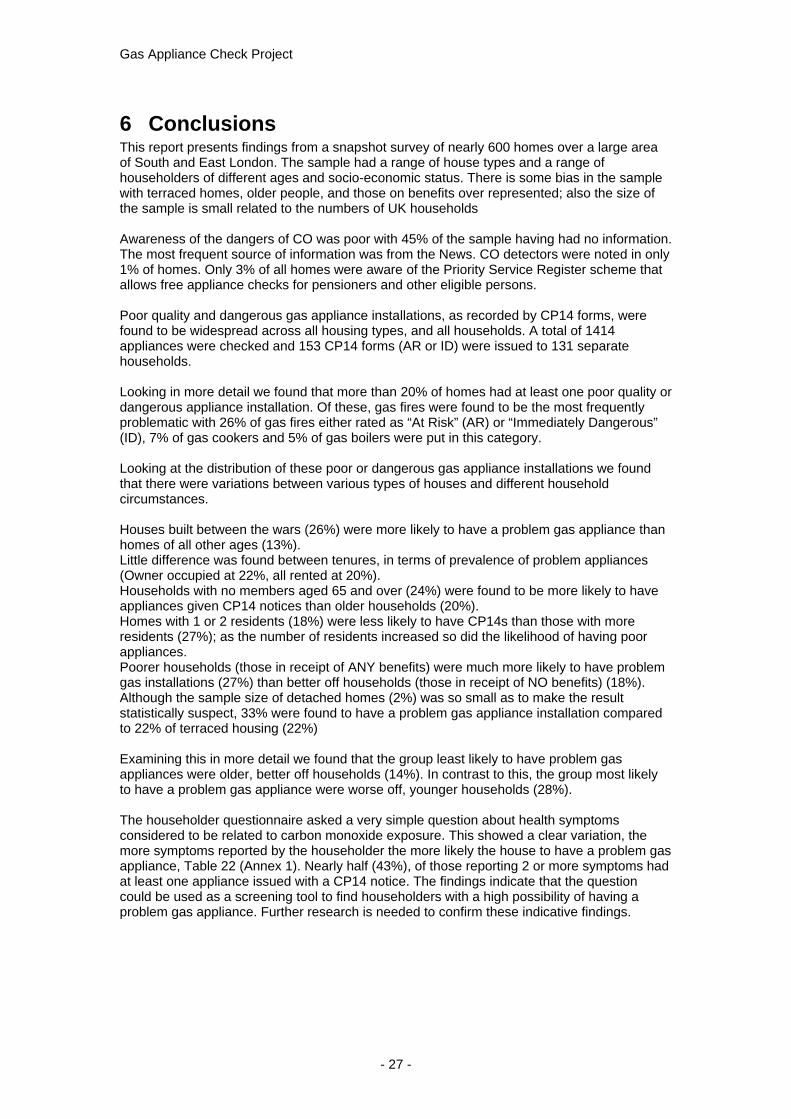


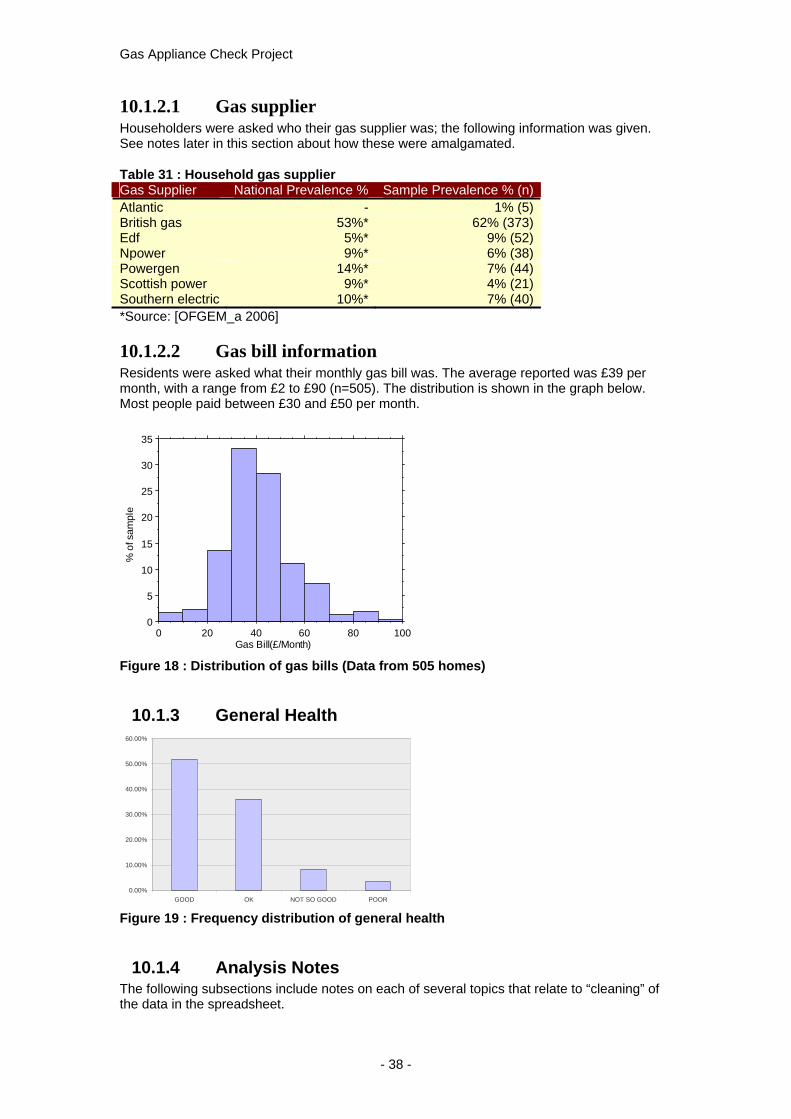
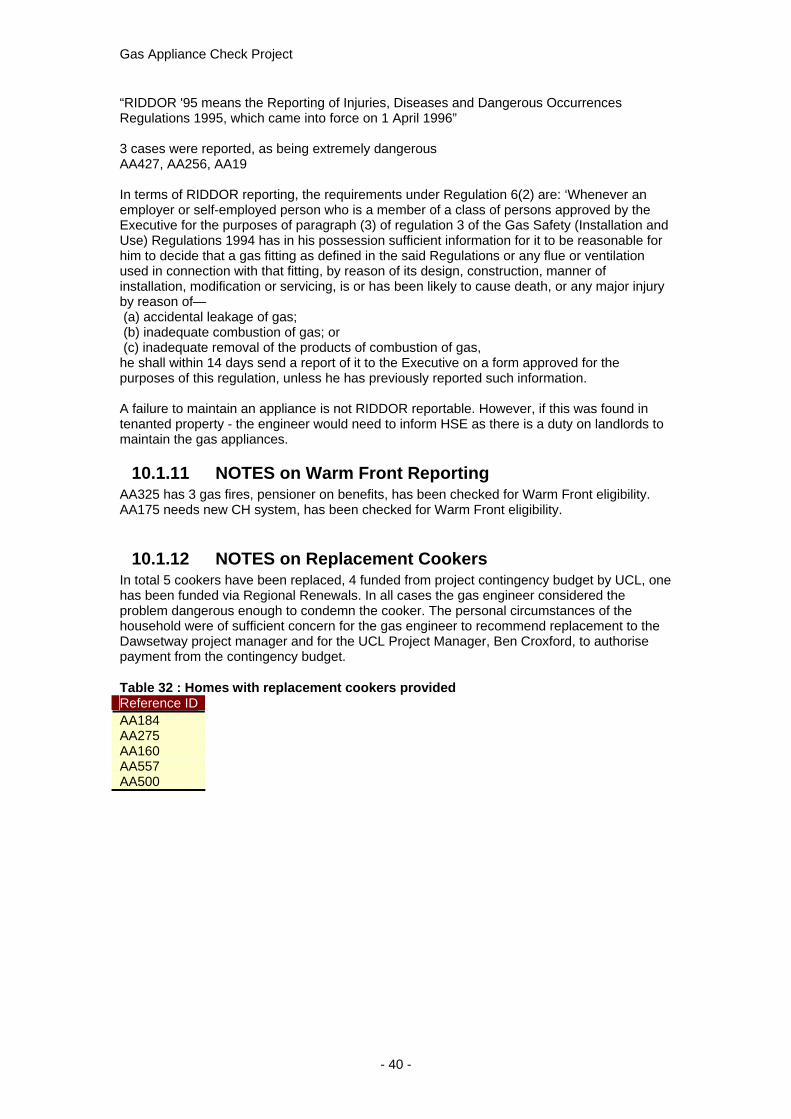
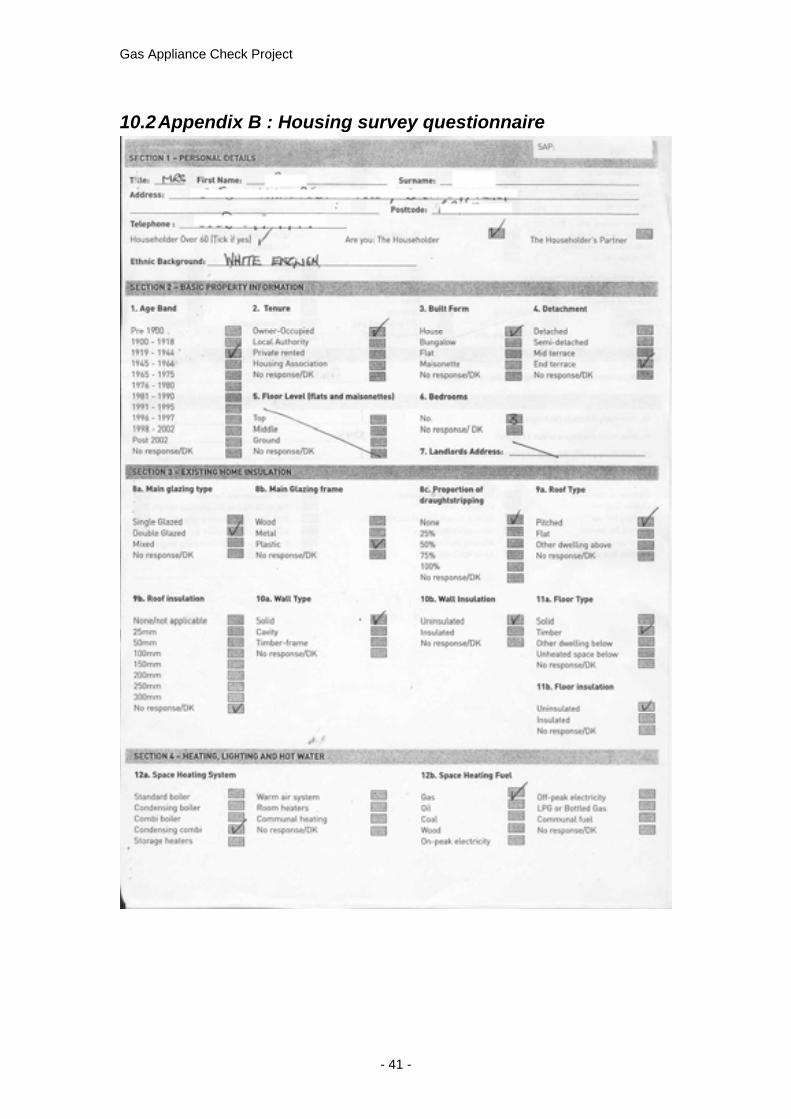
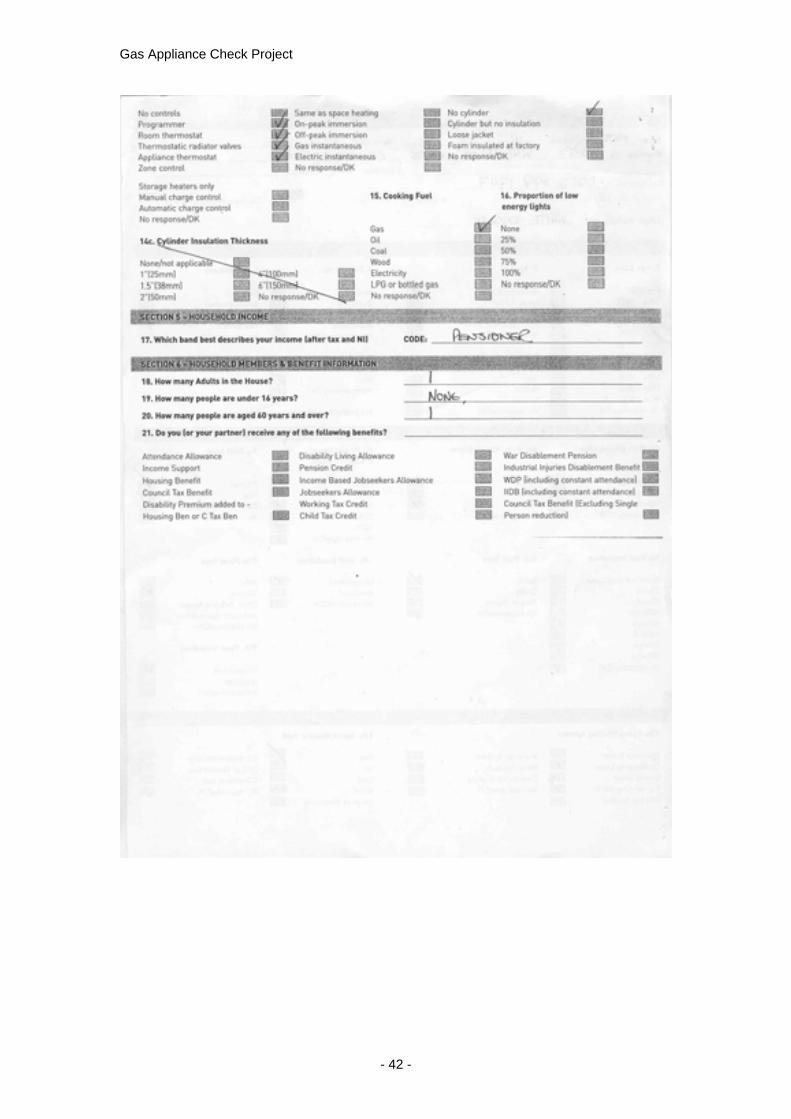
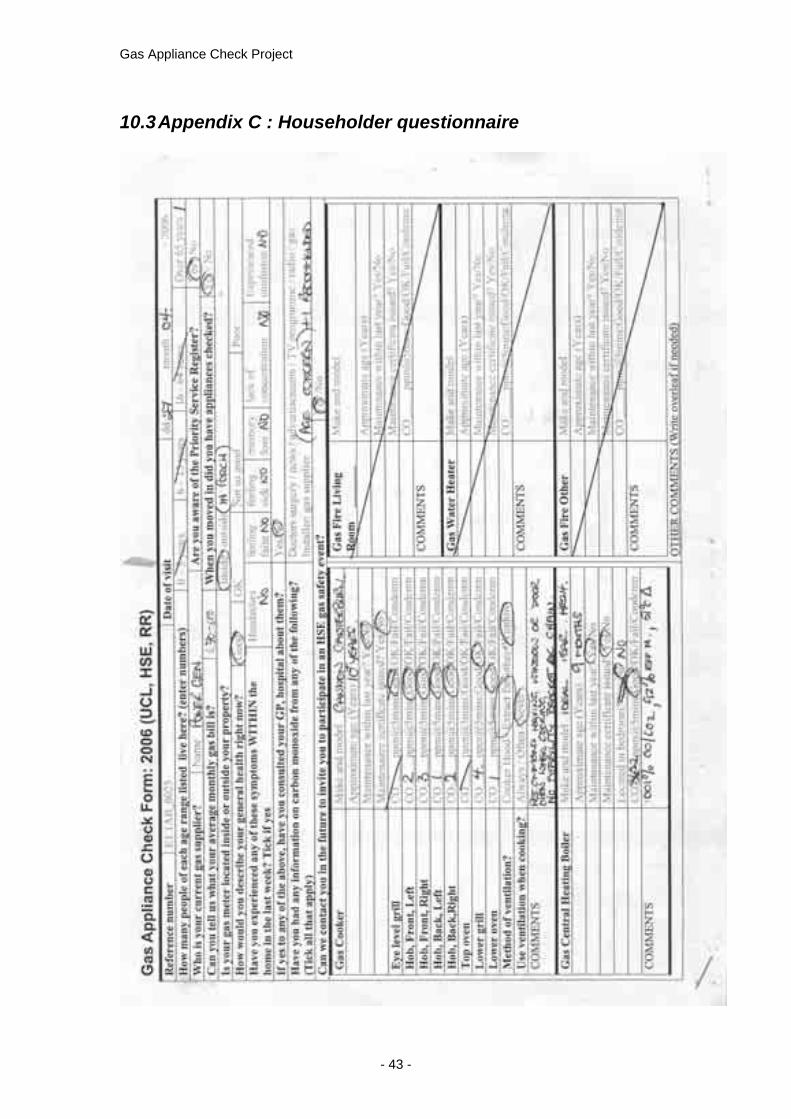
![Detecting Carbon Monoxide Poisoning Detecting Carbon ...2].pdf · Detecting Carbon Monoxide Poisoning Detecting Carbon Monoxide Poisoning. Detecting Carbon Monoxide Poisoning C arbon](https://static.documents.pub/doc/80x56/5f551747b859172cd56bb119/detecting-carbon-monoxide-poisoning-detecting-carbon-2pdf-detecting-carbon.jpg)


![Survivor - BnFBurning heart. - [2] (1991) avec Survivor comme Interprète Eye of the tiger. - [1] (1991) avec Survivor comme Interprète Eye of the tiger. - [1] (1989) avec Survivor](https://static.documents.pub/doc/80x56/6104989f161c530c9d24ab42/survivor-bnf-burning-heart-2-1991-avec-survivor-comme-interprte-eye-of.jpg)


