Page 1
Faculty of Science and Engineering
WA School of Mines: Minerals, Energy and Chemical Engineering
Department of Petroleum Engineering
Gas Hydrates Investigation: Flow Assurance for Gas Production and
Effects on Hydrate-bearing Sediments
Dhifaf Jaafar Sadeq
This thesis is presented for the Degree of
Doctor of Philosophy
of
Curtin University
November 2018
Page 2
I
DECLARATION OF ACADEMIC INTEGRITY
To the best of my knowledge and belief, this thesis contains no material previously
published by any other person except where due acknowledgment has been made.
This thesis contains no material, which has been accepted for the award of any other
degree or diploma in any university.
Signature:
Date: 07/11/2018
Page 3
II
COPYRIGHT
I warrant that I have obtained, where necessary, permission from the copyright owners to
use any third-party copyright material reproduced in the thesis (e.g. questionnaires,
artwork, unpublished letters), or to use any of my own published work (e.g. journal
articles) in which the copyright is held by another party (e.g. publisher, co-author).
Signature:
Date: 07/11/2018
Page 4
III
DEDICATION
I would like to dedicate my thesis to the memory of my father, Jaafar Sadeq who
would have been proud to see me follow his way as an educated person
To my dear mother, for her encouragement, sincere wishes and her prayers
To my lovely husband Omar and my children Maryam and Jaafar who have
supported me and believed that I would do it
To my brothers and all family members for their love and support
Page 5
IV
ACKNOWLEDGMENTS
All praises and thanks to Almighty ALLAH for the strengths and blessing that give
me the power to complete my study.
I am thankful to many people at the Department of Petroleum Engineering and the
Department of Exploration Geophysics, Curtin University, for their assistance and
support of the work presented in my PhD thesis.
First, I would like to express my sincere appreciation to my supervisor, Associate
Professor Ahmed Barifcani. I am grateful for his guidance, encouragement, and
knowledge, which have given me the power to go ahead through the difficulties during
our research. He has always been ready to provide the needed advices in great depth.
I also would like to express my utmost gratitude to my co-supervisor Professor Stefan
Iglauer, for his assistance and support. His knowledge, devoted efforts and essential
comments in terms of manuscript preparation and writing have guided me to introduce
my work in the best manner.
My thanks also extend to Professor Maxim Lebedev for his assistance and contribution
in the construction of the experimental setting, valuable discussions and advice.
Finally, I would like to thank my friends and colleagues in the Petroleum Department
for their support, encouragement and advice.
My special thanks and appreciation to Iraqi Higher Education and Scientific Research
Ministry, Iraq, for providing my PhD scholarship at Curtin University and the financial
support to carry out this study.
Page 6
V
ABSTRACT
In recent years, the importance of gas hydrates has significantly increased because of
their role as the main flow assurance problem in the oil and gas industry and as a
potential energy resource. In addition, carbon dioxide capture geo-sequestration into
sediments in the form of gas hydrates has been proposed as a promising approach to
reduce anthropogenic greenhouse gas emissions. In this context, gas hydrates
formation/dissociation in bulk and porous media have been evaluated. Thus, the work
presented in this thesis constitutes three main parts, all related to gas hydrates. In the
first part, we examined the formation and dissociation of different gas mixtures
containing methane, carbon dioxide and nitrogen in bulk. Hydrate equilibrium data
were measured using a stirred cryogenic sapphire cell together with recording of the
motor current changes during the hydrate formation/dissociation process. The results
showed that the hydrate equilibrium conditions vary depending on the composition of
the mixtures. The van der Waals-Platteeuw thermodynamic theory coupled with the
Peng-Robinson equation of state and the Langmuir adsorption model were used to
correlate the hydrate equilibrium data. The calculated values were compared with the
obtained experimental results and discussed in terms of cage occupancies and the
possibility of structural transformation. A new empirical correlation for the prediction
of gas hydrate equilibrium temperatures was developed, which showed a good
agreement with the experimental measurements.
In the second part, the effects of hydrate formation on the compressional wave
velocities of sandstone were investigated experimentally. Hydrate was formed using
tetrahydrofuran (THF, as a liquid hydrate former) through CO2 injection into partially
brine-saturated sandstone. Noticeable differences were recorded due to hydrate
formation in sandstone. The behaviour and interaction of both hydrates (THF and CO2)
with the host sediments are discussed focusing on the effect of different pore space
fillings on the measured acoustic velocities.
In the last part, we imaged the distribution of CO2 hydrate in sandstone, and
investigated the hydrate morphology and cluster characteristics via X-ray micro-
computed tomography at high resolution in 3D in-situ. A substantial amount of gas
hydrate (17% saturation) was observed, and the stochastically distributed hydrate
clusters followed power-law relations in terms of their size distributions and surface
Page 7
VI
area-volume relationships. These fundamental insights will aid large-scale
implementation of industrial carbon dioxide geo-sequestration projects via the hydrate
route.
Page 8
VII
PUBLICATIONS
Journal Publications
1. Sadeq, D., Iglauer, S., Lebedev, M., Smith, C., and Barifcani, A. (2017)
“Experimental determination of hydrate phase equilibrium for different
gas mixtures containing methane, carbon dioxide and nitrogen with motor
current measurements”, Journal of Natural Gas Science and Engineering,
38, 59-73. (https://doi.org/10.1016/j.jngse.2016.12.025)
2. Sadeq, D., Iglauer, S., Lebedev, M., Rahman, T., Zhang, Y. and
Barifcani, A. (2018) “Experimental Pore-scale Analysis of Carbon
Dioxide Hydrate in Sandstone via X-Ray Micro-Computed
Tomography”, International Journal of Greenhouse Gas Control, 79, 73-
82. (https://doi.org/10.1016/j.ijggc.2018.10.006)
3. Sadeq, D., Alef, K., Iglauer, S., Lebedev, M. and Barifcani, A. (2018)
“Compressional Wave Velocity of Hydrate-Bearing Bentheimer Sediments with
Varying Pore Fillings”, International Journal of Hydrogen Energy, 43(52), 23193-
23200. (doi.org/10.1016/j.ijhydene.2018.10.169)
Conferences Publications
1. Sadeq, D., Iglauer, S., Lebedev, M., Smith, C., and Barifcani, A. (2017) “Hydrate
Equilibrium Model and Cage Occupancies for N2 + CH4 and N2 + CO2 Gas
Mixtures”, One Curtin International Postgraduate Conference, At Miri, Sarawak,
Malaysia, 10-12 December.
2. Sadeq, D., Iglauer, S., Lebedev, M. and Barifcani, A. (2018) “Prediction of Hydrate
Phase Equilibrium Conditions for Different Gas Mixtures”, Offshore Technology
Conference Asia held in Kuala Lumpur, Malaysia, 20-23 March 2018.
Page 9
VIII
NOMENCLATURE
N2 Nitrogen gas
CH4 Methane gas
CO2 Carbon dioxide gas
THF Tetrahydrofuran
Q1 Lower quadruple point
Q2 Upper quadruple point
LNG Liquefied natural gas
HFZ Hydrate formation zone
GHSZ Gas hydrate stability zone
Ro Resistivity of the water saturation sediments
Rt Resistivity of hydrate-bearing sediments
NMR Nuclear Magnetic Resonance
MRI Magnetic resonance imaging
μCT Micro-computed tomography
NaCl Sodium chloride
NaI Sodium iodine
DI Deionized
MEG Mono-ethylene glycol
Vp Compressional wave velocity
Page 10
IX
Vs Shear velocity
ρ Density
K Bulk modulus
P Pressure (or equilibrium pressure)
T Temperature (or equilibrium temperature)
n Number of moles or number of data points
m Mass
Mi Molecular weight
V Vapour or volume
I Ice
µ Chemical potential or shear modulus
C Langmuir adsorption constant
f Fugacity
θ The fractional occupancy of each hydrate former
k Boltzmann constant
r Distance between the guest molecule and the centre of the cavity
R Radius of cavities
a Kihara Potential Parameter or Klein-Nishina coefficient
σ Kihara Potential Parameter
e Kihara Potential Parameter
Page 11
X
A, B Salufu correlation constants
a1 to a5 Coefficient values of the new correlation
Sg Gas specific gravity
R2 Squared correlation coefficient
AAPE Average absolute percentage error
AAD Average absolute deviation
SD Standard deviation
RMS Root mean square errors
μx X-ray mass attenuation coefficient
b Bulk density
Z effective atomic number
E Energy beam
Superscripts
H Hydrate
L Liquid
W Water
HC Liquid hydrocarbon
β Hypothetical empty hydrate lattice
i Gas component
Page 12
XI
j Cavity type
s Small cavities
l Large cavities
exp Experimental data
cal Calculated data
μx X-ray mass attenuation coefficient
Page 13
XII
TABLE OF CONTENTS
Introduction ............................................................................................. 1
Thesis Scope and Objectives .................................................................. 3
Structure of the Thesis ............................................................................ 4
Historical Background of Gas Hydrates ................................................. 7
Gas Hydrate Structures and Properties ................................................. 13
Thermodynamics of Hydrate Formation and Equilibrium ................... 19
Formation and Dissociation of Gas Hydrates ....................................... 20
2.4.1 Gas Hydrates Formation ....................................................................... 21
2.4.2 Dissociation of Gas Hydrates................................................................ 23
Application of Gas Hydrates (Importance of Gas Hydrates) ................ 25
2.5.1 Flow Assurance ..................................................................................... 25
2.5.2 Gas Storage and Transportation ............................................................ 26
2.5.3 Gas Hydrate as a Potential Energy Resource ........................................ 27
Page 14
XIII
2.5.4 Gas Hydrates as an Environmental Hazard and Factor in Climate Change
30
Gas Hydrate Occurrence in Nature ....................................................... 33
Hydrates in Sediments .......................................................................... 36
2.7.1 Naturally Occurring Gas Hydrate in Porous Medium (Reservoir System)
36
2.7.1.1 Gas Hydrate Stability Zone ............................................................................. 37
2.7.1.2 Gas Sources Availability ................................................................................. 38
2.7.1.3 Migration Pathways ........................................................................................ 40
2.7.1.4 High-quality Host Sediments .......................................................................... 40
2.7.1.5 Hydrate Growth in Sediments ......................................................................... 41
2.7.2 Gas Hydrate Morphology and Distribution in Sediments .................... 42
2.7.3 Physical Properties of Hydrate-bearing Sediments .............................. 45
2.7.4 Visual Observation of Hydrates in Sediments ...................................... 48
2.7.5 Laboratory Techniques for Hydrate Formation in Sediments .............. 52
2.7.5.1 Hydrate Formation by Dissolved Gas ............................................................. 52
2.7.5.2 Hydrate Formation by the Partial Saturation Method ..................................... 53
2.7.5.3 Hydrate Formation by Excess Water Method ................................................. 54
2.7.5.4 Hydrate Formation from Soluble Hydrate Former (Tetrahydrofuran) ............ 54
PVT Cryogenic Sapphire Cell for the Determination of Equilibrium
Conditions of CH4+CO2, CH4+N2 and CO2+N2 Hydrates .................... 56
3.1.1 PVT Cryogenic Sapphire Cell System .................................................. 56
3.1.2 Materials and Gas Mixtures Preparation .............................................. 59
3.1.3 Set-up and Experimental Procedure...................................................... 60
Ultrasonic Measurement System for the Determination of Compressional
Wave Velocities of Hydrate-bearing Sediments ................................... 62
3.2.1 Materials and Sample Preparation ........................................................ 65
Page 15
XIV
3.2.2 Experimental Procedure ........................................................................ 66
X-Ray Micro Computed-CO2 Hydrate Formation System for Analysing
Pore-scale of Hydrate in Sandstone ...................................................... 67
3.3.1 Materials and Sample Preparation ........................................................ 68
3.3.2 Experimental Procedure ........................................................................ 69
Summary ............................................................................................... 71
Introduction ........................................................................................... 71
Experimental Methodology .................................................................. 75
4.3.1 Materials and Gas Preparation .............................................................. 75
4.3.2 Experimental Apparatus and Procedure ............................................... 75
Results and Discussion ......................................................................... 78
4.4.1 Gas Hydrate Equilibrium Conditions ................................................... 78
4.4.2 Current as an Indication of Hydrate Plug and Dissociation .................. 86
Conclusions ........................................................................................... 93
Summary ............................................................................................... 94
Introduction ........................................................................................... 95
Methodology ......................................................................................... 96
5.3.1 Theoretical Model Prediction ............................................................... 96
5.3.2 Empirical Correlation Prediction .......................................................... 99
Results and Discussion ....................................................................... 103
5.4.1 Theoretical Model Prediction ............................................................. 103
5.4.2 Empirical model prediction ................................................................ 111
Conclusions ......................................................................................... 117
Page 16
XV
Summary ............................................................................................. 118
Introduction ......................................................................................... 118
Experimental Methodology ................................................................ 120
6.3.1 Materials and Experimental Set-up ..................................................... 120
6.3.2 Experimental Procedure ...................................................................... 122
Results and Discussion ....................................................................... 122
6.4.1 Visualisation and Morphology of CO2 Hydrate.................................. 122
6.4.2 Hydrate Saturation in the Core Sample .............................................. 127
6.4.3 Gas Hydrate Statistics - Cluster Size Distributions and Surface Area-
Volume Relationships ......................................................................... 128
Conclusions ......................................................................................... 133
Summary ............................................................................................. 134
Introduction ......................................................................................... 134
Methodology ....................................................................................... 137
7.3.1 Experimental Setup ............................................................................. 137
7.3.2 Materials ............................................................................................. 138
7.3.3 Experimental Procedure ...................................................................... 139
Results and Discussions ...................................................................... 142
7.4.1 THF Hydrate Formation in Sandstone ................................................ 142
7.4.2 CO2 hydrate formation in sandstone ................................................... 151
Conclusions ......................................................................................... 153
Conclusions ......................................................................................... 155
Page 17
XVI
8.1.1 Experimental Determination of Hydrate Phase Equilibrium for Different
Gas Mixtures Containing Methane, Carbon Dioxide and Nitrogen with
Motor Current Measurements ............................................................. 155
8.1.2 Thermodynamic Modelling and Empirical Correlation for the Prediction
of Gas Hydrate Equilibrium Conditions ............................................. 156
8.1.3 Experimental Pore-scale Analysis of Carbon Dioxide Hydrate in
Sandstone via X-Ray Micro-Computed Tomography ........................ 157
8.1.4 Ultrasonic Measurements of Hydrate-bearing Sandstone .................. 158
Potential Future Research Work ......................................................... 159
Page 18
XVII
LIST OF FIGURES
Figure 1-1 Gas hydrate-related publications over the past 20 years (Library catalogue
database, Curtin University) ........................................................................ 1
Figure 1-2 Relative volumes of hydrocarbon resources (Dong et al. 2012) ................ 2
Figure 1-3 Structural framework of thesis ................................................................... 6
Figure 2-1 Ice-like appearance of methane hydrate; after (Giavarini and Hester 2011)
..................................................................................................................... 8
Figure 2-2 A stabilising gas molecule (yellow ball) enclosed by a framework of water
molecules ................................................................................................... 13
Figure 2-3 Various types of natural gas hydrate cages (adapted from Koh and Sloan
2007) .......................................................................................................... 14
Figure 2-4 Flame of gas hydrate (methane) (Suess et al. 1999)................................. 15
Figure 2-5 Three common types of hydrate network unit structures. The term 51262
characterises a water cage consisting of twelve pentagonal and two
hexagonal faces. The arrows characterise the number of unit cells of the
various cavities. Figure modified from Koh and Sloan (2007) ................. 17
Figure 2-6 Phase diagram for methane-water (our work) .......................................... 20
Figure 2-7 Typical hydrate formation stages ............................................................. 21
Figure 2-8 Labile cluster nucleation model (adapted from Sloan and Koh 2008) ..... 22
Figure 2-9 Adsorption of gas molecules onto hydrate cavities based on the local
structuring nucleation mechanism Long (1994) ........................................ 23
Figure 2-10 Pressure-temperature phase diagram for various natural component gases
that form hydrates (adapted by Sloan and Koh 2008 from a figure developed
by Katz 1959). H refers to hydrate; V for vapour; I for ice; LHC for liquid
hydrocarbon and LW for water. Q1 and Q2 are lower and upper quadruple
points ......................................................................................................... 24
Figure 2-11 Natural gas hydrate plug in a transmission pipeline (Zarinabadi and
Samimi 2012) ............................................................................................ 25
Figure 2-12 Scheme explaining the three main techniques (thermal injection,
depressurisation and inhibitor injection) for gas production from hydrate
deposits (Collett 2002)............................................................................... 29
Page 19
XVIII
Figure 2-13 Scheme illustrating the effects of changes in temperature and pressure on
gas hydrate deposits and the subsequent gas release with seafloor failures
(adapted from Kvenvolden 1998) .............................................................. 32
Figure 2-14 Locations of natural gas hydrate deposits worldwide (Paull et al. 2010)
................................................................................................................... 34
Figure 2-15 Depth-temperature stability zone for gas hydrates (a) in permafrost
environment and (b) in deep oceanic (marine continental slops) adapted
after (Kvenvolden 1988) ............................................................................ 35
Figure 2-16 Pressure-temperature equilibrium conditions and water depth recorded for
collected hydrate samples (Sloan and Koh 2008) ..................................... 38
Figure 2-17 Steps of hydrate growth in sediments (modified from Jung and
Santamarina 2012) ..................................................................................... 42
Figure 2-18 Examples of gas hydrates found in the natural environment: (a) bulk; (b)
nodules; (c) layered and laminae (Worthington 2010) .............................. 43
Figure 2-19 The four morphological modes of hydrates in sediments (adapted from
Dangayach et al. 2015) .............................................................................. 44
Figure 2-20 Morphological patterns of gas hydrates (white) in sediment (grey)
saturated with pore fluid (blue); (a) pore filling, (b) load-bearing, (c)
cementing and (d) grain coating ................................................................ 45
Figure 2-21 Scheme illustrating (a) Tetrahydrofuran molecule and (b) Tetrahydrofuran
hydrate. Green is carbon atoms, white is hydrogen atoms, and red is oxygen
atoms (Conrad 2009) ................................................................................. 55
Figure 3-1 PVT Cryogenic Sapphire Cell Apparatus ................................................ 58
Figure 3-2 Cylindrical Sapphire Cell ......................................................................... 59
Figure 3-3 High-pressure cell (core holder) used in ultrasonic measurements for
determining the compressional velocities of hydrate-bearing sediments .. 63
Figure 3-4 Photograph showing (a) high-pressure cell and (b) a sandstone sample
placed in the middle of the high-pressure core holder............................... 64
Figure 3-5 Photograph showing the experimental set-up for the determination of
compressional wave velocities of hydrate-bearing sediments: (a) vacuum
pump; (b) high-pressure cell; (c) hand oil pump; (d) HPLC injection pump;
(e) oscilloscope and (f) pulser/receiver ..................................................... 65
Page 20
XIX
Figure 3-6 Bernheimer sandstone core samples used for compressional velocities
experiments ................................................................................................ 66
Figure 3-7 High-pressure cell for CO2 hydrate formation in small plugs and CT
imaging ...................................................................................................... 68
Figure 3-8 Photograph of the small cylindrical Bentheimer plug using CT imaging
experiment ................................................................................................. 69
Figure 4-1 Schematic of the PVT Sapphire Cell ........................................................ 77
Figure 4-2 Comparison of CH4 hydrate dissociation points (black squares:
experimental data; open symbols: literature data (Jhaveri and Robinson
1965, Adisasmito et al. 1991, Nakamura et al. 2003, Mohammadi et al.
2005, Sabil et al. 2014))............................................................................. 79
Figure 4-3 Comparison of 80 mol% methane and 20 mol% carbon dioxide hydrate
dissociation points (black squares: experimental data; open symbols:
literature data (Dholabhai and Bishnoi 1994, Servio et al. 1999, Seo et al.
2001, Lu and Sultan 2008, Beltrán and Servio 2008a)) ............................ 80
Figure 4-4 CH4 hydrate equilibrium curves. Closed symbols represent our
experimental data and open symbols represent the literature data: Pure
carbon dioxide reported by Ohgaki et al. (1993), 8% carbon dioxide reported
by Adisasmito et al. (1991) and 96.54% carbon dioxide reported by Fan and
Guo (1999). Numbers indicate gas mole in the mixture ............................ 81
Figure 4-5 N2-CH4 hydrate equilibrium curves. Closed symbols represent
experimental data and open symbols represent literature data: pure nitrogen
reported by Van Cleeff and Diepen (1960), 10.7% nitrogen reported by Mei
et al. (1996), 59.61% nitrogen reported by Lee et al. (2006) and 68.77%
nitrogen reported by Lee et al. (2006). Numbers indicate gas mole in the
mixture ....................................................................................................... 82
Figure 4-6 CO2-N2 hydrate equilibrium curves. Closed symbols represent
experimental data and open symbols represent the literature data: pure
nitrogen reported by Van Cleeff and Diepen (1960), pure carbon dioxide
reported by Ohgaki et al. (1993), 88.41% nitrogen reported by Kang et al.
(2001), 82.39% nitrogen reported by Kang et al. (2001) and 22.2% nitrogen
Page 21
XX
reported by Kang et al. (2001). Numbers indicate gas mole in the mixture
................................................................................................................... 83
Figure 4-7 Experimental CO2-CH4 hydrate equilibrium data in ln Pressure versus
1/Temperature plot. Numbers indicate gas mole percentages in the mixture
used in this study ....................................................................................... 84
Figure 4-8 Experimental N2-CH4 hydrate equilibrium data in ln Pressure versus
1/Temperature. Numbers indicate gas mole percentages in the mixture used
in this study ................................................................................................ 85
Figure 4-9 Experimental CO2-N2 hydrate equilibrium data in ln Pressure versus
1/Temperature. Numbers indicate gas mole percentages in the mixture used
in this study ................................................................................................ 86
Figure 4-10 Motor current and temperature vs time during hydrate
formation/dissociation process for pure CH4 at a pressure of 10 MPa ...... 87
Figure 4-11 Motor current and temperature vs time during hydrate
formation/dissociation process for a 10% CO2 + 90% CH4 gas mixture at a
pressure of 10 MPa .................................................................................... 88
Figure 4-12 Motor current and temperature vs time during hydrate
formation/dissociation process for a 16% CO2 + 84% CH4 gas mixture at a
pressure of 10 MPa .................................................................................... 89
Figure 4-13 Motor current and temperature vs time during hydrate
formation/dissociation process for a 80% CH4 + 20% CO2 gas mixture at a
pressure of 10 MPa .................................................................................... 90
Figure 4-14 Images captured during the experiments ................................................ 92
Figure 5-1 Comparison of experimental methane – carbon dioxide hydrate dissociation
points with model data. Numbers indicate CO2 mole percentage in the
mixture. Average relative deviations between the experimental data and the
model results are 0.21%, 0.18% and 0.13% for the 10% CO2 + 90% CH4,
16% CO2 + 84% CH4 and 20% CO2 + 80% CH4 gas mixtures, respectively.
................................................................................................................. 109
Figure 5-2 Comparison of experimental N2 + CH4 hydrates with model predictions.
Numbers indicate N2 mole percentage in the mixture. Average relative
deviations between the experimental data and the model results are 0.087%,
Page 22
XXI
0.054%, 0.15% and 0.12% for the 10% N2 + 90% CH4, 20% N2 + 80% CH4,
31% N2 + 69% CH4 and 36% N2 + 64% CH4 gas mixtures, respectively.
................................................................................................................. 110
Figure 5-3 Comparison of experimental N2 + CO2 hydrates with model predictions.
Numbers indicate N2 mole percentage in the mixture. Average relative
deviations between the experimental data and the model results are 0.07%
and 0.58% for the 36% CO2 + 64% N2 and 26% CO2 + 74% N2, respectively.
................................................................................................................. 111
Figure 5-4 Comparison of the new correlation results with the experimental data for
gas mixtures with specific gravities (Sg) of 0.553, 0.746, 0.7701, 0.7845,
0.95 and 1 ................................................................................................ 115
Figure 5-5 Cross plots of the experimental and predicted equilibrium temperatures
calculated by the new correlation (a), Hammerschmidt (b), Motiee (c) and
Salufu (d) correlations ............................................................................. 116
Figure 6-1 Experimental apparatus used for forming CO2 hydrate in a Bentheimer
sandstone plug (at 3 MPa and 274 K)...................................................... 121
Figure 6-2 Raw (top) and segmented (bottom) 2D slices through the CO2 hydrate-
bearing core. In the raw images, CO2 is black while hydrate is dark grey,
brine is slightly lighter grey, and sandstone is light grey. In the segmented
images, grain particles are dark grey, hydrates are white, brine is blue, and
CO2 gas is yellow .................................................................................... 123
Figure 6-3 Raw (a,d), filtered (b,e) and segmented (c,f) 2D slices through the hydrate-
bearing core (a-c) and the core after hydrate dissociation (d-f). In the
segmented images, grain particles are dark grey, hydrates clusters are white,
brine is blue, and CO2 gas is yellow ........................................................ 124
Figure 6-4 Three-dimensional segmented images showing each phase. The left-hand
side shows the phases for the hydrate-bearing sample (3 MPa, 274K), while
the right side shows the phases after hydrate dissociation (3 MPa, 294K).
Blue is brine, yellow is CO2 gas and grey is CO2-hydrate....................... 125
Figure 6-5 CO2 hydrate and CO2 gas clusters size distributions in Bentheimer
sandstone before and after hydrate dissociation ...................................... 130
Page 23
XXII
Figure 6-6 Hydrate clusters, (a) the largest hydrate clusters (size 204080–206590 µm3),
(b) medium hydrate clusters (size 5227–7456 µm3) and (c) small hydrate
clusters (size 40.5–121 µm3) ................................................................... 131
Figure 6-7 Surface area-volume relationships for (a) CO2 hydrate, (b) CO2 gas clusters
before hydrate dissociation and (c) CO2 gas clusters after hydrate
dissociation in the Bentheimer sample .................................................... 132
Figure 7-1 Experimental set-up for hydrate formation in sediments and P-wave
velocity measurements ............................................................................ 138
Figure 7-2 Dead time (td) as a function of temperature and confining pressure ...... 142
Figure 7-3 Typical P-waveforms recorded for different pore fillings of Bentheimer
samples .................................................................................................... 143
Figure 7-4 Compressional wave velocity in dry Bentheimer sample as a function of
confining pressure compared to the literature (Tao et al. 1995, Mayr and
Burkhardt 2006). The lines are fitted logarithmic trend-lines. ................ 144
Figure 7-5 Compressional wave velocity as a function of confining pressure for
different pore fillings in sample B1 ......................................................... 146
Figure 7-6 Compressional wave velocity as a function of confining pressure for
different pore fillings in sample B2 ......................................................... 147
Figure 7-7 Evolution of compressional wave velocity during THF hydrate formation
at confining pressure of 14 MPa in sample B2 ........................................ 150
Figure 7-8 P-wave velocities measured through sample B3 before and after CO2
hydrate formation as a function of confining pressure (pore pressure = 3
MPa) ........................................................................................................ 152
Figure 7-9 Evolution of P-wave velocity during CO2 hydrate formation in sample B3
as a function of (a) temperature and (b) time at 8 MPa confining pressure
................................................................................................................. 153
Page 24
XXIII
LIST OF TABLES
Table 2-1 The progress and development of gas hydrates research since 1778 .......... 9
Table 2-2 Description of each hydrate structure (number of cavities, crystal structure
and hydrate formers (adapted from Sloan (2003)) .................................... 16
Table 2-3 The most common guest molecules found in gas hydrates (Sloan and Fleyfel
1991) .......................................................................................................... 18
Table 2-4 Similarities and differences between gas hydrate deposits and the
conventional hydrocarbon system (Max et al. 2013) ................................ 36
Table 2-5 Seismic and electrical properties of materials that are generally considered
in natural gas hydrate reservoirs ................................................................ 48
Table 2-6 Examples of research studies observing the hydrate microstructure in
sediments via the X-ray technique ............................................................. 50
Table 4-1 Review of the Gas Hydrate Equilibrium for CH4+CO2, CH4+N2, and
CO2+N2 and Water Systems ...................................................................... 74
Table 4-2 Gas mixtures used in the present study...................................................... 75
Table 4-3 Measured hydrate dissociation data of CO2 + CH4 gas mixture in water 202
Table 4-4 Measured hydrate dissociation data of N2 + CH4 gas mixture in water ... 203
Table 4-5 Measured hydrate dissociation data of N2 + CO2 gas mixture in water ... 203
Table 5-1 Kihara potential parameters ....................................................................... 98
Table 5-2 Coefficient values of the new correlation, Equation 5-11 ....................... 101
Table 5-3 Experimental data collected from the literature used to construct the new
correlation ................................................................................................ 102
Table 5-4 Cage occupancy calculations for CO2 + CH4 mixtures in small and large
cavities ..................................................................................................... 106
Table 5-5 Cage occupancy calculations for N2 + CH4 mixtures in small and large
cavities ..................................................................................................... 107
Table 5-6 Cage occupancy calculations for N2 + CO2 mixtures in small and large
cavities ..................................................................................................... 108
Table 5-7 Statistical analysis parameters for the new correlation compared with other
correlations .............................................................................................. 114
Page 25
XXIV
Table 6-1 Brine, CO2, and hydrate saturations and statistical parameters in the hydrate-
bearing sandstone before and after hydrate dissociation ......................... 128
Table 7-1. Materials used in the study ..................................................................... 139
Table 7-2 Properties of the Bentheimer sandstone samples used in the study......... 139
Table 7-3 Experimentally measured compressional velocities for different pore fillings
in Bentheimer samples as a function of confining pressure .................... 148
Table 7-4 P-wave velocities before and after CO2 hydrate formation in sample B3152
Page 26
1
Introduction
Introduction
Natural gas hydrates in the petroleum and gas industry often have negative
connotations as they are most commonly encountered in their bulk form as a flow
assurance problem. Gas hydrate formation is responsible for obstructing flow lines and
gas production equipment which poses catastrophic economic and safety risks. The oil
and gas industry spends millions of dollars each day on inhibiting and preventing
unwanted gas hydrates (Max et al. 2005). Once hydrate blockage has occurred, safe
dissociation could take weeks or even months with complicated operations required to
remove the blockage (Kelkar et al. 1998).
Extensive research projects have been performed for better mitigating the
complications caused by hydrate formation. Figure 1-1 shows the growing number of
gas hydrate-related publications over the past 20 years and demonstrates the increasing
interest in gas hydrate research.
Figure 1-1 Gas hydrate-related publications over the past 20 years (Library
catalogue database, Curtin University)
0
200
400
600
800
1000
1200
1997 2002 2007 2012 2017
Num
ber
of
publi
cati
ons
Year
Page 27
2
Attention is now growing towards the potentially huge energy resource stored in the
naturally occurring hydrate deposits. Because of their ability to concentrate and store
gases, the estimated reserves of methane stored in natural gas hydrate deposits are vast
and huge (Kvenvolden 1988), which exceeds the entire combined world reserves of
oil, natural gas and coal (Makogon et al. 2007, Moridis 2008), as shown comparatively
in the resource triangle in Figure 1-2. Simultaneously, the demand for energy sources
(e.g. for natural gas) is increasing (Dudley 2013, Al-Fatlawi et al. 2017) especially in
countries who are heavily dependent on energy imports due to the lack of their own
natural resources, such as China, Japan, and India (Takeishi 2014). Therefore, the oil
and gas industry is now looking towards commercial production of gas from hydrate-
bearing sediments, and preferably to combine this process with the sequestration of
carbon dioxide. The importance of hydrate as a prospective source of energy has been
estimated by identifying the distribution and concentration of hydrates in their host
sediments (Priest et al. 2009). The occurrence of gas hydrates can be detected using
seismic surveys and well-logging data (Jones et al. 2008), which must to be calibrated
using laboratory acoustic velocity measurements.
Figure 1-2 Relative volumes of hydrocarbon resources (Dong et al. 2012)
Page 28
3
Gas hydrate formation in porous media is of essential importance for understanding
the properties of the hydrate-bearing sediments and for its potential role in seafloor
stability, drilling hazard, and mitigating climate changes by decreasing CO2 emissions.
Because of the metastable behaviour of natural gas hydrates, the description of their
in-situ occurrence via the retrieved real samples has been a challenge. Maintaining the
actual equilibrium temperature and pressure is not feasible due to the possibility of
hydrate dissociation during core sample recovery. Thus, gas hydrate occurrence and
distribution in sedimentary matrices is still not sufficiently explained, and thus their
microstructures and morphology remain unclear.
Thesis Scope and Objectives
Research relating to gas hydrates in bulk and sediments is of the utmost importance to
the energy industry. Gas hydrates have been identified as a flow assurance problem
that threaten natural gas production facilities and transport pipelines causing high
economic losses and safety risks. Therefore, an accurate measurement and estimation
of gas hydrate equilibrium conditions for different gas mixtures is of significant
importance to avoid these transport complications. In contrast, gas hydrate has been
proposed as a promising energy source (Chong et al. 2015). Thus, the increasing
demand for energy resources (e.g. for natural gas) encourages the research on the
production of natural gas (the main gas here is methane) from hydrate deposits.
Simultaneously, CO2 emissions into the atmosphere have increased significantly
(Pachauri et al. 2014), which has led to increasing global temperatures (global
warming) and thus climate change (Houghton et al., 2001). Thus, decreasing the level
of CO2 emissions is essential for mitigating climate change. One solution suggested
for achieving this is to capture and sequester CO2 in the form of gas hydrates (Orr,
2009; White et al., 2003; Yamasaki, 2003). This process may be combined with
methane production via CO2-CH4 replacement in methane hydrate-bearing sediments
(Ohgaki et al. 1994, Graue et al. 2008). In addition, hydrate morphology, distribution
and saturation in a porous medium significantly affect seismic velocities
(compressional and shear velocities) and other petro-physical properties (Waite et al.
2009).
Page 29
4
Consequently, the pore-scale characterisation of hydrates in their host sediments and
knowledge of their physical properties are vitally essential for exploration, monitoring,
implementation of hydrate-carbon dioxide geo-sequestration (CGS) and hydrate
exploitation as an energy source. However, experimental data for hydrate formation
and existence in bulk and sediments is limited despite their vital importance (Tohidi et
al. 2010, Ta et al. 2015).
The main aim of this research study was to establish a good fundamental understanding
of gas hydrate formation/dissociation, quantification and detection in bulk and porous
media. The following points describe the specific objectives of this research:
1. Obtaining new experimental data of gas hydrate formation from various gas
mixtures and investigating the effect of each gas composition on gas hydrate
equilibrium conditions.
2. Developing a thermodynamic model and empirical correlation for the prediction of
gas hydrate equilibrium conditions.
3. Investigating the distribution and morphology of gas hydrate in sandstone samples
via X-ray micro-computed tomography in 3D in-situ and analysing the
corresponding hydrate microstructures.
4. Studying the effect of pore volume and hydrate saturation on the acoustic velocity
of the hydrate-bearing sediments.
Structure of the Thesis
The structure of the presented thesis comprises eight chapters, including the
introduction, an extensive literature review, results and discussion (experimental and
computational studies), conclusions and recommendations. The structural framework
of the thesis is presented in Figure 1-3.
Chapter 1 – Introduction provides a summarised introduction of the background and
general issues encountered with solutions regarding gas hydrate formation in bulk and
sediments. This chapter also includes the research scope, objectives and thesis
structure.
Chapter 2 – Literature Review presents a comprehensive review and basic knowledge
of the various aspects of gas hydrates including the historical background, structure
Page 30
5
and thermodynamics of hydrate formation, gas hydrate applications, natural
occurrence of hydrate and hydrate in sediments.
Chapter 3 – Experimental Methods outlines the experimental systems, procedures and
materials used to achieve the aims and objectives of the study.
Chapter 4 – Experimental Determination of Hydrate Phase Equilibrium for Different
Gas Mixtures Containing Methane, Carbon Dioxide and Nitrogen with Motor Current
Measurements. Journal of Natural Gas Science and Engineering, 38, 59-73 measures
gas hydrate equilibrium conditions for different gas mixtures using PVT cryogenic
sapphire cell and assesses the motor current as a criterion for gas hydrate formation
and dissociation.
Chapter 5 – Thermodynamic Modelling and Empirical Correlation for the Prediction
of Gas Hydrate Equilibrium Conditions. OCPC-RE0023-2017 and OTC-28478-MS
develops a thermodynamic model and empirical correlation for the prediction of gas
hydrate equilibrium conditions.
Chapter 6 – Experimental Pore-scale Analysis of Carbon Dioxide Hydrate in
Sandstone via X-Ray Micro-Computed Tomography. International Journal of
Greenhouse Control, 79, 73-82 shows imaged CO2 hydrate distribution in sandstone,
and investigates the hydrate morphology and cluster characteristics via X-ray micro-
computed tomography in 3D in-situ.
Chapter 7 – Ultrasonic Measurements of Hydrate-bearing Sandstone. Accepted in the
International Journal of Hydrogen Energy measures the compressional wave velocity
(P-wave velocity) of consolidated sediments (sandstone) with and without tetrahydrofuran
and carbon dioxide hydrate-bearing pore fillings using the pulse transmission method.
Chapter 8 – Conclusions and Recommendations presents complete conclusions with
significant results from this thesis and provides recommendations for potential future
work.
Page 31
6
Chapter 1
Introduction
Chapter 2
Literature review
Chapter 3
Experimental
Methods
Chapter 4
Experimental
Determination of
Hydrate Phase
Equilibrium for
Different Gas
Mixtures Containing
Methane, Carbon
Dioxide and Nitrogen
with Motor Current
Measurements
Chapter 5
Thermodynamic
modelling and
Empirical correlation
for prediction gas
hydrate equilibrium
conditions
Chapter 6
Experimental Pore-
scale Analysis of
Carbon Dioxide
Hydrate in Sandstone
via X-Ray Micro-
Computed
Tomography
Chapter 7
Ultrasonic
measurements of
hydrate-bearing
sandstone
Thesis Outline
Gas hydrates investigation: Flow assurance for gas production and effects on hydrate-bearing sediments
1.1 Introduction
1.2 Thesis Objectives and Scope
1.3 Structure of the Thesis
2.1 Historical Background of Gas Hydrate 2.2 Gas Hydrate Structures and Properties
2.3 Thermodynamics of Hydrate Formation and Equilibrium
2.4 Gas Hydrates Formation and Dissociation
2.5 Application of Gas Hydrates (Importance of Gas Hydrates) 2.6 Gas Hydrate Occurrence in
Nature
2.7 Hydrates in Sediments
3.1 PVT Cryogenic Sapphire Cell for Determination Equilibrium Conditions of
CH4+CO2, CH4+N2, CO2+N2 Hydrates
3.2 Ultrasonic Measurement System for Determination Compressional Wave Velocities
of Hydrate-bearing Sediments
3.3 X-Ray Micro Computed- CO2 Hydrate formation system for analysing pore-scale of
Hydrate in Sandstone
4.1 Chapter Summary 4.2 Introduction
4.3 Experimental methodology: 4.3.1 Materials and gas preparation
4.3.2 Experimental apparatus and procedure
4.4 Results and discussion: 4.4.1 Gas hydrate equilibrium conditions
4.4.2 Current as an indication of hydrate plug and dissociation
5.1 Chapter Summary 5.2 Introduction
5.3 Methodology: 5.3.1 Theoretical model prediction
5.3.2 Empirical correlation Prediction
5.4 Results and discussion: 5.4.1 Theoretical model prediction
5.4.2 Empirical correlation Prediction
6.1 Chapter Summary 6.2 Introduction
6.3 Experimental methodology: 6.3.1 Materials and Experimental Set-up 6.3.2 Experimental
Procedure
6.4 Results and discussion: 6.4.1 Visualization and Morphology of CO2 Hydrate 6.4.2 Hydrate
Saturation in the Core Sample 6.4.3 Gas Hydrate Statistics - Cluster Size Distributions and
Surface Area-Volume Relationships
7.1 Chapter Summary 7.2 Introduction 7.3 Experimental methodology
7.4 Results and discussion: 7.4.1 THF hydrate in sandstone 7.4.2 CO2 hydrate in sandstone
Chapter 8
Conclusions and Recommendations
8.1 Conclusions
8.2 Recommendations
4.5
Conclusion
5.5
Conclusion
6.5
Conclusion
7.5
Conclusion
Figure 1-3 Structural framework of thesis
Page 32
7
Literature Review
This chapter presents the basic knowledge related to gas hydrates concentrating on the
aspects related to this research work. A brief historical background involving hydrate
discovery and the important steps in the development of gas hydrates research are
presented in section 2.1. The description of different hydrate structures and some
properties of gas hydrate are summarized in section 2.2. Thermodynamics of hydrate
formation and dissociation are presented in section 2.3. The gas hydrates importance
and applications are discussed in section 2.5. The natural occurrence of hydrates in
sediments are discussed regarding the gas hydrates morphology, their effects on the
physical properties of gas hydrate deposits and the visual observation of hydrates in
their host sediments are presented in sections 2.6 and 2.7.
Historical Background of Gas Hydrates
Gas hydrates (clathrate hydrates) are solid ice-like, non-stoichiometry crystalline
structures that exist naturally in the presence of water and certain guest (gas or liquid)
molecules such as methane, carbon dioxide, nitrogen, ethane, propane or butane for
gases (Sloan and Koh 2008), and ethylene oxide and tetrahydrofuran (THF) for liquids
(Koh 2002). Gas hydrates are typically formed and are stable under elevated pressure
conditions at temperatures above the freezing point of water and up to 25 °C if hydrate
former molecules (i.e. gas or liquid) and sufficient amounts of water are available
(Sloan and Koh 2008). The water molecules are known as “cage” whereas the hydrate
former molecules are called “guest”. Figure 2-1 shows the ice-like appearance of
methane hydrate.
Page 33
8
Figure 2-1 Ice-like appearance of methane hydrate; after (Giavarini and Hester
2011)
Historically, the first observation of gas hydrates was made by Joseph Priestley in
1778 while he was bubbling sulfur dioxide (SO2) through water at low room
temperature and atmospheric pressure (Koh 2002). This discovery was the first
identification of gas hydrates; however, it was not officially documented until 1810
when Sir Humphrey Davy noticed a similar crystal structure, now called gas hydrates
while he was working with chlorine mixtures (Faraday and Davy 1823). The
hydrocarbon hydrates were proven in 1888 by Villard (1896) who discovered several
hydrocarbon gases that formed hydrates such as methane, ethane and propane. By the
end of the century, many researchers had studied gas hydrates particularly in terms of
their discovery and observation of hydrates of various gases (Roozeboom 1885,
Villard 1888, Pickering 1893, Villard 1896). The industrial importance of gas hydrates
was established in 1934 due to the discovery that the formation of hydrates was
responsible for plugging gas-transmission pipelines (Hammerschmidt 1934).
Since then, a considerable amount of research has been focused on studying the
formation conditions, composition, kinetics and structures of gas hydrates to inhibit
and prevent the blockage of pipelines. Extensive efforts in this area have demonstrated
how to manage flow assurance issues and to consider the initial applications of gas
hydrate inhibitors. The next era of the history of gas hydrate studies begun in the 1960s
when the first occurrence of natural gas hydrates was discovered in Siberia (Makogon
Page 34
9
1997). Since then, gas hydrates have been highlighted as a potential energy resource
and prospective fuel reserves. This important discovery pushed researchers towards
studying the formation and dissociation kinetics in their natural environments and
interactions with their host sediments to investigate the possibility of the safe
production of gas hydrate. Later, it was found that gas hydrate formation required
specific thermodynamic conditions (i.e. high pressure and low temperature) that
widely exist in many regions worldwide such as in oceanic sediments and permafrost
area (Kvenvolden 1998, Kvenvolden and Rogers 2005). Recently, extensive research
on gas hydrates has been conducted to investigate the potential production of natural
gas hydrates. Many countries such as Japan, Canada, the United States and India have
started to fund programs for commercial gas production from gas hydrate-bearing
sediments (Lu 2015). The progress and development stages of research on gas hydrates
are outlined in Table 2-1.
Table 2-1 The progress and development of gas hydrates research since 1778
Year Source Achievements
1778 Priestly (1778) Discovery of SO2 hydrate
1810 Davy (1811) Chlorine (Cl2) hydrate determination
1823 Faraday and Davy (1823) Chlorine (CI2) hydrate formula inference as
Cl2.10H2O
1828 Löwig (1828) Discovery of bromine hydrates
1829 De la Rive (1829) Inference of SO2 hydrates formula as SO2.7H2O
1856 Berthelot (1856) First formation of organic hydrates
1882 Wróblewski (1882) CO2 hydrate reported
1882 Cailletet and Bordet
(1882)
CO2+PH3 and H2S+PH3 mixed hydrate system
formation
1888
1890
Villard (1888)
Villard (1890)
Hydrates of methane, ethane, ethylene,
acetylene, nitrous oxide and propane hydrate
discovered
1896 Villard (1896) Nitrogen and oxygen proposed as hydrate
formers
Page 35
10
Year Source Achievements
1897 de Forcrand and Thomas
(1897)
Exploring hydrates of several halohydrocarbons
found mixed with acetylene, carbon dioxide and
ethane
1902 De Forcrand (1902) Utilisation of Clausius-Claypeyron equation for
the first time to estimate gas hydrate enthalpies
and compositions
1925 De Forcrand (1925) Discovery and measurement of xenon hydrates
1934 Hammerschmidt (1934)
Detection that the formation of natural gas
hydrates in transmission lines was responsible
for pipeline blockages
1940 Fowler et al. (1940) Identification of semi-clathrate hydrates of tetra
alkylammonium salts
1941 Wilcox et al. (1941) Development of the K-factor charts for
predicting hydrate formation conditions.
1942 Benesh (1942) Using gas hydrates for the first time as a means
for gas storage and transportation
1946 Deaton and Frost Jr
(1946)
Presenting summarised data on gas hydrates and
providing methods for their prevention
1946 Strizhov and
Khodanovich (1946)
Initial prediction of the potential presence of
natural hydrate deposits
1949 Unruh and Katz (1949) Three phase (L-H-V) hydrate data for CH4-CO2
reported
1954 Von Stackelberg (1954) Identification of sI and sII hydrate structures
using X-ray diffraction
1957 (Barrer and Stuart 1957) Development of a statistical approach for
determining the properties of gas hydrates
1959 van der Waals and
Platteeuw (1959)
Statistical thermodynamic model depending on
structure was proposed for calculating hydrate
equilibrium conditions
1965 Saito and Kobayashi
(1965)
Applying the van der Waals-Platteeuw theory to
mixtures
Page 36
11
Year Source Achievements
1965 Makogon (1965) First observation of in-situ natural gas hydrates
in permafrost regions
1969 Ginsburg (1969) Hydrates in geology studied for the first time
1972 Parrish and Prausnitz
(1972)
Applying van der Waals-Platteeuw theory to
natural gas hydrates and mixed hydrates
1972 ARCO–Exxon First successful attempt to recover core samples
containing hydrates from an Alaskan well on
the North Slope
1974 Claypool and Kaplan
(1974)
Confirmation that gas hydrates exist naturally in
deep sea and shallow marine environments
1976 Ng and Robinson (1976) Performing measurements on two-phase
hydrate equilibrium conditions, three-phase,
and four-phase liquid hydrocarbons
1980 Kvenvolden and
McMenamin (1980)
Publishing a geological survey of worldwide
gas hydrate distribution
1984 Handa et al. (1984) Employing a temperature-scanning calorimeter
to investigate the thermal properties of gas
hydrates
1985 John et al. (1985) Extending the van der Waals-Platteeuw theory
based on higher order coordination of hydrate
water shells
1987 Ripmeester et al. (1987) Discovery of new hydrate structure (sH)
1988 (Kvenvolden 1988) Estimation of the volume of gas within gas
hydrates to be ~ 1016 m3
1994 Mehta and Sloan Jr
(1994)
First reporting of sH hydrate equilibria formed
from methane and liquid hydrocarbon system.
1994 Mehta and Dendy Sloan
(1994)
Applying van der Waals-Platteeuw theory to the
mixtures containing methane and larger
molecules
1996 Sum et al. (1997) Measurements of the hydration number and
hydrate composition using Raman spectroscopy
Page 37
12
Year Source Achievements
1997 Kuhs et al. (1997) Double occupancy of N2 molecules was
reported for the first time in the large cages of
sII gas hydrate using neutron diffraction
1997 Udachin et al. (1997) First X-ray diffraction study reported for sH
hydrate structure
1999 Dyadin et al. (1999) Discovery that H2 and neon gases can form
hydrates at conditions of elevated pressure (~
1.5 GPa)
2000 Kang and Lee (2000) Proposal of new process for the recovery of CO2
using gas hydrate
2000 Uchida et al. (2000) Confirming the occurrence of natural gas
hydrates below the permafrost region by
imaging the first hydrate sample recovered from
Mallik 2L-28 well using the X-ray CT.
2004 Camargo et al. (2004) “Cold flow” technique introduced to prevent
gas hydrate blockage in flowlines.
2006 Hester et al. (2007) First measurement of oceanic gas hydrates
using Raman spectrometer at Vancouver Island
2006 Collett et al. (2008) Collecting of 493 hydrate core samples during
the first Expedition of the Indian National Gas
Hydrate Program
2011-
2012
Boswell et al. ( 2014) Testing the production of methane from
hydrates via CO2-CH4 exchange
2013 Yamamoto et al. (2014) Conducting the first attempt for methane
production from hydrate deposits in Japan via
the depressurisation technique
Page 38
13
Gas Hydrate Structures and Properties
Clathrate hydrates are fundamentally composed of two components; guest molecules
(typically gas or liquid) and host molecules (water). The term clathrate hydrates is
generated from the Latin origin word clatratus, meaning latticed or encaged. When
the guest molecules and host molecules exist together under elevated pressure and low
temperature, the hydrogen-bonded water molecules tend to organise themselves in
frameworks of polyhedral structures surrounding the small gas molecules (Figure 2-2).
The water molecules create a structure “cage” that contain the gas molecules. The
resulting structures (non-stoichiometric ice-like components) are known as gas
hydrates or gas clathrates. Within the crystalline structure, there are no chemical bonds
occurring between the water molecules (cage) and the gas molecule whose diameter is
normally less than that of the cage diameter. Figure 2-3 shows the five different types
of hydrate cages that are the pentagonal dodecahedron (512), tetrakaidecahedron
(51262), hexakaidecahedron (51264), irregular dodecahedron (435663) and icosahedron
(51268) (Sloan and Koh 2008). Those cavities become stabilised when they are filled
with gas molecules within the hydrate structure (Tse et al. 1993).
Figure 2-2 A stabilising gas molecule (yellow ball) enclosed by a framework of
water molecules
Page 39
14
512
512
62 5
12 6
4
512
68
43 5
6 6
3
Figure 2-3 Various types of natural gas hydrate cages (adapted from Koh and
Sloan 2007)
The experimental observation of gas hydrate and ice has revealed that there are several
distinct differences between them regarding the chemical and physical properties even
though they have almost the same appearance (Koh and Sloan 2007). However, the
most distinct property is that hydrate could be stable at a temperature greater than the
freezing point of water. In addition, hydrate submerges in water due to its higher
density whereas ice floats on water (Giavarini and Hester 2011). Furthermore, unlike
ice, the stored gases in the form of hydrates can be flammable when exposed to an
excessive heat source (Figure 2-4) (Suess et al. 1999).
Page 40
15
Figure 2-4 Flame of gas hydrate (methane) (Suess et al. 1999)
Generally, the majority of hydrates exist in three distinct structures depending on the
size of the guest molecules (Sloan and Koh 2008). To date, three different crystal
structures have been identified in natural hydrates as follows: cubic structure I (sI),
cubic structureII (sII) and hexagonal structure (sH). First, von Stackelberg and Müller
(1954) identified the sI and sII structures using the X-ray diffraction testing methods
conducted at Bonn University. The third hydrate structure, sH was discovered later by
Ripmeester et al. (1987) using magnetic resonance imaging and X-ray powder
diffraction techniques. Small guest molecules (size range 0.4–0.550 nm, e.g. methane,
ethane, hydrogen sulfide and carbon dioxide) form sI hydrate. sII hydrate is generally
formed from larger guest molecules of sizes ranging from 0.6 to 0.7 nm, for instance,
propane and isobutane (Sloan 2003). sH gas hydrates can be formed from both large
and small guest molecules (size range 0.8–0.9 nm). Methane and some additives
including THF and cycloheptane are examples of sH hydrates formers (Sloan 2003).
These types of hydrate exhibit structural transitions between different structures (Sloan
2003). Details of each hydrate structure including the number of cavities, crystal
structures and hydrate formers for each type are listed in Table 2-2 and demonstrated
in Figure 2-5.
Page 41
16
Table 2-2 Description of each hydrate structure (number of cavities, crystal
structure and hydrate formers (adapted from Sloan 2003)
Hydrate Structure I II H
Cavity 512, 51262 512, 51264 512, 435663, 51268
Cavities / Unit cell 2,6 16,8 3,2,1
Average cavity radius (Å)
3.95,4.33 3.91,4.73 3.91,4.06,5.71
Water molecules/ Unit Cell 46 136 34
Variation in radius (%)
3.4,14.4 5.5,1.73 4.0,15.1
Type of crystal cubic cubic hexagonal
Example of hydrate former CH4, CO2,
C2H6, H2S,Xe
H2, N2,O2,
C3H8,THF
CH4+ THF
CH4+ cycloheptane
Page 42
17
512
512
62
512
64
512
68
16
6
8
12
Structure I
Methane, ethane,
carbon dioxide
Structure II
Propane, isobutane,
natural gas
Structure H
Methane+neohexane,
methane+cycloheptane
Water Molecule cage
Gas Molecule
43 5
6 6
3
Figure 2-5 Three common types of hydrate network unit structures. The term
51262 characterises a water cage consisting of twelve pentagonal and two
hexagonal faces. The arrows characterise the number of unit cells of the various
cavities. Figure modified from Koh and Sloan (2007)
If a single type of guest molecule occupies the cavities within the hydrate structure,
the resulting hydrate is named a pure hydrate. Examples of the most common guest
molecules in nature and the corresponding hydrate structures are listed in Table 2-3.
Methane can stabilise both the small and large cages of sI, whereas molecules larger
than methane (e.g. propane) are able to considerably stabilise only the large cages of
sII, and thus form sII hydrates (Koh et al. 2011). However, other large guest molecules
can be incorporated in sII and sH hydrate structures in the presence of a so-called help-
gas (e.g. CH4) to stabilise the 512 and 435663 cages (Giavarini and Hester 2011). In this
context, the equilibrium conditions for the existence of hydrate vary depending on
the types of forming gases (Sadeq et al. 2017).
Furthermore, gas hydrates could also be formed from binary, ternary and multi-
component gas systems. The composition of mixed gas hydrates has a significant
influence on the thermodynamic stability of hydrates and increasing the concentration
Page 43
18
of higher hydrocarbons (e.g. CO2) compared to pure methane that shifts the
equilibrium conditions to lower pressures and higher temperatures (Sadeq et al. 2017).
A mixture of methane and carbon dioxide forms only sI hydrate, whereas the binary
mixture of methane and ethane can form sI or sII hydrates (each one forms sI hydrate)
based on the temperature, pressure and concentration of each gas in the mixture (Sloan
and Koh 2008).
Table 2-3 The most common guest molecules found in gas hydrates (Sloan and
Fleyfel 1991)
Guest Molecules Formula Hydrate
Structure Cavities
Methane CH4 sI 512, 51268
Ethane C2H6 sI 51262
Propane C3H8 sII 51264
Butane C4H10 sII 51264
Methylcyclohexane C7H14 sII 51268
Carbon Dioxide CO2 sI 512, 51262
Nitrogen N2 sII 512, 51264
Hydrogen Sulfide H2S sI 512, 51262
In addition, certain materials that are in the liquid status at room temperature can form
hydrates at conditions of low temperatures and atmospheric pressure (Ohmura et al.
1999). These types of chemicals are of special interest for studying gas hydrates
experimentally due to their ability to form the same hydrate structures that some of the
gas molecules can do without the need for high-pressure conditions. Examples of such
Page 44
19
materials are THF (C4H8O) and cyclopentane (C5H10), which both form sII hydrates at
atmospheric pressures and temperature above 0 °C.
Thermodynamics of Hydrate Formation and Equilibrium
Understanding the thermodynamics of gas hydrate formation is essential before
undertaking any effort in the field of gas hydrate. Without fundamental knowledge
regarding the thermodynamics, driving forces and solubilities cannot be fully
comprehended or the correct operating conditions determined.
Knowing the minimum pressure necessary for the formation of a small amount of gas
hydrate at a specified temperature is fundamental in deciding the operating conditions.
These minimum conditions are commonly referred to as the incipient hydrate
formation conditions and have been extensively studied.
Incipient hydrate formation conditions are commonly measured in the laboratory using
three different types of experimental procedures as follows: the isothermal method, the
isobaric method and the isochoric method (Sloan and Koh 2008).
In the isothermal method, the temperature of the system is decreased to a certain value.
Then, the experiment is started at a constant temperature and pressure above the
hydrate formation point. Throughout the isobaric method, the system pressure is kept
constant while the volume varies. During the isochoric method, the volume is kept
constant while the pressure changes. According to Mohebbi et al. (2012), the gas
diffusion rates by the isochoric and isobaric approaches are approximately the same
because the gas consumption rates are equal. These experiments can be repeated over
a range of conditions to obtain a partial phase diagram. Researchers have known the
conditions required to form the gas hydrate (e.g. methane) since 1946. Figure 2-6
illustrates the phase-diagram for methane; the solid line represents the H-Lw-V line
that connects a series of three-phase (solid hydrate, liquid water and vapour)
equilibrium points. Hydrates will not form below this line, and the system will consist
of liquid water and gas in equilibrium. Above this line, hydrates start to form causing
hydrate-liquid water equilibrium. At any point on the line, the three phases exist in
equilibrium.
Page 45
20
Figure 2-6 Phase diagram for methane-water (our work)
Formation and Dissociation of Gas Hydrates
The formation of gas hydrates is mainly determined by the availability of the following
fundamental elements: low temperature, high pressure and sufficient amount of
hydrate former with the existence of free water. However, the requirement for free
water was later debated by Kobayashi in his experimental studies from 1973 to 2000,
which demonstrated that gas hydrates can form in the absence of free water (Sloan and
Koh 2008). In addition, it has been found that other factors enhancing hydrate
formation include a turbulence source (agitation), nucleation site and water history
(memory effect) (Moon et al. 2003, Wenji et al. 2009, Obanijesu et al. 2014).
Moreover, acid gases such as carbon dioxide and hydrogen sulfide are also known to
promote hydrate formation because they are more soluble in water than the
hydrocarbon gases (Adeleke 2010). Gas hydrate formation (or crystallisation) is an
exothermic reaction (i.e. releases heat) and typically includes nucleation and growth
processes. However, dissociation of gas hydrates is an endothermic activity (i.e.
0
2
4
6
8
10
12
14
16
18
20
22
24
26
28
278 279 280 281 282 283 284 285 286 287 288 289 290 291 292 293 294
Pre
ssu
re (
MP
a)
Temperature (K)
Methane Hydrate
and
Liquid Water
Methane Gas
and
Liquid Water
Page 46
21
absorbs heat) that causes hydrate to decompose to water and guest molecules (hydrate
former).
2.4.1 Gas Hydrates Formation
The formation process of hydrates can be typically characterised by the following three
phases: gas dissolution, hydrate nucleation and growth. During the dissolution stage,
the gas dissolves in the liquid phase until it reaches the point of supersaturation. Then,
the nucleation period starts at time = teq as shown in Figure 2-7. During nucleation,
liquid and guest molecules constantly react and vibrate to form small hydrate nuclei
(clusters). These hydrate nuclei remain unstable until they reach the critical nucleation
size necessary for continual hydrate growth to proceed. Hydrate nucleation is an
inherently stochastic process and it is reflected by the induction time required to form
the nuclei. Standard induction times are dependent on the supersaturation and the
degree of temperature reduction during the formation process (You et al. 2015).
Figure 2-7 Typical hydrate formation stages
Hydrate growth then begins once the critical nuclei size is accomplished. The point at
which the hydrate clusters become visible is referred to as turbidity point (ttp) as shown
in Figure 2-7. The time between nucleation and turbidity is known as the induction
Page 47
22
time. During the growth period, the stable hydrate nuclei that formed during the
induction time will grow and progressively agglomerate until completion of the
formation process.
To date, two major hypotheses for hydrate nucleation have arisen through
experimental and modelling studies, i.e. labile cluster nucleation and local structuring
nucleation (Sloan and Koh 2008). In the labile cluster mechanism, which is the more
accepted conception, nucleation is controlled by the dissolving of gas in the liquid
phase along the liquid-gas interface where the gas molecules create local structuring
of the neighbouring liquid molecules into clusters. Such clusters arrange themselves
and agglomerate because of the reduction in free energy. The number of coordinated
labile clusters varies based on the type of dissolved gas in the aqueous solution (Sloan
and Fleyfel 1991). When the labile clusters come in contact with each other, they start
to agglomerate through the face or/and vertices sharing. As discussed above, when
these clusters achieve a critical size, the hydrate nucleus is formed as a larger and more
stable structure and are able to start the growth period (Sloan and Fleyfel 1991). Figure
2-8 shows the stages of nucleation according to the labile cluster mechanism.
Figure 2-8 Labile cluster nucleation model (adapted from Sloan and Koh 2008)
In the local structuring nucleation, the gas molecule is absorbed in the aqueous phase
surface instead of dissolving in water. This hypothesis assumes that nucleation occurs
on the vapour side of the liquid-vapour interface (Long 1994). This process leads to
Page 48
23
building half a cage by water molecules (local structuring). The gas will then migrate
through surface diffusion until it enters the cage and then a complete enclosure will be
formed. This hypothesis is clearly presented in Figure 2-9.
Figure 2-9 Adsorption of gas molecules onto hydrate cavities based on the local
structuring nucleation mechanism Long (1994)
2.4.2 Dissociation of Gas Hydrates
Hydrate dissociation requires considerable external energy to break the intermolecular
bonding between the water and guest molecules (hydrate cage) and the decomposed
hydrates (Sloan and Koh 2008). To induce hydrate dissociation, the equilibrium
conditions (pressure and temperature) have to be shifted to a lower pressure or a higher
temperature.
Generally, in the oil and gas industry, several methods have been suggested for hydrate
dissociation including thermal stimulation, depressurisation and thermodynamic
inhibitor injection, which are also proposed as techniques for natural gas production
(Makogon and Makogon 1997).
Page 49
24
A typical pressure-temperature (P-T) phase diagram for different gas hydrate formers
is shown in Figure 2-10. Two quadruple points are shown in this figure, the lower
quadruple point, Q1 (I-LW-H-V) and the upper quadruple point, Q2 (LW-H-V-LHC). Q1
refers to the point at which the four phases (ice, liquid water, hydrate and hydrocarbon
vapour) exist in equilibrium with lowering temperature. Conversely, Q2 represents the
point at which water liquid, hydrocarbon liquid, hydrocarbon vapour and hydrate
coexist in an equilibrium state showing the upper-temperature limit for gas hydrate
formation. Q1 and Q2 are unique for each hydrate former.
Figure 2-10 Pressure-temperature phase diagram for various natural component
gases that form hydrates (adapted by Sloan and Koh 2008 from a figure
developed by Katz 1959). H refers to hydrate; V for vapour; I for ice; LHC for
liquid hydrocarbon and LW for water. Q1 and Q2 are lower and upper quadruple
points
Page 50
25
Application of Gas Hydrates (Importance of Gas Hydrates)
Gas hydrates have unique physical and chemical properties as non-flowing structures
that have a higher density than other fluids and a high volume of gas contents (Sloan
2003). These unique properties produce the proposal that gas hydrates can be applied
in various industrial applications including potentially flow assurance, carbon dioxide
capture to reduce carbon dioxide emissions, gas storage, gas transportation and
separation, potential energy resource and others. The applications of gas hydrates
worldwide are summarised in the following sections.
2.5.1 Flow Assurance
Since the discovery by Hammerschmidt (1934) that gas hydrates could block the gas
production and transportation pipelines, gas hydrates have been highlighted as the
main flow assurance and safety issue. Currently, the formation of solid hydrates in
pipelines represents a concern for the oil and gas industry (Macintosh 2000) due to
their significant threat to the safe and economical operation of production facilities.
Hydrate plugs can stop the flow of natural gas and can be difficult to remove (Figure
2-11). Methane hydrate is often hard to decompose even at temperatures and pressures
above equilibrium conditions.
Figure 2-11 Natural gas hydrate plug in a transmission pipeline (Zarinabadi and
Samimi 2012)
Page 51
26
Consequently, extensive studies have been conducted to investigate how to avoid
hydrate blockage in pipelines. Many techniques have been suggested to reduce the
potential threats from gas hydrates. The conventional solution depends on eliminating
one of the required elements for the formation of gas hydrates, such as removing water
from the production system using the dehydration process. Another solution is to
prevent hydrate blockage by shifting the hydrate formation conditions to elevated
pressures and lower temperatures using thermodynamic inhibitors such as methanol
and mono-ethylene glycol. The thermodynamic inhibitor shifts the three-phase
equilibrium curve; therefore, the system can tolerate lower temperatures and higher
pressures.
It has been revealed that other types of inhibitors such as low-dosage inhibitors (e.g.
kinetic hydrate inhibitors and anti-agglomerates) can be utilised to decrease the
hydrate nucleation and growth rate at very low amounts during the liquid phase
compared to thermodynamic inhibitors (Kelland 2006). The low-dosage inhibitors
work either by delaying the initial hydrate formation or by preventing the
agglomeration of hydrate particles (Perrin et al. 2013).
2.5.2 Gas Storage and Transportation
Gas hydrate technology has been proposed as a promising method for natural gas
storage and transportation. Utilising such technology was first proposed by Benesh in
1942 who studied the unique properties of the hydrate structure (i.e. up to 180 m3 of
gas can be stored in 1 m3 of hydrate). However, such a process is often hindered by
some restriction such as unfavourable kinetics and low conversion of water to hydrates
(Lee, Zhang, et al. 2007). Hydrate promoters can increase the hydrate formation rate
by increasing the solubility of gas in the aqueous phase (King 2004).
The gas hydrate technique for gas storage and transportation is favourable in terms of
safety and economics compared to other storage and transportation methods (e.g.
liquefied natural gas (LNG)) (Byk and Fomina 1968). The LNG process requires high
pressure (up to 4 MPa) and temperature lower than -160 °C (Thomas and Dawe 2003).
In addition, LNG production facilities require huge construction costs (Gudmundsson
and Borrehaug 1996), which is reflected negatively in natural gas prices. However, gas
storage in the hydrate form could be transported at atmospheric pressure and much
Page 52
27
higher temperature (~ -20 °C) than those required for LNG storage and transportation
(Nakajima et al. 2002). Consequently, research is being conducted on hydrate
promoters, which may increase the viability of hydrate as a medium for storage and
transportation.
2.5.3 Gas Hydrate as a Potential Energy Resource
The demand for energy sources (e.g., for natural gas) is increasing with the growing
population and is fast depleting conventional energy resources (Dudley 2013, Al-
Fatlawi et al. 2017). To meet such increasing demand, natural gas hydrates (the main
gas here is methane) have been proposed as one of the most potential energy resources
(Collett 2000, Makogon 2010, Arora and Cameotra 2015). Moreover, hydrates are a
massive reservoir of natural gas because 1 m3 of methane hydrate contains up to 180
m3 of methane gas under standard conditions (Max et al. 2005, Sloan and Koh 2008).
Estimates of the global natural gas volume contained in hydrates range from 1014 m3
to 1018 m3 (Kvenvolden 1988, Moridis et al. 2009, Dawe and Thomas 2007). These
estimates exceed the entire combined world reserves of conventional energy resources
(Makogon et al. 2007, Moridis 2008). In the present energy consumption situation,
production of 15% of these reserves will cover the global energy needs for the coming
200 years (Makogon et al. 2007). It has been stated that methane hydrates alongside
renewable energy and hydrogen are the most significant substitution energy resources
for the next few years (Demirbas 2010a). Thus, attention towards the commercial
recovery and production of natural gas from hydrate-bearing sediments is on the rise
to become another aspect of industrial interest in deposits of gas hydrates.
Several techniques have been suggested for the production of gas from natural hydrate
sediments (Collett 2000). These techniques rely on inducing hydrate dissociation
through:
(1) Thermal stimulation by heating the hydrate-bearing sediments to a temperature
outside the gas hydrate stability conditions (Zhao, Zhu, et al. 2015). Heat sources such
as steam or hot water can be utilised for heat stimulation and then gas production
(Sloan and Koh 2008). This method has been suggested as the most attractive option
for reservoirs with high permeability and those under saline aquifers (McGuire 1981).
Thermal stimulation has been conducted in a production test at the Mallik site in
Page 53
28
Canada, which showed a poor and insufficient production efficiency as only 470 m3
of gas was produced over 5 days (Song et al. 2015). Following the idea that a
significant amount of heat was getting lost during the injection of the hot fluids into
the targeted layer, Schicks et al. (2011) developed a counter-current heat-exchange
reactor to produce heat in the target zone. In the laboratory scale testing, thermal
stimulation could be applied using water/air bath. The hydrate-bearing samples were
heated by increasing the surrounding temperature without contacting the heating
source (hot water) to ensure that the water produced from hydrate dissociation did not
mix with the injected water (Mekala et al. 2014). This technique has also been
conducted by electromagnetic heating (Islam 1994), constant heat flux (Misyura 2013)
and in-situ combustion (Castaldi et al. 2007).
(2) Depressurisation technique by reducing the pressure to a point under the hydrate
stability pressure to disturb the mechanical equilibrium. This technique is conducted
by placing a pump into the borehole and continuously producing fluid due to
decreasing reservoir pressure to initiate hydrate dissociation. This method was
successfully used to produce a total 4 × 10⁶ cubic feet of gas (0.7 × 10⁶ cubic feet /day)
in the Nankai Area (Japan) from 12 to 18 March 2013 (Johnson 2013). Production by
depressurisation is considered the most economical and feasible option among the
other production methods due to its high production capability (Moridis et al. 2009).
However, gas recovery may be restricted by ice generation and hydrate reformation
during the depressurisation process because of the endothermic behaviour of the
hydrate dissociation (Collett 2000, Song et al. 2015).
(3) Inhibitor injection by injecting the system with chemicals (e.g. methanol, glycol
and NaCl) to disrupt the hydrate equilibrium conditions beyond the hydrate stability
conditions, and thus assist the dissociation of the hydrate to gas and water. Typically,
the dissociation rate is controlled by the concentration of the inhibitor, the injection
rate, pressure and interfacial area between the hydrate and the inhibitor (Sira et al.
1990). However, this method is not economically feasible due to the high cost of these
types of chemicals. This technique could also be used alongside other methods to
enhance the production efficiency due to the lower heat required for hydrate
dissociation (Fan et al. 2006).
Page 54
29
Of these three main techniques for gas production, it has been found that
depressurisation technique combined with thermal stimulation could be the most
practical method for gas extraction from gas hydrate reservoirs (Demirbas 2010b).
Figure 2-12 illustrates a scheme of the three main techniques for gas production from
natural gas hydrate deposits.
Figure 2-12 Scheme explaining the three main techniques (thermal injection,
depressurisation and inhibitor injection) for gas production from hydrate
deposits (Collett 2002)
Recently, a new technique has been suggested for methane production from gas
hydrates via CO2-CH4 exchange (Kvamme et al. 2007, Graue et al. 2008). This method
involves methane extraction from hydrates by carbon dioxide injection into existing
hydrate reservoirs and subsequent exchange of methane molecules by CO2 molecules
in which CO2 is sequestered in the form of hydrates (Baldwin et al. 2009). Both carbon
dioxide and methane can form sI hydrate (Sloan and Koh 2008); however, carbon
dioxide hydrate is thermodynamically more stable than that of methane hydrate under
the prevailing conditions (Ohgaki 1994, Ersland et al. 2009). Therefore, injection of
Page 55
30
carbon dioxide into hydrate reservoirs causes the exchange of methane hydrate by
carbon dioxide hydrate and simultaneously releasing trapped natural gas (Kvamme et
al. 2007). Such a technique has considerable advantages compared with the
conventional production techniques, e.g. maintaining the mechanical stability of the
sediments during the production process via CO2 hydrate formation, controlling the
water and sand production to a minimum level, and providing a cleaner environmental
method for carbon dioxide storage, and thus contributing to reduce carbon dioxide
emissions into the atmosphere.
Most of the above recovery methods have specific limitations when applied
individually. Thus, gas production efficiency could be improved using a combination
of these methods. The huff and puff technique is one of the suggested approaches to
combine the thermal stimulation and depressurisation methods (Wang et al. 2014). An
increase of 3.6 times has been reported in gas production using the combined thermal
stimulation-depressurisation method (Falser et al. 2012).
2.5.4 Gas Hydrates as an Environmental Hazard and Factor in Climate
Change
Natural gas hydrates in reservoirs are generally vulnerable because they are sensitive
to certain conditions of pressure and temperature as discussed earlier. Therefore, small
changes in these conditions can disturb the hydrate stability zone causing the
dissociation of hydrates to water and gas. Two serious implications can result from
uncontrolled hydrate dissociation: geological hazard and contribution to global climate
change (Kvenvolden 1993, 1999). It is recognised that the existence of gas hydrates in
the submarine and permafrost regions results in cementation of the sediments and
reduction in its permeability, which leads to restriction of the pore fluids. Therefore,
when hydrates dissociate to gas and liquid, the sediments become unconsolidated and
overpressured due to the release of gas. This phenomenon leads to lowering of the
shear strength of the zone, which could cause structural failure and landslides. The
slope failure issue related to hydrate dissociation is one of the main topics of ongoing
gas hydrate studies.
Page 56
31
Most of the natural hydrate-bearing sediments, where the hydrate is stable, are already
occupied by hydrate and gas causing continuous sedimentation and more hydrate
burial. The deep hydrate burial produces a temperature increase in the bottom section
of the hydrate zone, which affects the hydrate stability causing gas release.
Moreover, small changes in subsurface ocean temperatures due to global warming
could shift the hydrate stability zone by meters, thus causing gas hydrate dissociation
with a severe geo-hazard in the future (Maslin et al. 2010). Therefore, in terms of
climate issues, the release of methane from hydrate reservoirs because of hydrate
dissociation could increase the methane concentration in the atmosphere. This is
contributing significantly to climate change because methane has a greenhouse effect
that is 25 times stronger than that of carbon dioxide (Beget and Addison 2007). In
2010, methane emissions contributed to 16% of all other greenhouse gas emissions
(Blanco et al. 2014), and the total concentration of atmospheric methane rose to 1.82
ppm by volume in 2013 (Hartmann et al. 2013). Furthermore, there is a huge amount
of methane trapped in a relatively small volume of gas hydrate, as mentioned above.
Therefore, releasing even a small percentage of methane could have a catastrophic
effect on climate warming over a relatively short time. A diagram demonstrating
submarine slope failure and gas release due to hydrate dissociation is shown in Figure
2-13.
Page 57
32
Figure 2-13 Scheme illustrating the effects of changes in temperature and
pressure on gas hydrate deposits and the subsequent gas release with seafloor
failures (adapted from Kvenvolden 1998)
Several studies related to environmental issues have revealed that the main reason for
global warming and climate change is elevated anthropogenic carbon dioxide
emissions to the atmosphere (Houghton et al. 2001). CO2 emissions into the
atmosphere have increased significantly (IPCC 2005, Pachauri et al. 2014). This is
coupled with the massive growth in fossil fuel consumption, where carbon dioxide is
emitted (IEA 2016). Consequentially, such high CO2 concentrations lead to increasing
global temperatures (global warming), and thus climate change. Indeed, CO2
contributes to approximately 60% of this global warming (Yang et al. 2008).
Decreasing CO2 concentration in the atmosphere is thus crucial for mitigating climate
change.
One of the methods suggested to reduce such emissions is carbon dioxide geo-
sequestration and capture in deep ocean sediments (Yamasaki 2003, Orr 2009). The
Page 58
33
prevalent thermodynamic conditions in such marine environments are suitable for
hydrate formation as they are located within the stability zone of the CO2 hydrates
(Clennell et al. 1999, Tohidi et al. 2010). Simultaneously, hydrate formation within
the porous medium blocks the pore space and causes a decrease in the permeability of
sediments to gases and liquids, thus providing a second seal in the system by self-
sealing (House et al. 2006, Kvamme et al. 2007, Kwon and Cho 2009, Tohidi et al.
2010). Therefore, CO2 geo-sequestration and capture via hydrate formation is
proposed as a promising new technology to reduce carbon emissions, and thus mitigate
the harmful influences of global warming and climate change.
Gas Hydrate Occurrence in Nature
Natural gas hydrate accumulation has been reported in several locations over the last
decades. The geological areas in which hydrate deposits have been discovered are
specified according to the substantial elements of hydrates formation (low temperature
and elevated pressure in the presence of water and forming gases). Thus, hydrate
deposits have been discovered mostly in polar regions (onshore and offshore
permafrost) and in the sediments of marine continental slopes (Kvenvolden 1993).
Figure 2-14 shows a map of worldwide locations of found and inferred gas hydrate
deposits.
Page 59
34
Figure 2-14 Locations of natural gas hydrate deposits worldwide (Paull et al.
2010)
In the polar region, hydrates accumulate in shallow water as the low-temperature
environment is dominant. In such environments, gas hydrates form in depths below
150 m because the hydrostatic pressure and low ambient temperatures (below freezing)
control the stability of the hydrate (Figure 2-15 (a)). Permafrost region hydrates
comprise approximately ~ 1% of global gas hydrate reserves. However, approximately
99% of the gas hydrate reserves are located in the deep oceanic environment. The sub-
zero temperature of the bottom water and the high pressures secure the hydrate
formation and stability. In these environments, hydrates exist at depths beneath 300 m
with the maximum lower limit of ~ 2000 m (Figure 2-15 (b)).
Messoya
Page 60
35
Figure 2-15 Depth-temperature stability zone for gas hydrates (a) in the
permafrost environment and (b) in deep oceanic (marine continental slops)
adapted after (Kvenvolden 1988)
Page 61
36
Hydrates in Sediments
2.7.1 Naturally Occurring Gas Hydrate in Porous Medium (Reservoir System)
In nature, a gas hydrate system could be considered similar to a conventional
hydrocarbon system, which is determined by the fundamental elements required for
gas hydrate formation in sediments (Collett et al. 2009). Four significant elements are
required for the formation of gas hydrate in sediments as follows (Max et al. 2013):
(a) Thick hydrate stability zone appropriate for hydrate formation.
(b) Adequate gas sources.
(c) Migration pathways to the seabed.
(d) High-quality host reservoir sediments.
The substantial main changes between the two systems (gas hydrate and conventional
hydrocarbon) are determined by the structure and timing regarding the accumulations
themselves. Table 2-4 contains some of the similarities and changes between the two
systems.
Table 2-4 Similarities and differences between gas hydrate deposits and the
conventional hydrocarbon system (Max et al. 2013)
Similarities Differences
High-quality reservoirs
have high porosity and
permeability.
Early exploration is
dependent on seismic
surveys.
Not necessary to connect reservoir to the fixed
source beds.
In general, the geological position cannot be
changed by deposits and geological trap.
Hydrate deposits required less detailed
measurements and less costly assessments of
resources.
Focus on the co-existence of the required
elements for gas hydrate formation and
stability
long-standing basin history and thermal
history of sediments are less significant in
analysis.
Page 62
37
2.7.1.1 Gas Hydrate Stability Zone
As discussed previously, hydrate formation is generally reliant on the correct
thermodynamic equilibrium conditions and accessibility of sufficient concentration of
hydrate formers (natural gas), which mix and react with the pore water. The hydrate
formation zone (which is also known as a gas hydrate stability zone (GHSZ)) refers to
a sedimentary zone and depth of bed that is saturated with gas and water under suitably
thermodynamic P-T conditions for hydrate formation (Makogon 1982). GHSZ
thickness is governed by pressure, temperature, gas composition and pore water. The
optimal GHSZ is located at relatively elevated pressures and low temperatures (e.g.
pressure higher than 14–20 MPa and temperatures range from 4 to 17 °C across the
Andaman Deep Sea and Krishna-Godavari Basin, India), with the presence of a
relatively sufficient volume of natural gas and low salinity pore water. Figure 2-16
illustrates the worldwide range of GHSZ conditions by showing the thermodynamic
conditions (pressure and temperature) and the equivalent water depth for several
collected hydrate samples including the methane-hydrate equilibrium curve.
The equilibrium pressure (for a given subsurface area) is identified by gravity and mass
of overlying geological layers (overburden). This pressure increases almost linearly
with increasing depth. In the same manner, the low-temperature environment is the
result of decreasing bottom water temperature with depth (because of differential
density effects). Consequently, the changes in pressure and temperature conditions in
the underground can provide the required thickness of GHSZ (Max et al. 2013). This
thicker zone is favourable for concentrating more natural gas hydrates in the
subsurface.
Page 63
38
Figure 2-16 Pressure-temperature equilibrium conditions and water depth
recorded for collected hydrate samples (Sloan and Koh 2008)
2.7.1.2 Gas Sources Availability
The availability of a sufficient amount of gas sources is a substantial factor controlling
the location of natural gas hydrate formation and distribution (Kvenvolden 1988,
Collett 1993). Many areas provide P-T conditions that allow for hydrate formation,
and yet they do not have any hydrate formation at all. The reason for this is mostly due
to insufficient gas supply (Giavarini and Hester 2011).
Page 64
39
The most common natural hydrate deposits are of sI methane hydrates, which widely
exceed other hydrate deposits. However, sII and sH gas hydrates have also been found
naturally in the upper continental slope of the Gulf of Mexico (Sassen and MacDonald
1994, Sassen et al. 2001).
Methane gas that forms gas hydrates can be generated from both biogenic and
thermogenic sources. Biogenic methane (microbial) is created by the biological
activity of anaerobic bacteria breaking down organic matter (Whiticar et al. 1986).
This process is performed at low temperatures in relatively shallow sediments
extending from the seabed to a few hundred meters below the seafloor (Claypool and
Kvenvolden 1983, Parkes et al. 1990). The biogenic methane is then ready for the
formation of sI gas hydrate in sediment (Bohrmann and Torres 2006). Approximately
99% of all gas hydrates existing in nature are composed of this microbial methane
(Kvenvolden and Lorenson 2001). Consequently, the availability of a sufficient source
of methane into the sediments at present and in the immediate-geological past
represents the required precursors for the formation of gas hydrates in nature (Max et
al. 2013).
Conversely, thermogenic gas is produced in the deepest buried sediments more than 1
km below the seabed via the thermal decomposition of organic materials (e.g. kerogen)
under relatively high temperature and pressure conditions (Floodgate and Judd 1992).
This type of gas includes a broader variety of hydrocarbons in addition to methane
(e.g. ethane, propane, butane, pentane and hexane). Most of the naturally occurring
gas hydrates are generated from biogenic gas sources. This type of hydrates has been
observed in shallow deposits (Kvenvolden and Barnard 1982). However, thermogenic
gases may also form hydrates such as the natural hydrates in the Black Sea and in
Northern Alaska (Collett 2002). Moreover, a mixture of both biogenic and
thermogenic gas sources have been proposed for Nigeria and the Gulf of Mexico
(Booth et al. 1996).
Page 65
40
2.7.1.3 Migration Pathways
Studies on gas hydrate deposits demonstrate the great importance of the gas migration
pathway in terms of the formation of hydrates in reservoirs. In most instances, the
amount of biogenic gas created in-situ within the sediment pore space is not enough
for hydrate formation, or the reservoir sediment is not buried deep enough for the
generation of thermogenic gas (Kvenvolden 1993, Collett et al. 2009). Therefore, it is
necessary for gas to have an upwards migration pathway to enter the GHSZ. Various
strategies have been suggested for gas migration through the sedimentary layers into
the GHSZ such as diffusion, gas dissolving in the migrating water and gas migration
as a continuous bubble phase. The gas diffusion process is considered relatively slow
and may not contribute to concentrating hydrate deposits (Xu and Ruppel 1999). The
other strategies require permeable paths that allow fluids to migrate through them.
Channels such as faults and salt diapirs are considered fundamental pathways for gas
migration (Sloan and Koh 2008, Collett 2013). Generally, natural gas hydrate
accumulations can be determined by tracking formation water from a free gas source
under the hydrate stability zone. Such a process represents a substantial factor in the
formation of natural hydrate accumulations. In passive margins, water drive is
generally because of the compaction of gravity on the sedimentary layers, whereas
tectonics and fractures are more controlling in active margins (Max et al. 2013).
2.7.1.4 High-quality Host Sediments
Substantial amounts of natural gas hydrates have been found within coarse-grained,
fine-grained and fractured reservoirs (Trehu et al. 2004, Waite et al. 2009). Examples
of such reservoirs are sandy sediments close to the margins of deep oceans in Japan
(Egawa et al. 2013), sediments in continental slopes in the Gulf of Mexico (Boswell
et al. 2012) and turbidite sands in the Ulleung Basin offshore of Korea (Lee 2011).
Recent estimations of hydrate reservoirs in Japan and the US show that high-quality
hydrate-bearing sands (i.e. with high permeability and porosity) are more prevalent in
methane hydrate systems than previously thought (Collett et al. 2014). However,
regarding the global volume of gas hydrates, accumulation of gas hydrates in fine-
grained marine sediments is larger than that in coarse-grained deposits because up to
Page 66
41
90% of global hydrate accumulations are hosted in fine-grained sediments (Boswell
and Collett 2006).
Hydrate-bearing sediments in Alaska have demonstrated low permeability, having a
range of 0.01–0.1 mD compared to the same hydrate-free sediments that have a
permeability of 1 D (Collett 2013). The lower permeability is due to the existence of
gas hydrates within the sediment, which blocks the pores of the sediments and causes
a reduction in their permeability. Studies on sedimentary samples recovered from
Alaska indicate that the high permeability is substantial for the formation of high
hydrate saturation in sediments. This is consistent with high hydrate saturation (~ 80%)
observed in coarse-grained sediments at the Mallik permafrost site in Canada and high
permeability reservoirs in the Nankai Trough in offshore Japan (Dallimore 2005, Fujii
et al. 2009, Winters et al. 2011).
2.7.1.5 Hydrate Growth in Sediments
Typically, three main steps summarise the hydrate growth process in sediments (Figure
2-17). Gas hydrate within the pore space of sediments grows in discrete steps contrary
to that of hydrate plugs, which grow gradually (Jung and Santamarina 2012).
Hydrate growth rate, which is known as an increase in hydrate thickness with time,
was previously identified by gas diffusion. However, experimental studies have
demonstrated that the rapid formation of the first hydrate particles is faster than that
which can be explained by the diffusion of gas (Jung and Santamarina 2012).
Simultaneously, the hydrate growth rate in the meniscus between water-wet surfaces
is greater than that in oil-wet surfaces.
Page 67
42
Figure 2-17 Steps of hydrate growth in sediments (modified from Jung and
Santamarina 2012)
In addition, X-ray micro-computed tomography studies on hydrate growth within a
pore space show that hydrates nucleate randomly causing grain particles (sediment)
movements during hydrate formation. Patchy hydrate growth and distribution in
sediments significantly affect the seismic velocities (compressional and shear
velocities) and petro-physical properties such as permeability, electrical conductivity
and shear strength (Waite et al. 2009).
2.7.2 Gas Hydrate Morphology and Distribution in Sediments
When formed in sediments, natural gas hydrate as a solid crystalline structure grows
as a configuration (Figure 2-18). Generally, two scales describe the hydrate
configuration in sediments, which are macro-scale morphology and micro-scale
morphology (Clayton et al. 2010). The macro-scale morphology describes the
structure of large-scale hydrate formation within the host sediments, while the micro-
scale indicates the interactions of the hydrates with their host sediments.
Thin hydrate shell forms along
the water-hydrocarbon
interface
Hydrate shell grows into the water phase
Hydrate growth as a tree-branch
geometry into the gas- phase
Page 68
43
Figure 2-18 Examples of gas hydrates found in the natural environment: (a) bulk;
(b) nodules; (d) layered and (e) laminae (Worthington 2010)
Four distinct forms (modes) in which hydrates exist in marine sediments are shown in
Figure 2-19. These forms are disseminated, nodules, veins or layered, and bulk or
massive.
Disseminated hydrates refer to the hydrates that distribute homogeneously in the pore
space of the macro-structure of the sediments (Booth et al. 1998, Clennell et al. 1999,
Gabitto and Tsouris 2010). This type of hydrate preferentially exists in coarse-grained
sediments such as sand due to low capillary pressure (Kleinberg et al. 2003, Torres et
al. 2008). Through such sediments, gas and fluid can flow smoothly with the
availability of many nucleation sites, which allows for the formation of hydrates
throughout the sediment. The other three types typically exist in fine-grained
sediments such as clay, carbonates and silts. Nodules and veins types have been
observed in large accumulations that can potentially grow into massive hydrate types
in the presence of a sufficient source (high flux) of gas and water (Malone 1985). In
Page 69
44
addition, veins (layered) may grow in sediments with planes of weakness and pre-
existing fracture planes (Collett et al. 2008).
Figure 2-19 The four morphological modes of hydrates in sediments (adapted
from Dangayach et al. 2015)
Recently, another classification of gas hydrate morphology has been proposed to
describe them in the pore space depending on the interaction of hydrates with the host
sediments (micro-scale morphology) (Clennell et al. 1999, Dvorkin et al. 2000).
According to the pore filling or cementing morphology, gas hydrates can form in
sediments in four pore habit patterns (Helgerud et al. 1999, Lee, Yun, et al. 2007,
Waite et al. 2009); Figure 2-20:
(a) Pore filling: Hydrates nucleate within the pore space and grow freely without
contacting or bridging grains. The hydrate is considered to be part of the pore
fluid (not the matrix); thus, only the bulk modulus of the pore water and the
electrical resistivity will be affected (Helgerud et al. 1999, Spangenberg and
Kulenkampff 2006), whereas the permeability will decrease (Kleinberg et al.
2003).
(b) Load bearing: As the formed hydrate cluster grows, it bridges the space
between adjacent grains and acts as part of the load-bearing structure
increasing the mechanical strength of the sediments. Hydrates are considered
to be a part of the sediment matrix, increasing the seismic velocities higher than
that of the pore filling type (Helgerud et al. 1999). The pore filling hydrate
Page 70
45
grows to a load bearing hydrate when the hydrate saturation exceeds 40%
(Priest et al. 2009).
(c) Cementing: Hydrate forms preferentially at the grain contacts. It performs as
a consolidation item, bonding adjacent grains together, significantly affecting
the shear and the bulk stiffness of the sediment even in small quantities
(Dvorkin et al. 1999) and rapidly increasing the seismic velocities (Dai et al.
2012).
(d) Grain coating: The hydrate forms as a uniform layer coating the surface of the
grains. The formed hydrate shell can clog pore throats and then cut parts of the
pore space from the interconnected pore network (Kumar et al. 2010). This
hydrate the same effect as the cementing type when the hydrate saturation
exceeds 30%.
Figure 2-20 Morphological patterns of gas hydrates (white) in sediment (grey)
saturated with pore fluid (blue); (a) pore filling, (b) load-bearing, (c) cementing
and (d) grain coating
It is difficult to determine the hydrate growth patterns from field core samples owing
to the difficulty in maintaining the hydrate in the samples during the coring process.
Therefore, most of the hydrate morphological observations depend on experimentally
formed hydrates and modelling studies.
2.7.3 Physical Properties of Hydrate-bearing Sediments
The presence of gas hydrate in the pore space of any geological layer can have a
substantial effect on its physical properties. Hydrate morphological habits and
saturation define the main physical properties of hydrate-bearing sediments. The
Page 71
46
difference in the physical properties of free-hydrate sediments and those containing
hydrates is mainly influenced by hydrate saturation. The most affected physical
properties are the seismic velocities, electrical resistivity and hydraulic permeability.
The seismic velocities describe the relationship between the elastic properties of a
medium to its density regarding the elastic wave speed moving through a body of that
medium. The body waves can be classified into two types: compressional waves (P-
waves) and shear waves (S-waves) (Crampin 1977). These two types have propagation
velocities (compressional velocity (VP) and shear velocity (VS)) that are determined
by the bulk modulus (K), shear modulus (µ) and density (ρ) of the medium they are
travelling through (Rabbel 2006). Those two velocities are defined as follows:
VP = √K +43µ
𝜌
2-1
VS = õ
𝜌 2-2
The seismic velocities are a common tool used to classify materials or to assess
properties of the pore fill. The presence of gas hydrates in sediments is known to cause
an increase in the seismic velocities because some of the pore fluids will be replaced
by the hydrates. This could cement the sediment grains, increasing their stiffness, and
thus increasing the bulk modulus and shear modulus. Typically, the degree of increase
in seismic velocities is related to the volume of hydrates formed and their
morphological habits. The seismic velocities of hydrate-bearing sediments can be
severely changed based on the type of hydrate growth habit even for the same
sediments and degree of hydrate saturation (Dvorkin and Nur 1996, Helgerud et al.
1999).
In addition to influencing the seismic velocities of sediments, electrical properties are
also affected by the formation of gas hydrates. The electrical resistivity or its inverse
electrical conductivity are widely used parameters to characterise electrical charge
Page 72
47
transportation through a given medium. Because gas hydrates and most rocks are
electrical insulators (Pearson et al. 1983), the charge transport in natural sediments and
rocks is generally provided by the conductive pore water. Therefore, when the hydrate
forms in the pore space of sediments replacing the pore water, the bulk resistivity of
the sediments increases. This increase in resistivity represents the fundamental tool for
the detection of hydrate-bearing sediments using resistivity logs (Collett 2001,
Boswell et al. 2012). The variance between the resistivity of the water saturation
sediments (without hydrate) (Ro) and the measured resistivity of hydrate-bearing
sediments (Rt) represents the increase in the bulk resistivity. Formations with Rt
greater than Ro give an indication of gas hydrate occurrence in the sediments.
Changes in the seismic and electrical properties due to the presence of gas hydrates are
mainly used to map and explore natural gas hydrate accumulations. The transition of
sediments pore filling from free gas and water to hydrates is accompanied by an intense
acoustic impedance (wave velocity × density) variation, which results in significant
seismic reflection (Berndt et al. 2004). These seismic reflections generally crosscut
sedimentary layers and follow the topography of the seabed, which is why they are
indicated as bottom simulating reflectors (Kvenvolden et al. 1983).
To investigate the physical properties of gas hydrate reservoirs on a laboratory scale,
studies are generally kept uncomplicated by considering it as a homogenous sediment
sample. Medium and coarse sand (quartz) are most favourably used as hydrate-bearing
sediments due to their high permeability that gives the most promising gas production
rates in the case of economical gas production from hydrate-bearing sediments. Table
2-5 lists the seismic velocities and electrical resistivities of materials, which are
frequently considered in sand gas hydrate reservoirs. The various materials cover a
wide range of each physical property and the large disparity between these properties
allows the physical detection of the process of hydrate formation and dissociation.
Page 73
48
Table 2-5 Seismic and electrical properties of materials that are generally
considered in natural gas hydrate reservoirs
Material VP, m/s Vs, m/s Resistivity, Ωm
Ice 3900 (Shaw 1986) 1900 (Shaw 1986) ~ 4 ×10³ (Du Frane
et al. 2011)
Methane gas 412 (Waite et al.
2009)
0 (Waite et al.
2009) → ∞
3 wt% brine 1412 (Mavko et al.
2009)
0 (Mavko et al.
2009)
3.77 (Mavko et al.
2009)
Bulk
methane
hydrate
3369 (Whiffen et al.
1982) -
~ 2 ×10³ (Du Frane
et al. 2011)
Sediment
(quartz)
6040 (Helgerud et al.
1999)
4120 (Helgerud et
al. 1999)
~ 2 ×10¹⁴ (Schon
1998)
2.7.4 Visual Observation of Hydrates in Sediments
Previously, considerable attempts have been conducted to observe hydrate formation
and morphology (macro and micro scale) in the pore space of sediments. One of these
attempts was conducted by Brewer et al. (1997) who investigated the hydrate
formation process by bubbling gas into two types of sediments (coarse-grained and
fine-grained) at a depth of 910 m in the ocean. It was observed that in the coarse-
grained matrix, gas hydrates filled the pore space in a dispersed nature, whereas in the
fine-grained sediments, gas hydrates were formed in channels (veins) and grew until
large masses formed. These findings have been confirmed by hydrate core sampling.
The observation of actual hydrate growth directly represents the first concept of the
formation mechanism.
Since then, various characterisation methods have been applied to study the gas
hydrate microstructure and growth pattern in sediments such as direct microscopy
Page 74
49
observation (Tohidi et al. 2001), nuclear magnetic resonance (NMR) (Mork et al. 2000,
Kleinberg et al. 2003), magnetic resonance imaging (MRI) (Baldwin et al. 2003, Zhao
et al. 2011) and high resolution X-ray micro-computed tomography (CT) (Kerkar et
al. 2014, Chaouachi et al. 2015).
The first direct observation of hydrate formation at the pore scale was conducted by
Tohidi et al. (2001). They formed CO2 and CH4 hydrates in a 2D synthesised
micromodel. Their results showed that hydrates formed from the free gas beginning at
the gas-liquid interface and hydrates mainly existed in the pores without contacting the
grain surface. However, grains could be cemented by hydrates if they were small, or
in the case of pores were almost filled with hydrates.
NMR-related technologies have also been used to study inclusion complexes since the
1960s (Brownstein et al. 1967). However, this technique was developed afterwards for
utilisation in a variety of gas hydrate studies. Using NMR, Kleinberg et al. (2003)
suggested that hydrate formed mainly in the large pores of sediments without coating
the grain surface. Cheng et al. (2013) investigated the formation and dissociation of
carbon dioxide hydrate in porous media using MRI and also measured the induction
time and hydrate saturation. Their findings demonstrated that the free pore water was
identified by a strong MRI signal; however, the solid hydrate was not detected due to
the background noise. Daraboina et al. (2013) used MRI to investigate the kinetics of
CH4-C2H6-C3H6 hydrate formation in the presence of a kinetic inhibitor. Their study
confirmed the efficiency of MRI as a technique for visualisation and valuation of the
performance of the inhibitor on gas hydrate formation.
Recently, high-resolution X-ray computed tomography has shown an advantage for
characterising gas hydrate-bearing sediments. The first discovery of X-ray was in 1895
by the German engineer and physicist Wilhelm Röntgen (Röntgen 1896). X-ray is a
type of electromagnetic waves with high frequency. They are similar to normal light
but have more energy and shorter wavelengths (~ 10-10 m) (Hau-Riege 2012). Such
waves have the ability to pass through opaque objects. Thus, the X-ray technique
presents a non-destructive tool for imaging the microstructure features within the
interior of solid materials, and it is considered to be a significant contributor to the
understanding of gas hydrates in sediments. This technology offers a fine spatial
resolution that is easy to adapt and apply to various experimental studies (Akin and
Page 75
50
Kovscek 2003). Various studies have been performed to observe the microstructure of
hydrate-bearing sediments via the X-ray technique. Examples of these research studies
are presented in Table 2-6.
Table 2-6 Examples of research studies observing the hydrate microstructure in
sediments via the X-ray technique
Research Hydrate Porous media Description
Mork et al.
(2000)
THF Quartz sand
Investigating the hydrate formation
and mechanical strength
measurement of hydrate-bearing
samples. They could not gain useful
information via computed
tomography (CT) scanner due to the
difficulties in differentiation between
the THF hydrate and liquid mixture.
Jin et al.
(2004, 2006)
CH4 Sand
Direct determination of porosity and
hydrate saturation of hydrate
sediments without destroying the
sample.
Waite et al.
(2008) CH4 Sand
Investigating the physical properties
of hydrate-bearing sediments
Kneafsey et
al. (2007) CH4 Silica sand
Observation of the hydrate system
behaviour during the formation and
dissociation of methane hydrate. The
results showed that the hydrate
formation rate was not constant but
occurred mainly at the starts. The
percentage of water converted to
hydrate was 65% depending on a
hydration number of 5.75.
Page 76
51
Research Hydrate Porous media Description
Kerkar et al.
(2009) THF Glass spheres
Imaging the THF hydrate patches in
regular sized glass spheres; the results
showed random formation and
growth with grain movements but
without being affected by the cell
wall.
Kneafsey et
al. (2011) CH4 Sand, sand/silt
Observation of location-specific
density variation resulting from
hydrate formation and water flowing;
the images showed a heterogeneity
formation of hydrate within the host
sediments.
Seol and
Myshakin
(2011)
CH4 Sand
Prediction of porosity and
distribution of the water phase in
samples containing hydrates;
quantifying the influence of grains
size distribution during the formation
and dissociation of methane hydrate.
Rees et al.
(2011) CH4
Natural cores
collected from
drilling sites
Obtaining detailed 3D images of the
internal structure of natural samples
containing gas hydrates.
Zhao, Yang,
et al. (2015) CH4
Different sized
sands
Investigating the microstructure and
distribution of hydrates forming in a
porous medium. The results showed
that hydrates are randomly distributed
in the pores without contacting the
grains.
Page 77
52
Research Hydrate Porous media Description
Chaouachi et
al. (2015) Xenon
Different types
of sand and
glass beads
Observation of the crystallisation and
growth processes of xenon hydrate in
various sediments; hydrate was
formed using juvenile water and
metastable gas‐enriched water.
Schindler et
al. (2017) THF Glass beads
Obtaining information about hydrate
distribution in the pore space. The
images indicate that the formed
hydrates followed the pore-filling
model.
2.7.5 Laboratory Techniques for Hydrate Formation in Sediments
Hydrate formation in sediments is a long-time process that depends mainly on the
degree of gas solubility in the liquid phase. Several laboratory techniques have been
suggested that aim to balance smooth formation with achieving hydrate distribution
resembling natural samples. Different formation techniques result in diverse hydrate
patterns and distribution, and consequentially influence the physical properties of
hydrate-bearing sediments, as discussed previously. Sediments with the same hydrate
saturation but various pore filling patterns may produce several degrees of variation in
their physical properties (Dai et al. 2012).
The successful laboratory formation methods are summarised below.
2.7.5.1 Hydrate Formation by Dissolved Gas
The hydrate formation by this method is achieved by circulating liquid containing
dissolved gas as a hydrate former through sediment under hydrate stability conditions.
As mentioned above, gas solubility in the liquid phase governs the hydrate
concentration and influences the formation time. Thus, gases with high solubility (e.g.
CO2) are generally used in such methods (Tohidi et al. 2001, Katsuki et al. 2006). In
addition, it has been reported that the hydrate formation process from dissolved
Page 78
53
methane requires a long duration time (up to a few weeks) and advanced equipment,
making such approach an experimental challenge (Spangenberg et al. 2005, Waite and
Spangenberg 2013).
Typically, the saturation of hydrate formed by this method does not exceed 70%
(Waite et al. 2009), and it nucleates heterogeneously within the coarse-grained
sediments on the grain surface and grows into the pore space (Yun et al. 2005).
Acoustic velocity measurements for sediments containing hydrate formed by this
method suggest that the hydrate follows the load-bearing behaviour at saturation levels
above 40% but follows pore-filling behaviour at levels below that (Spangenberg et al.
2005).
2.7.5.2 Hydrate Formation by the Partial Saturation Method
In this method, the hydrate is formed with partially water-saturated sediments by
pressurising the system with the former gas under controlled pressure-temperature
conditions (Waite et al. 2004). Then, the sample is cooled to the hydrate equilibrium
temperature. In sandy sediments, the hydrate formed by this method produces a
grained cementing hydrate because the hydrate forms at the grain contact areas. The
cemented hydrate could bond sand particles at low hydrate saturation, thus producing
sediment with a stiffer skeleton higher than that of pore-filling hydrates (Priest et al.
2005). Typically, the hydrate formed in the high gas flux regions represents most of
this hydrate distribution pattern (Bohrmann et al. 1998).
A successful experiment was conducted to form CO2 hydrate in partially saturated
clay-silt sediments with different hydrate saturations (Kim et al. 2013). The authors
described the hydrate behaviour as ‘weak cementation’, which was identified as
transitional behaviour between load-bearing and grain-cementing patterns. This
behaviour was assumed to be because of weak connections between hydrate clusters
and the mineral surface due to the existence of the water film on the mineral grains.
Page 79
54
2.7.5.3 Hydrate Formation by Excess Water Method
Recently, the excess water method has been introduced as another approach for gas
hydrate formation at the laboratory scale (Priest et al. 2009, Clayton et al. 2010, Falser
et al. 2013). In this method, a known volume of hydrate former (gas) is introduced to
the sedimentary sample and then accompanied by an excess water injection (Priest et
al. 2009). The gas is allowed to exist as small bubbles within the sediment pore space.
This hydrate formation process is considered an analogue to the conditions for natural
hydrates formed within the water-saturated sediments in nature (Winters et al. 2004,
Lee and Waite 2008). Hydrates formed by this method are not restricted to exist at the
inter-grain contacts; thus, the cementing behaviour has not been observed for hydrate
saturation below 20% (Priest et al. 2009, Spangenberg et al. 2014). In addition, it has
been reported that there are large differences in seismic wave velocities of sediments
containing hydrates formed via this method and other methods (Best et al. 2013).
2.7.5.4 Hydrate Formation from Soluble Hydrate Former (Tetrahydrofuran)
Another technique for laboratory hydrate formation involves forming hydrate using
soluble hydrate former (e.g. THF, C4H8O as shown in Figure 2-21 (a)). THF is a
hydrate former (liquid at room temperature) that is colourless and is fully mixable with
water. THF has been widely employed for laboratory synthesising of hydrate in
sediments and provides specific control of hydrate saturation and a rapid hydrate
formation process compared to the long process of methane hydrate formation (Lee,
Yun, et al. 2007). THF forms sII hydrate as only the large cavities are occupied as
shown in Figure 2-21 (b). It has been found that a solution composed of THF and water
in a molar ratio of 1:17 can form THF hydrates at ~ 4 °C under atmospheric pressure
(Leaist et al. 1982).
In similar behaviour to that of hydrates formed from dissolved gas, THF hydrate forms
on grain surfaces and grows toward the sediment pore space (Waite et al. 2009). THF
hydrate dissociation does not produce free gas; thus, there is no significant change in
the volume resulting from dissociation compared to that of the gas hydrate.
Yun et al. (2007) studied THF hydrate formation in silt, clay and sand sediments at
50% and 100% hydrate saturation. They conducted their experimental study by
Page 80
55
saturating the dry samples with THF and water mixture, applying the effective stress
to the specimen and then cooling. Several other studies have been conducted to form
THF hydrate following the same procedure such as Lee et al. (2010) and Santamarina
and Ruppel (2010).
Figure 2-21 Scheme illustrating (a) Tetrahydrofuran molecule and (b)
Tetrahydrofuran hydrate. Green is carbon atoms, white is hydrogen atoms, and
red is oxygen atoms (Conrad 2009)
Page 81
56
Apparatuses and Experimental Methods
This chapter introduces comprehensive characterisation of the experimental systems,
procedures and materials utilised to accomplish the aims and objectives of this
research. The three systems discussed are the PVT cryogenic sapphire cell for
determination of the equilibrium conditions of hydrates, the ultrasonic measurement
system for the determination of the compressional wave velocities of hydrate-bearing
sediments and the µCT-CO2 hydrate formation system for analysing the pore-scale of
hydrate in sandstone.
PVT Cryogenic Sapphire Cell for the Determination of Equilibrium
Conditions of CH4+CO2, CH4+N2 and CO2+N2 Hydrates
The PVT cryogenic sapphire cell system was employed to determine the hydrate
equilibrium data for different gas mixtures. This system was manufactured and
supplied by Sanchez Technologies (France) and is installed at the Clean Gas
Technology Australia research centre. The PVT sapphire cell apparatus has the ability
to analyse the behaviour of the fluid, determining hydrates and evaluating the
efficiency of hydrate inhibitors under various operating conditions.
3.1.1 PVT Cryogenic Sapphire Cell System
Figure 3-1 shows the PVT sapphire cell apparatus. The entire system is comprised of
the following:
(a) A cylindrical PVT sapphire cell unit with a total inner volume of 60 mL, as shown
in Figure 3-2, and that is placed inside a controlled air bath at working
temperatures varying from -160 °C to 100 °C. The cell itself is made of protected
sapphire material designed for high pressure up to 500 bar and is isolated from
the outside environment by a strengthened glass window. The cell is equipped
with a magnetic stirrer (rotating at different velocities by a motor drive) that
provides the required agitation for hydrate formation.
Page 82
57
(b) A series of pumps including a vacuum pump (Edwards Rotation pump, Model
E2M2), positive displacement pump and pneumatic gas booster pump (Haskel,
model AA-30).
(c) A cooling/heating system: the unit is connected to a chiller (R2G2 Series Cooler-
AQUA) providing cooling during the hydrate formation process. The cooling and
heating processes are enhanced using a fan that circulates the cold or hot air
through the bath surrounding the cell.
(d) Various thermocouples (RTD PT100 sensors, Model TC02 SD145; Hinco) and
pressure monitoring sensors (Sanchez).
(e) Gas supplying and transporting lines of 6.4 mm (1/4 inch) size equipped with all
associated valves and fittings (all provided by Swagelok Western Australia).
(f) Digital displays and computer software for monitoring the pressure and
temperature during the experiments. Two colour video cameras, Sony HYPER
HAD (5× magnifying lens), placed against the cell window for visual
observation of the behaviour of the cell contents. These cameras are of great
importance for hydrate equilibrium and formation experiments owing to the
reliance on visual indications and changes.
(g) Gas injection manifold installed to allow several gas sample bottles (canisters)
to connect and feed gas into the system.
Page 83
58
Figure 3-1 PVT Cryogenic Sapphire Cell Apparatus
Page 84
59
Figure 3-2 Cylindrical Sapphire Cell
3.1.2 Materials and Gas Mixtures Preparation
Deionised water (electrical resistivity of 18 MΩ.cm at 25 °C) from David Gray was
used as the liquid. Methane, carbon dioxide and nitrogen, all supplied by BOC
Australia and of high purity (99.95 mol.% to 99.99 mol.%), were used as a pure gas or
gas mixtures The preparation of gas mixtures at the desired composition was
conducted on a weight basis using 500 mL stainless sample bottles as follows:
1- Vacuuming the residual gas and air from all the sample bottles using the vacuum
pump.
2- Weighing each individual bottle using a high accuracy electrical balance from
Shimadzu, model UW6200H (accuracy of ± 0.01 g).
Page 85
60
3- Supplying the bottles with the required gas from the main gas cylinders and
reweighing.
4- Determining the gas quantity and concentration when mixed by the following
equations:
𝐧𝐢 =∆𝐦𝐢
𝐌𝐢
3-1
𝐗𝐢 =𝐧𝐢
𝐧𝐭
3-2
where, ni and mi are moles and mass of component (i) gas, respectively; Mi is the
molecular weight of gas (i); and Xi is the gas (i) mole fraction. All compositions of gas
mixtures used in this PVT sapphire cell experiment are listed in Table 4-2 (chapter 4).
Prior to each experiment, the CO2 and CH4 compositions in the gas mixtures were
verified by sample testing using two gas sensors (Gas Alarm Systems, PolyGard
manufactured by MSR model MGC-03) with a standard accuracy of ± 0.05.
3.1.3 Set-up and Experimental Procedure
A schematic of the experimental set-up is depicted in Figure 4-1, and a detailed
description of the apparatus is given in chapter 4. This apparatus was used to procure
the hydrate dissociation conditions by employing the temperature research method at
constant pressure (isobaric method) (Kim et al. 2011, Loh et al. 2012, Smith et al.
2015, AlHarooni et al. 2015, Smith et al. 2016). This method includes stimulating the
cell content (fluids) by cooling and heating processes to enhance the hydrate formation
and dissociation by maintaining a constant pressure.
Before the beginning of each experiment, the apparatus was cleaned and purged with
nitrogen to remove any impurities that could affect the results. The gas sample bottles
were connected to the gas manifold to allow the gases to be mixed and transferred via
the piston pump to the sapphire cell. Then, deionised water (5 mL) was syringed into
the evacuated sapphire cell through the upper inlet. The nitrogen and air were
Page 86
61
vacuumed from the entire system using the vacuum pump, following the pressurisation
of the cell with the prepared gas mixtures via a pneumatic pump in combination with
the piston pump. When the prescribed pressure was achieved, the stirrer was switched
on, and the cooling of the sapphire cell contents (fluids) was initiated at a rate of 2 K/h
for gas hydrate formation. After completing the hydrate crystallisation, which was
visually observed via the control PC, the cooling was stopped. The sapphire cell was
then heated at a rate of 2 K/h to start the hydrate dissociation. During each experiment,
the hydrate dissociation conditions (pressure and temperature) and stirrer currents
were determined.
Finally, the PVT sapphire cell was depressurised and the fluids were evacuated
through the cell outlet on the bottom cell base followed by flushing of the cell with
deionised water several times and cleaning it for the next experiment.
Page 87
62
Ultrasonic Measurement System for the Determination of Compressional
Wave Velocities of Hydrate-bearing Sediments
The compressional wave velocities for THF and CO2 hydrate-bearing sandstone
samples were measured using an experimental set-up consisting of the following
essential parts:
(a) High-pressure cell (Figure 3-3 and Figure 3-4), which was designed for
simultaneous acoustic measurements and hydrate formation in a sample of 3.8 cm
(1.5″) in diameter. This cylindrical cell was composed of a polyether ether ketone
with a base for attaching two piezo-electric transducers to the outside wall. A
thermocouple was attached to the cell to monitor the temperature during the
experiment with a precision of ± 0.5 K.
(b) Various pumps were used for fluid injections and to confine the pressure. In the
THF hydrate experiments, a high-performance liquid chromatography (HPLC)
pump (LC-20AT Shimadzu Ltd.) was used for liquid injection (THF + brine)
whereas the confining pressure was applied using a hand oil pump. Three syringe
pumps (ISCO 500D) with high accuracy of 0.1% were used in the CO2 hydrate
formation experiment; the first two pumps were used for CO2 and brine injection,
and the third pump was used to apply the confining pressure by compressing the
deionised water.
(c) A thermo-refrigerated bath (Alpha RA8, Lauda, Germany) was used to circulate
a coolant antifreeze liquid containing ethylene glycol via a copper coil wrapped
around the flowing cell. This bath provided the cooling temperature required for
the hydrate formation process.
Page 88
63
Figure 3-3 High-pressure cell (core holder) used in ultrasonic measurements for
determining the compressional velocities of hydrate-bearing sediments
Page 89
64
Figure 3-4 Photograph showing (a) high-pressure cell and (b) a sandstone sample
placed in the middle of the high-pressure core holder
(d) An ultrasonic measurements system comprised of a Pulser-receiver (model
5072PR, OLYMPUS), digital oscilloscope (model DS4022, RIGOL) and two
piezo-electric transducers (1 MHz, model A114S, OLYMPUS) as shown in
Figure 3-5. This system was used to determine the compressional velocities
through the sample before, during and after hydrate formation.
Page 90
65
Figure 3-5 Photograph showing the experimental set-up for the determination of
compressional wave velocities of hydrate-bearing sediments: (a) vacuum pump;
(b) high-pressure cell; (c) hand oil pump; (d) HPLC injection pump; (e)
oscilloscope and (f) pulser/receiver
3.2.1 Materials and Sample Preparation
The cylindrical Bentheimer sandstone core samples (3.8 cm in diameter and 8.1 cm in
length) from Kocurek Industries were used as an experimental hydrate-bearing porous
medium. Bentheimer is a clean, homogeneous sandstone consisting mainly of quartz
(99 wt%) with high permeability and porosity (Rahman et al. 2016). Figure 3-6 shows
an example of the Bentheimer sandstone cores used in this study. The petrophysical
properties (porosity and permeability) of the Bentheimer samples were determined
experimentally using a nitrogen automated permeameter-porosimeter (AP-608 with an
accuracy of ± 0.1%). THF (purity of 99.9 mol%) from Sigma-Aldrich Germany and
carbon dioxide (purity 99.9 mol%) supplied by BOC Australia were used as hydrate
formers. The aqueous solution (brine) used was prepared by mixing sodium chloride
(NaCl) or sodium iodine (NaI) both obtained from Rowe Scientific with purity ≥ 99.5
Page 91
66
mol% into deionised water from David Gray. The salts were dissolved in deionised
water to achieve the desired concentrations.
Figure 3-6 Bernheimer sandstone core samples used for compressional velocities
experiments
3.2.2 Experimental Procedure
To protect the rubber sleeve from the injected fluids, first, clean dry samples were
wrapped in a layer of plastic foil before they were placed inside the high-pressure cell.
Then, the cell was connected to the experimental system through the fluids line. The
cell was placed inside the cooling bath, and the injection pumps, confinement pump
and transducers were connected. Then, the entire system including the core sample
were vacuumed for 24 h using the vacuum pump to remove any air from the system,
and the confining pressure was raised to 8 MPa. The sample was then fully saturated
with brine by injecting more than 1000 pore volumes (PV) of brine into the cell via
the inlet tube connected to the top of the cell. Subsequently, the hydrate former (THF
testing solution or CO2 gas) was injected into the cell at the same conditions and the
desired flow rate. The hydrate formation process was then started by decreasing the
Page 92
67
temperature to the hydrate forming temperature. The THF hydrate can form at
atmospheric pressure and temperature below 277 K whereas the CO2 hydrate forming
conditions are 3 MPa and 274 K. During this process, the P-wave velocity
measurements were recorded while maintaining a constant temperature. Increasing the
P-wave velocities indicated that hydrate was formed. The hydrate formation process
was completed when there was no change in the compressional velocities.
Consequentially, P-waves were recorded as a function of a series of confining pressure
(2–20 MPa). Details of both THF and CO2 hydrate formation procedures are presented
in chapter 7.
X-Ray Micro Computed-CO2 Hydrate Formation System for Analysing
Pore-scale of Hydrate in Sandstone
Here, the experimental system included the following two parts: the CO2 hydrate
formation system and the µCT imaging instrument. The experimental set-up for the
CO2 hydrate formation in sandstone is the same as described in section 3.2. However,
a smaller high-pressure cell (Lebedev et al. 2017, Iglauer and Lebedev 2017) was used
for CO2 hydrate formation and µCT imaging of small Bentheimer plugs (diameter =
5mm) as shown in Figure 3-7. The main body of the cell was made from polyether
ether ketone (diameter = 21 mm, length = 300 mm) supplied by RS Components. The
plug was fitted in a hole of 8 mm in diameter. The confinement pressure was supplied
via union fittings (1/4″) passing through stainless steel fluid tubing (1/8″) inside the
high-pressure cell. A high-resolution CT instrument (3D X-ray Microscope
VersaXRM 500; XRadia-Zeiss) was used to image the CO2 hydrate-bearing plug at a
high resolution of 3.43 µm3. A detailed description of the experimental set-up is given
in Chapter 6.
Page 93
68
Figure 3-7 High-pressure cell for CO2 hydrate formation in small plugs and CT
imaging
3.3.1 Materials and Sample Preparation
The experiments were performed on a small cylindrical Bentheimer sandstone plug
(diameter = 5 mm, length = 15 mm) as shown in Figure 3-8; this plug was drilled from
a clean homogenous Bentheimer block from Kocurek Industries and was used as the
host porous medium for carbon dioxide hydrate in this study. Carbon dioxide with a
purity of 99.9 mol% supplied by BOC Australia was used as the hydrate-forming gas.
The aqueous solution used in this study was sodium iodide (NaI) brine prepared by
dissolving 6 wt% of NaI salt into deionised water. The iodide was used in this
experiment to ensure sufficient X-ray contrast during the imaging process.
Page 94
69
Figure 3-8 Photograph of the small cylindrical Bentheimer plug using CT
imaging experiment
3.3.2 Experimental Procedure
The clean small Bentheimer plug was jacketed in the rubber sleeve and connected to
the fluid lines inside the pressure-cell (core holder), and the core holder was then
connected to the hydrate formation system (see Figure 6-1). The experimental system
including the core holder and flow lines were vacuumed for 24 h to remove air from
the entire system. Then, the cell was pressurised by increasing the confining pressure
and the pore pressure to 8 MPa and 3 MPa, respectively. The cooling process was
achieved by decreasing the temperature to 274 K. These conditions were maintained
for 24 h to allow hydrate to form and grow inside the core sample. After completing
the hydrate formation process, the cell was placed inside the μCT instrument, and an
image of the hydrate-bearing core was acquired at a high resolution of (3.43 μm)3.
Page 95
70
The cell including the core sample was then left in the μCT scanner for 24 h at room
temperature (294 K), and the core sample was again imaged using μCT at the same
high resolution. More details of the experimental set-up, procedure and segmentation
of the μCT images are discussed in chapter 6.
Page 96
71 *Reference: Sadeq et al. 2017 in Journal of Natural Gas Science and Engineering, 38, 59-73.
Experimental Determination of Hydrate Phase
Equilibrium for Different Gas Mixtures Containing Methane,
Carbon Dioxide and Nitrogen with Motor Current Measurements*
Summary
Hydrate dissociation equilibrium conditions for carbon dioxide + methane with water,
nitrogen + methane with water and carbon dioxide + nitrogen with water were
measured using a cryogenic sapphire cell. Measurements were performed for the
temperature range of 275.75 K to 293.95 K and for pressures ranging from 5 MPa to
25 MPa. The resulting data indicated that as the carbon dioxide concentration was
increased in the gas mixture, the gas hydrate equilibrium temperature increased. In
contrast, increasing the nitrogen concentration in the gas mixtures containing methane
or carbon dioxide decreased the gas hydrate equilibrium temperatures.
In addition, the motor current changes during the hydrate formation and dissociation
processes were measured by keeping the rotation speed of the magnetic stirrer
constant, which was connected to a DC motor. The motor current measurements were
reported and showed that the hydrate plug formation and dissociation could be
predicted by the changes in the motor current.
Introduction
In recent years, the importance of gas hydrates has significantly increased in the energy
sector. Large amounts of natural gas hydrate deposits have been discovered beneath
the permafrost areas and in deep oceanic sediments (Buffett 2000, Kim et al. 2005,
Sloan and Koh 2008). These deposits present an enormous fuel resource (Makogon
2010), with 2.1×10¹⁶ m3 methane gas reserves estimated (Kvenvolden 1988), which
is more than double the entire combined world reserves of oil, natural gas and coal
(Makogon et al. 2007, Moridis 2008, Sloan and Koh 2008). Therefore, the oil and gas
industry are now looking into commercially producing gas from these deposits, and
preferably combining this production with the sequestration of carbon dioxide (Goel
2006, Eslamimanesh et al. 2012, Wood 2015). In addition, gas hydrates have received
Page 97
72
growing attention because of their role in carbon dioxide capture to reduce carbon
dioxide emissions (Adeyemo et al. 2010, Dashti et al. 2015), gas storage (Sun et al.
2003, Taheri et al. 2014), transportation (Taheri et al. 2014), cool-energy storage (Xie
et al. 2010, Wood 2015) and water desalination (Park et al. 2011, Eslamimanesh et al.
2012). Thus, such low temperature, high-pressure reservoirs are a potential sink for
anthropogenic carbon dioxide storage and climate change may be mitigated via this
route (Kvamme et al. 2007). Second, gas hydrate formation presents the main flow
assurance problem in the oil and gas industry (Englezos 1993, Sloan and Koh 2008,
Haghighi et al. 2009). Here, gas hydrate particles can agglomerate and build-up
gradually so that a large mass of hydrate is formed, which can block flowlines, valves,
chokes and other production equipment (Najibi et al. 2009, Sloan et al. 2010).
Natural gas hydrates (clathrate hydrates) are solid ice-like, non-stoichiometric
structures that consist of water and small gas molecules such as methane, carbon
dioxide, nitrogen, ethane, propane or butane (Bishnoi and Natarajan 1996, Sloan and
Koh 2008, Delli and Grozic 2014). Clathrate hydrates are classified into the following
three categories based on the arrangement of the water molecules in the crystal
structure and the size of the gas molecules: sI, sII and sH (Sloan 2003, Sloan and Koh
2008, Carroll 2014). Typically, gas hydrates are formed and are stable under high-
pressure conditions at temperatures above the freezing point of water up to 25 °C if a
gas hydrate former (i.e. a gas) and a sufficient amount of water are available (Sloan
and Koh 2008).
In this context, several experimental studies have reported hydrate equilibrium data
for various gas mixtures, including for methane, nitrogen and carbon dioxide (Unruh
and Katz 1949, Adisasmito et al. 1991). Later, Ohgaki et al. (1993), Fan and Guo
(1999), Seo et al. (2000), Kang et al. (2001), Seo et al. (2001), Bruusgaard et al. (2008)
and Sun et al. (2015) measured hydrate equilibrium data for CO2 and CH4 or N2,
whereas the N2-CH4 hydrate data were reported by Jhaveri and Robinson (1965), Lee
et al. (2006) and Mei et al. (1996). A summary of the experimental hydrate equilibrium
data reported in the literature for the CH4+CO2, CH4+N2 and CO2+N2 gas mixtures in
the presence of water are listed in Table 4-1.
Most of the existing experimental data are limited to low and medium pressure
conditions, while gas hydrates naturally exist in a high-pressure environment.
Page 98
73
Moreover, natural gas production from deep reservoirs requires hydrate prevention at
high pressures; thus, reliable and accurate hydrate equilibrium measurements are
essential to formulate and validate thermodynamic models for predicting the hydrate-
forming conditions.
We thus measured hydrate equilibria for various gas mixtures (methane + carbon
dioxide), (methane + nitrogen) and (nitrogen + carbon dioxide) for a wide range of
temperatures and pressures.
Page 99
74
Table 4-1 Review of the Gas Hydrate Equilibrium for CH4+CO2, CH4+N2, and
CO2+N2 and Water Systems
System Reference T/K P/MPa
CH4+CO2
Unruh and Katz (1949) 275.5 – 285.7 1.99 – 7.00
Adisasmito et al. (1991) 273.7 – 287.4 1.45 – 10.95
Dholabhai and Bishnoi (1994) 277.56-284.84 3.41 – 17.90
Ohgaki et al. (1993) 280.3 3.04 – 5.46
Fan and Guo (1999) 273.5 – 282.3 1.10 – 4.80
Servio et al. (1999) 273.5-283.1 1.7-5.070
Seo et al. (2001) 274.3 – 283.5 1.5 – 5.0
Beltrán and Servio (2008a) 275.1 –285.3 1.92 –7.47
Belandria et al. (2011) 279.1–289.9 2.96 –13.06
Belandria et al. (2011) 277.9 –285.5 2.72–8.27
Herri et al. (2011) 277.15 2.04 – 3.90
Sabil et al. (2014) 272.15 –290.15 1.10 –15.29
CH4+N2
Jhaveri and Robinson (1965) 282.8 – 294.4 7.40 – 35.96
Mei et al. (1996) 273.2 – 279.8 2.64 – 32.42
Lee et al. (2006) 273.30 –285.05 8.325 –20.70
CO2+N2
Fan and Guo (1999) 273.1 – 280.2 1.22 – 3.09
Kang et al. (2001) 273.75 – 284.25 1.56 – 32.308
Linga et al. (2007) 273.7 1.6 –7.7
Bruusgaard et al. (2008) 275.00 – 283.00 2.0 – 22.4
Kim et al. (2011) 276.88 –285.41 5.0 –20.0
Herri et al. (2011) 273.40 –281.10 5.60 – 6.10
Sfaxi et al. (2012) 278.1–285.3 3.24 –29.92
Sun et al. (2015) 273.4 – 278.4 5.28 – 17.53
Page 100
75
Experimental Methodology
4.3.1 Materials and Gas Preparation
Methane (purity 99.995 mol%), carbon dioxide (purity 99.9 mol%) and nitrogen
(purity (99.99 mol%), all supplied by BOC Australia, were used as the received or gas
mixtures prepared by mass balance as follows: empty 500 mL stainless steel bottles
(Whitey DOT-3E1800 12EK082) were vacuumed using an Edwards Rotation pump
(Model E2M2) for 30 min and then weighed using a high-precision electronic balance
(Shimadzu model UW6200H, accuracy = 0.01 g). The vacuumed bottles were then
filled with the gas(es) from the main cylinders and reweighed. The weight of the empty
bottle was 1350 g. The weight difference was then converted into a mole percentage
(Table 4-2). Two gas sensors (PolyGard manufactured by MSR) measured CO2 and
CH4 concentrations in the gas mixtures with a standard uncertainty of ± 0.05.
Deionised water (electrical resistivity of 18 MΩ.cm at 25 °C) was used as the aqueous
phase.
Table 4-2 Gas mixtures used in the present study
Component
Mol%
Mixture No.
1 2 3 4 5 6 7 8 9 10
CH4% 100 90 84 80 90 80 69 64
CO2% 10 16 20 26 36
N2% 10 20 31 36 74 64
4.3.2 Experimental Apparatus and Procedure
A high-pressure apparatus (Sanchez Technology, France) comprising of a sapphire cell
(60 mL inner volume), piston pump and pneumatic booster pump (Haskel, model AA-
30), valves and connection tubing was employed for the experiments (Figure 4-1). The
temperature of the cell was carefully controlled with a chiller (R2G2, Model R130A3-
Page 101
76
P4) and electric heater. Furthermore, two thermometers (RTD PT100 sensor with three
core Teflon tails, Model TC02 SD145) were positioned in contact with the liquid and
gas at the top and bottom of the sapphire cell, and thus measured the liquid and gas
temperatures. The pressure inside the sapphire cell was measured with a pressure
sensor (Sanchez). The maximum uncertainty of the pressure and temperature
measurements were ± 0.05 MPa and 0.1 K, respectively. All cell contents were
continuously mixed with an electric stirrer (550 rpm) driven by a DC motor (equipped
with a variable speed drive). By magnetic coupling, the load on the motor was
decreased when solid hydrate formed in the cell. The electrical current required to
maintain a constant motor speed was measured and it was found to be proportional to
the torque load on the impeller.
Hydrate formation and dissociation processes in the sapphire cell were observed
visually using two Sony Digital cameras (Model SSS-DC 18P, 1/3-inch colour DSP
CCD with 470TV lines of horizontal resolution) located outside the cell. Cooling and
heating cycles were started by operating the refrigeration compressor or electrical
heater, respectively. During each experiment, pressure, temperature and motor current
were continuously recorded at a rate of 12 points per minute.
In all experiments, the gas steel bottles were fitted into the gas manifold to transfer the
gas through the piston pump to the PVT sapphire cell. Then, approximately 5 mL of
deionised water was initially charged into the evacuated clean sapphire cell.
Subsequently, the gas mixture was introduced into the sapphire cell from the fitted
steel bottles via the piston pump. The cell was then pressurised by a pneumatic pump
(Haskel, model AA-30) in combination with a piston pump (Sanchez). Once the
prescribed pressure was reached, the stirrer was switched on, and cooling was started
at a rate of approximately 2 K/h until hydrate (formation) was visually observed. The
cooling process was stopped when complete hydrate crystallisation was achieved. The
cell was then heated at a rate of 2 K/h to start the hydrate dissociation process. The gas
hydrate dissociation temperatures, pressures and stirrer currents were measured during
the experiments. All experiments were repeated for each gas mixture at 5, 7.5, 10, 15,
20 and 25 MPa and for the temperature range of 275.75K to 293.95K. Moreover, the
repeatability of the hydrate experimental data was determined by performing the
experiment three times for the methane hydrate and two times for some randomly
Page 102
77
selected experiments, with closely matching results obtained. The statistical analysis
of the obtained experimental data showed a maximum experimental error of 1.65%.
Figure 4-1 Schematic of the PVT Sapphire Cell
The PVT sapphire cell apparatus was used to measure the hydrate dissociation
conditions by employing the temperature search method as an experimental
determination technique (Kim et al. 2011, Loh et al. 2012, AlHarooni et al. 2015,
Smith et al. 2015, 2016). Experimentally, the PVT cell was maintained at a constant
pressure using the piston pump and keeping the valve to the PVT cell open. Because
of that, the hydrate formation conditions depended on various factors (induction time,
rate of cooling and memory effect), had a high degree of variance compared to the
dissociation conditions and represented a fixed thermodynamic property, thus the
dissociation was considered as the hydrate equilibrium conditions (Tohidi et al. 2000).
Hydrate dissociation conditions for the carbon dioxide + methane, nitrogen + methane
and carbon dioxide + nitrogen gas mixtures were measured for the temperature and
pressure ranges of 275.75K to 293.95K and 5 MPa to 25 MPa, respectively. In
addition, motor current measurements were used as an indication of gas hydrate plug
formation and dissociation.
Page 103
78
Results and Discussion
4.4.1 Gas Hydrate Equilibrium Conditions
Initially, the accuracy of the experimental results was checked by measuring the
equilibrium conditions for pure methane and the gas mixture containing 20 mol% CO2
and 80 mol% CH4 (Figure 4-2 and Figure 4-3), with our data in good agreement with
the literature data (Jhaveri and Robinson 1965, Adisasmito et al. 1991, Dholabhai and
Bishnoi 1994, Servio et al. 1999, Seo et al. 2001, Nakamura et al. 2003, Mohammadi
et al. 2005, Lu and Sultan 2008, Beltrán and Servio 2008a, Sabil et al. 2014). The
measured hydrate data are listed in Table A-1, Table A-2 and Table A-3 and plotted in
Figure 4-4, Figure 4-5 and Figure 4-6.
Figure 4-4 shows the equilibrium conditions for the CO2+CH4 gas mixture. As
expected, the CO2+CH4 hydrate equilibrium curves are located between the
equilibrium curves of pure CO2 and pure methane (Ohgaki et al. 1993, Sloan and Koh
2008). Furthermore, as the CO2 concentration increased in the CO2-CH4 mixture, the
equilibrium temperature also increased, approaching the curve for pure CO2. Figure
4-4 shows that the measured CO2+CH4 hydrate data in the present study showed a
similar trend with the data available in the literature (Adisasmito et al. 1991, Ohgaki
et al. 1993, Fan and Guo 1999).
An analogue scenario was observed for the N2+CH4 system (Figure 4-5). Again the
equilibrium curves of the N2+CH4 mixture are located in between the curves for pure
N2 (Van Cleeff and Diepen 1960) and pure CH4, and the gas hydrate equilibrium
temperature decreased with increasing N2 concentration, approaching the N2 curve.
Jhaveri and Robinson (1965), Mei et al. (1996) and Lee et al. (2006) observed similar
behaviour. This is due to the dilution effect of nitrogen, which leads to a lower hydrate
temperature.
This behaviour was again observed for the carbon dioxide + nitrogen mixtures (Figure
4-6), i.e. the presence of CO2 in the CO2+N2 mixture led to an increased hydrate
equilibrium temperature. The equilibrium curve of 64 mol% nitrogen (36 mol% carbon
dioxide) is closer to the pure carbon dioxide curve than the pure nitrogen curve. This
phenomenon was also observed by Seo et al. (2000), who explained that this behaviour
was due to the competition of CO2 and N2 molecules for optimum occupancy of the
Page 104
79
hydrate structure. Mechanistically, during the hydrate formation process, CO2
molecules occupy small and large cavities in the hydrate structure whereas N2
molecules fill the other unoccupied cavities.
Figure 4-6 shows that the N2 + CO2 data reported in the present study are incomparable
to the behaviour of those in the literature (Kang et al. 2001). Figure 4-7, Figure 4-8
and Figure 4-9 show plots of ln P vs 1/T for the experimental data obtained in the
present study, which show a good linear relationship.
Figure 4-2 Comparison of CH4 hydrate dissociation points (black squares:
experimental data; open symbols: literature data (Jhaveri and Robinson 1965,
Adisasmito et al. 1991, Nakamura et al. 2003, Mohammadi et al. 2005, Sabil et al.
2014)
0
5
10
15
20
25
30
276 281 286 291 296
Pre
ssu
re (
MP
a)
Temperature (K)
This work
Sabil et al., 2014
Mohammadi etal., 2005
Adisasmito et al., 1991
Nakamura et al., 2003
Jhaveri and Robinson, 1965
Page 105
80
Figure 4-3 Comparison of 80 mol% methane and 20 mol% carbon dioxide
hydrate dissociation points (black squares: experimental data; open symbols:
literature data (Dholabhai and Bishnoi 1994, Servio et al. 1999, Seo et al. 2001,
Lu and Sultan 2008, Beltrán and Servio 2008a)
0
5
10
15
20
25
30
270 275 280 285 290 295
Pre
ssu
re (
MP
a)
Temperature (K)
Sevio et al., 1999
Seo et al., 2001
Beltrán and Servio etal., 2008
This work
Lu and Sultan 2008
Dholabhai and Bishnoi
Page 106
81
Figure 4-4 CH4 hydrate equilibrium curves. Closed symbols represent our
experimental data and open symbols represent the literature data: Pure carbon
dioxide reported by Ohgaki et al. (1993), 8% carbon dioxide reported by
Adisasmito et al. (1991) and 96.54% carbon dioxide reported by Fan and Guo
(1999). Numbers indicate gas mole in the mixture
0
2
4
6
8
10
12
14
16
18
20
22
24
26
273 275 277 279 281 283 285 287 289 291 293 295
Pre
ssu
re (
MP
a)
Temperature (K)
100%
8% CO₂
10% CO₂
16% CO₂
20% CO₂
96.54% CO₂
100% CO₂
CH4
Page 107
82
Figure 4-5 N2-CH4 hydrate equilibrium curves. Closed symbols represent
experimental data and open symbols represent literature data: pure nitrogen
reported by Van Cleeff and Diepen (1960), 10.7% nitrogen reported by Mei et al.
(1996), 59.61% nitrogen reported by Lee et al. (2006) and 68.77% nitrogen
reported by Lee et al. (2006). Numbers indicate gas mole in the mixture
0
2
4
6
8
10
12
14
16
18
20
22
24
26
28
30
32
273 275 277 279 281 283 285 287 289 291 293 295
Pre
ssu
re (
MP
a)
Temperature (K)
100% 10% N₂
10.7% N₂ 20% N₂
31% N₂ 36% N₂
59.61% N₂ 68.77% N₂
100% N₂
CH4
Page 108
83
Figure 4-6 CO2-N2 hydrate equilibrium curves. Closed symbols represent
experimental data and open symbols represent the literature data: pure nitrogen
reported by Van Cleeff and Diepen (1960), pure carbon dioxide reported by
Ohgaki et al. (1993), 88.41% nitrogen reported by Kang et al. (2001), 82.39%
nitrogen reported by Kang et al. (2001) and 22.2% nitrogen reported by Kang et
al. (2001). Numbers indicate gas mole in the mixture
0
2
4
6
8
10
12
14
16
18
20
22
24
26
28
30
272 274 276 278 280 282 284 286
Pre
ssu
re (
MP
a)
Temperature (K)
100% N₂
88.41% N₂
82.39% N₂
74% N₂
64% N2
22.2% N₂
100% CO₂
Page 109
84
Figure 4-7 Experimental CO2-CH4 hydrate equilibrium data in ln Pressure versus
1/Temperature plot. Numbers indicate gas mole percentages in the mixture used
in this study
1
1.5
2
2.5
3
3.5
0.0033 0.00335 0.0034 0.00345 0.0035 0.00355 0.0036
ln P
ress
ure
(M
Pa
)
1/Temperature (K)
100%
10% CO₂
16% CO₂
20% CO₂
CH4
Page 110
85
Figure 4-8 Experimental N2-CH4 hydrate equilibrium data in ln Pressure versus
1/Temperature. Numbers indicate gas mole percentages in the mixture used in
this study
1
1.5
2
2.5
3
3.5
4
0.00335 0.0034 0.00345 0.0035 0.00355 0.0036 0.00365
ln P
ress
ure
(M
Pa
)
1/Temperature (K)
100%
20% N₂
31% N₂
36% N₂
10% N₂
CH4
Page 111
86
Figure 4-9 Experimental CO2-N2 hydrate equilibrium data in ln Pressure versus
1/Temperature. Numbers indicate gas mole percentages in the mixture used in
this study
4.4.2 Current as an Indication of Hydrate Plug and Dissociation
In the present study, visual observation was employed to measure the hydrate
dissociation condition. In some experiments, this technique was not available,
especially where the experimental cell is not visual. Therefore, the motor current
changes during the hydrate formation/dissociation process could be related to the
hydrate plug formation and dissociation. The motor current is a function of the torque
required to mix the sapphire cell contents; once a hydrate plug is formed, the torque
and thus the motor current increases due to the increasing load on the stirrer.
1
1.5
2
2.5
3
3.5
0.0035 0.00352 0.00354 0.00356 0.00358 0.0036 0.00362 0.00364
ln P
ress
ure
(M
Pa
)
1/Temperature (K)
74% N₂
64% N₂
Page 112
87
The stirrer motor current as a function of experimental time was measured in a set of
experiments as shown in Figure 4-10, Figure 4-11, Figure 4-12 and Figure 4-13.
Clearly, the motor current changes during hydrate formation and dissociation. Initially,
the motor current remains constant but then increases dramatically until it reaches a
maximum. This maximum indicates the presence of the full plug of the gas hydrate.
However once the solid plug hydrate was formed, the motor current decreased rapidly
due to slippage of the stirrer on the magnetic coupling. After dissociation began, the
stirrer started rotating again due to the magnetic stirrer being reconnected to the motor
and a small spike in the motor current was observed. Therefore, there was no
significant current change before hydrate plug formation, whereas the current changed
significantly once the full hydrate plug was formed. The hydrate behaviour as
indicated by the motor current was consistent with independent visual observations.
Therefore, the motor current can be used as a hydrate formation and dissociation
criterion.
Figure 4-10 Motor current and temperature vs time during hydrate
formation/dissociation process for pure CH4 at a pressure of 10 MPa
Page 113
88
Figure 4-11 Motor current and temperature vs time during hydrate
formation/dissociation process for a 10% CO2 + 90% CH4 gas mixture at a
pressure of 10 MPa
Page 114
89
Figure 4-12 Motor current and temperature vs time during hydrate
formation/dissociation process for a 16% CO2 + 84% CH4 gas mixture at a
pressure of 10 MPa
Page 115
90
Figure 4-13 Motor current and temperature vs time during hydrate
formation/dissociation process for a 80% CH4 + 20% CO2 gas mixture at a
pressure of 10 MPa
Figure 4-14 shows a series of images that were captured during the hydrate formation
process in the PVT sapphire cell. During cooling and when the temperature reached
2–4 degrees below the hydrate dissociation temperature, hydrate formation started at
the liquid-gas interface (Figure 4-14a), which is consistent with Tohidi et al. (2001)
and Ueno et al. (2015).
With continuing progress of the experiment, hydrate particles grew gradually on the
surface area and then built up towards the centre (Figure 4-14b). Later, the hydrate
particles increased in size and migrated into the liquid phase, which shrank due to
hydrate growth (Figure 4-14c-e). However, the PVT cell content was still flowing and
no apparent change in the motor current was observed during this period. Gas hydrates
continued to grow until all liquid was consumed. At this stage, the motor current began
to increase dramatically until it reached the maximum value. Once the solid hydrate
Page 116
91
plug was sharply formed (Figure 4-14f), the magnetic stirrer stopped moving, and the
hydrate completely blocked the system causing a rapid decrease in the current. During
the heating process, the gas hydrate started dissociating and gas bubbles appeared in
the solid phase (Figure 4-14g). At this point, the stirrer started to move again, and a
small increase in the current was measured.
Page 117
92
a b c
d e f
g
Start formation t= 5 mins t= 10 mins
t= 20 mins t= 60 mins t= 74 mins
Start dissociation
Figure 4-14 Images captured during the experiments
Page 118
93
Conclusions
The gas hydrate equilibrium conditions are of major significance in the energy sector
due to the importance of gas hydrates as a potential alternative energy resource, as a
means of CO2 sequestration, as a factor in global climate change and as a threat to flow
assurance and gas production systems. Thus, in the present study, the hydrate
equilibrium data for the carbon dioxide + methane + water, nitrogen + methane + water
and carbon dioxide + nitrogen + water systems were experimentally measured in the
PVT sapphire cell apparatus. Experiments were conducted at temperatures varying
from 275.75K to 293.95K and pressures ranging from 5 MPa to 25 MPa. An acceptable
agreement was found between the obtained experimental data and the literature data
(Jhaveri and Robinson 1965, Adisasmito et al. 1991, Dholabhai and Bishnoi 1994,
Servio et al. 1999, Seo et al. 2001, Nakamura et al. 2003, Mohammadi et al. 2005,
Beltrán and Servio 2008a, Lu and Sultan 2008, Sabil et al. 2014). Specifically, we
observed that at any given pressure the hydrate equilibrium temperature increased with
increasing CO2 mole percentage in the CO2 + CH4 and CO2 + N2 gas mixtures, whereas
increasing the N2 mole fraction in the N2 + CH4 gas mixture reduced the hydrate
equilibrium temperature at any given pressure. Furthermore, motor current
measurements were performed during the gas hydrate formation and dissociation
process, which showed that the motor current could be used as a gas hydrate formation
and dissociation criterion, particularly in the cases where visual observations are not
possible.
Page 119
94
*References:
1. Sadeq et al. (2017) in One Curtin International Postgraduate Conference, Miri, Sarawak, Malaysia,
10-12 December 2017.
2. Sadeq et al. (2018) in Offshore Technology Conference Asia held in Kuala Lumpur, Malaysia, 20-
23 March 2018.
Thermodynamic Modelling and Empirical Correlation
for the Prediction of Gas Hydrate Equilibrium Conditions*
Summary
Following on from chapter 4 where experimental hydrate equilibrium measurements
for carbon dioxide + methane, nitrogen + methane and carbon dioxide + nitrogen were
determined, this chapter seeks to present approaches for modelling gas hydrate
equilibrium conditions. As mentioned previously, gas hydrate formation represents
one of the main problems facing the oil and gas industry as it poses a significant threat
to the production, processing and transportation of natural gas. Here, gas hydrate
particles can agglomerate and build up gradually so that a large mass of hydrate is
formed, which can block flowlines, valves, chokes and other production equipment.
Thus, accurate predictions of gas hydrate equilibrium conditions are essential
requirements for designing gas production systems at safe operating conditions and
mitigating the problems caused by the formation of hydrates. Thus, in this chapter,
first, a thermodynamic model for gas hydrate equilibrium conditions and cage
occupancies for the gas mixtures containing methane, carbon dioxide and nitrogen at
different compositions are proposed. The van der Waals-Platteeuw thermodynamic
theory coupled with the Peng-Robinson equation of state and Langmuir adsorption
model are employed in the proposed model. The experimental measurements
generated in chapter 4 are used to evaluate the accuracy of this model. The results are
discussed extensively in the discussion section.
Second, a new hydrate empirical correlation for predicting gas hydrate equilibrium
conditions was obtained for the same hydrate mixtures. The new correlation was
proposed for a wide range of pressures, temperatures and gas specific gravities. The
nonlinear regression technique was applied to develop the correlation based on 142
experimental data points collected from the literature, validated by 85 data points not
Page 120
95
previously used for developing this correlation. The statistical parameters analysis
showed an average absolute error of 0.2183, a squared correlation coefficient (R2) of
0.9978 and standard deviation of 0.2483. In addition, comparing the new correlation
results with the experimental data and with those calculated by other correlations
showed an excellent performance for the investigated range.
Introduction
Natural gas hydrates (clathrate hydrates) are nonstoichiometric solid ice-like
compounds that are composed mainly of water molecules, which physically encage
small gas molecules. Methane, carbon dioxide, nitrogen, ethane and propane are
examples of gas hydrate formers (Sloan and Koh 2008, Delli and Grozic 2014).
Generally, depending on the arrangement of the water molecules and the size of the
gas molecules, gas hydrates have been found to form the following three structures:
sI, sII and sH (Sloan 2003, Carroll 2014). Typically, gas hydrate formation is expected
whenever a system of gas hydrate former (i.e. gas) and water molecules exist at
specific conditions of high pressure and low temperatures (usually pressure above
0.6 MPa and temperatures above the freezing point of water up to 300 K (Sloan and
Koh 2008)).
The importance of gas hydrates in the oil and gas industry became apparent in the
1930s when Hammerschmidt (1934) discovered that solid hydrates were plugging the
oil and gas transmission pipelines. Since then, gas hydrates have been considered as a
flow assurance problem in the oil and gas industry. In addition, gas hydrates could
have severe consequences to the oil and gas production facilities regarding safety and
cost. Moreover, gas hydrate technology has many applications in the industry due to
the high stability and storage capacity (up to 180 m3 of gas can be stored in 1 m3 of
hydrates at standard conditions) (Sloan and Koh 2008). Therefore, gas hydrates can be
considered as a secure and convenient method for gas storing and transportation
(Taheri et al. 2014) and as a potential energy resource (Makogon 2010). Thus, accurate
prediction of hydrate equilibrium conditions is essential for designing gas production
systems at safe operating conditions, and for investigating the feasibility of gas hydrate
as a storage and transportation medium. The best method for determining the hydrate
Page 121
96
equilibrium conditions is to measure them experimentally. However, experimental
measurements of hydrate temperatures and pressures for a wide range of gas
compositions are not feasible. Thus, in the present study we first applied the Langmuir
adsorption model coupled with van der Waals-Platteeuw theory (van der Waals and
Platteeuw 1959) and the Peng-Robinson equation of state (Peng and Robinson 1976)
to describe the CO2 + CH4, N2 + CH4 and N2 + CO2 hydrate equilibrium conditions
compared to the experimental measurements conducted in the cryogenic sapphire cell
for the temperature and pressure ranges of 275.5K to 292.95 K and 5 MPa to 25 MPa,
respectively. Moreover, the cage occupancies for the gas mixtures in each cavity of
hydrate were evaluated. Second, a new hydrate empirical correlation for predicting
hydrate equilibrium conditions for different gas mixtures containing methane, nitrogen
and carbon dioxide was established for the pressure range of 1.7–450 MPa and
temperature range of 273–320 K for specific gravities of 0.533–1. The results acquired
using the new correlation were compared with the literature data and computational
results from other widely used industrial empirical correlations.
Methodology
5.3.1 Theoretical Model Prediction
The occupancies of the sI hydrate cavities were evaluated based on the fact that at
equilibrium the chemical potential of water in the hydrate phase (𝜇𝑤𝐻) equates to the
chemical potential of water in the liquid phase (µwL ) as per Equation 5-1 below:
µ𝑤H = µw
L 5-1
Therefore, the chemical potential difference of water in the hydrate phase was equal
to the chemical potential difference of water in the liquid phase. Water molecules adopt
the formation of a lattice due to a lowering value of Gibbs free energy, hence the
change in chemical potential from a hypothetical empty hydrate lattice (superscript β)
to an occupied lattice (i.e. hydrate, superscript (H)) can be expressed using Equation
5-2 as:
Page 122
97
∆𝜇𝑤𝐻 = ∆𝜇𝑤
𝐿 = 𝜇𝑤𝐻 − 𝜇𝑤
𝛽= 𝜇𝑤
𝛽− 𝜇𝑤
𝐿 5-2
The fractional occupancy of each hydrate cavity type was calculated based on the
Langmuir adsorption approach. The occupancy of hydrate former ‘i’ in cavity type ‘j’
is a function of the fugacity of ‘i’, fi (evaluated with the Peng-Robinson equation of
state), and the Langmuir constant for a specified i – j combination, Ci,j, as shown in
Equation 5-3:
𝜃𝑖,𝑗 = 𝐶𝑖,𝑗𝑓𝑖
1 + ∑ 𝐶𝑖,𝑗𝑓𝑖𝑖
5-3
Using the Lennard-Jones-Devonshire cell potential theory, a relationship describing
Ci,j in terms of the cell potential, ω(r), Equation 5-4 was put forward by van der Waals
and Platteeuw (van der Waals and Platteeuw 1959):
𝐶𝑖,𝑗 = 4𝜋
𝑘𝑇∫ exp (
𝜔(𝑟)
𝑘𝑇) 𝑟2𝑑𝑟
𝑅
0
5-4
The Lennard-Jones-Devonshire theory takes the average of the potential between the
solute (i.e. hydrate former) and the water. It also considers the coordination of the
solute to water molecules for a particular cavity type, zj, which is 20 for the small 512
cavities and 24 for the large 51262 cavity (Sloan and Koh 2008). Parameters k and T
represent the Boltzmann constant and temperature, respectively. The cell potential is
given according to Equation 5-5 and Equation 5-6:
𝜔(𝑟) = 2𝑧𝑗𝑒 [𝜎12
𝑅𝑗11𝑟
(𝛿10 +𝑎
𝑅𝑗𝛿11) −
𝜎6
𝑅𝑗5𝑟
(𝛿4 +𝑎
𝑅𝑗𝛿5)]
5-5
Page 123
98
𝛿𝑁 = 1
𝑁[(1 −
𝑟
𝑅𝑗 −
𝑎
𝑅𝑗)
−𝑁
− (1 + 𝑟
𝑅𝑗 −
𝑎
𝑅𝑗)
−𝑁
]
5-6
Cell potential is a function of the distance, r, between the guest molecule and the centre
of the cavity. The constants a, e and σ are experimentally fitted parameters, or Kihara
parameters, that are unique for every hydrate former and Rj is the radius of the cavity
‘j’. Values of 3.95 and 4.33 Å are used for the small and large cavities, respectively
(Lederhos et al. 1993). The remaining parameter values used in the present study are
given in Table 5-1 (Erickson 1983).
The change in the chemical potential of water from an unoccupied water lattice to a
hydrate structure can be used with the previous equations to calculate occupancies at
the experimentally determined equilibrium conditions. This chemical potential change
is given by Equation 5-7:
∆𝜇𝑤𝐻 = 𝜇𝑤
𝐻 − 𝜇𝑤𝛽
= 𝑅𝑇 ∑ 𝑣𝑗 𝑙𝑛 (1 − ∑ 𝜃𝑖,𝑗𝑖 )𝑗 5-7
where, 𝑣𝑗 is the number of ‘j’ cavities per water molecule (𝑣𝑗 = 1/23 and 𝑣𝑗 = 3/23 for
small cavities and large cavities, respectively) (Sloan and Koh 2008). Experimentally
determined estimates of ∆𝜇𝑤𝐻 have previously been suggested. A value of -1264 J/mol
provided by Erickson (1983) has been applied in the present study, permitting the
evaluation of methane and carbon dioxide occupancies.
Table 5-1 Kihara potential parameters
Guest a, Å σ, Å e/k, K
CH4 0.3834 3.14393 155.593
CO2 0.6805 2.97638 175.405
N2 0.3526 3.13512 127.426
Page 124
99
5.3.2 Empirical Correlation Prediction
Several methods have been proposed to predict hydrate equilibrium conditions.
Historically, the K-value method was the first one used for predicting the hydrate
formation conditions depending on using empirically estimated equilibrium constants
(Carson and Katz 1942). Subsequently, Katz (1945) proposed the gas gravity method
by generating charts relating the hydrate pressure and temperature to gas gravity
defined as the molecular weight. This method represents a simple tool for predicting
the gas hydrate conditions but has a limitation that methane is the primary gas with
respect to other gases in the mixture (such as ethane, propane and butane). Later, the
regression analysis method was employed by many researchers to correlate the hydrate
equilibrium conditions as a function of gas gravity. Some of the correlations based on
this method are Hammerschmidt (1936), Berge (1986), Motiee (1991) and Salufu and
Nwakwo (2013).
The gas gravity method has been widely used in the gas processing industry as a simple
tool for the initial estimation of the hydrate equilibrium conditions. This method was
established as a chart that related the hydrate formation temperature and pressure with
the gas mixtures specific gravity. The main limitation of this method is that the gas
mixture mainly consists of methane, which results in a 50% error in the calculated
hydrate conditions (Elgibaly and Elkamel 1998). This error was generated because the
method predicts using the same hydrate conditions for different gas mixtures having
equal specific gravities. In this context, various hydrate correlations have been
proposed to predict the hydrate conditions for gas mixtures as a function of the specific
gravity. In the present study, a comparison was conducted with some of the available
correlations of the gas gravity method. Hammerschmidt (1936) proposed a simple
relation for estimating the initial hydrate temperature as follows in Equation 5-8:
𝑇 = 8.9 × 𝑃0.285 5-8
This correlation was developed for pressures less than 2000 psi (13.7 MPa) and a
temperature less than 60 °F (288.7 K).
Page 125
100
Motiee (1991) developed Equation 5-9, which contains six parameters using a
regression method and correlated hydrate temperature, pressure and specific gravity:
𝑇 = −124951 + 48.98387 × 𝑙𝑜𝑔(𝑃) + 2.66303 × (𝑙𝑜𝑔 (𝑃))2 + 176.9101
× 𝑆𝑔 ± 75.5873 × 𝑆𝑔2 ± 10.45 𝑆𝑔 × 𝑙𝑜𝑔(𝑃)
5-9
Motiee’s (1991) correlation has a limitation in that it is not applicable to gas mixtures
containing non-hydrocarbon gases.
Salufu and Nwakwo (2013) proposed a correlation that required pressure and specific
gravity to predict the hydrate equilibrium temperature as defined in Equation 5-10:
𝑇 = 𝐴[𝑙𝑛 𝑃 − 𝑙𝑛(𝐵 × 𝑆𝑔)] 5-10
where, 𝑃 , 𝑇 and 𝑆𝑔 are the pressure in psi, the temperature in °F and the specific
gravity of gas mixture, respectively, while A and B are the Salufu correlation constants
given as follow:
A = 10.9529 and B = 2.4196 for the specific gravity range of 0.85–1
A = 12.1212 and B = 8.7511 for the specific gravity range of 0.6–0.84
A = 16.2602 and B = 105.358 for the specific gravity range of 0.1–0.559
In the new correlation, the hydrate temperature was correlated as a function of pressure
and gas specific gravity (i.e. the temperature was a dependent variable whereas the
pressure and specific gravity were independent variables). A simple mathematical
formula was proposed as shown in Equation 5-11:
𝑇 = 𝑎1 × 𝑃𝑎2 +𝑎3
𝑎4− 𝑆𝑔− 𝑎5
5-11
Page 126
101
where, T is the calculated temperature in Kelvins, P is the pressure in MPa, 𝑆𝑔 is the
gas specific gravity and 𝑎1-𝑎5 are the correlation coefficients given in Table 5-2. A
total number of 227 experimental data points for different gas mixtures containing
methane, carbon dioxide and nitrogen were collected from the literature as shown in
Table 5-3 to develop the correlation. The nonlinear regression technique was applied
to provide a strong relationship for correlating the hydrate equilibrium temperature to
the equilibrium pressure and gas specific gravity. First, out of the collected
experimental dataset, 142 data points were employed to obtain the fitting parameters
for the correlation as listed in Table 5-2. Then, the remaining 85 data points were used
to check the validity of the new correlation. The hydrate equilibrium temperature given
by Equation 5-11 was correlated for a pressure range of 1.7–330 MPa and temperature
range of 273–320 K and covered gas mixtures containing methane, carbon dioxide and
nitrogen for a specific gravity range of 0.553 to 1.
Table 5-2 Coefficient values of the new correlation, Equation 5-11
Coefficients Values
𝑎1 99.49483
𝑎2 0.069881
𝑎3 7271.546
𝑎4 38.76813
𝑎5 22.02004
Page 127
102
Table 5-3 Experimental data collected from the literature used to construct the
new correlation
Source Temperature
range, K
Pressure
range, MPa
Specific
gravity
range
No. of
data
points
Unruh and Katz (1949) 277–281 2.84–5.1 0.621–0.88 6
Jhaveri and Robinson
(1965) 273.2–295.2 2.65–34.33 0.553–0.85 35
Adisasmito et al. (1991) 273.7–287.6 1.81–10.95 0.63–0.987 29
Dholabhai and Bishnoi
(1994) 274.1–284.84 2.36–7.53 0.74688 4
Mei et al. (1996) 273.7–285.3 2.99–10.1 0.5975 8
Servio et al. (1999) 274–278.26 2.315–3.4 0.7468 4
Nakano et al. (1999) 305.9–320.54 98–330 0.533 16
Seo et al. (2001) 273.1–281.46 2–5 0.75–0.96 12
Seo and Lee (2001) 274.36–282.6 2–5 0.746 3
Beltrán and Servio (2008b) 279.2–285.34 3.24–7.47 0.7468 3
Belandria et al. (2010) 279.1–284.2 3.6–5.29 0.81–0.815 4
Belandria et al. (2011) 277.9–285.5 4.03–8.27 0.75–1 6
Herri et al. (2011) 273.4–286.4 2.68–10.27 0.553–0.9 13
Lee et al. (2012) 274–278 1.71–4.24 0.553–1 11
Le Quang et al. (2016) 275.35–282.1 2.91–5.6 0.77–0.785 13
Sadeq et al. (2017) 276.8–293.95 5–25 0.553–0.75 53
Kastanidis et al. (2017) 274.3–278.7 2.63–4.01 0.7991 7
Page 128
103
Results and Discussion
5.4.1 Theoretical Model Prediction
Fractional occupancies were calculated for CO2 + CH4 mixtures (Table 5-4), N2 + CH4
mixtures (Table 5-5) and N2 + CO2 mixtures (Table 5-6) for each cavity using Equation
5-3. Table 5-4 shows that the guest/cavity size ratio for methane in the small cavity
was 0.867 and was 0.744 in the large cavity. For carbon dioxide, the ratios were1.018
and 0.874 for the small and large cavities, respectively (Lederhos et al. 1993). Given
that the carbon dioxide guest size exceeds that of the small cavity, carbon dioxide
adsorption is unlikely to occur. However, previous studies have shown that carbon
dioxide occupation of the small cavity can occur with pure carbon dioxide gas
(Ripmeester and Ratcliffe 1998, Circone et al. 2003). Methane has a far greater
propensity towards the cavity due to its optimal guest/cavity ratio and its concentration
far exceeds the carbon dioxide concentration in all gas mixtures. Methane was
therefore assumed to dominate the occupation of small cavities; hence, the occupation
of carbon dioxide was negated.
An interesting observation was the greater overall occupation of large cavities. This
was particularly noticeable at lower pressures. Methane and carbon dioxide were both
capable of stabilising the large cavity, as evidenced by their guest/cavity ratios,
although carbon dioxide offered greater stability. It makes sense that with two capable
guests for the large cavity compared to one for the small cavity, θi,l would be greater
than θi,s. Methane has been shown to occupy the large cavity to a greater extent in the
absence of carbon dioxide (Lee et al. 2013). It is likely that due to the relatively higher
number of large cavities in sI hydrates (6 to 2 in a unit cell), methane will prefer the
large cage. With more possible sites for methane guests to fill relative to small cages,
a higher methane occupancy of large cages than small cages will result in greater free
energy changes and therefore greater lattice stabilisation.
Results also demonstrated an increase in θi,j for both sI cavities with pressure, which
is in accordance with Equation 5-3. The filling of small cavities decreased with
increased carbon dioxide concentration due to the accompanying reduction in methane
partial pressure (and fugacity). Similarly, carbon dioxide filling of large cavities
increased with CO2 concentration and the small cavity occupation by methane
decreased to a minor extent. Likewise, the extent of large cavity occupation by carbon
Page 129
104
dioxide increased drastically and appeared to be proportional to CO2 concentration.
This increase ultimately reduced the filling of large cavities by methane. Greater
inclusion of carbon dioxide in the lattice stabilises the hydrate structure because CO2-
water interactions are stronger than CH4-water interactions in the large cage (Sloan
and Koh 2008). Therefore, the increase in θCO2,l promoted hydrate equilibrium
conditions.
For N2 + CH4 hydrates, the cage occupancy ratio of CH4, 𝜃𝑙/𝜃𝑠 was greater than 1,
which indicated that the small cages were less occupied than the large cages. CH4
molecules occupy the large and small cavities of sI (Sum et al. 1997), whereas N2
molecules prefer to occupy the small cages (Seo and Lee 2004). Thus, the methane
molecules mainly occupy large cages and compete with nitrogen molecules for the
best occupancy of small cages. The results also indicated that the occupancy of
methane in both large and small cavities, 𝜃CH4,𝑙 and 𝜃CH4,𝑠, respectively, decreased
with increased N2 concentration in the mixture. This reduction caused an increase in
N2 occupancy and explained the dilution effect of nitrogen. For N2 + CO2, the nitrogen
filling of small cavities increased drastically with N2 concentration, which decreased
CO2 occupation of small cavities. This might explain the structural transformation
phenomenon of mixed N2 + CO2 hydrates, which will be discussed later on.
Furthermore, the results also demonstrated an increase in the occupancy for both the
small and large cavities of N2 + CH4 and N2 + CO2 hydrates with pressure, which is in
accordance with Equation 5-3.
The comparison of the experimental data presented in chapter 4 and the model
calculations for various CO2 + CH4, N2 + CH4 and N2 + CO2 hydrates are illustrated in
Figure 5-1, Figure 5-2 and Figure 5-3, respectively. Figure 5-1 shows that the model
results using the Kihara parameters were in good agreement with the experimental
results at low to mid pressures. However, at higher pressures, the experimental
equilibrium points were noticeably further to the right (higher temperature). This
discrepancy could potentially be a consequence of the assumption that CO2 does not
occupy small cages. Therefore, results indicated that the model was accurate at lower
pressures (<10 MPa), while it had considerable deviation at extreme high pressures
where CO2 has the propensity (however small) to occupy the large cavities of sI.
Page 130
105
Figure 5-2 and Figure 5-3 shows that the modelling results are in good agreement with
the experimental data for N2 + CH4 hydrates and 64 mol% N2 + 36 mol% CO2.
However, the experimental equilibrium points were not consistent with the modelling
results. This variation could possibly be due to the structural conversion of sI/sII.
Nitrogen, as the smallest hydrate former, can stabilise small cavities of sII, while
carbon dioxide is well known to form sI (Kang et al. 2001). Literature studies revealed
that the structure of N2 + CO2 hydrates could either be of sI or sII depending on the
amount of nitrogen and carbon dioxide filled in the small and large cavities (Kang and
Lee 2000). Therefore, the structural transition possibly occurs for the mixed N2 + CO2
hydrates. Further investigations with direct observations using appropriate techniques
such as NMR and X-ray diffraction is recommended to study the potential structure
transition of N2 + CO2 hydrates.
Page 131
106
Table 5-4 Cage occupancy calculations for CO2 + CH4 mixtures in small and large
cavities
CO2
(mol%)
P
(MPa) θCH₄,l θCH₄,s θCO2,l θi,s θi,l
10
5.0 0.8468 0.8322 0.1288 0.8468 0.9611
7.5 0.8924 0.8437 0.1300 0.8924 0.9737
10 0.9172 0.8498 0.1303 0.9172 0.9802
15 0.9434 0.8564 0.1303 0.9434 0.9867
20 0.9573 0.8604 0.1297 0.9573 0.9901
25 0.9659 0.8628 0.1293 0.9659 0.9921
16
5.0 0.8376 0.7605 0.2014 0.8376 0.9619
7.5 0.8855 0.7712 0.2030 0.8855 0.9742
10 0.9118 0.7771 0.2035 0.9118 0.9806
15 0.9396 0.7831 0.2039 0.9396 0.9870
20 0.9545 0.7874 0.2029 0.9545 0.9903
25 0.9636 0.7908 0.2015 0.9636 0.9923
20
5.0 0.8306 0.7144 0.2479 0.8306 0.9623
7.5 0.8806 0.7241 0.2505 0.8806 0.9746
10 0.9077 0.7300 0.2508 0.9077 0.9808
15 0.9368 0.7362 0.2509 0.9368 0.9872
20 0.9523 0.7409 0.2495 0.9523 0.9904
25 0.9619 0.7446 0.2478 0.9619 0.9924
Subscripts ‘s’ and ‘l’ refer to small and large cavities, respectively.
Subscripts ‘CH4’ and ‘CO2’ refer to methane and carbon dioxide, respectively.
Page 132
107
Table 5-5 Cage occupancy calculations for N2 + CH4 mixtures in small and large
cavities
N2
(mol%)
P
(MPa) θCH₄,s θCH₄,l θN₂,s θN₂,l θi,s θi,l
10
5 0.8272 0.8626 0.0855 0.0603 0.9127 0.9229
7.5 0.8327 0.8705 0.0930 0.0656 0.9258 0.9361
10 0.8356 0.8748 0.0996 0.0702 0.9352 0.9450
15 0.8337 0.8758 0.1120 0.0790 0.9457 0.9548
20 0.8319 0.8759 0.1214 0.0857 0.9533 0.9616
25 0.8290 0.8747 0.1294 0.0914 0.9584 0.9661
20
7.5 0.7432 0.8013 0.1843 0.1341 0.9276 0.9354
10 0.7410 0.8017 0.1953 0.1423 0.9363 0.9440
15 0.7326 0.7974 0.2151 0.1573 0.9477 0.9548
20 0.7238 0.7918 0.2314 0.1698 0.9552 0.9616
25 0.7178 0.7878 0.2437 0.1792 0.9614 0.9670
31
5 0.6505 0.7210 0.2664 0.2000 0.9168 0.921
7.5 0.6458 0.7208 0.2832 0.2134 0.9290 0.9342
10 0.6401 0.7182 0.2979 0.2252 0.9380 0.9433
15 0.6271 0.7094 0.3222 0.2449 0.9493 0.9543
20 0.6158 0.7009 0.3414 0.2607 0.9572 0.9616
25 0.6072 0.6943 0.3558 0.2727 0.9630 0.9670
36
5 0.6072 0.6836 0.3100 0.2364 0.9172 0.9200
7.5 0.6032 0.6837 0.3290 0.2520 0.9322 0.9357
10 0.5971 0.6805 0.3439 0.2643 0.9411 0.9447
15 0.5825 0.6698 0.3698 0.2860 0.9523 0.9559
20 0.5696 0.6596 0.3895 0.3029 0.9591 0.9625
25 0.5590 0.6509 0.4057 0.3169 0.9647 0.9678
Subscripts ‘s’ and ‘l’ refer to small and large cavities, respectively.
Subscripts ‘CH₄’ and ‘N2’ refer to methane and nitrogen, respectively.
Page 133
108
Table 5-6 Cage occupancy calculations for N2 + CO2 mixtures in small and
large cavities
N2
(mol%)
P
(MPa) θCO₂,s θCO₂,l θN₂, s θN₂,l θi,s θi,l
64
5 0.2458 0.9042 0.6447 0.0780 0.8996 0.9822
7.5 0.2335 0.8956 0.6881 0.0897 0.9216 0.9852
10 0.2121 0.8846 0.7227 0.1022 0.9348 0.9868
15 0.1751 0.8597 0.7758 0.1287 0.9509 0.9885
20 0.1492 0.8361 0.8111 0.1533 0.9603 0.9894
74
5 0.1864 0.8640 0.7230 0.1147 0.9094 0.9787
7.5 0.1695 0.8522 0.7588 0.1299 0.9283 0.9821
10 0.1549 0.8396 0.7849 0.1444 0.9398 0.9840
15 0.1298 0.8118 0.8245 0.1745 0.9543 0.9863
20 0.1125 0.7867 0.8507 0.2010 0.9632 0.9877
Subscripts ‘s’ and ‘l’ refer to small and large cavities, respectively.
Subscripts ‘N2’ and ‘CO2’ refer to nitrogen and carbon dioxide, respectively.
Page 134
109
Figure 5-1 Comparison of experimental methane – carbon dioxide hydrate
dissociation points with model data. Numbers indicate CO2 mole percentage in
the mixture. Average relative deviations between the experimental data and the
model results are 0.21%, 0.18% and 0.13% for the 10% CO2 + 90% CH4, 16%
CO2 + 84% CH4 and 20% CO2 + 80% CH4 gas mixtures, respectively
Page 135
110
Figure 5-2 Comparison of experimental N2 + CH4 hydrates with model
predictions. Numbers indicate N2 mole percentage in the mixture. Average
relative deviations between the experimental data and the model results are
0.087%, 0.054%, 0.15% and 0.12% for the 10% N2 + 90% CH4, 20% N2 + 80%
CH4, 31% N2 + 69% CH4 and 36% N2 + 64% CH4 gas mixtures, respectively
0
2
4
6
8
10
12
14
16
18
20
22
24
26
275 280 285 290 295
Pre
ssu
re (
MP
a)
Temperature (K)
Model 10% N₂
Model 20% N₂
Model 31% N₂
Model 36% N₂
Exp. 10% N₂
Exp. 20% N₂
Exp. 31% N₂
Exp. 36% N₂
Page 136
111
Figure 5-3 Comparison of experimental N2 + CO2 hydrates with model
predictions. Numbers indicate N2 mole percentage in the mixture. Average
relative deviations between the experimental data and the model results are
0.07% and 0.58% for the 36% CO2 + 64% N2 and 26% CO2 + 74% N2,
respectively
5.4.2 Empirical model prediction
The performance and accuracy of the new correlation, Equation 5-11, were checked
by applying the statistical error analysis to 85 data points that were not used in the
correlation development. Statistical parameters of the new correlation, including
average deviation, average absolute deviation, standard deviation, average absolute
percentage error, root mean square errors and correlation coefficient (𝑅2) are
0
5
10
15
20
25
274 276 278 280 282 284 286
Pre
ssu
re (
MP
a)
Temperature (K)
Model 64% N₂
Model 74% N₂
Exp. 64% N₂
Exp. 74% N₂
Page 137
112
calculated. These statistical parameters are defined in Equations 5-12 to 5-18 as
follows:
𝐴𝐷 =1
𝑛 ∑(𝑇𝐸𝑋𝑃(𝑖)
𝑛
𝑖=1
− 𝑇𝐶𝑎𝑙(𝑖)) 5-12
𝐴𝐴𝐷 =1
𝑛 ∑|𝑇𝐸𝑋𝑃(𝑖)
𝑛
𝑖=1
− 𝑇𝐶𝑎𝑙(𝑖)| 5-13
𝑆𝐷 = √∑ (𝑥 − 𝑎𝑣𝑔. 𝑥)𝑛
𝑖=1
𝑛
2
5-14
𝑆𝐴𝐴𝑃𝐸 =1
𝑛∑ [|
(𝑇𝑐𝑎𝑙.(𝑖) − 𝑇𝑒𝑥𝑝.(𝑖))
𝑇𝑒𝑥𝑝.(𝑖)× 100|]
𝑖
𝑛=1
5-15
𝑅𝑀𝑆 = √∑ (𝑇𝑐𝑎𝑙.(𝑖) − 𝑇𝑒𝑥𝑝.(𝑖))2𝑛
𝑖=1
𝑛
2
5-16
𝑅𝑀𝑆 = √∑ (𝑇𝑐𝑎𝑙.(𝑖) − 𝑇𝑒𝑥𝑝.(𝑖))2𝑛
𝑖=1
𝑛
2
5-17
𝑅2 =
[
𝑛 ∑ 𝑇𝑒𝑥𝑝.(𝑖) × 𝑇𝑐𝑎𝑙.(𝑖) − (∑ 𝑇𝑒𝑥𝑝.(𝑖)𝑛𝑖=1 )(∑ 𝑇𝑐𝑎𝑙.(𝑖)
𝑛𝑖=1 )𝑛
𝑖=1
√𝑛 ∑ (𝑇𝑒𝑥𝑝.(𝑖))2
𝑛𝑖=1 − (∑ 𝑇𝑒𝑥𝑝.(𝑖)
𝑛𝑖=1 )
22
× √𝑛∑ (𝑇𝑐𝑎𝑙.(𝑖))2𝑛
𝑖=1 − (∑ 𝑇𝑐𝑎𝑙.(𝑖)𝑛𝑖=1 )
22
] 2
5-18
Page 138
113
where, n is the number of points in the dataset, 𝑇𝑐𝑎𝑙. is the calculated hydrate
equilibrium temperature, 𝑇𝑒𝑥𝑝. is the experimental hydrate equilibrium temperature
and 𝑥 is defined as | (𝑇𝑐𝑎𝑙.(𝑖)−𝑇𝑒𝑥𝑝.(𝑖))
𝑇𝑒𝑥𝑝.(𝑖)× 100| .
The correlation results were also compared with the experimental data and with the
predictions calculated by Hammerschmidt (1936), Motiee (1991), and Salufu (2013).
Table 5-7 shows statistical parameters of the proposed correlation compared with the
other correlations. According to Table 5-7, the new correlation had the highest value
of squared correlation coefficient (R2 = 0.9978) and lowest absolute percentage error
(0.2183) compared to the other correlations. In addition, the new correlation showed a
standard deviation and root mean square errors less than 1, which indicates the ability
of the new correlation to predict the hydrate equilibrium temperature correctly for the
assumed range of conditions. In addition, Table 5-7 shows that the Hammerschmidt
correlation had lower performance (highest statistical parameters) than that of the other
correlations.
The accuracy of the proposed correlation was also checked by comparing the
calculated temperatures with the experimental data shown in Figure 5-4, and our
calculated temperatures were in good agreement with the experimental data for gas
mixtures with a specific gravity in the range of 0.553 to 1. The cross plots shown in
Figure 5-5, compare the measured hydrate equilibrium temperatures with those
calculated by our correlation (a), Hammerschmidt (b), Motiee (c) and Salufu (d). As
demonstrated, an excellent agreement was shown between the measured and
calculated results for our correlation compared with other correlations.
Page 139
114
Table 5-7 Statistical analysis parameters for the new correlation compared with
other correlations
Analysis
parameter This work
Hammerschmidt
(1936)
Motiee
(1991)
Salufu
(2013)
𝐴𝐷 0.0127 -13.1245 -4.7073 -5.3278
𝐴𝐴𝐷 0.6203 13.1245 8.6390 5.4487
𝑆𝐷 0.1381 4.0165 1.1501 1.0296
𝐴𝐴𝑃𝐸 0.2183 4.3963 3.0223 1.9469
𝑅𝑀𝑆 0.7239 18.5168 9.2604 6.1317
𝑅2 0.9978 0.8792 0.8887 0.9783
AD: Average deviation
AAD: Average absolute deviation
SD: Standard deviation
AAPE: Average absolute percentage error
RMS: Root mean square error
R2: Squared correlation coefficient
Page 140
115
Figure 5-4 Comparison of the new correlation results with the experimental data
for gas mixtures with specific gravities (Sg) of 0.553, 0.746, 0.7701, 0.7845, 0.95
and 1
0
100
200
300
400
500
260 280 300 320 340
Pre
ssu
re,
MP
a
Temperature, K
Experimental T
Calculated T
Sg= 0.5530
1
2
3
4
5
6
270 275 280 285
Pre
ssu
re,
MP
a
Temperature, K
Experimental T
Calculated T
Sg=0.746
0
1
2
3
4
5
6
276 278 280 282
Pre
ssu
re,M
pa
Temprerature, K
Experimental T
Calculated T
Sg= 0.77010
1
2
3
4
5
6
276 278 280 282 284
Pre
ssu
re,
MP
a
Temperature, K
Experimental T
Calculated T
Sg=0.7845
0
2
4
6
8
10
12
270 275 280 285 290
Pre
ssu
re,
MP
a
Temperature, K
Experimental T
Calculated T
Sg= 0.950
1
2
3
4
5
6
7
270 275 280 285
Pre
ssu
re,
MP
a
Temperature, K
Experimental T
Calculated T
Sg=1
Page 141
116
Figure 5-5 Cross plots of the experimental and predicted equilibrium
temperatures calculated by the new correlation (a), Hammerschmidt (b), Motiee
(c) and Salufu (d) correlations
Page 142
117
Conclusions
The gas hydrate equilibrium conditions are of significance in the energy sector and
have extensive applications in industry because of their role either as a potential energy
source or as a threat to flow assurance. Thus, in the present study, we first proposed a
thermodynamic model for gas hydrate equilibrium conditions and cage occupancies
for CO2 + CH4, N2 + CH4 and CO2 + N2, at different compositions. The occupancy
calculations for the CO2 + CH4 hydrate system have shown that CO2 stabilises the sI
hydrate. Results also demonstrated that an increase in CO2 gas composition resulted in
higher CO2 hydrate equilibrium conditions. This confirms and explains the observed
promotion of hydrate equilibrium conditions with increasing CO2 gas composition.
The validity of the proposed model was tested by comparison with the experimental
data. A comparison between the experimental data and the model calculations for
carbon dioxide + methane hydrates shows that the model can acceptably predict the
hydrate equilibria at pressures lower than 10 MPa. For N2 + CH4 and 64 mol% N2 +
36 mol% CO2 hydrate systems, an acceptable agreement was found between the
experimental and model results. However, a considerable deviation was noticed
between the experimental data and model prediction for 74 mol% N2 + 26 mol% CO2
hydrate. Therefore, we investigated a potential structural transformation that occurs
for this mixed hydrate.
Second, a new correlation was developed for accurate prediction of hydrate
equilibrium temperatures for different gas mixtures containing methane, nitrogen and
carbon dioxide. The new correlation was applicable for the temperature range of 273–
320 K, pressure range of 1.7–330 MPa, and for gas mixtures containing methane,
carbon dioxide and nitrogen with specific gravity range of 0.553 to 1. The statistical
parameters showed that the new correlation has an excellent performance compared
with Hammerschmidt, Motiee and Salufu correlations. In addition, the correlation
results showed good agreement with the experimental measurements within the
investigated range. Consequently, the new correlation represents a simple, accurate,
low-cost and direct method for predicting gas hydrate equilibrium conditions in a
system that meets the above operating conditions.
Page 143
118
*Reference: Sadeq et al (2018) in International Journal of Greenhouse Gas Control, 79, 73-82.
Experimental Pore-scale Analysis of Carbon Dioxide
Hydrate in Sandstone via X-Ray Micro-Computed Tomography*
Summary
Carbon dioxide geo-sequestration (CGS) into sediments in the form of (gas) hydrates
is one of the proposed methods for reducing anthropogenic carbon dioxide emissions
to the atmosphere and, thus reducing global warming and climate change. However,
there is a serious lack of understanding as to how such CO2 hydrate forms and exists
in sediments. We thus imaged CO2 hydrate distribution in sandstone, and investigated
the hydrate morphology and cluster characteristics via X-ray micro-computed
tomography (CT) in 3D in-situ. A substantial amount of gas hydrate (~17%
saturation) was observed, and the stochastically distributed hydrate clusters followed
the power-law relations with respect to their size distributions and surface area-volume
relationships. The layer-like hydrate configuration is expected to reduce CO2 mobility
in the reservoir, and the smaller than expected hydrate surface-area/volume ratio would
reduce methane production and CO2 storage capacities. These findings will aid large-
scale implementation of industrial CGS projects via the hydrate route.
Introduction
Carbon dioxide emissions into the atmosphere have increased significantly over the
past decades (IPCC 2005, Pachauri et al. 2014). This is coupled with massive growth
in fossil fuel consumption, where CO2 is also emitted (IEA 2016). Such high CO2
concentrations, however, lead to rising global temperatures (global warming), and thus
climate change (Houghton et al. 2001). Indeed, CO2 contributes approximately 60
percent to this global warming (Yang et al. 2008). Decreasing the level of CO2
emissions is thus crucial for mitigating climate change. One solution suggested for
achieving this is to capture and sequester CO2 in permafrost areas (e.g. Alaska North
Slope; Schoderbek and Boswell 2011), onshore Arctic regions (e.g. Alberta portion,
Page 144
119
Canada; Cote and Wright 2010; Zatsepina et al. 2014) and deep ocean environments
(White et al. 2003, Yamasaki 2003, Orr 2009). The thermo-physical conditions
prevailing in such marine environments are clearly within the CO2 hydrates stability
zone (Clennell et al. 1999, Tohidi et al. 2010, Park et al. 2014). In addition, as hydrate
formation within the porous medium blocks the pores and causes a reduction in
sediment permeability, and could provide an additional seal by self-sealing (Kvamme
et al. 2007, Tohidi et al. 2010). However, sequestration of CO2 in such environments
will lead to the dissociation of the in-situ natural gas hydrates, thus releasing the
methane inside them. Problematically, methane released into the atmosphere causes
further global warming (hydrate gun hypothesis; Kennett et al. 2003).
At the same time, the demand for energy sources (e.g. for natural gas) is increasing
(Dudley 2013, Al-Fatlawi et al. 2017), which led to the proposal that natural gas
hydrates (the main gas here is methane) can be a potential energy source (Makogon
2010). Thus, the sequestration of CO2 in the form of hydrates may be combined with
methane production via CO2-CH4 replacement in methane hydrate-bearing sediments
(Graue et al. 2008, Ohgaki et al. 1994)
Furthermore, hydrate morphology, distribution and saturation in sediments
significantly affect seismic velocities (compressional and shear velocities) and petro-
physical properties (such as permeability, electrical conductivity, and shear strength;
Waite et al. 2009). Thus, gas hydrate exploration and monitoring depend on the
distribution and morphology of the hydrates in the pore space (Dai, Banik, et al. 2008,
Dai, Snyder, et al. 2008) and multiple pore-scale models (free floating, cementing
sediments and contacting but not cementing sediments; (Helgerud et al. 1999, Jones et
al. 2007)) have been hypothesized to correlate the hydrate distribution with seismic
velocities.
Consequently, pore-scale characterisation of hydrates in their host sediments is
essential for exploration, monitoring and implementation of hydrate-CGS and hydrate
exploitation as an energy source. However, experimental data for CO2-hydrate
formation and existence in sediments is limited despite their vital importance (Tohidi
et al. 2010, Ta et al. 2015) and most of the previous studies, imaged hydrate formation
in unconsolidated sediments. Thus, we thus imaged CO2 hydrate formation and
Page 145
120
dissociation via X-ray (CT) at high resolution in 3D in-situ and analysed the
corresponding hydrate microstructures.
Experimental Methodology
6.3.1 Materials and Experimental Set-up
A small cylindrical Bentheimer sandstone plug (5 mm in diameter and 15 mm in
length) was drilled and used in these experiments. Bentheimer is a clean, homogeneous
sandstone consisting mainly of quartz (99 wt%) with high permeability and porosity
(Rahman et al. 2016). Porosity and permeability of 22.1% and 2370 mD, respectively,
were measured precisely with a nitrogen permeameter-porosimeter (AP-608 with
accuracy ±0.1%) on a sister plug drilled from the same block. Carbon dioxide (purity
99.9 mol%, supplied by BOC Australia) was used as a hydrate-forming gas. Sodium
iodine brine solution was prepared by mixing 6% by weight of NaI into deionised
water; this brine was used as the aqueous phase (note that iodide is needed to ensure
sufficient X-ray contrast (Lusic and Grinstaff 2012)), see below. A high-pressure X-
ray transparent vessel (Iglauer et al. 2011, Rahman et al. 2016, Lebedev et al. 2017,
Iglauer and Lebedev 2017) was used as a core holder for hydrate formation and X-ray
CT imaging. The small Bentheimer plug was mounted inside the core holder, and the
core holder was connected to the hydrate formation setup as shown in Figure 6-1. In
addition to the high-pressure (core-holder) flow cell, the setup consisted of three high
precision syringe pumps (ISCO 500D with an accuracy of 0.1%); the first two pumps
were used for CO2 and brine injection, respectively, and the third pump provided
confining pressure by compressing the deionised water. A thermocouple was installed
in the flow cell to monitor the temperature during the hydrate formation process with
a precision of ± 0.5 K. The cooling temperatures required for hydrate formation were
achieved by circulating an antifreeze liquid containing ethylene glycol via a thermo-
refrigerated bath (Alpha RA8, Lauda, Germany). A high-resolution CT scanner
(Xradia VersaXRM) was then used to image the core plug in 3D at a high resolution
of (3.43 μm)3. μCT is an efficient and nondestructive method that is commonly used
to investigate the pore-scale structure of rock samples (Blunt et al. 2013, Cnudde and
Boone 2013, Wildenschild and Sheppard 2013, Iglauer and Lebedev 2017).
Page 146
121
Thermocouple
Refrigerator
Cooling
Bath
Sandstone Core
Sample
Pressure Cell
Confining pressure LineCO2 Injection
Line
Confining Pressure Pump
CO2 Injection Pump
Brine Injection Pump
Brine Injection Line
To Vacuum Pump
Figure 6-1 Experimental apparatus used for forming CO2 hydrate in a
Bentheimer sandstone plug (at 3 MPa and 274 K)
Page 147
122
6.3.2 Experimental Procedure
Initially, the flow cell and flow lines were vacuumed for 24 h to remove any air from
the system, and the confining pressure and pore pressure were increased to 8 MPa and
3 MPa, respectively. The sample was then completely saturated with doped brine (6
wt% NaI in deionised water) by injecting more than 1000 pore volumes (PV) of brine.
Subsequently, 50 PV of CO2 gas was injected into the core at the same pressure
conditions at a flow rate of 0.1 mL/min (capillary number = 5 × 10⁻⁶) to obtain a
partially (brine) saturated porous medium. These steps were performed at an ambient
laboratory temperature (294 K). Hydrate formation was then started by decreasing the
temperature to 274 K (1 °C; which is below the CO2 hydrate equilibrium temperature;
note that the CO2-hydrate formation temperature in sediments is ~ 8 °C at 3 MPa)
(Yang et al. 2012). Cooling was achieved by circulating the coolant continuously
through a copper coil wrapped around the core holder. Because the CO2 injection pump
was set to maintain a constant pressure of 3 MPa, gas consumption in the injection
pump over time indicated hydrate formation (Sloan and Koh 2008). Hydrate conditions
(3 MPa pore pressure and 274 K) were maintained for 48 h to let the hydrate nucleate
and grow inside the sample. Thus, the entire hydrate formation process was considered
complete when no further gas was injected into the system (from the injection pump
reservoir). The core holder was then placed inside the μCT scanner and an image of
the hydrate-bearing core was acquired at a high resolution of (3.43 μm)3.
The core holder with the core sample was then left in the scanner for 24 h at room
temperature (294 K), and the plug was again imaged μCT by imaged at the same high
resolution of (3.43 μm)3, i.e. after hydrate dissociation. All CT images were filtered
with a 3D non-local mean algorithm (Buades et al. 2005, Buades et al. 2008) and
segmented with a watershed algorithm (Schlüter et al. 2014) for subsequent analysis.
Results and Discussion
6.4.1 Visualisation and Morphology of CO2 Hydrate
The CO2 hydrate formed inside the Bentheimer plug is visualised in Figure 6-2,
Page 148
123
Figure 6-2 Raw (top) and segmented (bottom) 2D slices through the CO2 hydrate-
bearing core (3 MPa, 274K) . In the raw images, CO2 is black while hydrate is
dark grey, brine is slightly lighter grey, and sandstone is light grey. In the
segmented images, grain particles are dark grey, hydrates are white, brine is blue,
and CO2 gas is yellow
Page 149
124
1 mm
1 mm
1 mm
1 mm
1 mm
1 mm
(a) (d)
(b) (e)
(c) (f)
Figure 6-3 Raw (a,d), filtered (b,e) and segmented (c,f) 2D slices through the
hydrate-bearing core (a-c) and the core after hydrate dissociation (d-f). In the
segmented images, grain particles are dark grey, hydrates clusters are white,
brine is blue, and CO2 gas is yellow
Page 150
125
Hydrate-bearing sandstone
Brine
CO2 Gas
Hydrate
(a)
(b)
(c)
(d)
(e)
1 mm
1 mm
1 mm
1 mm
1 mm
Sandstone after hydrate dissociation
Figure 6-4 Three-dimensional segmented images showing each phase. The left-
hand side shows the phases for the hydrate-bearing sample (3 MPa, 274K), while
the right side shows the phases after hydrate dissociation (3 MPa, 294K). Blue is
brine; yellow is CO2 gas and grey is CO2-hydrate
Page 151
126
The CT images thus provide information about the distribution of various sample
components. Precisely, four components (grains, brine, CO2 gas, and hydrate), each
with a different gray scale value, can be determined from the images. The different
grey scales correlate with the X-ray mass attenuation coefficient μx, which is
proportional to a product of the bulk density b, the effective atomic number Z (i.e. the
chemical composition) and the beam energy E (which is kept constant here at 90 keV);
µ𝑥 𝑏(a + b × 𝑍3.8 𝐸3.2⁄ ), where a is the Klein-Nishina coefficient and, b is a
constant (Vinegar and Wellington 1987, Van Geet et al. 2000, Jin et al. 2004, Sato et
al. 2005). Different materials thus produce a contrast in X-ray attenuation and a
distinctly different grey scale in the image. Black/dark grey regions indicate low X-
ray attenuation while the light regions identify high attenuation. The bulk densities of
the four components are as follows: grain density (quartz)= 2.65 g/cm3 (Johnson and
Olhoeft 1984), NaI brine (6 wt %) density= 1.04 g/cm3, CO2 gas density at 3 MPa and
1°C = 0.0766 g/cm3 (Scalabrin et al. 2006) and CO2 hydrate density = 1.1 g/cm3 (Aya
et al. 1997). Thus, the grains have a higher attenuation value and a lighter color in the
CT image, whereas the CO2 gas with a lower attenuation is black. Hydrate and brine
have greyscales in between, i.e. hydrate is dark grey and brine is slightly lighter
because of the Kα-edge absorption of the iodine dissolved in the brine (doping agent),
which is consistent with observations made for methane-hydrate (Sato et al. 2005, Jin
et al. 2006).
We can thus distinctly differentiate CO2 hydrates, CO2 gas and brine in the pores, and
thus determine their distribution and morphology. At the image (mm)scale, a random
spatial hydrate distribution within the pore space was observed, which is consistent
with natural hydrate occurrence in sands and glass beads (Dai et al. 2012, Kerkar et al.
2014). However, at pore (μm) scale, CO2 hydrate resided mainly in the pore body of
the sandstone, and it did not contact the grain surface. This is consistent with the free-
floating model (Zhao et al. 2014, Zhao, Yang, et al. 2015). Instead, a layer of free brine
was observed between the grain surface and hydrate as shown in Figure 6-2. This
observation is consistent with the behaviour of carbon dioxide hydrate in etched glass
micromodels (Tohidi et al. 2001), xenon hydrates in quartz sand and glass beads
(Chaouachi et al. 2015), and molecular dynamics computations for methane hydrates
in the presence of silica (Bagherzadeh et al. 2012). The presence of a brine film coating
the grain surface indicates that the brine is the wetting phase (Iglauer 2017), although
Page 152
127
hydrate migration to the grain surface may be kinetically inhibited. In addition, CO2
hydrate formation occurred at the brine-CO2 interface, indicating preferential hydrate
nucleation and growth at the water-gas interface, as observed for CO2- and methane-
hydrate formation within a 2D porous silicon micromodel (Hauge et al. 2016,
Almenningen et al. 2017) and methane hydrate in sands (Waite et al. 2004, Jin et al.
2012). Furthermore, the free CO2 gas existed mainly in the pore centre which indicates
that CO2 is the non-wetting phase (Iglauer et al. 2015). Thus, the CO2 hydrate did not
completely plug the pores due to the existence of a wetting brine film.
However, hydrates substantially reduce permeability, i.e. hydrate formation obstructs
the flow (Kneafsey et al. 2011, Almenningen et al. 2017). Consequentially, such pore-
centred gas hydrate layers assist in vertical sealing and restrict the upwards CO2 flux
(Kvamme et al. 2007). However, such hydrate layers are also expected to reduce lateral
CO2 spreading in the reservoir, and thus reduce storage capacity. Moreover, CH4
recovery rates (by CH4-CO2 hydrate exchange) are expected to be reduced, although
the brine layers may act as paths for CH4 flow (Kvamme et al. 2007). However,
literature results showed that CH4 recovery could be enhanced using different
strategies such as injection of CO2 + N2 gas mixtures (Hauge et al. 2014), injection of
chemical inhibitors (Hossainpour 2013, Khlebnikov et al. 2016) or CO2 injection at
high initial pressures(Zhao et al. 2012). These strategies would prevent hydrate
formation near the production well, and thus increase storage capacity.
6.4.2 Hydrate Saturation in the Core Sample
Three-dimensional visualisations of each component within the CO2 hydrate-bearing
sample (a-c) and after hydrate dissociation (d and e) are shown in Figure 6-4. We first
measured the porosity of the images by counting the number of pore voxels and
divided them by the total number of voxels (i.e. the bulk volume). This CT porosity
was 21.1%, which is consistent with the 22.1% gas porosity measured pycnometrically
(see above). The slightly higher experimental gas porosity was caused by limited
spatial CT resolution (clay pore space cannot be resolved at 3 μm resolution (Desrues
et al. 2006)). Furthermore, the saturation of each component (volume fraction of each
component in the pore space) was measured on the μCT images (Table 6-1). A
Page 153
128
significant CO2 hydrate saturation (17.8%) was observed, which was localised at the
brine-gas interface and exhibited layer-like morphology (see Figure 6-2)
Table 6-1 Brine, CO2, and hydrate saturations and statistical parameters in the
hydrate-bearing sandstone before and after hydrate dissociation
Component
Saturation (%) τ p
Hydrate
-bearing
plug
After
dissociation
Hydrate
-bearing
plug
After
dissociation
Hydrate-
bearing
Plug
After
dissociation
CO2 59.0 64.2 1.375 1.15 0.764 0.74
Hydrate 17.8 - 1.58 - 0.791 -
Brine 23.2 35.8 - - - -
6.4.3 Gas Hydrate Statistics - Cluster Size Distributions and Surface Area-
Volume Relationships
CO2 hydrate and free gas distributions in the pore space were statistically analysed
before and after hydrate dissociation, (Figure 6-5). Power law relations were observed
for the CO2-gas and CO2-hydrate cluster size distributions (Table 6-1); i.e. N ∝ V-τ,
where N is the number of clusters of size V counted and τ is the fitting exponent. A
large number of small hydrate clusters was observed, which rapidly dropped with
increasing size, and only a few large hydrate clusters were measured. These large
clusters (Figure 6-6), ~ 1.5% of the total hydrate clusters), however, contributed most
to the hydrate saturation and they spanned several pores. Fewer small CO2 gas clusters
were counted, and the largest gas clusters were larger than the largest hydrate clusters
(the largest hydrate cluster had a volume of 205028 μm3, wheareas the largest CO2
cluster size had a volume of 407724 μm3, approximately two times larger). This is
reflected in the smaller values associated with the CO2 gas cluster size distributions.
was 1.375 in the hydrate-bearing sample, and decreased to 1.15 after hydrate
Page 154
129
dissociation. Physically, CO2 was released from the hydrates and coalesced with the
CO2 bubbles, thus increasing their sizes.
Moreover, the surface area (A) of the hydrate and CO2 clusters were measured and
plotted as a function of their volume (V,
Figure 6-7). A power-law relation was again observed (A ∝ V-p, Table 6-1). An
exponent p ~ 0.75 indicates structures less compact than a sphere (p = 2/3), but more
compact than a completely percolation-like ramified structure (where p 1, Stauffer
1979). This implies a smaller surface area/volume ratio for each hydrate cluster than
expected by the percolation theory. Such a smaller ratio has significant implications in
terms of gas recovery via CO2-CH4 exchange and safe storage in hydrate-bearing
sediments; because hydrate dissociation/formation rates are directly proportional to
the cluster surface area (Kwon et al. 2008, Cheng et al. 2013). Smaller surface
area/volume ratios lead to lower dissociation rates during the CO2-CH4 exchange
process, and thus less production and overall lower CO2 storage capacity.
Page 155
130
10-1
10-2
10-3
10-4
10-5
Cluster size (μm3)
103
104 10
5 10
6 10
7
Hydrate, hydrate-bearing sandstone
CO₂, hydrate-bearing sandstone
CO₂, after dissociation
Figure 6-5 CO2 hydrate and CO2 gas clusters size distributions in Bentheimer
sandstone before and after hydrate dissociation
Page 156
131
Figure 6-6 Hydrate clusters, (a) the largest hydrate clusters (size 204080–206590
µm3), (b) medium hydrate clusters (size 5227–7456 µm3) and (c) small hydrate
clusters (size 40.5–121 µm3)
Page 157
132
Figure 6-7 Surface area-volume relationships for (a) CO2 hydrate, (b) CO2 gas
clusters before hydrate dissociation and (c) CO2 gas clusters after hydrate
dissociation in the Bentheimer sample
(b) CO₂, hydrate-bearing
sandstone (a) Hydrate, hydrate-bearing
sandstone
(c) CO₂, after dissociation
Cluster size (µm3) Cluster size (µm3)
Cluster size (µm3)
1 1
1 1
1
1
10 10
10
102 10
2
102
103 10
3
103
104 10
4
104
105 10
5
105
106 10
6
106
107 10
7
107
102 10
2
102
104 10
4
104
106 10
6
106
108 10
8
108
Su
rfa
ce a
rea
(µ
m2)
Su
rfa
ce a
rea
(µ
m2)
Su
rfa
ce a
rea
(µ
m2)
Page 158
133
Conclusions
Detailed understanding of morphology, distribution and occurrence of gas hydrate in
host sediments is crucial for CGS (CO2 is stored as CO2-hydrate), natural gas recovery
from hydrate-bearing sediments by CO2 injection and interpretation of seismic data
(Waite et al. 2004, Graue et al. 2008, Rochelle et al. 2009). However, knowledge is
limited for pore-scale (μm-scale) behaviour of CO2 hydrate in sediments. Therefore,
we imaged the distribution of CO2 hydrates in sandstone via X-ray μCT and studied
the hydrate morphology and cluster size characteristics in 3D at high resolution.
Clearly, CO2 hydrate mainly formed in the pores at the gas-water interface, without
contacting the grain surface, which is consistent with the free-floating model (Zhao et
al. 2014, Zhao, Yang, et al. 2015).
Statistically, the hydrate and CO2 cluster size distributions followed power-law
relations (N ∝ V-τ, where N is the number of clusters of size V counted and τ is the
fitting exponent). A τ value of 1.375 for the hydrate cluster size distribution indicates
that only a few large hydrate clusters were present; decreased to 1.15 after hydrate
dissociation due to CO2 being liberated from the hydrates, which then coalesced with
the existing CO2 bubbles, thus increasing their sizes. A power law relationship (A ∝
V-p) was also observed for the surface area (A)-cluster volume (V) relationship. A p ~
0.75 indicated structures less compact than a sphere, but more compact than
percolation-like ramified structures (Stauffer 1979). This has important implications
for safe storage in hydrate-bearing sediments and gas recovery via CO2-CH4 exchange;
such a lower surface area-volume ratio results in less CH4 production and overall lower
CO2 storage capacity. These results thus add to the fundamental understanding,
planning and execution of industrial CGS projects via the hydrate-disposal route.
Page 159
134 *Sadeq et al. (2018) accepted in the International Journal of Hydrogen Energy.
Ultrasonic Measurements of Hydrate-bearing
Sandstone*
Summary
A potential alternative energy resource to meet energy demands is the vast amount of
gas stored in hydrate reserves. However, major challenges regarding exploration and
production surround profitable and effective exploitation of these reserves. The
measurement of acoustic velocity is a useful method for exploration of gas hydrate
reserves and can be an efficient method to characterise the hydrate-bearing sediments.
In this chapter, the compressional wave velocity (P-wave velocity) of consolidated
sediments (Bentheimer) with and without THF and carbon dioxide hydrate-bearing
pore fillings were measured using the pulse transmission method. The study found that
the P-wave velocities of consolidated sediments increased with increasing hydrate
formation and confining pressure. Of the samples tested, the increase in wave velocity
of the dry and THF hydrate-bearing samples was 27.6 % and 31.9 %, respectively,
while the P-wave velocities increased by 7%–8% after carbon dioxide hydrate
formation in sandstone sample. Interestingly, at the initial stage of hydrate formation,
there was no change in P-wave velocity, which was followed by a steady increase as
the hydrate crystals began to agglomerate and then increased rapidly to a constant
value confirming the test solution had converted to a hydrate solid.
Introduction
The search for cleaner and more abundant alternative energy resources continues as
the world faces scarcity in traditional conventional resources (Ball and Wietschel
2009, Al-Fatlawi et al. 2017). An unconventional resource that has in recent years
gained heightened attention is natural gas production from hydrate reserves (Makogon
et al. 2007, Boswell and Collett 2011). Gas hydrates have gained such popularity
because of the huge amount of trapped gas and the role they could play in global
climate change and the carbon cycle (Dickens 2004, Giavarini and Hester 2011), the
geological hazards surrounding them and the risk of seafloor instability (Dillon et al.
2001, Sultan et al. 2004, Best et al. 2006). The estimated amount of natural gas (mainly
Page 160
135
methane) at standard conditions that is entrapped within hydrate deposits is
approximately 5 × 10¹⁵ m3, which surpasses the conventional resources by at least one
order of magnitude (Meyer 1981, Kvenvolden 1988, Rice 2006, Dawe and Thomas
2007, Sloan and Koh 2008, Konno et al. 2010). Moreover, recently, carbon dioxide
hydrate formation in sediments has received growing attention as it is regarded as a
potential technology for carbon dioxide sequestration and storage in deep ocean
sediments (Yamasaki 2003, White et al. 2003, Orr 2009); thus, reducing carbon
dioxide emissions into the atmosphere. Simultaneously, CO2 hydrate formation within
the sediment pore space could provide an additional seal to natural geological seals by
self-sealing (House et al. 2006, Kvamme et al. 2007, Tohidi et al. 2010)
Natural gas hydrates are non-stoichiometric, ice-like compounds formed when gas
(such as methane, carbon dioxide, nitrogen and ethane) or volatile liquid (such as THF)
molecules are encaged by the strong hydrogen bonds of water molecules (Sloan and
Koh 2008, Carroll 2014, Sadeq, Iglauer, Lebedev, and Barifcani 2018).
Thermodynamically, hydrates usually form and remain stable under favourable
conditions of low temperature and high pressure(Sloan and Koh 2008, Carroll 2014),
and 1 m3 of natural gas hydrates can be stored in approximately 180 m3 of natural gas
(Veluswamy et al. 2014). These conditions are found in the permafrost regions and
offshore marine sediments, which represent the ideal environment for gas hydrate
formation. Typically, gas hydrates occur within the pore space of coarse-grain rocks,
or along fractures in fine-grain rocks (Collett 1999, Schindler and Batzle 2015).
Knowledge of the physical properties of sediments bearing gas hydrates is vitally
important to successfully characterise and commercialise the production of natural gas
from these hydrate deposits. Common geophysical processes such as well logging and
seismic surveying enable quantification of gas hydrate deposits, albeit this requires
further development (Collett and Lee 2012). However, the resulting field
measurements become meaningful after further studies are conducted in the
laboratory, which then allow for interpretation and calibration. Seismic velocities (e.g.
acoustic P-wave velocity) have been widely and effectively employed for detection
and exploration of gas hydrates in their host sediments (Shipley et al. 1979, Prakash et
al. 2010, Spence et al. 2010). Seismic velocities are influenced by the type and amount
of pore filling; therefore, when hydrate forms in the sediments, the acoustic P-wave
velocity increases significantly compared with the velocity of sediments containing
Page 161
136
other pore fillings (Berge et al. 1999, Lee and Collett 2001, Winters et al. 2007). The
compressional wave velocity (P-wave velocity) is considered to be a significant
property, which can provide information about the lithology, distribution and in-situ
conditions of hydrate-bearing sediments (Lee and Collett 2001, Carcione and Gei
2004, Rydzy and Batzle 2010). Furthermore, methane hydrate is the most common gas
hydrate that exists in nature, and thus obtaining gas hydrate samples of it from the field
are rare, because it is technically difficult to obtain and preserve them for laboratory
studies (Yun et al. 2006, Waite et al. 2009), thus laboratory synthesis of hydrate-
bearing samples is significant for acquiring essential knowledge about gas hydrates in
their host sediments. However, it is difficult to synthesize methane hydrate in the
laboratory, as it requires it to be cooled to -78.7 °C to be stabilized at atmospheric
pressure (Sloan and Koh 2008) or it requires higher pressure conditions (Carroll 2014).
In addition, it is difficult to form methane hydrates in aqueous solutions due to its low
solubility in water (Lide and Frederikse 1995). Thus, in this study, we have used THF
as the hydrate former in bentheimer samples due to easy laboratory synthesis. THF is
completely soluble in water (Sloan and Koh 2008) and it is commonly used as a
substitution to form hydrate from methane dissolved in water (Yun et al. 2005)
Moreover, researchers have showed that THF and methane hydrates reveal analogous
mechanical, electrical and thermal characteristics (Lee, Yun, et al. 2007). On the other
hand, THF and methane form different hydrate structures (THF hydrate forms
structure sII, while methane forms structure sI hydrate) (Sloan and Koh 2008).
Additionally, there are small differences in the velocities for both structures compared
with the variation in velocities resulting from the various pore-scale hydrate
distributions (Sloan and Koh 2008)
Previous laboratory studies of ultrasonic measurements of hydrate-bearing sediments
have been conducted on unconsolidated sediments such as sands and glass beads (Yun
et al. 2005, Rydzy and Batzle 2010, Li et al. 2012). To date, limited studies investigate
the effect of hydrate formation on the compressional velocities of consolidated
sediments (e.g. Benthiemer sandstone)
In the present study, the effect of different pore space fillings on measured acoustic
properties of Bentheimer sandstones were studied for a better understanding of the
interaction between hydrates and their host sediments. The experiments were
performed under low-temperature conditions (~ 1 °C) with a confining pressure range
Page 162
137
of 2–20 MPa. THF and carbon dioxide were used as hydrate formers in the
consolidated sediments. The P-wave velocities of different pore fillings such as dry,
brine-saturated, THF brine-saturated, THF hydrate-bearing and CO2 hydrate-bearing
samples were obtained. These measurements can be used to identify the hydrate
occurrence compared to other pore fillings and sediments. Compressional wave
velocity data serve as a good basis for gas hydrate estimation in consolidated sediments
that have not been previously studied. Furthermore, the present provided insight into
the use of acoustic velocity measurements to address the concerns of hydrate formation
in gas production pipelines.
Methodology
7.3.1 Experimental Setup
The schematic of the experimental set-up used for hydrate formation and measurement
of P-wave velocity as a function of confining pressure is presented in Figure 7-1. The
set-up comprises mainly of the following components: high-pressure cell, cooling
system, high-performance liquid chromatography (HPLC) pump for liquid injection,
hand oil pump for applying confining pressure and P-wave recording and measuring
system. The signals were processed, displayed and digitised on a digital oscilloscope
(model DS4022, RIGOL). The high-pressure cell was filled with hydraulic oil and the
core sample was placed inside a rubber sleeve to control the ambient confining
pressure. The pressure cell was submerged in a cooling bath. To allow for temperature
control, the cooling and heating cycles were initiated by circulating coolant liquid
using a controlled temperature liquid circulator (± 0.1 K, model Alpha RA8, LAUDA).
The confining pressure was applied to the sample at a range of 2–20 MPa by a manual
oil pump. Two piezo-electric transducers (1 MHz, A114S, OLYMPUS) were attached
to the cell walls for transmitting and receiving P-wave signals through the samples.
During each experiment, the P-waveforms were generated using the pulser/receiver
(model 5072PR, OLYMPUS). The experimental set-up was the same for both THF
and CO2 hydrate experiments. However, in the CO2 hydrate experiments, three high
precision syringe pumps were included ((ISCO 500D with an accuracy of 0.1%); the
first two pumps were used for CO2 and brine injection and the third pump provided
confining pressure by compressing deionised water (Figure 6-1, chapter 6).
Page 163
138
Figure 7-1 Experimental set-up for hydrate formation in sediments and P-wave
velocity measurements
7.3.2 Materials
The materials utilised in the study are given in Table 7-1. Cylindrical Bentheimer
sandstone samples from Kocurek Industries were used as the experimental porous
medium for hydrate formation. Bentheimer is a homogenous clean sandstone mainly
consisting of quartz with high permeability and average porosity of approximately
22%–25% (Rahman et al. 2016). The gas porosity and permeability of the Bentheimer
samples were measured in the laboratory using a nitrogen automated permeameter-
porosimeter (error of ± 0.1%, model AP-608). The properties of the sample are listed
in Table 7-2. The THF testing solution was prepared from pure THF solution (Sigma-
Aldrich, purity of 99.9 mol%) combined with NaCl (Sigma-Aldrich, purity of 99.5
mol%) as well as deionised water produced in the laboratory (17 MΩ·cm at 23.7 °C).
Page 164
139
Carbon dioxide (purity 99.9 mol%, supplied by BOC Australia) was used as a hydrate-
forming gas in the CO2 hydrate experiment.
Table 7-1. Materials used in the study
Material Purity Supplier
Bentheimer sandstone 99 wt % quartz Kocurek Industries
Tetrahydrofuran (THF) 99.9 mol% Sigma-Aldrich
Carbon dioxide (CO2) 99.9 mol% BOC Australia
Methanol 99.8 mol% Sigma-Aldrich
Sodium chloride (NaCl) >99.5 mol% Sigma-Aldrich
Table 7-2 Properties of the Bentheimer sandstone samples used in the study
Sample B1 B2 B3
Length (cm) 8.1 8.1 8.1
Diameter (cm) 3.8 3.8 3.8
Pore volume (cm3) 22.23 21.90 21.1
Porosity (%) 24.13 23.60 22.1
Permeability (md) 3371 3152 2370
7.3.3 Experimental Procedure
The Bentheimer samples were cleaned using methanol and then dried in an oven for
24 h at 60 °C. The dry samples were then mounted inside a rubber sleeve and tightly
assembled in the high-pressure core holder within the cell. A K-type thermocouple
with a precision of (± 0.5 °C) was attached to the core holder to measure the
temperature during the hydrate formation/dissociation process. The cell was then
placed firmly inside the cooling bath, and the HPLC pump, confining oil pump and
transducers were connected. The entire system was then vacuumed prior to saturating
the sample with a brine solution, to ensure the sample had undergone complete
Page 165
140
saturation. A confining pressure of 10 MPa was applied to the core sample while
several pore volumes of brine were injected into the cell via a tube connected from the
top of the cell. The HPLC pump was then activated to inject the hydrate formers.
In the THF hydrate formation experiment, brine and THF testing solutions were
injected at the desired concentrations at a constant flow rate of 2 mL/min. The
ultrasonic measurements were conducted on dry and brine saturated samples as a
function of confining pressure at room temperature. Several volumes of the
stoichiometric THF testing solution were then injected into the brine saturated sample
to displace the brine and to saturate the sample with THF testing solution. Following
the injection of the solution, the inlet and outlet of the cell were closed so that no
solution could move out of the sample. The hydrate formation process was initiated by
circulation of the coolant liquid from the cooling system. The cell temperature was
gradually decreased to 1 °C.
In the CO2 hydrate formation experiment, after the Bentheimer core sample was
completely saturated with brine, 50 PV of CO2 gas was injected into the core at a pore
pressure of 3 MPa and a flow rate of 0.1 mL/min (capillary number = 5 × 10⁻⁶) to
obtain a partially (brine) saturated porous medium. Hydrate formation was then started
by decreasing the temperature to 274 K (1 °C, which is below the CO2 hydrate
equilibrium temperature; note that the CO2-hydrate formation temperature in
sediments is ~ 8 °C at 3 MPa Yang et al., 2012). More details on CO2 hydrate formation
process and experimental set up were presented in chapter 6.
During the THF and CO2 hydrate formation process, the transmitted P-waves from the
piezo-electric transducers that were attached to the outer wall of the pressure cell were
recorded, and the temperature was maintained at 1 °C. The P-waves travelled through
the cell wall, the confining fluid, the rubber sleeve, the core sample and finally, to the
receiver. An increase in the compressional wave velocities indicated that hydrate
formation had occurred. The system was maintained at these conditions for a further
24 h to allow for complete hydrate formation after which a cycles of confining
pressures (2–20 MPa) were applied, and the P-waves were recorded. The cooling
process was stopped when there was no change in the compressional wave velocities
with time. Later, hydrate dissociation was achieved by gradually heating the cell to
room temperature.
Page 166
141
P-wave velocities were measured via the pulse transmission method (Birch 1960), i.e.
by sending a P-wave signal through the cell and sample material and measuring signal
travel time. Signal waveforms (of the compressional waves) were measured before,
during and after hydrate formation. The core was cooled from 294 K to 274 K by a
circulating cooling bath, and signal waveforms were measured for each 1 K interval.
Subsequently, the temperature was kept constant at 274 K until the compressional
wave velocity stabilised. First arrival times were measured on the waveforms before
and after hydrate formation, and the P-wave velocity was then calculated following
the methodology described by Birch (1960). The P-wave velocities of the core samples
were then calculated using Equation 7-1 from the measured arrival time and the sample
diameter:
𝑉𝑃 =L
t−𝑡𝑑 7-1
Where, VP is the P-wave velocity of the core sample in m/s, L is the diameter of the
core sample in m, t is the total measured travel time in s, and td is the dead travel time
of the pulse through the cell wall and the rubber sleeve in s.
Furthermore, since changes in temperature will influence the elastic properties of the
rubber sleeve, a relationship for td had to be developed to cater for this dependency on
temperature. Thus, td was calibrated as a function of temperature (T) and confining
pressure (Pcon) using an aluminum sample of known P-wave velocity. Figure 7-2
shows td through the cell wall and the rubber sleeve as a function of temperature and
confining pressure. The relationship for td can then be developed through regression
analysis as shown in Equation 7-2 where the R-squared value is 0.9779.
𝑡𝑑 = (−0.0003𝑇 − 0.0128)𝑃𝑐𝑜𝑛 + 0.0661 + 20.35 7-2
Page 167
142
Figure 7-2 Dead time (td) as a function of temperature and confining pressure
Results and Discussions
7.4.1 THF Hydrate Formation in Sandstone
THF was chosen for hydrate formation in the present study due to its simple process
and application in experiments. It also helps to overcome the difficulties surrounding
the use of methane hydrates in the laboratory such as the high pressures and longer
formation times required for hydrate stability. THF is thus used as the hydrate guest
former as a substitution for methane gas as it can form a hydrate out of solution at
ambient pressure and at a temperature of ~3.9 °C (Gough and Davidson 1971, Pearson
et al. 1986, Lee, Yun, et al. 2007, Yun et al. 2007, Strobel et al. 2009, Xue et al. 2012).
In addition, THF is ideally miscible with water and the amount of water in the solution
allows for control of the hydrate concentration (hydrate saturation) in the pore space
(Yun et al. 2005). Thus, a mixture containing THF at a concentration of 15 wt % and
balance being pure water will yield a hydrate saturation of 100% (Yun et al. 2005). In
the present study, the test solution contained 15 wt% THF and 85 wt% brine (81.5 wt%
water and 3.5 wt% NaCl) to yield a hydrate saturation of approximately 80 wt%.
20.0
20.2
20.4
20.6
20.8
21.0
21.2
21.4
21.6
21.8
22.0
1 3 5 7 9 11 13 15 17 19 21 23
Dea
d T
ime,
td
(μs)
Confining Pressure, Pcon (MPa)
T= 25.0 °C
T= 21.0 °C
T= 19.3 °C
T= 15.0 °C
T= 10.5 °C
T= 6.0 °C
T= 1.0 °CT= 0.5 °C
Page 168
143
The P-waveforms produced from a Bentheimer sample containing different pore
fillings is shown in Figure 7-3 where the arrows refer to the arrival times for the
measured P-waves. The travel path of the P-wave was measured with an accuracy of
0.1%. The uncertainty in measurements of wave arrival was thus 0.3%. The resulting
waveforms clearly show a change as the pore fillings vary in content from dry, brine-
saturated, THF brine-saturated, and finally to THF hydrate-bearing. Evidently, the
speed and amplitude of the measured P-wave for the hydrate-bearing sample is the
highest amongst the other samples and pore fillings.
Figure 7-3 Typical P-waveforms recorded for different pore fillings of
Bentheimer samples
The measured compressional wave velocities in the dry samples are presented in
Figure 7-4 as a function of confining pressure in comparison to the literature data (Tao
et al. 1995, Mayr and Burkhardt 2006). As the confining pressure increased, the
compressional wave velocities increased due to the compression, which represent
normal behaviour in rock samples. The experimental data from the present study have
0
0.5
1
1.5
2
2.5
3
3.5
4
4.5
5
25 27 29 31 33 35 37 39 41 43 45 47
Volt
age
(V)
Time (μs)
Dry
Brine-saturated
THF Brine-saturated
THF Hydrate-bearing
Page 169
144
the same trend as the literature data. A variation of 6.6% was observed between the
measured data and that in the literature. This variation is due to the different sandstone
used in the literature (i.e. Berea sandstone) and the differences in sample properties
such as the distribution of grain size and pore space network characteristics.
Figure 7-4 Compressional wave velocity in dry Bentheimer sample as a function
of confining pressure compared to the literature (Tao et al. 1995, Mayr and
Burkhardt 2006). The lines are fitted logarithmic trend-lines
The corresponding P-wave velocities for the different pore fillings for B1 and B2
Bentheimer sandstone samples were calculated and are shown in Table 7-3, Figure 7-5
and Figure 7-6. These results represent the compressional wave velocities across
different pore fillings (dry, brine-saturated, THF brine-saturated and THF hydrate-
bearing) as a function of pressure. For all pore filling types, the compressional wave
velocities increased as the confining pressure increased. The compressional wave
velocity in the dry sample was lower than that in the brine saturated and THF brine-
2000
2500
3000
3500
4000
4500
5000
0 2 4 6 8 10 12 14 16 18 20
Co
mp
ress
ion
al
vel
oci
ty (
m/s
)
Pressure (MPa)
This Study: Sample B1
This Study: Sample B2
Mayr and Burkhardt. (2006)
Tao et al. (1995)
Page 170
145
saturated samples for the studied pressure range. The same behaviour was reported by
Mayr and Burkhardt (2006) for the dry and partially water saturated Bentheimer
sandstone samples. The compressional wave velocity was significantly higher for the
hydrate-bearing sediment than that of the other samples. An average increase of 964.9
m/s and 1028 m/s was observed in the dry and hydrate-bearing sediment samples of
B1 and B2, respectively, which corresponds to a percentage increase in compressional
wave velocity of 27.6% for sample B1 and 31.9% for sample B2. This general increase
in compressional wave velocity can be explained by the fact that the formation of
hydrate solids in pore spaces leads to a decrease in the P-wave travel time (Figure
7-3), which translates to an increase in compressional wave velocity. The higher
increase in compressional wave velocity observed in sample B2 may be attributed to
its lower porosity and pore volume, which means a greater number of cracks were
closed compared to sample B1 due to the applied confining pressure (Mayr and
Burkhardt 2006). Thus, under the hydrate formation conditions, the compressional
wave velocity increased in Bentheimer sandstone samples (B1 and B2) due to the
plugging caused by hydrate solids as well as the closing of cracks due to the applied
pressure.
Page 171
146
Figure 7-5 Compressional wave velocity as a function of confining pressure for
different pore fillings in sample B1
3200
3400
3600
3800
4000
4200
4400
4600
4800
0 5 10 15
Co
mp
ress
ion
al
Vel
oci
ty (
m/s
)
Confining Pressure (MPa)
B1 - Dry B1 - Brine-saturated
B1 - THF Brine-saturated B1 - THF Hydrate-bearing
Page 172
147
Figure 7-6 Compressional wave velocity as a function of confining pressure for
different pore fillings in sample B2
2800
3000
3200
3400
3600
3800
4000
4200
4400
4600
0 2 4 6 8 10 12 14 16 18 20
Co
mp
ress
ion
al
Vel
oci
ty (
m/s
)
Confining Pressure (MPa)
B2 - Dry B2 - Brine-saturated
B2 - THF Brine-saturated B2 - THF Hydrate-bearing
Page 173
148
Table 7-3 Experimentally measured compressional velocities for different pore
fillings in Bentheimer samples as a function of confining pressure
Sample Pcon (MPa)
VP (m/s)
Dry Brine-
saturated
THF Brine-
saturated
THF Hydrate-
bearing
B1
2 3254 3389 3401 4376
4 3393 3442 3467 4441
6 3455 3512 3525 4470
10 3526 3621 3635 4505
12 3602 3651 3673 4525
14 3634 3693 3715 4539
15 3647 3700 3722 -
16 - 3704 3730 4553
17 3679 - - -
B2
2 3026.97 3317.67 3358.96 4156
4 3135.83 3358.96 3402.57 4215
6 3204.58 3382.88 3427.12 4241
8 3242.87 3400.81 3427.12 4253
10 3267.97 3425.33 3449.21 4283
12 3290.61 3437.731 3463.04 4301
14 3306.36 3450.21 3474.76 4314
16 3319.35 3469.11 3501.33 4321
18 - 3475.46 3509.420 4323
20 3360.45 3481.83 3514.288 4325
Page 174
149
The evolution of compressional wave velocity during the cooling process (THF
hydrate formation) at 14 MPa is shown in Figure 7-7. It can be seen that the
compressional wave velocity remained constant at ~3474 m/s for the first 20 h.
However, the temperature began to decrease below the hydrate equilibrium
temperature of the THF solution (~3.9 °C) at ~11 h indicating that hydrate formation
had initiated, while there was no change seen in the compressional wave velocity for
the next 9 h as the temperature steadily dropped to 1 °C. This behaviour was due to
hydrate formation occurring initially as thin hydrate films forming at the pore surface,
then progressing into a water-hydrate slurry followed by a slow solid crystallisation
stage (Beltrán and Servio 2008a, Alef et al. 2018). The velocity then increased steadily
from t = 20-24 h to ~3510 m/s while the temperature was kept constant at 1 °C. This
apparent increase in compressional wave velocity was due to initial hydrate crystals
starting to agglomerate in the pore spaces. During the next 10 h, the velocity increased
rapidly to ~3830 m/s. This rapid increase may be due to the rapid hydrate
crystallisation occurring in the pore spaces. Lastly, there was no noticeable change
occurring in the compressional wave velocity and the recorded velocity approaches to
the approximately constant value of ~3,860 m/s. Therefore, the hydrate formation
process had finished and the THF testing solution has been converted into a hydrate
solid.
Page 175
150
Figure 7-7 Evolution of compressional wave velocity during THF hydrate
formation at confining pressure of 14 MPa in sample B2
In contrast, gas hydrate formation in production pipelines from gas reservoirs is a
major concern. Hydrate formation in pipelines can result in safety concerns for
operation personnel, environmental issues in the case of a leak, production downtime,
increased maintenance and repair costs (Chatti et al. 2005, Sloan 2005, Alef et al.
2018). The monitoring of compressional wave velocity along pipelines can be used to
detect hydrate formation and serve as a warning system to operators. As can be seen
from Figure 7-7, a window of 4 h can be achieved before a rapid increase in
compressional wave velocity is observed. During this time, the operator may take
precautionary measures such as the injection of hydrate inhibitors to lower the risk of
hydrate promotion and agglomeration.
0
2
4
6
8
10
12
14
16
18
20
3400
3500
3600
3700
3800
3900
4000
0 2 4 6 8 10 12 14 16 18 20 22 24 26 28 30 32 34 36 38 40 42 44 46 48 50 52 54
Tem
per
atr
e (
°C)
Co
mp
ress
ion
al
Vel
oci
ty (
m/s
)
Time (h)
Compressional Velocity
Temperature
THF Hydrate Equilibirum Temperature
com
Page 176
151
7.4.2 CO2 hydrate formation in sandstone
Following on from the CT experiment for imaging the CO2 hydrate formation in
Bentheimer sandstone, measurements of the compressional wave velocities were
conducted using the same materials and procedures used in the CT experiments, see
chapter 7. However, a large Bentheimer core (B3; Table 7-2) was used as the host
sediment. P-wave velocities through sample B3 were calculated before and after CO2
hydrate formation and are reported in Table 7-4 and Figure 7-8. Compressional wave
velocities increased by 7%-8% after CO2 hydrate formation (e.g. from 2880 m/s to
3100 m/s at 8 MPa confining pressure; Figure 7-8). This observation is consistent with
the free-floating model (Helgerud et al. 1999, Waite et al. 2009). In this model, the
floating hydrate is considered part of the pore fluid (and not the rock matrix), thus only
the bulk modulus of the pore fluid changes (but not that of the rock skeleton) (Waite
et al. 2009). The free-floating model is applicable for hydrate saturations up to 40%
(Spangenberg et al. 2005); recall that in CT experiments the hydrate saturation was
~ 17%. This conclusion is consistent with the CT images, where hydrate layers
between water and CO2 gas were observed. CO2 hydrate thus has no effect on the
stiffness of the sedimentary matrix (Brugada et al. 2010).
During the first stage, the velocity remained stable and did not show a significant
change until CO2 hydrate nucleation began (Figure 7-9). Increasing velocities
demonstrated that the hydrate had formed in the pore space. The hydrate formation
process was completed when the velocities stabilised. The measured P-wave velocities
before and after hydrate formation are listed in Table 7-4.
Page 177
152
Figure 7-8 P-wave velocities measured through sample B3 before and after CO2
hydrate formation as a function of confining pressure (pore pressure = 3 MPa)
Table 7-4 P-wave velocities before and after CO2 hydrate formation in sample B3
Confining Pressure, MPa P-wave velocity before
hydrate formation, m/s
P-wave velocity after
hydrate formation, m/s
8 2857 3100
10 2886 3146
12 2902 3167
14 2914 3193
16 2928 3209
18 2941 3226
2700
2800
2900
3000
3100
3200
3300
6 8 10 12 14 16 18 20
P-w
ave
Vel
oci
ty (
m/s
)
Confining Pressure (MPa)
P-wave velocity before hydrate formation, T=291 K
P-wave velocity after hydrate formation, T=274 K
Page 178
153
Figure 7-9 Evolution of P-wave velocity during CO2 hydrate formation in sample
B3 as a function of (a) temperature and (b) time at 8 MPa confining pressure
Conclusions
Hydrate reserves are currently classified as an unconventional energy resource
although they have the potential to become an alternative resource to meet the growing
demands. The acoustic method is an important method for the exploration of gas
hydrate reserves and can be an efficient method to characterise hydrate-bearing
Page 179
154
sediments. In the present study, the pulse transmission method was used to determine
the compressional wave velocities of three Bentheimer samples. Thus, new
compressional wave velocity measurements have been reported for multiple pore
fillings ranging from dry, brine-saturated, THF brine-saturated, THF hydrate-bearing
and CO2 hydrate-bearing as a function of confining pressure in consolidated
sediments. The THF hydrate formation in the pore spaces is indicated by a significant
increase in velocities; typically they increased by 27.6% and 31.9% compared to a dry
sample for B1 and B2, respectively.
Furthermore, P-wave velocities increased by 7%–8% after CO2 hydrate formation,
which confirms the hydrate free-floating behaviour. This conclusion is consistent with
the CT images of CO2 hydrate-bearing sandstone (see chapter 6). These free-floating
hydrates have no significant contribution to the stiffness of the host sediments.
At the initial stage of hydrate formation, there was no change in the compressional
wave velocity, which was followed by a steady increase as the hydrate crystals began
to agglomerate and then increased rapidly to a constant value suggesting that the test
solution had converted to a hydrate solid. The experimental data of the present study
will aid in the formulation of geophysical models to determine hydrate content in
consolidated sediments. Furthermore, the study has given an insight into the use of
compressional wave velocity to detect hydrate formation in gas production pipelines.
A window of 4 h was found before high-risk hydrate formation would form that can
potentially blocking the gas pipelines could occur.
Page 180
155
Conclusions and Recommendations
This chapter introduces the overall conclusions from the studies presented in the
previous chapters and gives recommendations for potential future research work.
Conclusions
Gas hydrates have continued to be an area of increasing attention because of their role
as the main flow assurance problem in natural gas production and their importance as
a potential energy resource. This thesis presents experimental measurements and
modelling of gas hydrate equilibrium conditions for different gas mixtures containing
methane, carbon dioxide and nitrogen. In addition, the CO2 existing in consolidated
sandstone samples have been studied in terms of hydrate morphology, distribution and
hydrate cluster characteristics. Another study was performed to investigate the effect
of hydrate formation on compressional wave velocities of consolidated sandstone
samples.
Experimental studies using PVT sapphire cell, ultrasonic measurements set-up and X-
ray µCT were conducted to achieve the targets and objectives of this thesis. The study
consists of five chapters, which are summarised below.
8.1.1 Experimental Determination of Hydrate Phase Equilibrium for Different
Gas Mixtures Containing Methane, Carbon Dioxide and Nitrogen with
Motor Current Measurements
New hydrate equilibrium measurements of the systems of carbon dioxide +
methane + water, nitrogen + methane + water and carbon dioxide + nitrogen +
water were reported at varying temperature and pressure conditions.
The comparison between the obtained experimental data and the literature data
(Jhaveri and Robinson 1965, Adisasmito et al. 1991, Dholabhai and Bishnoi
1994, Servio et al. 1999, Seo et al. 2001, Nakamura et al. 2003, Mohammadi et
al. 2005, Beltrán and Servio 2008a, Lu and Sultan 2008, Sabil et al. 2014)
showed good consistency.
Results indicated that the hydrate equilibrium conditions for gas mixtures vary
depending upon the type of gases in the mixture and their concentrations.
Page 181
156
Specifically, the hydrate equilibrium temperature increased with increasing CO2
concentration in the CO2 + CH4 and CO2 + N2 gas mixtures at any given pressure.
However, increasing N2 concentration in the N2 + CH4 gas mixture reduced the
hydrate equilibrium temperature at any given pressure.
Motor current measurements conducted during the experimental processes
(formation and dissociation) indicated that the motor current could be effectually
used as a gas hydrate formation and dissociation parameter, particularly in the
cases when visual observations are inaccessible.
8.1.2 Thermodynamic Modelling and Empirical Correlation for the Prediction of
Gas Hydrate Equilibrium Conditions
A thermodynamic model was developed for hydrate equilibrium conditions and
cage occupancies for varying gas mixtures containing CH4, CO2 and N2. The
occupancy results showed that the CO2 stabilised the sI hydrate in the CO2 + CH4
hydrate system, which confirmed the promotion of hydrate conditions with
increasing CO2 gas concentration. The proposed model was validated by
comparison with experimental measurements. The comparison results
demonstrated that the model could acceptably predict the hydrate equilibria at
pressures lower than 10 MPa in the CO2 + CH4 hydrate system. Moreover, for
N2 + CH4 and 64 mol% N2 + 36 mol% CO2 hydrate systems, the model results
showed good performance when tested with the experimental data. However, for
74 mol% N2 + 26mol% CO2 hydrate, a considerable deviation was observed
between the experimental data and model predictions. Therefore, a potential
structural transformation could occur for this mixed hydrate.
A new empirical correlation was developed that can be used for accurate
prediction of the hydrate equilibrium temperatures. This correlation is applicable
for a wide range of temperatures, pressures and for gas mixtures containing CH4,
CO2 and N2 with specific gravities up to 1. This correlation showed excellent
accuracy compared with the published experimental data and results obtained
from other hydrate correlations. Thus, it represents a simple, accurate and direct
Page 182
157
tool for predicting gas hydrate equilibrium conditions in the system that meets
the above operating conditions.
8.1.3 Experimental Pore-scale Analysis of Carbon Dioxide Hydrate in Sandstone
via X-Ray Micro-Computed Tomography
We studied CO2 hydrate distribution in sandstone and investigated the hydrate
morphology and cluster characteristics to determine the role that CO2 hydrate
plays in CGS and natural gas recovery from hydrate-bearing sediments. CO2
hydrates in Bentheimer were imaged via X-ray µCT. It was found that CO2
hydrate mainly formed in the centre of the pore bodies, without contacting the
grain surface, which is consistent with the free-floating model (Zhao et al. 2014,
Zhao, Yang, et al. 2015).
A brine layer existed between the hydrate and the grain surface indicating that
brine is the wetting phase.
CO2 hydrate saturation (17.8%) was observed, which was localised at the brine-
gas interface and exhibited layer-like morphology.
It has been shown for the first time how CO2 hydrate clusters are formed,
distributed and shaped within a sandstone at in-situ conditions of pore-scale. The
stochastically distributed hydrate clusters followed power-law relations in terms
of their size distributions (N ∝ V-τ, where N is the number of clusters of size V
counted and τ is the fitting exponent) and surface area-volume relationships (A
∝ V-p, where A is the surface area and V is the cluster volume).
A τ value of 1.375 for the hydrate cluster size distribution indicated that only a
few large hydrate clusters were present; decreased to 1.15 after hydrate
dissociation due to CO2 being liberated from the hydrates, which then coalesced
with the existing CO2 bubbles, thus increasing their size.
An exponent p ~ 0.75 indicated structures less compact than a sphere (p = 2/3),
but more compact than percolation-like ramified structures where p 1 (Stauffer
1979). This has important implications for safe storage in hydrate-bearing
sediments and gas recovery via CO2-CH4 exchange; such a lower surface area-
volume ratio results in less CH4 production and overall lower CO2 storage
capacity.
Page 183
158
In summary, this study provided a significant contribution to current knowledge
as it adds to the fundamental understanding, planning and execution of industrial
CGS projects via the hydrate-disposal route.
8.1.4 Ultrasonic Measurements of Hydrate-bearing Sandstone
The acoustic method is an important method for the exploration of gas hydrate
reserves and can be used as an efficient method to characterise hydrate-bearing
sediments.
The compressional wave velocities were measured for multiple pore filling
sandstone samples: dry, brine-saturated, THF brine-saturated, THF hydrate-
bearing and CO2 hydrate-bearing. All velocities were reported as a function of
confining pressure.
The hydrate formation in the pore space was indicated by the significant increase
in compressional wave velocities.
P-wave velocities increased by 27.6% and 31.9% in the THF hydrate-bearing
sandstone as compared to a dry sample for two sandstone samples.
P-wave velocities increased by 7%–8% after CO2 hydrate formation, which
confirms the hydrate free-floating behaviour. This conclusion is consistent with
the CT images of CO2 hydrate-bearing sandstone. These free-floating hydrates
have no significant contribution to the stiffness of the host sediments.
At the first stage of hydrate formation, no change in P-wave velocity was
observed. However, this stage was followed by a steady increase in the velocity
as the hydrate crystals began to agglomerate and then increased rapidly to a
constant value indicating that the test solution had converted to a hydrate solid.
The results presented in this study will aid in the formulation of geophysical
models to determine the hydrate content in consolidated sediments. Furthermore,
the study has given an insight into the use of compressional wave velocity to
detect hydrate formation in gas production pipelines.
Page 184
159
Potential Future Research Work
On the basis of the findings in this thesis, a number of recommendations are
proposed for future research work:
Further investigation should be conducted to measure gas hydrate equilibrium
conditions for other types of gas mixtures for a broader range of operating
conditions (temperature and pressures).
Studying the memory effect on the equilibrium conditions of gas hydrate
containing gas mixtures could explain the reduction in the induction time prior
to hydrate nucleation process. Various experiments are recommended to
investigate the memory effect of mixed hydrates under varying conditions for
hydrate forming methods (isobaric and isochoric).
Studying the potential structural transition of some types of mixed hydrates (e.g.
N2-CO2) using high-speed visualisation techniques such as NMR and X-ray
diffraction.
In the present thesis, we studied CO2 hydrate formation in sandstone. More
research is needed on the formation and dissociation of multi-component hydrate
systems in sediments.
Studying the influence of wetting properties (contact angle) between gas
hydrates, liquid and the mineral surface of the hydrate hosting sediments and
thus their effects on the hydrate nucleation rate.
A further study is recommended to use the compressional wave velocity to detect
hydrate formation in gas production pipelines before blocking the pipeline could
occur.
Page 185
160
References
Adeleke, Najeem A. 2010. "Blockage Detection in Natural Gas Pipelines by Transient
Analysis."
Adeyemo, Adebola, Rajnish Kumar, Praveen Linga, John Ripmeester, and Peter
Englezos. 2010. "Capture of carbon dioxide from flue or fuel gas mixtures by clathrate
crystallization in a silica gel column." International Journal of Greenhouse Gas
Control 4 (3):478-485.
Adisasmito, Sanggono, Robert J Frank, and E Dendy Sloan 1991. "Hydrates of carbon
dioxide and methane mixtures." Journal of Chemical and Engineering Data 36 (1):68-
71.
Akin, S, and AR Kovscek. 2003. "Computed tomography in petroleum engineering
research." Geological Society, London, Special Publications 215 (1):23-38.
Al-Fatlawi, Omar, Md Mofazzal Hossain, and Jake Osborne. 2017. "Determination of
best possible correlation for gas compressibility factor to accurately predict the initial
gas reserves in gas-hydrocarbon reservoirs." International Journal of Hydrogen
Energy 42 (40):25492-25508.
Alef, Khalid, Stefan Iglauer, and Ahmed Barifcani. 2018. "Effect of Dissolved
Oxygen, Sodium Bisulfite, and Oxygen Scavengers on Methane Hydrate Inhibition."
Journal of Chemical & Engineering Data 63 (5):1821-1826.
AlHarooni, Khalifa, Ahmed Barifcani, David Pack, Rolf Gubner, and Varun Ghodkay.
2015. "Inhibition effects of thermally degraded MEG on hydrate formation for gas
systems." Journal of Petroleum Science and Engineering.
Almenningen, Stian, Josef Flatlandsmo, Anthony R Kovscek, Geir Ersland, and
Martin A Fernø. 2017. "Determination of pore-scale hydrate phase equilibria in
sediments using lab-on-a-chip technology." Lab on a Chip 17 (23):4070-4076.
Page 186
161
Arora, Amit, and Swaranjit Singh Cameotra. 2015. "Natural Gas Hydrate as an
Upcoming Resource of Energy." Journal of Petroleum & Environmental
Biotechnology 6 (01).
Aya, I, K Yamane, and H Nariai. 1997. "Solubility of CO2 and density of CO2 hydrate
at 30 MPa." Energy 22 (2-3):263-271.
Bagherzadeh, S Alireza, Peter Englezos, Saman Alavi, and John A Ripmeester. 2012.
"Molecular modeling of the dissociation of methane hydrate in contact with a silica
surface." The Journal of Physical Chemistry B 116 (10):3188-3197.
Baldwin, BA, A Moradi-Araghi, and JC Stevens. 2003. "Monitoring hydrate formation
and dissociation in sandstone and bulk with magnetic resonance imaging." Magnetic
resonance imaging 21 (9):1061-1069.
Baldwin, Bernard A, Jim Stevens, James J Howard, Arne Graue, Bjorn Kvamme, Erick
Aspenes, Geir Ersland, Jarle Husebø, and David R Zornes. 2009. "Using magnetic
resonance imaging to monitor CH4 hydrate formation and spontaneous conversion of
CH4 hydrate to CO2 hydrate in porous media." Magnetic resonance imaging 27
(5):720-726.
Ball, Michael, and Martin Wietschel. 2009. "The future of hydrogen–opportunities and
challenges." International journal of hydrogen energy 34 (2):615-627.
Barrer, R.M., and WI Stuart. 1957. "Non-stoicheiometric clathrate compounds of
water." Proc. R. Soc. Lond. A.
Beget, James E, and Jason A Addison. 2007. "Methane gas release from the Storegga
submarine landslide linked to earlyHolocene climate change: a speculative
hypothesis." The Holocene 17 (3):291-295.
Belandria, Veronica, Ali Eslamimanesh, Amir H Mohammadi, Pascal Théveneau,
Hervé Legendre, and Dominique Richon. 2011. "Compositional analysis and hydrate
dissociation conditions measurements for carbon dioxide+methane+water system."
Industrial & Engineering Chemistry Research 50 (9):5783-5794.
Page 187
162
Belandria, Veronica, Amir H Mohammadi, and Dominique Richon. 2010. "Phase
equilibria of clathrate hydrates of methane+ carbon dioxide: New experimental data
and predictions." Fluid Phase Equilibria 296 (1):60-65.
Beltrán, JG, and P Servio. 2008a. "Morphology studies on gas hydrates interacting
with silica gel.//paper presented at Sixth International Conference on Gas Hydrate."
British Columbia, Canada.
Beltrán, Juan G, and Phillip Servio. 2008b. "Equilibrium studies for the system
methane+ carbon dioxide+ neohexane+ water." Journal of Chemical and Engineering
Data 53 (8):1745-1749.
Benesh, Matthew E. 1942. The use of gas hydrates in improving the load factor of gas
supply systems. Google Patents.
Berge, BK. 1986. "Hydrate predictions on a microcomputer." Petroleum Industry
Application of Microcomputers.
Berge, Lars Inge, Kjell Arne Jacobsen, and Arne Solstad. 1999. "Measured acoustic
wave velocities of R11 (CCl3F) hydrate samples with and without sand as a function
of hydrate concentration." Journal of Geophysical Research: Solid Earth 104
(B7):15415-15424.
Berndt, Christian, Stefan Bünz, Trevor Clayton, Jürgen Mienert, and Martin Saunders.
2004. "Seismic character of bottom simulating reflectors: examples from the mid-
Norwegian margin." Marine and Petroleum Geology 21 (6):723-733.
Best, Angus I, Jeffrey A Priest, Christopher RI Clayton, and Emily VL Rees. 2013.
"The effect of methane hydrate morphology and water saturation on seismic wave
attenuation in sand under shallow sub-seafloor conditions." Earth and Planetary
Science Letters 368:78-87.
Best, Angus I, Michael D Richardson, Bernard P Boudreau, Alan G Judd, Ira Leifer,
Anthony P Lyons, Christopher S Martens, Danial L Orange, and Simon J Wheeler.
2006. "Shallow seabed methane gas could pose coastal hazard." Eos 87 (22):213-217.
Page 188
163
Birch, Francis. 1960. "The velocity of compressional waves in rocks to 10 kilobars:
1." Journal of Geophysical Research 65 (4):1083-1102.
Bishnoi, P Raj, and V Natarajan. 1996. "Formation and decomposition of gas
hydrates." Fluid phase equilibria 117 (1):168-177.
Blanco, Gabriel, Reyer Gerlagh, Sangwon Suh, John Barrett, Heleen C de Coninck,
CF Diaz Morejon, Ritu Mathur, Nebojsa Nakicenovic, Alfred Ofosu Ahenkorah, and
Jiahua Pan. 2014. "Drivers, trends and mitigation."
Blunt, Martin J, Branko Bijeljic, Hu Dong, Oussama Gharbi, Stefan Iglauer, Peyman
Mostaghimi, Adriana Paluszny, and Christopher Pentland. 2013. "Pore-scale imaging
and modelling." Advances in Water Resources 51:197-216.
Bohrmann, Gerhard, Jens Greinert, Erwin Suess, and Marta Torres. 1998. "Authigenic
carbonates from the Cascadia subduction zone and their relation to gas hydrate
stability." Geology 26 (7):647-650.
Bohrmann, Gerhard, and Marta E Torres. 2006. "Gas hydrates in marine sediments."
In Marine geochemistry, 481-512. Springer.
Booth, James S, Mary M Rowe, and Kathleen M Fischer. 1996. Offshore gas hydrate
sample database: with an overview and preliminary analysis: Citeseer.
Booth, JS, WJ Winters, William P Dillon, MB Clennell, and MM Rowe. 1998. "Major
occurrences and reservoir concepts of marine clathrate hydrates: implications of field
evidence." Geological Society, London, Special Publications 137 (1):113-127.
Boswell, R., K. Yamamoto, S.-R. Lee, T. S. Collett, P. Kumar, and S. Dallimore.
2014. "Chapter 8. Methane Hydrates." In Future Energy, edited by T. M. Letcher,
159−178. New York: Elsevier Publishing.
Boswell, Ray, and Tim Collett. 2006. "The gas hydrates resource pyramid." Natural
Gas & Oil 304:285-4541.
Page 189
164
Boswell, Ray, and Timothy S Collett. 2011. "Current perspectives on gas hydrate
resources." Energy and environmental science 4 (4):1206-1215.
Boswell, Ray, Timothy S Collett, Matthew Frye, William Shedd, Daniel R McConnell,
and Dianna Shelander. 2012. "Subsurface gas hydrates in the northern Gulf of
Mexico." Marine and Petroleum Geology 34 (1):4-30.
Brewer, Peter G, Franklin M Orr Jr, Gernot Friederich, Keith A Kvenvolden, Daniel
L Orange, James McFarlane, and William Kirkwood. 1997. "Deep-ocean field test of
methane hydrate formation from a remotely operated vehicle." Geology 25 (5):407-
410.
Brownstein, S, DW Davidson, and D Fiat. 1967. "Proton resonance spectra of some
gas hydrates." The Journal of Chemical Physics 46 (4):1454-1459.
Brugada, J, YP Cheng, K Soga, and JC Santamarina. 2010. "Discrete element
modelling of geomechanical behaviour of methane hydrate soils with pore-filling
hydrate distribution." Granular Matter 12 (5):517-525.
Bruusgaard, Hallvard, Juan G Beltrán, and Phillip Servio. 2008. "Vapor− liquid water−
hydrate equilibrium data for the system N2+CO2+H2O." Journal of Chemical and
Engineering Data 53 (11):2594-2597.
Buades, Antoni, Bartomeu Coll, and J-M Morel. 2005. "A non-local algorithm for
image denoising." Computer Vision and Pattern Recognition, 2005. CVPR 2005. IEEE
Computer Society Conference on.
Buades, Antoni, Bartomeu Coll, and Jean-Michel Morel. 2008. "Nonlocal image and
movie denoising." International Journal of Computer Vision 76 (2):123-139.
Buffett, Bruce A. 2000. "Clathrate hydrates." Annual Review of Earth and Planetary
Sciences 28 (1):477-507.
Byk, S Sh, and Valentina Ivanovna Fomina. 1968. "Gas hydrates." Russian Chemical
Reviews 37 (6):469.
Page 190
165
Cailletet, L, and R Bordet. 1882. "Sur divers hydrates qui se forment par la pression et
la détente." CR Hebd. Seances′ Acad. Sci 95:58-61.
Camargo, RMT, MAL Gonçalves, JRT Montesanti, CABR Cardoso, and K Minami.
2004. "A perspective view of flow assurance in deepwater fields in Brazil." Offshore
Technology Conference.
Carcione, Jose M, and Davide Gei. 2004. "Gas-hydrate concentration estimated from
P-and S-wave velocities at the Mallik 2L-38 research well, Mackenzie Delta, Canada."
Journal of Applied Geophysics 56 (1):73-78.
Carroll, John. 2014. Natural gas hydrates: a guide for engineers: Gulf Professional
Publishing.
Carson, Don B, and Donald L Katz. 1942. "Natural gas hydrates." Transactions of the
AIME 146 (01):150-158.
Castaldi, Marco J, Yue Zhou, and Tuncel M Yegulalp. 2007. "Down-hole combustion
method for gas production from methane hydrates." Journal of petroleum Science and
Engineering 56 (1-3):176-185.
Chaouachi, Marwen, Andrzej Falenty, Kathleen Sell, Frieder Enzmann, Michael
Kersten, David Haberthür, and Werner F Kuhs. 2015. "Microstructural evolution of
gas hydrates in sedimentary matrices observed with synchrotron X‐ray computed
tomographic microscopy." Geochemistry, Geophysics, Geosystems 16 (6):1711-1722.
Chatti, Imen, Anthony Delahaye, Laurence Fournaison, and Jean-Pierre Petitet. 2005.
"Benefits and drawbacks of clathrate hydrates: a review of their areas of interest."
Energy conversion and management 46 (9-10):1333-1343.
Cheng, ChuanXiao, JiaFei Zhao, YongChen Song, ZiHao Zhu, WeiGuo Liu, Yi
Zhang, MingJun Yang, and XiChong Yu. 2013. "In-situ observation for formation and
dissociation of carbon dioxide hydrate in porous media by magnetic resonance
imaging." Science China Earth Sciences 56 (4):611-617. doi: 10.1007/s11430-012-
4570-5.
Page 191
166
Chong, Zheng Rong, She Hern Bryan Yang, Ponnivalavan Babu, Praveen Linga, and
Xiao-Sen Li. 2015. "Review of natural gas hydrates as an energy resource: prospects
and Challenges." Applied Energy.
Circone, Susan, Laura A Stern, Stephen H Kirby, William B Durham, Bryan C
Chakoumakos, Claudia J Rawn, Adam J Rondinone, and Yoshinobu Ishii. 2003. "CO2
hydrate: synthesis, composition, structure, dissociation behavior, and a comparison to
structure I CH4 hydrate." The Journal of Physical Chemistry B 107 (23):5529-5539.
Claypool, George E, and IR Kaplan. 1974. "The origin and distribution of methane in
marine sediments." In Natural gases in marine sediments, 99-139. Springer.
Claypool, George E, and Keith A Kvenvolden. 1983. "Methane and other hydrocarbon
gases in marine sediment." Annual Review of Earth and Planetary Sciences 11
(1):299-327.
Clayton, CRI, JA Priest, and EVL Rees. 2010. "The effects of hydrate cement on the
stiffness of some sands." Géotechnique 60 (6):435.
Clennell, M Ben, Martin Hovland, James S Booth, Pierre Henry, and William J
Winters. 1999. "Formation of natural gas hydrates in marine sediments: 1. Conceptual
model of gas hydrate growth conditioned by host sediment properties." Journal of
Geophysical Research: Solid Earth 104 (B10):22985-23003.
Cnudde, Veerle, and Matthieu Nicolaas Boone. 2013. "High-resolution X-ray
computed tomography in geosciences: A review of the current technology and
applications." Earth-Science Reviews 123:1-17.
Collett, T. S. 1993. "Natural gas hydrates of the Prudhoe Bay and Kuparuk River area,
North Slope, Alaska." American Association of Petroleum Geologists Bulletin 77
(5):793-812.
Collett, Tim, Jang-Jun Bahk, Rick Baker, Ray Boswell, David Divins, Matt Frye, Dave
Goldberg, Jarle Husebø, Carolyn Koh, and Mitch Malone. 2014. "Methane Hydrates
Page 192
167
in Nature: Current Knowledge and Challenges." Journal of chemical & engineering
data 60 (2):319-329.
Collett, Timothy S. 1999. "Natural Gas Hydrates: Resource of the 21st Century?"
AAPG Bulletin 83 (12).
Collett, Timothy S. 2000. "Natural gas hydrate as a potential energy resource." In
Natural Gas Hydrate, 123-136. Springer.
Collett, Timothy S. 2001. "AAPG Memoir 74, Chapter 7: Natural-Gas Hydrates,
Resource of the Twenty-First Century?".
Collett, Timothy S. 2002. "Energy resource potential of natural gas hydrates." AAPG
bulletin 86 (11):1971-1992.
Collett, Timothy S. 2013. "Gas Hydrate Reservoir Properties."
Collett, Timothy S, Arthur H Johnson, Camelia C Knapp, and Ray Boswell. 2009.
"Natural gas hydrates: a review."
Collett, Timothy S, and Myung W Lee. 2012. "Well log characterization of natural
gas-hydrates." Petrophysics 53 (05):348-367.
Collett, TS, M Riedel, J Cochran, R Boswell, J Presley, P Kumar, A Sathe, A Sethi, M
Lall, and V Sibal. 2008. "National Gas Hydrate Program (NGHP) Expedition 01 Initial
Reports." Directorate General of Hydrocarbons, New Delhi.
Conrad, Heiko. 2009. "Tetrahydrofuran clathrate hydrate formation studied by X-ray
Raman scattering." Faculty of Physics, Technique University Dortmund.
Crampin, Stuart. 1977. "A review of the effects of anisotropic layering on the
propagation of seismic waves." Geophysical Journal International 49 (1):9-27.
Page 193
168
Dai, Jianchun, Niranjan Banik, Diana Gillespie, and Nader Dutta. 2008. "Exploration
for gas hydrates in the deepwater, northern Gulf of Mexico: Part II. Model validation
by drilling." Marine and Petroleum Geology 25 (9):845-859.
Dai, Jianchun, Fred Snyder, Diana Gillespie, Adam Koesoemadinata, and Nader
Dutta. 2008. "Exploration for gas hydrates in the deepwater, northern Gulf of Mexico:
Part I. A seismic approach based on geologic model, inversion, and rock physics
principles." Marine and Petroleum Geology 25 (9):830-844.
Dai, Sheng, J Carlos Santamarina, William F Waite, and Timothy J Kneafsey. 2012.
"Hydrate morphology: Physical properties of sands with patchy hydrate saturation."
Journal of Geophysical Research: Solid Earth 117 (B11).
Dallimore, SR. 2005. "Summary and implications of the Mallik 2002 gas hydrate
production research well program." Scientific Results from the Mallik 2002 Gas
Hydrate Production Well Program, Mackenzie Delta, Northwest Territories,
Canada:1-36.
Dangayach, S, DN Singh, P Kumar, SK Dewri, B Roy, C Tandi, and J Singh. 2015.
"Thermal instability of gas hydrate bearing sediments: Some issues." Marine and
Petroleum Geology 67:653-662.
Daraboina, Nagu, Igor L. Moudrakovski, John A. Ripmeester, Virginia K. Walker, and
Peter Englezos. 2013. "Assessing the performance of commercial and biological gas
hydrate inhibitors using nuclear magnetic resonance microscopy and a stirred
autoclave." Fuel 105:630-635. doi: https://doi.org/10.1016/j.fuel.2012.10.007.
Dashti, Hossein, Leonel Zhehao Yew, and Xia Lou. 2015. "Recent advances in gas
hydrate-based CO2 capture." Journal of Natural Gas Science and Engineering 23:195-
207.
Davy, Humphry. 1811. "The Bakerian Lecture. On some of the combinations of
oxymuriatic gas and oxygene, and on the chemical relations of these principles, to
inflammable bodies." Philosophical Transactions of the Royal Society of London
101:1-35.
Page 194
169
Dawe, RA, and S Thomas. 2007. "A large potential methane source—Natural gas
hydrates." Energy Sources, Part A 29 (3):217-229.
De Forcrand, R. 1902. "Sur la composition des hydrates de gaz." Compt. rend
135:959-961.
De Forcrand, R. 1925. "L'hydrate de Xénon." Compt. rend 181:15.
de Forcrand, R, and Sully Thomas. 1897. Compt. Rend.:109.
De la Rive, A. 1829. "Observations sur le liquide que l’on obtient par la condensation
du gaz acide sulfureux." Annales de Chimie et de Physique. Paris.
Deaton, WM, and EM Frost Jr. 1946. Gas hydrates and their relation to the operation
of natural-gas pipe lines. Bureau of Mines, Amarillo, TX (USA). Helium Research
Center.
Delli, Mohana L, and Jocelyn LH Grozic. 2014. "Experimental determination of
permeability of porous media in the presence of gas hydrates." Journal of Petroleum
Science and Engineering 120:1-9.
Demirbas, Ayhan. 2010a. Methane gas hydrate: Springer Science & Business Media.
Demirbas, Ayhan. 2010b. "Processes for methane production from gas hydrates."
Methane Gas Hydrate:161-181.
Desrues, Jacques, Gioacchino Viggiani, and Pierre Besuelle. 2006. Advances in X-ray
Tomography for Geomaterials. Vol. 118. London: Wiley-ISET.
Dholabhai, Pankaj D, and P Raj Bishnoi. 1994. "Hydrate equilibrium conditions in
aqueous electrolyte solutions: mixtures of methane and carbon dioxide." Journal of
Chemical and Engineering Data 39 (1):191-194.
Dickens, Gerald R. 2004. "Global change: Hydrocarbon-driven warming." Nature 429
(6991):513-515.
Page 195
170
Dillon, William P, Jeffrey W Nealon, Michael H Taylor, Myung W Lee, Rebecca M
Drury, and Christopher H Anton. 2001. "Seafloor collapse and methane venting
associated with gas hydrate on the blake ridge: causes and implications to seafloor
stability and methanerelease." Natural gas hydrates: Occurrence, distribution, and
detection:211-233.
Dong, Zhenzhen, Stephen Holditch, Duane McVay, and Walter B Ayers. 2012.
"Global unconventional gas resource assessment." SPE Economics & Management 4
(04):222-234.
Du Frane, Wyatt L, Laura A Stern, Karen A Weitemeyer, Steven Constable, and
Jeffery J Roberts. 2011. Electrical properties of methane hydrate+ sediment mixtures.
Lawrence Livermore National Laboratory (LLNL), Livermore, CA.
Dudley, B. 2013. "Statistical review of world energy." BP plc, London.
Dvorkin, Jack, Michael B Helgerud, William F Waite, Stephen H Kirby, and Amos
Nur. 2000. "Introduction to physical properties and elasticity models." In Natural Gas
Hydrate, 245-260. Springer.
Dvorkin, Jack, and Amos Nur. 1996. "Elasticity of high-porosity sandstones: Theory
for two North Sea data sets." Geophysics 61 (5):1363-1370.
Dvorkin, Jack, Manika Prasad, Akio Sakai, and Dawn Lavoie. 1999. "Elasticity of
marine sediments: Rock physics modeling." Geophysical research letters 26
(12):1781-1784.
Dyadin, Yuri A, Eduard G Larionov, Andrei Y Manakov, Fridrich V Zhurko, Eugeny
Y Aladko, Tamara V Mikina, and Vladislav Y Komarov. 1999. "Clathrate hydrates of
hydrogen and neon." Mendeleev communications 9 (5):209-210.
Egawa, Kosuke, Toshiko Furukawa, Tatsuo Saeki, Kiyofumi Suzuki, and Hideo
Narita. 2013. "Three-dimensional paleomorphologic reconstruction and turbidite
distribution prediction revealing a Pleistocene confined basin system in the northeast
Nankai Trough area." AAPG bulletin 97 (5):781-798.
Page 196
171
Elgibaly, Ahmed A, and Ali M Elkamel. 1998. "A new correlation for predicting
hydrate formation conditions for various gas mixtures and inhibitors." Fluid Phase
Equilibria 152 (1):23-42.
Englezos, Peter. 1993. "Clathrate hydrates." Industrial & Engineering Chemistry
Research 32 (7):1251-1274.
Erickson, Dale D. 1983. "Development of a natural gas hydrate prediction computer
program." Colorado School of Mines. Arthur Lakes Library.
Ersland, Geir, Jarle Husebø, Arne Graue, and Bjørn Kvamme. 2009. "Transport and
storage of CO2 in natural gas hydrate reservoirs." Energy Procedia 1 (1):3477-3484.
Eslamimanesh, Ali, Amir H Mohammadi, Dominique Richon, Paramespri Naidoo,
and Deresh Ramjugernath. 2012. "Application of gas hydrate formation in separation
processes: a review of experimental studies." The Journal of Chemical
Thermodynamics 46:62-71.
Falser, S, S Uchida, AC Palmer, K Soga, and TS Tan. 2012. "Increased gas production
from hydrates by combining depressurization with heating of the wellbore." Energy
& fuels 26 (10):6259-6267.
Falser, Simon, Andrew C Palmer, Khoo Boo Cheong, and Tan Thiam Soon. 2013.
"Temperature increase during the depressurization of partially hydrate-saturated
formations within the stability region." Energy & Fuels 27 (2):796-803.
Fan, Shuan-Shi, and Tian-Min Guo. 1999. "Hydrate formation of CO2-rich binary and
quaternary gas mixtures in aqueous sodium chloride solutions." Journal of Chemical
and Engineering Data 44 (4):829-832.
Fan, Shuanshi, Yuzhen Zhang, Genlin Tian, Deqing Liang, and Dongliang Li. 2006.
"Natural gas hydrate dissociation by presence of ethylene glycol." Energy & fuels 20
(1):324-326.
Page 197
172
Faraday, Michael, and Humphry Davy. 1823. "On fluid chlorine." Philosophical
Transactions of the Royal society of London 113:160-165.
Floodgate, GD, and AG Judd. 1992. "The origins of shallow gas." Continental Shelf
Research 12 (10):1145-1156.
Fowler, DL, WV Loebenstein, DB Pall, and Charles A Kraus. 1940. "Some unusual
hydrates of quaternary ammonium salts." Journal of the American Chemical Society
62 (5):1140-1142.
Fujii, Tetsuya, Masaru Nakamizu, Yoshihiro Tsuji, Takatoshi Namikawa, Toshiharu
Okui, Masayuki Kawasaki, Koji Ochiai, Mizue Nishimura, and Osamu Takano. 2009.
"Methane-hydrate occurrence and saturation confirmed from core samples, eastern
Nankai Trough, Japan."
Gabitto, Jorge F, and Costas Tsouris. 2010. "Physical properties of gas hydrates: A
review." Journal of Thermodynamics 2010.
Giavarini, Carlo, and Keith Hester. 2011. Gas hydrates: Immense energy potential and
environmental challenges: Springer Science & Business Media.
Ginsburg, G.D. 1969. "Hydrogeology of the North Yenisei Region." Natural Gas
Crystalline Hydrate Formation in the Interior of the Earth 1:109-128.
Goel, Naval. 2006. "In situ methane hydrate dissociation with carbon dioxide
sequestration: Current knowledge and issues." Journal of petroleum science and
engineering 51 (3):169-184.
Gough, SR, and DW Davidson. 1971. "Composition of tetrahydrofuran hydrate and
the effect of pressure on the decomposition." Canadian Journal of Chemistry 49
(16):2691-2699.
Graue, Arne, B Kvamme, Bernie Baldwin, Jim Stevens, James J Howard, Eirik
Aspenes, Geir Ersland, Jarle Husebo, and D Zornes. 2008. "MRI visualization of
Page 198
173
spontaneous methane production from hydrates in sandstone core plugs when exposed
to CO2." SPE Journal 13 (02):146-152.
Gudmundsson, J. S., and A. Borrehaug. 1996. "Frozen hydrate for transport of natural
gas." Proceedings of the 2nd International Conference of Natural Gas Hydrates,
Toulouse, France, 1996.
Haghighi, Hooman, Antonin Chapoy, Rod Burgess, and Bahman Tohidi. 2009.
"Experimental and thermodynamic modelling of systems containing water and
ethylene glycol: Application to flow assurance and gas processing." Fluid Phase
Equilibria 276 (1):24-30.
Hammerschmidt, EG. 1934. "Formation of gas hydrates in natural gas transmission
lines." Industrial & Engineering Chemistry 26 (8):851-855.
Hammerschmidt, EG. 1936. "Gas hydrates." Am. Gas Assoc. Mon 18 (7):273-276.
Handa, YP, RE Hawkins, and JJ Murray. 1984. "Calibration and testing of a Tian-
Calvet heat-flow calorimeter Enthalpies of fusion and heat capacities for ice and
tetrahydrofuran hydrate in the range 85 to 270 K." The Journal of Chemical
Thermodynamics 16 (7):623-632.
Hartmann, D.L., A.M.G. Klein Tank, M. Rusticucci, L.V. Alexander, S. Bronnimann,
Y. Charabi, F.J. Dentener, E.J. Dlugokencky, D.R. Easterling, A. Kaplan, B.J. Soden,
P.W. Thorne, M. Wild, and P.M. Zhai. 2013. "Observations: Atmosphere and
Surface." In Climate Change 2013: The Physical Science Basis. Contribution of
Working Group I to the Fifth Assessment Report of the Intergovernmental Panel on
Climate Change, edited by T.F. Stocker, D. Qin, G.-K. Plattner, M. Tignor, S.K. Allen,
J. Boschung, A. Nauels, Y. Xia, V. Bex and P.M. Midgley, 159–254. Cambridge,
United Kingdom and New York, NY, USA: Cambridge University Press.
Hau-Riege, Stefan P. 2012. High-Intensity X-rays-Interaction with Matter: Processes
in Plasmas, Clusters, Molecules and Solids: John Wiley & Sons.
Page 199
174
Hauge, LP, KA Birkedal, G Ersland, and A Graue. 2014. "Methane production from
natural gas hydrates by CO2 replacement-review of lab experiments and field trial."
SPE Bergen One Day Seminar.
Hauge, LP, J Gauteplass, MD Høyland, G Ersland, A Kovscek, and MA Fernø. 2016.
"Pore-level hydrate formation mechanisms using realistic rock structures in high-
pressure silicon micromodels." International Journal of Greenhouse Gas Control
53:178-186.
Helgerud, MB, J Dvorkin, A Nur, A Sakai, and T Collett. 1999. "Elastic‐wave velocity
in marine sediments with gas hydrates: Effective medium modeling." Geophysical
Research Letters 26 (13):2021-2024.
Herri, J-M, A Bouchemoua, Matthias Kwaterski, Amara Fezoua, Yamina Ouabbas,
and Ana Cameirao. 2011. "Gas hydrate equilibria for CO2–N2 and CO2–CH4 gas
mixtures—Experimental studies and thermodynamic modelling." Fluid Phase
Equilibria 301 (2):171-190.
Hester, KC, RM Dunk, Sheri N White, Peter G Brewer, Edward T Peltzer, and ED
Sloan. 2007. "Gas hydrate measurements at Hydrate Ridge using Raman
spectroscopy." Geochimica et Cosmochimica Acta 71 (12):2947-2959.
Hossainpour, Reza. 2013. "Catalysts for Enhanced CO2-CH4 Exchange in Natural Gas
Hydrates. An experimental feasibility study of exchange enhancement by use of
chemical additives." The University of Bergen.
Houghton, John Theodore, YDJG Ding, David J Griggs, Maria Noguer, Paul J van der
Linden, Xiaosu Dai, Kathy Maskell, and CA Johnson. 2001. Climate Change
2001:The Scientific Basis: The Press Syndicate of the University of Cambridge.
House, Kurt Zenz, Daniel P. Schrag, Charles F. Harvey, and Klaus S. Lackner. 2006.
"Permanent carbon dioxide storage in deep-sea sediments." Proceedings of the
National Academy of Sciences 103 (33):12291-12295. doi: 10.1073/pnas.0605318103.
Page 200
175
IEA. 2016. "Decoupling of Global Emissions and Economic Growth Confirmed."
Accessed 23 March. www.iea.org/newsroom/news/2016/march/decoupling-of-global-
emissions-and-economic-growth-confirmed.html.
Iglauer, Stefan. 2017. "CO2–Water–Rock Wettability: Variability, Influencing
Factors, and Implications for CO2 Geostorage." Accounts of Chemical Research 50
(5):1134-1142.
Iglauer, Stefan, and Maxim Lebedev. 2017. "High pressure-elevated temperature x-
ray micro-computed tomography for subsurface applications." Advances in Colloid
and Interface Science.
Iglauer, Stefan, Adriana Paluszny, Christopher H Pentland, and Martin J Blunt. 2011.
"Residual CO2 imaged with X‐ray micro‐tomography." Geophysical Research Letters
38 (21).
Iglauer, Stefan, CH Pentland, and A Busch. 2015. "CO2 wettability of seal and
reservoir rocks and the implications for carbon geo‐sequestration." Water Resources
Research 51 (1):729-774.
IPCC. 2005. "IPCC, 2005: IPCC special report on carbon dioxide capture and storage."
Islam, MR. 1994. "A new recovery technique for gas production from Alaskan gas
hydrates." Journal of petroleum Science and Engineering 11 (4):267-281.
Jhaveri, Jaysukh, and Donald B Robinson. 1965. "Hydrates in the methane‐nitrogen
system." Canadian Journal of Chemical Engineering 43 (2):75-78.
Jin, Shigeki, Jiro Nagao, Satoshi Takeya, Yusuke Jin, Junko Hayashi, Yasushi
Kamata, Takao Ebinuma, and Hideo Narita. 2006. "Structural investigation of methane
hydrate sediments by microfocus X-ray computed tomography technique under high-
pressure conditions." Japanese Journal of Aplied Physics 45 (7L):L714.
Jin, Shigeki, Satoshi Takeya, Junko Hayashi, Jiro Nagao, Yasushi Kamata, Takao
Ebinuma, and Hideo Narita. 2004. "Structure analyses of artificial methane hydrate
Page 201
176
sediments by microfocus X-ray computed tomography." Japanese Journal of Applied
Physics 43 (8R):5673.
Jin, Yusuke, Yoshihiro Konno, and Jiro Nagao. 2012. "Growth of methane clathrate
hydrates in porous media." Energy and Fuels 26 (4):2242-2247.
John, VT, KD Papadopoulos, and GD Holder. 1985. "A generalized model for
predicting equilibrium conditions for gas hydrates." AIChE Journal 31 (2):252-259.
Johnson, A. H. 2013. "Unconventional Energy Resources: 2013 Review." Natural
Resources Research 23 (1):19-98. doi: 10.1007/s11053-013-9224-6.
Johnson, GR, and GR Olhoeft. 1984. "Density of rocks and minerals." In CRC
handbook of physical properties of rocks, edited by R.S. Carmichael, 38. Boca Raton,
FL: CRC Press.
Jones, Emrys, Tom Latham, Daniel Russell McConnell, Matt Frye, Jesse Hunt,
William Shedd, Dianna Shelander, Ray Boswell, Kelly Rose, and Carolyn Ruppel.
2008. "Scientific objectives of the Gulf of Mexico gas hydrate JIP Leg II drilling."
Offshore Technology Conference.
Jones, KW, PB Kerkar, D Mahajan, WB Lindquist, and H Feng. 2007. "Microstructure
of natural hydrate host sediments." Nuclear Instruments and Methods in Physics
Research Section B: Beam Interactions with Materials and Atoms 261 (1):504-507.
Jung, Jong-Won, and J Carlos Santamarina. 2012. "Hydrate formation and growth in
pores." Journal of Crystal Growth 345 (1):61-68.
Kang, S-P, H Lee, C-S Lee, and W-M Sung. 2001. "Hydrate phase equilibria of the
guest mixtures containing CO2, N2 and tetrahydrofuran." Fluid Phase Equilibria 185
(1):101-109.
Kang, Seong-Pil, and Huen Lee. 2000. "Recovery of CO2 from flue gas using gas
hydrate: thermodynamic verification through phase equilibrium measurements."
Environmental science & technology 34 (20):4397-4400.
Page 202
177
Kastanidis, Panagiotis, George E Romanos, Athanassios K Stubos, Ioannis G
Economou, and Ioannis N Tsimpanogiannis. 2017. "Two-and three-phase equilibrium
experimental measurements for the ternary CH4+ CO2+ H2O mixture." Fluid Phase
Equilibria 451:96-105.
Katsuki, Daisuke, Ryo Ohmura, Takao Ebinuma, and Hideo Narita. 2006. "Formation,
growth and ageing of clathrate hydrate crystals in a porous medium." Philosophical
magazine 86 (12):1753-1761.
Katz, Donald L. 1945. "Prediction of conditions for hydrate formation in natural
gases." Transactions of the AIME 160 (01):140-149.
Katz, Donald La Verne. 1959. Handbook of natural gas engineering: McGraw-Hill.
Kelkar, SK, MS Selim, and ED Sloan. 1998. "Hydrate dissociation rates in pipelines."
Fluid Phase Equilibria 150:371-382.
Kelland, Malcolm A. 2006. "History of the Development of Low Dosage Hydrate
Inhibitors." Energy & Fuels 20 (3):825-847. doi: 10.1021/ef050427x.
Kerkar, Prasad B, Kristine Horvat, Keith W Jones, and Devinder Mahajan. 2014.
"Imaging methane hydrates growth dynamics in porous media using synchrotron X‐
ray computed microtomography." Geochemistry, Geophysics, Geosystems 15
(12):4759-4768.
Kerkar, Prasad, Keith W Jones, Robert Kleinberg, W Brent Lindquist, Stan Tomov,
Huan Feng, and Devinder Mahajan. 2009. "Direct observations of three dimensional
growth of hydrates hosted in porous media." Applied physics letters 95 (2):024102.
Khlebnikov, VN, SV Antonov, AS Mishin, DA Bakulin, IV Khamidullina, Meng
Liang, VA Vinokurov, and PA Gushchin. 2016. "A new method for the replacement
of CH4 with CO2 in natural gas hydrate production." Natural Gas Industry B 3 (5):445-
451.
Page 203
178
Kim, Do-Youn, Tae-Won Uhm, Huen Lee, Young-Joo Lee, Byong-Jae Ryu, and Ji-
Hoon Kim. 2005. "Compositional and structural identification of natural gas hydrates
collected at Site 1249 on Ocean Drilling Program Leg 204." Korean Journal of
Chemical Engineering 22 (4):569-572.
Kim, Gil Young, B Narantsetseg, B-J Ryu, D-G Yoo, JY Lee, HS Kim, and Michael
Riedel. 2013. "Fracture orientation and induced anisotropy of gas hydrate-bearing
sediments in seismic chimney-like-structures of the Ulleung Basin, East Sea." Marine
and Petroleum Geology 47:182-194.
Kim, Sun Hyung, Myoung Do Seo, Jeong Won Kang, and Chul Soo Lee. 2011.
"Hydrate-containing phase equilibria for mixed guests of carbon dioxide and
nitrogen." Fluid Phase Equilibria 306 (2):229-233.
King, A. D. 2004. "The solubility of ethane, propane, and carbon dioxide in aqueous
solutions of sodium cumene sulfonate." Journal of Colloid and Interface Science 273
(1):313-319. doi: https://doi.org/10.1016/j.jcis.2003.11.042.
Kleinberg, RL, C Flaum, DD Griffin, PG Brewer, GE Malby, ET Peltzer, and JP
Yesinowski. 2003. "Deep sea NMR: Methane hydrate growth habit in porous media
and its relationship to hydraulic permeability, deposit accumulation, and submarine
slope stability." Journal of Geophysical Research: Solid Earth 108 (B10).
Kneafsey, Timothy J, Yongkoo Seol, Arvind Gupta, and Liviu Tomutsa. 2011.
"Permeability of laboratory-formed methane-hydrate-bearing sand: measurements and
observations using X-ray computed tomography." SPE Journal 16 (01):78-94.
Kneafsey, Timothy J, Liviu Tomutsa, George J Moridis, Yongkoo Seol, Barry M
Freifeld, Charles E Taylor, and Arvind Gupta. 2007. "Methane hydrate formation and
dissociation in a partially saturated core-scale sand sample." Journal of Petroleum
Science and Engineering 56 (1-3):108-126.
Koh, Carolyn A. 2002. "Towards a fundamental understanding of natural gas
hydrates." Chemical Society Reviews 31 (3):157-167.
Page 204
179
Koh, Carolyn A, and E Dendy Sloan. 2007. "Natural gas hydrates: Recent advances
and challenges in energy and environmental applications." AIChE journal 53
(7):1636-1643.
Koh, Carolyn A, E Dendy Sloan, Amadeu K Sum, and David T Wu. 2011.
"Fundamentals and applications of gas hydrates."
Konno, Yoshihiro, Yoshihiro Masuda, Yosuke Hariguchi, Masanori Kurihara, and
Hisanao Ouchi. 2010. "Key factors for depressurization-induced gas production from
oceanic methane hydrates." Energy & fuels 24 (3):1736-1744.
Kuhs, WF, B Chazallon, PG Radaelli, and F Pauer. 1997. "Cage occupancy and
compressibility of deuterated N2-clathrate hydrate by neutron diffraction." Journal of
inclusion phenomena and molecular recognition in chemistry 29 (1):65-77.
Kumar, Anjani, Brij Maini, PR Bishnoi, Matthew Clarke, Olga Zatsepina, and Sanjay
Srinivasan. 2010. "Experimental determination of permeability in the presence of
hydrates and its effect on the dissociation characteristics of gas hydrates in porous
media." Journal of Petroleum Science and Engineering 70 (1-2):114-122.
Kvamme, B, A Graue, T Buanes, T Kuznetsova, and G Ersland. 2007. "Storage of CO2
in natural gas hydrate reservoirs and the effect of hydrate as an extra sealing in cold
aquifers." International Journal of Greenhouse gas control 1 (2):236-246.
Kvenvolden, KA. 1998. "A primer on the geological occurrence of gas hydrate."
Geological Society, London, Special Publications 137 (1):9-30.
Kvenvolden, Keith A. 1988. "Methane hydrate—a major reservoir of carbon in the
shallow geosphere?" Chemical geology 71 (1-3):41-51.
Kvenvolden, Keith A. 1993. "Gas hydrates—geological perspective and global
change." Reviews of geophysics 31 (2):173-187.
Kvenvolden, Keith A. 1999. "Potential effects of gas hydrate on human welfare."
Proceedings of the National Academy of Sciences 96 (7):3420-3426.
Page 205
180
Kvenvolden, Keith A, LA Barnard, and DH Cameron. 1983. "Pressure core barrel-
application to the study of gas hydrates, deep-sea drilling project site-533, leg-76."
Initial Reports of the Deep Sea Drilling Project 76 (NOV):367-375.
Kvenvolden, Keith A, and Leo A Barnard. 1982. "Hydrates of Natural Gas in
Continental Margins: Environmental Processes: Model Investigations of Margin
Environmental and Tectonic Processes."
Kvenvolden, Keith A, and Thomas D Lorenson. 2001. "Global occurrences of gas
hydrate." The Eleventh International Offshore and Polar Engineering Conference.
Kvenvolden, Keith A, and Mark A McMenamin. 1980. "Hydrates of natural gas: a
review of their geologic occurrence."
Kvenvolden, Keith A, and Bruce W Rogers. 2005. "Gaia's breath—global methane
exhalations." Marine and Petroleum Geology 22 (4):579-590.
Kwon, Tae-Hyuk, and Gye-Chun Cho. 2009. "Evolution of compressional wave
velocity during CO2 hydrate formation in sediments." Energy & Fuels 23 (11):5731-
5736.
Kwon, Tae‐Hyuk, Gye‐Chun Cho, and J Carlos Santamarina. 2008. "Gas hydrate
dissociation in sediments: Pressure‐temperature evolution." Geochemistry,
Geophysics, Geosystems 9 (3).
Le Quang, Duyen, Baptiste Bouillot, Jean-Michel Herri, Philippe Glénat, and Pierre
Duchet-Suchaux. 2016. "Experimental procedure and results to measure the
composition of gas hydrate, during crystallization and at equilibrium, from N2–CO2–
CH4–C2H6–C3H8–C4H10 gas mixtures." Fluid Phase Equilibria 413:10-21.
Leaist, DG, JJ Murray, ML Post, and DW Davidson. 1982. "Enthalpies of
decomposition and heat capacities of ethylene oxide and tetrahydrofuran hydrates."
The Journal of Physical Chemistry 86 (21):4175-4178.
Page 206
181
Lebedev, Maxim, Yihuai Zhang, Vassili Mikhaltsevitch, Stefan Inglauer, and Taufiq
Rahman. 2017. "Residual trapping of supercritical CO2: direct pore-scale observation
using a low cost pressure cell for micro computer tomography." Energy Procedia
114:4967-4974.
Lederhos, JP, RL Christiansen, and ED Sloan. 1993. "A first order method of hydrate
equilibrium estimation and its use with new structures." Fluid phase equilibria
83:445-454.
Lee, Jong-Won, Do-Youn Kim, and Huen Lee. 2006. "Phase behavior and structure
transition of the mixed methane and nitrogen hydrates." Korean Journal of Chemical
Engineering 23 (2):299-302.
Lee, JY, J Carlos Santamarina, and C Ruppel. 2010. "Volume change associated with
formation and dissociation of hydrate in sediment." Geochemistry, Geophysics,
Geosystems 11 (3).
Lee, JY, TS Yun, JC Santamarina, and C Ruppel. 2007. "Observations related to
tetrahydrofuran and methane hydrates for laboratory studies of hydrate‐bearing
sediments." Geochemistry, Geophysics, Geosystems 8 (6).
Lee, Myung W, and Timothy S Collett. 2001. "Elastic properties of gas hydrate-
bearing sediments." Geophysics 66 (3):763-771.
Lee, Myung W, and William F Waite. 2008. "Estimating pore‐space gas hydrate
saturations from well log acoustic data." Geochemistry, Geophysics, Geosystems 9
(7).
Lee, Sangyong, Junshe Zhang, Raxit Mehta, T. K. Woo, and Jae W. Lee. 2007.
"Methane Hydrate Equilibrium and Formation Kinetics in the Presence of an Anionic
Surfactant." The Journal of Physical Chemistry C 111 (12):4734-4739. doi:
10.1021/jp0667590.
Lee, Seungmin, Youngjun Lee, Sungwon Park, Yunju Kim, Inuk Cha, and Yongwon
Seo. 2013. "Stability conditions and guest distribution of the methane+ ethane+
Page 207
182
propane hydrates or semiclathrates in the presence of tetrahydrofuran or quaternary
ammonium salts." The Journal of Chemical Thermodynamics 65:113-119.
Lee, Sung-Rock. 2011. "2nd ulleung basin gas hydrate expedition (UBGH2): findings
and implications." Fire in the Ice 11 (1):6-9.
Lee, Yun-Je, Taro Kawamura, Yoshitaka Yamamoto, and Ji-Ho Yoon. 2012. "Phase
equilibrium studies of tetrahydrofuran (THF)+ CH4, THF+ CO2, CH4+ CO2, and THF+
CO2+ CH4 Hydrates." Journal of Chemical & Engineering Data 57 (12):3543-3548.
Li, Feng-Guang, Chang-Yu Sun, Sheng-Li Li, Guang-Jin Chen, Xu-Qiang Guo, Lan-
Ying Yang, Heng Pan, Shi Li, and Ke Zhang. 2012. "Experimental studies on the
evolvement of electrical resistivity during methane hydrate formation in sediments."
Energy & Fuels 26 (10):6210-6217.
Lide, DR, and HPR Frederikse. 1995. "Handbook of Chemistry and Physics, CRC
Press, Inc." Boca Raton, FL.
Linga, Praveen, Adebola Adeyemo, and Peter Englezos. 2007. "Medium-pressure
clathrate hydrate/membrane hybrid process for postcombustion capture of carbon
dioxide." Environmental Science & Technology 42 (1):315-320.
Loh, Matilda, Simon Falser, Ponnivalavan Babu, Praveen Linga, Andrew Palmer, and
Thiam Soon Tan. 2012. "Dissociation of fresh-and seawater hydrates along the phase
boundaries between 2.3 and 17 MPa." Energy & Fuels 26 (10):6240-6246.
Long, Jinping. 1994. "Gas hydrate formation mechanism and kinetic inhibition."
Colerado School of Mines.
Löwig, Carl. 1828. "Ueber einige Bromverbindungen und über Bromdarstellung."
Annalen der Physik 90 (11):485-499.
Lu, Shyi-Min. 2015. "A global survey of gas hydrate development and reserves:
Specifically in the marine field." Renewable and Sustainable Energy Reviews 41
(C):884-900.
Page 208
183
Lu, Zhengquan, and Nabil Sultan. 2008. "Empirical expressions for gas hydrate
stability law, its volume fraction and mass-density at temperatures 273.15 K to 290.15
K." Geochemical Journal 42 (2):163-175.
Lusic, Hrvoje, and Mark W Grinstaff. 2012. "X-ray-computed tomography contrast
agents." Chemical Reviews 113 (3):1641-1666.
Macintosh, N. 2000. "FlowAssurance Still Leading Concern Among Producers. sl:
Offshore."
Makogon, IUriĭ Fedorovich. 1997. Hydrates of hydrocarbons: Pennwell Books.
Makogon, IUriĭ Fedorovich, and Yuri F Makogon. 1997. Hydrates of hydrocarbons:
Pennwell Books.
Makogon, YF. 1965. "A gas hydrate formation in the gas saturated layers under low
temperature." Gas Industry 5:14-15.
Makogon, YF, SA Holditch, and TY Makogon. 2007. "Natural gas-hydrates—A
potential energy source for the 21st Century." Journal of Petroleum Science and
Engineering 56 (1):14-31.
Makogon, Yu F. 1982. "Perspectives for the development of gas hydrate deposits."
Gas hydrates and permafrost: Proceedings of the 4th Canadian Permafrost Conference.
Makogon, Yuri F. 2010. "Natural gas hydrates–A promising source of energy."
Journal of Natural Gas Science and Engineering 2 (1):49-59.
Malone, R.D. 1985. Gas Hydrates Topical Report–DOE. US: METC/SP-218
(DE85001986): Morgantown (DOE, Morgantown Energy Technology Center).
Maslin, Mark, Matthew Owen, Richard Betts, Simon Day, Tom Dunkley Jones, and
Andrew Ridgwell. 2010. "Gas hydrates: past and future geohazard?" Philosophical
Transactions of the Royal Society of London A: Mathematical, Physical and
Engineering Sciences 368 (1919):2369-2393.
Page 209
184
Mavko, Gary, Tapan Mukerji, and Jack Dvorkin. 2009. The rock physics handbook:
Tools for seismic analysis of porous media: Cambridge university press.
Max, Michael D, Arthur H Johnson, and William P Dillon. 2005. Economic geology
of natural gas hydrate. Vol. 9: Springer Science & Business Media.
Max, Michael D, Arthur H Johnson, and William P Dillon. 2013. Natural Gas
Hydrate-Arctic Ocean Deepwater Resource Potential: Springer.
Mayr, Sibylle I, and Hans Burkhardt. 2006. "Ultrasonic properties of sedimentary
rocks: Effect of pressure, saturation, frequency and microcracks." Geophysical
Journal International 164 (1):246-258.
McGuire, Patrick L. 1981. Methane hydrate gas production by thermal stimulation.
Los Alamos Scientific Lab., NM (USA).
Mehta, Ajay P, and E Dendy Sloan. 1994. "A thermodynamic model for structure‐H
hydrates." AIChE journal 40 (2):312-320.
Mehta, Ajay P, and E Dendy Sloan Jr. 1994. "Structure H hydrate phase equilibria of
paraffins, naphthenes, and olefins with methane." Journal Of Chemical And
Engineering Data 39 (4):887-890.
Mei, Dong-Hai, Jian Liao, Ji-Tao Yang, and Tian-Min Guo. 1996. "Experimental and
modeling studies on the hydrate formation of a methane+ nitrogen gas mixture in the
presence of aqueous electrolyte solutions." Industrial and engineering chemistry
research 35 (11):4342-4347.
Mekala, Prathyusha, Ponnivalavan Babu, Jitendra S Sangwai, and Praveen Linga.
2014. "Formation and dissociation kinetics of methane hydrates in seawater and silica
sand." Energy & Fuels 28 (4):2708-2716.
Meyer, RF. 1981. "Speculations on oil and gas resources in small fields and
unconventional deposits." Long-term energy resources:49-72.
Page 210
185
Misyura, S Ya. 2013. "Effect of heat transfer on the kinetics of methane hydrate
dissociation." Chemical Physics Letters 583:34-37.
Mohammadi, Amir H, Ross Anderson, and Bahman Tohidi. 2005. "Carbon monoxide
clathrate hydrates: equilibrium data and thermodynamic modeling." AIChE journal
51 (10):2825-2833.
Mohebbi, V., A. Naderifar, R. M. Behbahani, and M. Moshfeghian. 2012.
"Investigation of kinetics of methane hydrate formation during isobaric and isochoric
processes in an agitated reactor." Chemical Engineering Science 76:58-65. doi:
https://doi.org/10.1016/j.ces.2012.04.016.
Moon, Changman, Paul C Taylor, and P Mark Rodger. 2003. "Molecular dynamics
study of gas hydrate formation." Journal of the American Chemical Society 125
(16):4706-4707.
Moridis, George J. 2008. "Toward production from gas hydrates: current status,
assessment of resources, and simulation-based evaluation of technology and
potential." Lawrence Berkeley National Laboratory.
Moridis, George J, Timothy S Collett, Ray Boswell, Masanori Kurihara, Matthew T
Reagan, Carolyn Koh, and E Dendy Sloan. 2009. "Toward production from gas
hydrates: current status, assessment of resources, and simulation-based evaluation of
technology and potential." SPE Reservoir Evaluation & Engineering 12 (05):745-771.
Mork, Marit, Grethe Schei, and Roar Larsen. 2000. "NMR imaging study of hydrates
in sediments." Annals of the New York Academy of Sciences 912 (1):897-905.
Motiee, M. 1991. "Estimate possibility of hydrates." Hydrocarbon processing 70
(7):98-99.
Najibi, Hesam, Antonin Chapoy, Hooman Haghighi, and Bahman Tohidi. 2009.
"Experimental determination and prediction of methane hydrate stability in alcohols
and electrolyte solutions." Fluid Phase Equilibria 275 (2):127-131.
Page 211
186
Nakajima, Yasuharu, Tatsuya Takaoki, Kazunari Ohgaki, and Susumu Ota. 2002. "Use
of hydrate pellets for transportation of natural gas-II-proposition of natural gas
transportation in form of Hydrate pellets." Proc. 4th Int. Conf. Gas Hydrates.
Nakamura, Toshiyuki, Takashi Makino, Takeshi Sugahara, and Kazunari Ohgaki.
2003. "Stability boundaries of gas hydrates helped by methane—structure-H hydrates
of methylcyclohexane and cis-1, 2-dimethylcyclohexane." Chemical engineering
science 58 (2):269-273.
Nakano, Shinya, Masato Moritoki, and Kazunari Ohgaki. 1999. "High-pressure phase
equilibrium and Raman microprobe spectroscopic studies on the methane hydrate
system." Journal of Chemical & Engineering Data 44 (2):254-257.
Ng, Heng-Joo, and Donald B Robinson. 1976. "The measurement and prediction of
hydrate formation in liquid hydrocarbon-water systems." Industrial & Engineering
Chemistry Fundamentals 15 (4):293-298.
Obanijesu, Emmanuel O, Ahmed Barifcani, Vishnu K Pareek, and Moses O Tade.
2014. "Experimental study on feasibility of H2 and N2 as hydrate inhibitors in natural
gas pipelines." Journal of Chemical & Engineering Data 59 (11):3756-3766.
Ohgaki, K. 1994. "A proposal for gas storage on the bottom of the ocean using gas
hydrates." Int. Chem. Eng. 34:417-419.
Ohgaki, Kazunari, Yoshihiro Makihara, and Kiyoteru Takano. 1993. "Formation of
CO2 Hydrate in Pure and Sea Waters." Journal of chemical engineering of Japan 26
(5):558-564.
Ohgaki, Kazunari, Kiyoteru Takano, and Masato Moritoki. 1994. "Exploitation of CH4
Hydrates under the Nankai Trough in Combination with CO2 Storage." Kagaku
Kogaku Ronbunshu 20:121-121.
Ohmura, Ryo, Toru Shigetomi, and Yasuhiko H Mori. 1999. "Formation, growth and
dissociation of clathrate hydrate crystals in liquid water in contact with a hydrophobic
hydrate-forming liquid." Journal of crystal growth 196 (1):164-173.
Page 212
187
Orr, Franklin M. 2009. "Onshore geologic storage of CO2." Science 325 (5948):1656-
1658.
Pachauri, Rajendra K, Myles R Allen, Vicente R Barros, John Broome, Wolfgang
Cramer, Renate Christ, John A Church, Leon Clarke, Qin Dahe, and Purnamita
Dasgupta. 2014. Climate change 2014: synthesis report. Contribution of Working
Groups I, II and III to the fifth assessment report of the Intergovernmental Panel on
Climate Change: IPCC.
Park, Kyeong-nam, Sang Yeon Hong, Jin Woo Lee, Kyung Chan Kang, Young Cheol
Lee, Myung-Gyu Ha, and Ju Dong Lee. 2011. "A new apparatus for seawater
desalination by gas hydrate process and removal characteristics of dissolved minerals
(Na+, Mg2+, Ca2+, K+, B3+)." Desalination 274 (1):91-96.
Park, Taehyung, Daeseung Kyung, and Woojin Lee. 2014. "Effect of organic matter
on CO2 hydrate phase equilibrium in phyllosilicate suspensions." Environmental
Science and Technology 48 (12):6597-6603.
Parkes, Ronald John, BA Cragg, JC Fry, RA Herbert, and JWT Wimpenny. 1990.
"Bacterial biomass and activity in deep sediment layers from the Peru margin." Phil.
Trans. R. Soc. Lond. A 331 (1616):139-153.
Parrish, William R, and John M Prausnitz. 1972. "Dissociation pressures of gas
hydrates formed by gas mixtures." Industrial & Engineering Chemistry Process
Design and Development 11 (1):26-35.
Paull, C., W.S. Reeburgh, S.R. Dallimore, G. Enciso, C.A. Koh, K.A. Kvenvolden, C.
Mankin, and M. Riedel. 2010. Realizing the energy potential of methane hydrate for
the United States. Washington DC: National Research Council of the National
Academies.
Pearson, C, J Murphy, and R Hermes. 1986. "Acoustic and resistivity measurements
on rock samples containing tetrahydrofuran hydrates: laboratory analogues to natural
gas hydrate deposits." Journal of Geophysical Research: Solid Earth 91 (B14):14132-
14138.
Page 213
188
Pearson, CF, PM Halleck, PL McGuire, R Hermes, and M Mathews. 1983. "Natural
gas hydrate deposits: A review of in situ properties." The Journal of Physical
Chemistry 87 (21):4180-4185.
Peng, Ding-Yu, and Donald B Robinson. 1976. "A new two-constant equation of
state." Industrial & Engineering Chemistry Fundamentals 15 (1):59-64.
Perrin, Andrea, Osama M. Musa, and Jonathan W. Steed. 2013. "The chemistry of low
dosage clathrate hydrate inhibitors." Chemical Society Reviews 42 (5):1996-2015. doi:
10.1039/C2CS35340G.
Pickering, Spencer Umfreville. 1893. "X.—The hydrate theory of solutions. Some
compounds of the alkyl-amines and ammonia with water." Journal of the Chemical
Society, Transactions 63:141-195.
Prakash, Anand, BG Samanta, and NP Singh. 2010. "A seismic study to investigate
the prospect of gas hydrate in Mahanadi deep water basin, northeastern continental
margin of India." Marine Geophysical Researches 31 (4):253-262.
Priest, Jeffrey A, Angus I Best, and Christopher RI Clayton. 2005. "A laboratory
investigation into the seismic velocities of methane gas hydrate‐bearing sand."
Journal of Geophysical Research: Solid Earth 110 (B4).
Priest, Jeffrey A, Emily VL Rees, and Christopher RI Clayton. 2009. "Influence of gas
hydrate morphology on the seismic velocities of sands." Journal of Geophysical
Research: Solid Earth (1978–2012) 114 (B11).
Rabbel, Wolfgang. 2006. "Seismic methods." In Groundwater geophysics, 23-83.
Springer.
Rahman, Taufiq, Maxim Lebedev, Ahmed Barifcani, and Stefan Iglauer. 2016.
"Residual trapping of supercritical CO2 in oil-wet sandstone." Journal of Colloid and
Interface Science 469:63-68.
Page 214
189
Rees, Emily VL, Jeffery A Priest, and Chris RI Clayton. 2011. "The structure of
methane gas hydrate bearing sediments from the Krishna–Godavari Basin as seen from
Micro-CT scanning." Marine and Petroleum Geology 28 (7):1283-1293.
Rice, Warren. 2006. "Hydrogen production from methane hydrate with sequestering
of carbon dioxide." International Journal of Hydrogen Energy 31 (14):1955-1963.
Ripmeester, John A, S Tse John, Christopher I Ratcliffe, and Brian M Powell. 1987.
"A new clathrate hydrate structure." Nature 325 (6100):135-136.
Ripmeester, John A, and Christopher I Ratcliffe. 1998. "The diverse nature of
dodecahedral cages in clathrate hydrates as revealed by 129Xe and 13C NMR
spectroscopy: CO2 as a small-cage guest." Energy & fuels 12 (2):197-200.
Rochelle, CA, AP Camps, D Long, A Milodowski, K Bateman, D Gunn, P Jackson,
MA Lovell, and J Rees. 2009. "Can CO2 hydrate assist in the underground storage of
carbon dioxide?" Geological Society, London, Special Publications 319 (1):171-183.
Röntgen, Wilhelm Conrad. 1896. "On a new kind of rays." Science 3 (59):227-231.
Roozeboom, HW. 1885. "Sur la dissociation des hydrates de l'acide sulfureux, du
chlore et du brome." Recueil des Travaux Chimiques des Pays-Bas 4 (2):65-73.
Rydzy, Marisa B, and Michael L Batzle. 2010. "Ultrasonic velocities in laboratory-
formed gas hydrate-bearing sediments." 23rd EEGS Symposium on the Application of
Geophysics to Engineering and Environmental Problems.
Sabil, Khalik M, Qazi Nasir, Bezhad Partoon, and Akbar A Seman. 2014.
"Measurement of H–LW–V and Dissociation Enthalpy of Carbon Dioxide Rich
Synthetic Natural Gas Mixtures." Journal of Chemical and Engineering Data 59
(11):3502-3509.
Sadeq, Dhifaf, Stefan Iglauer, Maxim Lebedev, and Ahmed Barifcani. 2018.
"Prediction of Hydrate Phase Equilibrium Conditions for Different Gas Mixtures."
Offshore Technology Conference Asia.
Page 215
190
Sadeq, Dhifaf, Stefan Iglauer, Maxim Lebedev, Taufiq Rahman, Yihuai Zhang, and
Ahmed Barifcani. 2018. "Experimental pore-scale analysis of carbon dioxide hydrate
in sandstone via X-Ray micro-computed tomography." International Journal of
Greenhouse Gas Control 79:73-82.
Sadeq, Dhifaf, Stefan Iglauer, Maxim Lebedev, Callum Smith, and Ahmed Barifcani.
2017. "Experimental determination of hydrate phase equilibrium for different gas
mixtures containing methane, carbon dioxide and nitrogen with motor current
measurements." Journal of Natural Gas Science and Engineering 38:59-73.
Saito, Shozaburo, and Riki Kobayashi. 1965. "Hydrates at high pressures: Part III.
Methane‐argon‐water, argon‐nitrogen‐water system." AIChE Journal 11 (1):96-99.
Salufu, Samuel O, and Princess Nwakwo. 2013. "New Empirical Correlation for
Predicting Hydrate Formation Conditions." SPE Nigeria Annual International
Conference and Exhibition.
Santamarina, J Carlos, and Carolyn Ruppel. 2010. "The impact of hydrate saturation
on the mechanical, electrical, and thermal properties of hydrate-bearing sand, silts, and
clay." Geophysical Characterization of Gas Hydrates, Geophys. Dev. Ser 14:373-384.
Sassen, R, SL Losh, L Cathles III, HH Roberts, JK Whelan, AV Milkov, ST Sweet,
and DA DeFreitas. 2001. "Massive vein-filling gas hydrate: relation to ongoing gas
migration from the deep subsurface in the Gulf of Mexico." Marine and Petroleum
Geology 18 (5):551-560.
Sassen, Roger, and Ian R MacDonald. 1994. "Evidence of structure H hydrate, Gulf of
Mexico continental slope." Organic Geochemistry 22 (6):1029-1032.
Sato, Mitsutaka, Satoshi Takeya, Jiro Nagao, Shigeki Jin, Yasushi Kamata, Hideki
Minagawa, Takao Ebinuma, and Hideo Narita. 2005. "Distribution of hydrate
saturation ratios in artificial methane hydrate sediments measured by high-speed X-
ray computerized tomography." Japanese Journal of Applied Physics 44 (1R):473.
Page 216
191
Scalabrin, G, P Marchi, F Finezzo, and R Span. 2006. "A reference multiparameter
thermal conductivity equation for carbon dioxide with an optimized functional form."
Journal of physical and chemical reference data 35 (4):1549-1575.
Schicks, Judith M, Erik Spangenberg, Ronny Giese, Bernd Steinhauer, Jens Klump,
and Manja Luzi. 2011. "New approaches for the production of hydrocarbons from
hydrate bearing sediments." Energies 4 (1):151-172.
Schindler, Mandy, and Michael L Batzle. 2015. "Pore-Scale Investigations of Hydrate
Bearing Sediments." In Pore Scale Phenomena: Frontiers in Energy and Environment,
115-133. World Scientific.
Schindler, Mandy, Michael L Batzle, and Manika Prasad. 2017. "Micro X‐Ray
computed tomography imaging and ultrasonic velocity measurements in
tetrahydrofuran‐hydrate‐bearing sediments." Geophysical Prospecting 65 (4):1025-
1036.
Schlüter, Steffen, Adrian Sheppard, Kendra Brown, and Dorthe Wildenschild. 2014.
"Image processing of multiphase images obtained via X‐ray microtomography: a
review." Water Resources Research 50 (4):3615-3639.
Schoderbek, David, and Ray Boswell. 2011. "Iġnik sikumi# 1, gas hydrate test well,
successfully installed on the Alaska North slope." Natural Gas & Oil 304:285-4541.
Schon, JH. 1998. "Physical properties of rocks: Fundamentals and principles of
petrophysics." Handbook of geophysical exploration.
Seo, Yu-Taek, Seong-Pil Kang, Huen Lee, Chul-Soo Lee, and Won-Mo Sung. 2000.
"Hydrate phase equilibria for gas mixtures containing carbon dioxide: a proof-of-
concept to carbon dioxide recovery from multicomponent gas stream." Korean
Journal of Chemical Engineering 17 (6):659-667.
Seo, Yu-Taek, and Huen Lee. 2001. "Multiple-phase hydrate equilibria of the ternary
carbon dioxide, methane, and water mixtures." The Journal of Physical Chemistry B
105 (41):10084-10090.
Page 217
192
Seo, Yu-Taek, and Huen Lee. 2004. "Structure and guest distribution of the mixed
carbon dioxide and nitrogen hydrates as revealed by X-ray diffraction and 13C NMR
spectroscopy." The Journal of Physical Chemistry B 108 (2):530-534.
Seo, Yu-Taek, Huen Lee, and Ji-Ho Yoon. 2001. "Hydrate phase equilibria of the
carbon dioxide, methane, and water system." Journal of Chemical and Engineering
Data 46 (2):381-384.
Seol, Yongkoo, and Evgeniy Myshakin. 2011. "Experimental and numerical
observations of hydrate reformation during depressurization in a core-scale reactor."
Energy & Fuels 25 (3):1099-1110.
Servio, Phillip, Fritz Lagers, Cor Peters, and Peter Englezos. 1999. "Gas hydrate phase
equilibrium in the system methane–carbon dioxide–neohexane and water." Fluid
phase equilibria 158:795-800.
Sfaxi, Imen Ben Attouche, Veronica Belandria, Amir H Mohammadi, Rafael Lugo,
and Dominique Richon. 2012. "Phase equilibria of CO2+ N2 and CO2+ CH4 clathrate
hydrates: Experimental measurements and thermodynamic modelling." Chemical
Engineering Science 84:602-611.
Shaw, George H. 1986. "Elastic properties and equation of state of high pressure ice."
The Journal of chemical physics 84 (10):5862-5868.
Shipley, Thomas H, Mark H Houston, Richard T Buffler, F Jeanne Shaub, Kenneth J
McMillen, John W Ladd, and J Lamar Worzel. 1979. "Seismic evidence for
widespread possible gas hydrate horizons on continental slopes and rises." AAPG
bulletin 63 (12):2204-2213.
Sira, JH, SL Patil, and VA Kamath. 1990. "Study of hydrate dissociation by methanol
and glycol injection." SPE Annual technical conference and exhibition.
Sloan , E Dendy. 2003. "Fundamental principles and applications of natural gas
hydrates." Nature 426 (6964):353.
Page 218
193
Sloan, E Dendy. 2005. "A changing hydrate paradigm—from apprehension to
avoidance to risk management." Fluid Phase Equilibria 228:67-74.
Sloan, E Dendy, and Carolyn Koh. 2008. Clathrate hydrates of natural gases. 3rd ed.
New York: CRC press.
Sloan, E Dendy, Carolyn Ann Koh, and Amadeu Sum. 2010. Natural gas hydrates in
flow assurance: Gulf Professional Publishing.
Sloan, ED, and F Fleyfel. 1991. "A molecular mechanism for gas hydrate nucleation
from ice." AIChE Journal 37 (9):1281-1292.
Smith, Callum, Ahmed Barifcani, and David Pack. 2015. "Gas hydrate formation and
dissociation numerical modelling with nitrogen and carbon dioxide." Journal of
Natural Gas Science and Engineering 27:1118-1128.
Smith, Callum, Ahmed Barifcani, and David Pack. 2016. "Helium substitution of
natural gas hydrocarbons in the analysis of their hydrate." Journal of Natural Gas
Science and Engineering 35:1293-1300.
Song, Yongchen, Chuanxiao Cheng, Jiafei Zhao, Zihao Zhu, Weiguo Liu, Mingjun
Yang, and Kaihua Xue. 2015. "Evaluation of gas production from methane hydrates
using depressurization, thermal stimulation and combined methods." Applied Energy
145:265-277.
Spangenberg, E, J Kulenkampff, R Naumann, and J Erzinger. 2005. "Pore space
hydrate formation in a glass bead sample from methane dissolved in water."
Geophysical Research Letters 32 (24).
Spangenberg, Erik, and Johannes Kulenkampff. 2006. "Influence of methane hydrate
content on electrical sediment properties." Geophysical Research Letters 33 (24).
Spangenberg, Erik, Mike Priegnitz, Katja Heeschen, and Judith M Schicks. 2014. "Are
laboratory-formed hydrate-bearing systems analogous to those in nature?" Journal of
Chemical & Engineering Data 60 (2):258-268.
Page 219
194
Spence, GD, RR Haacke, and RD Hyndman. 2010. "Seismic indicators of natural gas
hydrate and underlying free gas." In Geophysical Characterization of Gas Hydrates,
39-71. Society of Exploration Geophysicists.
Stauffer, Dietrich. 1979. "Scaling theory of percolation clusters." Physics Reports 54
(1):1-74.
Strizhov, I. N., and I. E. Khodanovich. 1946. "Gas Production. Gostoptekhizdat.
Moscow, Russia. ."
Strobel, Timothy A, Carolyn A Koh, and E Dendy Sloan. 2009. "Thermodynamic
predictions of various tetrahydrofuran and hydrogen clathrate hydrates." Fluid Phase
Equilibria 280 (1):61-67.
Suess, Erwin, Gerhard Bohrmann, Jens Greinert, and Erwin Lausch. 1999.
"Flammable ice." Scientific American 281 (5):76-83.
Sultan, Nabil, Pierre Cochonat, J-P Foucher, and J Mienert. 2004. "Effect of gas
hydrates melting on seafloor slope instability." Marine geology 213 (1):379-401.
Sum, Amadeu K, Robert C Burruss, and E Dendy Sloan. 1997. "Measurement of
clathrate hydrates via Raman spectroscopy." The Journal of Physical Chemistry B 101
(38):7371-7377.
Sun, Shi-Cai, Chang-Ling Liu, and Qing-Guo Meng. 2015. "Hydrate phase
equilibrium of binary guest-mixtures containing CO2 and N2 in various systems." The
Journal of Chemical Thermodynamics 84:1-6.
Sun, Zhi-gao, Ruzhu Wang, Rongsheng Ma, Kaihua Guo, and Shuanshi Fan. 2003.
"Natural gas storage in hydrates with the presence of promoters." Energy Conversion
and Management 44 (17):2733-2742.
Ta, Xuan Hien, Tae Sup Yun, Balasingam Muhunthan, and Tae‐Hyuk Kwon. 2015.
"Observations of pore‐scale growth patterns of carbon dioxide hydrate using X‐ray
Page 220
195
computed microtomography." Geochemistry, Geophysics, Geosystems 16 (3):912-
924.
Taheri, Zahra, Mohammad Reza Shabani, Khodadad Nazari, and Ali Mehdizaheh.
2014. "Natural gas transportation and storage by hydrate technology: Iran case study."
Journal of Natural Gas Science and Engineering 21:846-849.
Takeishi, Reiji. 2014. "Japan's Energy Policy in the Asian Region." Public Policy
Review 10 (1):153-187.
Tao, G, MS King, and M Nabi‐Bidhendi. 1995. "Ultrasonic wave propagation in dry
and brine‐saturated sandstones as a function of effective stress: laboratory
measurements and modelling 1." Geophysical Prospecting 43 (3):299-327.
Thomas, Sydney, and Richard A Dawe. 2003. "Review of ways to transport natural
gas energy from countries which do not need the gas for domestic use." Energy 28
(14):1461-1477.
Tohidi, Bahman, Ross Anderson, M Ben Clennell, Rod W Burgass, and Ali B
Biderkab. 2001. "Visual observation of gas-hydrate formation and dissociation in
synthetic porous media by means of glass micromodels." Geology 29 (9):867-870.
Tohidi, Bahman, Jinhai Yang, Manoochehr Salehabadi, Ross Anderson, and Antonin
Chapoy. 2010. "CO2 hydrates could provide secondary safety factor in subsurface
sequestration of CO2." Environmental Science and Technology 44 (4):1509-1514.
Tohidi, Burgass, RW Burgass, A Danesh, KK Østergaard, and AC Todd. 2000.
"Improving the accuracy of gas hydrate dissociation point measurements." Annals of
the New York Academy of Sciences 912 (1):924-931.
Torres, ME, Ann M Trehu, N Cespedes, M Kastner, UG Wortmann, J-H Kim, P Long,
A Malinverno, JW Pohlman, and Michael Riedel. 2008. "Methane hydrate formation
in turbidite sediments of northern Cascadia, IODP Expedition 311." Earth and
Planetary Science Letters 271 (1):170-180.
Page 221
196
Trehu, Ann M, Philip E Long, ME Torres, GRRF Bohrmann, FR Rack, TS Collett, DS
Goldberg, AV Milkov, Michael Riedel, and P Schultheiss. 2004. "Three-dimensional
distribution of gas hydrate beneath southern Hydrate Ridge: constraints from ODP Leg
204." Earth and Planetary Science Letters 222 (3):845-862.
Tse, JS, BM Powell, VF Sears, and YP Handa. 1993. "The lattice dynamics of clathrate
hydrates. An incoherent inelastic neutron scattering study." Chemical physics letters
215 (4):383-387.
Uchida, Takashi, Scott Dallimore, and JUN Mikami. 2000. "Occurrences of Natural
Gas Hydrates beneath the Permafrost Zone in Mackenzie Delta: Visual and X‐ray CT
Imagery." Annals of the New York Academy of Sciences 912 (1):1021-1033.
Udachin, KA, CI Ratcliffe, GD Enright, and JA Ripmeester. 1997. "Structure H
hydrate: A single crystal diffraction study of 2, 2-dimethylpentane· 5 (Xe, H2S)·
34H2O." Supramolecular Chemistry 8 (3):173-176.
Ueno, Hiroki, Hotaka Akiba, Satoru Akatsu, and Ryo Ohmura. 2015. "Crystal growth
of clathrate hydrates formed with methane+ carbon dioxide mixed gas at the gas/liquid
interface and in liquid water." New Journal of Chemistry 39 (11):8254-8262.
Unruh, Carl H, and Donald L Katz. 1949. "Gas hydrates of carbon dioxide-methane
mixtures." Journal of Petroleum Technology 1 (04):83-86.
Van Cleeff, A, and GAM Diepen. 1960. "Gas hydrates of nitrogen and oxygen."
Recueil des Travaux Chimiques des Pays-Bas 79 (6):582-586.
van der Waals, JH, and JC Platteeuw. 1959. "Clathrate solutions." Advances in
Chemical Physics 2:1-57.
Van Geet, Maarten, Rudy Swennen, and Martine Wevers. 2000. "Quantitative analysis
of reservoir rocks by microfocus X-ray computerised tomography." Sedimentary
Geology 132 (1):25-36.
Page 222
197
Veluswamy, Hari Prakash, Weng Inn Chin, and Praveen Linga. 2014. "Clathrate
hydrates for hydrogen storage: the impact of tetrahydrofuran, tetra-n-butylammonium
bromide and cyclopentane as promoters on the macroscopic kinetics." International
Journal of Hydrogen Energy 39 (28):16234-16243.
Villard, P. 1890. "Sur l'hydrate et la composition des hydrates de gaz." C.R. Acad.
Sci., Paris 119:368-371.
Villard, P. 1896. "Combination de l’argon avec l’eau." Comptes Rendus
Hebdomadaires des Seances de l’Academie des Sciences 123:377-380.
Villard, Paul. 1888. "Sur quelques nouveaux hydrates de gaz." Compt. rend 106:1602-
1603.
Vinegar, Harold J, and Scott L Wellington. 1987. "Tomographic imaging of three‐
phase flow experiments." Review of Scientific Instruments 58 (1):96-107.
von Stackelberg, M, and HR Müller. 1954. "Feste Gas Hydrate II." Zeitschrift fuer
Elektrochem 58:25-31.
Von Stackelberg, Mv. 1954. "Fete Gashydrate II. Struktur and Raumchemie." Zeit. F.
Elektro. 58:25.
Waite, William F, Timothy J Kneafsey, William J Winters, and DH Mason. 2008.
"Physical property changes in hydrate‐bearing sediment due to depressurization and
subsequent repressurization." Journal of Geophysical Research: Solid Earth 113 (B7).
Waite, William F, J Carlos Santamarina, Douglas D Cortes, Brandon Dugan, DN
Espinoza, J Germaine, Jaewon Jang, JW Jung, Timothy J Kneafsey, and H Shin. 2009.
"Physical properties of hydrate‐bearing sediments." Reviews of Geophysics 47 (4).
Waite, William F, and E Spangenberg. 2013. "Gas hydrate formation rates from
dissolved‐phase methane in porous laboratory specimens." Geophysical Research
Letters 40 (16):4310-4315.
Page 223
198
Waite, William F, William J Winters, and DH Mason. 2004. "Methane hydrate
formation in partially water-saturated Ottawa sand." American Mineralogist 89 (8-
9):1202-1207.
Wang, Yi, Xiao-Sen Li, Gang Li, Ning-Sheng Huang, and Jing-Chun Feng. 2014.
"Experimental study on the hydrate dissociation in porous media by five-spot thermal
huff and puff method." Fuel 117:688-696.
Wenji, Song, Xiao Rui, Huang Chong, He Shihui, Dong Kaijun, and Feng Ziping.
2009. "Experimental investigation on TBAB clathrate hydrate slurry flows in a
horizontal tube: Forced convective heat transfer behaviors." international journal of
refrigeration 32 (7):1801-1807.
Whiffen, BL, H Kiefte, and MJ Clouter. 1982. "Determination of acoustic velocities
in xenon and methane hydrates by Brillouin spectroscopy." Geophysical Research
Letters 9 (6):645-648.
White, Curt M, Brian R Strazisar, Evan J Granite, James S Hoffman, and Henry W
Pennline. 2003. "Separation and capture of CO2 from large stationary sources and
sequestration in geological formations—coalbeds and deep saline aquifers." Journal
of the Air and Waste Management Association 53 (6):645-715.
Whiticar, Michael J, Eckard Faber, and Martin Schoell. 1986. "Biogenic methane
formation in marine and freshwater environments: CO2 reduction vs. acetate
fermentation—isotope evidence." Geochimica et Cosmochimica Acta 50 (5):693-709.
Wilcox, Willard I, DB Carson, and DL Katz. 1941. "Natural gas hydrates." Industrial
& Engineering Chemistry 33 (5):662-665.
Wildenschild, Dorthe, and Adrian P Sheppard. 2013. "X-ray imaging and analysis
techniques for quantifying pore-scale structure and processes in subsurface porous
medium systems." Advances in Water Resources 51:217-246.
Page 224
199
Winters, William J, Ingo A Pecher, William F Waite, and David H Mason. 2004.
"Physical properties and rock physics models of sediment containing natural and
laboratory-formed methane gas hydrate." American Mineralogist 89 (8-9):1221-1227.
Winters, William J, William F Waite, DH Mason, LY Gilbert, and IA Pecher. 2007.
"Methane gas hydrate effect on sediment acoustic and strength properties." Journal of
Petroleum Science and Engineering 56 (1):127-135.
Winters, William, Michael Walker, Robert Hunter, Timothy Collett, Ray Boswell,
Kelly Rose, William Waite, Marta Torres, Shirish Patil, and Abhijit Dandekar. 2011.
"Physical properties of sediment from the Mount Elbert gas hydrate stratigraphic test
well, Alaska North Slope." Marine and Petroleum Geology 28 (2):361-380.
Wood, David A. 2015. "Gas hydrate research advances steadily on multiple fronts: A
collection of published research (2009–2015)." Journal of Natural Gas Science and
Engineering (24):A1-A8.
Worthington, Paul F. 2010. "Petrophysical evaluation of gas-hydrate formations."
Petroleum Geoscience 16 (1):53-66.
Wróblewski, Zygmunt Florenty. 1882. Sur la combinaison de l'acide carbonique et de
l'eau.
Xie, Yingming, Gang Li, Daoping Liu, Ni Liu, Yingxia Qi, Deqing Liang, Kaihua
Guo, and Shuanshi Fan. 2010. "Experimental study on a small scale of gas hydrate
cold storage apparatus." Applied Energy 87 (11):3340-3346.
Xu, Wenyue, and Carolyn Ruppel. 1999. "Predicting the occurrence, distribution, and
evolution of methane gas hydrate in porous marine sediments." Journal of
Geophysical Research: Solid Earth 104 (B3):5081-5095.
Xue, Kaihua, Jiafei Zhao, Yongchen Song, Weiguo Liu, Weihaur Lam, Yiming Zhu,
Yu Liu, Chuanxiao Cheng, and Di Liu. 2012. "Direct observation of THF hydrate
formation in porous microstructure using magnetic resonance imaging." Energies 5
(4):898-910.
Page 225
200
Yamamoto, Koji, Yoshihiro Terao, Tesuya Fujii, Terumichi Ikawa, Makoto Seki,
Maki Matsuzawa, and Takayuki Kanno. 2014. "Operational overview of the first
offshore production test of methane hydrates in the Eastern Nankai Trough." Offshore
Technology Conference.
Yamasaki, Akihiro. 2003. "An overview of CO2 mitigation options for global
warming—emphasizing CO2 sequestration options." Journal of Chemical
Engineering of Japan 36 (4):361-375.
Yang, Hongqun, Zhenghe Xu, Maohong Fan, Rajender Gupta, Rachid B Slimane,
Alan E Bland, and Ian Wright. 2008. "Progress in carbon dioxide separation and
capture: A review." Journal of Environmental Sciences 20 (1):14-27.
Yang, Mingjun, Yongchen Song, Xuke Ruan, Yu Liu, Jiafei Zhao, and Qingping Li.
2012. "Characteristics of CO2 Hydrate Formation and Dissociation in Glass Beads and
Silica Gel." Energies 5 (4):925-937.
You, Kehua, Timothy J Kneafsey, Peter B Flemings, Peter Polito, and Steven L
Bryant. 2015. "Salinity‐buffered methane hydrate formation and dissociation in gas‐
rich systems." Journal of Geophysical Research: Solid Earth 120 (2):643-661.
Yun, Tae Sup, FM Francisca, J Carlos Santamarina, and C Ruppel. 2005.
"Compressional and shear wave velocities in uncemented sediment containing gas
hydrate." Geophysical Research Letters 32 (10).
Yun, Tae Sup, J Carlos Santamarina, and C Ruppel. 2007. "Mechanical properties of
sand, silt, and clay containing tetrahydrofuran hydrate." Journal of geophysical
research: solid earth 112 (B4).
Yun, TS, GA Narsilio, JC Santamarina, and C Ruppel. 2006. "Instrumented pressure
testing chamber for characterizing sediment cores recovered at in situ hydrostatic
pressure." Marine Geology 229 (3-4):285-293.
Zarinabadi, Soroush, and Amir Samimi. 2012. "Problems of hydrate formation in oil
and gas pipes deals." Journal of American Science 8 (8).
Page 226
201
Zatsepina, Olga Ye, Hassan Hassanzadeh, and Mehran Pooladi‐Darvish. 2014.
"Geological Storage of CO2 as Hydrate in a McMurray Depleted Gas Reservoir." Gas
Injection for Disposal and Enhanced Recovery:311-329.
Zhao, Jiafei, Kun Xu, Yongchen Song, Weiguo Liu, Weihaur Lam, Yu Liu, Kaihua
Xue, Yiming Zhu, Xichong Yu, and Qingping Li. 2012. "A review on research on
replacement of CH4 in natural gas hydrates by use of CO2." Energies 5 (2):399-419.
Zhao, Jiafei, Lei Yang, Yu Liu, and Yongchen Song. 2015. "Microstructural
characteristics of natural gas hydrates hosted in various sand sediments." Physical
Chemistry Chemical Physics 17 (35):22632-22641.
Zhao, Jiafei, Lei Yang, Kaihua Xue, Weihaur Lam, Yanghui Li, and Yongchen Song.
2014. "In situ observation of gas hydrates growth hosted in porous media." Chemical
Physics Letters 612:124-128.
Zhao, Jiafei, Lei Yao, Yongchen Song, Kaihua Xue, Chuanxiao Cheng, Yu Liu, and
Yi Zhang. 2011. "In situ observations by magnetic resonance imaging for formation
and dissociation of tetrahydrofuran hydrate in porous media." Magnetic resonance
imaging 29 (2):281-288.
Zhao, Jiafei, Zihao Zhu, Yongchen Song, Weiguo Liu, Yi Zhang, and Dayong Wang.
2015. "Analyzing the process of gas production for natural gas hydrate using
depressurization." Applied Energy 142:125-134.
“Every reasonable effort has been made to acknowledge the owners of
copyright material. I would be pleased to hear from any copyright owner
who has been omitted or incorrectly acknowledged”.
Page 227
202
APPENDIX A: Measured hydrate dissociation data of CO2 + CH4,
N2 + CH4 and N2 + CO2
Table A- 1 Measured hydrate dissociation data of CO2 + CH4 gas mixture in
water
P/MPa T/K
CO2 mol%= 0
T/K
CO2 mol%=10
T/K
CO2 mol%=16
T/K
CO2 mol%=20
5 279.45 280.55 281.45 282.05
7.5 283.25 283.95 284.95 285.55
10 285.75 286.75 287.35 287.95
15 289.05 289.65 290.55 290.85
20 291.18 291.8 292.25 292.75
25 292.95 293.35 293.5 293.95
Page 228
203
Table A- 2 Measured hydrate dissociation data of N2 + CH4 gas mixture in
water
P/ MPa
T/K
N2
mol%= 0
T/K
N2
mol%=10
T/K
N2
mol%=20
T/K
N2
mol%=31
T/K
N2
mol%=36
5 279.45 278.65 - 277.8 276.75
7.5 283.25 282.8 282.15 281.6 280.35
10 285.75 285.15 284.85 284.25 282.95
15 289.05 288.85 288.25 287.85 286.3
20 291.18 290.85 290.35 289.85 288.8
25 292.95 292.75 291.5 291.25 290.15
Table A- 3 Measured hydrate dissociation data of N2 + CO2 gas mixture in
water
P/ MPa T/K
N2 mol%= 64
T/K
N2 mol%=74
5 277.8 275.75
7.5 280.1 278.65
10 281.6 280.6
15 283.3 282.75
20 284.45 283.9
Page 229
204
APPENDIX B: Official Permissions and Copyrights
Page 233
208
APPENDIX C: Attribution of Authorship
Paper: “Experimental determination of hydrate phase equilibrium for
different gas mixtures containing methane, carbon dioxide and nitrogen with
motor current measurements” Journal of Natural Gas Science and
Engineering, 38, 59-73.
Authors and full affiliations: Dhifaf Sadeqa,c, Stefan Iglauerb, Maxim Lebedev a,
Callum Smitha, Ahmed Barifcania.
a WA School of Mines: Minerals, Energy and Chemical Engineering, Curtin
University, Bentley Western Australia 6102, Australia
b School of Engineering, Petroleum Engineering discipline, Edith Cowan University,
Joondalup Western Australia 6027, Australia
c University of Baghdad, College of Engineering, Department of Petroleum
Engineering, Baghdad, Iraq
Page 234
209
Conference Paper: “Hydrate Equilibrium Model and Cage Occupancies for N2 + CH4
and N2 + CO2 Gas Mixtures” in One Curtin International Postgraduate Conference, At
Miri, Sarawak, Malaysia, 10-12 December (2017).
Authors and full affiliations: Dhifaf Sadeqa,c, Stefan Iglauerb, Maxim Lebedev a,
Callum Smitha, Ahmed Barifcania.
a WA School of Mines: Minerals, Energy and Chemical Engineering, Curtin
University, Bentley Western Australia 6102, Australia
b School of Engineering, Petroleum Engineering discipline, Edith Cowan University,
Joondalup Western Australia 6027, Australia
c University of Baghdad, College of Engineering, Department of Petroleum
Engineering, Baghdad, Iraq
Page 235
210
Conference Paper: “Prediction of Hydrate Phase Equilibrium Conditions for Different
Gas Mixtures” in Offshore Technology Conference Asia. Offshore Technology
Conference. Malaysia, 20 - 23 March (2018)
Authors and full affiliations: Dhifaf Sadeqa,c, Stefan Iglauerb, Maxim Lebedev a,
Ahmed Barifcania.
a WA School of Mines: Minerals, Energy and Chemical Engineering, Curtin
University, Bentley Western Australia 6102, Australia
b School of Engineering, Petroleum Engineering discipline, Edith Cowan University,
Joondalup Western Australia 6027, Australia
c University of Baghdad, College of Engineering, Department of Petroleum
Engineering, Baghdad, Iraq
Page 236
211
Paper: “Experimental Pore-scale Analysis of Carbon Dioxide Hydrate in Sandstone
via X-Ray Micro-Computed Tomography” International Journal of Greenhouse Gas
Control, 79, 73-82.
Authors and affiliations: Dhifaf Sadeqa,c, Stefan Iglauerb, Maxim Lebedev a, Taufiq
Rahman a, Yihuai Zhanga, Ahmed Barifcania.
a WA School of Mines: Minerals, Energy and Chemical Engineering, Curtin
University, Bentley Western Australia 6102, Australia b School of Engineering, Petroleum Engineering discipline, Edith Cowan University,
Joondalup Western Australia 6027, Australia c University of Baghdad, College of Engineering, Department of Petroleum
Engineering, Baghdad, Iraq
Page 237
212
Paper: “Compressional Wave Velocity of Hydrate-Bearing Bentheimer Sediments
with Varying Pore Fillings” accepted for publication in the International Journal of
Hydrogen Energy.
Authors and full affiliations: Dhifaf Sadeqa,c, Khalid Alefa, Stefan Iglauerb, Maxim
Lebedev a, Ahmed Barifcania.
a WA School of Mines: Minerals, Energy and Chemical Engineering, Curtin
University, Bentley Western Australia 6102, Australia
b School of Engineering, Petroleum Engineering discipline, Edith Cowan University,
Joondalup Western Australia 6027, Australia
c University of Baghdad, College of Engineering, Department of Petroleum
Engineering, Baghdad, Iraq


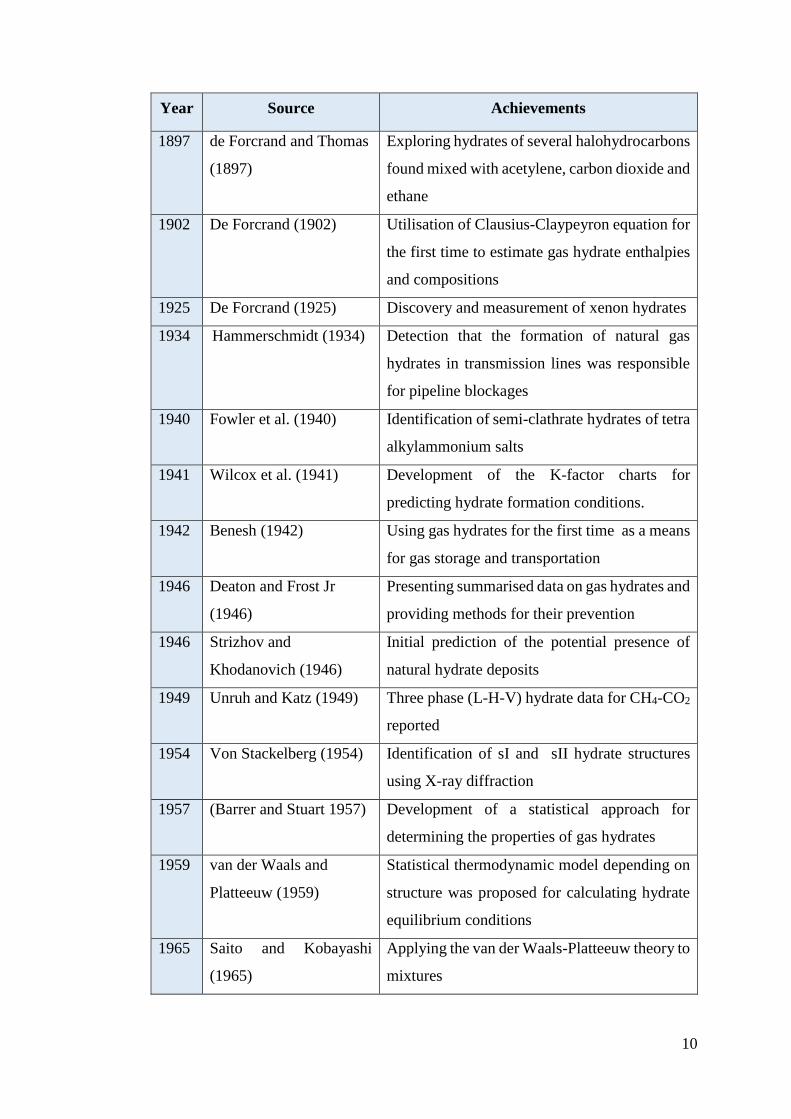
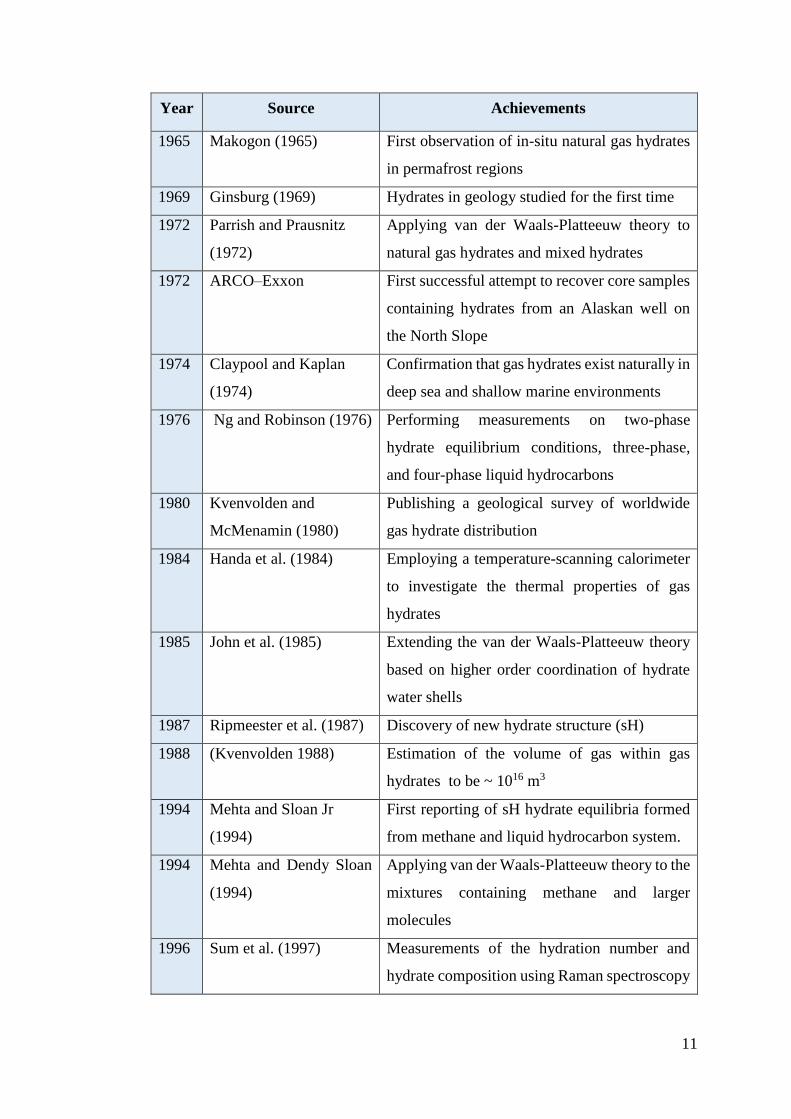


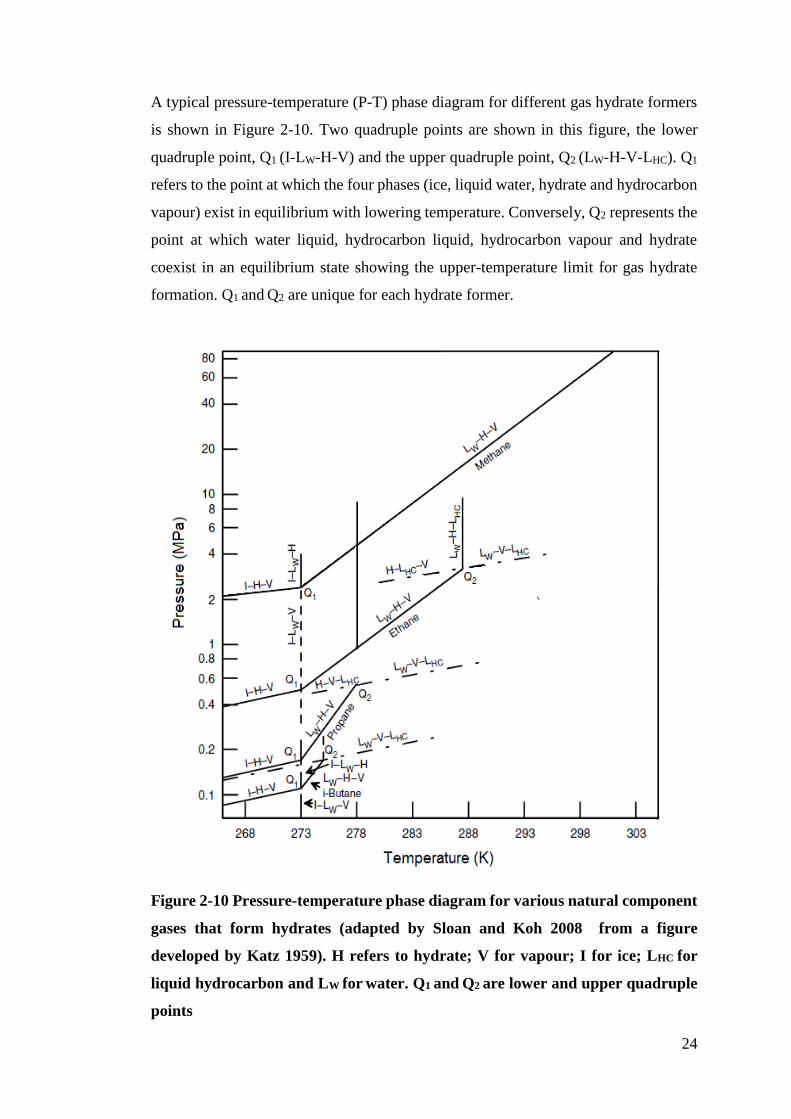
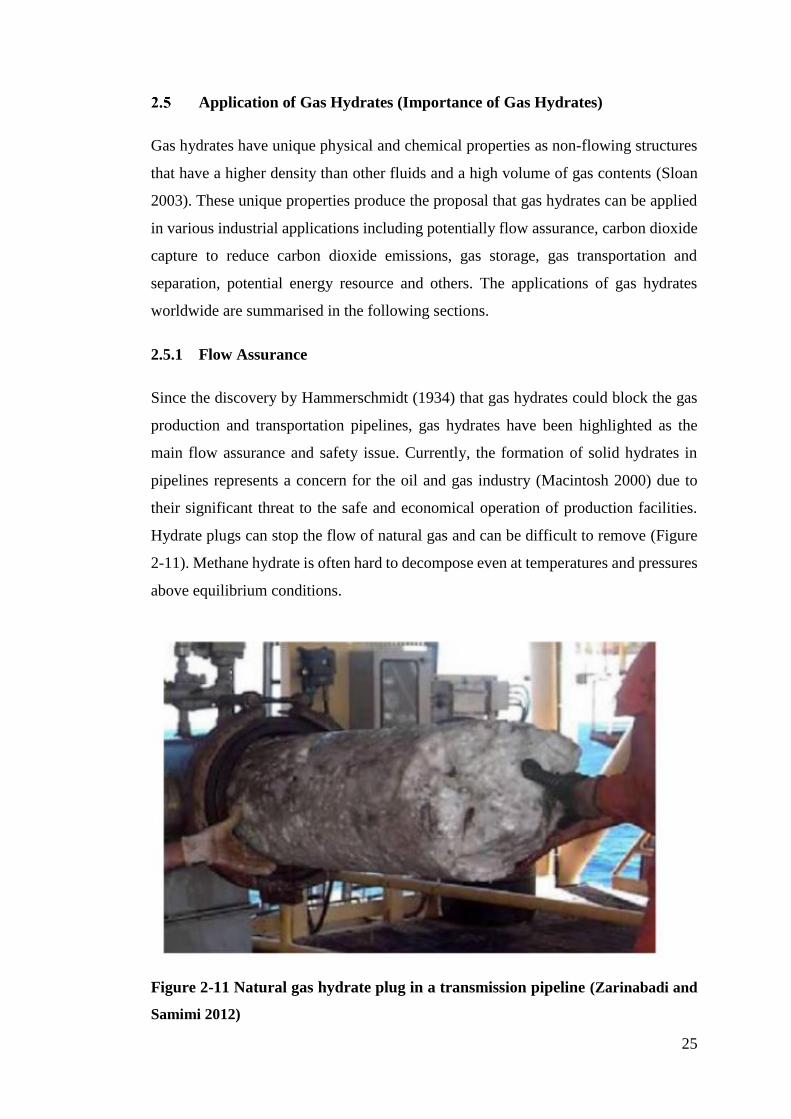


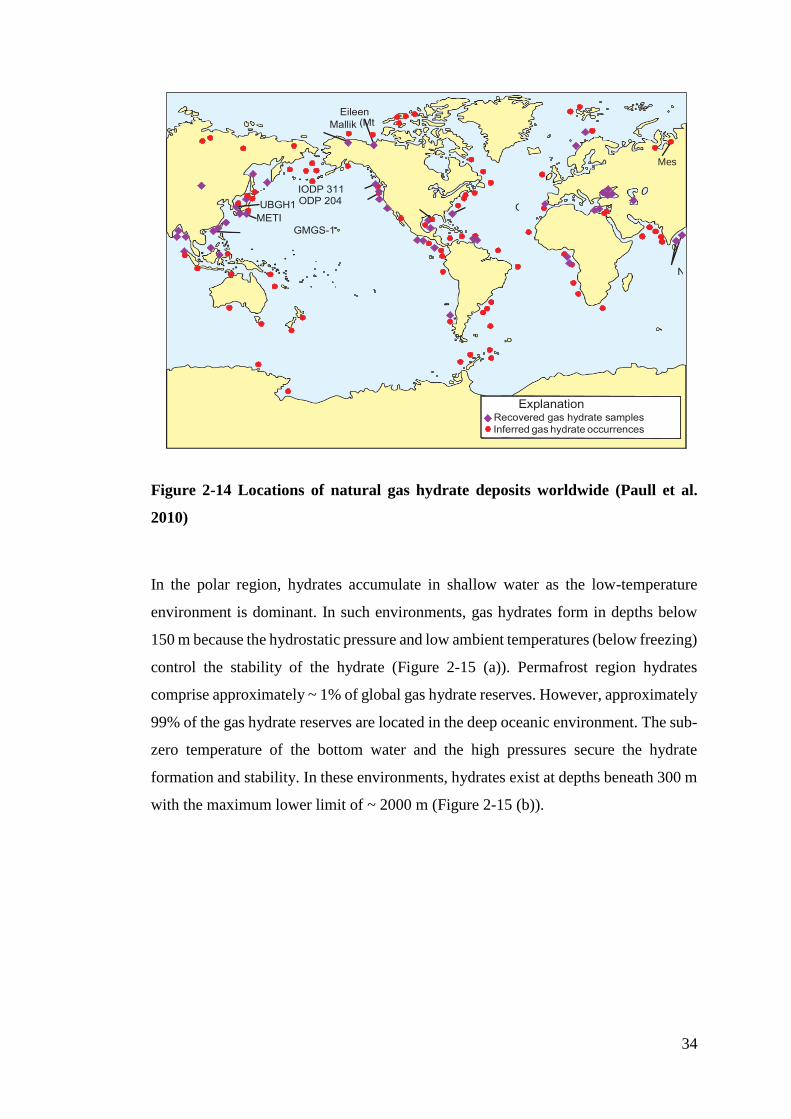


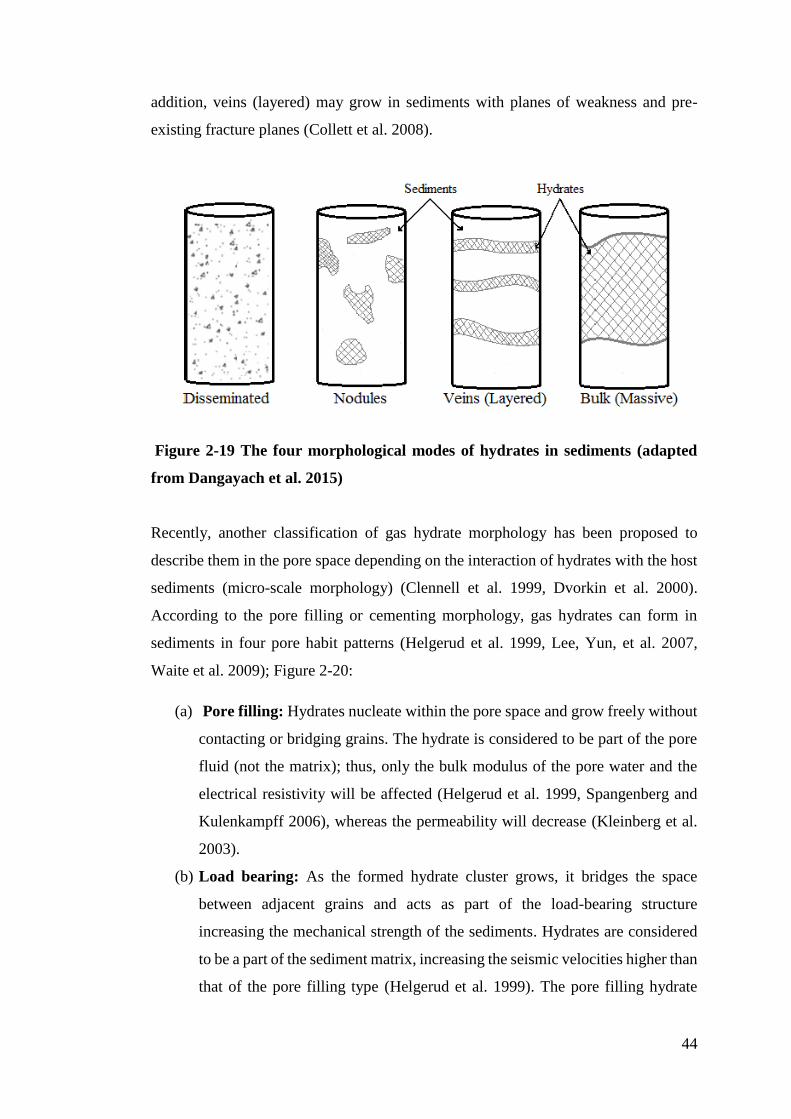


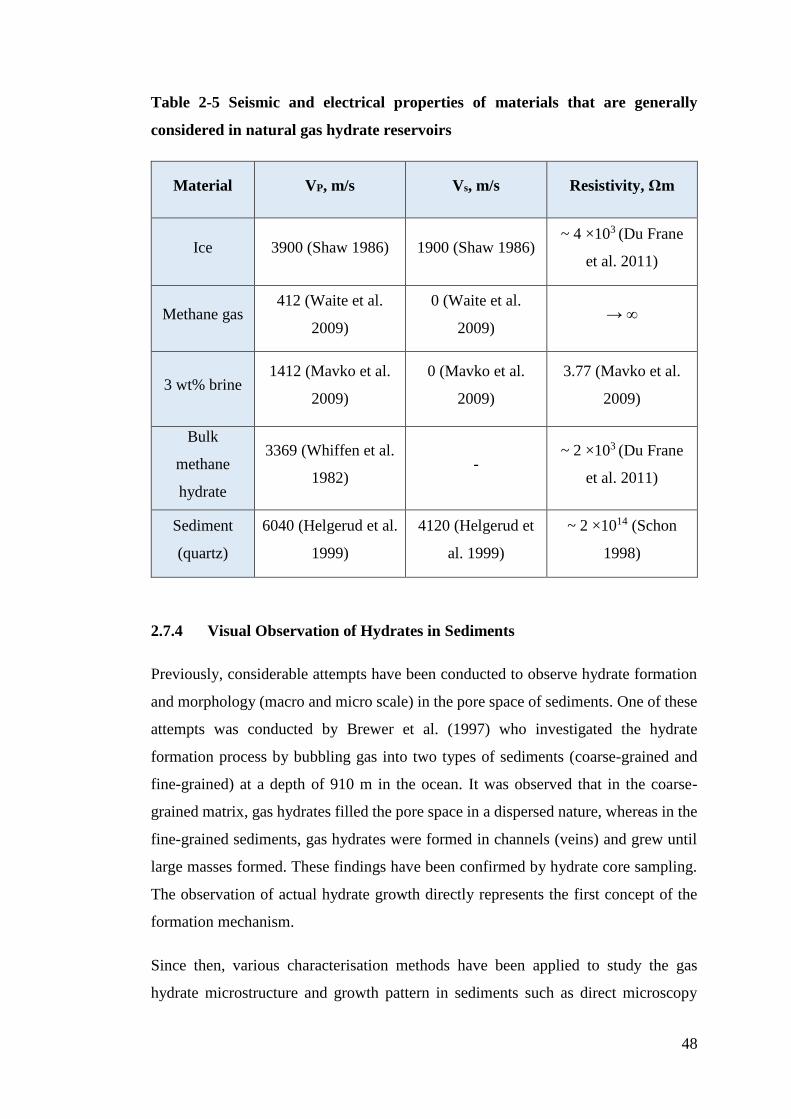


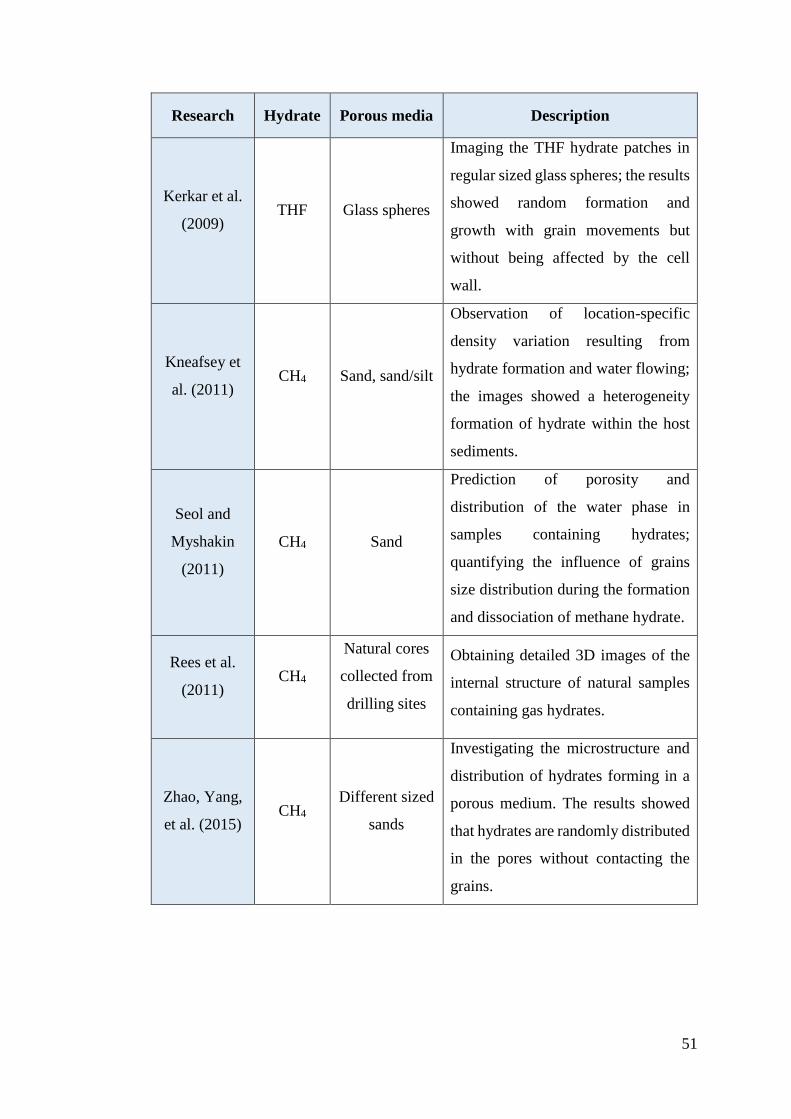


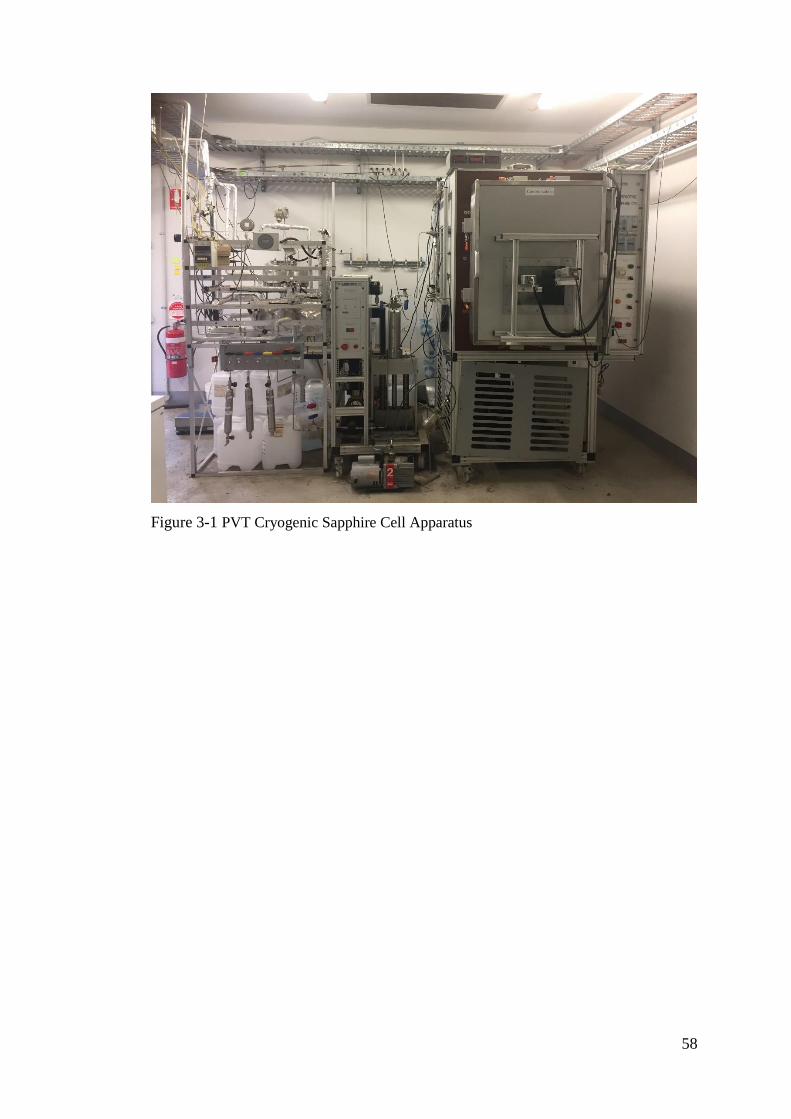


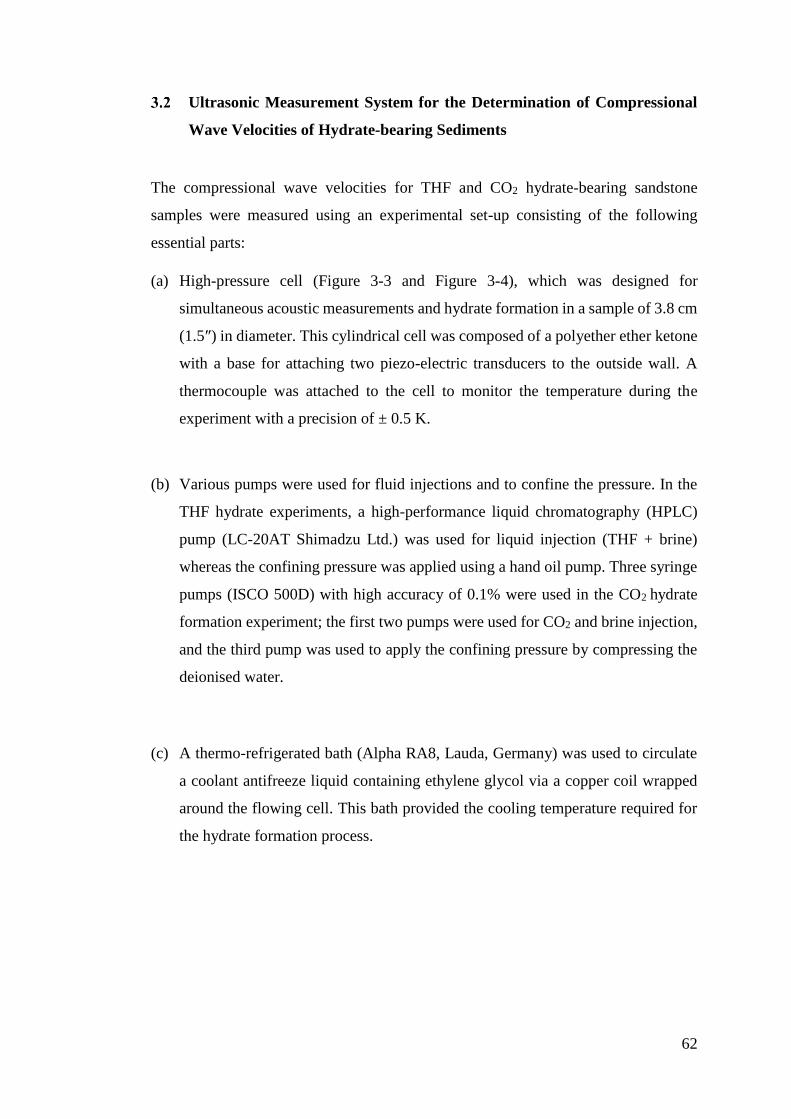


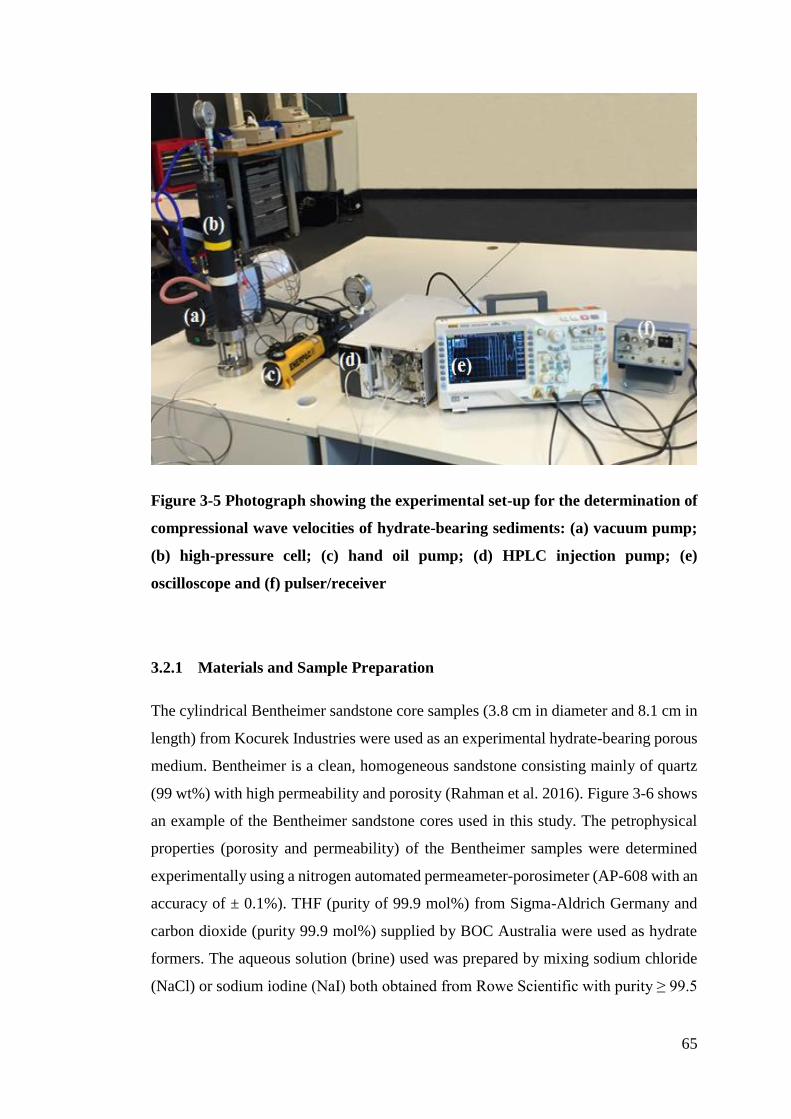


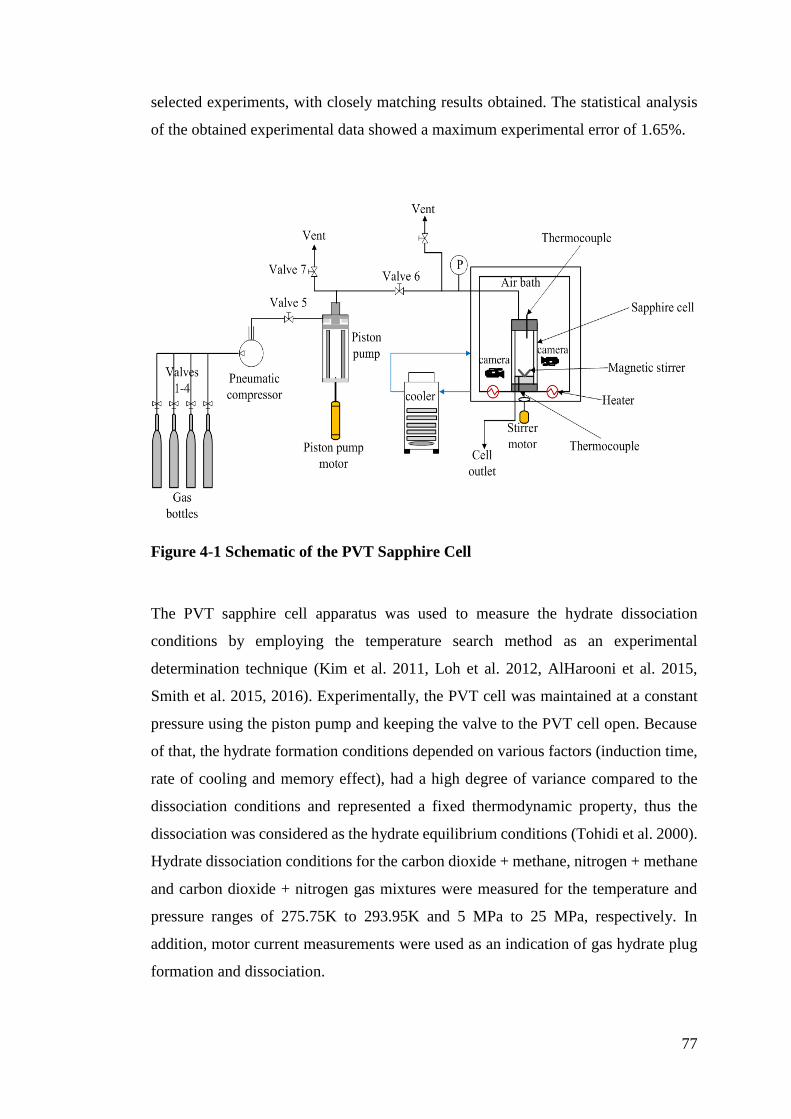
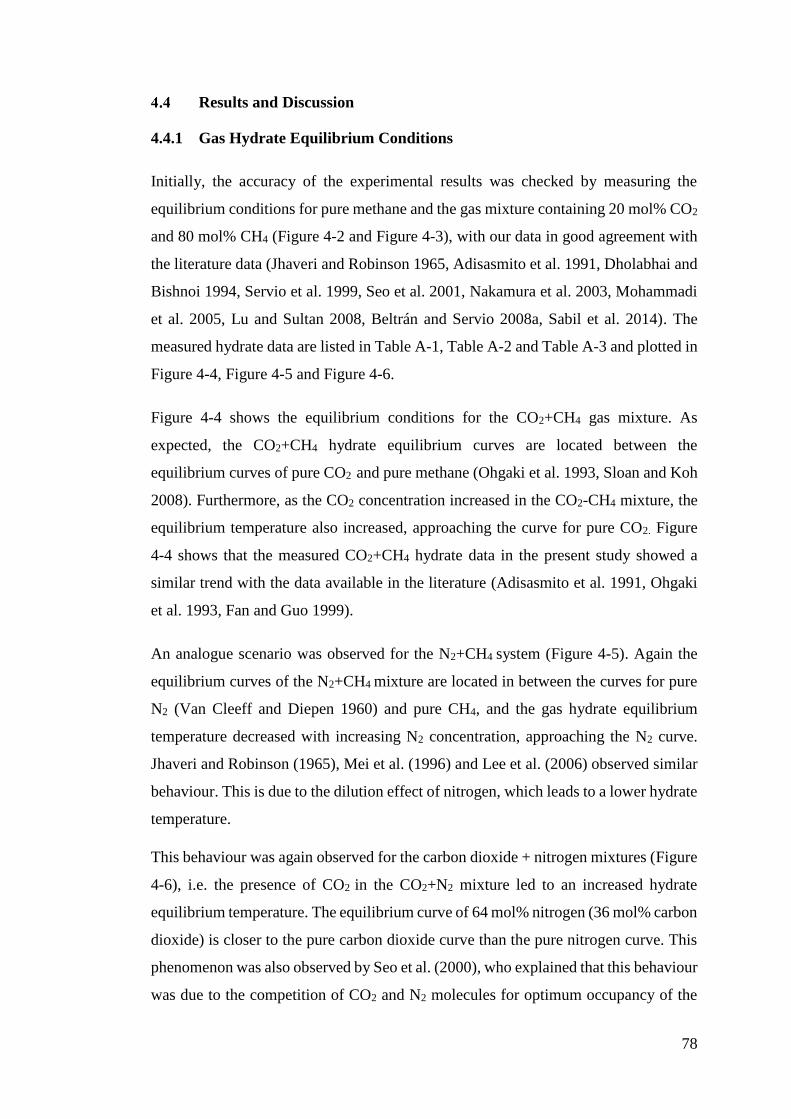


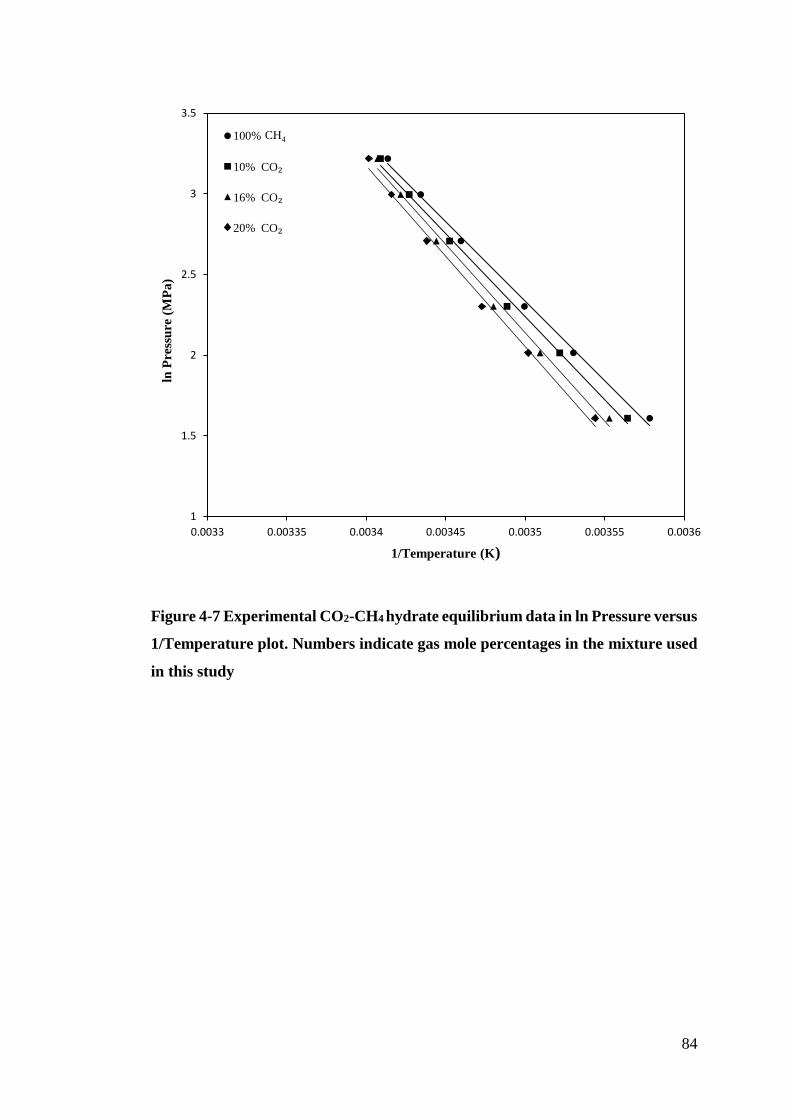


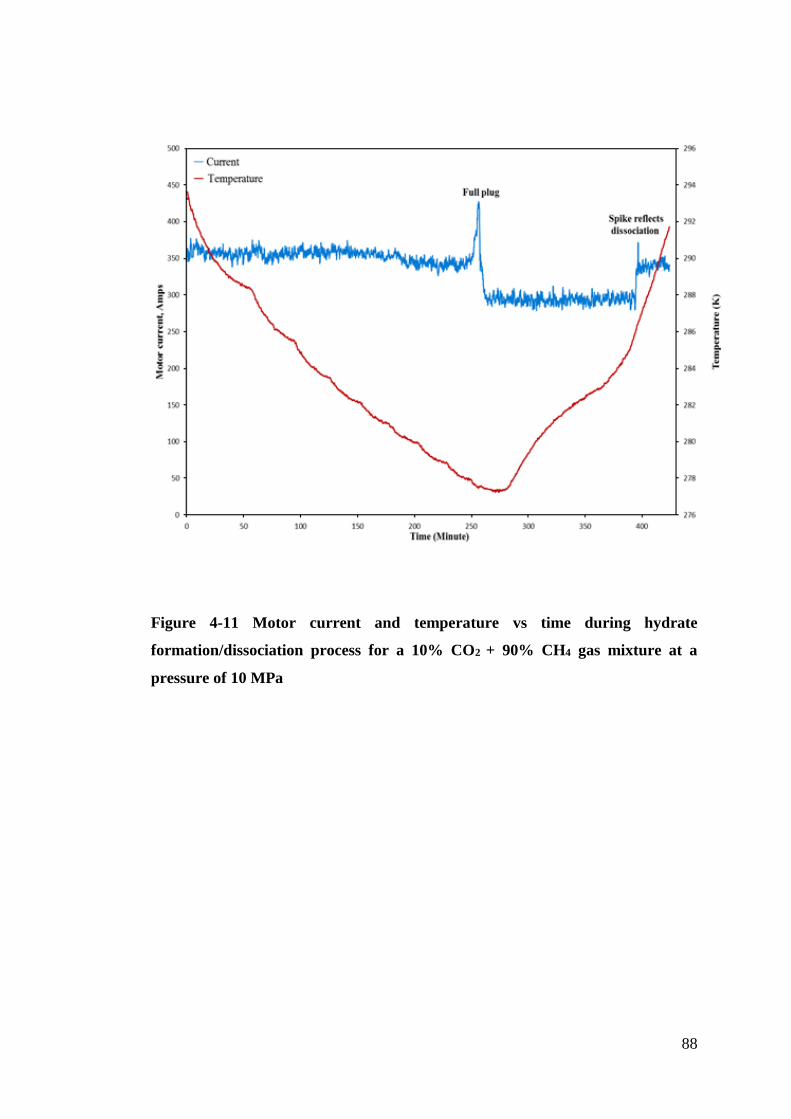


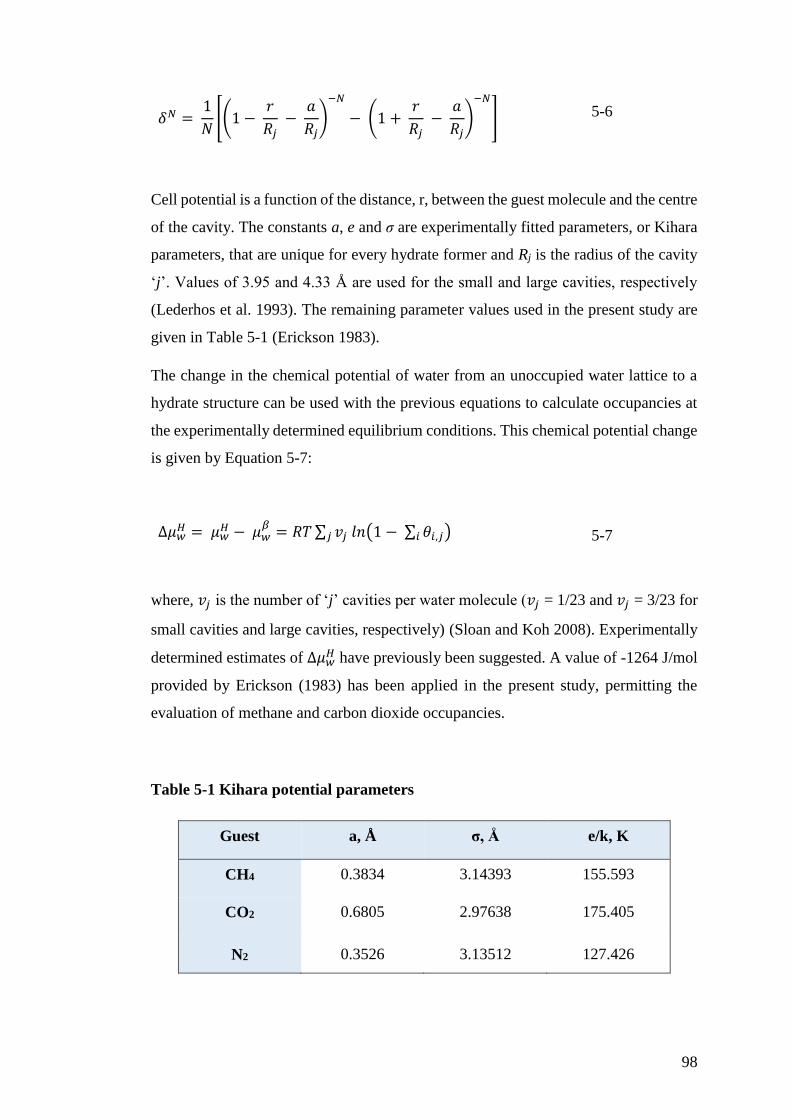


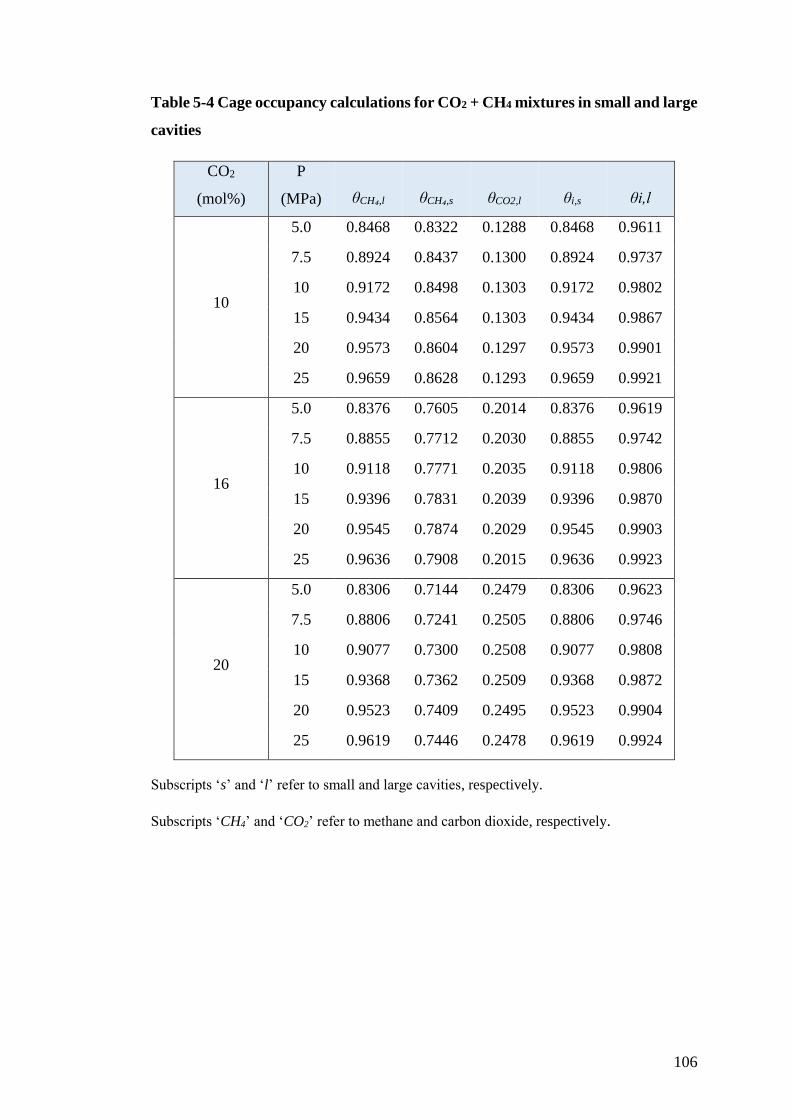


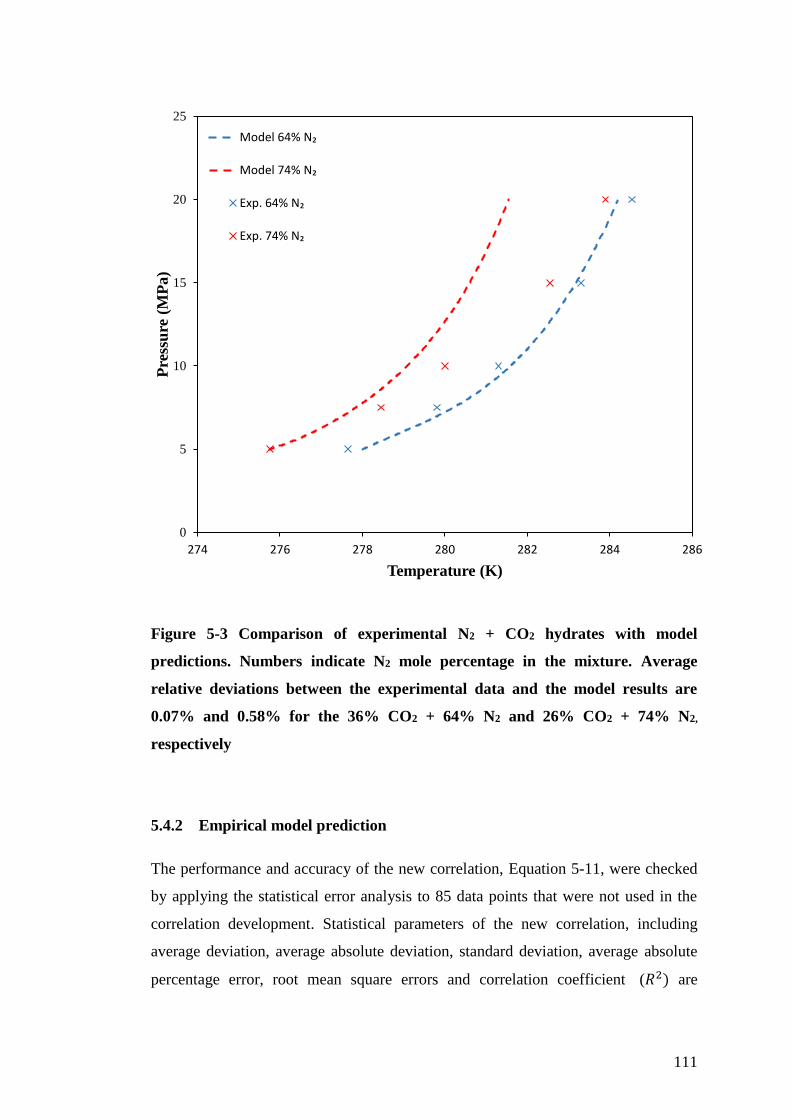


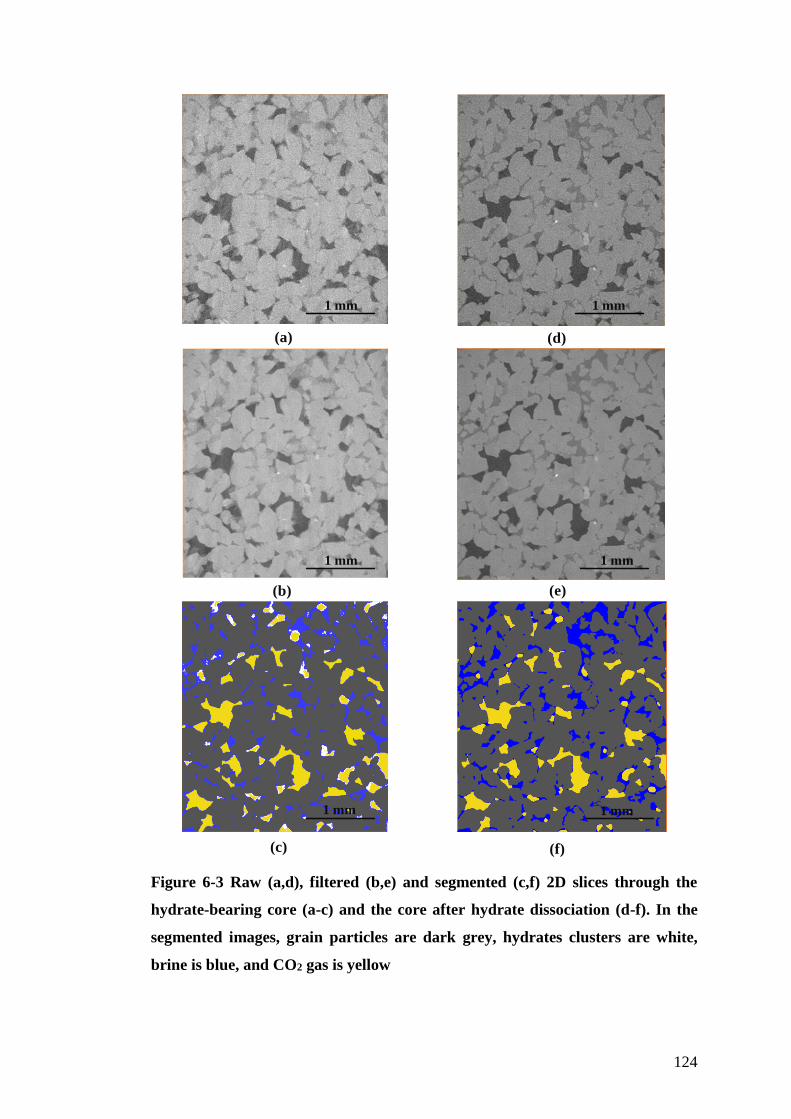


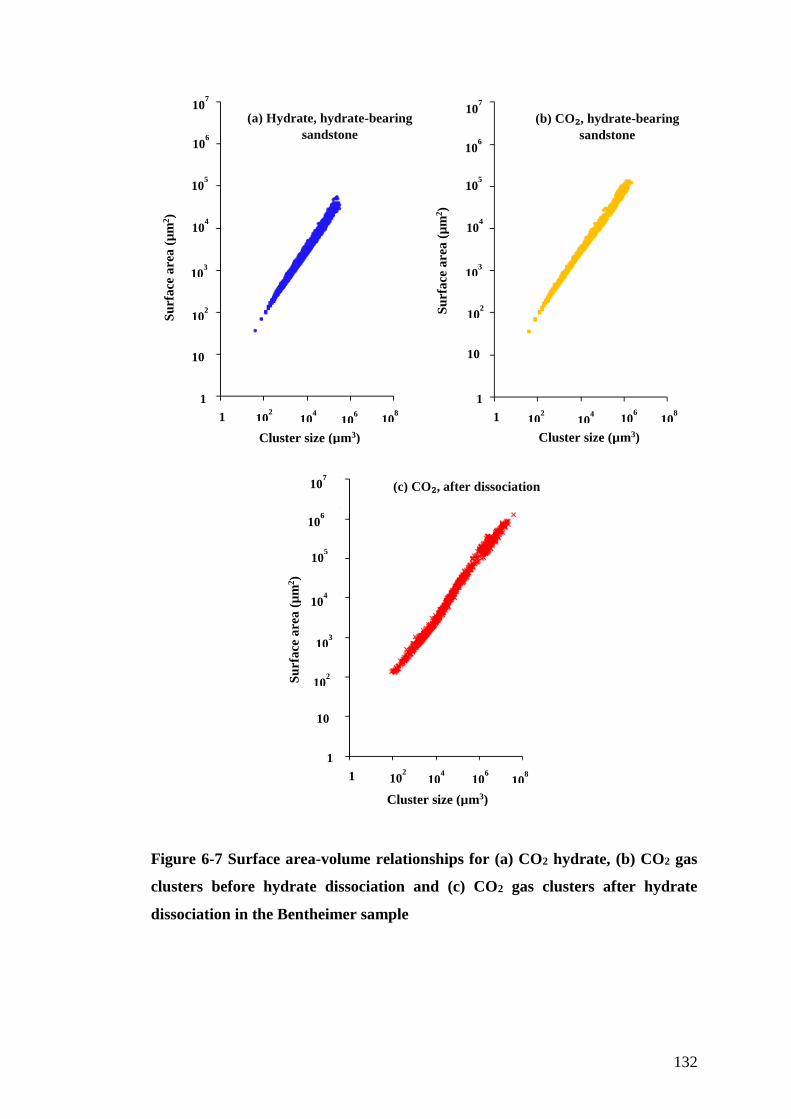
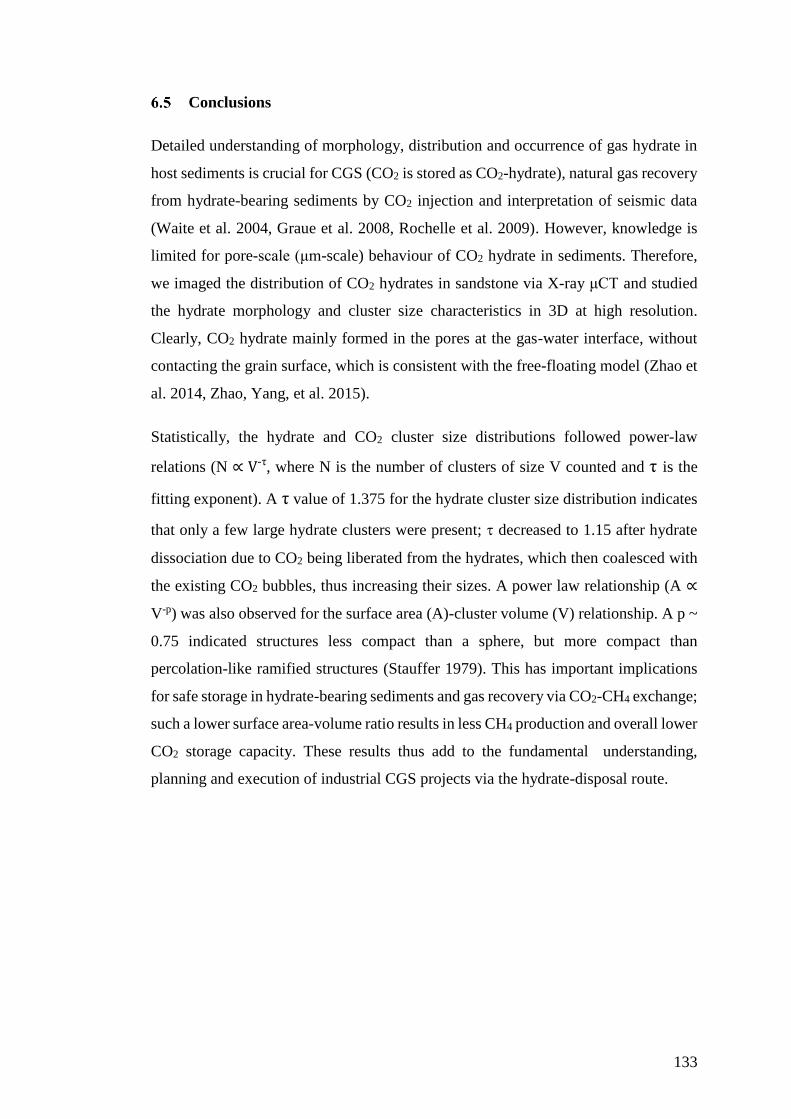


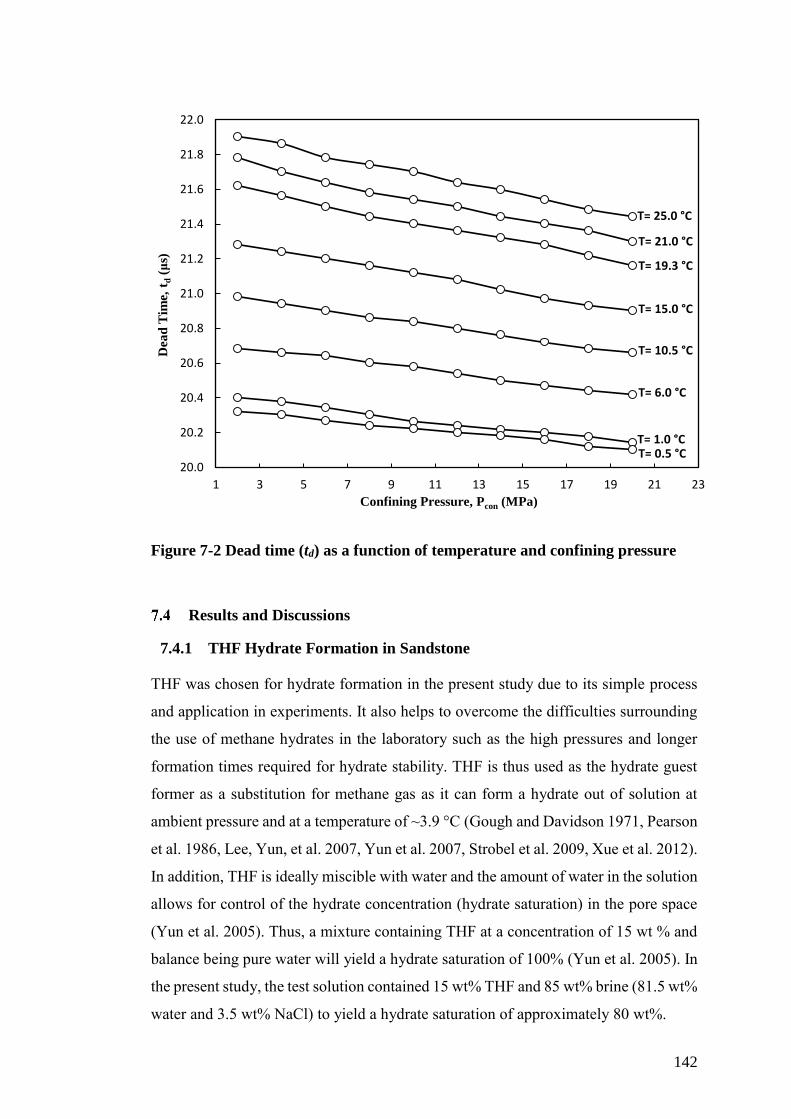
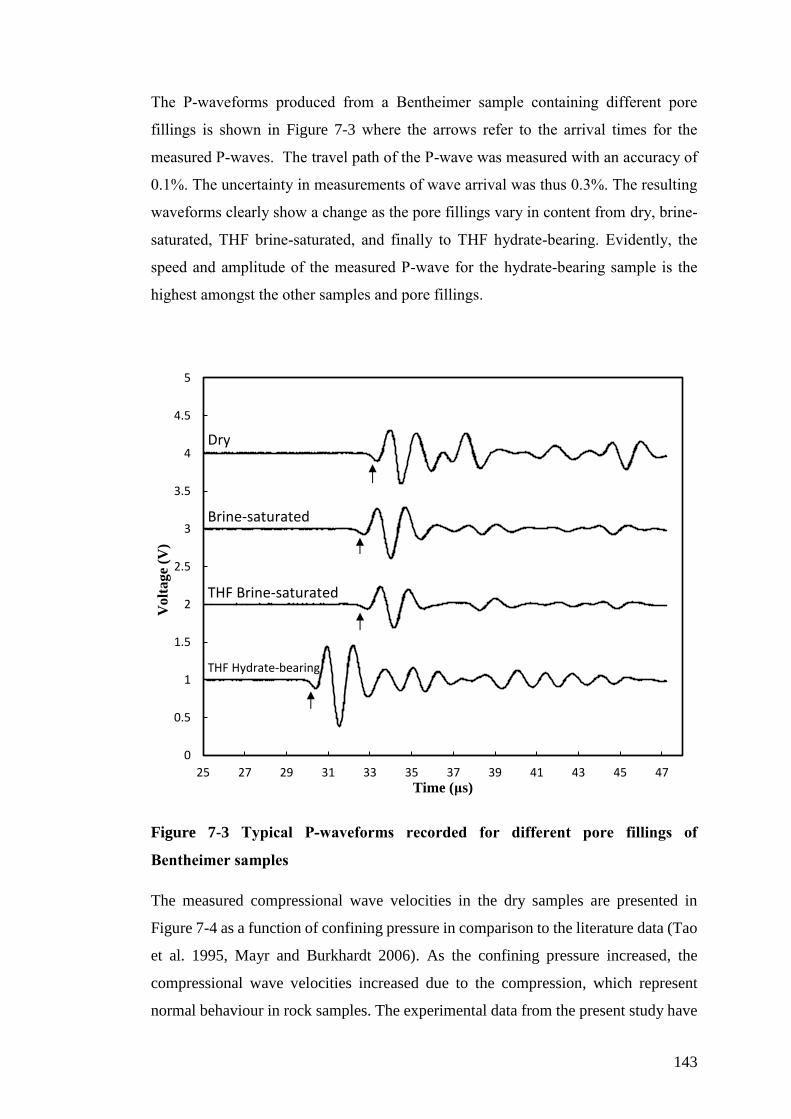

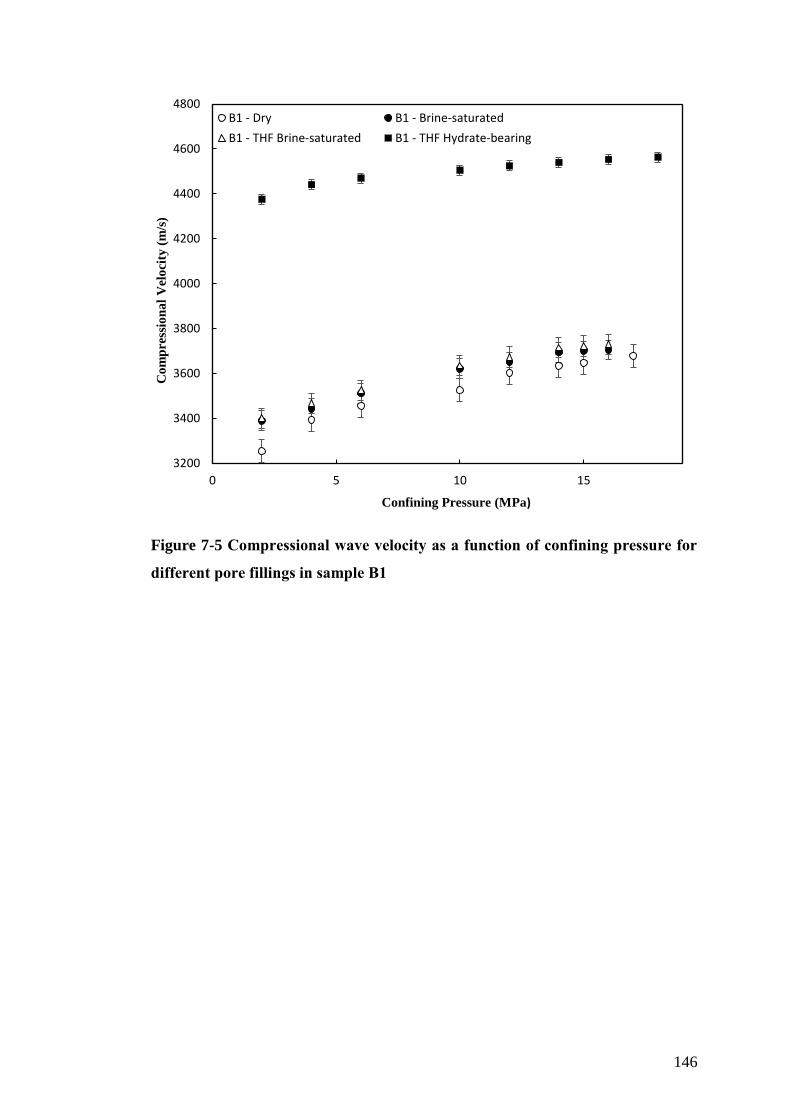


![New Techniques in Corolling Gas Hydrates [Recovered] Techniques in Corolling Gas Hydrates... · New Techniques in Controlling Gas Hydrates ... Ethane Propane ... • When hydrates](https://static.documents.pub/doc/80x56/5b865c467f8b9a195a8ca7ef/new-techniques-in-corolling-gas-hydrates-recovered-techniques-in-corolling-gas.jpg)