Gas jet hitting a wall in a cross flow British Gas 1 Introduction This report concerns the problem brought to the 1995 Study Group by Dr. John Morgan of British Gas. The problem concerned the flow of a gas jet that was directed downwards towards a planar surface. A number of different people worked on the problem, and it emerged that there were a number of different ways of modelling the flow, each having varying degrees of complexity. This report therefore gives some basic details of the flow in question, and then examines three distinct modelling approaches in detail, namely a 'vortex model' where the main concern is the location of the horseshoe vortices in the wake behind the jet, a 'balance model' where some simple conservation arguments are used to determine the properties and upstream penetration of the jet and a two-dimensional model for the particle trajectories is proposed. Next, a 'dimensional analysis' model is considered where alternative approaches to the problem are examined. Finally some conclusions are discussed and some recommendations are made. 2 Details of the Physical Problem A schematic drawing of the flow and coordinate system used is shown in figure (1). The jet is assumed to have originated from some 'adverse event' and, at its source is pure CH 4 (methane) having a density Pm = 0.665 kg/m". The jet issues into air (density Pa = 1.205 kg/rn", all values calculated at an ambient temperature of 20 deg. C) vertically downwards from a tube of radius a = 5.4 mm at a speed of U j = 128 m/sec. The mouth of the tube is at a distance of 138mm from an impermeable plane z = 0 and the cross-flow (of pure air) has a speed U e = 5 m/sec in the positive x-direction. The kinematic viscosities of air and methane are taken to be equal, having the value of Vm = V« = 1.510- 5 m 2 /sec. The methane jet at the mouth of the tube has a Reynolds number (based on the tube radius) of 46000 and thus the jet is turbulent. As the jet spreads before hitting the plane, turbulent entrainment decreases the methane concentration. After striking the plane, the jet begins to spread radially, its direction influenced by the cross-flow. The main parameter of interest to British Gas is the position of the 8 per cent methane contour, since methane/air mixtures existing below this critical concentration do not burn. The 8 per cent contour may thus be thought of as the 'safety limit' in any hazardous adverse event. 1
Transcript
Gas jet hitting a wall in a cross flow
British Gas
1 IntroductionThis report concerns the problem brought to the 1995 Study Group by Dr. JohnMorgan of British Gas. The problem concerned the flow of a gas jet that was directeddownwards towards a planar surface. A number of different people worked on theproblem, and it emerged that there were a number of different ways of modelling theflow, each having varying degrees of complexity. This report therefore gives somebasic details of the flow in question, and then examines three distinct modellingapproaches in detail, namely a 'vortex model' where the main concern is the locationof the horseshoe vortices in the wake behind the jet, a 'balance model' where somesimple conservation arguments are used to determine the properties and upstreampenetration of the jet and a two-dimensional model for the particle trajectoriesis proposed. Next, a 'dimensional analysis' model is considered where alternativeapproaches to the problem are examined. Finally some conclusions are discussedand some recommendations are made.
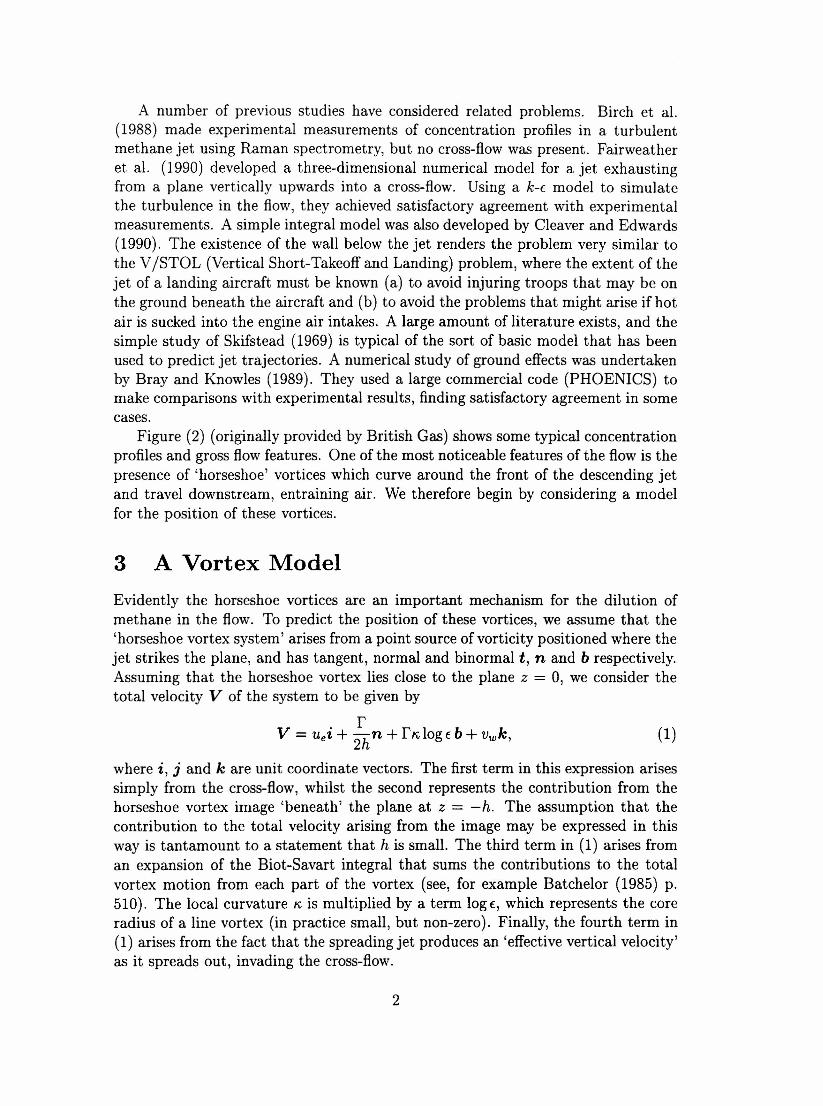
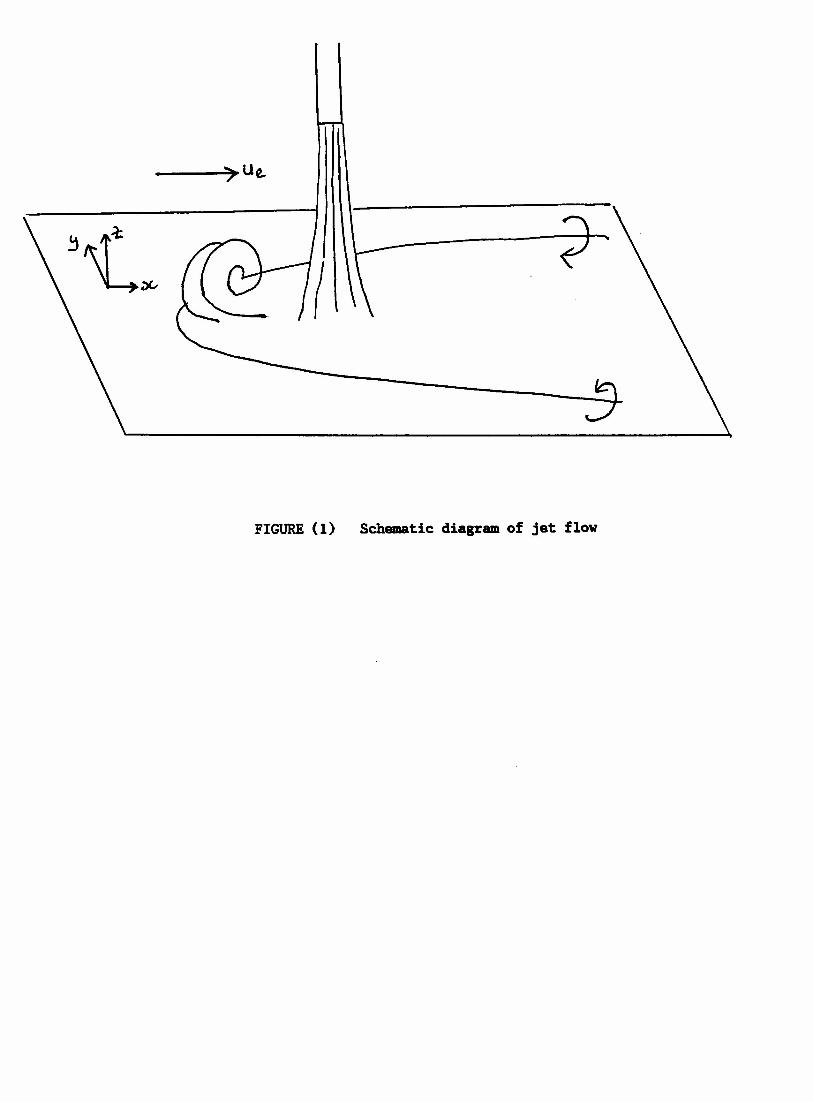
2 Details of the Physical ProblemA schematic drawing of the flow and coordinate system used is shown in figure (1).The jet is assumed to have originated from some 'adverse event' and, at its sourceis pure CH4 (methane) having a density Pm = 0.665 kg/m". The jet issues intoair (density Pa = 1.205 kg/rn", all values calculated at an ambient temperature of20 deg. C) vertically downwards from a tube of radius a = 5.4 mm at a speedof Uj = 128 m/sec. The mouth of the tube is at a distance of 138mm from animpermeable plane z = 0 and the cross-flow (of pure air) has a speed Ue = 5 m/secin the positive x-direction. The kinematic viscosities of air and methane are takento be equal, having the value of Vm = V« = 1.510-5m2/sec.
The methane jet at the mouth of the tube has a Reynolds number (based onthe tube radius) of 46000 and thus the jet is turbulent. As the jet spreads beforehitting the plane, turbulent entrainment decreases the methane concentration. Afterstriking the plane, the jet begins to spread radially, its direction influenced by thecross-flow. The main parameter of interest to British Gas is the position of the 8per cent methane contour, since methane/air mixtures existing below this criticalconcentration do not burn. The 8 per cent contour may thus be thought of as the'safety limit' in any hazardous adverse event.
1
A number of previous studies have considered related problems. Birch et al.(1988) made experimental measurements of concentration profiles in a turbulentmethane jet using Raman spectrometry, but no cross-flow was present. Fairweatheret al. (1990) developed a three-dimensional numerical model for a jet exhaustingfrom a plane vertically upwards into a cross-flow. Using a k-e model to simulatethe turbulence in the flow, they achieved satisfactory agreement with experimentalmeasurements. A simple integral model was also developed by Cleaver and Edwards(1990). The existence of the wall below the jet renders the problem very similar tothe V/STOL (Vertical Short-Takeoff and Landing) problem, where the extent of thejet of a landing aircraft must be known (a) to avoid injuring troops that may be onthe ground beneath the aircraft and (b) to avoid the problems that might arise if hotair is sucked into the engine air intakes. A large amount of literature exists, and thesimple study of Skifstead (1969) is typical of the sort of basic model that has beenused to predict jet trajectories. A numerical study of ground effects was undertakenby Bray and Knowles (1989). They used a large commercial code (PHOENICS) tomake comparisons with experimental results, finding satisfactory agreement in somecases.
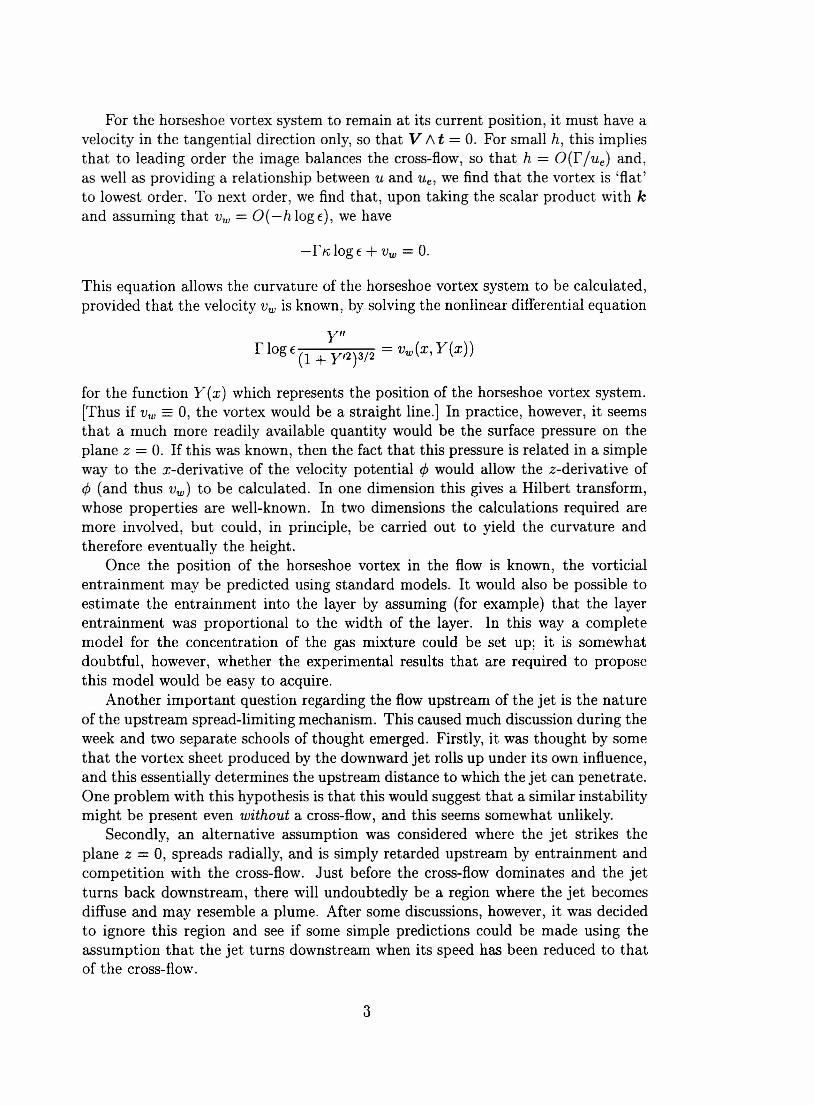
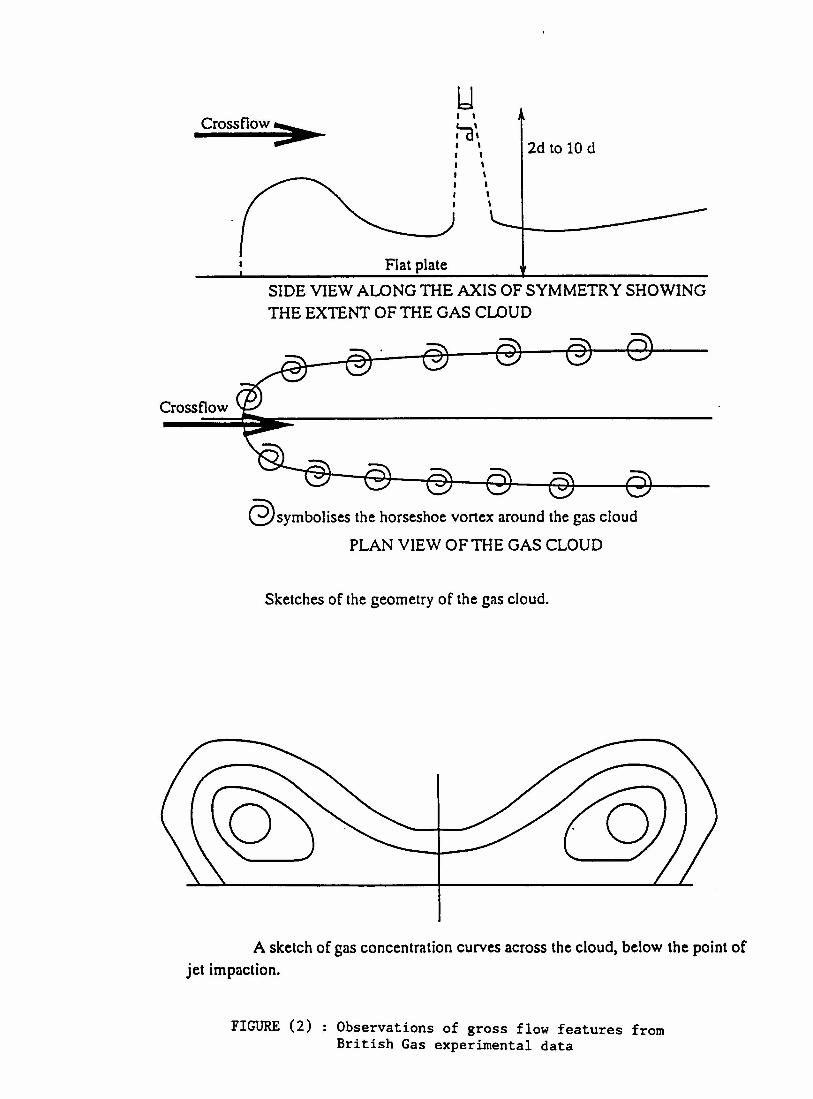
Figure (2) (originally provided by British Gas) shows some typical concentrationprofiles and gross flow features. One of the most noticeable features of the flow is thepresence of 'horseshoe' vortices which curve around the front of the descending jetand travel downstream, entraining air. We therefore begin by considering a modelfor the position of these vortices.
3 A Vortex ModelEvidently the horseshoe vortices are an important mechanism for the dilution ofmethane in the flow. To predict the position of these vortices, we assume that the'horseshoe vortex system' arises from a point source of vorticity positioned where thejet strikes the plane, and has tangent, normal and binormal t, nand b respectively.Assuming that the horseshoe vortex lies close to the plane z = 0, we consider thetotal velocity V of the system to be given by
V = uei+ ~hn+rKIOgEb+vwk, (1)
where i, j and k are unit coordinate vectors. The first term in this expression arisessimply from the cross-flow, whilst the second represents the contribution from thehorseshoe vortex image 'beneath' the plane at z = -h. The assumption that thecontribution to the total velocity arising from the image may be expressed in thisway is tantamount to a statement that h is small. The third term in (1) arises froman expansion of the Biot-Savart integral that sums the contributions to the totalvortex motion from each part of the vortex (see, for example Batchelor (1985) p.510). The local curvature K is multiplied by a term log E, which represents the coreradius of a line vortex (in practice small, but non-zero). Finally, the fourth term in(1) arises from the fact that the spreading jet produces an 'effective vertical velocity'as it spreads out, invading the cross-flow.
2
For the horseshoe vortex system to remain at its current position, it must have avelocity in the tangential direction only, so that V /\ t = O. For small h, this impliesthat to leading order the image balances the cross-flow, so that h = O(r jue) and,as well as providing a relationship between u and u., we find that the vortex is 'flat'to lowest order. To next order, we find that, upon taking the scalar product with kand assuming that Vw = O( -h log €), we have
-rKlog€ + Vw = O.
This equation allows the curvature of the horseshoe vortex system to be calculated,provided that the velocity Vw is known, by solving the nonlinear differential equation
for the function Y (x) which represents the position of the horseshoe vortex system.[Thus if Vw = 0, the vortex would be a straight line.] In practice, however, it seemsthat a much more readily available quantity would be the surface pressure on theplane z = O. If this was known, then the fact that this pressure is related in a simpleway to the x-derivative of the velocity potential ~ would allow the z-derivative of~ (and thus vw) to be calculated. In one dimension this gives a Hilbert transform,whose properties are well-known. In two dimensions the calculations required aremore involved, but could, in principle, be carried out to yield the curvature andtherefore eventually the height.
Once the position of the horseshoe vortex in the flow is known, the vorticialentrainment may be predicted using standard models. It would also be possible toestimate the entrainment into the layer by assuming (for example) that the layerentrainment was proportional to the width of the layer. In this way a completemodel for the concentration of the gas mixture could be set up; it is somewhatdoubtful, however, whether the experimental results that are required to proposethis model would be easy to acquire.
Another important question regarding the flow upstream of the jet is the natureof the upstream spread-limiting mechanism. This caused much discussion during theweek and two separate schools of thought emerged. Firstly, it was thought by somethat the vortex sheet produced by the downward jet rolls up under its own influence,and this essentially determines the upstream distance to which the jet can penetrate.One problem with this hypothesis is that this would suggest that a similar instabilitymight be present even without a cross-flow, and this seems somewhat unlikely.
Secondly, an alternative assumption was considered where the jet strikes theplane z = 0, spreads radially, and is simply retarded upstream by entrainment andcompetition with the cross-flow. Just before the cross-flow dominates and the jetturns back downstream, there will undoubtedly be a region where the jet becomesdiffuse and may resemble a plume. After some discussions, however, it was decidedto ignore this region and see if some simple predictions could be made using theassumption that the jet turns downstream when its speed has been reduced to thatof the cross-flow.
3
4 A Simple Balance Law Model for the FlowFirst, we consider the region between the mouth of the jet nozzle and the planez = o. There are a number of ways in which the calculation of the concentration,jet radius and velocity in this region may be undertaken, but the simplest assumesthe 'ten degree' law, which states that, according to experimental observation, aturbulent jet spreads by a semi-angle of Os = 10 degrees. At the jet nozzle theconcentration flux F = pAcu is given by F = Pm1ra2uj = 7.798 X 10⁻³ kg/sec whilstthe momentum flux M = Pm1fa2u; = 0.998 kg m/sec2. At a distance z from the jetnozzle the jet radius is z tan Os, and we have
P = Pa(1- c) + Pmc
Thus the concentration c is given by
The distance from the jet nozzle to the plane is 138 mm, but we expect the radiallyspreading jet on the plane to have a height of around 20-30 mm. (This value couldbe altered if required.) At a distance z = 110mm below the jet nozzle we thereforehave
c = 0.218, U = 27.90 m/sec, A = 1.182 X 10⁻³ m2,
whilst with z = 138 mm we find that
c = 0.172, U = 22.01 m/sec, A = 1.860 X 10⁻³ m2.
These results are significant as they show that, even by the time the jet has struckthe plane z = 0, turbulent entrainment has forced the methane concentration todrop by a factor of around 5.
An independent check of the results given above may be carried out by assumingconservation of momentum and concentration flux as before, but modelling theturbulent entrainment using the law
ddz (pAu) = 21fapaE I Ue - U I (2)
rather than by assuming the (somewhat contrived) 'ten degree' law. In (2), u; isthe external flow velocity (zero for the downward jet), a is the jet radius and E isa dimensionless entrainment coefficient which has been found experimentally to beapproximately 0.1 in a number of different flows (see Turner 1973, page 173). Using(2) together with the previous definitions of F and M, we find that the concentrationat a distance z below the jet nozzle is given by
~ (~) = 2PaE J1fMdz c F P
4
and thus
VI - QC Q 1 (2 - QC - 2V1 - QC) _ 2) M Ez K- - - og - - 7r Pa- +C 2 QC F
This gives C = 0.144 at z = 1l0mm, a lower value than the 'ten degree' rule, andalso yields U = 18A3m/sec, A = 2.607 X 10⁻³ m2.
A simple calculation explains the difference between these results, for if we usethe entrainment model with Pa = Pm, we find that Q = 0 and C is given by
FC - -;::;-----:::-:-r~;;:::=_;:;_
- F + 2V7rMPaEz'
whilst the 'ten degree' rule gives
Fc= .
VPaM7rz tan OsComparing these two results for large z shows that Os = 10 degrees gives E rv 0.09,confirming that the 'ten degree' rule is appropriate only for single density flows.
An estimate of the upstream penetration of the jet may now be made. Assum-ing that when the jet hits the plane we have Co = 0.144, Uo = 18.43 m/sec andTO = 2.881 x 1O-2m (as calculated above), we assume that although momentumis destroyed by the plane, energy and mass are conserved. Thence the quantitiespA and U must both be conserved. The jet spreads out radially, and its area justbefore hitting the plane is 7rr~. Just after contact, area is therefore preserved if thespreading layer has a height ho = To/2. We therefore conserve the quantities
M = pu2h27rT,
and model the entrainment by
ddT (27rTpuh) = Epa27rT I U - Ue I .
F=puch27rT (3)
(4)
As a simple first approximation, we take Ue = O. Some simple calculations now showthat
~ _ ~ _ 2EpaM7r ( 2 _ 2)c2 c5 - F2 r r0 .
Assuming that the jet is effectively halted when U drops to 5 m/sec, we find that cat this point has the value 0.039, so that T = 0.223m and the jet penetrates 223mmupstream. Naturally this is an over estimate, since the cross-flow has been neglectedfor entrainment purposes. Conversely, an underestimate of the penetration distancemay be calculated by assuming that the entrainment velocity is given by 'Ue = -ueer.
Using (3) and (4), we find that
~(~_!) + M log (Co(CM + FUe)) = 7rEpa (T5 _ T2),ii; Co C Fu~ c( coM + Fue) F
5
giving a penetration distance of 173mm. Experimental studies carried out by BritishGas have indicated penetration distances of approximately 170mm, which is wellin line with the two estimates produced above; evidently further models could beproposed that also included the effects of momentum entrainment from the cross-flow.
Finally, a two-dimensional model was proposed to predict the spread and concen-tration in the jet. Assuming that u and v are the velocities in the x and y directionsrespectively, and that both mass and momentum are entrained from the cross-flow,the obvious conservation laws give
(uh)x + (vh)y = E I U - Ue I(u2h)x + (uvh)y = EUe I U - Ue I (5)
(uvh)x + (v2h)y = O.These equations may be thought of as two-dimensional shallow water theory withno gravity, and must be solved subject to known conditions (see above) at the originwhere the jet strikes the plane z = o. At present the equations (5) do not includeconcentration conservation, and so also density changes; once their structure hasbeen understood, however, concentration and density effects may easily be added.The equations have real (though not distinct) characteristics, and may be integratednumerically to determine particle paths: this was attempted at the meeting but therewas not sufficient time available to produce a working code.
5 Dimensional Analysis ModelA separate analysis of the problem, based largely upon dimensional arguments, isalso possible. Assuming simply that the maximum upstream penetration distance fmcan depend only upon the the cross-flow speed u; (of dimensions m/sec), the volumeflux Q (of dimensions m3/sec) and the specific momentum flux P (of dimensionsm4/sec2), then the obvious characteristic length is given by
pl/2fu = --,
Ue
under the assumption that Q is not important. Assuming therefore that fm = aofuwhere ao is an order one constant, we find that, according to British Gas dataao '" 0.694, giving a simple scaling law for the penetration distance. If more accurateresults were required, then it would also be important to include density ratio effects.
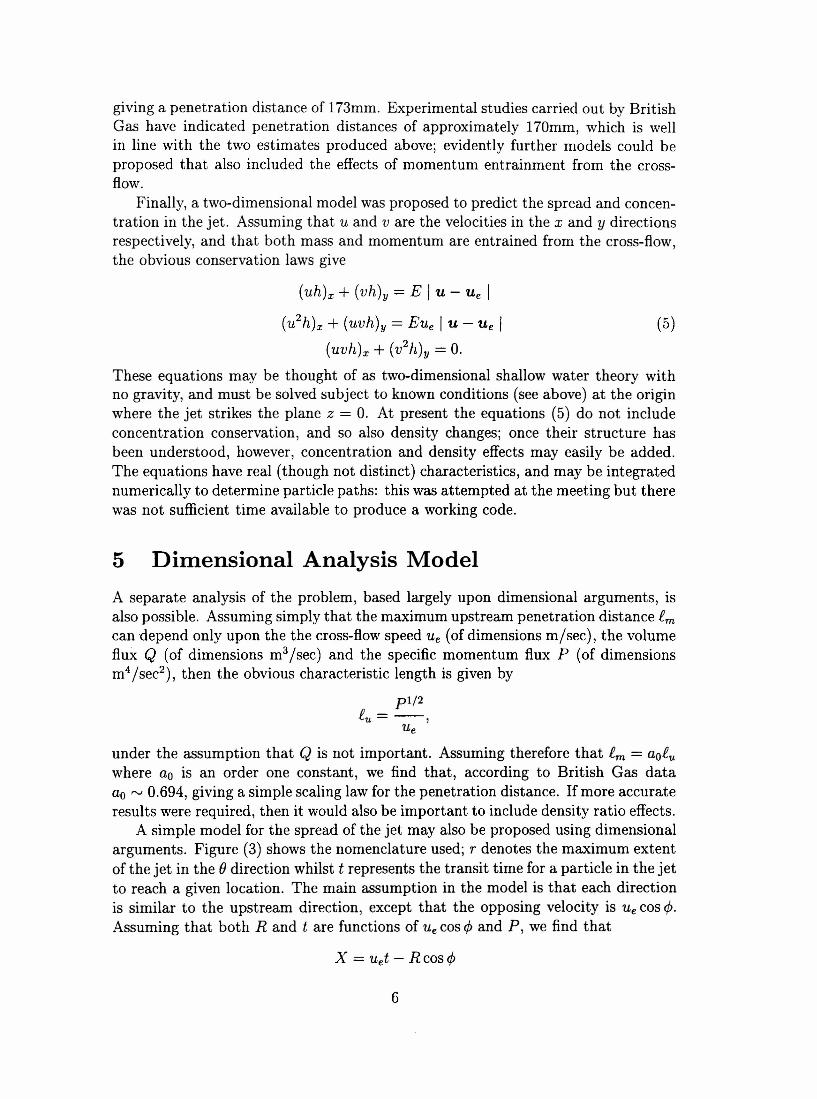
A simple model for the spread of the jet may also be proposed using dimensionalarguments. Figure (3) shows the nomenclature used; r denotes the maximum extentof the jet in the (J direction whilst t represents the transit time for a particle in the jetto reach a given location. The main assumption in the model is that each directionis similar to the upstream direction, except that the opposing velocity is Ue cos c/>.Assuming that both Rand t are functions of u; cos c/>and P, we find that
x = uet - Rcosc/>
6
Y = Rsin 1>and thus
x = eu(C2 sec21> - c.)Y = euCl tan 1>
where Cl and C2 are constant. Finally, therefore, we have
X = bo (Y)2 _ ao.i. r.
Coefficients derived from British Gas raw data indicates that a good approximationto the constants is furnished by ao = 0.694 (as before) and bo = 0.871. The boundingshape of the jet is thus a parabola, with scaling law as given above.
Studies based on dimensional arguments were considered by Linden & Simpson(1994) and List (1979). Such models also propose an alternative explanation for thevortex structure that is seen at the edge of the spreading jet. Regarding each partof the jet as a 'component jet', each of which is subject to a cross-flow Ue sin () andan opposing flow Ue cos (), the lateral extent of the jet is determined by the envelopeof the particle paths. At points on the edge of the jet, the 'rays' converge and thisrequires that fluid is pushed vertically upwards before it can travel downstream. Avortex is thus produced at the envelope of the particle paths. It is hard to quantifythis effect at present; undoubtedly some numerical solutions of the equations (5)would allow some firmer conclusions to be drawn.
6 Conclusions and RecommendationsAny study of this problem must acknowledge that this is a three-dimensional turbu-lent flow, and it is unlikely that any simple models will give all the required detailsof the flow. Recognizing that safety is the primary reason for studying the flow, it isprobable that a combination of the methods given above will be required if realisticpredictions are to be made. In many circumstances such as those pertaining here,political expediency demands that a study of the flow is undertaken using a com-mercial code such as PHOENICS or FLOW3D, in order that some wholly numericaldata may be obtained. Safety contours may then be proposed by multiplying therelevant numbers by suitably chosen 'safety factors'. If calculations of this sort areundertaken, it should be stressed that, in spite of the 'good agreement with experi-ment' that has been reported in the literature, experience shows that the choice ofturbulence model is crucial and different codes may give very different results. Itis therefore strongly recommended that a number of computations are undertakenif commercial codes are to be used, and that these should be used in parallel withsome of the methods described above.
AcknowledgementThe authors acknowledge the generous assistance of Dr. J.E. Simpson (DAMTP,Cambridge) during aspects of work of this project.
7
References
Batchelor, G.K. (1985) An Introduction to Fluid Dynamics, Cambridge Univer-sity Press.
Birch, A.D., Brown, D.R, Dodson, M.G. & Thomas, J.R (1978) The turbulentconcentration field of a methane jet, J. Fluid Mech. 88 431
Bray, D. & Knowles, K. (1989) Numerical modelling of jets in cross-flow andground effect. Royal Military College of Science, Shrivenham, Aeromechanical Sys-tems Group, rept. no. TN SMMCE/ AeS/0305/1
Cleaver, R.P. & Edwards, P.D. (1990) Comparison of an integral model for pre-dicting the dispersion of a turbulent jet in a crossflow with experimental data. J.Loss Prev. Proc. Ind. 3(1) 91-95.
Fairweather, M., Jones, W.P. & Marquis, A.J. (1990) The concentration field ofa jet in a cross-wind. Comb. Sci. & Tech. 73 463-478.
Linden, P.F. & Simpson, J.E. (1994) Continuous releases of dense fluid from anelevated point source in a cross-flow. In: Mixing and Transport in the Environment,eds. K.J. Beven, P.C. Chatwin and J.H. Millbank. John Wiley & Sons. (Seeespecially Chapter 21 pp. 401-418).
List, E.J. (1979) Turbulent Jets and Plumes. In: Mixing in Inland and CoastalWaters, eds. H.G. Fisher, E.J. List, RC.Y. Koh, J. Imberger & N.H. Brooks,Academic Press. (See especially Chapter 9 pp. 315-389).
Skifstead, J.G. (1969) Numerical treatment of line singularities for modeling ajet in a low speed cross flow. In: Analysis of a jet in a subsonic crosswind, NASASP-218
Turner, J.S. (1973) Buoyancy effects in fluids. CUP.
List of ParticipantsJohn Byatt-Smith, John Chapman, Jon Chapman, Alistair Fitt, John Hinch, TimLattimer, David Leppinen, John Lister, John Ockendon, Giles Richardson, RobertTong, Jon Wylie.
Report written by: Alistair Fitt, University of Southampton
8
__ -.-;)~U~
FIGURE(1) Schematic diagram of jet flow
2d to 10 d
I ,
:0',I ,I ,I ,I ,
I II ,
I I
Crossflow>
Flat plateSIDE VIEW ALONG THE AXIS OF SYMMETRY SHOWINGTHE EXTENT OF THE GAS CLOUD
Cross flow
@symbolises the horseshoe vortex around the gas cloud
PLAN VIEW OF THE GAS CLOUD
Sketches of the geometry of the gas cloud.
A sketch of gas concentration curves across the cloud, below the point ofjet impaction.
FIGURE (2) Observations of gross flow features fromBritish Gas experimental data
FIGURE (3) Nomenclature for dimensional analysis jetextent calculation.