Contents lists available at SciVerse ScienceDirect
Powder Technology
j ourna l homepage: www.e lsev ie r .com/ locate /powtec
Gas jet penetration lengths from upward and downward nozzles in dense gas–solidfluidized beds
Pierre Sauriol, Heping Cui, Jamal Chaouki ⁎Department of Chemical Engineering, École Polytechnique de Montréal, P.O. Box 6079, Station Centre-ville, Montréal, Québec, Canada H3C 3A7
The penetration lengths of a jet issuing from upward and downward injection nozzles were measured in adense fluidized bed of Geldart A to Geldart B particles, operated at superficial velocity well beyond the min-imum bubbling velocity. Nozzle orientation, injection velocity and injected gas density were found to be theparameters having the most influence on the jet penetration lengths. Three distinct jet penetration lengthswere determined for the upward nozzle: Lmin, Lmax and Lb, in accordance with Knowlton and Hirsan's(1980) definition [1], while for the downward nozzle, only Lmin and Lmax were observed. The jet penetrationlengths were correlated with respect to dimensionless groups in a systematic approach in an effort to identifythe most important terms. For each nozzle orientation, the analysis yielded unique correlation format whichcould be applied to each characteristic jet length by changing the correlation parameters. Fundamental dis-tinctions between the upward and downward nozzles were uncovered. The mechanism responsible for thejet momentum dissipation was found to be gravitational forces acting on the jet volume for the upward noz-zle and drag forces exerted on the entrained particles for the downward nozzle. Five new correlations werederived for the prediction of the characteristic jet lengths for upward and downward nozzles. The correla-tions retained for the upward nozzle were also found to be in good agreement with data from a high pressurefluidized bed.
In industrial fluidized bed reactors, the injection of gas-phase re-actants through nozzles located downstream from the main distribu-tor is common practice to avoid potentially explosive conditions andpromote selectivity [2,3]. The injection of high velocity gas throughthese nozzles can lead to the formation of so-called jets which arecharacterized by enhanced momentum, heat and mass transfer rates[4]. Entrainment of gas and solids from the fluidized bed into thehigh velocity jet can lead to the premature failure of the reactor dueto particle attrition or erosion of bed internals [1]. Jets can play akey role in the performance of the reactors, thus nozzle design re-quires serious consideration.
The jet penetration length is one of the key nozzle design parametersand several correlations have been proposed for its prediction [5–14].However, due to limitations in the experimental approaches, these cor-relations are often limited to a narrow validity window (e.g. near mini-mum fluidization velocity) and most have been developed for upwardand horizontal nozzles. Furthermore, the jet length predicted by mostcorrelations corresponds to Lmax, a distance which is not sufficient toprevent jet erosion of bed internals. Knowlton and Hirsan [1] haveshown that high momentum bubbles originating from the jet structure
; fax: +1 514 340 4159.ki).
rights reserved.
can penetrate the bed beyond Lmax up to Lb, for which very few dataand correlations have been reported. None of the correlations gatheredfrom the literature and very few data targeted Lmin, a distance of impor-tance to themomentum, heat andmass transfer in the jet region, since itcorresponds to the region with the greatest velocity difference betweenthe jet and the fluidized bed.
Despite limitations in predicting the jet length from correlations,several studies have explored the impact of nozzle design and operatingconditions. Every study encountered reported that the jet penetrationlengths increase with the injection velocity and the orifice diameter.The impact of nozzle orientation has seldom been investigated system-atically within a single study, but Zenz [14] showed that downward andhorizontal nozzles yield jets of similar length, typically three timesshorter than for upward nozzles. Benjelloun et al. [5] and Wang et al.[15] have shown that the injection of denser gases yields longer jets,which is consistent with trends observed on pressurized fluidizedbeds [1,16]. Systematic investigation of particle properties on the pene-tration length is rare due of the difficulty in obtaining particles differingonly in the studied aspect. Hirsan et al. [9] have shown that increases inparticle density and diameter result in shorter jet lengths. It is generallyreported that in excess of minimum fluidization velocity, an increase insuperficial velocity results in shorter jet lengths [1,9,15–19]. Guo et al.[8] recently showed that for FCC particles (Geldart A), an increase in su-perficial velocity, with Ug/Umf between 1 and 2, presumably below Umb,resulted in an increase in jet penetration length. Hong et al. [10] and
43P. Sauriol et al. / Powder Technology 235 (2013) 42–54
Zhong and Zhang [20] have shown that lowering the position of the in-jector relative to the bed surface and the initial bed height, even inlaboratory-scaledfluidized beds, resulted innoticeably shorter jet lengths.
The impact of bed scale has seldom been investigated when deal-ing with the study of jets in fluidized beds. None of the research pa-pers consulted have firmly concluded to an influence of the beddiameter on the jet penetration length. In their work, Vaccaro et al.[4] examined the influence of bed diameter on the upward jet pene-tration by pressure signal analysis. They concluded that the bed diam-eter had a negligible effect on the jet penetration in the range of 0.2 to0.35 m. In their study, Berruti et al. [21] addressed the impact of scaleon the penetration of a horizontal gas–liquid jet in a gas–solid fluid-ized bed using a triboelectric sensing array. The small-scale systemhad a rectangular cross-section with a 0.3 m thickness and 1 mwidth; the large scale system had a trapezoidal cross section with athickness varying between 0.2 near the nozzle inlet and 1.2 m atthe opposite wall and a width of 3.5 m. Their experimental resultsfor both scales agreed with the predictions using the correlation ofAriyapadi et al. [22]. Given that the correlation does not account forbed scale, it can be concluded that bed scale effects, if any, only playa minor role on the jet penetration length in the range consideredby the authors. The correlation of Zhong and Zhang [20] contains aheight-to-hydraulic bed diameter ratio term; however their studywas conducted a 2D jetting-fluidized bed with a unique bed geometryand scale, thus a unique hydraulic bed diameter. The hydraulic beddiameter merely acts as a false constant in their proposed correlation.Caution should be exerted when applying their correlation for bedswith significantly different bed geometry and/or hydraulic bed diam-eter. The correlation of Rees et al. [23] and the condition for jettingderived by Roach [24] suggest a dependency of the jet phenomenonwith respect to the bed diameter in the form of a grid open arearatio. These correlations are not intended for isolated jets with back-ground fluidization but rather for grids with multiple orifices.
In a prior work, an experimental approach using a reflectivefiber-optic probe to determine the local structure of a gas jet was pro-posed [25]. The approach was suitable for dense fluidized beds oper-ated at superficial velocities in excess of the minimum bubblingvelocity (Umb) and allowed for the determination of Lmin, Lmax andLb. The present effort builds on this prior knowledge and attemptsto highlight the impact of operating conditions on the jet penetrationlength for upward and downward nozzles.
The intrusiveness of probe based measurements in fluidized bedshas often been raised and in some cases, spectacular discrepancieshave been reported. Recently, Liu et al. [26] found that average bubblesize determined by intrusive fiber-optic probe was greater than that de-termined by non-intrusive pressure fluctuation by a factor 2–5. Theyexplained this difference by the fact that freely rising bubbles of smallsize are not as likely to be captured by the intrusive probe. On theother hand, a comparative study conducted by Dubrawski et al. [27]has shown that intrusive fiber-optic probe measurements are in agree-mentwith those fromnon-intrusive techniques such as electrical capac-itance tomography, X-ray tomography and radioactive particle trackingwhen determining the time-averaged solid holdup influidized beds. Theexperimental approach used herein is based on the semi-quantitativeevolution of time averaged solid holdup measurement with respect toinjection velocity and thus is not as sensitive to the intrusiveness ofthe fiber optic probe as is the determination of bubble sizes and bubblerise velocities. Furthermore, as opposed to freely rising bubbles, the im-pact of the probe's intrusiveness is expected to be lower due to thehigher momentum carried by the jets and ensuing bubbles and by rely-ing on probes with small impact surfaces.
2. Experimental setup and procedure
The experimental procedure used in the present study was devel-oped in earlier work [25]. For a given fiber-optic probe measurement
position, located at a distance L downstream from the injector alongthe injection axis, plots of the average local solid holdup against injec-tion velocity exhibit transition velocities indicative of one of four jetimpact zones: 1) no impact; 2) intense bubbling; 3) pulsating jet;4) permanent jet. To these transition velocities correspond a charac-teristic jet length: Lb, Lmax and Lmin.
The experimental apparatus consisted of a 152 mm ID by 1.5 mtall Plexiglas column mounted on a perforated plate distributor with160 holes with a diameter of 0.8 mm. The column was topped by avertical acceleration section feeding into a cyclone which returnedthe entrained solids near the top of the column. The column was di-vided into three sections, 0.6, 0.6 and 0.3 m tall from bottom to toprespectively. The middle section could be removed to allow direct ac-cess to the injector and fiber-optic probe located in the bottom sec-tion. The bottom section was equipped with an array of portslocated along the axis with a 50 mm pitch.
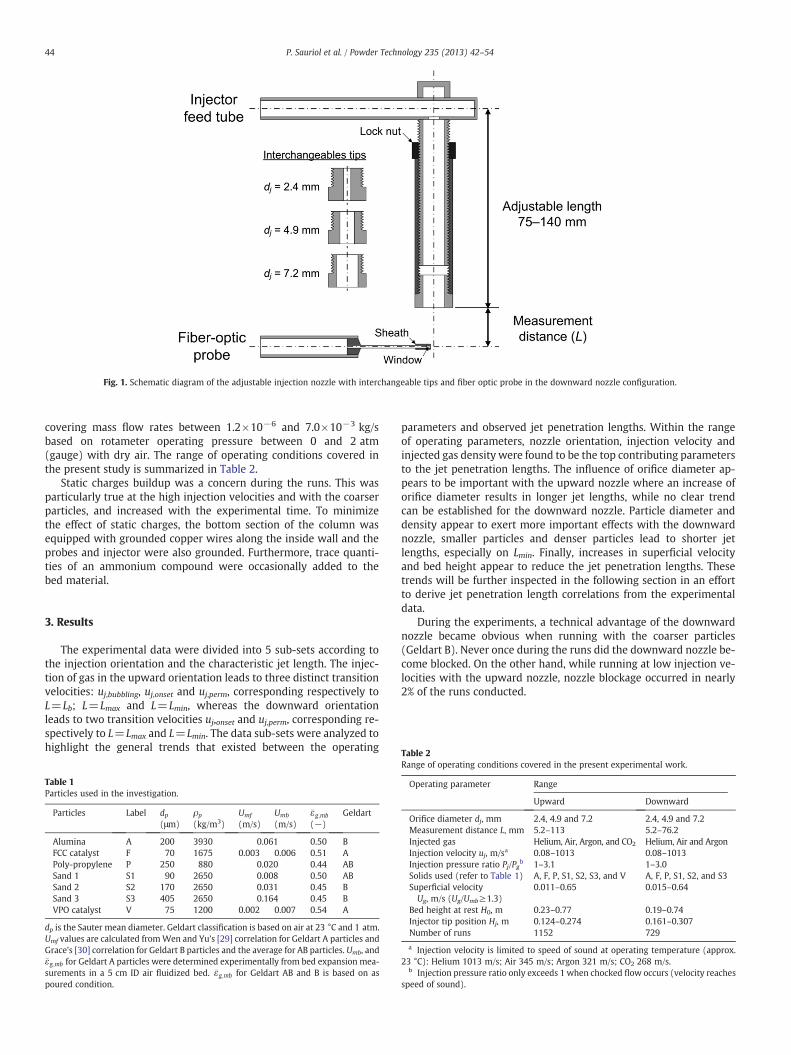
The injector depicted in Fig. 1, consisted of an 80 mm longthreaded shaft with a 8 mm ID. The shaft was welded near its toponto a 150 mm long 6.35 mmOD feeding tube. An 80 mm long sleevewith a 10 mm OD was screwed onto the shaft. Three interchangeableinjection tips with 10 mm OD and 2.4, 4.9 and 7.2 mm orifices couldbemounted onto the tip side of the sleeve. The sleeve could be adjust-ed so that the distance between the feeding tube and the injection tipcovered a 75–140 mm span. This span was sufficient to cover the dis-tance between two consecutive column ports, thus allowing a widerange of effective injection locations and measurement distances.The sleeve position was held in place with a lock nut. Adjustment ofthe injector location relative to the probe tip was made by first posi-tioning the injector tip in contact with the probe tip either directly orindirectly by way of two calibrated gauges of 30 and 80 mm. From thepoint of contact, sleeve rotations were added or removed to achievethe desired distance. A distinct marking on the sleeve body allowedfor an easy assessment of the number of rotations, with each rotationcorresponding to a tip displacement of 1.06 mm. The injector couldbe mounted with the nozzle in the upward or downward orientationand was positioned along the centerline of the column. The tip of theinjector was typically located between 0.15 and 0.30 m from thedistributor.
Single bundle reflective-type fiber-optic probes were used for thelocal solid holdup measurements (also shown in Fig. 1). The probebody was a 6.35 mm OD tube and the probe tip consisted of a50 mm long 0.9 mm OD needle which was press-fit into the end ofthe probe body. A 2 mm OD protective sheath was affixed to the tipof the needle to provide support for a 1 mm-thick window whichminimized the impact of the blind region on the solid holdup mea-surements [28]. Despite the presence of a sheath, the more abrasiveparticles, coupled with the vicinity of a strong jet, could cause signif-icant erosion of the sheath after as little as a week of continuousoperation. A replacement probe was always available to limit thedown time. The effective measurement location was considered tocorrespond to the axis of the fiber-optic probe and thus the distanceswere corrected to account for the sheath radius. The tip of thefiber-optic probe was positioned 1 mm short of the injection axis sothat its effective measurement volume coincided with the injectionaxis.
The solids used for the investigation were intended to cover heatcarriers (Geldart B) used in homogeneous combustion systems aswell as common catalysts (Geldart A) and are summarized inTable 1. The bed height at rest was varied between 0.2 and 0.75 m.The main fluidization gas, which consisted of dry air, was monitoredby one of two rotameters covering a range of superficial velocitiesfrom 0.015 to 0.7 m/s. The injected gas consisted of air, helium, CO2
or argon. CO2 was used during the first series of runs, but difficultiesin maintaining constant flow at the higher injection rates, due tothe evaporative cooling of the CO2, resulted in argon being preferred.The injection flow rate was monitored by one of four rotameters
Fig. 1. Schematic diagram of the adjustable injection nozzle with interchangeable tips and fiber optic probe in the downward nozzle configuration.
44 P. Sauriol et al. / Powder Technology 235 (2013) 42–54
covering mass flow rates between 1.2×10⁻⁶ and 7.0×10⁻³ kg/sbased on rotameter operating pressure between 0 and 2 atm(gauge) with dry air. The range of operating conditions covered inthe present study is summarized in Table 2.
Static charges buildup was a concern during the runs. This wasparticularly true at the high injection velocities and with the coarserparticles, and increased with the experimental time. To minimizethe effect of static charges, the bottom section of the column wasequipped with grounded copper wires along the inside wall and theprobes and injector were also grounded. Furthermore, trace quanti-ties of an ammonium compound were occasionally added to thebed material.
Table 2
3. Results
The experimental data were divided into 5 sub-sets according tothe injection orientation and the characteristic jet length. The injec-tion of gas in the upward orientation leads to three distinct transitionvelocities: uj,bubbling, uj,onset and uj,perm, corresponding respectively toL=Lb; L=Lmax and L=Lmin, whereas the downward orientationleads to two transition velocities uj,onset and uj,perm, corresponding re-spectively to L=Lmax and L=Lmin. The data sub-sets were analyzed tohighlight the general trends that existed between the operating
Table 1Particles used in the investigation.
Particles Label dp(μm)
ρp(kg/m3)
Umf
(m/s)Umb
(m/s)�ε g;mb
(−)Geldart
Alumina A 200 3930 0.061 0.50 BFCC catalyst F 70 1675 0.003 0.006 0.51 APoly-propylene P 250 880 0.020 0.44 ABSand 1 S1 90 2650 0.008 0.50 ABSand 2 S2 170 2650 0.031 0.45 BSand 3 S3 405 2650 0.164 0.45 BVPO catalyst V 75 1200 0.002 0.007 0.54 A
dp is the Sauter mean diameter. Geldart classification is based on air at 23 °C and 1 atm.Umf values are calculated fromWen and Yu's [29] correlation for Geldart A particles andGrace's [30] correlation for Geldart B particles and the average for AB particles. Umb, and�ε g;mb for Geldart A particles were determined experimentally from bed expansion mea-surements in a 5 cm ID air fluidized bed. �ε g;mb for Geldart AB and B is based on aspoured condition.
parameters and observed jet penetration lengths. Within the rangeof operating parameters, nozzle orientation, injection velocity andinjected gas density were found to be the top contributing parametersto the jet penetration lengths. The influence of orifice diameter ap-pears to be important with the upward nozzle where an increase oforifice diameter results in longer jet lengths, while no clear trendcan be established for the downward nozzle. Particle diameter anddensity appear to exert more important effects with the downwardnozzle, smaller particles and denser particles lead to shorter jetlengths, especially on Lmin. Finally, increases in superficial velocityand bed height appear to reduce the jet penetration lengths. Thesetrends will be further inspected in the following section in an effortto derive jet penetration length correlations from the experimentaldata.
During the experiments, a technical advantage of the downwardnozzle became obvious when running with the coarser particles(Geldart B). Never once during the runs did the downward nozzle be-come blocked. On the other hand, while running at low injection ve-locities with the upward nozzle, nozzle blockage occurred in nearly2% of the runs conducted.
Range of operating conditions covered in the present experimental work.
Operating parameter Range
Upward Downward
Orifice diameter dj, mm 2.4, 4.9 and 7.2 2.4, 4.9 and 7.2Measurement distance L, mm 5.2–113 5.2–76.2Injected gas Helium, Air, Argon, and CO2 Helium, Air and ArgonInjection velocity uj, m/sa 0.08–1013 0.08–1013Injection pressure ratio Pj/Pgb 1–3.1 1–3.0Solids used (refer to Table 1) A, F, P, S1, S2, S3, and V A, F, P, S1, S2, and S3Superficial velocityUg, m/s (Ug/Umb≥1.3)
0.011–0.65 0.015–0.64
Bed height at rest H0, m 0.23–0.77 0.19–0.74Injector tip position Hj, m 0.124–0.274 0.161–0.307Number of runs 1152 729
a Injection velocity is limited to speed of sound at operating temperature (approx.23 °C): Helium 1013 m/s; Air 345 m/s; Argon 321 m/s; CO2 268 m/s.
b Injection pressure ratio only exceeds 1 when chocked flow occurs (velocity reachesspeed of sound).
45P. Sauriol et al. / Powder Technology 235 (2013) 42–54
In the present study, it was hypothesized that the intrusiveness ofthe probe would have a greater influence in the downstream direc-tion rather than in the upstream, as some momentum losses mightresult from the gas and solids flow associated with the jet having todeviate around the probe. The influence of such momentum losseswas found to be negligible (within normal measurement error limits).This was determined for the upward pointing nozzle by positioningtwo measurement probes 5 cm apart (distance between two ports),respectively 3 and 8 cm away from the injection nozzle along itsaxis, and performing the velocity sweep. The measurements were re-peated with single probes and found to be in agreement with the dualprobe arrangement. It was thus concluded that the hydrodynamics ofjets were not markedly affected by the presence of the fiber-opticprobe. This dual probe arrangement was used in nearly 50% of themeasurements conducted with the nozzle in the upward directionwhen the probes were located at least 3 cm away from the nozzle.The dual probe approach was not implemented when a probe wasless than 3 cm away from the injection nozzle, as the high velocity re-quired to complete the velocity sweep on the farther probe would re-sult in premature erosion of the sheath and failure of the windowwhich prevents the blind region on the nearer probe.
4. Correlation
4.1. System variables and dimensionless groups
An effort was made to correlate the experimental data to allow forthe prediction of jet penetration lengths. The correlations are basedon the nondimensionalization of injection and fluidized bed proper-ties. It was assumed that the jet length ratio could be expressed asthe product of dimensionless numbers. Given that the system is de-scribed by a set of 19 variables (L, dj, dp, ρp, ρg, ρj, uj, Ug, Umb, μg, μj,Pg,∞, Pj, �εg;ref , �εg , �ε s, g, Href, Hj) involving 3 dimensions (mass, time,length), the Buckingham π theorem stipulates that as many as 16 in-dependent dimensionless groups can be formed. Instead of definingthat many dimensionless groups, the set was reduced by combiningsome of the variables to more sensible forms. This was the case ofthe bed height (H0 or Hmf) and injection location (Hj) which werenot included in the analysis as height Hj/Hmf or aspect ratios H0/dt,as proposed by Hong et al. [10], and Zhong and Zhang [20] respective-ly. The reason for not including such ratios is because of their limitedrange in the context of the present study and concerns when extrap-olating to larger geometries. Instead, it was preferred to define thebed pressure (Pg) as that of the bed at the position of the injectorwhich indirectly accounts for the bed height and the injection
Table 3List of dimensionless groups considered for jet penetration correlation and their range with
Description Dimensionless group
Jet length ratio L/x, where x is a length scaling f
Archimedes number Ari ¼ gd3pρi ρp−ρið Þμ2i
Fluidized bed Reynolds number Reg ¼ ρgUgdpμg
Injection Reynolds number Rej ¼ ρjujxμ j
Injection Froude number Fr1 ¼ u2j þ Pj−Pgð Þ=ρj
gx , where (Pj−Pgto fluid momentum when chock
Injection two-phase Froude number Fr2 ¼ ρj u2j þ Pj−Pgð Þρp �ε s
gx
Orifice-to-particle size ratio dj/dpDensity ratios ρi/ρp
Average fluidized bed voidage �ε g
Average fluidized bed solid holdup �ε s ¼ 1−�ε g
Fluidized bed velocity ratio Ug/Umb
location in accordance with Eq. (1). Thus the bed pressure effectivelyreplaces four variables.
Pg ¼ Pg;∞ þ ρpg ∫Hbed
Hj
1−εg� �
dH≃Pg;∞ þ ρpg 1−�εg� �
Hbed−Hj
� �
≃Pg;∞ þ ρpg Href 1−�εg;ref� �
−Hj 1−�εg� �h i
:
ð1Þ
From the remaining variables, and based on correlations found inthe literature, dimensionless groups were defined for the analysis. Itwas noted from existing correlations that there is not a general con-sensus as to the length scaling factor to be used in the formulationof dimensionless groups; some authors have used particle diameteras well as orifice diameter for both injection Reynolds and Froudenumbers. One of the objectives of the present effort will be to lookat the influence of this choice, not only on the Froude and Reynoldsnumbers but also on the jet length ratio, which so far has exclusivelybeen looked at in terms of a L/dj ratio, a default choice for single-phase systems but not necessarily for dense particulate systems. Thekey dimensionless groups considered are summarized in Table 3.
Analysis of the injection velocity data indicates that under someinjection conditions choked flow was reached within the injector.When chocked flow is reached, the injection velocity is equal to thatof the speed of sound and incremental mass flow out of the injectoris the result of a proportional density (and pressure) increase. Conse-quently, when chocked flow occurs, the pressure difference betweenthe injected gas and the gas in the fluidized bed at the same axial po-sition is not zero and contributes to the momentum. Thus the mo-mentum term included in the Froude numbers must be corrected toaccount for the pressure difference contribution. When sub-sonicflow exists, the pressure difference term is omitted.
4.2. Bed voidage estimate
Instead of relying on bed voidage measurements, which are not al-ways available during the design phases, and for which good esti-mates are difficult to achieve due to correlation limitations, it wasdecided to standardize its estimate within the present effort.
It was first attempted to estimate the bed voidage and fluidizedbed height from the simple two-phase model using the generalizedbubble size model proposed by Choi et al. [31]. The results yieldedby the model were found to disagree with the experimental observa-tions yielding average bed voidages that were generally much lowerthan the measured values. An alternative approach proposed byHilal and Gunn [32], which yields an average solid holdup, was also
in the present work.
Range
actor (dj and dp were considered). x=dj: 1–50x=dp: 30–1500i=g: 20–6800i= j: 2–1.6×10⁴
0.07–18x=dj: 20–1.4×10⁵
x=dp: 0.3–2.4×10⁴
) accounts for pressure contributioned flow arises.
x=dj: 3×10⁻²–3.6×10⁷
x=dp: 0.8–1.2×10⁹
x=dj: 9×10⁻⁵–8.5×10⁴
x=dp: 2.6×10⁻³–1.6×10⁵
6–100i=g: 3×10⁻⁴–1.4×10⁻³
i= j: 4×10⁻⁵–3×10⁻³
0.47–0.750.25–0.531.3–90
Fig. 2. Comparison between measured and estimated bed voidage. Simple two-phasemodel+Choi et al. [31] is based on the average voidage for an initial bed height of0.75 m.
46 P. Sauriol et al. / Powder Technology 235 (2013) 42–54
considered. The approach developed for Geldart B particles yieldedvery high bed voidages, especially for the Geldart A particles in therange of velocities covered within the present study. Although limitedto FCC particles, the simple correlation of King [33] in Eq. (2) was con-sidered for comparison. Finally, a method loosely based on Zenz's [14]dimensionless velocity–diameter plot was formulated. It is assumedthat the average bed voidage increases exponentially with superficialvelocity increase from minimum bubbling velocity (Umb) to the tran-sition to fast fluidization velocity (Use), described by Eq. (3) whichshares similarities with the Richardson–Zaki equation. Use is estimat-ed from Eq. (4) [34]. The average bed voidage at the onset of fast flu-idization, �εg;se, is derived from figures presented in [35] 0.8 and 0.9respectively for Geldart A and Geldart B particles. An average valueof 0.85 is considered for Geldart AB particles. The main differences be-tween the present approach and that of Zenz [14] is that in the pres-ent case, Use and �εg;se rather than the terminal velocity and voidage ofunity are considered as the upper interpolation boundary. For parti-cles with Arg lower than 8000, the terminal velocity is typically small-er than Use.
�εg ¼ Ug þ 1Ug þ 2
with Ug in m=s ð2Þ
�εg ¼ �εg;mb þ �εg;se−�εg;mb
� � ln Ug=Umb
� �ln Use=Umbð Þ ð3Þ
Rese ¼ρgUsedp
μg¼ 1:68Ar0:469g where 8≤Arg≤8000 : ð4Þ
Comparison between the various bed voidage estimators and ex-perimental data from the present work (with only background fluidi-zation) is presented in Fig. 2 for FCC and sand 3 particles. Experimentaldata from Dubrawski et al. [27] from fiber-optic measurements takennear the bed half height is considered for FCC (104 μm) and sand (332and 383 μm). In general, the experimental data is in fair agreementwith the proposed simple estimator given by Eq. (3), for both sandand FCC particles.
4.3. Formulating a correlation
A systematic way of determining the most relevant dimensionlessgroups was followed. The procedure consisted in ranking the variousdimensionless groups with respect to their ability to describe the ex-perimental data on their own (e.g. L/x=C(π)α) and then, consideringthe most relevant groups as starting points, the correlations were re-fined by adding other groups and assessing their impact on the pre-diction quality. An effort was made to limit the total number ofdimensionless groups involved in the correlations. For instance,it was found that the injection two-phase Froude number yieldednearly the same results as the triplet of the injection single-phaseFroude number, injected gas-to-solid density ratio and average solidholdup, thus the injection two-phase Froude number was preferred.The effort was repeated for all five data sub-sets.
For the upward nozzle, two correlation formats were found to beacceptable for all three characteristic jet lengths. Eq. (5) yields a mar-ginally better agreement with the experimental data than Eq. (6), butcounts one more dimensionless group, both formats will be consid-ered for analysis. The resulting correlation parameters are summa-rized in Table 4.
Upward :Ldj
¼ C Fr2;j� �α1 Reg
� �α2 Arg� �α3 ð5Þ
where 9×10⁻⁵bFr2,jb8.5×104, 0.07bRegb18, and 20bArgb6800.
Upward :Ldj
¼ C Fr2;j� �α1 Ug
Umb
� �α2
ð6Þ
where 9×10⁻⁵bFr2, jb8.5×104 and 1.3bUg/Umbb90.The correlations for the upward nozzle based on the Eq. (5) are
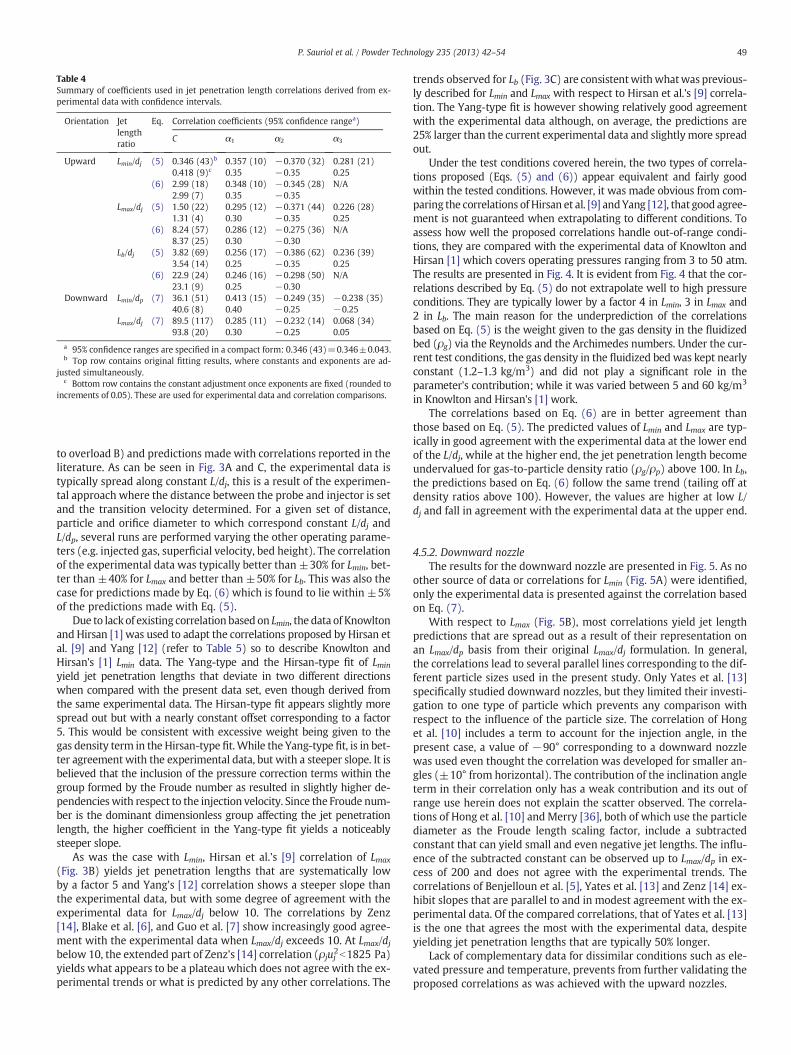
similar for all characteristic jet lengths, the major difference beingthe constant and the exponent affected with the Froude number.The exponents expressing the dependency with respect to the fluid-ized bed Reynolds number is found to be nearly constant at −0.35for every characteristic jet lengths. The negative value is consistentwith the reported trends that the jet penetration lengths decreasewith respect to superficial velocity. As for the Archimedes number,its coefficient nearly constant at 0.25 is consistent with the reportedtrends that larger particles which are less mobile yield higher pene-tration lengths. The observed trends for the correlations based onEq. (6) are similar with respect to the Froude number. The negativeexponent of the fluidized bed velocity ratio is consistent with thetrends that jet penetration length decrease with increasing superficialvelocity. At the same time, the denominator shares similarities withthe Archimedes number used in Eq. (5). It is an indication of theease with which particles are fluidized and may get entrained in thejet.
For the downward nozzle, Eq. (7) was found to be the most ade-quate correlation format for both characteristic jet lengths. Theresulting correlation parameters are summarized in Table 4.
Downward :Ldp
¼ Cρj
ρp⋅Fr1;p
!α1
Arg� �α2 Ug
Umb
� �α3
ð7Þ
where 4×10⁻⁵bρj/ρpb3×10−3, 0.8bFr1,pb1.2×109, 20bArgb6800,and 1.3bUg/Umbb90.
It should be noted that the present formulation uses the particlediameter as the length scaling factor in the jet length ratio and theFroude number, however, the Froude term alone is not sufficient todescribe adequately the jet length ratio when using the particle diam-eter as the length scaling factor. When the first term of Eq. (7) is usedalone, the coefficient of determination (R2) is found to be close to 0.6,
47P. Sauriol et al. / Powder Technology 235 (2013) 42–54
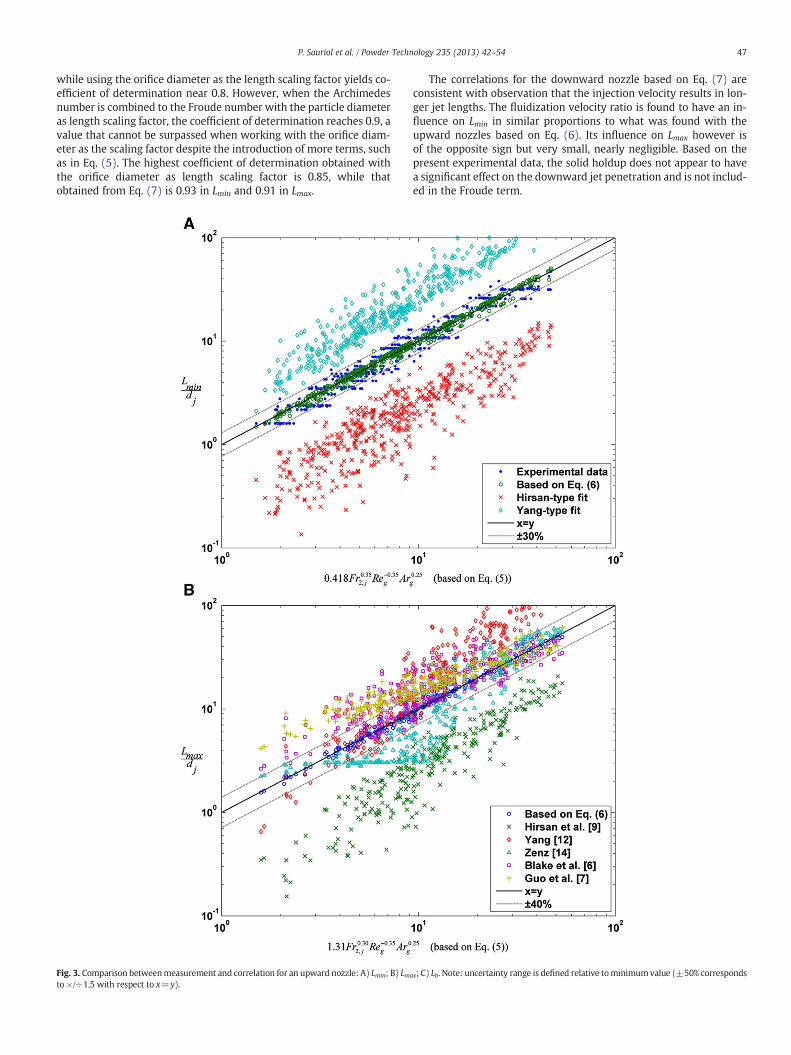
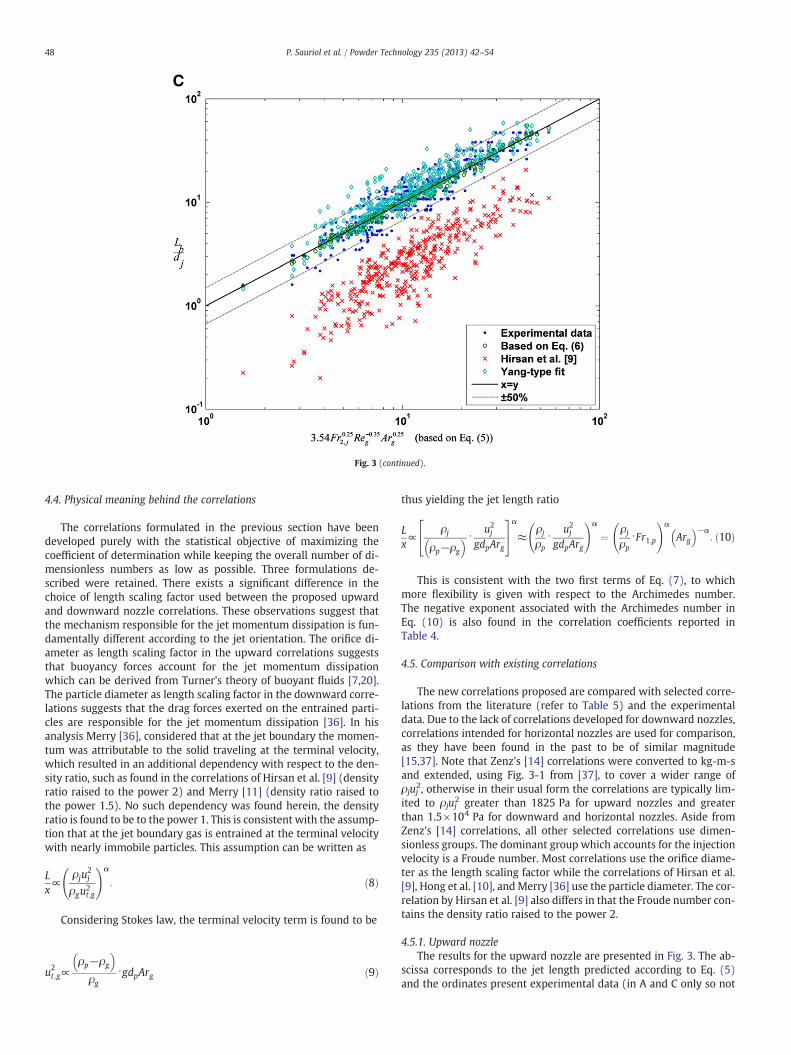
while using the orifice diameter as the length scaling factor yields co-efficient of determination near 0.8. However, when the Archimedesnumber is combined to the Froude number with the particle diameteras length scaling factor, the coefficient of determination reaches 0.9, avalue that cannot be surpassed when working with the orifice diam-eter as the scaling factor despite the introduction of more terms, suchas in Eq. (5). The highest coefficient of determination obtained withthe orifice diameter as length scaling factor is 0.85, while thatobtained from Eq. (7) is 0.93 in Lmin and 0.91 in Lmax.
Fig. 3. Comparison betweenmeasurement and correlation for an upward nozzle: A) Lmin; B) Lmto ×/÷1.5 with respect to x=y).
The correlations for the downward nozzle based on Eq. (7) areconsistent with observation that the injection velocity results in lon-ger jet lengths. The fluidization velocity ratio is found to have an in-fluence on Lmin in similar proportions to what was found with theupward nozzles based on Eq. (6). Its influence on Lmax however isof the opposite sign but very small, nearly negligible. Based on thepresent experimental data, the solid holdup does not appear to havea significant effect on the downward jet penetration and is not includ-ed in the Froude term.
ax; C) Lb. Note: uncertainty range is defined relative tominimumvalue (±50% corresponds
48 P. Sauriol et al. / Powder Technology 235 (2013) 42–54
4.4. Physical meaning behind the correlations
The correlations formulated in the previous section have beendeveloped purely with the statistical objective of maximizing thecoefficient of determination while keeping the overall number of di-mensionless numbers as low as possible. Three formulations de-scribed were retained. There exists a significant difference in thechoice of length scaling factor used between the proposed upwardand downward nozzle correlations. These observations suggest thatthe mechanism responsible for the jet momentum dissipation is fun-damentally different according to the jet orientation. The orifice di-ameter as length scaling factor in the upward correlations suggeststhat buoyancy forces account for the jet momentum dissipationwhich can be derived from Turner's theory of buoyant fluids [7,20].The particle diameter as length scaling factor in the downward corre-lations suggests that the drag forces exerted on the entrained parti-cles are responsible for the jet momentum dissipation [36]. In hisanalysis Merry [36], considered that at the jet boundary the momen-tum was attributable to the solid traveling at the terminal velocity,which resulted in an additional dependency with respect to the den-sity ratio, such as found in the correlations of Hirsan et al. [9] (densityratio raised to the power 2) and Merry [11] (density ratio raised tothe power 1.5). No such dependency was found herein, the densityratio is found to be to the power 1. This is consistent with the assump-tion that at the jet boundary gas is entrained at the terminal velocitywith nearly immobile particles. This assumption can be written as
Lx∝
ρju2j
ρgu2t;g
!α
: ð8Þ
Considering Stokes law, the terminal velocity term is found to be
u2t;g∝
ρp−ρg
� �ρg
⋅gdpArg ð9Þ
thus yielding the jet length ratio
Lx∝
ρj
ρp−ρg
� � ⋅ u2j
gdpArg
24
35α
≈ρj
ρp⋅
u2j
gdpArg
!α
¼ ρj
ρp⋅Fr1;p
!α
Arg� �−α
: ð10Þ
This is consistent with the two first terms of Eq. (7), to whichmore flexibility is given with respect to the Archimedes number.The negative exponent associated with the Archimedes number inEq. (10) is also found in the correlation coefficients reported inTable 4.
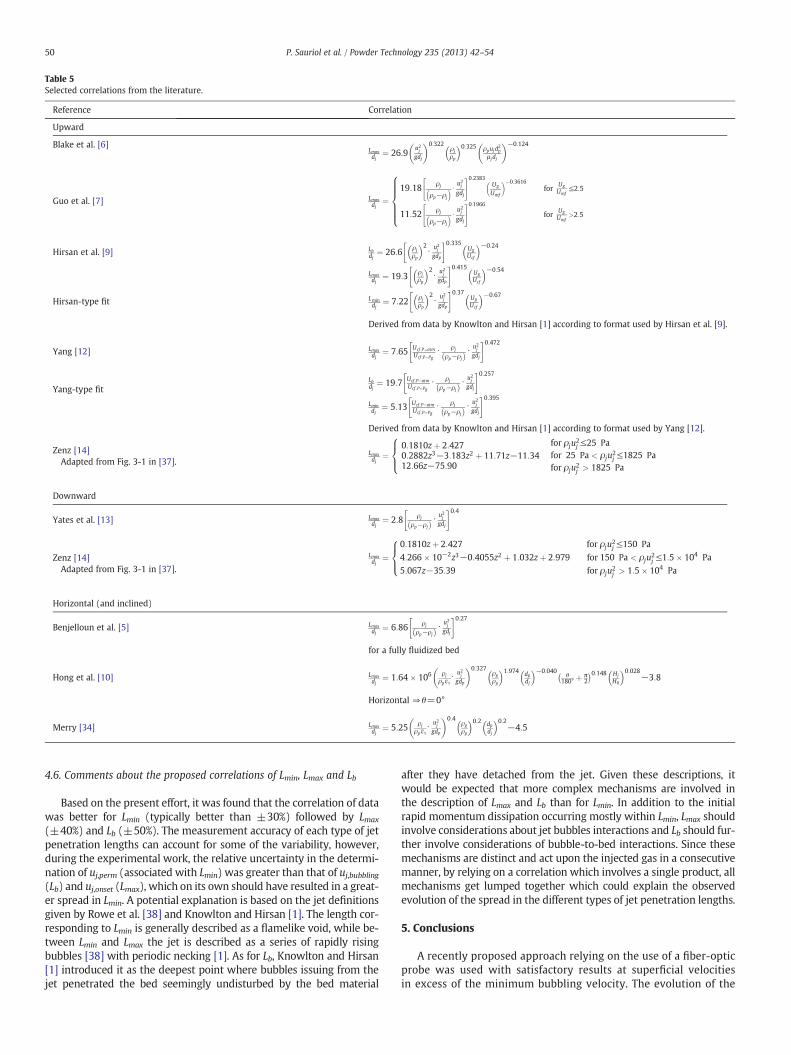
4.5. Comparison with existing correlations
The new correlations proposed are compared with selected corre-lations from the literature (refer to Table 5) and the experimentaldata. Due to the lack of correlations developed for downward nozzles,correlations intended for horizontal nozzles are used for comparison,as they have been found in the past to be of similar magnitude[15,37]. Note that Zenz's [14] correlations were converted to kg-m-sand extended, using Fig. 3-1 from [37], to cover a wider range ofρjuj2, otherwise in their usual form the correlations are typically lim-ited to ρjuj2 greater than 1825 Pa for upward nozzles and greaterthan 1.5×10⁴ Pa for downward and horizontal nozzles. Aside fromZenz's [14] correlations, all other selected correlations use dimen-sionless groups. The dominant group which accounts for the injectionvelocity is a Froude number. Most correlations use the orifice diame-ter as the length scaling factor while the correlations of Hirsan et al.[9], Hong et al. [10], andMerry [36] use the particle diameter. The cor-relation by Hirsan et al. [9] also differs in that the Froude number con-tains the density ratio raised to the power 2.
4.5.1. Upward nozzleThe results for the upward nozzle are presented in Fig. 3. The ab-
scissa corresponds to the jet length predicted according to Eq. (5)and the ordinates present experimental data (in A and C only so not
Table 4Summary of coefficients used in jet penetration length correlations derived from ex-perimental data with confidence intervals.
a 95% confidence ranges are specified in a compact form: 0.346 (43)=0.346±0.043.b Top row contains original fitting results, where constants and exponents are ad-
justed simultaneously.c Bottom row contains the constant adjustment once exponents are fixed (rounded to
increments of 0.05). These are used for experimental data and correlation comparisons.
49P. Sauriol et al. / Powder Technology 235 (2013) 42–54
to overload B) and predictions made with correlations reported in theliterature. As can be seen in Fig. 3A and C, the experimental data istypically spread along constant L/dj, this is a result of the experimen-tal approach where the distance between the probe and injector is setand the transition velocity determined. For a given set of distance,particle and orifice diameter to which correspond constant L/dj andL/dp, several runs are performed varying the other operating parame-ters (e.g. injected gas, superficial velocity, bed height). The correlationof the experimental data was typically better than ±30% for Lmin, bet-ter than ±40% for Lmax and better than ±50% for Lb. This was also thecase for predictions made by Eq. (6) which is found to lie within ±5%of the predictions made with Eq. (5).
Due to lack of existing correlation based on Lmin, the data of Knowltonand Hirsan [1] was used to adapt the correlations proposed by Hirsan etal. [9] and Yang [12] (refer to Table 5) so to describe Knowlton andHirsan's [1] Lmin data. The Yang-type and the Hirsan-type fit of Lmin
yield jet penetration lengths that deviate in two different directionswhen compared with the present data set, even though derived fromthe same experimental data. The Hirsan-type fit appears slightly morespread out but with a nearly constant offset corresponding to a factor5. This would be consistent with excessive weight being given to thegas density term in the Hirsan-type fit.While the Yang-type fit, is in bet-ter agreement with the experimental data, but with a steeper slope. It isbelieved that the inclusion of the pressure correction terms within thegroup formed by the Froude number as resulted in slightly higher de-pendencies with respect to the injection velocity. Since the Froude num-ber is the dominant dimensionless group affecting the jet penetrationlength, the higher coefficient in the Yang-type fit yields a noticeablysteeper slope.
As was the case with Lmin, Hirsan et al.'s [9] correlation of Lmax
(Fig. 3B) yields jet penetration lengths that are systematically lowby a factor 5 and Yang's [12] correlation shows a steeper slope thanthe experimental data, but with some degree of agreement with theexperimental data for Lmax/dj below 10. The correlations by Zenz[14], Blake et al. [6], and Guo et al. [7] show increasingly good agree-ment with the experimental data when Lmax/dj exceeds 10. At Lmax/djbelow 10, the extended part of Zenz's [14] correlation (ρjuj2b1825 Pa)yields what appears to be a plateau which does not agree with the ex-perimental trends or what is predicted by any other correlations. The
trends observed for Lb (Fig. 3C) are consistentwithwhatwas previous-ly described for Lmin and Lmax with respect to Hirsan et al.'s [9] correla-tion. The Yang-type fit is however showing relatively good agreementwith the experimental data although, on average, the predictions are25% larger than the current experimental data and slightly more spreadout.
Under the test conditions covered herein, the two types of correla-tions proposed (Eqs. (5) and (6)) appear equivalent and fairly goodwithin the tested conditions. However, it was made obvious from com-paring the correlations of Hirsan et al. [9] andYang [12], that good agree-ment is not guaranteed when extrapolating to different conditions. Toassess how well the proposed correlations handle out-of-range condi-tions, they are compared with the experimental data of Knowlton andHirsan [1] which covers operating pressures ranging from 3 to 50 atm.The results are presented in Fig. 4. It is evident from Fig. 4 that the cor-relations described by Eq. (5) do not extrapolate well to high pressureconditions. They are typically lower by a factor 4 in Lmin, 3 in Lmax and2 in Lb. The main reason for the underprediction of the correlationsbased on Eq. (5) is the weight given to the gas density in the fluidizedbed (ρg) via the Reynolds and the Archimedes numbers. Under the cur-rent test conditions, the gas density in the fluidized bed was kept nearlyconstant (1.2–1.3 kg/m3) and did not play a significant role in theparameter's contribution; while it was varied between 5 and 60 kg/m3
in Knowlton and Hirsan's [1] work.The correlations based on Eq. (6) are in better agreement than
those based on Eq. (5). The predicted values of Lmin and Lmax are typ-ically in good agreement with the experimental data at the lower endof the L/dj, while at the higher end, the jet penetration length becomeundervalued for gas-to-particle density ratio (ρg/ρp) above 100. In Lb,the predictions based on Eq. (6) follow the same trend (tailing off atdensity ratios above 100). However, the values are higher at low L/dj and fall in agreement with the experimental data at the upper end.
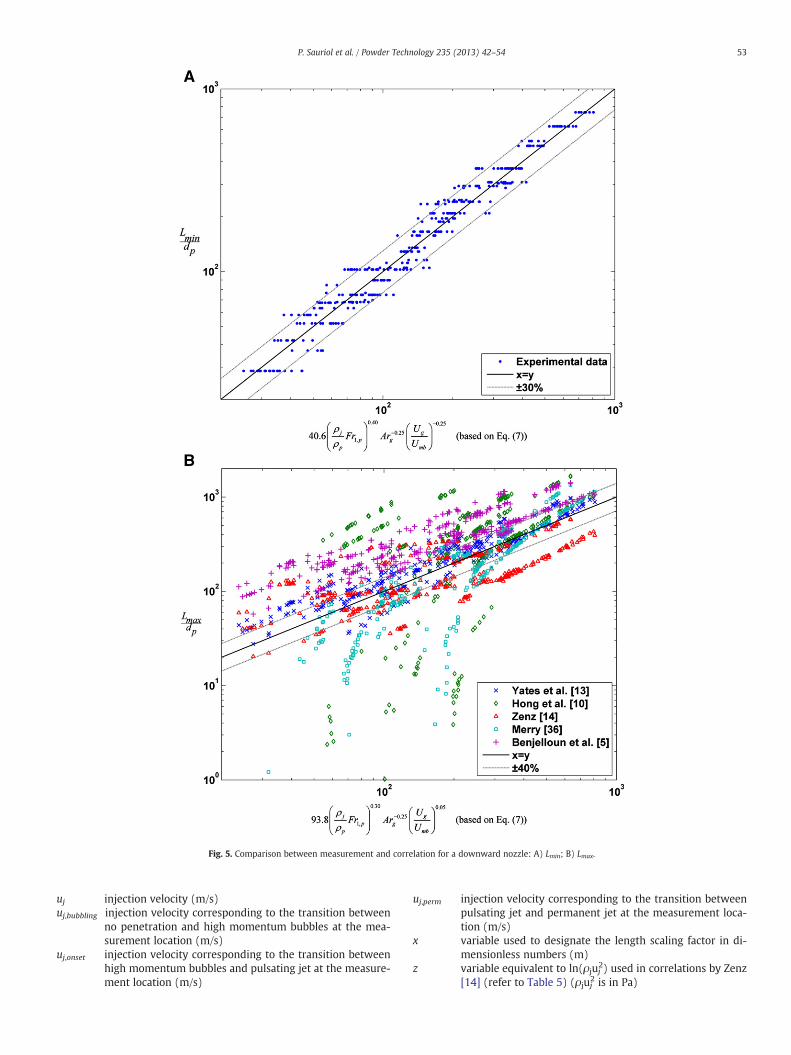
4.5.2. Downward nozzleThe results for the downward nozzle are presented in Fig. 5. As no
other source of data or correlations for Lmin (Fig. 5A) were identified,only the experimental data is presented against the correlation basedon Eq. (7).
With respect to Lmax (Fig. 5B), most correlations yield jet lengthpredictions that are spread out as a result of their representation onan Lmax/dp basis from their original Lmax/dj formulation. In general,the correlations lead to several parallel lines corresponding to the dif-ferent particle sizes used in the present study. Only Yates et al. [13]specifically studied downward nozzles, but they limited their investi-gation to one type of particle which prevents any comparison withrespect to the influence of the particle size. The correlation of Honget al. [10] includes a term to account for the injection angle, in thepresent case, a value of −90° corresponding to a downward nozzlewas used even thought the correlation was developed for smaller an-gles (±10° from horizontal). The contribution of the inclination angleterm in their correlation only has a weak contribution and its out ofrange use herein does not explain the scatter observed. The correla-tions of Hong et al. [10] and Merry [36], both of which use the particlediameter as the Froude length scaling factor, include a subtractedconstant that can yield small and even negative jet lengths. The influ-ence of the subtracted constant can be observed up to Lmax/dp in ex-cess of 200 and does not agree with the experimental trends. Thecorrelations of Benjelloun et al. [5], Yates et al. [13] and Zenz [14] ex-hibit slopes that are parallel to and in modest agreement with the ex-perimental data. Of the compared correlations, that of Yates et al. [13]is the one that agrees the most with the experimental data, despiteyielding jet penetration lengths that are typically 50% longer.
Lack of complementary data for dissimilar conditions such as ele-vated pressure and temperature, prevents from further validating theproposed correlations as was achieved with the upward nozzles.
Table 5Selected correlations from the literature.
Reference Correlation
Upward
Blake et al. [6]Lmaxdj
¼ 26:9u2j
gdj
� �0:322ρj
ρp
� �0:325 ρpujd2p
μ j dj
� �−0:124
Guo et al. [7] Lmaxdj
¼19:18 ρj
ρp−ρj
� � ⋅ u2j
gdj
24
350:2383
Ug
Umf
� �−0:3616for Ug
Umf≤2:5
11:52 ρj
ρp−ρj
� � ⋅ u2j
gdj
24
350:1966
forUg
Umf>2:5
8>>>><>>>>:
Hirsan et al. [9] Lbdj¼ 26:6 ρj
ρp
� �2⋅ u2
j
gdp
� �0:335Ug
Ucf
� �−0:24
Lmaxdj
¼ 19:3 ρj
ρp
� �2⋅ u2
j
gdp
� �0:415Ug
Ucf
� �−0:54
Hirsan-type fit Lmindj
¼ 7:22 ρj
ρp
� �2⋅ u2
j
gdp
� �0:37Ug
Ucf
� �−0:67
Derived from data by Knowlton and Hirsan [1] according to format used by Hirsan et al. [9].
Yang [12] Lmaxdj
¼ 7:65 Ucf ;P¼atm
Ucf ;P¼Pg⋅ ρj
ρp−ρjð Þ ⋅u2j
gdj
� �0:472
Yang-type fitLbdj¼ 19:7 Ucf ;P¼atm
Ucf ;P¼Pg⋅ ρj
ρp−ρjð Þ ⋅u2j
gdj
� �0:257Lmindj
¼ 5:13 Ucf ;P¼atm
Ucf ;P¼Pg⋅ ρj
ρp−ρjð Þ ⋅u2j
gdj
� �0:395Derived from data by Knowlton and Hirsan [1] according to format used by Yang [12].
4:266 � 10−2z3−0:4055z2 þ 1:032zþ 2:979 for 150 Pa < ρju2j ≤1:5� 104 Pa
5:067z−35:39 for ρju2j > 1:5� 104 Pa
8><>:
Horizontal (and inclined)
Benjelloun et al. [5] Lmaxdj
¼ 6:86 ρj
ρp−ρjð Þ ⋅u2j
gdj
� �0:27
for a fully fluidized bed
Hong et al. [10] Lmaxdj
¼ 1:64� 106 ρj
ρp �ε s⋅ u2
j
gdp
� �0:327ρg
ρp
� �1:974 dpdj
� �−0:040θ
180° þ π2
� 0:148 Hj
H0
� �0:028−3:8
Horizontal ⇒θ=0°
Merry [34] Lmaxdj
¼ 5:25 ρj
ρp �ε s⋅ u2
j
gdp
� �0:4ρg
ρp
� �0:2 dpdj
� �0:2−4:5
50 P. Sauriol et al. / Powder Technology 235 (2013) 42–54
4.6. Comments about the proposed correlations of Lmin, Lmax and Lb
Based on the present effort, it was found that the correlation of datawas better for Lmin (typically better than ±30%) followed by Lmax
(±40%) and Lb (±50%). The measurement accuracy of each type of jetpenetration lengths can account for some of the variability, however,during the experimental work, the relative uncertainty in the determi-nation of uj,perm (associated with Lmin) was greater than that of uj,bubbling(Lb) and uj,onset (Lmax), which on its own should have resulted in a great-er spread in Lmin. A potential explanation is based on the jet definitionsgiven by Rowe et al. [38] and Knowlton and Hirsan [1]. The length cor-responding to Lmin is generally described as a flamelike void, while be-tween Lmin and Lmax the jet is described as a series of rapidly risingbubbles [38] with periodic necking [1]. As for Lb, Knowlton and Hirsan[1] introduced it as the deepest point where bubbles issuing from thejet penetrated the bed seemingly undisturbed by the bed material
after they have detached from the jet. Given these descriptions, itwould be expected that more complex mechanisms are involved inthe description of Lmax and Lb than for Lmin. In addition to the initialrapid momentum dissipation occurring mostly within Lmin, Lmax shouldinvolve considerations about jet bubbles interactions and Lb should fur-ther involve considerations of bubble-to-bed interactions. Since thesemechanisms are distinct and act upon the injected gas in a consecutivemanner, by relying on a correlation which involves a single product, allmechanisms get lumped together which could explain the observedevolution of the spread in the different types of jet penetration lengths.
5. Conclusions
A recently proposed approach relying on the use of a fiber-opticprobe was used with satisfactory results at superficial velocitiesin excess of the minimum bubbling velocity. The evolution of the
51P. Sauriol et al. / Powder Technology 235 (2013) 42–54
average particle holdup measured in a fixed location downstream ofthe injector nozzle during an injection velocity sweep, allowed forthe determination of transition velocities corresponding to Lmin,Lmax and Lb from a single run. The data confirmed that with theupward nozzle, the three characteristic jet penetration lengthsexist, while with the downward nozzle, only Lmin and Lmax wereobserved.
Fig. 4. Comparison between data from Knowlton and Hirsan [1] and p
The most influent parameters affecting the jet penetration lengthwere found to be the nozzle orientation, the injection velocity andthe injected gas density. Other operating parameters such as particledensity, superficial gas velocity and orifice diameter. A simple ap-proach to estimate the average bed voidage was proposed. This aver-age voidage was used to account for effects of superficial velocity andto determine the pressure at the injection location which also de-
roposed correlations for an upward nozzle: A) Lmin; B) Lmax; C) Lb.
52 P. Sauriol et al. / Powder Technology 235 (2013) 42–54
pends on the solid properties, the initial bed height, and the injectionlocation.
The jet penetration data was correlated against the experimentaldata from the present study. The better correlations all involved theuse of two-phase Froude numbers to which complementary termsdescribing the state of the fluidized bed were added. Based on thelength scaling factor required in the Froude number, it was postulatedthat the mechanism responsible for momentum dissipation differsaccording to the nozzle orientation. With the upward nozzle, the jetmomentum dissipation is dominated by gravitational forces actingon the jet volume; with the downward nozzle, jet momentum dissi-pation is caused by drag forces acting upon the entrained particles.
Two forms of correlations were found to yield seemingly equiva-lent results based on the present experimental data for the upwardnozzle. The correlations' predictions were compared with data fromKnowlton and Hirsan [1] which were obtained under dissimilar con-ditions (e.g. pressurized fluidized bed with large orifice diameter).Only the following form was found to be in good agreement withboth sets of data:
Lmin
dj¼ 2:99 Fr2;j
� �0:35 Ug
Umb
� �−0:35
Lmax
dj¼ 8:37 Fr2;j
� �0:30 Ug
Umb
� �−0:30
Lbdj
¼ 23:1 Fr2;j� �0:25 Ug
Umb
� �−0:30
;
where 9×10⁻⁵bFr2,jb8.5×104 and 1.3bUg/Umbb90.For the downward nozzle, correlations with the particle diameter
as the length scaling factor are in better agreement with the experi-mental data. However, concerns about the suitability of the correla-tion when extrapolating to higher pressure conditions remain, dueto the presence of the Archimedes term as illustrated for the upward
nozzle. For near atmospheric conditions the jet penetration lengthscan be estimated from
Lmin
dp¼ 40:6
ρj
ρp⋅Fr1;p
!0:40
Arg� �−0:25 Ug
Umb
� �−0:25
Lmax
dp¼ 93:8
ρj
ρp⋅Fr1;p
!0:30
Arg� �−0:25 Ug
Umb
� �0:05
;
where 4×10⁻⁵bρj/ρpb3×10−3, 0.8bFr1,pb1.2×109, 20bArgb6800,and 1.3bUg/Umbb90.
Complementary data at elevated temperature and high pressureconditions, especially for the downward nozzle, are needed to furthervalidate the proposed correlations.
NotationAr Archimedes number (refer to Table 3)C constants used in jet length correlations (refer to Eqs. (5–7)
and Table 4)d diameter (m)Fr Froude number (refer to Table 3)g gravitational constant (g=9.81 m/s)H height or axial position in the bed (m)L distance between the nozzle tip and the fiber-optic probe's
54 P. Sauriol et al. / Powder Technology 235 (2013) 42–54
Greek lettersα exponents used in jet length correlations (refer to Eqs.
(5–7) and Table 4)ε local volumetric fraction�ε average volumetric fraction (estimated from Eq. (3) and
Eq. (4))μ viscosity (Pa·s)θ nozzle inclination angle relative to horizontal used in corre-
lation by Hong et al. [10] (refer to Table 5) (°)ρ density (kg/m3)
Subscripts0 refers to the fluidized bed at rest (Ug=0 m/s)1 refers to the single phase Froude number (refer to Table 3)2 refers to the two-phase Froude number (refer to Table 3)bed refers to the fluidized bed operated at Ug
cf refers to the fluidized bed at complete fluidizationg refers to the gas in the fluidized bed at the same axial posi-
tion as the nozzle tipg,∞ refers to the gas conditions above the bed surfacej refers to the injected gas (based on conditions within the
orifice at its tip)mb refers to the fluidized bed at minimum bubblingmf refers to the fluidized bed at minimum fluidizationp refers to the particlesref refers to known a reference fluidized bed conditions (0, mb
or mf)s refers to solid fractionse refers to the fluidized bed at the onset of transport fluidiza-
tion (significant entrainment)t refers to the column
Acknowledgment
The authors are grateful for the financial support of the NaturalSciences and Engineering Research Council of Canada (NSERC). Theauthors also wish to thank Mr. Jean Huard for modifying andmanufacturing of the experimental equipment, and Mr. GuillermoSolano Rosas and Dr. Rachid Mabrouk for their assistance carryingout the experimental work.
References
[1] T.M. Knowlton, I. Hirsan, The effect of pressure on jet penetration in semi-cylindrical gas-fluidized beds, in: J.R. Grace, J.M. Matsen (Eds.), Proceedings ofthe Third Engineering Foundation Conference on Fluidization (Henniker, NewHampshire), Engineering Foundation, New York, 1980, pp. 315–324.
[2] R.J. Dry, M.R. Judd, Split feed fluidised bed reactors: mass transfer in the spargerregion, in: K. Østergaard, A. Sørensen (Eds.), Proceedings of the Fifth EngineeringFoundation Conference on Fluidization, Engineering Foundation, New York, 1986,pp. 47–54.
[3] G.S. Patience, R.E. Bockrath, Butane oxidation process development in a circulat-ing fluidized bed, Applied Catalysis 376 (2010) 4–12.
[4] S. Vaccaro, D. Musmarra, M. Petrecca, Evaluation of the jet penetration depth ingas-fluidized beds by pressure signal analysis, International Journal of MultiphaseFlow 23 (1997) 683–698.
[5] F. Benjelloun, R. Liégeois, J. Vanderschuren, Détermination des longueurs de jetsde gaz horizontaux dans les lits fluidises, in: C. Laguérie, P. Guigon (Eds.), Récentsprogrès en génie des procédés: La fluidization, 1991, pp. 108–115.
[6] T.R. Blake, H. Webb, P.B. Sunderland, The nondimensionalization of equations de-scribing fluidization with application to the correlation of jet penetration height,Chemical Engineering Science 45 (1990) 365–371.
[7] Q. Guo, G. Yue, J. Zhang, Z. Liu, Hydrodynamic characteristics of a two-dimensional jetting fluidised bed with binary mixtures, Chemical EngineeringScience 56 (2001) 4685–4694.
[8] Q. Guo, C. Si, J. Zhang, Flow characteristics in a jetting fluidized bed with acousticassistance, Industrial and Engineering Chemistry Research 49 (2010) 7638–7645.
[9] I. Hirsan, C. Sishtla, T.M. Knowlton, The effect of bed and jet parameters on verti-cal jet penetration length in gas fluidized beds, in: Paper presented at the 73rdAnnual AIChE Meeting, 1980.
[10] R. Hong, H. Li, H. Li, Y. Wang, Studies on the inclined jet penetration length in agas–solid fluidized bed, Powder Technology 92 (1997) 205–212.
[11] J.M.D. Merry, Penetration of vertical jets into fluidized beds, AICHE Journal 21(1975) 507–510.
[12] W.-C. Yang, Jet penetration in a pressurized fluidized bed, Industrial and Engi-neering Chemistry Fundamentals 20 (1981) 297–300.
[14] F.A. Zenz, Bubble formation and grid design, IChemE Symposium Series 30 (1968)136–139.
[15] C.-H. Wang, Z.-P. Zhong, R. Li, J.-Q. E, Prediction of jet penetration depth based onleast square support vector machine, Powder Technology 203 (2010) 404–411.
[16] J.G. Yates, V. Bejcek, D.J. Cheesman, Jet penetration into fluidized beds at elevatedpressures, in: K. Østergaard, A. Sørensen (Eds.), Proceedings of the Fifth Engineer-ing Foundation Conference on Fluidization, Engineering Foundation, New York,1986, pp. 79–86.
[17] C.S. Chyang, C.H. Chang, J.H. Chang, Gas discharge modes at a single horizontalnozzle in a two-dimensional fluidized bed, Powder Technology 90 (1997) 71–77.
[18] S. Vaccaro, D. Musmarra, F. Costanza, M. Filla, L. Massimilla, Diagnostics of Gas In-jection in Fluidized Beds by Pressure Signal Analysis, in: J.R. Grace, L.W. Shemilt,M.A. Bergounou (Eds.), Proceedings of the Sixth Engineering Foundation Confer-ence on Fluidization, Engineering Foundation, New York, 1989, pp. 245–252.
[19] C. Xuereb, C. Laguérie, T. Baron, Étude du comportement des jets continushorizontaux ou inclinés introduits dans un lit fluidisé par un gaz, I: Morphologiedes jets, Powder Technology 67 (1991) 43–56.
[20] W. Zhong, M. Zhang, Jet penetration depth in a two-dimensional spout–fluid bed,Chemical Engineering Science 60 (2005) 315–327.
[21] F. Berruti, M. Dawe, C. Briens, Study of gas–liquid jet boundaries in a gas–solid flu-idized bed, Powder Technology 192 (2009) 250–259.
[22] S. Ariyapadi, F. Berruti, C. Briens, J. McMillan, D. Zhou, Horizontal penetration ofgas–liquid spray jets in gas–solid fluidized beds, International Journal of ChemicalReactor Engineering 2 (2004) A22.
[23] A.C. Rees, J.F. Davidson, J.S. Dennis, P.S. Fennell, L.F. Gladden, A.N. Hayhurst, M.D.Mantle, C.R. Müller, A.J. Sederman, The nature of the flow just above the perforat-ed plate distributor of a gas-fluidised bed, as imaged using magnetic resonance,Chemical Engineering Science 61 (2006) 6002–6015.
[24] P.E. Roach, Differentiation between jetting and bubbling in fluidized beds, Inter-national Journal of Multiphase Flow 19 (1993) 1159–1161.
[25] P. Sauriol, H. Cui, J. Chaouki, Gas–solid structure in the vicinity of a sparger nozzlein a fluidized bed, Powder Technology 228 (2012) 131–140.
[26] M. Liu, Y. Zhang, H. Bi, J.R. Grace, Y. Zhu, Non-intrusive determination of bubblesize in a gas–solid fluidized bed: an evaluation, Chemical Engineering Science65 (2010) 3485–3493.
[27] K. Dubrawski, H.T. Bi, J. Chaouki, N. Ellis, J.R. Grace, A. Kantzas, C. Lim, G.S. Pa-tience, T. Pugsley, J.X. Zhu, Comparison of invasive and non-invasive fluidizationhydrodynamic measurement techniques (in preparation).
[28] H.P. Cui, N. Mostoufi, J. Chaouki, Comparison of measurement techniques of localparticle concentration for gas–solid fluidization, in: M. Kwauk, J. Li, W.C. Yang(Eds.), Proceedings of the Tenth Engineering Foundation Conference on Fluidiza-tion, Engineering Foundation, New York, 2001, pp. 779–786.
[29] C.Y. Wen, Y.H. Yu, Mechanics of fluidization, Chemical Engineering Progress Sym-posium Series 62 (1966) 100–111.
[31] J.H. Choi, J.E. Son, S.D. Kim, Generalized model for bubble size and frequency ingas-fluidized beds, Industrial and Engineering Chemistry Research 37 (1998)2559–2564.
[32] N. Hilal, D.J. Gunn, Solid hold up in gas fluidised beds, Chemical Engineering andProcessing 41 (2002) 373–379.
[33] D.F. King, Estimation of dense bed voidage in fast and slow fluidized beds of FCCcatalyst, in: J.R. Grace, L.W. Shemilt, M.A. Bergounou (Eds.), Proceedings of theSixth Engineering Foundation Conference on Fluidization, Engineering Founda-tion, New York, 1989, pp. 1–8.