Page 1
General rights Copyright and moral rights for the publications made accessible in the public portal are retained by the authors and/or other copyright owners and it is a condition of accessing publications that users recognise and abide by the legal requirements associated with these rights.
Users may download and print one copy of any publication from the public portal for the purpose of private study or research.
You may not further distribute the material or use it for any profit-making activity or commercial gain
You may freely distribute the URL identifying the publication in the public portal If you believe that this document breaches copyright please contact us providing details, and we will remove access to the work immediately and investigate your claim.
Downloaded from orbit.dtu.dk on: Dec 06, 2021
Gas-liquid two-phase flow behavior in terrain-inclined pipelines for gathering transportsystem of wet natural gas
Yang, Yan; Li, Jingbo; Wang, Shuli; Wen, Chuang
Published in:International Journal of Pressure Vessels and Piping
Link to article, DOI:10.1016/j.ijpvp.2018.03.005
Publication date:2018
Document VersionPeer reviewed version
Link back to DTU Orbit
Citation (APA):Yang, Y., Li, J., Wang, S., & Wen, C. (2018). Gas-liquid two-phase flow behavior in terrain-inclined pipelines forgathering transport system of wet natural gas. International Journal of Pressure Vessels and Piping, 162, 52-58.https://doi.org/10.1016/j.ijpvp.2018.03.005
Page 2
1
Gas-liquid two-phase flow behavior in terrain-inclined pipelines for 1
gathering transport system of wet natural gas 2
Yan Yang1, Jingbo Li1, Shuli Wang1, Chuang Wen2, * 3
1School of Petroleum Engineering, Changzhou University, Zhonglou District, 4
Changzhou, 213016, China 5
2Department of Mechanical Engineering, Technical University of Denmark, Nils 6
Koppels Allé, 2800 Kgs. Lyngby, Denmark 7
*Corresponding author. Tel.: +45 45254168; fax: +45 45251961. E-mail address: 8
[email protected] (C. Wen). 9
Abstract: The Volume of Fluid method and Re-Normalisation Group (RNG) k-ε 10
turbulence model were employed to predict the gas-liquid two-phase flow in a terrain-11
inclined pipeline with deposited liquids. The simulation was carried out in a 22.5 m 12
terrain-inclined pipeline with a 150 mm internal diameter. The flow parameters were 13
numerically analyzed in detail including the phase distribution in pipes, the velocity 14
and pressure around the elbow, the liquid flow rate and liquid holdup in different cross-15
section and the volume of liquid outflow. The numerical results presented that a wave 16
crest formed on the liquid level under the suction force which caused by the negative 17
pressure around the elbow, and then it touched to the top of the pipe. When the liquid 18
blocked the pipe, the pressure drop between the upstream and downstream of the elbow 19
increased with the increase of the gas velocity. At larger gas velocity, more liquid was 20
carried out to the pipeline. The liquid periodically flowed and returned along the uphill 21
section when the liquid was no longer flowing out of the pipeline. 22
Keywords: terrain-inclined pipeline; natural gas; liquid loading; gas-liquid two-phase 23
flow; Volume of Fluid 24
Page 3
2
1. Introduction 25
During the development of condensate natural gas fields, such as the Puguang Gas 26
Field in China’s Sichuan Basin, there are many uphill and downhill pipes due to the 27
large rolling terrain. The liquid often accumulates in the low section of the pipeline 28
during the wet natural gas transportation. The deposited liquid may block the pipeline 29
under the action of the gaseous phase and cause the sharp fluctuation of pressure [1]. It 30
affects the normal operation of the pipeline, even damages the conveying equipment. 31
In addition, the pipeline is more easily subjected to the corrosion issues [2, 3], because 32
the deposited liquid is difficult to be removed. Therefore, it is significant to study the 33
flow behavior of the deposited liquid in the wet natural gas pipelines. 34
The gas-liquid two-phase flows in the horizontal and inclined pipes have been 35
studied for decades. Taitel et al. [4] proposed a model to calculate the flow behavior 36
under the transient flow conditions in a hilly-terrain pipeline system. The model was 37
applied to the low liquid and gas flow rates, where the frictional pressure losses could 38
be neglected. Grolman and Fortuin [5] modified the apparent rough surface model to 39
predict the pressure gradient and liquid holdup in slightly inclined pipes. Salhi, et al. 40
[6] improved the one-dimensional two-fluid model to study the stability of stratified 41
gas–liquid two-phase flows in an inclined pipe. Goldstein et al. [7] proposed the exact 42
solutions for the laminar stratified flows in the inclined pipes. The solution could be 43
used for investigating the influence of the pipe inclination and flow geometry on the 44
liquid holdup and pressure gradient. Gawas et al. [8] proposed a new wave celerity 45
correlation for the gas-liquid two-phase stratified flow using the low viscosity fluids 46
and compared with a mechanistic model proposed by Watson. The Poisson probability 47
theory was employed to predict the slug frequency in the gas-liquid horizontal pipelines 48
[9]. The results indicated that the theoretical model resulted in a great improvement 49
Page 4
3
with the average error of 15% for 1.2 m/s and 0.4 m/s superficial liquid velocities. 50
Ferrari et al. [10] developed a novel two-fluid model to capture the slug flow in pipes 51
using a one-dimensional transient hyperbolic five-equation. This theoretical model 52
successfully captured the slug onset, growing, and development from a stratified flow 53
in horizontal pipes. 54
Barnea and Shoham [11] carried out an experimental study in an air-water system 55
with 2.55 cm and 1.95 cm pipes and compared with the theoretical prediction of Taitel 56
and Dukler. The results showed that the experiment data agreed with the theoretical 57
prediction. Tzotzi and Andritsos [12] gave a modified form of Andritsos-Hanratty 58
model to study stratified gas–liquid two-phase flow and estimate pressure drop and 59
interfacial friction factor in a horizontal pipe. Jia et al. [13] used two absolute pressure 60
sensors to measure differential pressure and obtained the void fraction from differential 61
pressure model in a horizontal gas-liquid two-phase pipe. Arunkumar et al. [14] used 62
the dielectric sensors to identify the gas-liquid two-phase flow regime. The bubbly, slug 63
and stratified flow regimes could be identified in their experiments. Abdulkadir et al. 64
[15] investigated the unsteady hydrodynamic behaviour of slug flow in a horizontal 65
pipe using the an air–silicone oil mixture as the working fluid. Their results showed 66
that the drift velocity component of the bubbles in horizontal pipes far exceeds the value 67
found for vertical riser pipes. Dinaryanto et al. [16] experimentally studied the initiation 68
and flow development mechanisms of the gas-liquid two-phase slug flow in a horizontal 69
pipe., The initiation frequency of slug flow and the evolution of passing slug frequency 70
along the pipeline were also observed by using two high video cameras in their 71
experiments. Bouyahiaoui et al. [17] employed intermediary of the conductance probe 72
technique to study the slug flow behavior in the vertical downward air-water two-phase 73
Page 5
4
pipelines. The experimental results showed that the mean averaged void fraction 74
increased with the gas superficial velocity. 75
The numerical simulation approach was employed to predict the flow regime and 76
flow characteristics of gas-liquid two-phase flows. Mouza et al. [18] used 77
computational fluid dynamics (CFD) modeling to simulate the wave stratified two-78
phase flow in a horizontal pipe. The distribution of the shear stresses and the velocity 79
profiles of both phases were calculated by using CFD modeling. Loilier [19] applied 80
the two-fluid model to simulate the gas-liquid two-phase flow in vertical and terrain-81
inclined pipelines consisting of the uphill, downhill and horizontal sections. The 82
vertical bubble flow, stratified and terrain-inclined slug flows were simulated and the 83
avoid fraction, slug frequency, slug length and other parameters were obtained in this 84
work. Ekambara et al. [20] performed a numerical study of the bubbly two-phase flow 85
in a horizontal pipeline. The numerical results agreed well with the experimental data. 86
Vallée et al. [21] investigated the stratified and slug flow by using the CFD modeling, 87
particle image velocimetry and high-speed video observation experiments. The main 88
flow characteristics obtained by the CFD modeling were successfully validated against 89
the experiments. Verdin et al. [22] used the CFD modeling for simulating the transport 90
behavior of water droplets in 38 in. diameter pipes and compared the oil flow behavior 91
and droplets with that of water. Santim et al. [23] compared different methodologies in 92
transient isothermal gas-liquid two-phase slug flows in a horizontal pipeline. The 93
comparison studies indicated that the Drift-Flux Model presented the better agreement 94
with the pressure wave velocity by the experiments. Wang et al. [24] developed a fluid-95
structure interaction dynamic model for the conveying severe slugging flow in a 96
pipeline-riser system. Their results showed that the dynamic response of the riser is 97
Page 6
5
closely related to the characteristics of severe slugging, which can be used to eliminate 98
severe slugging phenomenon to improve the stability of the riser system. 99
The gas-liquid two-phase flows in horizontal and vertical pipelines attract a great 100
many of experimental and numerical studies, while the flow mechanism of the 101
gathering liquids in the elbow of hilly-terrain pipes is still not understood very well. 102
The purpose of this work is to study the gas-liquid two-phase flow in the terrain-103
inclined pipelines to obtain local and global flow characteristics using the CFD 104
modeling, which can provide the detailed information for removing the deposited liquid 105
effectively and correspondingly protecting natural gas pipeline and equipment. The 106
Volume of Fluid (VOF) method and Re-Normalisation Group (RNG) k-ε turbulence 107
model are used to predict the deposited liquid motion under the action of the gaseous 108
phase in the terrain-inclined pipeline system including an uphill section and a downhill 109
section. The flow parameters are analyzed in detail, including the velocity and pressure 110
distribution, phase fraction and cross-section liquid holdup. 111
2. Terrain-inclined pipelines 112
The terrain-inclined pipeline is employed for our current studies, which contains 113
a downhill section and an uphill part. The inclination angles of downhill and uphill 114
segments are both assigned to be 5°. It is assumed that a certain amount of liquids is 115
gathering at the bottom of the inclined pipeline system, as shown in Fig. 1. The three-116
dimensional geometry of terrain-inclined pipeline is established for the computational 117
domain, including the pipe diameter of D=150 mm and the length of every section is 118
75 D, which ensures a fully developed flow for this terrain-inclined pipeline system. 119
Page 7
6
120
Fig. 1 Terrain-inclined pipelines 121
The flow data for the gas-liquid two-phase is presented in Table 1, obtained from 122
Puguang gas field in Sichuan Basin of China. The working fluids are methane and water, 123
respectively. In this case, the solubility of methane in water can be neglected, we, 124
therefore, assume that the water and methane are the immiscible fluids in the numerical 125
studies. 126
Table 1 Flow data for gas-liquid two-phase numerical simulation 127
Case UG
(m s-1)
G
(kg m-3)
G
(m2 s-1)
h/D
(-)
VL
(m3)
L
(kg m-3)
L
(m2 s-1)
1 5.5 0.6679 1.087×10⁻⁵ 0.75 0.01637 998.2 0.001003
2 6.5 0.6679 1.087×10⁻⁵ 0.75 0.01637 998.2 0.001003
3 7.5 0.6679 1.087×10⁻⁵ 0.75 0.01637 998.2 0.001003
128
3. Computational methods 129
3.1 Governing equations 130
The gas-liquid two-phase flow in the terrain-inclined pipeline represents a distinct 131
phase interface. The interface catching is a key issue for our simulation of this kind of 132
flow behavior. The VOF model [25] uses the surface-tracking technology based on the 133
fixed Eulerian mesh, which can be employed to model two or more immiscible fluids. 134
Therefore, we utilize the VOF model here to track the gas-liquid phase interface in the 135
terrain-inclined pipelines. 136
Page 8
7
The continuity equation is as follows [26]: 137
( ) 0i
i
ut x
(1) 138
The momentum equation [27] is solved throughout the computational domain, and 139
the velocity field is shared among all the phases. 140
( ) ( ) ( )T
u uu p u u g Ft
(2) 141
where ρ is the density, u is the velocity, p is the static pressure, μ is the dynamic 142
viscosity, g is the gravitational body force and F is external body force. 143
For the gas-liquid two-phase flow, the ρ and μ in each computational cell are given 144
by the following equations: 145
2 2 2 1(1 ) (3) 146
2 2 2 1(1 ) (4) 147
The volume fraction of each phase in each grid cell is calculated throughout the 148
domain. The interface between two phases is tracked by solving the continuity equation 149
for the volume fraction of one (or more) phases. The volume fraction equation is as 150
follows [28]: 151
1
1( ) ( ) ( )
n
q q q q q pq qp
pq
u m mt
(5) 152
where pqm is the mass transfer from phase q to phase p and
qpm is the mass transfer from 153
phase p to phase q, αq is the volume fraction of phase q. 154
The primary phase volume fraction is solved based on the following constraint: 155
1
1n
q
q
(6) 156
3.2 Continuum surface force model 157
The effect of surface force along the interface is included in the VOF model. The 158
continuum surface force model proposed by Brackbill et al. [29] is used in this paper. 159
Page 9
8
It is implemented as a source term in the momentum equation. The pressure drop across 160
the surface depends on the surface coefficient σ and the surface curvature are measured 161
by two radii in orthogonal directions R1, R2: 162
1 2
1 2
1 1p p
R R
(7) 163
The surface force Fvol is expressed as follows: 164
1 2
1
2
i ivol ijF
(8) 165
3.3 Turbulence model 166
Among the k-ε, k-ω and Reynolds stress models [30-32], the RNG k-ε turbulence 167
model [33] involves an additional term to its dissipation rate equation that can improve 168
the accuracy for rapidly strained flow. The swirling effect on the turbulence is also 169
included in the RNG k-ε model. Both of these two modifications show that the RNG k-170
ε model is more suitable for the prediction of the large curvature and strain rate flow in 171
the terrain-inclined pipelines. Therefore, the RNG k-ε turbulence model is employed 172
here, because the flow turns at the elbow of the pipe, which connects the uphill section 173
and downhill section in terrain-inclined pipelines. The turbulence kinetic energy, k, and 174
its rate of dissipation, ε, are as follows: 175
( )( ) i
k eff k b M
i j j
kuk kG G Y
t x x x
(9) 176
2
1
3 2
( )( )( )i
eff k b
i j j
u CG C G C R
t x x x k k
(10) 177
where Gk represents the generation of turbulence kinetic energy due to the mean 178
velocity gradients, Gb is the generation of turbulence kinetic energy due to buoyancy, 179
YM represents the contribution of the fluctuating dilatation in compressible turbulence 180
to the overall dissipation rate. αk and αε are the inverse effective Prandtl numbers for k 181
and ε, respectively. 182
Page 10
9
3.4 Numerical schemes 183
The pressure-based VOF method and the RNG k-ε turbulence model are employed 184
for the computation of the gas-liquid two-phase flow in the terrain-inclined pipeline. 185
The VOF explicit scheme is performed for accurately tracking the surface between the 186
gaseous and liquid phases [34]. In addition, the effect of the body force is considered, 187
including the gravity and the surface force. The pressure-velocity coupling is the PISO 188
algorithm. The continuity equation, momentum equation and turbulence equations are 189
discretized with the QUICK method, while the Geometric Reconstruction scheme 190
(Geo-Reconstruct) is chosen for the volume fraction equation. 191
The structured mesh is adopted as the strategy of the grid system for the whole 192
computational domain. The velocity-inlet and outflow boundary conditions are set for 193
the inlet and outlet of the calculation model. The residual of the calculation is set to 10-194
5, and the maximal iterations per time step is 20. The time step size is 10-4 s for proving 195
the calculation convergence in every time step. 196
4. Results and discussion 197
4.1 CFD validation 198
The numerical method was validated with the experiments carried out by 199
Heywood and Richardson [35] before we applied it to the gas-liquid two-phase flows 200
in the terrain-inclined pipeline. The liquid holdup of a slug flow was measured by γ-ray 201
absorption method in a horizontal pipeline with 42 mm inner diameter and 457 m length. 202
The average results of the experimental data were estimated by the probability density 203
functions. The working fluids were air and water, respectively. For the CFD model 204
validation, we utilized six group experimental data in the different gas superficial 205
velocities, while the liquid superficial velocity was fixed at 0.978 m/s. The comparison 206
of the slug flow in a horizontal pipe was described in Fig. 2. The similar flow behavior 207
Page 11
10
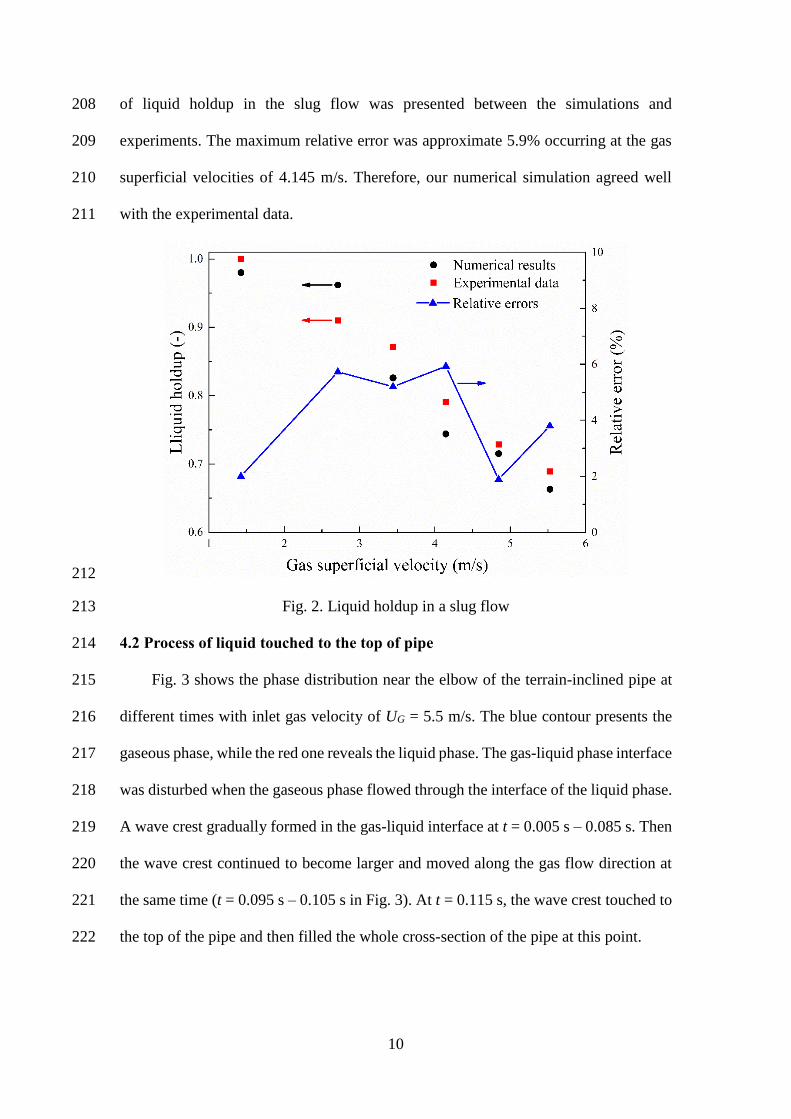
of liquid holdup in the slug flow was presented between the simulations and 208
experiments. The maximum relative error was approximate 5.9% occurring at the gas 209
superficial velocities of 4.145 m/s. Therefore, our numerical simulation agreed well 210
with the experimental data. 211
212
Fig. 2. Liquid holdup in a slug flow 213
4.2 Process of liquid touched to the top of pipe 214
Fig. 3 shows the phase distribution near the elbow of the terrain-inclined pipe at 215
different times with inlet gas velocity of UG = 5.5 m/s. The blue contour presents the 216
gaseous phase, while the red one reveals the liquid phase. The gas-liquid phase interface 217
was disturbed when the gaseous phase flowed through the interface of the liquid phase. 218
A wave crest gradually formed in the gas-liquid interface at t = 0.005 s – 0.085 s. Then 219
the wave crest continued to become larger and moved along the gas flow direction at 220
the same time (t = 0.095 s – 0.105 s in Fig. 3). At t = 0.115 s, the wave crest touched to 221
the top of the pipe and then filled the whole cross-section of the pipe at this point. 222
Page 12
11
223
Fig. 3. Gas and liquid phase distribution in the terrain-inclined pipes 224
The distribution of velocity magnitude and static pressure near the elbow are 225
shown in Fig. 4. It represents that the gas velocity obviously increased when the gaseous 226
phase flows through the region above the liquid, and the maximum velocity can reach 227
36 m/s at t = 0.005 s. The gas flow area decreased due to the liquids assembled at the 228
bottom of the pipe, which caused the increase of the gas velocity when the gaseous 229
phase went through the region. At t = 0.085 s, the gaseous phase flowed through the 230
top of the wave crest and then it was accelerated. At t = 0.115 s, the distribution of 231
velocity in the pipe was different from the first two time steps due to the gaseous phase 232
was separated to two discontinuous regions by the liquid phase. 233
The pressure difference appeared around the elbow of the terrain-inclined pipe at 234
t=0.005 s due to the increase of the gas velocity. The gas-liquid phase interface was 235
disturbed and then the wave crest formed due to the large suction force overcoming the 236
effect of the gravity. At t = 0.085 s, the pressure difference region moved to the 237
Page 13
12
downstream of the elbow and the suction force was directed to this region. The wave 238
crest correspondingly continued to become larger and moved to the downstream of the 239
elbow. At t = 0.115 s, some amount of the liquids filled the whole cross-section of the 240
pipe and the gaseous phase was divided into two parts. The upstream pressure is higher 241
than the downstream one. The liquids moved by the action of the pressure difference 242
between the upstream and downstream. 243
Fig. 4 Velocity and static pressure in the terrain-inclined pipes
4.3 Liquid motion along the uphill section
The gaseous and liquid phase distributions along the uphill section are shown in
Fig. 5. The blue and red contours present the gaseous and liquid phase, respecively. We
can see that the liquid phase blocked the pipe cross-section like a water plug after the
liquid touched to the top of the pipe. It continued to move under the action of the
pressure difference between the upstream and downstream, and some liquids moved
along the top of the pipe and fell under the action of the gravity (t = 0.12 s - 0.40 s). At
t=0.80 s - 5.0 s, the liquid motioned to the pipe outlet and some liquids flowed out the
pipe exit under the action of the inertia and the shearing force of the gaseous phase. At
t=6.0 s - 9.8 s, the remanent liquids refluxed to the elbow and the gravity played a
dominant role in this fluid flow process.
Page 14
13
Fig. 5 Gas and liquid phase distribution along the uphill pipe
Fig. 6 shows the flow rate of the liquid phase at four cross-sections of the uphill
pipe (x = 1000 mm, 3000 mm, 6000 mm, 7000 mm) under the superficial gas velocity
of UG = 5.5 m/s. The flow rate presented the periodic alternation between the positive
and negative in Fig. 6 (a) - (d). The positive flow rate means that the liquid motioned
along the uphill section, while the negative flow rate represents the liquid refluxed. In
Fig. 6 (c), the flow rate is equal to 0 kg/s in this cross-section (x = 6000 mm) at t = 11
s - 17 s, and then a small amount of the liquid flowed through this cross-section of the
uphill pipe. It illustrates that the liquid discontinuously flowes through this pipe cross-
section. We can see from the Fig. 7 (d) that there was almost no liquid going through
this pipe cross-section (x = 7000 mm) after t = 10 s. We, therefore, can conclude that
the periodic reflux occurres between the elbow and the pipe cross-sections less than x
= 6000 mm.
Page 15
14
Fig. 6 Liquid flow rate in different cross-sections of the uphill pipe
Fig. 7 shows the liquid holdup in different cross-sections of the uphill pipe under
the superficial gas velocity of UG = 5.5 m/s. The fluctuation of the liquid holdup is
shown in Fig. 7 (a) - (d). The liquid holdup showed the maximum peak of 1.0 in Fig. 7
(a). In other words, the liquids filled the whole cross-section of the uphill pipe at this
point. As shown in Fig. 7 (b), the minimum peak of the liquid holdup was around 0.17
and the highest one was close to 0.40. In Fig. 7 (c) - (d), the maximum liquid holdup
could reach 0.14 and the others were below 0.05. The average thickness of the liquid
layer tended to become thinner from the uphill cross-section of x = 1000 mm to x =
7000 mm. The shearing force of the gaseous phase on the liquid was gradually
weakened, and the liquids no longer flowed out the pipe exit.
Page 16
15
Fig. 7 Liquid holdup in different cross-section of the uphill pipe
The volume of the liquid was monitored in the numerical simulation and the results
were presented in Fig. 8. The similar trends were obtained under three different inlet
gas velocities. It can be seen that some liquids flowed out the pipe exit and the volume
of liquid rapidly decreased in about 2 seconds. Later, the volume of the liquid was no
longer changed. The volume percentages of the outflow liquid are approximately
20.16%, 28.4%, 31.58% under the superficial gas velocity of UG = 5.5 m/s, 6.5 m/s, 7.5
m/s, respectively.
Page 17
16
Fig. 8 Volume of the liquids in the terrain-inclined pipe
5. Conclusions
The VOF method and the RNG k-ε turbulence model were used to simulate the
gas-liquid two-phase flows within the terrain-inclined pipelines with deposited liquids.
The flow area decreased because of the liquids gathered at the bottom of the pipe. It
caused the increase of the gas velocity and the decrease of the static pressure, which
generated the suction force above the gas-liquid interface. A wave crest formed and
touched the top of the pipe under the action of the suction force around the elbow. The
liquid blocked the cross-section of the pipe and correspondingly resulted in a large
pressure drop. A certain amount of liquids can flow out the pipe exit carried by the
gaseous phase. The volume percentages of the outflow liquids were 20.16%, 28.4%,
31.58% under the superficial gas velocity of 5.5 m/s, 6.5 m/s, 7.5 m/s, respectively. The
liquid periodically flowed and returned along the uphill section in the pipe when the
liquid was no longer flowing out the pipe exit.
Acknowledgements
This work was supported by the National Natural Science Foundation of China
(51606015), the Natural Science Foundation of Jiangsu Province, China (BK20150270),
and the General Program of Natural Science Research Project of Jiangsu Province
Universities and Colleges (15KJB440001). The research leading to these results has
received funding from the People Programme (Marie Curie Actions) of the European
Union's Seventh Framework Programme (FP7/2007-2013) under REA grant agreement
no. 609405 (COFUNDPostdocDTU).
Page 18
17
References
[1] Taitel Y, Simkhis M, Tevelev A, Barnea D. Transient gas liquid flow in hilly
terrain pipelines. International Journal of Multiphase Flow. 2016;86:21-7.
[2] Wen C, Li J, Wang S, Yang Y. Experimental study on stray current corrosion of
coated pipeline steel. Journal of Natural Gas Science and Engineering. 2015;27:1555-
61.
[3] Yang Y, Li Z, Wen C. Effects of alternating current on X70 steel morphology and
electrochemical behavior. Acta Metall Sin. 2013;49:43-50.
[4] Taitel Y, Shoham O, Brill J. Transient two-phase flow in low velocity hilly terrain
pipelines. International Journal of Multiphase Flow. 1990;16:69-77.
[5] Grolman E, Fortuin JM. Gas-liquid flow in slightly inclined pipes. Chemical
Engineering Science. 1997;52:4461-71.
[6] Salhi Y, Si-Ahmed E-K, Legrand J, Degrez G. Stability analysis of inclined
stratified two-phase gas–liquid flow. Nuclear Engineering and Design.
2010;240:1083-96.
[7] Goldstein A, Ullmann A, Brauner N. Characteristics of stratified laminar flows in
inclined pipes. International Journal of Multiphase Flow. 2015;75:267-87.
[8] Gawas K, Karami H, Pereyra E, Al-Sarkhi A, Sarica C. Wave characteristics in
gas–oil two phase flow and large pipe diameter. International Journal of Multiphase
Flow. 2014;63:93-104.
[9] Al-Safran EM. Probabilistic modeling of slug frequency in gas/liquid pipe flow
using the Poisson probability theory. Journal of Petroleum Science and Engineering.
2016;138:88-96.
Page 19
18
[10] Ferrari M, Bonzanini A, Poesio P. A 5‐equation, transient, hyperbolic, 1‐
dimensional model for slug capturing in pipes. International Journal for Numerical
Methods in Fluids. 2017;85:327-62.
[11] Barnea D, Shoham O, Taitel Y, Dukler A. Flow pattern transition for gas-liquid
flow in horizontal and inclined pipes. Comparison of experimental data with theory.
International Journal of Multiphase Flow. 1980;6:217-25.
[12] Tzotzi C, Andritsos N. Interfacial shear stress in wavy stratified gas–liquid flow
in horizontal pipes. International Journal of Multiphase Flow. 2013;54:43-54.
[13] Jia J, Babatunde A, Wang M. Void fraction measurement of gas–liquid two-
phase flow from differential pressure. Flow Measurement and Instrumentation.
2015;41:75-80.
[14] Arunkumar S, Adhavan J, Venkatesan M, Das S, Balakrishnan A.
Characterization of gas-liquid two phase flows using dielectric Sensors. Flow
Measurement and Instrumentation. 2015;45:274-9.
[15] Abdulkadir M, Hernandez-Perez V, Lowndes I, Azzopardi B, Sam-Mbomah E.
Experimental study of the hydrodynamic behaviour of slug flow in a horizontal pipe.
Chemical Engineering Science. 2016;156:147-61.
[16] Dinaryanto O, Prayitno YAK, Majid AI, Hudaya AZ, Nusirwan YA,
Widyaparaga A. Experimental investigation on the initiation and flow development of
gas-liquid slug two-phase flow in a horizontal pipe. Experimental Thermal and Fluid
Science. 2017;81:93-108.
[17] Bouyahiaoui H, Azzi A, Zeghloul A, Hasan A, Berrouk AS. Experimental
investigation of a vertically downward two-phase air-water slug flow. Journal of
Petroleum Science and Engineering. 2018;162:12-21.
Page 20
19
[18] Mouza A, Paras S, Karabelas A. CFD code application to wavy stratified gas-
liquid flow. Chemical Engineering Research and Design. 2001;79:561-8.
[19] Loilier P. Numerical simulation of two-phase gas-liquid flows in inclined and
vertical pipelines: Cranfield University; 2006.
[20] Ekambara K, Sanders R, Nandakumar K, Masliyah J. CFD simulation of bubbly
two-phase flow in horizontal pipes. Chemical Engineering Journal. 2008;144:277-88.
[21] Vallée C, Höhne T, Prasser H-M, Sühnel T. Experimental investigation and CFD
simulation of horizontal stratified two-phase flow phenomena. Nuclear Engineering
and Design. 2008;238:637-46.
[22] Verdin P, Thompson C, Brown L. CFD modelling of stratified/atomization gas–
liquid flow in large diameter pipes. International Journal of Multiphase Flow.
2014;67:135-43.
[23] Santim C, Gaspari E, Paternost G. A transient analysis of gas-liquid slug flow
inside a horizontal pipe using different models. Journal of Petroleum Science and
Engineering. 2017;151:62-76.
[24] Wang L, Yang Y, Liu C, Li Y, Hu Q. Numerical investigation of dynamic
response of a pipeline-riser system caused by severe slugging flow. International
Journal of Pressure Vessels and Piping. 2018;159:15-27.
[25] Hirt CW, Nichols BD. Volume of fluid (VOF) method for the dynamics of free
boundaries. Journal of Computational Physics. 1981;39:201-25.
[26] Wen C, Cao X, Yang Y, Feng Y. Prediction of mass flow rate in supersonic
natural gas processing. Oil & Gas Science and Technology–Revue d’IFP Energies
nouvelles. 2015;70:1101-9.
Page 21
20
[27] Yang Y, Wen C. CFD modeling of particle behavior in supersonic flows with
strong swirls for gas separation. Separation and Purification Technology.
2017;174:22-8.
[28] Fluent A. User’s Guide Release 16.1. Ansys Inc. 2015.
[29] Brackbill J, Kothe DB, Zemach C. A continuum method for modeling surface
tension. Journal of Computational Physics. 1992;100:335-54.
[30] Yang Y, Walther JH, Yan Y, Wen C. CFD modeling of condensation process of
water vapor in supersonic flows. Applied Thermal Engineering. 2017;115:1357-62.
[31] Yang Y, Li A, Wen C. Optimization of static vanes in a supersonic separator for
gas purification. Fuel Processing Technology. 2017;156:265-70.
[32] Wen C, Li A, Walther JH, Yang Y. Effect of swirling device on flow behavior in
a supersonic separator for natural gas dehydration. Separation and Purification
Technology. 2016;168:68-73.
[33] Yakhot V, Orszag SA. Renormalization group analysis of turbulence. I. Basic
theory. Journal of Scientific Computing. 1986;1:3-51.
[34] Yang Y, Li J, Wang S, Wen C. Understanding the formation process of the liquid
slug in a hilly-terrain wet natural gas pipeline. Journal of Environmental Chemical
Engineering. 2017;5:4220-8.
[35] Heywood N, Richardson J. Slug flow of air—water mixtures in a horizontal pipe:
Determination of liquid holdup by γ-ray absorption. Chemical Engineering Science.
1979;34:17-30.