member firms affiliated with KPMG International, a Swiss cooperative. All rights reserved. Liability limited by a scheme approved under Professional Standards Legislation.
Contents
1 Executive summary 1
2 Scope and approach 4 2.1 KPMG’s engagement 4 2.1.1 Gas resource base in Australia 4 2.1.2 Factors influencing the commercialisation of gas in Australia 4 2.1.3 Domestic gas market 4 2.1.4 Integration with LNG export markets 5 2.1.5 Carbon and renewable energy policy implications 5 2.1.6 Impact of potential interventionist policies 5 2.1.7 Outlook for the Australian natural gas market 5 2.2 Report structure 5
4 Factors affecting gas field commercialisation 48 4.1 Land rights and access 48 4.2 Multiple land use classifications 48 4.3 Capital investment constraints 49 4.4 Infrastructure and labour availability 49
member firms affiliated with KPMG International, a Swiss cooperative. All rights reserved. Liability limited by a scheme approved under Professional Standards Legislation.
4.5 Geology and geography 49 4.6 CSG water management 50 4.7 Ramp-up gas 51 4.8 Scale 52 4.9 Environmental regulation 52 4.10 Approvals time 52 4.11 Technology 53
5 Australia’s LNG export markets 54 5.1 Introduction 54 5.1.1 Trade flows 54 5.1.2 Pricing 56 5.1.3 Production 58 5.2 LNG demand base 60 5.2.1 Japan 62 5.2.2 South Korea 62 5.2.3 China 63 5.2.4 India 63 5.3 LNG rivals 63 5.3.1 Qatar 64 5.3.2 Malaysia 64 5.3.3 Indonesia 65 5.3.4 Papua New Guinea 65 5.3.5 Other 65 5.4 Existing LNG projects in Australia 66 5.4.1 Operational 66 5.4.2 Under construction 66 5.5 Proposed LNG projects 67
6 The role of gas in a carbon constrained economy 78 6.1 CPRS 78 6.2 Enhanced RET 79 6.3 Clean Energy Initiative 81 6.4 Issues for the LNG industry 81
7 Factors impacting the domestic gas supply market 83 7.1 Co-dependence on LNG exports 83 7.2 Joint marketing 83 7.3 Vertical integration 84 7.4 Price transparency 84 7.5 Acreage management 85 7.6 Pipeline policy and regulation 86 7.6.1 Gas quality specifications 86 7.6.2 Pipeline regulations 86
member firms affiliated with KPMG International, a Swiss cooperative. All rights reserved. Liability limited by a scheme approved under Professional Standards Legislation.
7.6.3 Approvals process 86
8 Gas market efficiency 87 8.1 National Gas Bulletin Board 87 8.2 Short Term Trading Market 88 8.3 National Gas Market Operator 89 8.4 Impact of interventionist policies on market efficiency 90
9 Gas policy initiatives 91 9.1 Mandatory domestic gas reservation 91 9.2 Retention leases 91 9.3 Royalty reductions or holidays 91 9.4 Broadening of gas quality specifications 92 9.5 Taxation reform to assist small exploration companies 92 9.6 Provision of infrastructure supporting exploration and development 92
10 Outlook for the Australian natural gas market 93 10.1 Short term outlook 93 10.2 Medium term outlook 93 10.3 Long term outlook 94
A Australia’s gas resource base 96 A.1 Conventional gas 96 A.2 Coal Seam Gas (CSG) 105
B Long term and medium term LNG contracts in force in 2008 (duration > 4 yrs) 109
member firms affiliated with KPMG International, a Swiss cooperative. All rights reserved. Liability limited by a scheme approved under Professional Standards Legislation.
Disclaimer Inherent Limitations
This report has been prepared as outlined in Section 2.1 and Section 2.2. The services provided in connection with this engagement comprise an advisory engagement, which is not subject to assurance or other standards issued by the Australian Auditing and Assurance Standards Board and, consequently no opinions or conclusions intended to convey assurance have been expressed.
References to ‘review’ throughout this report have not been used in the context of a review in accordance with assurance and other standards issued by the Australian Auditing and Assurance Standards Board.
Any estimates or projections of future economic performance are impacted by numerous factors that may influence the various components of the estimates or projections, and are inherently indeterminable whether considered in isolation or in conflux. Although KPMG exercises reasonable care when making forecasts or predictions, factors in the process, such as market behaviour, are inherently uncertain. As such, future events may not unfold as expected and actual results achieved for the forecast periods covered will vary from the information presented. Any estimates or projections will only take into account information available to KPMG up to the date of the deliverable and so findings may be affected by new information. Accordingly, we do not warrant or guarantee that any outcome presented in this report will be achieved. Further, events may have occurred since we prepared this report which may impact on it and its findings.
No warranty of completeness, accuracy or reliability is given in relation to the statements and representations made by, and the information and documentation provided by market participants consulted as part of the engagement.
KPMG have indicated within this report the sources of the information provided. We have not sought to independently verify those sources unless otherwise noted within the report.
KPMG is under no obligation in any circumstance to update this report, in either oral or written form, for events occurring after the report has been issued in final form.
The findings in this report have been formed on the above basis.
Third Party Reliance This report is solely for the purpose set out in Section 2.1 and Section 2.2 of this report and for APPEA’s information, and is not to be used for any other purpose.
This report has been prepared at the request of APPEA in accordance with the terms of KPMG’s Engagement Letter with APPEA, dated 18 September 2009. Other than our responsibility to APPEA, neither KPMG nor any member or employee of KPMG undertakes responsibility arising in any way from reliance placed by a third party on this report. Any reliance placed is that party's sole responsibility.
We understand that this report may be made available on the APPEA website. Third parties who access this report are not a party to our Engagement Letter with APPEA and, accordingly, may not place reliance of this report.
KPMG shall not be liable for any losses, claims, expenses, actions, demands, damages, liabilities or any other proceedings arising out of any reliance by a third party on this report.
member firms affiliated with KPMG International, a Swiss cooperative. All rights reserved. Liability limited by a scheme approved under Professional Standards Legislation.
1 Executive summary KPMG have been engaged by the Australian Petroleum Production & Exploration Association (APPEA) to undertake a study of the natural gas market in Australia, its structure, efficiency and future outlook. The purpose of the report is to assist APPEA in establishing a current base of information to communicate with its stakeholders.
The topics covered in this Gas Market Report include:
• an overview of Australian gas reserves and resources;
• the nature and structure of the Australian natural gas market;
• factors affecting the commercialisation of domestic gas resources (including those for Liquefied Natural Gas (LNG) export);
• the impact of the gas export market on the efficient operation of the domestic gas market;
• analysis of potential impacts of interventionist policies aimed at domestic gas volume/price control; and
• an outlook for the Australian gas market.
Gas production in Australia services both domestic gas demand (56%) and the export LNG markets (44%).1 While coal is the predominant fuel in Australia, the use of natural gas has accelerated at a rate greater than that of coal (average consumption of gas has increased by an average of 3.5% pa, compared to 2.4% pa for coal). The strong growth to date has been driven by sustained population growth, strong economic growth, alongside its competitiveness as a fuel source and governmental policies to encourage its uptake.2 The outlook is furthermore positive, as gas is projected to be the fastest growing fossil fuel over the period to 2029-30.3 Primary gas consumption is projected to rise by 3.4% per year, its share of primary energy consumption projected to rise to 33% by 2029-30.4 This forecast growth in demand is driven primarily by the electricity sector, as the share of gas fired generation (GFG) in the energy mix is projected to increase considerably over the medium to long term, reflecting the shift to less carbon intensive fuels in a carbon constrained environment.5
While Australia accounted for 2% of world gas reserves and production in 2008, it is the world’s six largest LNG exporter, accounting for 9% of the world’s LNG trade in 2008.6 Since 2006-07, gas exports have increased by 12%. By 2029-30, LNG exports are projected to reach 109 Mt (from 14.4 Mt in 2007-08), reflecting an average annual growth rate over the outlook period of 9.5%.7
1 Australian Energy Regulator, State of the Energy Market 2009, at 226. 2 Geoscience Australia and ABARE, Australian Energy Resource Assessment, Canberra, 2010, at 102. 3 Ibid at 2 at 121. 4 Ibid. 5 Ibid at 2 at 121 and 122. 6 Ibid at 2 at 83. 7 Ibid at 2 at 122.
member firms affiliated with KPMG International, a Swiss cooperative. All rights reserved. Liability limited by a scheme approved under Professional Standards Legislation.
Production of LNG is projected to increase its share of total Australian gas production to 70% by 2029-30.8
There are two types of gas production: conventional and unconventional. Unconventional gas production typically includes coal seam gas (CSG), tight and shale gas. However, no tight or shale gas is currently produced in Australia.9 Accordingly, for the purposes of this report, only conventional gas and CSG is discussed. Conventional gas contributes 92% of Australia’s gas production, with the remainder consisting of CSG production. Australian gas production is projected to reach 8505 PJ (7.7 Tcf) in 2029-30, with CSG projected to account for 29% of this total.10 CSG is set to contribute to a greater proportion of the gas market, as the burgeoning LNG industry in Queensland (QLD) continues to gain momentum.
In order to inform the Gas Market Report, KPMG undertook a targeted industry consultation, alongside a desktop analysis of the Australian gas market. The industry consultation was conducted by way of one-on-one discussions with a cross section of gas market participants. The industry consultation facilitated the identification of common themes in industry views and the reasons supporting those views. The recurrent themes from the desktop research undertaken and the targeted industry consultation include the following:
• Australia has no shortage of gas resources, across each of the east, west and Northern Territory (NT) markets.
• There is no need for interventionist policies to be introduced by Governments to reserve domestic gas supply or control its price. Market forces suffice to establish the equilibrium between domestic and LNG supply at the respective prices. Domestic gas reservation policies distort the market and discourage investment.
• The QLD Government’s decision to set aside future gas fields for domestic supply if needed (rejecting the option to require a percentage of gas from all fields to contribute to domestic supply) is supported by industry. Further, the QLD Government’s decision was consistent with the findings of KPMG Econtech’s critique and economic analysis on the impact of the proposed policies, which found that mandatory gas volume reservation would diminish the consumer welfare that could be derived from the creation of a 28Mtpa LNG industry in the Gladstone region.
• Buyers and sellers are now opting to contract gas supply for shorter periods (3-5 years as opposed to typical 15 year terms) for ‘brownfield’ and mature supply projects. However, for ‘greenfield’ projects, long-term contracts are still more applicable in order to secure investment.
• Pipeline contracts are generally long-term in comparison to contracts from mature supply projects. The alignment of contract terms would go a long way to standardise contracts and remove any inherent market frictions.
East coast, west coast and the Northern Territory gas markets are distinct and will remain that way until WA’s market matures. Lack of transparency in the gas market has been raised by some
8 Ibid at 2 at 122. 9 Ibid at 2 at 85. 10 Ibid at 2 at 86.
member firms affiliated with KPMG International, a Swiss cooperative. All rights reserved. Liability limited by a scheme approved under Professional Standards Legislation.
participants as a potential impediment. The lack of standardisation across the market, including fungibility of contracts, also acts as a potential barrier to trade. Joint ventures are often needed to secure investment in illiquid non-transparent markets, particularly for foundation contracts. WA could benefit from a Gas Market Bulletin Board, but it is too premature for a gas Short Term Trading Market.
• The Federal Government’s proposed Carbon Pollution Reduction Scheme (CPRS) is given qualified support by surveyed industry participants. Increasing costs of abatement and the risk of diminishing investment capital are concerns. The CPRS is potentially beneficial for domestic gas market development, as it will make gas more competitive with coal as a fuel source once carbon costs are accounted for. Industry has expressed a desire for further clarity surrounding permit allocation arrangements for the LNG industry.
• The Enhanced Renewable Energy Target (RET) scheme creates an unequal playing field in the electricity market, at the expense of the contribution from gas-fired generation (GFG). The carbon price should dictate when renewable technologies are commercially viable, without the need for the RET. While the enhanced RET may act to remove up to 20% of potential market opportunities for GFG, it will nonetheless foster gas as the fuel of choice for backing up the wind farm Power Purchase Agreements (PPAs) vulnerable to the intermittent nature of wind.
• In Western Australia, after the Reindeer and Macedon gas projects are brought online, offshore gas fields will be predominantly underpinned by LNG projects. Domestic supply will depend on the existence of the export LNG market.
• The terms of retention leases can affect the timing of supply of gas to domestic markets, though changes to legislation governing such acreage management is not considered desirable from a gas producer’s perspective. Infrastructure inadequacies, including gas quality specifications for pipelines, can restrict domestic supply, as can development approval processes, which can be overly onerous on time. Tightening the rules surrounding the issue of retention leases could also act as a deterrent to investment in Australia. Royalty reductions and holidays for tight gas operators would be a desirable intervention measure, as would taxation reform for small exploration companies.
This Report provides an overview of Australia’s domestic gas market and the challenges, opportunities and dynamics that it currently faces in light of its increasing integration with the Global market for LNG and the Australian electricity market. Further, the findings in this Report provide context for understanding how the current Australian gas market can operate efficiently, and an outlook going forward.
member firms affiliated with KPMG International, a Swiss cooperative. All rights reserved. Liability limited by a scheme approved under Professional Standards Legislation.
2 Scope and approach
2.1 KPMG’s engagement KPMG has been engaged by APPEA to prepare a report on the natural gas market in Australia. The study encompasses:
• an overview of Australia’s natural gas resource base;
• factors affecting its commercialisation;
• the domestic gas market (and regional differences within);
• the export LNG industry;
• the influence of pending and legislated climate change policies on gas market dynamics;
• the impact of the gas export market on the efficient operation of the domestic gas market;
• potential impacts of interventionist policies aimed at domestic gas volume/price control; and
• outlook for the Australian natural gas market.
2.1.1 Gas resource base in Australia A desktop review of the Australian domestic gas market was conducted in order to compile a snapshot of Australia’s existing natural gas resource base. The basins with known gas reserves were identified using publicly available sources of information, and these were then categorised according to the type of natural gas being extracted – that is, conventional gas or coal seam gas (CSG). The geographic location of the basins, their area covered, total reserve estimate and key fields and projects belonging to each basin were then described.
2.1.2 Factors influencing the commercialisation of gas in Australia Industry consultation was conducted in order to inform the report on the factors influencing commercialisation of gas in Australia. Topics explored include land rights and access, multiple land use classifications, capital investment constraints, infrastructure and labour availability, geology and geography, and the management of waste water and ramp-up gas.
2.1.3 Domestic gas market An overview of the domestic gas market was compiled using a combination of available market information and anecdotal evidence collected from industry consultations, incorporating descriptions of significant features and trends in each of the regional markets comprising the national market,
member firms affiliated with KPMG International, a Swiss cooperative. All rights reserved. Liability limited by a scheme approved under Professional Standards Legislation.
including the east coast, west coast and Northern Territory market. Commentary focuses on market developments on the supply side, gas infrastructure, GFG and gas retailing.
2.1.4 Integration with LNG export markets An overview of the global LNG industry and international LNG demand and supply centres was undertaken using available market information and input from industry feedback. The existing LNG suppliers operating in Australia are described, and an analysis of prospective and committed Australian LNG projects was undertaken.
2.1.5 Carbon and renewable energy policy implications The impacts of the Federal Government’s climate change policies, specifically the expanded Renewable Energy Target (RET) and the proposed Carbon Pollution Reduction Scheme (CPRS), on gas market dynamics are discussed. Industry views are also included in the commentary.
2.1.6 Impact of potential interventionist policies Several potential interventionist policies aimed at domestic gas price/volume control are reviewed in order to identify what could be expected as likely outcomes. Consultation with industry was a key component of the research to inform this section of the report.
2.1.7 Outlook for the Australian natural gas market An outlook for the Australian gas market was developed, largely driven from industry feedback, and analysis of information gathered. This included views on the direction of the Australian natural gas supply and demand balance, alongside its anticipated price path.
2.2 Report structure Chapter 3 presents Australia’s gas basins, categorising them according to their specific gas resource type. Their size, key fields and key projects (existing and expected) are explored. It also reviews the Australian gas market structure. Each of the three distinct markets operating within Australia – the east coast, west coast and Northern Territory markets – are individually described. Commentary surrounding the supply base, gas transport infrastructure, GFG and retailing in each region is provided. It includes recent developments affecting and potential issues facing each market.
Chapter 4 reviews the factors affecting gas field commercialisation. It is predominantly informed by feedback received from KPMG’s targeted industry consultation.
Chapter 5 reviews Australia’s existing and anticipated involvement in the global LNG industry. It gives an overview of the role of LNG in the global landscape and the main LNG demand and supply centres in the international market. It then looks at Australia’s existing LNG projects, and new projects on the horizon.
member firms affiliated with KPMG International, a Swiss cooperative. All rights reserved. Liability limited by a scheme approved under Professional Standards Legislation.
Chapter 6 is an overview of the role of gas in a carbon constrained economy. It presents the existing policy instruments that have been used in order to implement the Government’s climate change goals and the expected impact of these instruments on the domestic gas and LNG export markets.
Chapter 7 presents potential identified barriers to supply of domestic gas in Australia. Competition with LNG export markets is also explored.
Chapter 8 addresses issues surrounding the efficiency of the Australian gas market and outlines any identified impediments to this end.
Chapter 9 presents analysis surrounding interventionist strategies being considered by the government, aimed at domestic volume/price control.
Chapter 10 presents a short term, medium term and long term outlook for the Australian gas market.
member firms affiliated with KPMG International, a Swiss cooperative. All rights reserved. Liability limited by a scheme approved under Professional Standards Legislation.
3 Australia’s gas market
3.1 Overview Natural gas serves a wide and increasingly important role in Australia’s economy. Besides being a key domestic energy source, electricity generation fuel and feedstock for international LNG projects, it is a:
• significant and expanding contributor to export earnings and economic growth;
• significant contributor to the petroleum sector’s $8 billion per year tax and royalty payments made to the government.11
• stimulant for regional investment and development.
Gas has increasingly become the marginal fuel for electricity generation, leading to the increasing convergence of Australian gas and electricity markets. Forty-four percent of Australia’s gas production is exported. In 2009-10, Australian LNG exports are forecast to increase by 13%.12 Natural gas is the third largest source of Australia’s primary energy consumption (behind coal and petroleum products).13 While coal is Australia’s largest energy commodity export, the use of natural gas in Australia has accelerated at a rate greater than that of coal (average consumption has increased by an average of 3.5% pa, compared to 2.4% pa for coal).14
The Australian gas market can be broadly divided into three regions: east coast, west coast and the Northern Territory (NT). These markets are geographically isolated from one another, making transmission and distribution of gas between markets uneconomic at present.15 As a result, all gas is either consumed within each market or exported as LNG.16 The east coast is Australia’s largest gas market, and the most advanced in terms of its interconnectedness and price transparency. The electricity generation and residential sectors are the largest consumers of gas in the east coast market.17 The west coast accounts for around 57% of Australia’s gas production, and accounts for around 41% of Australia’s gas consumption.18 The electricity generation and manufacturing sectors account for the majority of gas consumption in the west coast market.19 The NT market is the smallest producer and consumer of gas in Australia.20
The west coast and NT markets support Australia’s two operational LNG developments: North West Shelf Venture (NWS Venture) and Darwin LNG, which have been supplying LNG to Asian markets for twenty years and three years respectively. The NWS Venture has also supplied domestic gas to WA for 25 years, accounting for 65% of the state’s gas supply. This highlights the potential for LNG to successfully supply not only export markets but local markets as well. 11 Belinda Robinson, CEDA Oil & Gas Industry Update (Conference), 5 November 2009. 12 ABARE, Australian Commodities, Vol 16 No. 14, December quarter 2009 at 662. 13 ABARE, Energy in Australia, Department of Energy, Resources and Tourism, 2009 at 47. 14 Ibid. 15 Ibid at 2 at 104. 16 Ibid. 17 Ibid at 2 at 105. 18 Ibid. 19 Ibid. 20 Ibid.
member firms affiliated with KPMG International, a Swiss cooperative. All rights reserved. Liability limited by a scheme approved under Professional Standards Legislation.
3.1.1 Resources, reserves and production Geoscience Australia defines petroleum resources (which includes natural gas) to include only those natural concentrations of petroleum from which economic extraction of a part is feasible within the range of technology and prices likely to be seen within the next 20 to 25 years.21 Australia has abundant gas resources. According to the State of the Energy Market Report 2009, Australia has over 200,000 PJ (190 Tcf) of gas resources – making it one of the largest endowments in the Asia Pacific region.22 CSIRO estimates that CSG resources in Queensland (alone) are between 150,000 PJ (143 Tcf) and 500,000 PJ (476 Tcf), averaging around 250 Tcf.23 Sedimentary basins located (mostly) offshore from WA in Commonwealth waters currently hold more than 80% of Australia’s discovered natural gas resources. The proved and probable (2P) reserves (those with at least a 50% cumulative probability of existence24) within this resource base account for approximately 60,257 PJ (57 Tcf).25
Australia’s gas production total for the year to June 2009 was approximately 1780 PJ (including LNG exports).26 In 2009-10, Australia’s gas production is forecast to increase by 10%.27 The number of developed and producing fields has almost doubled over the past decade. Currently there are 67 producing fields in the WA region. Not surprisingly, Western Australia is also Australia’s largest producer of gas (66% of national production in 2007-08 (1141 PJ)), followed by Victoria (at 20% (312 PJ)). Gas production in WA has been growing at an average annual rate of 6.8% (over the past seven years), compared to 3.2% in Victoria. There are two primary sources of natural gas in Australia: conventional gas and coal seam gas. At present, with a share of 92%, Australian gas production is dominated by conventional gas.
Around 96% of Australia’s conventional gas production is sourced from the three petroleum basins: the Carnarvon Basin (WA), the Gippsland Basin (offshore Victoria) and the Cooper-Eromanga Basin (central Australia). The Carnarvon Basin in WA is set to become an even bigger contributor with the recent approval of the Gorgon Gas Project – the Greater Gorgon resource is the largest undeveloped gas resource under common control in Australia. Other basins contributing to conventional gas production are the Perth, Browse and Bonaparte Basins (WA), Otway and Bass Basins (Victoria) and the Amadeus Basin (NT).
While CSG currently constitutes only 8% of total natural gas production in Australia28, it is the fastest growing gas production sector29 and its contribution is set to escalate with the successful development of QLD’s burgeoning CSG to LNG industry. In the five years to 2008, 2P (proved and probable) CSG reserves increased at a rate of about 46% per year, significantly increasing resource life.30 Currently, QLD and NSW are the only two states in Australia producing CSG. CSG accounted for almost 23% of gas produced in eastern Australia in the year to June 2009.31 It contributes around 21 Geoscience Australia, http://www.ga.gov.au/resources/publications/oil-gas-resources-australia-2008/glossary.jsp, last accessed 22 January 2010. 22 Ibid at 1 at 28. 23 Dr. Abouna Saghafi, CSIRO Energy Technology, Enhanced Coal Bed Methane (ECBM) and CO2 storage in Australian coals, 2007 at 10. 24 Geoscience Australia, http://www.ga.gov.au/resources/publications/oil-gas-resources-australia-2008/glossary.jsp, last accessed on 22 January 2010. 25 Ibid at 1 at 226. 26 Ibid. 27 ABARE, Australian Commodities, Vol 16 No. 4, December quarter 2009, at 660. 28 Ibid at 1 at 226. 29 Ibid at 1 at 229. 30 Ibid at 2 at 98. 31 Ibid at 1 at 229.
member firms affiliated with KPMG International, a Swiss cooperative. All rights reserved. Liability limited by a scheme approved under Professional Standards Legislation.
90% of QLD’s total natural gas production (sourced from the Bowen and Surat Basins) and meets over 70% of the QLD market demand.32 The entirety of NSW’s gas production (albeit marginal in size) is CSG sourced (from the Gunnedah Basin).
The Joint Petroleum Development Area (JPDA) is also a substantial source of production. The JPDA was established by the Timor Sea Treaty between Timor-Leste and Australia in 2002. It demarcates an area of the Timor Sea located between Australia and Timor-Leste that has overlapping territorial claims by the two countries. The Timor Sea Treaty provisionally gives 90% of the tax revenues from petroleum production from within the JPDA to Timor-Leste and 10% to Australia. Concerning natural gas, there are two projects lying within the JPDA:
• The Bayu-Undan liquids and gas development; and
• The Greater Sunrise gas project (gas reserve estimate of 8.3 Tcf, about three times that of Bayu Undan)
Figure 3.1 shows the location of Australia’s gas reserves. Table 3.1 provides the size of the reserves, their production volumes and the percentage they contribute to domestic sales in 2009 (excluding the JPDA). Figure 3.2 shows a summary of Australian gas production per region, including the JPDA. Figure 3.3 shows the market shares of domestic gas production per gas basin as it stood in 2008 (as the close indicator of 2009 positioning).
member firms affiliated with KPMG International, a Swiss cooperative. All rights reserved. Liability limited by a scheme approved under Professional Standards Legislation.
Figure 3.1: Location of Australia's gas reserves, 2009
Notes: Production data for year ended 30 June 2009. Reserves at June 2009. Source: State of the Energy Market 2009
member firms affiliated with KPMG International, a Swiss cooperative. All rights reserved. Liability limited by a scheme approved under Professional Standards Legislation.
Table 3.1: Natural gas reserves and production in Australia, 2009
Gas Basin Production (Year to June 2009) Proved and Probable Reserves (June 2009)2 PJ Percentage of Domestic Sales PJ Percentage of Domestic Sales
Conventional Natural Gas Western Australia Carnarvon 332 32.2 28739 47.7 Perth 7 0.7 21 0 Northern Territory Amadeus 19 1.9 181 0.3 Bonaparte 0 0 1638 2.7 Eastern Australia Cooper (SA-QLD) 124 12.4 1084 1.8 Gippsland (VIC) 230 23 5625 9.3 Otway (VIC) 116 11.6 1291 2.1 Bass (VIC) 18 1.8 287 0.5 Surat-Bowen (QLD) 16 1.6 212 0.4 Total conventional natural gas 852 85 39079 64.9 Coal Seam Gas Surat-Bowen (QLD) 143 14.3 19726 32.7 Sydney (NSW) 5 0.5 1452 2.4 Total coal seam gas 148 14.8 21178 35.1 Domestic Totals 1000 100 60257 100 Liquefied Natural Gas (Exports) Carnarvon (WA) 766 Bonaparte (NT) 14 Total liquefied natural gas 780 Total production 1780 Notes: 1. Conventional natural gas reserves include liquefied natural gas and ethane 2. Proved reserves are those for which geological and engineering analysis suggests at least a 90 per cent probability of commercial recovery. 3. Probable reserves are those for which geological and engineering analysis suggests at least a 50 per cent probability of commercial recovery. Source: State of the Energy Market 2009
member firms affiliated with KPMG International, a Swiss cooperative. All rights reserved. Liability limited by a scheme approved under Professional Standards Legislation.
Figure 3.2: Australian gas production by region (including JPDA), 2008
TAS, 2%
SA, 4%
QLD, 5%
JPDA, 9%
VIC, 22%
NT, 2%
WA, 56%
Source: Oil & Gas in Australia, October 2008
Figure 3.3: Market shares in domestic gas production, by basin, 2008
member firms affiliated with KPMG International, a Swiss cooperative. All rights reserved. Liability limited by a scheme approved under Professional Standards Legislation.
3.1.2 Wholesale pricing Australian wholesale gas prices have historically been low by international standards.33 They have also been relatively stable, bound by provisions in long term supply contracts out of the Cooper and Gippsland basins and the North West Shelf fields.34 While gas in the United States and Europe closely follows the oil price, natural gas in Australia has traditionally been used as a substitute for coal in coal-fired electricity generation. Australian gas prices have therefore effectively been capped by Australia’s low cost coal prices.35 Given gas price transparency is very low throughout Australia (except in Victoria where a Short Term Trading Market exists), precise pricing information is not widely available. In 2005, estimates for wholesale gas prices on the east coast ranged between $2.90 to $3.15 per gigajoule.36 Between 2005 and 2008, there has been upward pressure on gas prices due to various factors including: • Substantial increases in costs associated with gas exploration, development and production.
• Higher oil prices have pushed up international gas prices which has flowed into Australian LNG exports. This has put upward pressure on WA’s domestic gas prices (given its sizeable LNG export capacity) and has heightened east coast price expectations (given its potential LNG export capacity).
• Drought conditions in eastern Australia in 2007 increased the demand for GFG, which escalated gas prices.
• Market participants began factoring the projected effects of the CPRS into demand projections and pricing on long term gas contracts.37
In 2008 and 2009, weaker economic growth (domestically and internationally) softened demand for natural gas and eased price pressure.38 Figure 3.4 shows indicative price data for the period 2005 to 2009 for domestic gas and LNG exports in Australia. Commentary on the pricing patterns on the east versus west coast is provided in detail in Section 3.2.2 and 3.2.3.
33 Ibid at 1 at 244. 34 Ibid at 1 at 244 and Ibid at 2 at 106. 35 Ibid. 36 Australian Energy Regulator, State of the Energy Market 2008, at 243. 37 Ibid at 1 at 244. 38 Ibid.
member firms affiliated with KPMG International, a Swiss cooperative. All rights reserved. Liability limited by a scheme approved under Professional Standards Legislation.
Figure 3.4: Indicative wholesale natural gas prices
Notes: 1. Prices for the second quarter of the year (April-June). 2. Data for Producers A, B, C and D are average company realisations for specific Australian gas producers. Source: State of the Energy Market 2009
3.1.3 Pipelines
Australia’s gas transmission pipeline system has almost trebled in length since the early 1990s, and around $4 billion has been invested or committed to new transmission pipelines and expansions since 2000.39 A large portion of this investment has been in long-haul cross border pipelines that have introduced new sources of supply and improved the security of gas supply on the east coast. The interconnected nature of the eastern jurisdictions has not only widened the gas supply options available, it has also created a more competitive landscape for gas producers, pipeline operators and gas retailers.
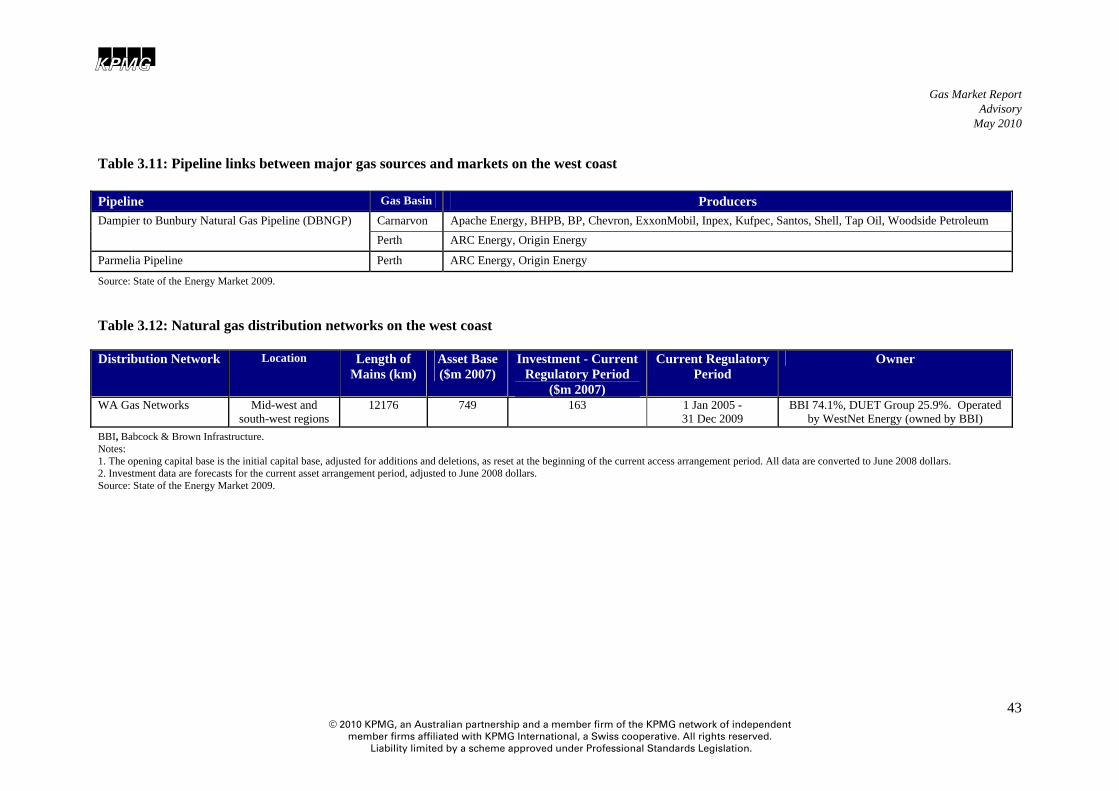
Transmission pipelines in Western Australia and the Northern Territory are not interconnected with other jurisdictions. WA is serviced by three main pipelines: the Dampier to Bunbury Pipeline (DBNGP) (holds the significant position of suppling the south west of WA), Goldfields Pipeline and the Parmelia Pipeline. There has been sizeable investment in WA pipelines in the past ten years, including expansion of the DBNGP and new pipelines to supply gas to the mining and resources sector.40 In NT, the Amadeus Basin to Darwin Pipeline transports gas from the Mereenie and Palm Valley gas fields.
In general it is cheaper to transport gas into Sydney, Canberra and Adelaide from the Cooper Basin than it is from the Victorian coastal basins.41 Tariffs for interruptible services are typically 30% higher than that of firm transportation charges. However, they are paid on the actual quantities shipped rather than on reserved capacity.42 Transmission through the high pressure transmission system is the smallest contributor to delivered costs for residential consumers in Australia’s capital
39 Ibid at 1 at 254. 40 Ibid at 1 at 255. 41 Ibid at 1 at 272. 42 Ibid.
member firms affiliated with KPMG International, a Swiss cooperative. All rights reserved. Liability limited by a scheme approved under Professional Standards Legislation.
cities. Transmission charges range from 2% of delivered gas in Adelaide and Melbourne, to 7% in Perth.43
Figure 3.5 shows Australia’s major gas transmission pipelines. Figure 3.5: Australia's major gas transmission pipelines
member firms affiliated with KPMG International, a Swiss cooperative. All rights reserved. Liability limited by a scheme approved under Professional Standards Legislation.
Gas distribution networks in Australia deliver over 370 petajoules of gas per year and have a combined valuation of over $8 billion.44 The total length of Australia’s gas distribution networks expanded from approximately 67,000 kilometres in 1997 to over 82,000 kilometres in 2009.45 Natural gas is now reticulated to most Australian capital cities, major regional areas and towns. Investment to augment and expand the networks is forecast at about $2 billion in the current access arrangement periods (typically five years).46 The investments are relatively small and stable over time compared to gas transmission capital projects, whose investment cycles are often ‘lumpy’.
The major gas distribution networks in Australia are privately owned, with South Australia, Victoria, Western Australia and Queensland having privatised their state-owned networks in 1993, 1997, 2000 and 2006 respectively.47 The construction of new transmission pipelines provides opportunities to develop new distribution networks, which otherwise tend to focus on roll-out and upgrade projects. Distribution charges for metering and transport often represent the most significant component of retail gas prices for small gas users (up to 60%).48
Figure 3.6 shows the location of Australia’s gas distribution networks.
44 Ibid at 1 at 276. 45 Ibid. 46 Ibid. 47 Ibid. 48 Ibid at 1 at 275.
member firms affiliated with KPMG International, a Swiss cooperative. All rights reserved. Liability limited by a scheme approved under Professional Standards Legislation.
Figure 3.6: Australia’s gas distribution networks
Source: State of the Energy Market 2009
The regulatory framework underpinning gas transmission and distribution in Australia has increasingly gained focus as the rate of project commercialisation supersedes the current capabilities of gas transport infrastructure. The Australian Energy Regulator (AER) is responsible for the economic regulation of covered natural gas transmission and distribution pipelines in all states and territories (except WA). It also enforces the national gas law and national gas rules in all jurisdictions, and regulates retail markets (other than retail pricing) in all states (except WA and NT). The AER is responsible for setting the rate of return on investments made in gas networks.
member firms affiliated with KPMG International, a Swiss cooperative. All rights reserved. Liability limited by a scheme approved under Professional Standards Legislation.
3.1.4 Gas-fired generation About 200 large electricity generators operate in the National Electricity Market (NEM) jurisdictions in eastern and southern Australia.49 Of the registered NEM generation capacity, about 20% is GFG.50 However, given its positioning as intermediate and peaking plant generators, GFG supplies only about 8% of the electricity output.51 Black and brown coal account for around 60% of the registered NEM capacity, yet supply 85% of the output, given their positioning as predominantly baseload generators. Hydroelectric generation accounts for 17%, but has less than 6% of the output.52 In WA, around 60% of installed generation capacity is fuelled by natural gas, and 35% by coal.53 In SA and NT, electricity generation is also mainly fuelled by natural gas.54 The majority of committed and proposed investments in Australian generation capacity involve GFG (2200 MW out of total 2650 MW of committed capacity)55, which is an indication of the industry’s anticipation of the Federal Government’s climate change policies.56 Currently, coal is the lowest cost fuel sources for electricity generation in Australia, followed by gas. However, due to its lower carbon intensity, gas is well placed to become more cost competitive against coal, should the Government’s proposed Carbon Pollution Reduction Scheme (CPRS) be enacted. However, the expanded Renewable Energy Target (RET) does erode the benefits of the CPRS for the gas industry, by forcing renewable energy supply against market forces. The impact of the CPRS and enhanced RET are discussed in more detail in Chapter 6. Most of the committed GFG projects are expected to be commissioned by the end of 2010. Table 3.2 shows the GFG projects that were completed in the twelve month period to October 2009. Figure 3.7 shows the location and fuel type of Australian generation projects in advanced stages of development (the size of the GFG projects is also indicated). Table 3.3 shows the NEM’s committed investment generation projects as at June 2009. Table 3.4 lists the major generation development projects proposed for the NEM, showing that the bulk of proposed capacity occurs in NSW (possibly because the region is the highest net importer in the NEM) and Queensland.57
49 Ibid at 1 at 52. 50 Ibid at 1 at 55. 51 Ibid. 52 Ibid. 53 Ibid at 1 at 112. 54 Ibid at 1 at 59. 55 Ibid at 1 at 62. 56 Ibid at 36 at 67. 57 Ibid at 1 at 62.
member firms affiliated with KPMG International, a Swiss cooperative. All rights reserved. Liability limited by a scheme approved under Professional Standards Legislation.
Table 3.2: GFG developments completed between October 2008 – October 2009
Project Location Company Capacity (MW)
Capital Expenditure (A$m)
NewGenKwinana WA Babcock and Brown Power/ERM 330 400 Newman WA Babcock and Brown Power 37 90 Neerabup WA ANZ Infrastructure Services/ERM Power 320 425 Braemar 2 QLD ERM Power/Arrow Energy 450 546 Tallawarra Stage 1 NSW TRUenergy Tallawarra 400 350 Uranquinty NSW Origin Energy 640 700 Quarantine Expansion SA Origin Energy 120 86 Weddell Stage 2 NT Power and Water Corporation 43 N/A Tamar Valley TAS Aurora Energy 390 451
Source: ABARE, Electricity generation – Major development projects - April 2009 and October 2009 listings. Figure 3.7: Advanced electricity generation projects
Source: ABARE, Electricity generation – Major development projects - October 2009 listing.
member firms affiliated with KPMG International, a Swiss cooperative. All rights reserved. Liability limited by a scheme approved under Professional Standards Legislation.
Table 3.3: Committed investment projects in the NEM, June 2009
Developer Power Station Technology Capacity (MW)
Planned Commissioning Date
Queensland Queensland Gas Company Condamine CCGT 135 2009 - 10 Origin Energy Darling Downs CCGT 605 2010 Origin Energy Mount Stuart (extension) OCGT 127 2009 Rio Tinto Yarwun Cogen Gas cogeneration 152 2010 New South Wales Eraring Energy Eraring (extension) Coal fired 120 2010 – 11 Delta Electricity Colongra (units 2 – 4) OCGT 471 Victoria AGL Energy Bogong Hydro 140 2009 – 10 Origin Energy Mortlake OCGT 518 2010 Pacific Hydro Portland Wind 164 2009 – 10 South Australia International Power Port Lincoln OCGT 25 2010 Tasmania Aurora Energy Tamar Valley CCGT 196 2009
Note: Capacity is summer capacity for all generators Source: State of the Energy Market 2009
member firms affiliated with KPMG International, a Swiss cooperative. All rights reserved. Liability limited by a scheme approved under Professional Standards Legislation.
Table 3.4: Major proposed generation investment in the National Electricity Market, 2009 Developer Power Station Technology Capacity
(MW) Planned
Commissioning Date Queensland Origin Energy Spring Gully CCGT 1000 n/a ERM Energy Braemar 3 Gas 462 2012 ERM Energy Braemar 4 Gas 434 2013 CS Energy Swanbank F CCGT 380 2012 New South Wales Macquarie Generation Tomago Gas Turbine OCGT 500 n/a Eraring Energy Eraring upgrade Coal 60 2011 Eraring Energy Eraring upgrade Coal 60 2012 ERM Power Wellington (Unit 5) OCGT 280 2012 ERM Power Wellington (Units 1 - 4) OCGT 616 2011 AGL Energy Leaf's gully Gas 360 2012 Delta Electricity Mt Piper expansion Coal 600 2015-2016 Delta Electricity Bamarang CCGT 450 2012-2013 Delta Electricity Marulan Gas Turbine CCGT 420 2013-2014 Delta Electricity Marulan Gas Turbine OCGT 330 2013-2014 Delta Electricity Bamarang CCGT 330 2012-2013 International Power Parkes OCGT 150 n/a International Power Buronga OCGT 120 n/a Victoria Origin Energy Mortlake Stage 2 CCGT 470 n/a Santos Shaw River CCGT 500 2012 AGL Energy Tarrone Gas 500 2012 Solar system Solar System Victorian Solar
Energy Facility (Unit 2-51) Solar Concentrator 100 2012
Solar system Solar System Victorian Solar Energy Facility (Unit 52-77)
Solar Concentrator 54 2013
HRL Group and Harbin Power Engineering
IDGCC demonstration plant IDGCC 500 2013
South Australia Altona Resources Arkaringa IGCC 560 2014 International Power Pelican Point (Stage 2) Gas 300 n/a Strike Oil Kingston Coal 40 2015 Tasmania Gunns Bell Bay Pulp Mill power
plant Biomass 184 2012
Notes: 1. CCGT, combined cycle gas turbine; IDGCC, integrated drying and gasification combined cycle; OCGT, open cycle gas turbine 2. Excludes wind generation. Source: State of the Energy Market 2009
member firms affiliated with KPMG International, a Swiss cooperative. All rights reserved. Liability limited by a scheme approved under Professional Standards Legislation.
3.1.5 Gas retailing Gas retailing is the final component of the gas supply chain. All state and territory governments have introduced full retail contestability (FRC) for gas customers, which allows customers freedom of choice for selecting their gas supplier. In most jurisdictions there is at least one host retailer (whom are subject to various regulatory obligations), and new entrants. The major retail players in most jurisdictions are privately owned. On the east coast, AGL Energy, Origin Energy and TRUenergy are the largest retailers. Each has significant market share in Victoria and South Australia. AGL Energy is the largest gas retailer in NSW and jointly owns (with the ACT Government) the largest ACT retailer.58 AGL Energy acquired significant market share via the 2006-07 privatisation process, while Origin Energy was already established as a retailer in that state.59 In WA, Alinta (owned by Babcock and Brown Power) is the leading retailer and is the only retailer licensed to retail to customers consuming less than 0.l8 terajoules per year on the main distribution systems.60 NT Gas (owned by the APA Group) supplies a small quantity of gas to commercial and industrial customers in Darwin. Table 3.4 lists the active gas retailers for the small customer market. Table 3.5: Active gas retailers for the small customer market, May 2009 Retailer1 Ownership VIC NSW QLD SA TAS2 ACT WA
ActewAGL Retail ACT Government and AGL Energy AGL Energy AGL Energy Alinta Babcock & Brown Power Aurora Energy Tasmanian Government Australian Power & Gas Australian Power & Gas Country Energy NSW Government Energy Australia NSW Government Red Energy Snowy Hydro 3 Simply Energy International Power Tas Gas Retail Babcock & Brown Infrastructure Origin Energy Origin Energy TRUenergy CLP Group Victoria Electricity Infratil Active retailers 7 6 2 4 2 2 1 Approx market size ('000 000 customers)4 1.68 1.19 0.15 0.37 0.005 0.09 0.58 Host (incumbent retailer) New Entrant Notes: 1. Not all licensed retailers are listed. Some of the retailers listed only offer gas services as part of a gas and electricity contract. The list also excludes three small retailers (BRW Power Generation (Esperance), Dalby Town Council and Roma Town Council). 2. There is no host retailer in Tasmania as gas distribution and retail services have only been available for a short time and FRC existed from the market start. 3. Snowy Hydro is owned by the New South Wales Government (58%), the Victorian Government (29%) and the Australian Government (13%). 4. Customer numbers for Queensland, New South Wales and the ACT are estimates based on the number of distribution connection points. Source: State of the Energy Market 2009 58 Ibid at 1 at 295. 59 Ibid. 60 Ibid at 1 at 296.
member firms affiliated with KPMG International, a Swiss cooperative. All rights reserved. Liability limited by a scheme approved under Professional Standards Legislation.
While all jurisdictions have introduced FRC, NSW, Victoria, SA and WA continue to regulate gas retail prices for small customers (the remaining states and territories do not). Wholesale gas costs and transportation charges account for the majority of retail gas prices.61 Retail operating costs and retail margins account for around 36% of retail prices in QLD and 22% in SA.62 Retail gas prices show significant variation for customers with different volume requirements and at different geographical locations. For small customers, distribution charges for metering and transport often represent the most significant component – up to 60% - of retail gas prices.63 However, regulatory arrangements governing the market, wholesale gas costs and industry scale also affect the retail prices. For businesses, the real price of gas has fallen by 10.6% since 1991, while for households it has increased by 28.6%.64 As shown in Figure 3.9, real household gas prices have increased since 1996 in all states except Victoria, however the pattern and rate of adjustment has varied.65 Customers in all states except QLD experienced real price increases from 2000-01 to 2008-09 of between 19.9% and 25.6%.66 Queensland prices were relatively stable from 2000-01 to 2004-05 but have since risen sharply.67 Figure 3.8: Real retail gas prices, July 1996 - March 2009 (forecasts based on 1998-99 prices)
Notes: The dashed lines are estimates based on inflating 1998-99 AGA data by the CPI series for gas and other household fuels for the capital city in that state. Source: State of the Energy Markets 2009
A high degree of vertical integration is a key feature of the Australian gas market, as gas retailers like Origin Energy and AGL increasingly look to gain exposure to all aspects of the gas supply chain – from securing gas acreage, to developing gas reserves, securing third party long term gas supply contracts, negotiating spot gas deals, building GFGs, forging LNG exporting projects and optimising gas placement opportunities between customers, GFGs and LNG projects.
61 Ibid at 1 at 304. 62 Ibid. 63 Ibid at 1 at 275. 64 Ibid at 1 at 307. 65 Ibid. 66 Ibid. 67 Ibid.
member firms affiliated with KPMG International, a Swiss cooperative. All rights reserved. Liability limited by a scheme approved under Professional Standards Legislation.
3.2 East coast
3.2.1 Suppliers The main suppliers of gas on the east coast are Origin Energy, British Gas (BG), Santos, Arrow Energy, BHP Billiton and ExxonMobil. Cooper and Gippsland dominated gas supply under long term (30 year) contracts. The market has now expanded and offers numerous sources of supply. The acceptance of CSG as a viable form of gas for commercial and retail customers and as a feedstock for GFGs and LNG trains has facilitated this step change in market structure.
The Gippsland Basin, which lies mostly offshore from the south east corner of Victoria, has great potential for bringing on-line new gas supplies for the east coast market. Production at the Longtom field started in October 2009. Kipper is currently Victoria’s largest known undeveloped gas resource, having estimated reserves of 620 Bcf.68 First gas production from the US$1.1 billion Kipper gas and condensate project is anticipated for 201169, with the field having an estimated lifespan of 15 years.70 Also in the Gippsland Basin, the Turrum field holds an estimated 1 Tcf of gas.71 The US$1.3 billion Turrum natural gas and condensate project is due for completion in 2011.72 Other fields in the Gippsland Basin expected to come online include Basker-Manta-Gummy and Sole.
Exploration at the Otway Basin (located off the south western corner of Victoria and the south east corner of South Australia) is mature onshore and immature offshore. Commercial gas discoveries include the offshore Thylacine and Geographe (combined raw gas reserves of approximately 950 Bcf)73, Minerva (301 Bcf)74 and Casino (280 Bcf)75 fields. Undeveloped gas discoveries include the La Bella (210 Bcf)76 and Henry (estimated 2P reserves of 150 PJ)77 fields. First gas production from the Henry field is expected during the first half of 2010.
Not all states have equal access to gas supplies. Unlike other mainland states, NSW does not have substantial indigenous gas production. It sources nearly all of its natural gas from interstate. NSW remains highly unexplored for natural gas compared to its neighbouring states, despite it being Australia’s largest source of gas demand. With QLD LNG plants expected to start shipping gas overseas in about 2014, some industry analysts argue it is critical that NSW act now to sure up a secure gas supply.
However, NSW has significant gas production potential. While the NSW CSG fields are yet to be proven commercial, this local supply has the potential to rapidly expand and reduce the need for
68 Department of Primary Industries, Oil and Gas Industry Activity, http://www.dpi.vic.gov.au/dpi/nrenmp.nsf/LinkView/4091419D117B5E654A2569B2002022F456D4D5E9AEF563E84A256A800011E5D6, 26 June 2009. 69 M. Lampard, ABARE, Minerals and energy: Major development projects – October 2009 listing, November 2009 at 8. 70 Ibid at 68. 71 Ibid. 72 Ibid at 60 at 8. 73 Woodside website, Otway, http://www.woodside.com.au/Our+Business/Production/Australia/Otway+Southern+Australia.htm. 74 Ibid at 68. 75 Ibid at 68. 76 Australian Government Department of Industry, Tourism and Resources, Release of Offshore Petroleum Exploration Areas Australia 2006 at 18. 77 Santos Website, Henry, http://www.santos.com/Content.aspx?p=343, 14 October 2009.
member firms affiliated with KPMG International, a Swiss cooperative. All rights reserved. Liability limited by a scheme approved under Professional Standards Legislation.
interstate gas import in the future. NSW CSG proponents cite infrastructure and state regulations as the two biggest barriers holding back commercialisation of the reserves.
The prospect of a pipeline directly linking the CSG fields of QLD, Gunnedah and the Hunter Valley to major population centres in Sydney, Newcastle and Wollongong, is already having positive effects, with Santos initialising exploration at Gunnedah based on available transport infrastructure. This Queensland Hunter Gas Pipeline is discussed in more detail in Section 3.2.3.
Santos has the largest involvement with CSG in NSW. In June 2008 its Gunnedah tenements had the potential to contain 40 Tcf of CSG, more than that controlled by the NWS Venture. It has plans to drill 18 to 20 wells over the next 18 months in pursuit of proving up a preliminary resource. Santos has also considered LNG plants in Newcastle. While port constraints are a possible hurdle to this development, NSW gas may also be exported through QLD given sufficient transport capacity.
The Gloucester Basin is physically smaller than the other prospective coal seam gas basins in NSW and QLD, and therefore is unlikely to hold enough gas to support an LNG project on its own. However, it is large enough to support power stations and industrial users in the region.
As mentioned, NSW is considered to be a tougher operating environment than QLD. Approvals that may take up to one year in QLD, may take up to three in NSW. The NSW Government did launch the Exploration NSW initiative in 2000, which provided $30m of funding over seven years to promote minerals and petroleum exploration. It has been suggested this is a small proportion of what is needed.
3.2.2 Wholesale pricing Historically, wholesale gas prices on the east coast showed some evidence of rising prices.78 QLD prices in 2006 were in the range of $2.50 to $2.90/GJ, rising to around $4/GJ in 2008.79 However, EnergyQuest reported mixed outcomes in 2008-09.80 One QLD joint venture recorded average price realisations of $3.15/GJ in June quarter 2009.81
On the east coast generally, one major producer recorded average prices of around $3.46/GJ in June quarter 2009, compared with $3.12/GJ in the equivalent period of 2008.82 CSG prices in QLD were typically lower than conventional gas, however the onset of numerous CSG-LNG developments in QLD in the next few years may see wholesale gas prices rise in the longer term.83 In the short to medium term, EnergyQuest projects that domestic prices may ease during the lengthy ramp-up of LNG export capacity.84 During this period, increased supplies of gas will be available at relatively low domestic prices for domestic purposes such as power generation.85
78 Ibid at 36 at 244. 79 Ibid at 1 at 245. 80 Ibid. 81 Ibid. 82 Ibid. 83 Ibid. 84 Ibid. 85 Ibid at 1 at 36.
member firms affiliated with KPMG International, a Swiss cooperative. All rights reserved. Liability limited by a scheme approved under Professional Standards Legislation.
The price listings of the Victorian spot market (which accounts for only 10-20% of the wholesale volumes traded in Victoria) can provide some comparisons to gas contract prices. However, the volatility that is observed in spot market prices (given prices can reach as high as the VoLL price of $800/GJ) means they are not necessarily indicative of underlying contract prices.
Until 2005, spot prices remained relatively stable (excluding the winter peaking demand profile). However, since then volatility has increased with substantially higher winter prices observed in 2006, 2007 and 2008 (spot prices peaked at $336/GJ on 17 July 2007).86 Spot price spikes which occurred in 2007 due to drought conditions, caused a shift to GFG and a corresponding increase in gas demand. Since then, however, spot prices have eased back towards trend levels.87 For June quarter 2009, Victorian spot prices averaged $2.68/GJ, down 19% on the previous year’s June quarter average.88 EnergyQuest reported that spot prices in June 2009 were below current contract prices.89 This outcome reflects a combination of factors:
• The expansion of the Victorian Transmission System via the Corio Loop development (completed in 2008) eased capacity constraints on the network, helping avoid winter price spikes.
• The easing of the drought in 2008, lead to reduced interstate demand for gas for electricity generation.
• A weaker economy and a relatively mild winter led to some easing of demand in 2009.90
3.2.3 Pipelines Gas transport in the east coast market is relatively more mature and interlinked than that of the west coast, however it services a greater demand base. There exists a significant interconnected network of transmission and distribution infrastructure, which is still progressively evolving to support the development of a competitive gas market. While cross border gas volume swaps between counterparties still remains a significant means of meeting gas demand on the east coast, significant investment has and will take place to enable greater deliveries of gas from QLD to the southern states, to pending LNG terminals near Gladstone, and to new GFGs that will potentially be built in response to the Federal Government’s climate change initiatives.
In the twelve months to October 2009, two gas pipeline projects were completed on the east coast. The Queensland to South Australia/New South Wales (QSN) Link was completed at an estimated cost of $165 million and connects the South Western Queensland Pipeline to the Moomba gas hub in north-east South Australia. Its transport capacity is 60 PJ/yr and it is a key lever in the transport of CSG produced in the Surat and Bowen Basins to be transported to the Moomba-Adelaide Pipeline (MAP), and the Moomba-Sydney Pipeline (MSP).91
Also completed in Queensland, at an estimated cost of $110 million, was the Berwyndale to Wallumbilla pipeline. Spanning 110km this pipeline connects the CSG fields around Berwyndale (located approximately 300km north-west of Brisbane) to the Wallumbilla gas hub.92
86 Ibid at 1 at 247. 87 Ibid at 36 at 245. 88 Ibid at 1 at 247. 89 Ibid. 90 Ibid. 91 A. Copeland, ABARE, Minerals and energy: Major development projects – April 2009 listing, May 2009 at 3. 92 Ibid.
member firms affiliated with KPMG International, a Swiss cooperative. All rights reserved. Liability limited by a scheme approved under Professional Standards Legislation.
There are also several natural gas pipelines at an advanced stage of development. In May 2009, Australian Pipeline Trust made the decision to proceed with the expansion of the Moomba to Sydney pipeline. The $90 million project is scheduled to be completed in 2010.93 SP AusNet is undertaking expansions to two of its pipelines: the Eastern Gas Pipeline (EGP) (which transports from Longford, Victoria to Wollongong) and the Queensland Gas Pipeline (QGP) (Wallumbilla to Gladstone). At an estimated cost of $41 million, the EGP expansion will increase capacity by 20 PJ/yr. At an estimated cost of $112 million, the QGP expansion will increase its capacity by 25 PJ/yr.94
Though still in planning phases, the Queensland Hunter Gas Pipeline (QHGP) is another key east coast infrastructure development. In April 2007, the QLD Government granted a pipeline licence for the QLD portion of the project. In February 2008, the NSW Government declared the project as critical infrastructure. In December 2008 the project was granted Federal Government approval. In February 2009, NSW approved their segment of the pipeline. The estimated capital cost of the project is $900m.95
If successful, the QHGP would be the third gas pipeline into NSW, delivering competitively priced gas from the Wallumbilla Gas hub in QLD to eastern Australia. It would initially free flow 85 PJ/year, however, with installation of compression, it could potentially increase gas flow to 160 PJ/year (NSW currently uses 200+ PJ/year).96 The importance of the QHGP lies in the fact that it could: • Provide much needed new gas pipeline capacity and reduce pressure on tariffs: the MSP and EGP
are nearing full delivery capacity, and the NSW transmission tariffs tripled in 2008 due to the capacity constraints with the MSP and EGP.
• Improve security of supply in the face of growing gas demand in NSW: by diversifying the supply sources and facilitating access to expanding gas reserves in QLD and NSW.
• Stimulate exploration and development of prospective gas reserves in northern and central NSW: including the commercialisation of the Gunnedah CSG field (estimated at 40 Tcf). The successful development of NSW CSG reserves could yield significant royalty revenue for the NSW Government.
• Facilitate the development of GFGs for base load power: NSW is in need of more generation capacity.
• Feed and facilitate potential LNG developments in the Hunter region. Table 3.5 lists the major gas transmission pipelines on the east coast, and their key physical and ownership characteristics. Table 3.6 shows the gas basins and producers that feed the major transmission pipelines. Table 3.7 shows the major gas distribution networks on the east coast, and their key physical and ownership features.
93 M. Lampard, ABARE, Minerals and energy: Major development projects – October 2009 listing, November 2009 at 9. 94 A Copeland, ABARE, Minerals and Energy: Major development projects – April 2009 listing, May 2009 at 9. 95 Queensland Hunter Gas Pipeline Website, http://www.qhgp.com.au/index.asp, accessed 18 November 2009. 96 Ibid.
member firms affiliated with KPMG International, a Swiss cooperative. All rights reserved. Liability limited by a scheme approved under Professional Standards Legislation.
Table 3.6: Major transmission pipelines on the east coast
Pipeline Location Length (km)
Year Constructed
Capacity (TJ/D)
Covered? Valuation ($ million)
Current Access
Arrangement
Owner Operator
Queensland QSN Link (Ballera to Moomba interconnect) Qld-SA
(and NSW) 180 2009 212 No 165 (2009) n/a Epic Energy (Hastings) Epic Energy
South West Queensland Pipeline (Ballera to Wallumbilla)
Qld 756 1996 168 No n/a n/a Epic Energy (Hastings) Epic Energy
Roma (Wallumbilla) to Brisbane Qld 440 1969 208 Yes 296 (2006) 2007-2011 APA Group APA Group
Queensland Gas Pipeline (Wallumbilla to Gladstone)
Qld 629 1989-1991 79 No n/a n/a Jemena (Singapore Power International (Australia))
Jemena Asset Management
Carpentaria Pipeline (Ballera to Mount Isa) Qld 840 1998 117 Yes (light regulation)
n/a n/a APA Group APA Group
Wallumbilla to Darling Downs Pipeline Qld 205 2009 400 No 90 (2009) n/a Origin Energy Origin Energy
Berwyndale to Darling Downs Pipeline Qld 113 2009 No 70 (2009) n/a AGL Energy AGL Energy North Queensland Gas Pipeline Qld 391 2004 108 No 160 (2005) n/a Victorian Funds Management
Corporation AGL Energy, Arrow
Energy Dawson Valley Pipeline Qld 47 1996 30 Yes 8 (2007) 2007/2016 Anglo Coal (51%), Mitsui (49%) Anglo Coal New South Wales Moomba to Sydney Pipeline SA-NSW 2029 1974-1993 420 Partial 835 (2003) 2004-2009 APA Group APA Group
Eastern Gas Pipeline (Longford to Sydney) Vic-NSW 795 2000 250 No 450 (2000) n/a Jemena (Singapore Power International (Australia))
Jemena Asset Management
Central West (Marsden to Dubbo) Pipeline NSW 255 1998 10 Yes 28 (1999) 2000-2010 APA Group APA Group Central Ranges (Dubbo to Tamworth) Pipeline
NSW 300 2006 7 Yes 53 (2003) 2005-2019 APA Group Country Energy (NSW Govt)
Victoria Victorian Transmission System (GasNet) Vic 2035 1969-2008 1030 Yes 524 (2007) 2008-2012 APA Group APA Group/AEMO South Gippsland Natural Gas Pipeline Vic 250 2006-2010 No 50 (2007) n/a Multinet Gas Jemena Asset Management
VicHub Vic n/a 2003 150 (into Vic)
No n/a n/a Jemena (Singapore Power International (Australia))
Jemena Asset Management
South Australia SEA Gas Pipeline (Port Campbell to Adelaide)
Vic-SA 680 2003 314 No 500 (2003) n/a International Power, APA Group, and REST (equal shares)
APA Group
Moomba to Adelaide Pipeline SA 1185 1969 253 No 370 (2001) n/a Epic Energy (Hastings) Epic Energy
member firms affiliated with KPMG International, a Swiss cooperative. All rights reserved. Liability limited by a scheme approved under Professional Standards Legislation.
Tasmania Tasmanian Gas Pipeline (Longford to Hobart) Vic-Tas 734 2002 129 No 440 (2005) n/a Babcock & Brown Infrastructure Jemena Asset Management
REST, Retail Employees Superannuation Trust Notes: 1. Covered pipelines are subject to regulatory arrangements under the National Gas Law. The Australian Energy Regulator (AER) covered pipelines outside Western Australia, where the Economic Regulation Authority is the transmission regulator. 2. For covered pipelines subject to full regulations, valuation refers to the opening capital base for the current regulatory period. For the Moomba to Sydney Pipeline, the Australian Competition Tribunal determined the valuation. For non-covered pipelines, listed valuations are estimated construction costs, subject to availability of data. 3. Coverage of the Moomba to Sydney Pipeline was partly revoked in 2003. The revoked portion runs from Moomba to the offtake point of the Central West Pipeline at Marsden. The covered portion became a light regulation pipeline in 2008 Source: State of the Energy Market 2009
member firms affiliated with KPMG International, a Swiss cooperative. All rights reserved. Liability limited by a scheme approved under Professional Standards Legislation.
Table 3.7: Pipeline links between major gas sources and markets on the east coast Pipeline Gas Basin Producers Brisbane Roma to Brisbane pipeline Surat-Bowen Mosaic, Origin Energy, Santos, Arrow Energy,
Mitsui, Molopo, BG Group Sydney and Canberra
Moomba to Sydney Pipeline (MSP) Cooper, Sydney Santos, Beach Petroleum, Origin Energy, AGL Energy, Sydney Gas
Adelaide Moomba to Adelaide Pipeline (MAP) Cooper Santos, Beach Petroleum, Origin Energy SEA Gas Pipeline Otway and Gippsland BHPB, ExxonMobil, Origin Energy, Santos
AWE, Beach Petroleum South West Queensland Pipeline / QSN Link
Darwin Amadeus Basin to Darwin Amadeus Magellan, Santos Bonaparte Pipeline Bonaparte ENI Tasmania Tasmanian Gas Pipeline Cooper (via MSP and NSW-Vic
Interconnect), Gippsland, Otway, Bass
Santos, Beach Petroleum, Origin Energy
Note: In some cases, it may only be possible to source gas from a particular basin using backhaul and swap arrangements. Source: State of the Energy Market 2009
member firms affiliated with KPMG International, a Swiss cooperative. All rights reserved. Liability limited by a scheme approved under Professional Standards Legislation.
Table 3.8: Natural gas distribution networks on the east coast
Distribution Network Location Length of Mains
(km)
Opening Capital Base (2008, $m)1
Investment - Current Regulatory Period
($m 2008)2
Current Regulatory
Period
Owner
New South Wales and ACT Jemena Gas Networks (NSW) Sydney, Newcastle/Central Coast and
Wollongong 23800 2300 542 1 July 2005 - 30
June 2010 Jemena (Singapore Power
International) Central Ranges System Tamworth 180 n/a n/a 2006-2019 APA Group Wagga Wagga distribution Wagga Wagga and surrounding areas 622 49 8 1 July 2005 - 30
June 2010 Country Energy (NSW Govt)
ActewAGL ACT, Palerang (Bungendore) and Queanbeyan
3604 266 66 1 July 2004 - 30 June 2010
ACTEW Corporation (ACT Govt) 50%; Jemena (Singapore Power International (Australia)) 50%
Victoria Multinet Melbourne's eastern and south-
eastern suburbs 9585 888 232 1 Jan 2008 - 31 Dec
2012 DUET Group 79.9%; BBI 20.1%
Envestra (Stratus) Melbourne, north-east and central Victoria, and Albury-Wadonga
region
9603 859 411 1 Jan 2008 - 31 Dec 2012
Envestra (Cheung Kong Infrastructure 18.5%, APA Group 30.6%)
SP Ausnet (Westar) Western Victoria 9284 955 342 1 Jan 2008 - 31 Dec 2012
SP AusNet (listed company: Singapore Power International 51%)
Queensland APT Allgas South of the Brisbane River 2605 362 141 1 July 2006 - 30
June 2011 APA Group
Envestra Brisbane, Gladstone and Rockhampton
2489 261 104 1 July 2006 - 30 June 2011
Envestra (Cheung Kong Infrastructure 18.5%, APA Group 30.6%)
South Australia Envestra Adelaide and surrounds 7477 942 213 1 July 2006 - 30
June 2011 Envestra (Cheung Kong Infrastructure
18.5%, APA Group 30.6%) Tasmania Tasmanian Gas Network Hobart, Launceston and other towns 730 1121 n/a Not regulated Tas Gas (BBI) Notes: 1. For Tasmania, the asset value is an estimated construction cost. For other networks, the asset value is the opening regulated asset base for the current regulatory period, adjusted to June 2008 dollars. 2. Investment data are forecasts for the current asset arrangement period, adjusted to June 2008 dollars. 3. National totals exclude the Northern Territory Source: State of the Energy Market 2009.
member firms affiliated with KPMG International, a Swiss cooperative. All rights reserved. Liability limited by a scheme approved under Professional Standards Legislation.
3.2.4 Gas storage Gas storage facilities are limited on the east, however a large volume of storage is provided in the form of linepack (capacity within the gas pipelines). It is anticipated that more storage facilities will be built as demand for gas (especially for GFG) is forecast to increase.
There are two gas storage facilities in Victoria: the Iona Gas Plant and the Dandenong LNG storage facility. The Iona Gas storage facility is owned by TRUenergy and located near Port Campbell in southwest Victoria.97 The Iona facility is located in a depleted gas field originally used to supply the Western System, adjacent to the Otway Gas Plant currently under construction.98 This facility is connected to the VTS via the South West Pipeline to Melbourne.99 It is also connected to the SEA Gas Pipeline to provide flow to Adelaide.100
The Dandenong LNG storage facility is owned and operated by APA Group.101 It has a fully contracted capacity of around 0.7 PJ and provides peak shaving and security of supply services for the VTS.102 This facility injects gas into the VTS to meet peak winter demands as well as providing a truck loading service station for LNG tankers. The facility is not subject to regulation under the National Gas Code, and APA Group has no plans to change this situation at present.
3.2.5 Gas-fired generation GFG on the east coast has seen great growth in recent years, a result of the anticipation of a price on carbon (which heightens the attractiveness of gas as a fuel source over coal), and for its means as a channel for excess ramp-up gas from the CSG fields of QLD. Following the expected privatisation of NSW’s electricity generation assets, new GFG plants are expected, given NSW is forecast to be short baseload capacity in the near future. Gas is the most likely fuel choice, assuming the development of NSW’s CSG fields and adequate gas and electricity transmission capacity is in place.
In the six months to April 2009, ten electricity generation projects were completed, six of which were GFGs.103 Two of these were in NSW. With a 640MW capacity, the Uranquinty power station (located near Wagga Wagga in south-west NSW) is the largest of the six. The project had a capital expenditure bill of $700m. Stage 1 of the 400 MW Tallawarra power station (located around 100km south of Sydney) was completed. Origin Energy also completed the 120 MW expansion of its Quarantine power station, which is located in South Australia.104 In the six months to October 2009, no generation projects were completed.
97 TRUenergy Website, Iona Gas Plant, http://www.truenergy.com.au/Production/Iona/index.xhtml, last accessed 17 November 2009. 98 Ibid. 99 Ibid. 100 Ibid. 101 APA Group Website, Victoria, http://www.apa.com.au/our-business/gas-transmission-and-distribution/victoria.aspx, last accessed 17 November 2009. 102 Ibid. 103 A. Copeland, ABARE, Electricity Generation, Major development projects – April 2009 listing, May 2009 at 5. 104 Ibid.
member firms affiliated with KPMG International, a Swiss cooperative. All rights reserved. Liability limited by a scheme approved under Professional Standards Legislation.
There are also a number of advanced GFG projects on the east coast. Origin Energy has commenced construction on Stage 1 of the 550 MW Mortlake power station in Victoria. With a capital expenditure of $640m, it is scheduled for completion in 2010. Origin may also build a second 450MW unit at the complex at some future date.105
Origin Energy also has the Darling Downs project in Queensland, which has a capacity of 630MW, delivered at a capital cost of $951m. The project includes the construction of a pipeline to access CSG reserves in the area surrounding Roma and Chinchilla. It is scheduled to be completed in early 2010.106
Table 3.8 shows the existing and committed gas-fired power stations in each state belonging to the east coast market. Figure 3.10 shows registered generation capacity by state by fuel source.
105 A. Copeland, ABARE, Electricity Generation, Major development projects – April 2009 listing, May 2009 at 5. 106 Ibid.
member firms affiliated with KPMG International, a Swiss cooperative. All rights reserved. Liability limited by a scheme approved under Professional Standards Legislation.
Table 3.9: Existing and committed gas-fired power stations in the east coast market
Station Type Configuration Registered capacity (MW)
New South Wales Colongra OCGT OCGT (4x166 MW) 664 Smithfield CCGT/Cogen OCGT (3x38 MW), Steam turbine (1x62 MW) 160 Tallawarra CCGT OCGT (1x260 MW), Steam turbine (1x160 MW) 435 Uranquinty OCGT OCGT (4x166 MW) 664 Queensland Barcaldine CCGT OCGT (1x37 MW), Steam turbine (1x18 MW) 55 Braemar OCGT OCGT (3x168 MW) 504 Braemar 2 OCGT OCGT (3x168 MW) 504 Condamine A CCGT OCGT (2x45 MW), Steam turbine (1x45 MW) 135 Darling Downs CCGT OCGT (3x120 MW), Steam turbine (1x270 MW) 630 Oakey OCGT OCGT (2x141 MW) 282 Roma GT OCGT OCGT (2x40 MW) 80 Swanbank E CCGT CCGT (1x385 MW) 385 Townsville CCGT OCGT (1x165 MW), Steam turbine (1x82 MW) 242 Yarwun Cogen OCGT (configuration as yet unknown) 160 South Australia Dry Creek GT OCGT OCGT (3x52 MW) 156 Ladbroke Grove OCGT OCGT (2x40 MW) 80 Mintaro GT OCGT OCGT (1x90 MW) 90 Osborne Cogen/CCGT OCGT (1x118 MW), Steam turbine (1x62 MW) 180 Pelican Point CCGT OCGT (2x160 MW), Steam turbine (1x158 MW) 478 Quarantine OCGT OCGT (4x24 MW; 1x120 MW) 216 Torrens Island A Steam turbine Steam turbine (4x120 MW) 480 Torrens Island B Steam turbine Steam turbine (4x200 MW) 800 Tasmania Bell Bay Steam turbine Steam turbine (2x120 MW) 240 Bell Bay Three OCGT OCGT (3x35 MW) 105 Tamar Valley OCGT OCGT OCGT (1x75 MW) 75 Tamar Valley OCGT OCGT (3x40 MW), Steam turbine (1x80 MW) 200 Victoria Bairnsdale OCGT OCGT (2x47 MW) 94 Jeeralang A OCGT OCGT (4x51 MW) 204 Jeeralang B OCGT OCGT (3x76 MW) 228 Laverton North OCGT OCGT (2x156 MW) 312 Mortlake OCGT OCGT (2x275 MW) 550 Newport Steam turbine Steam turbine (1x500 MW) 500 Somerton OCGT OCGT (4x40 MW) 160 Valley Power OCGT OCGT (6x50 MW) 300 Advanced proposals (both in VIC) Mortlake 2 CCGT Unknown 400 Spring Gully CCGT Unknown 1000
Source: ACIL Tasman, Fuel resource, new entry and generation costs in the NEM, 2009
member firms affiliated with KPMG International, a Swiss cooperative. All rights reserved. Liability limited by a scheme approved under Professional Standards Legislation.
Figure 3.9: Registered generation capacity by region by fuel source, 2009
Note: New South Wales and Victoria include Snowy Hydro capacity allocated to those regions. Source: State of the Energy Market 2009.
3.2.6 Retailers Retail prices on the east coast are largely dependent on the consumption and customer composition characteristics of the host states. For example, Victoria has a relatively large residential consumer base with consumers located in close proximity to gas supply fields. Queensland prices reflect a small residential customer base and low rates of residential consumption because of the state’s warm climate.
Some jurisdictions have experienced rising gas wholesale and transportation costs, especially since 2007. This includes NSW, whose regulator (IPART), in 2008, approved special retail tariff increases between 5.24% and 12.2% for the host retailers AGL Energy, ActewAGL Retail and Country Energy in response to the rising component costs.107 Specifically:
• AGL Energy and ActewAGL Retail could not secure the required transmission capacity on the EGP to cater for peak winter gas demand, and incurred extra costs in having to source gas from the Cooper Basin via the MSP. There were also significant alterations to the contractual arrangements for the transport of gas via the MSP.108
• Country Energy incurred additional costs in sourcing alternative gas supply arrangements, following compression issues in the Victorian transmission network during winter 2007.109
Similarly, the South Australian regulator (ESCOSA) attributed the 8.25% increase in retail prices in 2008-09 to an increase in wholesale gas supply costs. An increase in the retail margin was a contributor.110 Retail operating costs and retail margins account for around 22% of retail prices in SA.111
Queensland has seen recent significant gas retail price increases, as retailers and distributors have restructured tariffs post the introduction of FRC and the simultaneous deregulation of retail pricing.
107 Ibid at 36 at 308. 108 Ibid. 109 Ibid. 110 Ibid. 111 Ibid at 1 at 304.
member firms affiliated with KPMG International, a Swiss cooperative. All rights reserved. Liability limited by a scheme approved under Professional Standards Legislation.
However, many prices are still not cost-reflective. This has led to lower profit margins for retailers, which has become a major impediment to increased competition in the Queensland gas market. While there are a number of retailers licensed to retail gas in Queensland, only two are currently active in the market (Origin Energy and AGL Energy). The lack of activity by new retailers suggests that the current level of profitability in insufficient to attract new entrants.112 Retail operating costs and retail margins account for around 36% of retail prices in Queensland.113
3.3 West coast The WA gas market is unique in that five major customers – Alcoa, Alinta, BHP Billiton, Burrup Fertilisers and Verve Energy – account for approximately 90% of the State’s gas consumption.114 Residential usage accounts for just 4% of the WA gas market.115
The Western Australian Government introduced market reforms to the WA gas retail market in May 2004. Included in the reform was the introduction of FRC and several new customer protection mechanisms. The retail market administrator is the Retail Energy Market Company Limited (REMCo). Responsibility for regulatory oversight of the REMCo market scheme rests with the Economic Regulation Authority (ERA).
WA has been affected by a tight demand and supply balance since 2006, stemming from 20 years of subsidised gas which made it uneconomic for companies to develop new domestic gas sources, and driven by strong domestic demand and rising LNG export prices.116 In the short term, the overall level of energy security in WA is lower than the national level, reflecting current affordability and availability issues in the domestic gas sector.117 However, energy security over the mid to long term is expected to improve given plans for additional domestic gas supply and the depressive effect of the GFC on demand growth. The following section outlines the current supply situation and proposed new supply sources.
3.3.1 Suppliers The west coast has extensive gas reserves that support a large export market and a strong domestic market. The NWS Venture is the dominant seller, though it has competition from smaller gas reserves, which are mainly concentrated in the Carnarvon and Perth Basins. Gas reserves offshore from WA are not all equally accessible, especially for servicing the domestic market. Many are offshore in deep waters, making their development costly given the size of the reserves, and their commercialisation more applicable to floating or remote island LNG processing facilities, potentially precluding domestic sales.
112 Queensland Competition Authority, Review of Small Customer Gas Pricing and Competition in Queensland, November 2008. 113 Ibid at 1 at 304. 114 Government of Western Australia, Office of Energy, Gas Supply and Emergency Management Review: Public Consultation Package, 2009 at 3. 115 APPEA, Submission to The Gas Supply Emergency Management Review Committee: Gas Supply Security in Western Australia, May 2009 at 5. 116 Ibid at 1 at 240. 117 Gas Supply and Emergency Management Committee, Report to Government, September 2009 at 16.
member firms affiliated with KPMG International, a Swiss cooperative. All rights reserved. Liability limited by a scheme approved under Professional Standards Legislation.
After the NWS Venture, the John Brookes field currently contributes the most gas to the domestic market. Both Santos and Apache sell John Brookes gas. There are three other current producing fields: Beharra Springs, Dongara and Harriet (Griffin ceased operation in October 2009). However, these three fields have very limited undeveloped reserves that are not committed.
New supply sources are anticipated, with the Reindeer (Apache (operator) and Santos) and Macedon (BHP Billiton (operator) and Apache) fields expected to come online 2011 and 2012/13 respectively. The Devil Creek Development Project (DCDP), which began construction in September 2009, will use Reindeer gas to supply up to 220 TJ/d into the domestic gas market, while Macedon is marked to provide around 200 TJ/d. Engineering for the proposed Wheatstone LNG project also includes a domestic gas plant with a supply capacity of 150 TJ/d.
In the six months to October 2009, the Gorgon LNG project was added to the ABARE’s list of advanced major energy developments. With an estimated capital expenditure of $43 billion, the Gorgon LNG project is the largest minerals and energy project to be undertaken in Australia.118 The 15 Mtpa project received final investment decision in September 2009 and is scheduled for completion by 2015.119 The Gorgon LNG project includes a domestic gas plant with a capacity of up to 300 TJ/d, and marketing is underway for the supply of 150TJ/d into the WA market from 2015.
Also in advanced stages, is Woodside’s Pluto LNG project, which has an announced capital cost of $12 billion. This project will have an annual production capacity of 4.3 Mtpa of LNG and is scheduled for completion in late 2010.120 In December 2008, the NWS Venture approved the $US1.5 billion NWS CWLH project, which will facilitate continued production from the Cossack, Wanea, Lambert and Hermes fields beyond 2013.121 The NWS Venture is also undertaking the US$5.1 billion North Rankin B project (a second platform), which is due for completion in 2012.122
While the WA market is tight domestic gas supply in the short term, the long term position is more favourable. The development of additional domestic gas supply options could also be expedited by the Federal Government’s current review of its stance on retention leases, whereby it is considering a new ‘use it or lose it’ approach to discourage the warehousing of gas reserves at the expense of their commercialisation.
However, the December 2009 decision by the Western Australian Department for Mines and Petroleum (DMP) to grant renewal of seven Browse retention leases with conditions, and to refuse the renewal of the Dixon retention lease (WA-9-R) in the North West Shelf Project Area, indicates that current legislation can also accommodate hastened efforts to commercialise gas reserves. The renewal conditions stipulate that the Browse JV partners will lose their retention leases if they don’t choose where to process the gas (Kimberley LNG precinct or otherwise) within 120 days.123 The partners must also spend A$1.25 billion on work towards making a final investment decision on an LNG development by 2012.124 The Dixon decision means that, from the date of refusal, the NWS Venture has 12 months to apply for a production license and an additional five years to commence 118 M. Lampard, ABARE, Minerals and energy: Major development projects – October 2009 listing, November 2009 at 7. 119 Ibid. 120 Ibid at 118 at 8. 121 Ibid. 122 Ibid. 123 The Australian, Browse Gas Partners Agree On Leases, http://www.theaustralian.com.au/business/browse-gas-partners-agree-on-leases/story-e6frg8zx-1225813660310, 26 December 2009. 124 Ibid.
member firms affiliated with KPMG International, a Swiss cooperative. All rights reserved. Liability limited by a scheme approved under Professional Standards Legislation.
petroleum recovery operations, consistent with the Offshore Petroleum and Greenhouse Gas Storage Act 2006.125
State royalties for gas from ‘tight’ gas reserves are also set to reduce, to encourage the commercialisation of such fields. Reform of state royalties and retention leases as interventionist strategies to encourage gas reserve commercialisation will be discussed in more detail in Section 9.
Worth noting is the impact of the GFC on WA’s current gas supply. While the short term gas supply outlook remains tight, the immediate supply position (to the first quarter of 2010) has eased. According to industry feedback, instances of distressed sellers (of both gas and pipeline capacity), as well as buyers who are either banking gas or requesting contractual relief (for both gas and pipeline capacity) had been observed in the market in the second half of 2009, in response to customer gas demand reductions in the wake of decreased industry production levels due to the GFC.
3.3.2 Wholesale pricing WA’s wholesale gas pricing history shows that it experienced low domestic gas prices for two decades, as a consequence of competition between the NWSV and smaller producers dedicated to the domestic market.126 More recently, however, domestic prices have escalated, driven by supply and demand imbalances. As an indication, in July 2007 Santos was reported to have received more than $7/GJ in two separate contracts with mining companies, which represents an almost three-fold increase on the $2.50/GJ wholesale gas prices that prevailed until 2006.127 In July 2008, following the Varanus Island incident, short term gas contracts averaged almost $17/GJ.128
Several factors have attributed to the price rise:
• Historically low domestic prices created little incentive to explore for new domestic gas supply.
• WA’s resources boom sparked high demand for gas contracts, at a time when most developed reserves are fully contracted. It also pushed up input prices generally.129
• Gas field development costs have significantly increased, for both LNG and domestic gas. This is partly because new fields tend to be located in deeper water and are more expensive to develop.130
• Most recently discovered offshore fields are large enough to have LNG potential. WA has a relative shortage of gas fields that are unsuitable for LNG, which makes domestic gas users relatively dependent on LNG projects.131
• Much of WA’s domestic market relies on a single transmission pipeline – the Dampier to Bunbury Natural Gas Pipeline – which currently operates at a gas quality specification that is
125 Energy Business Review, Western Australia To Grant Seven Browse Retention Lease Renewals, http://oilgasexploration.energy-business-review.com/news/western_australia_to_grant_seven_browse_retention_lease_renewals_091202/, 2 December 2009. 126 Ibid at 36 at 244. 127 Ibid at 1 at 244. 128 Ibid. 129 Ibid at 1 at 30. 130 Ibid at 1 at 30. 131 Ibid.
member firms affiliated with KPMG International, a Swiss cooperative. All rights reserved. Liability limited by a scheme approved under Professional Standards Legislation.
narrower than the national standard and so limits gas supply options (particularly supply from the Macedon field). However, new legislation passed on 18 November 2009, will see the broadening of the gas quality specifications from 1 January 2012. This is discussed in more detail in Section 3.3.3.
• Strong global demand significantly raised international energy prices, making LNG exports an attractive alternative to domestic sales.132
• WA’s LNG export capacity created an exposure in the domestic market to international energy prices. Average LNG prices received by Australian producers rose by 48% between the June quarters of 2007 and 2008.133
However, while significant price escalation has/is occurring in the short term (and low volume) contract market, the long term (and high volume) contract market is different in that prices are determined by the extent of new supply from new gas projects, and firm demand from new, long term mining and minerals processing projects. It is also important to note that price rises occurring where demand is greater than supply may be a trigger for the development of more supply.
3.3.3 Pipelines WA’s domestic gas market is supported by several transmission pipelines linking reserves to market centres. However, the critical lines are the Dampier to Bunbury Natural Gas Pipeline (DBNGP) and the Goldfields Pipeline. Domestic gas from the NWSV (which provides 65% of the state’s gas consumption) is processed at the Karratha Gas Plant and delivered to customers in southern WA via the 1600km DBNGP and in Port Hedland via the Pilbara Energy Pipeline. John Brookes gas is processed onshore at Apache Energy’s processing facilities on Varanus Island, before feeding both the DBNGP and the Goldfields Pipeline (1380km).
The state’s heavy reliance on these two pipelines leaves it vulnerable to gas supply constraints, should a system security issue on one or both occur. Such fragility was evidenced following the explosion at Apache Energy’s gas processing facilities at Varanus Island on 3 June 2008. The sudden loss of 35% of the state’s gas supply was partially mitigated by demand side management (temporarily returning to service two units of the Muja AB coal fired power station to spare gas from use in GFGs), increasing gas supply from the NWS Venture and using alternative (though more expensive) fuel sources (diesel) for power generation. However, the crisis lasted three months, and saw mining and manufacturing companies affected.
This event has triggered the formation of the Gas Supply and Emergency Management Committee (GSEMC). The Committee, established by the WA Government, reviewed and provided advice to the Government on the State’s gas security, gas supply disruption management and mitigation options for gas supply disruptions.134 Among its recommendations were:
132 Ibid at 1 at 30. 133 Ibid at 36 at 244. 134 Gas Supply and Emergency Management Committee, Report to Government, September 2009 at 4.
member firms affiliated with KPMG International, a Swiss cooperative. All rights reserved. Liability limited by a scheme approved under Professional Standards Legislation.
• Providing incentive for electricity generators to install or retrofit dual-fuel generation capacity and maintain an adequate strategic stock of diesel to meet abnormal fuel requirements associated with a gas supply disruption.135
• Requiring gas retailers to have adequate back-up supply arrangements to ensure continuity of supply for small use customers on standard contracts, with standard tariffs, and offer such back-up arrangements as an opt-in service for other gas distribution system customers.136
• Dual fuelling of the Cockburn and Kwinana high efficiency combined cycle gas turbines as a contingency service in the electricity market.137
• Potentially building a gas storage facility in close proximity to Perth (capable of withdrawal rates of between 35 TJ/day and 100 TJ/day), with an additional interconnection of the Parmelia pipeline with the DBNGP to allow stored gas to flow into these pipelines and WA Gas Network’s distribution system.138
Complementary to the recommendations of the GSEMC was the motion was for the broadening of WA’s pipeline gas specification. In WA, different gas quality specifications exist on different pipelines across the state. The most restrictive quality specification applies to the main pipeline in the state: the DBNGP. Furthermore, the Western Australian Gas Regulations are significantly more restrictive than the Australian Standard.139
On 18 November 2008, new legislation – The Gas Supply (Gas Quality Specifications) Bill 2009 – was passed by the WA Government. The Bill allows additional sources of gas to feed the domestic market. Under the new Bill, gas producers that supply at the broader specification will compensate pipeline owners and large consumers for increased costs to their operations. This will be achieved via commercial negotiations. The Bill also prohibits the use of some pre-1980 gas appliances that could have safety issues. This will require suppliers providing gas at the broader specification to pay a levy to fund replacement or service of these appliances (at an estimated $35 million cost).140 The broader gas specification and appliance prohibition will take effect from January 1, 2012.141
While broadening the pipeline gas specification will encourage the development of gas fields, such as BHP Billiton’s Macedon, APPEA has expressed concerns that care must be taken to ensure that transmission infrastructure owners are prohibited from capitalising on any change to gas specifications, by way of increasing tariffs on the basis of lower energy capacity in the pipelines. Given changes to pipeline specifications have been planned for a sizeable period of time, APPEA’s view is that the valuations on infrastructure were appropriately discounted at the time of original acquisition to account for costs incurred as part of the broadening of the quality specifications.142
135 Gas Supply and Emergency Management Committee, Report to Government, September 2009 at 5. 136 Ibid. 137 Ibid. 138 Ibid. 139 APPEA, Broadening the Gas Specifications on Pipelines in Western Australia Issues Paper by Office of Energy: APPEA Comments, November 2008 at 2. 140 Government of Western Australia Ministerial Media Statements, State Government opens door to greater domestic gas supplies, http://www.mediastatements.wa.gov.au/Pages/Results.aspx?ItemID=131104, last updated 25 March 2008. 141 Ibid. 142 Ibid at 139 at 3.
member firms affiliated with KPMG International, a Swiss cooperative. All rights reserved. Liability limited by a scheme approved under Professional Standards Legislation.
Whilst not addressing the issue of over reliance on this pipeline, the Dampier Bunbury Pipeline owners (DBNGP) announced in March 2009 their commitment to the $700 million construction of the Stage 5B expansion. This project is forecast for completion in 2010 and will enable the pipeline to deliver an additional 40 PJ/year.
There is the view that the development of new export LNG projects will greatly assist in bringing on additional sources of gas for the domestic market, given sufficient investment in infrastructure. Finally, there have been calls for improvements in the infrastructure approvals process, including Commonwealth assistance with project approvals and contract negotiations involving foreign counterparties.
Table 3.9 lists the major gas transmission pipelines and their key physical and ownership characteristics. Table 3.10 shows the gas basins and producers that feed the major transmission pipelines. Table 3.11 shows the major gas distribution networks on the west coast, and their key physical and ownership features.
member firms affiliated with KPMG International, a Swiss cooperative. All rights reserved. Liability limited by a scheme approved under Professional Standards Legislation.
Table 3.10: Major gas transmission pipelines on the west coast Pipeline Location Length
(km) Year
Constructed Capacity
(TJ/d) Covered? Valuation
($m) Current Access Arrangement
Owner Operator
Dampier to Bunbury Pipeline WA 1854 1984 785 Yes 1618 (2004)
2005-2010 DUET Group (60%), Alcoa (20%), Babcock & Brown Infrastructure
(BBI) (20%)
WestNet Energy (owned by BBI)
Goldfields Gas Pipeline WA 1427 1996 150 Yes 514 (1999) 2000-2009 APA Group (88.2%), Babcock & Brown Power (11.8%)
APA Group
Parmelia Pipeline WA 445 1971 70 No n/a n/a APA Group APA Group Telfer Pipeline (Port Hedland to Telfer)
WA 443 2004 25 No 114 (2004) n/a Energy Infrastructure Investments (APA Group 20%, Marubeni 50%,
Osaka Gas 30%)
APA Group
Midwest Pipeline WA 353 1999 20 No n/a n/a APA Group (50%), Horizon Power (WA Govt) (50%)
APA Group
Kambalda to Esperance Pipeline
WA 350 2004 6 No 45 (2004) n/a ANZ Infrastructure Services WorleyParsons Asset Management
Pilbara Energy Pipeline WA 219 1995 188 No n/a n/a Epic Energy (Hastings) Epic Energy Kalgoorlie to Kambalda Pipeline
member firms affiliated with KPMG International, a Swiss cooperative. All rights reserved. Liability limited by a scheme approved under Professional Standards Legislation.
Table 3.11: Pipeline links between major gas sources and markets on the west coast
Source: State of the Energy Market 2009.
Table 3.12: Natural gas distribution networks on the west coast
Distribution Network Location Length of Mains (km)
Asset Base ($m 2007)
Investment - Current Regulatory Period
($m 2007)
Current Regulatory Period
Owner
WA Gas Networks Mid-west and south-west regions
12176 749 163 1 Jan 2005 - 31 Dec 2009
BBI 74.1%, DUET Group 25.9%. Operated by WestNet Energy (owned by BBI)
BBI, Babcock & Brown Infrastructure. Notes: 1. The opening capital base is the initial capital base, adjusted for additions and deletions, as reset at the beginning of the current access arrangement period. All data are converted to June 2008 dollars. 2. Investment data are forecasts for the current asset arrangement period, adjusted to June 2008 dollars. Source: State of the Energy Market 2009.
Pipeline Gas Basin Producers Dampier to Bunbury Natural Gas Pipeline (DBNGP) Carnarvon Apache Energy, BHPB, BP, Chevron, ExxonMobil, Inpex, Kufpec, Santos, Shell, Tap Oil, Woodside Petroleum Perth ARC Energy, Origin Energy
member firms affiliated with KPMG International, a Swiss cooperative. All rights reserved. Liability limited by a scheme approved under Professional Standards Legislation.
3.3.4 Gas storage Presently, there is only one commercial gas storage facility in Western Australia. This is a small underground gas storage facility owned and operated by APA, located in the depleted Mondarra gas reservoir in the Perth near Dongara.143 This storage facility is adjacent to the two pipelines which service Perth and south-west Western Australia.144 It has a capacity of around 15 TJ/d, however, in response to the increase in gas demand, APA is looking to increase this to around 35 TJ/d in 2010.145
In 2004, BHPB purchased the Tubridgi facility close to Onslow, potentially intending to use it as a gas storage facility for their nearby fields.146 This facility has not been developed to date.
3.3.5 Gas-fired generation WA is highly dependent on gas for its electricity generation - around 60% of installed generation capacity is fuelled by natural gas (35% by coal).147 Investment in new GFG capacity has been coming on line and in October 2008, NewGen Kwinana was commissioned. The $400m, 320MW combined cycle gas-fired power plant was completed by Babcock & Brown Power (BBP) and ERM. BBP subsequently sold its stake to ERM. It has the capacity to supply 10% of the state’s energy needs.
Close to completion is the 320 MW Neerabup power station, which is due this year. The project is owned by ANZ Infrastructure Services and ERM. It has a capital cost of $425m and is located 50km north of Perth.148 In addition, the WA Government has also committed to investing $263.4m to construct two 100 MW high efficiency gas turbines in Kwinana to enhance the reliability of electricity supply within WA’s South West Interconnected System electricity supply region. It is to be commissioned in 2011-12.
3.3.6 Retailers As discussed in Section 3.3.2, wholesale gas prices in WA rose sharply in 2007, to levels up to three times that observed earlier in the decade. This has lead to concerns from the Office of Energy that the increases could act as a barrier to entry in the gas retail market, and that they could affect future retail margins – especially for new entrant retailers that would need to secure wholesale gas supplies.149
Accordingly, in 2008 the Office of Energy reviewed the level and structure of gas tariffs and in June 2008 made an interim recommendation to increase regulated tariffs by between 5.4% and 16.5%
143 APA Group Website, Western Australia, http://www.apa.com.au/our-business/gas-transmission-and-distribution/western-australia.aspx, last accessed 17 November 2009. 144 Ibid. 145 Gas Supply and Emergency Management Committee, Options to Avoid or Minimise Gas Supply Disruptions and to Mitigate their Effects – Summary Report, 20 August 2009 at 12. 146 The Allen Consulting Group, Gorgon Gas project Joint Venture Application for Authorisation of Joint Marketing – Report to the Australian Competition and Consumer Commission, July 2009 at 20. 147 Ibid at 1 at 112. 148 A. Copeland, ABARE, Electricity Generation, Major development projects – April 2009 listing, May 2009 at 7. 149 Ibid at 36 at 308.
member firms affiliated with KPMG International, a Swiss cooperative. All rights reserved. Liability limited by a scheme approved under Professional Standards Legislation.
(depending on the customers’ geographic location and level of gas consumption).150 This recommendation was accepted by the WA Government and took effect on 1 July 2008.
In June 2009, the Office of Energy conducted another interim review and recommended another adjustment to tariffs over and above the 2008 increases, in order to move the tariff caps to cost-reflective levels, citing cost increases mainly due to significant gas commodity price increases.151 The tariff increase also includes an allowance for partial recovery of the additional costs incurred by Alinta in association with the Varanus Island explosion. For the median customer the tariff cap increases are about 18% to 21% on top of what would have occurred under the CPI based increase (excluding Mid-West/South-West small business customers).152 This recommendation was also accepted by the WA Government and took effect on 1 July 2009.
Table 3.12 shows the structure of the license areas, network operators, retailers and the retail market administrators operating in the WA gas retail market. It exemplifies that despite the introduction of gas FRC, the level of competition is the WA gas market is still limited.
Table 3.13: WA's retail gas market structure
RetailersLicence Area Network Operator
Small Customers Large Customers
Retail Market Administrator
Alinta Sales Alinta Sales South Western Coastal Area WA Gas Networks
Synergy (>0.18TJ/a) Synergy
REMCo
Kalgoorlie-Boulder WA Gas Networks Alinta Sales Alinta Sales REMCo
Albany WA Gas Networks Alinta Sales Alinta Sales REMCo
Margaret River Wesfarmers Kleenheat Wesfarmers Kleenheat Wesfarmers Kleenheat None
Rottnest Island Rottnest Island Rottnest Island Rottnest Island None
Source: Office of Energy, Government of Western Australia, http://www.energy.wa.gov.au/2/3178/64/competitive_gas.pm
3.4 Northern Territory The Northern Territory has a small domestic market that has seen limited growth in demand. The demand comes from the electricity sector.153 It is supplied by two operating gas fields, Mereenie and Palm Valley, both of which are located in the Amadeus Basin in central Australia. The Bayu Undan field in the Timor Sea supports an export LNG operation through the 3.5 Mtpa Darwin LNG facility.154
150 Ibid at 36 at 308. 151 Office of Energy Report to the Minister for Energy, Gas Tariff Review, Interim Report, June 2009 at 1. 152 Ibid at 151 at 6. 153 McLennan Magasanik Associates, Report to the Joint Working Group on Natural Gas Supply, Vol 2, 16 July 2007 at 35. 154 ABARE, Energy in Australia, published for Department of Resources, Energy and Tourism, 2009 at 49.
member firms affiliated with KPMG International, a Swiss cooperative. All rights reserved. Liability limited by a scheme approved under Professional Standards Legislation.
In the Northern Territory, gas-fired plants are used to generate public electricity.155 These plants currently use gas from the Amadeus Basin. This basin, however, cannot meet the increasing demand, which, coupled with the fact that the majority of the contracts for the supply of gas from Amadeus Basin were due to end in 2009, has resulted in the need for an alternative source of gas.156
Following the expiration of the existing gas supply contract for Power and Water, the NT Government owned electricity and water utility has contracted with ENI Australia for supply from the Blacktip field in the Bonaparte Basin. The contract is for 850 PJ over 25 years, which accommodates growth in demand but not a major gas utilising project.157
The Blacktip natural gas field began delivering gas to the Power and Water Network in August 2009. The gas comes onshore to a processing plant near Wadeye, and is then transported by the Bonaparte Gas Pipeline (which connects to the existing Amadeus Basin to Darwin Pipeline).158 NT Gas transmits natural gas through 2,000km of pipelines. The major transmission pipelines in the Northern Territory are listed in Table 3.13.
In early 2009, two new GFGs were constructed at Weddell, each with a capacity of 40 MW.159
155 Ibid at 1 at 119. 156 Ibid. 157 A Copeland, ABARE, Minerals and Energy: Major development projects – April 2009 listing, May 2009 at 5. 158 Ibid at 1 at 121. 159 Ibid at 36 at 214.
member firms affiliated with KPMG International, a Swiss cooperative. All rights reserved. Liability limited by a scheme approved under Professional Standards Legislation.
Table 3.14: Major gas transmission pipelines in NT Pipeline Location Length
(km) Year
Constructed Capacity
(TJ/d) Covered? Valuation
($m) Current Access Arrangement
Owner Operator
Bonaparte NT 287 2008 80 No 170 (2008)
n/a Energy Infrastructure Investments (APA Group 20%, Marubeni 50%,
Osaka Gas 30%
APA Group
Amadeus Basin to Darwin Pipeline
NT 1512 1987 44 Yes 229 (2001)
2001-2011 Amadeus Pipeline Trust (96% APA Group)
NT Gas (APA Group)
Wickham Point Pipeline NT 13 2009 No 36 (2009)
n/a Energy Infrastructure Investments (APA Group 20%, Marubeni 50%,
Osaka Gas 30%)
APA Group
Palm Valley to Alice Springs Pipeline
NT 140 1983 27 No n/a n/a Envestra (APA Group 31%, CKI 17%)
APA Group
Daly Waters to McArthur River NT 330 1994 16 No n/a n/a APA Group, Power and Water NT Gas (APA Group)
CKI, Cheung Kong Infrastructure Source: State of the Energy Market 2009.
member firms affiliated with KPMG International, a Swiss cooperative. All rights reserved. Liability limited by a scheme approved under Professional Standards Legislation.
4 Factors affecting gas field commercialisation Gas field commercialisation is affected by many factors, including terrain, governmental policies and the economics and funding requirements of the projects. The principal factors are discussed below.
4.1 Land rights and access The development of gas fields and LNG projects can sometimes be impacted by necessary negotiations and agreements over land rights and access. Land councils and traditional owners of the land must be consulted and significant buy-in must be obtained where developments are proposed to take place on indigenous lands. This can be a lengthy and demanding process, and a danger to project viability if agreement cannot be reached, or if it is not reached in a timely manner.
On the east coast, development of CSG fields also requires negotiation of purchase/access/use of private land. Resistance to engagement in such discussions has also been known to stymie CSG field developments in this space, both in QLD and in NSW (particularly the Hunter region). As the level of exploration for both CSG and conventional gas expands, the footprint on freehold and leasehold will also become more expansive. Compensation payments requested by landholders may also expand, so relationship management between producers and landholders is key to ensuring effective working relationships.
4.2 Multiple land use classifications While activity in the CSG industry has expanded significantly over the past five years, it has not been in isolation. The coal industry has also expanded. In QLD this has heightened competition for access to resources, as petroleum and minerals legislation includes provisions which allow for the coordinated production of both coal and CSG from the same area.
Generally, this legislative approach has been successful in fostering mutually satisfying commercial arrangements between coal and CSG producers for the exploration and production in common tenements. However, difficulties have arisen where both parties are seeking the same resource, in particular, the same coal seam. This is evidenced in overlaps between CSG and proposed underground coal gasification projects (UCG).
In February 2009, the QLD Government introduced a new regulatory framework160 in an attempt to resolve disputes between the CSG and UCG industries. The framework covers future exploration permits in the Bowen and Surat Basin and allows UCG companies with existing mineral development licenses to continue trials and possibly production. The majority of the disputed tenements then go to the CSG industry. The framework provides certainty to both parties, as it gives UCG proponents the opportunity to prove up pilot projects in the Surat and South Burnett regions, whilst also giving certainty to CSG operators proposing LNG projects by progressing thousands of hectares of gas acreage towards tenure approval.161
160 Queensland Government, Department of Mines and Energy, Underground Coal Gasification Policy, 18 February 2009. 161 Queensland Government, Bligh Govt gives green light to thousands of jobs, http://www.cabinet.qld.gov.au/MMS/StatementDisplaySingle.aspx?id=62825, 18 February 2009.
member firms affiliated with KPMG International, a Swiss cooperative. All rights reserved. Liability limited by a scheme approved under Professional Standards Legislation.
4.3 Capital investment constraints The sheer scale of investment capital required to develop gas fields, build LNG processing facilities and upgrade and expand gas transport and storage infrastructure, will obviously affect the economic viability of project ambitions. At a time where debt markets are tight and investors in equity markets are treading tentatively post the GFC, access to capital in order to fund projects is tight and may remain so for the time being. This inevitably leads to higher costs of capital, shorter debt terms and tighter debt covenants.
While many Australian upstream oil and gas companies have reasonably strong balance sheets, the recent fall of commodity prices owing to the GFC has reduced their capacity to fund new developments.162 This has resulted in a number of upstream companies selling non-core assets, looking for partners and reducing exploration spending.163 Credit ratings of oil and gas companies operating in Australia have been largely unaffected by the crisis, and while the crisis increased the cost of debt and reduced its availability, companies operating in Australia’s gas sector have nonetheless been able to raise debt.164 At the time of writing, the GFC has not affected the momentum behind Australia’s proposed LNG projects (notwithstanding higher financing costs and reduced funding availability).165 Given LNG projects can take up to five years to build, companies are looking beyond the current downturn to the middle of the next decade.166
Pipeline companies, have generally been more negatively affected than upstream gas companies. Specifically, the higher gearing of pipeline companies has made it more difficult for them to obtain finance for new projects at an acceptable cost.167
However, the threat still remains that with a finite pool of global capital available, there will be a cap on how much will be available for Australia. Given the high level of competition in the international markets for this capital, this may decrease the international competitiveness of Australian gas development opportunities.
4.4 Infrastructure and labour availability Gas developments require select expertise. Given the number of potential LNG developments in planning phase at present, there is a risk that there may be a shortage of labour in Australia to deliver the task. To the extent that labour cannot be sourced to deliver on these projects, projects may be delayed, along with the supporting investment in infrastructure (roads, houses etc).
4.5 Geology and geography Gas reserve characteristics also play a major part in investment decisions concerning the commercialisation of gas in Australia. Some of the main features that are assessed during the determination of the viability of a gas field include:
162 Ibid at 1 at 39. 163 Ibid. 164 Ibid. 165 Ibid at 1 at 29. 166 Ibid. 167 Ibid.
member firms affiliated with KPMG International, a Swiss cooperative. All rights reserved. Liability limited by a scheme approved under Professional Standards Legislation.
• Location: For conventional gas reserves, offshore fields pose greater technical and economic challenges to commercialisation compared to that of onshore fields, due to the added technical complexity in accessing and transporting the gas at sea. For CSG, onshore reserves also pose challenges, by way of the high number of deep wells and pipelines required. Physical proximity to processing facilities, transmission pipelines (and other associated infrastructure) and demand centres, also play integral parts in assessing suitable locations for field development.
• Depth: the depth of the gas deposits underground (and underwater) also impacts on the ease and cost of accessing them. Generally, the greater the depth, the greater the cost to access and retrieve.
• Porosity, permeability and pressure: each of these three features is determined by the type of rock that contains the gas deposits (for example, sedimentary rocks). Porosity refers to the amount of void space (pores) in the rock (which determines how much water and gas can be held) and permeability refers to how well water flows through the rock (which is dependent on the size of the pores and how well connected they are). The pressure under which the gas is contained within the rocks determines how quickly/easily it can be extracted.
• Water content: the water content of the gas reserve will depend on the porosity and permeability of the rock that houses it. Reserves must be dewatered to extract the gas. Therefore, the higher the water content, the greater the development costs.
• Chemical content: oxygen, hydrogen sulphide, total sulphur and total inert gas levels are some of the key chemical constituents of gas that must be assessed. The removal of excessive quantities of such impurities can be costly and can therefore affect investment decisions.
4.6 CSG water management One challenge faced by the CSG industry is water management. As the industry continues to expand, so too does the volume of water that is generated as part of the process. In 2007, Queensland CSG fields produced 12.5 billion litres of water.168 Water production is now around 22 billion litres and could grow to 250-480 billion litres per year if LNG development reaches annual production of 40 million tonnes.169 The environmental impact of this CSG water is of increasing concern, due to its high salinity and the presence of other impurities. Government authorities and landowner groups have expressed concern that the extraction and storage of this saline water may contaminate potable aquifers, from which they extract water for their stock and domestic uses.
Accordingly, in October 2008, the QLD government announced its policy position for the disposal and beneficial use of CSG water. Key features of the policy include:
• The discontinuation of the use of evaporation ponds as the primary means of disposal of CSG water. Remediation of existing ponds is to occur within three years.
member firms affiliated with KPMG International, a Swiss cooperative. All rights reserved. Liability limited by a scheme approved under Professional Standards Legislation.
• Resting full responsibility for the treatment and disposal of CSG water with the CSG producers. Specifically, unless the producers use direct injection of CSG water or have arrangements for environmentally acceptable direct use of untreated CSG water, the water must be treated to an EPA defined standard before disposal or supply to other water users.
Stakeholder consultation is currently being undertaken to develop the final policy position. It is expected that tighter regulatory controls aimed at environmentally sustainable outcomes and better use of CSG water will result. Industry is responding to the concerns of government authorities and landowners by investigating and inventing options for the treatment and use of the water. Origin Energy’s reverse osmosis (RO) water treatment plant, which forms part of its $53 million expansion of its Spring Gully CSG production facility, is a good example of industry working towards finding environmentally sound solutions for CSG water. Origin is canvassing the use of the post treatment water for local potable water supply and for industrial use in coal washing.
4.7 Ramp-up gas The issue of ramp-up gas is specific to CSG field development. As CSG field development ramps up in preparation for gas supply of LNG proportions, there exists the need to find a home for the gas that is extracted in the process. This can present a problem to CSG producers given the nature of gas supply contracts. Specifically, the absence of a spot market in QLD and the fact that all major gas users are supplied under long term contracts, which have take or pay clauses at around 85% to 95%, means that buyers have limited flexibility to take additional gas.
Limited transmission pipeline capacity in QLD also presents a hurdle in getting ramp-up gas to market. Major pipelines, including the SWQP and the RBP are at or close to full capacity, meaning securing additional transport capacity to cater for increasing ramp-up gas volumes is restricted. Transmission constraints have been addressed, to some extent, by the construction of the Berwyndale to Wallumbilla pipeline and the QSN Link (which became operational in January 2009) which enables gas to be transmitted from the Wallumbilla Gas hub to the southern markets. A Stage 2 expansion of the QSN Link (expected to be completed by December 2013), together with the three stage expansion of the SWQP and the successful development of the QHGP will all facilitate even greater transport of ramp-up gas to southern demand centres.
With adequate transport available, opportunities do exist for profitable use of ramp-up gas. Producers like Origin have created sinks for the ramp-up gas in the form of developing GFG generation plants. Origin’s Darling Downs combined cycle gas turbine (CCGT), which takes CSG from fields surrounding Chinchilla and Roma in QLD, has an announced capacity of 630MW and is scheduled for completion in early 2010. Markets for gas storage are also expected to be triggered in response to ramp-up gas production. The use of the Cooper Basin for gas storage, and the construction of new storage facilities (including pipes for linepack) are all options at hand.
In addition, improvements have been made in gas well management, which allow some relatively mature CSG fields (generally more than one year in operation) to be shut down without damaging the productivity of coal seams. Initially it was thought that it was impossible to control production rates from any CSG well (no matter what age) because turning them off meant that water would refill the seams, which would require months to dewater again. Santos has been active in shutting down wells at its Fairview CSG field in its ramp-up phase. This has enabled them to substitute some of the gas being sold into sales contracts with ramp-up gas.
member firms affiliated with KPMG International, a Swiss cooperative. All rights reserved. Liability limited by a scheme approved under Professional Standards Legislation.
The problem of ramp-up gas has also been addressed by the improved design of LNG plants. Some technologies now enable plants to run as low as 50% capacity. In addition, most LNG producers plan to add trains to the project incrementally. Both these project design features facilitate the exporting of LNG while the CSG projects are in the process of ramping up to full-field production, and therefore enables the LNG producer to earn higher prices compared to that available on the domestic market (subject to domestic reservation policies that are discussed in Section 9.1).
4.8 Scale Among other things, the scale of projects affects access to capital, approvals time and labour requirements. LNG projects are large scale investments, requiring extensive economies of scale before they can be deemed economic. Industry feedback has reinforced this point in light of the risk sharing and long term contracts required to underpin and secure the necessary lumpy investment.
4.9 Environmental regulation Environmental regulation plays an important part in the approvals process and the process of maintaining production licences. It can be a time and capital intensive process, and can be the decider as to whether gas commercialisation projects proceed. Environmental Impacts Statements (EISs) and Environmental Management Plans (EMPs) are required to be written, and State and Federal environmental conditions of approval must be met.
The Gorgon LNG project, which is to be based on Barrow Island off the coast of WA, is a prime example of the level of environmental assessment that can be required. Spanning six years, the environmental assessment for the Gorgon LNG project has been one of the most comprehensive ever undertaken in Australia. When the project was up-scaled from a 2 train to a 3 train project, Chevron, as project operator, was required to repeat the process of environmental assessment, even though approval had been granted for the 2 train project. Air, light, noise and greenhouse gas emissions, alongside the terrestrial and marine impacts of the construction and operation of the LNG project, are some of the issues that were addressed.
Two distinct conditions of approval include the provision of $62 million to establish a North West Shelf Flatback Turtle Conservation Program spanning 60 years, and $60 million for a Net Conservation Benefits (NCBs) program to add or improve biodiversity conservation values targeting bioregions similar to Barrow Island.
4.10 Approvals time The length of the approvals process has also been identified by some industry sources as a potential impediment to gas commercialisation. According to the Productivity Commission’s Review of Regulatory Burden on the Upstream Petroleum (Oil and Gas) Sector (2009), approvals are taking longer than a streamlined approval process would allow, potentially diminishing the present value of petroleum resource extraction in Australia by billions of dollars each year.170 Failure to attain
170 Productivity Commission Research Report, Review of Regulatory Burden on the Upstream Petroleum (Oil and Gas) Sector, April 2009 at xx.
member firms affiliated with KPMG International, a Swiss cooperative. All rights reserved. Liability limited by a scheme approved under Professional Standards Legislation.
approval in a timely manner has the potential to marginalise otherwise commercial projects. The streamlining of all regulatory approvals has the potential to bring forward project commitments in a more timely and efficient manner.
4.11 Technology Advances in technology will increasingly play a role in changing the cost dynamics of the gas industry. This will be pertinent in a carbon constrained economy, for example, the Gorgon LNG project is planning the biggest carbon capture and storage project in the world.
member firms affiliated with KPMG International, a Swiss cooperative. All rights reserved. Liability limited by a scheme approved under Professional Standards Legislation.
5 Australia’s LNG export markets
5.1 Introduction
Liquefied natural gas (LNG) is a safe and convenient form of energy, whose ease of transport to overseas markets makes it a prime candidate for rapid global growth. LNG is usually the cheaper option for distances of more than about 4000 km (compared with a 20 bcm/year pipeline) and is often the only practical option between continents because of the difficulties in laying long-distance pipelines along the seabed.171 In some cases, geopolitical factors also favour LNG over long-distance pipelines.172 The LNG business is in the midst of an unprecedented period of expansion, with a number of liquefaction plants - many of them larger than any previously built - due to be commissioned in the next few years.173 Global LNG consumption has risen strongly over the past decade. From 2003 to 2008 (before the advent of the recession flattened growth), LNG consumption was rising annually at around 7%.174 The global recession, however, has depressed demand. Strong gas production growth in North America, which reduces the region’s import needs, has also weakened the International Energy Agency’s (IEA’s) latest outlook for gas trade.175 Australia’s LNG represents a pivotal link between the domestic and international gas markets.176 Since it began exporting LNG in the late 1980s (via the NWS Venture), Australia’s annual LNG capacity has risen to 19.5 million tonnes (nearly 1100 PJ a year – close to Australia’s total domestic demand for natural gas).177 Australia houses one of only two LNG plants that have been given green lights to proceed since 2007 – Gorgon, approval granted in September 2009 (the other being the Gassi Touil in Algeria in 2008).
5.1.1 Trade flows Worldwide LNG trade can be divided into three main regions comprising of the North American, European and Asian markets, reflecting historical supply sources and trade flows. As shown in Figure 5.1, LNG markets in the past were generally isolated but expanded trade and potential delivery routes provide stronger links between the three distinct regional markets.
171 International Energy Agency, World Energy Outlook 2009, at 438. 172 Ibid. 173 Ibid. 174 Ibid at 1 at 26. 175 Ibid at 171 at 425. 176 Ibid at 1 at 24. 177 Ibid.
member firms affiliated with KPMG International, a Swiss cooperative. All rights reserved. Liability limited by a scheme approved under Professional Standards Legislation.
Figure 5.1: Evolution of global gas trade
Source: BG Group Investor Presentation, Petex November 2008 The linking of regional markets is due to the following: • Energy policies – A trend towards market deregulation over the past decade,178 continued focus
on security of energy supply issues and diversifying the supply mix to reduce reliance on specific trade partners and fuel types179 has driven cross-region trading. The introduction of carbon
178 A. Eliston, Convergence of Regional Liquid Natural Gas (LNG) Prices, University of Oslo, 2009. 179 A. Alhajji, Middle East Economic Survey. What Is Energy Security? Definitions and Concepts, http://www.mees.com/postedarticles/oped/v50n45-5OD01.htm, Volume 45, 2007.
member firms affiliated with KPMG International, a Swiss cooperative. All rights reserved. Liability limited by a scheme approved under Professional Standards Legislation.
reduction policies around the world will also promote LNG use over the medium term due to its lower greenhouse gas emissions.
• Viable economics – Realisation of rising oil and gas prices provides incentives for exploration of
newer or unconventional gas reserves180 leading to new gas supply centres and LNG supply options and trade routes. Ease of transport and decreasing costs over time also facilitate the linking of regional markets.
• Contract flexibility – Long term contracts have typically been rigid with respect to destinations
restricting delivery to one specific point however clauses such as delivery on a ‘Free on Board’ (FOB) basis has allowed freight costs and responsibilities to be transferred to the buyer. Provided the buyer has access to shipping and flexible delivery destinations, FOB provides for arbitrage opportunities between regional markets allowing pricing signals to transfer from one region to another.181
It is expected that global gas trading will rise more quickly than global gas demand (by 2% per year over the period 2007-2030), reflecting the imbalance between the location of reserves and the sources of demand.182 Inter-regional gas trade is projected to rise, most of which will be in the form of LNG - LNG’s share of trade is expected to rise from 34% in 2007 to 40% in 2030.183 While still distinct, the three LNG markets are becoming more interconnected, not least because of the rapid growth in Middle East LNG supply.184
5.1.2 Pricing Although the trend towards integration would intuitively suggest convergence of prices, the current state of LNG markets is still considered undeveloped185 and notable differences arise in pricing dynamics due to differences in regional market structures. The majority of LNG prices around the world are determined by long term contract negotiations, typically with terms of 20 years or longer, and account for approximately 90% of all volumes traded.186 Contract pricing terms are usually structured with a base component reflecting the large capital outlays required for LNG projects and an indexation component delivering further upside (downside) to suppliers relating to price increases (decreases) of LNG fuel substitutes, either crude and/or natural gas. The Asia Pacific region tends to link LNG prices to oil prices such as the Japanese custom-cleared crude (JCC) or Indonesian crude price, whereas the North American region tends to link to Henry Hub gas prices. Asian prices are generally higher than prices elsewhere in the world.187 Figure 5.2 shows an increasing correlation (steeper line) between Asia Pacific LNG prices and oil prices over time. This can explained by strong competition between projects (Northwest Shelf, Tangguh and Rasgas) allowing buyers to negotiate contract prices without the indexation component 180 Energy Information Administration, Annual Energy Outlook 2009 with Projections to 2030, 2009. 181 P. Zhuravleva, The Nature of LNG Arbitrage: an Analysis of the Main Barriers to the Growth of the Global LNG Arbitrage Market, Oxford Institute for Energy Studies, 2009. 182 Ibid at 2 at 94. 183 Ibid. 184 Ibid at 2 at 106. 185 J. Jensen, The Development of a Global LNG Market, Oxford Institute for Energy Studies, 2004. 186 M. Tusiani & G. Shearer, LNG A Nontechnical Guide, PennWell Corp, 2007. 187 Ibid at 2 at 106.
member firms affiliated with KPMG International, a Swiss cooperative. All rights reserved. Liability limited by a scheme approved under Professional Standards Legislation.
against crude in 2002. As oil prices increased these contracts were renegotiated to include oil prices levels to reflect fairer market values of LNG.188 In its 2009 World Energy Outlook, the IEA flagged a potential relaxation of indexation as significant new gas supplies come on line, thus putting downward pressure on prices.189 However, it highlighted that indexation will still remain dominant in the Asia-Pacific region, where most of Australia’s gas trade will continue to occur.190 Figure 5.3 shows the high correlation of US LNG prices with the Henry Hub reference price. Pricing dynamics in the North American markets are based off US natural gas prices which are a direct fuel substitute for LNG, and implicitly linked to the price of oil.191 Prices are referenced to Henry Hub, which is the largest trading hub for natural gas and is connected to other large pipelines linked to gas storage facilities and LNG infrastructure. Significant levels of risk exist for suppliers and buyers given the high degree of volatility experienced in the US natural gas market.192
Reflecting higher oil prices, LNG import prices increased significantly in the four years prior to the GFC, which led to a corresponding increase in Australia’s average LNG export price during that period. Between 2004-05 and 2007-08, Australian export prices increased by an average 18% per annum.193 However, despite this, the average Australian export price declined in 2006-07 (to $US 345 per tonne)194 reflecting increased shipments under lower priced contracts.195 The 2007 average LNG import prices paid by Japan, Korea and China are $US 355 per tonne, $US 401 per tonne, and $US 549 per tonne196 respectively.
188 Energy Charter Secretariat. Fostering LNG Trade: Developments in LNG Trade and Pricing, 2009. 189 Ibid at 2 at 107. 190 Ibid. 191 S. Brown & B. Yucel, What Drives Natural Gas Prices?, Federal Reserve Bank of Dallas, 2007. 192 A. Ball et all, ABARE Research Report 04.1, The Asia Pacific LNG Market: Issues and Outlook, 2004. 193 ABARE, Energy in Australia, published for Department of Resources, Energy and Tourism, 2009 at 51. 194 Ibid. 195 Ibid. 196 Source Juice, www.sourcejuice.com/1245726/2009/08/25/High-priced-imports-liquefied-natural-gas-South-China-combat/, last accessed 16 October 2009.
Source: Origin Energy Investor Presentation, Macquarie Australia Conference, May 2009
Source: Convergence of Regional Liquid Natural Gas (LNG) Prices, May 2009
Figure 5.2: LNG Pricing in the Asia Pacific region Figure 5.3: Henry Hub LNG pricing
member firms affiliated with KPMG International, a Swiss cooperative. All rights reserved. Liability limited by a scheme approved under Professional Standards Legislation.
The economic climate of the GFC had minimal implications to existing LNG contracts due to the long term contracting nature and price floors in place to cushion indexation impacts.197 However, the slowdown has led to higher natural gas stockpiles198 and a significant reduction in US natural gas spot prices from over $US13/mmBtu in 2008 to current levels around $US4/mmBtu – around one third of oil price parity, based on an oil price of US$70 per barrel.199 Inventory levels in the Asian region have also produced a similar price trend in the short term markets as shown in Figure 5.4.200 The proponents of Australian LNG projects consider, however, there will be significant benefits over the longer term from exporting Australian gas as LNG.201
Figure 5.4: Recent Asian spot LNG prices
Source: Paul Balfe, AMPLA State Conference 2009 Sheraton Mirage, May 2009
5.1.3 Production Australia is the world’s sixth largest LNG exporter (at approximately 9%) after Qatar, Malaysia, Indonesia, Algeria and Nigeria.202 To the Asia-Pacific region alone it supplies 13% of the LNG market.203
During 2008, the fallout of the GFC and slowing economic growth resulted in the lowest annual growth over the past decade of just 0.8% in international LNG trade comprising of 6.1% growth across Asia and Europe and a 40.8% drop in the North American region.204 Over this period infrastructure development costs also rose205 adding to the uncertainty of financing LNG projects
197 C. Hart, Financial crisis hits LNG: Don Voelte, http://www.theaustralian.com.au/business/mining-energy/financial-crisis-hits-lng-voelte/story-e6frg9ef-1111117742213, The Australian, 14 October 2008. 198 Ministry of Economic Development. A Formula for LNG Pricing, http://www.med.govt.nz/templates/MultipageDocumentTOC____39562.aspx, November 2008. 199 Ibid at 1 at 28. 200 The International Group of Liquefied Natural Gas Importers, The LNG Industry 2008, 2009. 201 Ibid at 1 at 28. 202 Ibid at 1 at 27 and 232. 203 Ibid at 2 at 92. 204 The International Group of Liquefied Natural Gas Importers, The LNG Industry 2008, 2009. 205 Ministry of Economic Development. A Formula for LNG Pricing, http://www.med.govt.nz/templates/MultipageDocumentTOC____39562.aspx, November 2008.
member firms affiliated with KPMG International, a Swiss cooperative. All rights reserved. Liability limited by a scheme approved under Professional Standards Legislation.
which require long term supply contracts to underpin the large capital outlays. As such, several gas producers have delayed final investment decisions or construction of LNG projects.206
While the GFC did negatively impact on the ability of Australian LNG proponents to secure offtake agreements to underpin their investments, Australia’s existing LNG industry weathered well through the financial turmoil. WA’s LNG output increased by 15% in the 2008–09 financial year, and sales values increased by 67 per cent for a total value of $8.5 billion.207
However the advent of the GFG and the global recession has affected the outlook for the global LNG industry considerably. While in June 2009, the IEA suggested their would be a dearth of new LNG capacity after 2012208, its latest (November 2009) outlook warns of a looming gas glut over the next few years as a result of an unexpected boom in North American unconventional gas production, the recession’s depressive effects on demand and unprecedented growth in LNG supply capacity.209 The main driver of commercial scale exploitation of unconventional resources in North America has been the successful development and deployment of technologies that enable these resources to be produced at costs similar to those of local conventional gas, particularly with recent high gas prices.210 More than 15 new liquefaction trains now under construction211 are expected to be commissioned by 2013 resulting in a 56 per cent (102 Mtpa) increase in global LNG supply capacity since 2008.212 The IEA warns of significant under-utilisation of the world’s inter-regional pipelines and LNG liquefaction capacity to at least 2015 and that the looming gas glut could have far reaching consequences for the structure of gas markets and for the way gas is priced in Europe and Asia-Pacific.213 Specifically, the much-reduced need for imports into the United States (due to improved prospects for domestic production and weaker-than-expected demand) could lead to less connectivity between the major regional markets (North America, Europe and Asia-Pacific) in the coming years.214 An increased availability of uncontracted gas supplies to the spot market may also result in lower prices.215 This would help to boost demand, especially in power generation, and reduce the overhang in supply capacity in the medium term.216 Globally, there are around a dozen projects lined up that are facing a final investment decision before the end of 2010, the earliest of which any of these would come on stream being 2014 or 2015.217 It is far from certain that any of them will proceed, in view of the prospect of lower prices, persistently high construction costs, scarce finance and reluctance on the part of some buyers to sign long-term purchase contracts (given the uncertainty about the outlook for demand in the medium term).218 As a
206 Ministry of Economic Development. A Formula for LNG Pricing, http://www.med.govt.nz/templates/MultipageDocumentTOC____39562.aspx, November 2008. 207 Gas Today Australia, WA Petroleum Sector Powers Australian Economy Through GFC: Moore, http://gastoday.com.au/news/wa_petroleum_sector_powers_australian_economy_though_gfc_moore/008114/, last accessed 25 September 2009. 208 International Energy Agency, Natural Gas Market Review 2009, at 14. 209 International Energy Agency, World Energy Outlook 2009, at 50. 210 Ibid at 1 at 93. 211 International Energy Agency, World Energy Outlook 2009, at 151. 212 Ibid at 211 at 438. 213 Ibid at 211 at 51. 214 Ibid. 215 Ibid. 216 Ibid. 217 Ibid at 211 at 151. 218 Ibid.
member firms affiliated with KPMG International, a Swiss cooperative. All rights reserved. Liability limited by a scheme approved under Professional Standards Legislation.
result, global liquefaction capacity is likely to plateau by 2013219, possibly lasting several years.220 Growth in capacity worldwide is expected to resume closer to 2020.221 Figure 5.5 shows estimates of current and forecast production levels of Australia and its LNG export rivals. Appendix B contains a list of long and medium term LNG contracts in force across the globe. Figure 5.5: LNG Supply Outlook by 2020
Source: BG Group Investor Presentation, CWC World LNG Summit, December 2008
5.2 LNG demand base LNG imports accounted for one quarter of world gas trade in 2008, equal to 7% of world gas consumption; the remainder was transported by gas pipeline.222
Eighteen countries around the world import LNG. A further 17 countries have import plants under construction or planned.223 Regasification capacity in importing countries is expanding in anticipation of a surge in supply.224 At the end of 2008, there was just over 600 bcm/year of regasification capacity worldwide - more than twice the amount of liquefaction capacity.225 The amount of regasification capacity under construction, around 210 bcm/year, is slightly larger than liquefaction capacity.226 The ratio of regasification to liquefaction capacity is nonetheless set to drop slightly, to around two, once all the new capacity is brought on stream.227
219 Ibid at 211 at 151. 220 Ibid at 211 at 442. 221 Ibid. 222 Ibid at 2 at 92. 223 Ibid at 1 at 26. 224 Ibid at 211 at 442. 225 Ibid. 226 Ibid. 227 Ibid.
member firms affiliated with KPMG International, a Swiss cooperative. All rights reserved. Liability limited by a scheme approved under Professional Standards Legislation.
The largest and fastest growing LNG market in the world is the Asia-Pacific region228 (accounting for over 68% of global LNG trade).229 With fewer international pipelines in the Asia-Pacific region, the share of gas trade met by LNG imports in this region alone is 83%, much higher than the 7% seen on the global scale.230 In this region alone, countries with import plants under construction or planned include Malaysia, Singapore, Thailand, Indonesia, Chile and the Philippines.231
Japan and South Korea are the largest importers of LNG with China and India also expected to evolve as major LNG markets in the near future.232 The majority of Australia’s LNG exports are supplied to Japan under long term contracts. Australia also exports LNG to a number of other countries such as South Korea, China and India under medium term contracts.233 Demand for LNG arises for various reasons. In Japan, South Korea and Taiwan there is a lack of alternative sources of natural gas.234 China has insufficient infrastructure to meet gas demand in coastal cities from domestic sources.235 In Europe, an increasing number of countries are seeking to diversify their sources of gas supply away from Russia.236 In Asia, climate change policies are likely to increase the demand for LNG (and LNG prices) as a cleaner alternative to coal for power generation.237
While the recession has led to a significant easing in the demand for gas overseas, Australian LNG exports have increased against this trend, with a fifth train on the NWS Venture recently becoming fully operational.238 Figure 5.6 shows the location of LNG importing countries around the world, while Australia’s main LNG demand base is described below.
228 Ibid at 1 at 35. 229 Global LNG Market Analysis, http://www.researchandmarkets.com/reportinfo.asp?report_id=1083027, September 2009. 230 Ibid at 2 at 92. 231 Ibid at 1 at 26. 232 Ibid. 233 Australian Government, Australian Liquefied Natural Gas (LNG) – Clean Energy for a Secure Future, June 2007 at 8. 234 Ibid at 1 at 26. 235 Ibid. 236 Ibid. 237 Ibid at 1 at 38. 238 Ibid.
member firms affiliated with KPMG International, a Swiss cooperative. All rights reserved. Liability limited by a scheme approved under Professional Standards Legislation.
Figure 5.6: LNG importing countries
Source: State of the Energy Market 2009
5.2.1 Japan Japan is a critical market for Australia: 79% of Australia’s LNG goes to Japan (supplying 17% of its LNG demand).239 Japan depends almost entirely on LNG imports and continues to be a major player in the LNG markets. In recent years LNG imports have risen in Japan as a result of ongoing nuclear power capacity closures. The electric power sector is expected to remain the main consumer of natural gas, accounting for around 60% of the country’s total natural gas consumption. Future growth in gas demand, however, remains low. Potential growth in gas consumption, expected to arise due to policies encouraging energy security and cleaner energy sources, will be partially offset by slow economic growth prospects and the absence of a national pipeline network which would enable increased gas use outside the power sector.
5.2.2 South Korea South Korea relies heavily on imported LNG: in 2007 it imported 15.21% of the global LNG imports.240 South Korea’s natural gas use predominantly lies in the electric power and residential sectors, each accounting for around a third of the country’s total natural gas consumption. Gas consumption has increased at an average of 19% per year since 1990, as a result of various factors, including government policies encouraging natural gas use, expansion in gas infrastructure, and rising personal incomes that have induced a shift in preferences to clean and efficient fuels.
239 Ibid at 1 at 26. 240 Research and Markets Brochure, Liberization of South Korean LNG Market, accessed 19 October 2009.
member firms affiliated with KPMG International, a Swiss cooperative. All rights reserved. Liability limited by a scheme approved under Professional Standards Legislation.
5.2.3 China In 2008, Australia accounted for 81% of China’s LNG imports.241 In China it is anticipated that consumption of natural gas will increase as a result of continued rapid growth in economic activity, policies encouraging clean and efficient fuels and the expansion of natural gas infrastructure. Although new supplies from Sichuan province are due to come on line in the short term, and the country’s total domestic production of natural gas is expected to increase, growth in production growth will not satisfy the growth in demand.
As a result, LNG imports are likely to play a significant role in China, predominantly in the eastern coastal region, where no indigenous energy sources are available and extended gas pipelines do not appear to be viable.242 The gap between projected demand and indigenous production will be bridged by a mixture of LNG and piped imports, initially from Turkmenistan and, after 2020, also possibly from Russia.243 A second west-east pipeline to bring gas from Turkmenistan, with an eventual capacity of 30 bcm/year, is under construction.244
5.2.4 India India’s natural gas consumption is expected to double by 2015245, and increase in excess of 250% between 2005 and 2025, as a result of robust economic growth and expanding population. Recent increases in gas demand have been met in large part by imports of LNG, which started in 2003.246 India’s imported LNG, however, is expected to reduce when new natural gas production from the Krishna Godavari Basin comes on line. The expected short-term surge in output is set to hold down LNG imports in the coming years. However, it is expected that LNG imports will rebound and by 2030 India is projected to be dependent on imports for more than 30% of its total natural gas consumption.247
5.3 LNG rivals The largest LNG exporters are Qatar, Malaysia and Indonesia.248 In the current decade, production has increased from Qatar, Malaysia, Nigeria, Australia, Trinidad and Oman (as shown in Figure 5.7). Qatar is increasing its capacity in enormous proportions, from 30 Mtpa to 77 Mtpa by 2012.249 In the Asia Pacific region, two projects commenced production in 2009 – Sakhalin II in Russia and Tangguh in Indonesia. However, output from Tangguh will only partially offset the recent decline in Indonesia production that has occurred due to reduced gas availability and the prioritisation of gas for domestic use.250
241 Ibid at 2 at 103. 242A. Ball et all, ABARE Research Report 04.1, The Asia Pacific LNG Market: Issues and Outlook, 2004. 243 International Energy Agency, World Energy Outlook 2009, at 503. 244 Ibid. 245 Ibid. 246 Ibid. 247 Ibid. 248 Ibid at 1 at 27. 249 Ibid. 250 Ibid.
member firms affiliated with KPMG International, a Swiss cooperative. All rights reserved. Liability limited by a scheme approved under Professional Standards Legislation.
Australia’s main LNG exporting rivals – those that supply to the Asia Pacific region - are Qatar, Malaysia, Indonesia, Papua New Guinea (PNG), Brunei, Oman, the United Arab Emirates and the Russian Federation. Their production and expansion plans are discussed below.
Figure 5.7: World exports of LNG
Source: State of the Energy Market 2009
5.3.1 Qatar Qatar has the largest natural gas reserves of all existing LNG suppliers and leads the world in LNG exports, having outpaced its rivals, Malaysia and Indonesia in 2007.251 Qatar supplies majority of its LNG to the Asia-Pacific region, with most of its customers in Japan, Korea and India. This is a result of a number of long term LNG supply contracts for the next 12-15 years with companies such as Chubu, Kansai and Chugoku Electric Power Companies, Tokyo Gas, Tohoku, KOGAS and Petronet LNG.252
In addition to its current LNG facilities, three new LNG facilities are due to come on stream throughout 2009 and 2010, more than doubling Qatar’s LNG production capacity from around 30 Mtpa to almost 80 Mtpa, all of which is contracted for export. Qatar’s strong presence in the Asia-Pacific LNG supply market places it in direct competition with the Australian LNG suppliers.
5.3.2 Malaysia Malaysia is the world’s second largest exporter of LNG and began exports in 1983.253 It exports the majority of its LNG to Japan and Korea. Malaysia holds a number of long term LNG supply contracts with companies such as Tepco, Tokyo Gas, Osaka Gas, Kansai and Tohoku Electric Power Companies and KOGAS. Malaysia’s LNG suppliers compete within the Asia-Pacific markets which places them in direct competition with Australian LNG suppliers. 251 Arabianbusiness.com, Qatar at top of the LNG table, http://www.arabianbusiness.com/495237-qatar-at-top-of-the-lng-table-, 26 June 2007. 252 A. Ball et all, ABARE Research Report 04.1, The Asia Pacific LNG Market: Issues and Outlook, 2004 at 134. 253 Bloomberg, LNG Exports Slump, Gas Demand Down, http://orangminyak.wordpress.com/2009/07/14/lng-exports-slump-gas-demand-down/, 14 July 2009.
member firms affiliated with KPMG International, a Swiss cooperative. All rights reserved. Liability limited by a scheme approved under Professional Standards Legislation.
5.3.3 Indonesia Indonesia is one of the largest suppliers of LNG in the world and exports the majority of its LNG to Japan, Korea and China. This is a result of a number of long term LNG supply contracts with companies such as Chubu, Kansai and Kyushu Electric Power Companies, Osaka Gas, Toho Gas, Hiroshima Gas, KOGAS and CPC Corporation.254 The 7.6 Mtpa plant at Tannguh, Indonesia’s third LNG centre, has recently started commercial operations delivering supplies to China, South Korea and Mexico.255 Indonesia, however, faces a number of issues such as perceived political insecurity which can add supply reliability concerns and domestic gas shortage in some regions.256 Such issues may result in a preference for alternative suppliers of LNG, such as Australia.
5.3.4 Papua New Guinea PNG has not been a key player in the gas export market in the past. This is predicted to change in the near future with discoveries of significant amounts of gas during drilling for oil.257 PNG expects to begin exporting its first LNG in 2013-14, from the JV between Oil Search, ExxonMobil, Santos, Nippon Oil Exploration, Mineral Resource Development Company and Petromin PNG Holdings.
5.3.5 Other There are several other countries that engage in LNG exports to the Asia Pacific region, including Brunei, Oman, the United Arab Emirates, Nigeria and Algeria. Brunei’s most significant LNG trade relationship is with Japan. It has long term sales contracts with Japan and Korea for around 6.7 Mtpa, both of which are due to expire in 2013.258 Oman has long term supply contracts with Korea (4.1 Mtpa) and Japan (0.7 Mtpa), with the contracts due to expire in 2024 and 2025 respectively.259 The United Arab Emirates has a long term 4.7 Mtpa supply contract with Japan, due to expire in 2019.260 The Russian Federation began exporting LNG to Japan in 2009, with a long term 0.2 Mtpa (approximately) for in excess of 20 years.261 Nigeria and Algeria also export to Japan, though their principal exporting destinations are Europe and the United States.
Outside the Asia Pacific region, Trinidad and Tobago are significant market participants, being the largest suppliers of LNG to the United States (supplying 60% of total US LNG net imports).
254 A. Ball et all, ABARE Research Report 04.1, The Asia Pacific LNG Market: Issues and Outlook, 2004 at 121. 255 BP Global, First Cargo From Indonesia’s Tangguh Project, http://www.bp.com/genericarticle.do?categoryId=2012968&contentId=7054378, 6 July 2009. 256 Ibid at 254 at 123. 257 Reuters, Papua New Guinea Sees First LNG Exports in 2013-14, http://www.reuters.com/article/ELECTU/idUSLB00105620081211, 11 December 2008. 258 A. Ball et all, ABARE Research Report 04.1, The Asia Pacific LNG Market: Issues and Outlook, 2004 at 128. 259 Ibid at 254 at 138. 260 Ibid at 254 at 141. 261 http://www.sakhalinenergy.com/en/ataglance.asp?p=aag_main&s=1
member firms affiliated with KPMG International, a Swiss cooperative. All rights reserved. Liability limited by a scheme approved under Professional Standards Legislation.
5.4 Existing LNG projects in Australia
5.4.1 Operational
5.4.1.1 West Coast The NWS Venture has provided 20 years of LNG exports to customers in the Asia Pacific region to date262 and currently supplies around 65% of WA’s domestic gas market.263 It is currently Australia’s largest oil and gas resource development, generating over 40% of Australia’s gas and oil production.264 It has six equal participants, namely BHP Billiton Petroleum (North West Shelf) Pty Ltd, BP Developments Australia Pty Ltd, Chevron Australia Pty Ltd, Japan Australia LNG (MIMI) Pty Ltd, Shell Development (Australia) Pty Ltd and Woodside Energy Limited as the operator.265 In addition, China National Offshore Oil Corporation forms part of this venture, however they have no interests in its infrastructure.266
A new platform called ‘North Rankin B’ is scheduled to start-up in 2013 in order to recover the remaining low-pressure gas from two NWS fields thereby extending the life of the field to 2040.267 Table 5.1 shows some of the key project features of the NWS Venture, while Figure 5.7 shows its location.
5.4.1.2 Northern Territory The Darwin LNG facility is being operated as a joint venture comprising ConocoPhillips as the operator (57.2%), Eni Australia (11%), Santos (11.4%), INPEX (11.3%), Tokyo Electric Power Co. Inc. and Tokyo Gas Co. Ltd. (9.2% combined).268 The facility processes gas from the Bayu-Undan field and holds a 17-year contract for the sale of 3.24 Mtpa of LNG to several Japanese energy companies.269 The estimated cost of the construction of the Darwin LNG facility and the 502 km pipeline connecting the Bayu-Undan gas field to Darwin was $1.8 billion.270 Table 5.1 shows some of the key project features of the Darwin LNG facility, while Figure 5.8 shows its location.
5.4.2 Under construction Two new LNG projects are also under construction and are expected to commence production within the next few years. The 4.3 mtpa Pluto project is scheduled to commence LNG deliveries in early 2011 and the 15 mtpa Gorgon Project (costing $43 billion) is expected to commence production in 2014. Table 5.2 shows some of the key project features of the Pluto and Gorgon LNG developments.
262 North West Shelf Venture, http://www.nwsg.com.au/download/NWSV%20Corporate%20Brochure%20Sep2009.pdf, 2009 at 1. 263 Australia LNG, http://www.nwsalng.com.au/, accessed 18 November 2009. 264 Ibid. 265 Ibid. 266 Ibid. 267 Ibid at 262 at 1. 268 Ibid. 269 The Territory, Darwin LNG Plant/Bayu Undan, http://www.theterritory.com.au/index.php?menuID=171, accessed 16 October 2009. 270 http://www.hydrocarbons-technology.com/projects/darwin/
member firms affiliated with KPMG International, a Swiss cooperative. All rights reserved. Liability limited by a scheme approved under Professional Standards Legislation.
5.5 Proposed LNG projects While Australia is only one of a number of countries proposing new liquefaction projects, it has the most ambitious expansion plans of any country.271 Numerous new LNG projects and project expansions are being proposed in Queensland, Western Australia and the Northern Territory. However, as discussed in Section 5.3.1, in view of the prospect of lower prices, persistently high construction costs, scarce finance and reluctance on the part of some buyers to sign long-term purchase contracts (given the uncertainty about the outlook for demand in the medium term), competition for markets and capital will be intense.
Since May 2007, a number of LNG proposals have been announced in Queensland, as detailed in Table 5.2. The total proposed capacity of these projects is initially 16.8 Mtpa of LNG, however, if the plans are developed to their ultimate potential this would increase to 40.6 Mtpa.272 International interest in Queensland gas reserves has been very high over the past year, with major overseas companies (Petronas, Shell, BG Group and ConocoPhillips) acquiring interests in these east coast LNG projects.273 In total, these entities spent around $20 billion to acquire CSG interests.274 Three of the four major LNG projects proposed in Queensland are at the front-end engineering and design (FEED) stage and have gas sale contracts in place. All four are aiming for final investment decision (FID) in 2010.
There are a number of proposed LNG projects on the west coast that are at various stages of planning, including Sunrise, Prelude, Wheatstone, Scarborough and Pluto 2. In the NT, the Ichthys project in the Browse Basin is at an advanced stage of planning, aiming to reach FID by the end of 2010.275 Details of WA’s, NT’s and the east coast’s proposed LNG projects are shown in Table 5.3, 5.4 and 5.5 respectively. Figure 5.8 shows the location of Australia’s existing and proposed LNG projects.
271 Ibid at 1 at 28. 272 ACIL Tasman, Fuel Resource, New entry and Generation Costs in the NEM, April 2009 at 64. 273 Gas Today Australia, A field of Dreams: Gladstone LNG, http://gastoday.com.au/news/a_field_of_dreams_gladstone_lng/00716/ ,May 2009. 274 Ibid at 1 at 35. 275 Ibid at 1 at 35.
member firms affiliated with KPMG International, a Swiss cooperative. All rights reserved. Liability limited by a scheme approved under Professional Standards Legislation.
Figure 5.8: Location of Australia's existing and proposed LNG projects
member firms affiliated with KPMG International, a Swiss cooperative. All rights reserved. Liability limited by a scheme approved under Professional Standards Legislation.
Western Australia Tokyo, Chubu, Kansai, Chugoku and Kyushu Electric Power Companies:
20 years from 1989 for 7.3 Mtpa280 Tokyo Gas:
20 years from 1989 for 7.3 Mtpa and 25 years from 2004 for 1.4 Mtpa281 Toho Gas:
20 years from 1989 for 7.3 Mtpa and 25 years from 2004 for 1.4 Mtpa282 Osaka Gas:
20 years from 1989 for 7.3 Mtpa and 17 years from 2004 for 1.0 Mtpa283 Tohoku Electric power company:
15 years from 2005 fro 0.4 Mtpa284 and 8 years from 2010 for 0.5 Mtpa285
Japan 279
Shizuoka Gas, 24 years from 2005 for varying volumes peaking at 0.135 Mtpa286 China Guangdong Dapeng LNG:
25 years from 2006 for 3.7 Mtpa287 South Korea KOGAS:
7 years from 2003 for 0.5 Mtpa288
North West Shelf
Venture
1989 276 16.3 Mtpa277
51 years278
Spot cargoes Have been sold to customers in Spain, Turkey, India and the United States.289 http://www.nwsg.com.au
276 Australia LNG, http://www.nwsalng.com.au/About-Us/Our-history, accessed 19 October 2009. 277 Woodside Website, http://www.woodside.com.au/Our+Business/Production/Australia/North+West+Shelf/, accessed 19 October 2009. 278 North West Shelf Venture, http://www.nwsg.com.au/download/NWSV%20Corporate%20Brochure%20Sep2009.pdf, 2009 at 1. 279 Australia LNG, http://www.nwsalng.com.au/Customers/Our-customers, accessed 19 October 2009. 280 A. Ball et all, ABARE Research Report 04.1, The Asia Pacific LNG Market: Issues and Outlook, 2004 at 41. 281 Ibid. 282 Ibid. 283 Ibid. 284 News Wire, Australia’s North West Shelf JV Signs Deal with Japan’s Tohoku, http://www.highbeam.com/doc/1G1-98446348.html, accessed 20 October 2009. 285 PNN, NWS Doubles Gas Sales to Japanese Customer, http://www.petroleumnews.net/storyview.asp?storyid=122889§ionsource=, 6 December 2007. 286 Woodside News release, http://www.woodside.com.au/NR/rdonlyres/0909C5A0-4685-4622-9035-9FFB310DC7DD/0/ASX09LNGsaleagreementsignedwithShizuokaGas23.pdf, 23 January 2003. 287 GDLNG Website, http://www.dplng.com/en/project/project_01.aspx, accessed 19 October 2009. 288 Ibid at 285 at 55. 289 Australia LNG, http://www.nwsalng.com.au/Customers/Our-customers, accessed 19 October 2009.
member firms affiliated with KPMG International, a Swiss cooperative. All rights reserved. Liability limited by a scheme approved under Professional Standards Legislation.
Facility Commenced Capacity Lifetime Customers
Northern Territory
Tokyo Gas: 17 years from 2006 for 1.0 Mtpa292
Darwin LNG
Facility
2006290 3.24 Mtpa 25 years291
Japan
Tokyo Electric Power Company: 17 years from 2006 for 2 Mtpa293
http://www.darwinlng.com
290 ConocoPhillips Website, Australia and Timore-Leste, http://www.conocophillips.com/EN/about/worldwide_ops/country/australia/Pages/australia.aspx, accessed 20 October 2009. 291 M. Jahanshah, Developing the Top End’s Gas Industry, http://www.lincenergy.com.au/pdf/coverage-221b.pdf, at 2. 292 A. Ball et all, ABARE Research Report 04.1, The Asia Pacific LNG Market: Issues and Outlook, 2004 at 114; 293 Thefreelibrary.com, http://www.thefreelibrary.com/TEPCO+and+Tokyo+Gas+Announce+LNG+Sales+Agreement+on+Darwin+LNG+...-a0134899034, accessed 19 October 2009.
member firms affiliated with KPMG International, a Swiss cooperative. All rights reserved. Liability limited by a scheme approved under Professional Standards Legislation.
Table 5.2: Australia's LNG projects under construction
Project Announced Capacity Schedule for fist cargoes
Site selected
EIS submitted
FID Customers Comments
Osaka Gas Co. Ltd., 25 years from 2014 for 1.375 Mtpa.298
Tokyo Gas Co. Ltd., 25 years from 2014 for 1.1 Mtpa.301
Japan
Chubu Electric Co. Inc., for 1.5 Mtpa.302
GS Caltex Corp., 20 years for 0.5 Mtpa.303
South Korea
KOGAS, 15 years for 1.5 Mtpa.304
China PetroChina Co., 20 years for 2.25 Mtpa.305
India Petronet LNG Ltd., 20 years for 1.5 Mtpa.306
Gorgon 2007 (approval)294
15 Mtpa295
2014296 Barrow Island,
WA
Yes297 Sept-09
China PetroChina, for 2 Mtpa.
Estimated cost of the project is $40 billion.299 JV between Chevron Australia Pty Ltd
(approx 47%), ExxonMobil Corp (25%), Royal Dutch Shell (25%), Osaka Gas (1.25%), Tokyo Gas (1%) and Chabu
Electric (0.417%).300 http://www.chevronaustralia.com
294 Australian Government, Australian Liquefied Natural gas (LNG), June 2007 at 13. 295 Chevron Australia Website, Chevron and KOGAS sign Gorgon gas Deal, http://www.chevronaustralia.com/media/mediastatements/gasmarketing/09-09-16/Chevron_and_KOGAS_Sign_Gorgon_Gas_Deal.aspx, 16 September 2009. 296 Engineering News Record, Gorgon LNG Project Awarded, http://enr.ecnext.com/coms2/article_bmco090916LNGProjectAw, 16 September 2009. 297 Chevron Australia Website, http://www.chevronaustralia.com/ourbusinesses/gorgon/environmentalresponsibility/environmentalapprovals.aspx, accessed 20 October 2009. 298 Nasdaq, Update: Chevron Signs Biding Gorgon LNG Sales Agreements, 16 October 2009. 299 Engineering News Record, Gorgon LNG Project Awarded, http://enr.ecnext.com/coms2/article_bmco090916LNGProjectAw, 16 September 2009. 300 Chevron Australia Website, Chevron and KOGAS sign Gorgon gas Deal, http://www.chevronaustralia.com/media/mediastatements/09-12-17/Chevron_and_Chubu_Sign_Major_Gorgon_LNG_Deal.aspx, accessed 21 December 2009. 301 Ibid. 302 Nasdaq, Update: Chevron Signs Biding Gorgon LNG Sales Agreements, 16 October 2009. 303 Ibid. 304 Chevron Australia Website, Chevron and KOGAS sign Gorgon gas Deal, http://www.chevronaustralia.com/media/mediastatements/gasmarketing/09-09-16/Chevron_and_KOGAS_Sign_Gorgon_Gas_Deal.aspx, 16 September 2009. 305 Ibid. 306 Ibid.
member firms affiliated with KPMG International, a Swiss cooperative. All rights reserved. Liability limited by a scheme approved under Professional Standards Legislation.
Project Announced Capacity Schedule for fist cargoes
Site selected
EIS submitted
FID Customers Comments
Kansai Electric, 15 years for 2 Mtpa313
Pluto 2007307 4.3 Mtpa308
2010309 Carnarvon Basin, WA310
Yes311 2007312 Japan
Tokyo Gas, 15 years for 1.75 Mtpa.316
Located 190km northwest of Karratha, Western Australia. JV between Woodside
90% (operator), Tokyo Gas 5% and Kansai Electric 5%.314 Estimated cost of $12
billion.315 http://www.woodside.com.au
307 Woodside Fact Sheet, Pluto LNG Project, Q2 2009. 308 Ibid. 309 Woodside Website, Pluto LNG Project, http://www.woodside.com.au/Our+Business/Projects/Pluto/, accessed 19 October 2009. 310 Ibid. 311 Ibid. 312 Woodside, Final Year Review 2007, www.woodside.com.au, 20 February 2008. 313 Australian Government, Australian Liquefied Natural gas (LNG) – Clean Energy for a Secure Future, June 2007 at 12. 314 Woodside Fact Sheet, Pluto LNG Project, Q2 2009. 315 Ibid. 316 Australian Government, Australian Liquefied Natural gas (LNG) – Clean Energy for a Secure Future, June 2007 at 12.
member firms affiliated with KPMG International, a Swiss cooperative. All rights reserved. Liability limited by a scheme approved under Professional Standards Legislation.
Table 5.3: Proposed LNG projects on Australia’s east coast
Proponent Announced Capacity Schedule for fist cargoes
Toyota Tsusho Corp, 12 years from 2014 for a total of 1.5 Mtpa320
Estimated capital cost of US $400 m. Potential for a second train of the same size. http://www.lnglimited.com.au/
Shell Australia LNG (Arrow
Energy /Shell)
Feb-09321 16 Mtpa322
2014323 Unknown Curtis Island324
No 2010 None Estimated cost $35 billion http://www.arrowenergy.com.au.
Gladstone LNG (Santos/ Petronas)
Jul-07 3-4 Mtpa Early 2014 170-220 PJ/a
Curtis Island325
Yes326 Early 2010327
Petronas, 20 years from 2014 for
2 Mtpa328
The project will initially produce 3-4 Mtpa, with a maximum potential production of 10 Mtpa. Reported capital cost of $7.7 billion. In May 2008 Santos sold a
40% interest in the GLNG project to Petronas for US$2.008 billion plus US$500 million upon FID of
GLNG train 2 using JV gas. http://www.santos.com
Sun LNG Project (Sojitz)
Dec-07 0.5 Mtpa Early 2012 30 PJ/a Fisherman’s Landing, Gladstone
No Unknown None First gas cargoes anticipated in early 2012. Train size of 0.5 Mtpa which can be developed as modules. Takeover
of Sunshine Gas by QGC and subsequently BG may result in Sojitz looking for other feedstock gas.
317 Arrow Energy Website, Gladstone LNG Project, http://www.arrowenergy.com.au/page/Projects/Australia/Gladstone_LNG_Project, accessed 20 October 2009. 318 Queensland Government Environment and Resource Management, Gladstone LNG Project Fisherman’s Landing, http://www.epa.qld.gov.au/environmental_management/impact_assessment/current_eis_processes/gladstone_lng_project_fishermans_landing/, last updated 14 April 2009. 319 Upstreamonline.com, Arrow On Target for Gladstone LNG, http://www.upstreamonline.com/live/article175817.ece, 16 April 2009. 320 Business Spectator, First Fisherman’s Landing LNG Shipment Headed for Japan, 18 September 2009. 321 G. Scanlan, Gladstone Economic and Industry Development Board, LNG Update, http://www.gladstoneindustry.org.au/documents/1239685963_go_110409_3rd_advertorial.pdf, 30 March 2009. 322 R. Lee May, Sydney Morning Herald, Shell CSG-to-LNG Project ‘Significant’, 12 June 2009. 323 Ibid. 324 Ibid. 325 GLNG Website, About the Project, http://www.glng.com.au/Content.aspx?p=55, accessed 20 June 2009. 326 Ibid. 327 Ibid. 328 Santos Website, Gladstone LNG, http://www.santos.com/activities-browser/development-projects/gladstone-lng.aspx, accessed 19 October 2009.
member firms affiliated with KPMG International, a Swiss cooperative. All rights reserved. Liability limited by a scheme approved under Professional Standards Legislation.
Proponent Announced Capacity Schedule for fist cargoes
Gas feed required
Site selected EIS submitted
FID Customers Comments
Queensland Curtis LNG (BG Group)
Feb-08 3-4 Mtpa Early 2014 170-220 PJ/a
Curtis Island329
Yes330 Early 2010 China National Offshore Oil Corporation,
20 years from start up for 3.6 Mtpa.331
Initial design for 3-4 Mtpa, with potential expansion to up to 12 Mtpa subject to additional gas reserves.
Estimated capital cost of $8 billion including 380km pipeline. Initially a JV between QGC and BG group,
BG has since acquired QGC. http://www.qclng.com.au
Southern Cross LNG
(LNG Impel)
May-08 0.7-1.3 Mtpa
2013 42-78 PJ/a Curtis Island No Unknown None To be constructed in modules of between 0.7 and 1.3 Mtpa. Site scoped for up to 3 trains. Open-access LNG plant projects to be designed on a toll for service basis
with 15 to 20 year contracts. http://www.lngimpel.com
Australia- Pacific LNG
(Origin/ ConocoPhillips)
Sep-08 3.5 Mtpa x2
Early 2014 195 PJ/a x2
Gladstone No332 Late 2010333
None ConocoPhillips to invest A$9.6 billion for a 50% share in CSG to LNG project proposed for Gladstone. Plans for ultimately up to 4 x 3.5 Mtpa LNG trains. 50/50 JV
alignment for whole project. www.originenergy.com.au
Abbot Point LNG Project
(Energy World Corporation
Ltd)
2009 0.5-5 Mtpa334
2012335 Unknown Abbot Point No Unknown None To be constructed in stages with stage 1 giving a capacity of 0.5-1 Mtpa And later stages expanding to up
to 5 Mtpa.
329 Gas Today Australia, A field of Dreams: Gladstone LNG, http://gastoday.com.au/news/a_field_of_dreams_gladstone_lng/00716/ , May 2009. 330 Queensland Curtis LNG Website, http://qclng.com.au/eis/, accessed 20 October 2009. 331 BG Group Website, Australia, http://www.bg-group.com/OurBusiness/WhereWeOperate/Pages/Australia.aspx, accessed 19 October 2009. 332 Australia Pacific LNG Website, http://www.aplng.com.au/index.html, accessed 20 October 2009. 333 Gas Today Australia, A field of Dreams: Gladstone LNG, http://gastoday.com.au/news/a_field_of_dreams_gladstone_lng/00716/ , May 2009. 334 Raggat, T., Townsville Bulletin, Huge expansion at Abbot Point, http://www.tablelander.com.au/article/2009/10/23/88491_business.html, accessed 13 November 2009. 335 CDHC, Central Queensland Energy Development Projects, http://www.chdc.com.au/Reports/CQ%20Mines%20&%20Energy%20Projects%20-%20Listing.pdf, accessed 13 November 2009.
member firms affiliated with KPMG International, a Swiss cooperative. All rights reserved. Liability limited by a scheme approved under Professional Standards Legislation.
Table 5.4: Proposed LNG projects on Australia's west coast
Project Announced Capacity Schedule for fist cargoes
Site selected
EIS submitted
FID Customers Comments
Taiwan CPC Corporation, for 2–3 Mtpa.
Browse 2006 10 Mtpa336
2013-2015337
No No Late 2010338
China PetroChina, for 2 Mtpa.
Proposes development of a facility 425 km northwest of Broome (WA).339 JV between Woodside
(operator), BHP Billiton. BP, Chevron and Shell, likely to cost $25 billion.340 Planning commenced in
2006, however, JV partners are yet to decide on location of the facility.341
No346 2011347 Japan HoA with Tokyo Electric, for 4.1 Mtpa
Chevron Australia Pty Ltd is the sole developer and operator.348 Engineering and design commenced in
August 2009.349 http://www.chevronaustralia.com/
Pluto 2 2008 4 Mtpa 2013350 Carnarvon Basin
Unknown Unknown Unknown Front end engineering contracts have been awarded for trains 2 and 3.351
http://www.woodside.com.au
336 Browse LNG Project, Australia, http://www.hydrocarbons-technology.com/projects/browse/, accessed 16 October 2009 337 Ibid. 338 Australian Government, Australian Liquefied Natural gas (LNG) – Clean Energy for a Secure Future, June 2007 at 13. 339 Ibid at 336. 340 Ibid. 341 The West Australian, Delay Looms for Browse LNG, 1 July 2009. 342 Chevron Australia Website, Wheatstone, http://www.chevronaustralia.com/ourbusinesses/wheatstone.aspx, accessed 19 October 2009. 343 Upstream Online, Chevron Triples Wheatstone on Iago Find, http://www.upstreamonline.com/live/article159062.ece, 11 July 2008. 344 The Wall Street Journal, Chevron pressing Ahead with Wheatstone LNG, 31 July 2009. 345 Ibid. 346 Chevron Australia Website, http://www.chevronaustralia.com/ourbusinesses/wheatstone/projectmilestones.aspx, acceded 20 October 2009. 347 Ibid at 344. 348 Chevron Australia Website, http://www.chevron.com/news/Press/release/?id=2009-07-30 349 Chevron Australia Website, Wheatstone, http://www.chevronaustralia.com/ourbusinesses/wheatstone.aspx, accessed 19 October 2009. 350 Phaceas, J., WA Business News, Woodside awards Pluto FEED contracts, http://www.wabusinessnews.com.au/en-story/1/76643/Woodside-awards-Pluto-FEED-contracts, accessed 13 November 2009. 351 Ibid.
member firms affiliated with KPMG International, a Swiss cooperative. All rights reserved. Liability limited by a scheme approved under Professional Standards Legislation.
Project Announced Capacity Schedule for fist cargoes
Site selected
EIS submitted
FID Customers Comments
Prelude 2009 3.5 Mtpa352
2016353 Browse Basin
Yes354 2011355 None 100% Shell. This project has now entered the FEED phase of development.356 In July 2009, Shell
awarded a contract for the design, construction and installation of multiple FLNG facilities over a period
of up to 15 years. http://www.shell.com
Scarborough 2004 Unknown Unknown Onslow, Western Pilbara
region357
Yes Dec 2009358
Unknown BHP Billiton and ExxonMobil appear to be making progress with this project after many years of little
activity and vacillating between an onshore location or the world’s first floating LNG facility.359
http://www.exxonmobil.com.au Greater Sunrise
2003 5 Mtpa360 2015 No No Unknown None Located 450 km north-west of Darwin in the Timor Sea. JV between Woodside as operator (33.44%), ConocoPhillips (30%), Shell (26.56%) and Osaka
Gas (10%). Development options being consideration include a brownfields expansion of the Wickham Point Bayu Undan LNG plant at Darwin
and a Floating LNG option.361 http://www.woodside.com.au
352 Shell, Prelude Floating Liquefied Natural Gas Project, http://www.shell.com/home/content/au-en/about_shell/what_we_do/prelude/index.html, accessed 13 November 2009. 353 Sharples, B., Bloomberg.com, Shell Expects Output at Prelude off Australia in 2016 (Update 1), http://www.bloomberg.com/apps/news?pid=20601072&sid=aa3XRPWZuxGA, accessed 13 November 2009. 354 Ibid at 352. 355 Sharples, B., Bloomberg.com, Shell Expects Output at Prelude off Australia in 2016 (Update 1), http://www.bloomberg.com/apps/news?pid=20601072&sid=aa3XRPWZuxGA, accessed 13 November 2009. 356 Ibid. 357 Global Insight, Onshore Location Likely as Scarborough LNG Project Makes Progress, http://www.ihsglobalinsight.com/SDA/SDADetail16806.htm, 25/5/09, accessed 13 November 2009. 358 Ibid. 359 Ibid. 360 Department of Industry, Tourism and Resources, Australian LNG Industry: APEC LNG Workshop, March 2005. 361 Woodside Website, Sunrise, http://www.woodside.com.au/Our+Business/Development/Sunrise.htm, accessed 19 October 2009.
member firms affiliated with KPMG International, a Swiss cooperative. All rights reserved. Liability limited by a scheme approved under Professional Standards Legislation.
Table 5.5: Proposed LNG project in the Northern Territory
Project Announced Capacity Schedule for fist cargoes
Site Selected
EIS submitted
FID Customers Comments
Ichthys Sep-2008362 7.2 Mtpa363
2014-2015364
Blaydin Point,
Darwin
No365 Early 2010366
None JV between INPEX as operator (76%) and Total E&P Australia (24%). Proposed location is the
Middle Arm Peninsula in Darwin Estimated cost of US$20 billion.
362 Inpex, Ichthys Darwin LNG Plant Proposal, http://www.inpex.com.au/media/4443/ichthys-proposal-fact-sheet.pdf, September 2008. 363 Australian Government, Australian Liquefied Natural gas (LNG) – Clean Energy for a Secure Future, June 2007 at 13. 364 Inpex Website, Inpex Announces Northern territory Location for Ichthys LNG Facility, 26 September 2008. 365 Inpex Website, http://www.inpex.com.au/projects/ichthys/environmental-assessment-and-environmental-approvals-process.aspx, accessed 20 October 2009. 366 Inpex, Ichthys Darwin LNG Plant Proposal, http://www.inpex.com.au/media/4443/ichthys-proposal-fact-sheet.pdf, September 2008.
member firms affiliated with KPMG International, a Swiss cooperative. All rights reserved. Liability limited by a scheme approved under Professional Standards Legislation.
6 The role of gas in a carbon constrained economy
The Federal Government’s commitment to reducing Australia’s greenhouse gas emissions, is a key driver in the recent and anticipated changes in Australia’s gas and electricity markets. The two main vehicles to be used for implementing their climate change visions are the Carbon Pollution Reduction Scheme (CPRS) (still in proposal stages) and the expanded Renewable Energy Target (RET) (already legislated). The Carbon Energy Initiative (CEI) complements these two schemes by supporting the research, development and demonstration of low-emission technologies, including industrial scale carbon capture and storage and solar energy.367
While the CPRS in isolation acts as a catalyst for the increasing presence of GFG in Australia’s electricity mix, the enhanced RET lessens the advent of such. Overall, however, gas is still considered the fuel of choice in electricity generation as Australia transitions from a coal centric to a carbon constrained economy. In other words, gas is being positioned to replace coal in setting the marginal price of electricity generation, as the intermediate step between the shift of focus from coal to renewables in the electricity mix. In doing so, the climate change policies are causing a convergence of Australia’s electricity and gas markets. The two schemes are discussed below.
6.1 CPRS The CPRS is the Federal Government’s flagship scheme that seeks to forge its ultimate climate change goals. Along with the enhanced RET, the price of emissions permits underpinning the CPRS is likely to greatly shape the electricity generation mix of Australia going forward. High carbon prices relative to long run marginal costs for low emission technologies are expected to provide sufficient incentive to invest in an efficient mix of generation. In the long run the CPRS price should converge to an internationally linked carbon price given a comprehensive international agreement on a global carbon-trading scheme.
In the short term, however, it is proposed that coal fired generators will receive assistance from the Federal Government under the Electricity Sector Adjustment Scheme (ESAS). The assistance is intended to provide general transitional assistance towards a carbon constrained economy, and recognises that some generators could experience significant reductions in their profitability and in asset values because they may not be able to pass on their full carbon costs, because they are constrained by competing generators with a lower emissions intensity.368 The assistance would also be provided to lower the risk of detrimentally effecting the investment environment in the Australian electricity generation sector. The current proposal comes in the form of a fixed administrative allocation of free carbon permits worth $7.3 billion (based on an initial carbon price of $25 per tonne). The permits would be distributed to each eligible generator over the first five years of the Scheme.
The assistance for coal fired generators may postpone the re-ordering of the electricity bid stack order, however, GFG should eventually have a carbon cost advantage over coal fired generation. Over time, the CPRS is expected to encourage increased investment in the gas industry as the 367 Australian Government – Department of Climate Change, Clean Energy Initiative, http://www.climatechange.gov.au/government/initiatives/clean-energy-initiative.aspx, last accessed 18 November 2009. 368 Australian Government, Carbon Pollution Reduction Scheme: Australia’s Low Pollution Future, White Paper, Volume 1, December 2008.
member firms affiliated with KPMG International, a Swiss cooperative. All rights reserved. Liability limited by a scheme approved under Professional Standards Legislation.
demand for gas increases, from increased gas field developments, right through to GFG and gas delivery infrastructure and storage. The carbon price would factor into the short run and long run marginal costs of electricity generation. It would ultimately shift the order of bid stack, as coal fired generators lose their cost advantage, owing to the higher carbon emissions arising from coal burning (and therefore higher costs of offsetting those emissions through purchase of carbon credits).
According to Australian Treasury estimates published in December 2008, GFG under the Garnaut scenarios could increase to 60-64 terawatt hours by 2020, up from the 30 terawatt hours of GFG produced in 2007-08.369 This would increase gas demand to 530-560 PJ – a doubling of current gas use in power generation.370 The Garnaut review also predicted greenhouse mitigation policies would expand opportunities to export gas.371
Beyond 2020, however, the role of gas may be constrained as rising carbon prices make renewable sources and coal with carbon capture and storage more competitive.372 Likewise, rising electricity prices in the residential sector would encourage energy efficiency and renewable investment, thereby reducing the use of fossil fuels.373 However, these projections rely on assumptions regarding long term energy prices, carbon prices, the outcome of future research and development, and costs of competing forms of energy – all of which are subject to considerable uncertainty.374
6.2 Enhanced RET The RET aims to provide an incentive for investment in renewable sources of energy. The RET increases the target for renewable energy generation in Australia from the current 9,500 GWh in 2010 to 45,000 GWh in 2021, held to 2030 (around 20% of the total electricity supply). On 26 February 2010, the Federal Government announced that from 1 January 2011 the RET would include two parts – the Small-scale Renewable Energy Scheme (SRES) and the Large-scale Renewable Energy Target (LRET). This enhanced RET scheme provides greater certainty for energy market participants, and is expected to deliver more renewable energy than the existing 20% target.
The LRET will cover large scale renewable energy projects like wind farms, commercial solar and geothermal and will deliver the vast majority of the 2020 target: a target of 41,000 GWh for 2020. The LRET has been set to achieve a level of large-scale renewable electricity generation above what was expected under the existing RET. The LRET annual targets (to commence in 2011) for large-scale renewable electricity generation are shown in Figure 6.1.
The SRES will cover small-scale technologies, such as solar panels and solar hot water systems, and will deliver the remainder of the 45,000 GWh target. It will provide a fixed price of $40/MWh of electricity produced from such systems (though this fixed price will be reassessed at the planned statutory review of the RET in 2014). The number of systems receiving support under the SRET will be uncapped to ensure certainty for small-scale installers.
369 Ibid at 1 at 37. 370 Ibid. 371 Ibid. 372 Ibid. 373 Ibid. 374 Ibid.
member firms affiliated with KPMG International, a Swiss cooperative. All rights reserved. Liability limited by a scheme approved under Professional Standards Legislation.
The Government will be releasing an industry consultation paper on the enhanced RET arrangements and will be consulting with stakeholders on the implementation aspects of the scheme.
Figure 6.1: LRET annual targets against the existing RET targets
0
5000
10000
15000
20000
25000
30000
35000
40000
45000
50000
2010
2011
2012
2013
2014
2015
2016
2017
2018
2019
2020
2021
2022
2023
2024
2025
2026
2027
2028
2029
2030
Rene
dwab
le E
lect
ricity
G
ener
atio
n (G
Wh)
LRET
Existing RET
The enhanced RET effectively forces higher cost renewable energy into the electricity generation mix. However it is at the expense of lower cost emissions abatement opportunities available in the market. Of the renewable energy options available in Australia, it is anticipated that investment in wind energy will be much higher relative to other renewable energy technologies (by virtue of its cost advantages) in response to the enhanced RET scheme (especially in the short term).
A positive repercussion of the enhanced RET for the gas industry is that GFG will be essential for backing up the intermittent nature of wind energy (and will provide the necessary security for firm wind offtake agreements in the form of Power Purchase Agreements). This is because gas provides a quick response time for the start-up of GFG facilities, and has a lighter carbon footprint than coal (and is therefore more preferable as a fuel source given the anticipated introduction of the CPRS). The enhanced RET will therefore foster some degree of increased investment in gas supply, GFG facilities, gas storage facilities and gas transmission infrastructure.
However, such benefit must be weighed against the loss of potential market share for GFG due to the forced entry of renewables. The benefit that the CPRS brings to the gas industry is eroded by the displacement of gas caused by an enhanced RET. Without the enhanced RET, baseload GFG developments opportunities may have been more pronounced. By requiring a certain proportion of electricity to be generated from renewable sources, efficient resource allocation is distorted. It requires a disproportionate amount of abatement to be obtained from the electricity generation sector and, furthermore, from more expensive fuel sources.375 Therefore, any benefit to gas demand that is achieved through the CPRS is lessened if a CPRS runs simultaneously with the enhanced RET.
375 CRA International, Implications of a 20% Renewable Energy Reduction Target for Electricity Generation, 2007 at 19.
member firms affiliated with KPMG International, a Swiss cooperative. All rights reserved. Liability limited by a scheme approved under Professional Standards Legislation.
6.3 Clean Energy Initiative The Clean Energy Initiative (CEI) is intended to support the research and development of low-emission energy technology. It provides funding for three programs:
1. Carbon Capture and Storage Flagship Program: for the construction and demonstration of large-scale integrated Carbon Capture and Storage (CCS) projects in Australia.
2. Solar Flagships Program: for the construction of large scale solar power stations in Australia.
3. Australian Centre for Renewable Energy (ACRE): to establish an industry body whose purpose is to promote the development, commercialisation and deployment of renewable technologies.
Both the CEI and the enhanced RET have negative implications for the gas industry. Progress in the development of CCS technologies will add longevity to the coal fired electricity generation sector, while investment in renewable technologies may advance their share of the energy mix. Both such occurrences would be at the expense of GFG.
6.4 Issues for the LNG industry While the Garnaut review predicted greenhouse mitigation policies would expand opportunities to export gas, downside exists in that LNG production creates greenhouse emissions that may be priced under the CPRS. Some gas reservoirs being proposed for Australian LNG projects contain significant volumes of carbon dioxide, and the process of liquefaction also emits carbon dioxide.376 Accordingly, the CPRS would require the proponents to manage their emissions. However, they have also sought relief under the proposed CPRS, to compensate for the significant adjustment costs and potential loss of competitiveness to exporting industries whose competitors do not face similar carbon constraints.
In recognition of the growing importance of the role of Australia’s LNG export industry, the Government recently announced additional measures for LNG production. These measures predominately relate to the expected drop-off in effective permit allocations that will be experienced by the industry as natural gas reserves become more energy intensive to extract and are likely to contain higher proportions of associated carbon dioxide. Based on current information about project emissions and start-up dates, the additional levels of permit allocation are estimated to be worth $0.6 billion over the period to 2019/20.
The main amendments relating to LNG are:
• additional ongoing supplementary allocation of permits to be provided for LNG projects to ensure that all projects receive permit allocations at or above 50 per cent in relation to their LNG production;
• the supplementary allocation to be for the number of permits needed to ‘top up’ the previous year's allocation to provide an effective assistance rate of 50 per cent for the LNG project;
• in determining the supplementary allocation, the emissions associated with the entire LNG production process to be taken into account, that is, including extraction and transportation
376 CRA International, Implications of a 20% Renewable Energy Reduction Target for Electricity Generation, 2007 at 19.
member firms affiliated with KPMG International, a Swiss cooperative. All rights reserved. Liability limited by a scheme approved under Professional Standards Legislation.
emissions associated with LNG production, but excluding emissions attributable to other saleable products, such as the production of condensate and LPG;
• the need for this supplementary assistance to be assessed by the Independent Expert Review, including whether it is appropriate to apply a carbon productivity contribution to the supplementary allocation.
It is noted that, at the time of writing, the Department of Climate Change and Energy Efficiency (DCCEE) has not published a final activity definition for LNG manufacturing. The DCCEE has, however, indicated that it expects the LNG manufacturing activity to be “moderately emissions-intensive,” thereby triggering the 66 percent level of permit allocation.
member firms affiliated with KPMG International, a Swiss cooperative. All rights reserved. Liability limited by a scheme approved under Professional Standards Legislation.
7 Factors impacting the domestic gas supply market
7.1 Co-dependence on LNG exports The WA domestic gas market is about to enter a period of considerable growth, as a result of new projects being developed in response to increasing gas demand and a tightening in the market over 2006-2008. Queensland is set for a major CSG gas extraction and LNG export program (which may rival that which has occurred in WA) and, in November 2009, Santos submitted a proposal for an LNG plant in the Hunter region of NSW. Critical to Australia’s energy security is the sufficient development of Australia’s large gas resources (more than 100 years of supply at current production rates), in order to meet the long term needs of a growing Australian gas market and an expanding LNG industry. Indeed, co-dependency exists between the two needs since many of Australia’s more remote offshore gas fields can not be economically developed without the higher volumes and prices generated from LNG exports.
Consensus from industry feedback is that the presence of LNG exporting from WA resources will not act as a barrier to future domestic supply. Rather, WA domestic supply will be inhibited if LNG export projects do not go ahead. The premise for this view is that domestic demand alone is inadequate to justify the expense in developing offshore fields (which is highly capital intensive). In the case of WA, once the Reindeer and Macedon fields come on line, which are purely for domestic supply, LNG projects will need to underpin the bulk of remaining WA gas fields able to be developed, before the economics stack up to warrant them commercially viable.
7.2 Joint marketing Joint marketing between gas producers and gas marketers has been addressed in many forums over the years. Some industry feedback has suggested that separate marketing could result in a greater likelihood of field development, as different market participants would have different views on the commerciality of different fields. However, joint venture parties in gas production have to date mainly sold their gas through joint marketing arrangements under authorisation from the Australian Competition and Consumer Commission (ACCC).377
ACCC decisions regarding marketing arrangements for JVs concluded that assessments should be conducted on a case-by-case basis. Separate marketing is feasible as evidenced by Santos’ and Apache’s separate marketing of John Brookes gas (Carnarvon Basin), BHP Billiton at Minerva (Otway Basin), Santos at Casino (Otway Basin) and Woodside at Thylacine/Geographe (Otway Basin).
However, when reviewing the case for the Gorgon Project, the ACCC was of the view that delivery of gas would commence at an earlier time and at larger volumes under joint marketing than would be the case under separate marketing.378 This would have three key impacts. It would:
• provide a new source of supply to the domestic market (and assist the supply/demand balance)
377 Ibid at 36 at 240. 378 ACCC, Application for Authorisation, Determination in respect of the joint marketing and sale of natural gas from the Gorgon Gas Project for supply in Western Australia, 5 November 2009 at iii.
member firms affiliated with KPMG International, a Swiss cooperative. All rights reserved. Liability limited by a scheme approved under Professional Standards Legislation.
• prompt greater competition from other projects (and assist development of WA’s gas market)
• assist in gas pricing by way of increasing gas volume in the market.
The ACCC considered that gas market conditions in WA has experienced only marginal development since its authorisation of joint marketing from the North West Shelf in 1998, and that separate marketing remains difficult with substantial commercial risks.379 The ACCC identified that should separate marketing be attempted by the Gorgon JV partners it may lead them to require higher prices than otherwise would have been needed in order for them to meet their threshold rates of return for investment.380 Reasons behind the ACCC assessment include:
• the relatively small number of suppliers, purchasers and gas transport options;
• the preference of the majority of suppliers, purchasers and pipeline operators to sign long term gas supply contracts;
• which has resulted in a market which is contract based or ‘lumpy’ (where demand and supply move in significant steps or increments); and
• which appears to have limited the extent to which parties in the market are able to engage in secondary trading and has discouraged the development of significant gas storage.381
Joint marketing therefore provides a mechanism for the sharing of project related risks in markets that are otherwise illiquid and non-transparent. It is also an effective way for JV partners to handle imbalances in reserves shared, and negates the likelihood of one party disputing another for failing to honour gas delivery obligations. It is also worth noting that a number of approved joint marketing authorisations are set to expire (or have expired) with no extension requested.
7.3 Vertical integration Vertical integration is a strategic decision that is likely to become more prevalent in the Australian gas market, for the risk mitigation benefits that it provides. In WA, BHP Billiton will use its Macedon field to supply its iron, nickel and alumina businesses. Origin and AGL also show significant investment along the supply chain from gas reserves through to gas retail and GFG.
7.4 Price transparency
The Australian gas market is typified by a lack of transparent information surrounding market prices, contractual arrangements and general market and system capabilities. The contractual stipulation of price reopening clauses and the occurrence of price resetting arbitrations/price review processes with long term supply contracts is implicit recognition of the inadequate transparency and insufficient
379 ACCC, Application for Authorisation, Determination in respect of the joint marketing and sale of natural gas from the Gorgon Gas Project for supply in Western Australia, 5 November 2009 at ii. 380 Ibid at 379 at 47. 381 Ibid at 379 at ii.
member firms affiliated with KPMG International, a Swiss cooperative. All rights reserved. Liability limited by a scheme approved under Professional Standards Legislation.
price signalling. There is also a lack of a forward curve for gas. These features have been raised by some analysts as a significant impediment to efficient operation and further development of the Australian gas market.
The level of transparency differs from state to state. In VIC, the level of transparency has improved and is considered better than that of other states, owing to the existence of a spot market. However, in other jurisdictions, especially NSW, SA and QLD, a lack of transparency remains an issue.
In SA the majority of swing gas is procured ‘off market’, which means it is procured under bilateral contracts as opposed to via the Retail Energy Market Company (REMCo) market process. This has two consequences: it reduces the transparency of prices, and increases the risk for participants who are unable to secure a swing gas contract off market (because there is little liquidity within REMCo market processes and prices have at times been significant (up to $1600 / GJ)).
Industry feedback has suggested that inadequate price transparency could be an issue for domestic gas supply, but not the LNG industry. The domestic gas market on the east coast is relatively more transparent than the West and NT, owing to its size, maturity and the interconnectivity of the gas transport infrastructure it supports. The Bulletin Board and Short Term Trading Market in VIC (discussed in Chapter 8) do expose and facilitate gas trading opportunities that might otherwise be unknown to those not facing the market. While a Bulletin Board can be supported in WA as a means to increase price transparency, the market is currently considered too immature to support a STTM.
It was also noted that the proliferation of LNG projects in Australia is a reflection of the high degree of price transparency in that market. In comparison, the same impetus to supply the domestic market is not evident, owing largely to the lack of price transparency. While there are instances where government intervention seen in the North American and Northern Europe (especially the UK) markets has helped the market become more transparent and efficient, this is not always the case. This issue is discussed further in Section 9.1.
It is in emergency situations, such as that presented by the Varanus explosion, that concerns Government and public authorities in light of the lack of price transparency. Those facing the market do not share the same concern, in their view the transparency is adequate and they can readily trade.
7.5 Acreage management The management of gas reserves is an issue relating to gas supply in Australia. In particular, retention leases and production licenses are, at times, an area of scrutiny by Government. With WA and NT recently facing supply constraints, and forecasts suggesting these shortages may continue, the timely commercialisation of gas reserves for domestic supply remains an issue for Government.
The number of retention leases382 and their timetable for renewal may impact the market, particularly in WA where short term domestic gas supply is tight due to the lack of demand for large, long term contracts to underwrite new gas projects. Over 50% of Western Australia’s reserves are held under retention leases, and around a further 25% of reserves are held as undeveloped gas in production
382 Retention leases are granted to titleholders on the basis that a discovery may not be commercially viable at the time of application for the lease but is likely to be within fifteen years. They expire after 5 years but are renewable, and there is no limit on the number of renewals that can be granted (provided the commerciality criteria is satisfied).
member firms affiliated with KPMG International, a Swiss cooperative. All rights reserved. Liability limited by a scheme approved under Professional Standards Legislation.
licences.383 While the LNG export industry does take large volumes of gas offshore, the fact that Macedon has been looking for domestic customers since the early 1990s is indication of the availability of local supply options.
While gas producers recognise the importance of domestic gas supply, acreage management flexibility is a key incentive for gas resource exploration and development. To remove or lessen such flexibility may discourage the pursuit for and commercialisation of Australian gas reserves.
7.6 Pipeline policy and regulation
7.6.1 Gas quality specifications While not so much an issue in the east coast market, the divergence from national gas quality standards in the west coast has presented an impediment to standardisation in the WA market. However, as discussed in Section 3.3.3, new legislation was passed (on 18 November 2009) by the WA Government to broaden WA’s gas quality specifications, and thereby allow greater supply of gas to the domestic market at lower cost. Broadening the make up of gas for the domestic market encourages the development of gas fields, such as BHP Billiton’s Macedon, which (prior to the new legislation) sat outside specifications for delivery through WA’s gas pipeline network. The Gas Supply (Gas Quality Specifications) Bill 2009 will take effect from 1 January 2012.
7.6.2 Pipeline regulations Recent legislation has tended to promote greenfield investment in transport infrastructure to support the gas industry, but it offers less incentives for upgrades to existing transport infrastructure. This is seen by some industry members as a limiting factor for efficient gas transport.
7.6.3 Approvals process Industry feedback suggests that the approvals process for gas transport infrastructure projects can be arduous, and an impediment to gas field commercialisation. Cross border pipeline projects, such as the Queensland to Hunter Gas Pipeline, are particularly prone to jurisdictional frictions with approval processes. It is hoped that a streamlining of these processes will not further hinder the commercialisation of these gas fields.
383 McLennan Magasanik Associates, Natural Gas in Australia, Report to Joint Working Group on Natural Gas Supply, 16 July 2007.
member firms affiliated with KPMG International, a Swiss cooperative. All rights reserved. Liability limited by a scheme approved under Professional Standards Legislation.
8 Gas market efficiency
In 2005, the Ministerial Council on Energy (MCE) appointed a Gas Market Leaders Group to review the necessity for continued reform of the Australian gas market.384 In 2006, the Group recommended the establishment of a:
• National Gas Market Bulletin Board (NGBB)
• Short Term Trading Market (STTM)
• National Gas Market Operator to administer to the NGBB and STTM and to produce an annual national Statement of Opportunities on the gas market.385
The objective of the recommendations was to improve transparency and efficiency in the Australian gas market. They also aimed to provide timely information to help manage gas emergencies and system constraints.386
8.1 National Gas Bulletin Board The NGBB is a website (www.gasbb.com.au) covering major gas production fields, storage facilities, demand centres and transmission pipelines in southern and eastern Australia, with provisions for Western Australia and NT to participate in the future.387
The aim of the National Gas Bulletin Board (NGBB) is to facilitate trade in gas and capacity over the relevant pipeline systems through the provision of readily accessible and up-to-date system and market information to end-users, potential users, market entrants and market observers. The NGBB went live on July 1, with VENCorp as the Bulletin Board Operator. On 1 July 2009 VENCorp's role in the NGBB was transitioned to the Australian Energy Market Operator (AEMO) (the move towards a single market operator is discussed in Section 8.3).
The NGBB provides real-time information about gas market conditions, through the mandatory submission by relevant market participants of information including gas pipeline capacity and production and storage capabilities. Participants are also able to advise of spare capacity and make offers through the Bulletin Board.
The benefits of the NGBB are that it:
• provides readily accessible and updated information on the state of the market, system constraints and opportunities. The information assists existing and potential users to identify potential trading, risk mitigation or investment opportunities;
384 Ibid at 36 at 245. 385 Ibid. 386 Ibid. 387 Ibid at 36 at 246.
member firms affiliated with KPMG International, a Swiss cooperative. All rights reserved. Liability limited by a scheme approved under Professional Standards Legislation.
• provides historical information that existing and new industry participants can use in negotiating new long term contracts, or for short term trading around their contracted position;
• holds very similar market information to that required by the National Gas Emergency Response Advisory Committee (NGERAC) which will better facilitate informed decisions to be made in times of a major supply constraint.
However, the BB concept does have some limitations, including:
• existing major players already have access to much of the information it provides, and therefore may be of limited added value;
• legal arrangements must be developed to impose obligations on parties to provide or update the information on the BB;
• it has no direct impact on the pipeline operations or the operation of existing gas supply or pipeline transportation contracts;
8.2 Short Term Trading Market The MCE has approved the development of a STTM in gas, with a target commencement date of June 2010.388 The objective of the STTM is to establish a mandatory price based balancing mechanism for gas delivered to, and withdrawn from, defined market hubs. Initially such hubs will be Sydney and Adelaide (where existing gas balancing arrangements will be replaced). However the STTM will be expanded to cover further hubs in the future. In Victoria, a STTM already exists in the form of the spot market.
The ACCC recommends the presence of a STTM as a building block upon which separate marketing can be supported. Other benefits of a STTM include:
• The STTM would remove the need for the Operational Balancing Gas (OBG) in NSW and Swing Gas in SA, thereby eliminating a key area of jurisdictional difference;
• Participants would be able to purchase gas from the STTM without the need to contract with a supplier or pipeliner thereby reducing the previous complexities and barriers to entry;
• The STTM would facilitate gas trading on a daily basis at market driven short term prices, providing transparent pricing signals between hubs, and facilitate greater demand side responses by users;
• The competitive market for gas would better enable existing participants and new entrants to manage financial risks and match short term variations in supply or demand;
388 AEMO website, Gas Market Operations, http://www.aemogas.com.au/index.php?sectionID=6890&pageID=6898, accessed 18 November 2009.
member firms affiliated with KPMG International, a Swiss cooperative. All rights reserved. Liability limited by a scheme approved under Professional Standards Legislation.
• A daily clearing price signal would directly assist the ability of the market to respond efficiently to shortages of supply, and so avoid the adverse commercial impacts of intervention and/or the exercise of emergency powers by jurisdictions in rationing scarce gas supplies;
• The proposed STTM arrangements would be compatible with the Victorian spot market, with pricing signals at hubs used in conjunction with signals from the Victorian market to enable participants to make informed decisions.
Limitations
• As the STTM will not replace bilaterally negotiated long term contracts, it will not necessarily increase the depth and liquidity of the wholesale gas market significantly;
• An independent Market Operator with gas market expertise is required to oversee the development, maintenance and operation of the STTM;
• The detailed design requires significant work around pricing, clearing, settlement details, and the governance or legal framework for its operation;
• Consideration needed on transitioning the proposed balancing arrangements from existing ‘swing service’ in SA and OBG arrangement NSW.
8.3 National Gas Market Operator The establishment and administration of a STTM and BB requires a Market Operator. It is considered most appropriate to have a single market operator (the National Gas Market Operator) given co-existence with existing operators would add undue complexity and therefore cost of participation (in a national market), increase the likelihood of jurisdictional differences and, overall, increase potential barriers to entry. A single market operator aids standardisation. AEMO is the entity that fulfils the role of National Gas Market Operator. In this role, AEMO oversees the following functions:
• development, implementation and operation of the BB and STTM;
• supporting NGERAC through the collection, maintenance and analysis of gas system and market information;
• preparation of an annual Gas Statement of Opportunities (GSOO) – a national gas supply and demand statement (similar to that currently published for the Australian electricity market). The first GSOO was released on 17 December 2009;389
• operation of the gas retail market arrangements in NSW/ACT and SA, and planning for the future operations of retail markets in other States and Territories; and
• operation of the gas market and networks in Victoria.
389 Australian Energy Market Operator (AEMO), 2009 Gas Statement of Opportunities for Eastern and South Eastern Australia, 2009.
member firms affiliated with KPMG International, a Swiss cooperative. All rights reserved. Liability limited by a scheme approved under Professional Standards Legislation.
8.4 Impact of interventionist policies on market efficiency
Interventionist policies have the effect of creating impediments to market dynamics. They overrule the natural forces of a market in determining the most efficient/optimal allocation of resources. Interventionist strategies have been adopted in WA and considered in QLD, for the purposes of securing/increasing domestic gas supply in the presence of LNG export options.
All other things being equal, domestic gas reservation policies may reduce the diversity of supply, which may lower energy security. On absolute terms reservation policies can increase sovereign risk, reduce investment returns and adversely affect propensity to invest. By forcing gas to specific markets, against market forces, market efficiency is reduced and the economic welfare of the State populous can be reduced. Therefore, while reservation policies are just one of a number of factors affecting investment decisions, they do add to project risks and costs and can reduce Australia’s competitiveness for investment to supply export as well as domestic markets.
Industry feedback suggests that the WA reservation policy has also had the unintended effects of discouraging new market entrants, with at least one APPEA member company viewing the WA domestic gas reservation policy as the single largest impediment to their plans to proceed with domestic gas supply development in that State.390
In November 2009, the Queensland Government decided its strategy for achieving long term supply security would be to set aside future gas fields for future domestic supply if needed. It rejected an option to require a percentage of gas from all fields to go to the domestic market. This approach was welcomed by the gas industry.
390 APPEA, Consultation Paper: Domestic Gas Market Security of Supply, September 2009 at 19.
member firms affiliated with KPMG International, a Swiss cooperative. All rights reserved. Liability limited by a scheme approved under Professional Standards Legislation.
9 Gas policy initiatives
9.1 Mandatory domestic gas reservation The WA Government has incorporated a gas reservation policy as a means to secure domestic gas suppliers since the 1980s. It first approved the NWS LNG project with provisions that specified that 4.7 Tcf of the gas reserves must be supplied to the domestic market. Likewise, the State Agreement for the Gorgon gas project contains similar provisions (1.85 Tcf of gas to be supplied to the domestic market). It is the State’s objective to continue with such policy in order to secure domestic gas commitments up to 15% of LNG production from each export gas project. This is as a condition of access to WA land for the location of processing facilities.
Modelling undertaken by KPMG Econtech391, however, concluded that a gas reservation policy would lower the consumer welfare benefits that would arise from a 28 Mtpa LNG export industry in QLD. Deadweight losses would be generated since only a part of the costs to producers would be offset by benefits to consumers. Producers would be forced to sell more gas at lower prices than they would otherwise and the cost of doing this would be greater than the benefit to domestic gas consumers. This is an inefficient outcome and net consumer welfare will be lower than would have been achieved if producers were allowed to choose the optimum allocation of supply between the domestic and export markets.
Following release of the KPMG Econtech report, the QLD Government (in November 2009) decided its strategy would be to set aside future gas fields for domestic supply only if needed, rejecting the option to require a percentage of gas from all fields to contribute to domestic supply.392
9.2 Retention leases In order to free up gas for domestic supply, the Federal Government is proposing an overhaul of the policies regarding retention leases. The main issue with retention leases is that there is no clear definition of what renders a field ‘commercially viable’. The Government aims to address this issue, and to shorten or fix the fifteen year term of the leases. It has also canvassed the removal of the right of individual members of a joint venture (that holds a retention lease over a reserve) to veto the other partners from wanting to develop the reserve.
9.3 Royalty reductions or holidays In order to encourage gas producers to develop ‘tight’ gas reserves to increase domestic gas supply, the WA government has flagged that it will be reducing the state royalty on gas from such reserves from 10% of its wellhead value to 5%. ‘Tight’ reserves refer to those that are found in low permeable rocks that require mechanical/chemical stimulation to flow at commercial rates.
The onshore Perth Basin is considered quite prospective for tight gas. Accordingly, the royalty relief is a powerful incentive for companies with interests in the gas region, including JV partners 391 KPMG Econtech, Critique and Economic Analysis of Domestic Gas Reservation Policy Options, October 2009. 392 Gas Today Australia, Queensland sets aside future domestic LNG, http://gastoday.com.au/news/qld_gov_greenlights_lng_policy/008705/, last accessed 21 December 2009.
member firms affiliated with KPMG International, a Swiss cooperative. All rights reserved. Liability limited by a scheme approved under Professional Standards Legislation.
Australian Worldwide Exploration and Origin Energy, and Transerv. Royalty holidays have also been highlighted as attractive incentives for tight gas operators.
9.4 Broadening of gas quality specifications The Council of Australian Governments (COAG) ruled that specifications should be consistent across all jurisdictions in order to assist with the standardisation of gas market operation. However, as discussed in Section 3.3.3, in WA different gas quality specifications exist on different pipelines across the state. The most restrictive quality specification applies to the main pipeline in the state: the DBNGP. This has meant that some gas fields, such as BHP Billiton’s Macedon field in the Carnarvon Basin in WA, have been blocked from supplying customers in WA because the gas does not meet the tight quality specifications for delivery into the DBNGP.
However, new legislation to broaden WA gas quality specifications was passed by the WA Government on 18 November 2009, which will now allow fields such as Macedon to supply the domestic market. While Macedon was the only substantial field that had been affected by the WA rules prior to the introduction of this new Bill, the development of this field could deliver approximately 20% of the state’s daily gas demand. In time, the changes could also facilitate the development of other offshore fields.
9.5 Taxation reform to assist small exploration companies Taxation reform is another means by which the government could intervene to increase domestic gas supply. This could be of particular benefit to junior gas explorers, whom are disadvantaged by the current tax system. While a ‘flow-through’ share scheme is current government policy, it has yet to be implemented and still remains one option to incentive junior gas explorers. A review of the resource and company tax regimes (particularly around depreciation) could be undertaken to improve the economics of gas projects. The fiscal regime is seen by the industry as a key determinant of project economics.
9.6 Provision of infrastructure supporting exploration and development
Another means by which the government can assist in the increasing domestic gas supply is to fund the development of supporting infrastructure for exploration and development projects. This could include funding for roads, pipes, housing for staff and contractors and community centres. Relieving gas field developers of these ancillary costs, and assisting in the attraction and keeping of staff and contractors, can greatly increase the likelihood of a successful development.
member firms affiliated with KPMG International, a Swiss cooperative. All rights reserved. Liability limited by a scheme approved under Professional Standards Legislation.
10 Outlook for the Australian natural gas market
10.1 Short term outlook In the short term, the outlook for the natural gas market is the following:
• Greater sophistication in gas trading across all market participants, especially for those in the east coast market as they translate lessons learned from the Victorian market into trading strategies in other markets;
• On the east coast there will be a continued move (by both suppliers and customers) towards short term gas supply contracts, away from the typical 15+ year contracts, as confidence in Australian gas supplies and caution over CPRS cost pass-through mechanisms persist. The opportunity cost of selling into the global LNG market is also a driver in this regard. The supply and demand balance will remain comfortable and prices should remain where they are;
• On the West Coast, gas supply and demand balance will remain tight overall, however the short term contract may be more lax than the long term contract market. Most customers will still prefer long term contracts (15+ years) as security of supply is their main concern. However, suppliers will be tending towards short term contracts for domestic gas customers, and long term contracts for LNG export customers.
• The NT gas supply and demand balance will remain tight, the Blacktip supply contract accommodating growth in demand but not a major gas utilising project.
• Focus of government attention on the West Coast and NT is on securing adequate domestic gas supply for the medium and long term. Their focus in the East is laying the foundations for the successful establishment of a CSG to LNG export industry in QLD and building infrastructure to allow greater transport of QLD CSG gas to the southern markets.
• Standardisation of market processes and of gas quality specifications, and increasing gas market transparency, should aid in market development across each of the three regional gas markets, but particularly on the West coast.
10.2 Medium term outlook In the medium term, the outlook for the natural gas market is the following:
• On the east coast, investment in infrastructure supporting the increasing prominence of GFG in the energy mix, in response to both the CPRS (gas will become more cost competitive against coal as a fuel choice) and enhanced RET (GFG used to back up PPAs from wind farms as a consequence of wind’s intermittent nature). Gas should continue to set the marginal price of generation. Greater focus will also be placed on commercialising NSW’s CSG reserves, and building infrastructure to support, including consideration towards an LNG plant in Newcastle.
• On the west coast, tightness in the gas market will ease as new projects are developed. The Devil Creek gas project will boost the State’s production capacity by more than 20% when it
member firms affiliated with KPMG International, a Swiss cooperative. All rights reserved. Liability limited by a scheme approved under Professional Standards Legislation.
commences production in 2011. Several other projects which, together could almost double the State’s gas production capacity by 2020, will have secured customers after successful active marketing for customers in years prior. The extent and pace at which these projects are developed will be determined by the extent and pace at which buyers and sellers can agree to firm contracts on terms that will enable projects to be economically developed.
• LNG projects on both the east coast, west coast and the Northern Territory should be delivering their first gas around 2014. Not all proposed LNG projects will be commercialised. Those that are will have secured Government approvals and offtake agreements early.
• Domestic gas prices across all regions in Australia will show positive tension towards alignment with the Asia Pacific LNG prices (as the LNG export industry develops on the east coast and expands on the west). However, local supply and demand pressures, alongside local cost factors (such as the CPRS) and the need to compete with coal for electricity generation will also act to shape the domestic gas price. Domestic gas reservation policies may have the effect of creating a disconnect between domestic and global gas prices. This may impact upon the extent of gas reserve commercialisation in Australia and may also impact the electricity price.
10.3 Long term outlook In the long term, the outlook for the natural gas market is the following:
• The LNG industry would represent a strong export earner and royalty revenue source for the Australian and State and Territory governments, and would foster strong investment in employment and regional and state wide development and prosperity for the entire economy.
• Market efficiency improvements through Bulletin Boards and STTM, with the oversight of AEMO. The west coast market will have matured, as gas commercialisation projects support both LNG and domestic gas supply to comfortable arrangements for both. The east coast market should further progress with price transparency mechanisms, reflective of their more advanced and interconnected infrastructure systems, and this will act to ensure efficient trade in gas.
• A derivatives market (for example, gas futures) would also be embedded in the gas market, similar to that existing in the electricity market. These initiatives are already on the drawing board with the ASX.
• The presence of an LNG industry in the Hunter region of NSW is a distinct possibility, though international shipments may be made from southern QLD instead of Newcastle Harbour, should bottlenecks (as experienced with coal exporting from the Harbour) continue to be a concern.
Figure 10.1 shows a summary of ABARE’s outlook for Australia’s gas markets in terms of production, consumption and export volumes in 2029-30 and average annual growth rates for the period from 2007-08 to 2029-30.
member firms affiliated with KPMG International, a Swiss cooperative. All rights reserved. Liability limited by a scheme approved under Professional Standards Legislation.
Table 10.1: Long-term outlook for Australia's gas markets
2029-30 Average annual growth 2007-08 to 2029-30
PJ % East coast Production 2861 6.7 Conventional gas 353 -2.2 Coal seam gas 2507 14.9 Consumption 1501 3.6 Exports 1360 - Northern Territory Production 677 4.5 Consumption 93 2.2 Exports 583 5.0 West coast Production 4968 7.1 Consumption 982 3.2 Exports 3986 9.0 Australian total Production 8505 6.7 Consumption 2575 3.4 Exports 5930 9.5 Note: Production includes imports from JPDA. Source: Australian Energy Resource Assessment, 2010.
In ABARE’s forecasts in Table 10.1, growth in gas consumption is driven by the electricity generation and mining sectors, and reflects the shift to less carbon intensive fuels in a carbon constrained environment.393 Natural gas production will grow strongly, underpinned by increasing demand in the domestic market and increasing global demand for LNG.394 LNG exports will significantly expand over the next two decades, reflecting not only Australia’s abundant gas reserves and their proximity to growing Asia-Pacific markets, but also Australia’s attractiveness as a reliable and stable destination for investment.395
member firms affiliated with KPMG International, a Swiss cooperative. All rights reserved. Liability limited by a scheme approved under Professional Standards Legislation.
A Australia’s gas resource base
A.1 Conventional gas
A.1.1 Carnarvon Basin (WA) The Carnarvon Basin accounts for 99% of WA’s gas production. It is located on Australia’s northwest continental shelf and covers an area spanning over 1,000 km of the west and northwest coast of Western Australia, from Geraldton to north of Port Headland. The onshore part of the Carnarvon Basin covers about 115,000 km², while the offshore area covers approximately 535,000 km² (with water depths up to 3,500 metres). It is partitioned into two major zones: the Northern Carnarvon Basin, and the Southern Carnarvon Basin.
The Northern Carnarvon Basin includes: the Exmouth and Wombat Plateaus; the Investigator, Exmouth, Barrow, Dampier and Beagle Sub-basins; Rankin Platform, Enderby Terrace; and the Peedamullah and Lambert Shelves. The Southern Carnarvon Basin consists of the Gascoyne, Merlinleigh, Bidgemia and Byro Sub-basins and the Bernier Platform. Three key gas projects occurring in the Carnarvon Basin are described below.
A.1.1.1 NWS Venture The Northern Carnarvon Basin is a sizeable contributor to gas production from the NWS Venture – Australia’s largest oil and gas resource development (representing a A$27 billion investment it accounts for 40% of the national oil and gas production). It is estimated that the NWS has natural gas resources of more than 3168 Gm3 (130 Tcf)1. The NWS Venture is WA’s largest producer of domestic gas (accounts for 65% of the state total). It has been producing domestic gas for WA for 25 years and LNG for international customers in the Asia Pacific region for 20 years.
The NWS Venture has six participants: BHP Billiton Petroleum (North West Shelf) Pty Ltd, BP Developments Australia Pty Ltd, Chevron Australian Pty Ltd, Japan Australia LNG (MIMI) Pty Ltd, Shell Development (Australia) Pty Ltd and Woodside Energy Ltd, who is also Operator of the North West Shelf Venture’s facilities. Woodside acquired Shell Development (Australia) Pty Ltd’s 16.67 per cent interest in the North West Shelf oil interests in May 2008. The China National Offshore Oil Corporation is also part of the North West Shelf Venture but does not have an interest in its infrastructure.
A.1.1.2 Pluto LNG Project Also located in the Northern Carnarvon Basin, Woodside’s A$12 billion Pluto LNG Project is expected to become the fastest developed LNG project in the world, since discovery of the field in 2005 to first gas forecast for late 2010.
The project will process gas from the Pluto and Xena gas fields. The Pluto field is estimated to contain a total dry gas recoverable reserve volume of 4.4 Tcf, whilst the Xena field (which will be incorporated into the project at a later date) is estimated at 0.6 Tcf.
member firms affiliated with KPMG International, a Swiss cooperative. All rights reserved. Liability limited by a scheme approved under Professional Standards Legislation.
The Pluto LNG Project is underpinned by 15-year sales agreements with Kansai Electric and Tokyo Gas. Both companies became project participants in January 2008, with each acquiring a 5% interest in the foundation project. Three LNG trains are planned.
A.1.1.3 Gorgon Gas Project JV The A$43b Gorgon Gas Project proposed petroleum project was given the green light by the WA Government in September 2009. It involves the development of the Greater Gorgon gas field located in the Carnarvon Basin, and three-five LNG trains on Barrow Island. The Project is being undertaken as a joint venture between Chevron (operator and approximately 47% interest in the project), and ExxonMobil (25%), Shell (25%), Osaka Gas (1.25%), Tokyo Gas (1%) and Chabu Electric (0.417%).
The Gorgon Project will produce 15mtpa of LNG, with first gas planned for export by 2014. Under arrangements with the WA state government, Gorgon must reserve 2,000 PJ of natural gas for supply to the domestic market (up to 300 TJ/d). Deliveries of domestic gas would start around the time of the 3rd LNG train development.
The five fields belonging to the Greater Gorgon area are the Gorgon, Chrysaor, Dionysus, West Tryal Rocks and Spar fields. Up to 13.8 Tcf of hydrocarbon reserves have been certified as proven in the Greater Gorgon area. Conventional wisdom is that the Greater Gorgon area contains over 40 Tcf of gas.
A.1.1.4 Wheatstone LNG Chevron discovered Wheatstone in August 2004 and in March 2008 it announced its intention to develop the gas resource at a greenfield onshore LNG and domestic gas project. The resource is large enough to underpin two 4.3 Mtpa LNG processing trains, and a domestic gas plant. In December 2008, Ashburton North was announced as the preferred site for the LNG hub. FEED commenced in August 2009.
In December 2009, Chevron and Tokyo Electric Power Company (TEPCO) signed a Heads of Agreements (HOA) for the delivery of 4.1 Mtpa of LNG for up to 20 years from the Wheatstone project.396 Under the agreements, TEPCO also intends to acquire 15 percent of Chevron’s equity share in the licenses over the Wheatstone field and an 11.25 percent interest in the Wheatstone natural gas processing facilities to be developed onshore near Onslow in Western Australia.397 Chevron currently has 100% interest in the Wheatstone project.398
A.1.1.5 Santos interests Santos has a 33.4% interest in the Mutineer-Exeter field and a 45% interest in each of the John Brookes and East Spar gas fields.
396 Chevron Australia Website, http://www.chevronaustralia.com/media/mediastatements/09-12-05/Chevron_and_TEPCO_Sign_Major_Wheatstone_LNG_and_Equity_Deal.aspx, accessed 22 December 2009. 397 Ibid. 398 Ibid.
member firms affiliated with KPMG International, a Swiss cooperative. All rights reserved. Liability limited by a scheme approved under Professional Standards Legislation.
A.1.2 Browse Basin (WA) Often referred to as the ‘Sleeping Giant’, the Browse Basin is estimated to contain one-third of Australia’s offshore gas reserves (more than 50 Tcf), yet remains completely undeveloped. Isolation is the main obstacle to its development, being almost 300 km from the mainland and under 300–500 m of water. It covers approximately 140 000 km2. The Browse Basin comprises the Leveque and Yampi Shelves, the Barcoo, Caswell and Seringapatam Sub-basins and the Scott Plateau.
The most significant gas fields of the Browse Basin occur in the Caswell Sub-basin:
A.1.2.1 Woodside’s Browse Project Woodside as operator, together with its JV partners BHP Billiton (North West Shelf) Pty Ltd, BP Developments Australia Pty Ltd, Chevron Australia Pty Ltd, and Shell Development Australia Pty Ltd, are the drivers behind the development of the Torosa, Brecknock and Calliance fields with ambitions for gas to feed a LNG development.
Engineering, environmental and social impact studies for the development of a LNG plant continue. Two options remain under consideration: the State Government’s proposed LNG precinct in the James Price Point coastal area in the Kimberley or existing Woodside-operated facilities located near Karratha. Final investment decision is anticipated for early 2011.
A.1.2.2 Shell’s Prelude Floating LNG Project Shell is the 100% equity holder and operator of the WA-371-P permit, an area which covers around 1,000 sq m in the remote Browse Basin, 475km north-northeast of Broome, WA. Shell discovered the Prelude gas field in 2007 and the Concerto gas field in March 2009 within this permit area. The Prelude field has 2.5-3 Tcf of gas and about 120 million barrels of condensate.399
The Prelude Floating LNG (FLNG) project is anticipated to produce a maximum of 3.6 Mtpa of LNG, 1.3 Mtpa of condensate and 400,000 tonnes of LPG.400 A referral under the Environment Protection and Biodiversity Conservation Act 1999 (EPBC Act) was submitted in April 2008. In July 2009, Shell submitted its draft Environmental Impact Statement to the Department of Environment, Water, Heritage and the Arts, as required by the Commonwealth Minister for the Environment. This is open for public comment until 20 November 2009.401
While pending FID (which is anticipated for early 2011), the Prelude FLNG Project is now in the Front End Engineering and Design (FEED) phase of development. After the final investment
member firms affiliated with KPMG International, a Swiss cooperative. All rights reserved. Liability limited by a scheme approved under Professional Standards Legislation.
decision is made it is expected to take about five years before construction of the FLNG facility will be completed and towed to site for start-up.402
A.1.2.3 Karoon interests Karoon Gas Australia Ltd, together with its JV partner ConocoPhillips (51%), are exploring three acreage sites within the Browse Basin. Seven prospect areas have been delineated and exploration success could also lead to an Australian LNG project. Their Poseidon-1 well drilling program yielded favourable results earlier this year, however another such well yielded disappointing outcomes (less gas than anticipated). Hopes are being pinned on successful drilling at the Poseidon-2 well.
A.1.2.4 Santos interests Santos holds interests in four exploration permits in the Browse Basin, however currently has no production interests there.
A.1.3 Perth Basin (WA) The Perth Basin is a large (172,300 km2), onshore and offshore sedimentary basin, that extends about 1300 km along the south western margin of the Australian continent. It consists of the Bunbury and Dandaragan Troughs, Abrolhos, Houtman and Vlaming Sub-basins, Beagle Ridge, Dongara Terrace and Greenough Shelf.
The Perth Basin is prospective for natural gas and oil, with exploration wells, including Origin Energy/Arc Energy's Hovea 2, confirming large resources of natural gas. However, complex reservoir geology has prevented the full utilisation of these energy reserves to date.
A.1.4 Bonaparte Basin (WA) The Bonaparte Basin is the most northerly sedimentary basin in Western Australia. Straddling the border between the Northern Territory and Western Australia, it covers a total area of approximately 270,000 km2, of which 250,000 km2 is offshore. The Basin joins the Browse Basin to the west, the Money Shoals Basin to the northeast, and is bound by the Timor Trough in the north.
It is a major prospective area, the success to date is considered to be directly commensurate with the extent of exploration in the Basin. There are large number of gas fields that have not yet been developed due to their remote location, including Petrel, Tern, Sunrise and Troubadour (which were all discovered in the early 1970s).
Due to its abundant resources, close proximity to Asian markets and increasing number of major projects, the Bonaparte Basin is anticipated to rise to become one of Australia’s preeminent gas production areas.
402 Shell Website, http://www.shell.com/home/content/au-en/about_shell/what_we_do/prelude/index.html, accessed 13 November 2009.
member firms affiliated with KPMG International, a Swiss cooperative. All rights reserved. Liability limited by a scheme approved under Professional Standards Legislation.
A.1.4.1 Santos interests Santos holds five permits in the Southern Bonaparte, which contain the presently undeveloped Petrel and Tern gas fields. These fields (which are located in the Western Australian-administered waters) have estimated recoverable reserves of 1.4 Tcf.
In the Northern Bonaparte, Santos holds interests in a further three permits. These permits contain the currently undeveloped Evans Shoal (6.6 Tcf reserve managed as a JV between Santos, Shell Development (Australia), Petronas and Osaka Gas Australia), with Santos as the operator), and Caldita and Lynedoch/Barossa gas resources (both of which Santos holds a 40% interest, with ConocoPhillips being the operator).
A.1.4.2 ConocoPhillips interests ConocoPhillips operates the Caldita and Barossa fields. Once the presence of gas was confirmed in the western part of the Caldita structure in 2007, it was plugged and abandoned as planned (for possible development at a later date). Likewise, once drilling confirmed the presence of gas at Barossa-1 in 2006, it was also plugged and abandoned as planned.
ConocoPhillips is also the operator of the Bayu-Undan offshore gas fields, which has estimated recoverable reserves of 3.4 Tcf. Alongside ConocoPhillips, participants in the Bayu-Undan JV are Eni, Santos, Inpex and Tokyo Timor Sea Resources Pty.
A.1.4.3 Woodside interests Woodside has a large project on its book: the Greater Sunrise Gas Development. With estimated recoverable reserves of 7.7 Tcf, this project includes the development of the Sunrise and Troubadour fields.
Development options include brownfield expansion of the Wickham Point Bayu-Undan LNG plant in Darwin (current capacity at 3.5 Mtpa), plus consideration towards a world first floating LNG facility. Development is contingent on the project receiving legal, regulatory and fiscal certainty from the East Timorese and Australian governments.
A.1.4.4 Eni Australia interests Eni Australia began developing the Blacktip field in 2006. It has estimated recoverable reserves of 1.1 Tcf. It has signed a sales and purchase agreement with the Northern Territory’s Power and Water Corporation for the supply of gas from the field.
A.1.5 Gippsland Basin (VIC) The Gippsland Basin is a sedimentary basin that lies mostly offshore and covers 40,000 km2 on the continental shelf on the south-east corner of Victoria. With estimated gas reserves at 4779.5 Bcf, it is the source of 75% of Victoria’s total gas production. To date, the developed fields in the Gippsland Basin have produced about 6.5 Tcf of gas, which represents about 60% of the initial gas reserves.
member firms affiliated with KPMG International, a Swiss cooperative. All rights reserved. Liability limited by a scheme approved under Professional Standards Legislation.
There are several gas fields contained in the Gippsland Basin including offshore Kipper, Sole, Patricia Baleen, Longtom and Basker-Manta.
A.1.5.1 Kipper Kipper is currently Victoria’s largest known undeveloped gas resource, having estimated reserves of 620 Bcf (or 610 PJ of 2P reserves)403. It is being operated as a JV comprising Esso Australia as operator (32.5%), Santos (35% interest) and BHP Billiton (32.5% interest).404 First gas production is anticipated for mid 2011, with the field having an estimated lifespan of 15 years.405
A.1.5.2 Longtom The Longtom gas field is owned entirely by Nexus Energy. The field is located approximately 30 km south of the Victorian coast near Orbost.406 It has a contingent resource estimate of 435 PJ of gas, of this 350 PJ has been booked as proved and probable reserves.407 A gas sales agreement for Longtom was signed with Santos in December 2005, where Santos agreed to process up to 450 PJ of raw gas from the Longtom field through its existing Patricia Baleen facilities near Orbost, Victoria. The project began gas production in October 2009.
A.1.5.3 Basker-Manta-Gummy The Basker-Manta-Gummy gas project (BMG) comprises of estimated reserves of 384 PJ of gas.408 The BMG project is being operated as a JV comprising Anzon Australia Limited as the operator (40%), Beach Petroleum Limited (30%), CIECO Exploration and Production (Australia) Pty Ltd (20%) and Sojitz Energy Australia Pty Ltd (10%).409 Anzon Australia Limited is proposing the development of a floating 70 km pipeline to shore with the first gas production anticipated in 2011.410
A.1.5.4 Sole The Sole gas project proposes the development of a gas field to be located approximately 38 km offshore the coast of east Gippsland.411 Santos has 100% interest in the Sole gas project and construction is intended to commence in 2010.412
403 Department of Primary Industries, Oil and Gas Industry Activity, http://www.dpi.vic.gov.au/dpi/nrenmp.nsf/LinkView/4091419D117B5E654A2569B2002022F456D4D5E9AEF563E84A256A800011E5D6, 26 June 2009. 404 Santos Website, Kipper, http://www.santos.com/Content.aspx?p=344 , 14 October 2009. 405 Ibid at 403. 406 Ibid. 407 Nexus Energy Website, VIC/L29 (Longtom Gas Project) Nexus 100%, http://www.nexusenergy.com.au/2369550/nexus-energy-oil-gas-exploration-and-productio.htm, 2009. 408 NERA Economic Consulting, The Gas Supply Chain in Eastern Australia: A Report to the Australian Energy Market Commission, March 2008 at 10. 409 Ibid at 408 at 20. 410 Ibid at 403. 411 Ibid. 412 Santos website, Gippsland Basin, http://www.santos.com/Content.aspx?p=192, 14 October 2009.
member firms affiliated with KPMG International, a Swiss cooperative. All rights reserved. Liability limited by a scheme approved under Professional Standards Legislation.
A.1.5.5 Patricia Baleen The Patricia Baleen gas project is located south of Orbost which is 23 km off the coast of Victoria.413 Santos had a 100% interest in the VIC/L21 permit which includes the Patricia Baleen gas fields and gas production commenced in 2003.414 Currently the capacity is as around 43 TJ a day,415 however the field is near depletion. It is anticipated that the onshore infrastructure will be used to process gas from other suppliers in the region.
A.1.5.6 Turrum The Turrum oil and gas field lies offshore the southern coast of Australia, holding an estimated 1 Tcf of gas.416 The Turrum project is being operated as a JV comprising Esso Australia as the operator (50%) and BHP (50%).417 First gas sales are anticipated to begin in 2015 at approximately 200 Mcf a day.418
A.1.5.7 Golden Beach The Golden Beach gas field lies approximately 4km off the ninety mile beach in Victoria, near the Golden Beach township.419 The estimated reserves for the field are 30-35 PJ.420 The Cape Energy Group (CEG) owns 100% working interest in the permit VIC/RL1 which contains the Golden Beach gas field.421 CEG proposed to develop the Golden Beach gas project in 2007. This project would result in the development of the first field in the Victorian waters, however, the project is currently placed on hold as a result of investment considerations.422
413 Santos website, Patricia- Baleen, http://www.santos.com/Content.aspx?p=227, 14 October 2009. 414 Ibid. 415 Ibid. 416 Department of Primary Industries, Oil and Gas Industry Activity, http://www.dpi.vic.gov.au/dpi/nrenmp.nsf/LinkView/4091419D117B5E654A2569B2002022F456D4D5E9AEF563E84A256A800011E5D6, 26 June 2009. 417 ExxonMobil Website, ExxonMobil Announces $1.1 Billion Turrum Field Development, http://www.businesswire.com/portal/site/exxonmobil/index.jsp?ndmViewId=news_view&ndmConfigId=1001106&newsId=20080725005343&newsLang=en, 25 July 2008. 418 Reuters Website, Exxon, BHP Approve $1.3 Billion Australia Turrum project, http://www.reuters.com/article/ousivMolt/idUSSYD33339720080725, 25 July 2008. 419 Uhde Shedden, Golden Beach Development: Gippsland Basin, Victoria, Australia, http://www.sheddenuhde.com/UploadFiles/e1/e165917e-78e9-4059-8537-7b749631747b.pdf; PESA: Australia in Focus, Petroleum Projects Spark Life into Regional Victoria, http://www.pesa.com.au/publications/pesa_news/oct_06/govtsupp/govsupp_6.htm 420 Ibid at 416. 421 Petroleum Title System, Offshore Tenements, http://www.dpi.vic.gov.au/DPI/nrenmp.nsf/LinkView/F457F0F2E28849A5CA2573E7007DF07E8B3DA072DA032386CA2573DF001C56C6/$file/Offshore_Petroleum.pdf, 5 October 2009 at 9 422 Ibid at 416.
member firms affiliated with KPMG International, a Swiss cooperative. All rights reserved. Liability limited by a scheme approved under Professional Standards Legislation.
A.1.5.8 Bream A The Bream A gas project comprised the creation of a 51 km pipeline with the capacity to carry in excess of 200 Mcf a day to join the Bream gas field to the Langford processing facilities.423 The project also included modifications to the Bream A platform to enable gas extraction from the Bream field.424 The project is a JV between Exxon Mobil and BHP Billiton and was inaugurated on 12 December 2002.425
A.1.6 Otway Basin (VIC) The Otway Basin is a large, northwest trending basin located on the south western corner of Victoria and the South east corner of South Australia. Exploration is mature onshore and immature offshore, with more than 200 wells in total. Commercial gas discoveries include the offshore Thylacine, Geographe, Minerva and Casino fields, and numerous smaller onshore gas fields (including Wallaby Creek, North Paarette, Myler and Katnook). Undeveloped gas discoveries include the Martha and Henry fields.
A.1.6.1 Otway The Otway gas project entails the development of the Geographe field (55 km from Port Campbell) and Thylacine field (70 km from Port Campbell) in Victoria.426 The combined reserves of the fields are approximately 950 Bcf of raw gas, 12.2 million barrels of condensate and 1.7 million tonnes of LPG.427 The fields commenced production in 2007 and are being operated as JV arrangement between Woodside (51.55%), Origin (30.75%), Benaris International (12.7%) and CalEnergy Gas (5%).428 The two fields combined have an estimated lifespan of 10 years.429
A.1.6.2 Minerva The Minerva gas project is located about 10 km offshore Port Campbell, Victoria.430 The project is a JV between BHP Billiton (operator) and Santos who respectively hold 90% and 10% interests in the VIC/L22 permit which contains the Minerva gas field.431 The Minerva gas field commenced production late 2004. It currently produces around 130-140 TJ of gas a day and has estimated reserves of 301 Bcf.432
423 Department of Primary Industries, Oil and Gas Industry Activity, http://www.dpi.vic.gov.au/dpi/nrenmp.nsf/LinkView/4091419D117B5E654A2569B2002022F456D4D5E9AEF563E84A256A800011E5D6, 26 June 2009. 424 Ibid. 425 Ibid. 426 Woodside website, Otway, http://www.woodside.com.au/Our+Business/Production/Australia/Otway+Southern+Australia.htm. 427 Ibid. 428 Ibid. 429 Ibid at 423. 430 Santos Website, Minerva, http://www.santos.com/Content.aspx?p=224, 14 October 2009. 431 Ibid. 432 Ibid at 423.
member firms affiliated with KPMG International, a Swiss cooperative. All rights reserved. Liability limited by a scheme approved under Professional Standards Legislation.
A.1.6.3 Casino The Casino gas project is situated 250 km southwest of Melbourne.433 The project is a JV with Santos holding a 50% operated interest in the VIC/L24 permit containing the Casino gas field and AWE and Mitsui holding a 25% interest each.434 The Casino field came on-stream in early 2006 and as at year-end 2007 it was producing 96 TJ a day.435 Currently, the Casino gas field has an estimated recoverable gas reserve of 280 Bcf.436
A.1.6.4 La Bella The La Bella field lies approximately 55 km southwest of Port Campbell.437 It is currently undeveloped and is estimated to have 210 Bcf of gas reserves.438 BHP (operator) and Santos respectively hold a 90% and 10% interest in the VIC/RL7 permit which contains the La Bella gas field.439
A.1.6.5 Henry The Henry gas project is situated in the southwest of Port Campbell, approximately 18 km off the coastline of Victoria.440 The VIC/P44 permit contains the Henry gas field and is being operated by Santos (50%) on behalf of AWE (25%) and Mitsui (25%).441 The estimated proven and probable reserves for this field are 150PJ with the first gas production expected in the first half of 2010.442
A.1.7 Bass Basin (TAS) The Bass Basin is a northwest trending basin situated offshore Tasmania and expands across 41,000 square kilometres.443 The only field producing conventional gas currently is the Yolla gas field. The Yolla gas field is situated 147 km off Victoria’s south coast and contains an estimated reserve of 438 Bcf of gas.444 The Bass gas project in the Yolla field commenced in 2006 and is a JV operated by
433 Santos Website, Casino, http://www.santos.com/Content.aspx?p=207, 14 October 2009. 434 Ibid. 435 Ibid. 436 Department of Primary Industries, Oil and Gas Industry Activity, http://www.dpi.vic.gov.au/dpi/nrenmp.nsf/LinkView/4091419D117B5E654A2569B2002022F456D4D5E9AEF563E84A256A800011E5D6, 26 June 2009. 437 C.W. Luxton et al, APEA Journal, The La Bella and Minerva Gas Discoveries, Offshore Otway Basin, Volume Vol. 35, 1995 at 405-417. 438 Australian Government Department of Industry, Tourism and Resources, Release of Offshore Petroleum Exploration Areas Australia 2006 at 18. 439 Department of Industry, Tourism and Resources, Oil and Gas Resources Of Australia, 2003 at 207; Santos Website, Otway Basin, http://www.santos.com/activities-browser/exploration-acreage/otway-basin.aspx, 14 October 2009. 440 Ibid at 436. 441 Santos Website, Henry, http://www.santos.com/Content.aspx?p=343, 14 October 2009. 442 Ibid. 443 Australian Government, Geoscience Australia, Bass Basin, http://webmap.ga.gov.au/provexplorer/provinceDetails.do?eno=22295, 2004. 444 Origin Website, BassGas Project, http://www.originenergy.com.au/1532/BassGas-Project; Department of Primary Industries, Oil and Gas Industry Activity, http://www.dpi.vic.gov.au/dpi/nrenmp.nsf/LinkView/4091419D117B5E654A2569B2002022F456D4D5E9AEF563E84A256A800011E5D6, 26 June 2009.
member firms affiliated with KPMG International, a Swiss cooperative. All rights reserved. Liability limited by a scheme approved under Professional Standards Legislation.
Origin Energy (42.5%) on behalf of AWE (30%), CalEnergy (15%) and Wandoo Petroleum Mitsui Group (12.5%).445
A.1.8 Cooper Basin (SA) The Cooper Basin is situated in the southwest of Queensland and northeast of South Australian and expands across 130,000 square kilometres.446 It has around 160 gas fields currently on production.447 Santos is the largest producer in the Cooper Basin with an estimated proved and probable reserve of 9.7 Tcf.448 Santos holds operated interests of 66.6% in the Cooper Basin. Other companies holding interest in the Basin include Beach (20.2%) and Origin Energy (13.2%).449
A.1.9 Amadeus Basin (NT) The Amadeus Basin lies largely within the southern quarter of Northern Territory and extends approximately 150 km into Western Australia.450 It expands across a total area of 170,000 square kilometres, hosting 2 producing gas fields (Mereenie and Palm Valley) as well as a number of potential gas producing fields.451 The Mereenie field is operated by Santos (65%) and Megallan holds the remaining interest (35%).452 The Palm Valley field is operated by Megallen (52%) and Santos holds the remaining interest (48%).453 Santos also holds interest in permits covering the Dingo gas field.454
A.2 Coal Seam Gas (CSG)
A.2.1 Surat Basin (QLD & NSW) The Surat Basin covers 270,000 square kilometres in Queensland and northern New South Wales.455 It commenced commercial production of CSG in January 2006 from the Kogan North coal seam gas
445 NERA Economic Consulting, The Gas Supply Chain in Eastern Australia: A report to the Australian Energy Market Commission, March 2008 at 19. 446 Encyclopaedia Britannica, Cooper Basin, http://www.britannica.com/EBchecked/topic/136306/Cooper-Basin, 15 October 2009. 447 Santos Website, Cooper Basin (Overview), http://www.santos.com/activities-browser/production-processing/cooper-basin-overview-.aspx, 14 October 2009. 448 M. Perland & L Mewett, The Cooper Basin – Australia’s Central Gas Hub, http://gas-today.com.au/news/the_cooper_basin_-_australias_central_gas_hub/00283/, November 2008. 449 NERA Economic Consulting, The Gas Supply Chain in Eastern Australia: A Report to the Australian Energy Market Commission, March 2008 at 19. 450 Australian Government, Geoscience Australia, Amadeus basin, http://www.ga.gov.au/oceans/ea_Amadeus.jsp, July 2008. 451 Northern Territory Government, Minerals and Energy – Northern Territory Geological Survey: Amadeus Basin, http://www.nt.gov.au/d/Minerals_Energy/Geoscience/index.cfm?Header=Amadeus%20Basin, April 2009. 452 Santos Website, Mereenie, http://www.santos.com/Content.aspx?p=223, 14 October 2009. 453 Ibid. 454 Ibid. 455 NSW Department of Primary Industries, Minerals and Petroleum: Sydney Basin – Geological Overview, http://www.dpi.nsw.gov.au/minerals/geological/overview/regional/sedimentary-basins/sydbasin, 2005.
member firms affiliated with KPMG International, a Swiss cooperative. All rights reserved. Liability limited by a scheme approved under Professional Standards Legislation.
area and later from Berwyndale South coal seam gas area in May 2006.456 In addition, CSG is currently being produced from several areas between Dalby and Chinchilla.457 In recent years the Surat Basin has gained increased importance as a source of CSG because the coal is buried shallower within the Basin, resulting in lower drilling and completion costs.458 The certified proved and probable reserves within the Basin have grown considerably in recent years with Arrow Energy Limited owning 2,434.4 PJ, Origin Energy owning 698.30 PJ and Queensland Gas Company Limited owning 5,537.6 PJ.459
A.2.2 Bowen Basin (QLD) The Bowen Basin is the origin of Queensland’s coal seam gas industry and has been the major supplier of CSG to the Queensland market to date.460 The Basin expands across over 60,000 square kilometres of central Queensland running from Collinsville to Theodore.461 It commenced production from the Dawson River coal seam gas area in 1996 and from Fairview coal seam gas area in 1998.462 Currently, CSG is produced from the central and southern areas of the Basin.463 The certified proved and probable CSG reserves in the Basin are increasing steadily with Santos Ltd owning 4,391 PJ, Origin Energy owning 1,549.4 PJ, Arrow Energy Limited owning 969.30 PJ and Anglo Coal (Dawson) Limited owning 134.5 PJ.464 In addition, AGL has working interest of 50% in the Moranbah gas project and working interest ranging between 0.0375% and 75% in the Spring Gully project.465
A.2.3 Galilee Basin (QLD) The Galilee Basin is the last remaining undeveloped major coal province in Queensland. This Basin expands over approximately 247,000 square kilometres in central Queensland.466 In July 2008 AGL Energy Limited announced an investment in Glenaras pilot project in the Galilee Basin and it currently owns a 50% interest in the exploration permit ATP 529P.467 In addition, in September 2009 COMET Ridge were awarded with 100% ownership of a permit to drill for CSG in the Galilee Basin.468 Drilling is planned to commence in 2009/10.469
456 Queensland Government Mining Journal, Queensland’s Coal Seam Gas Industry Continues to Brighten, March 2008 at 43. 457 Ibid at 456. 458 Queensland Government, Queensland’s Coal Seam Gas Overview, August 2009 at 4. 459 Ibid at 458 at 3. 460 Ibid at 458 at 4. 461 Mining Communities Research Exchange, Bowen Basin, http://www.bowenbasin.cqu.edu.au/, accessed 15 October 2009. 462 Ibid at 458 at 4. 463 Ibid. 464 Ibid at 458 at 3. 465 AGL Energy Limited, 2009 Full Year Results: 12 Months to 30 June 2009, 20 August 2009 at 65. 466 International Coalbed and Shale Gas Symposium, Recent Coalbed Methane Exploration in the Galilee Basin, Queensland, Australia, 2008 at 2. 467 Ibid at 465. 468 Coal Mining, Comet Ridge to Drill Galilee Basin Coal Seams, http://www.miningcoal.com.au/article/Comet-Ridge-to-drill-Galilee-Basin-coal-seams/497356.aspx, 7 October 2009. 469 Comet Ridge Website, Key Projects: Galilee Basin, http://www.come tridge.com.au/Projects_Galilee.htm, 2009.
member firms affiliated with KPMG International, a Swiss cooperative. All rights reserved. Liability limited by a scheme approved under Professional Standards Legislation.
A.2.4 Sydney Basin (NSW) The Sydney Basin forms a part of the Sydney-Gunnedah-Bowen Basin.470 It extend from Southern coastal New South Wales to Central Queensland, covering approximately 36,000 square kilometres onshore and 28,000 square kilometres offshore.471 As at 2005 the Basin comprised 35 CSG wells with an estimated 5297 Bcf of potentially recoverable CSG.472 Currently, AGL has a 100% working interest in permits in the Camden Gas project and the Hunter Gas project in the Sydney Basin.473
A.2.5 Gunnedah Basin (NSW) The Gunnedah Basin forms a part of the Sydney-Gunnedah-Bowen Basin.474 It covers approximately 15,000 square kilometres in central New South Wales from Gulgong to Narrabri.475 As at 2005 the Basin had an estimated 5156 Bcf of potentially recoverable CSG.476 Santos and Eastern Star Gas have a combined CSG permit covering an area of around 63,000 square kilometres in the Gunnedah Basin with an estimated resource potential of above 50 Tcf.477
470 NSW Department of Primary Industries, Minerals and Petroleum: Sydney Basin – Geological Overview, http://www.dpi.nsw.gov.au/minerals/geological/overview/regional/sedimentary-basins/sydbasin, 2005. 471 Australian Government: Geoscience Australia, Sydney Basin, http://webmap.ga.gov.au/provexplorer/provinceDetails.do?eno=22351, 2006. 472 NSW Department of Primary Industries, Minerals and Petroleum: Coal Seam Methane in NSW, http://www.dpi.nsw.gov.au/minerals/geological/overview/regional/sedimentary-basins/methanensw, 2005. 473 AGL Energy Limited, 2009 Full Year Results: 12 Months to 30 June 2009, 20 August 2009 at 65. 474 NSW Department of Primary Industries, Minerals and Petroleum: Gunnedah Basin – Geological Overview, http://www.dpi.nsw.gov.au/minerals/geological/overview/regional/sedimentary-basins/gunnedah, 2005. 475 Ibid. 476 NSW Department of Primary Industries, Minerals and Petroleum: Coal Seam Methane in NSW, http://www.dpi.nsw.gov.au/minerals/geological/overview/regional/sedimentary-basins/methanensw, 2005. 477 Santos Website, Gunnedah Basin, http://www.santos.com/activities-browser/exploration-acreage/gunnedah-basin.aspx, 2009.
member firms affiliated with KPMG International, a Swiss cooperative. All rights reserved. Liability limited by a scheme approved under Professional Standards Legislation.
A.2.6 Clarence Moreton Basin (NSW & QLD) The Clarence Moreton Basin is located in the northeast of New South Wales and the southeast of Queensland. It lies largely onshore, expanding across an area of approximately 27,000 square kilometres.478 The first well in the Clarence Moreton Basin was drilled in 1997 and to date the Basin remains largely underdeveloped, holding approximately 247 PJ of CSG reserves.479 Metgasco currently has a strong presence in the Clarence Moreton Basin, owning permits for approximately 6,000 square kilometres.480 On 2 October 2009 Metgasco announced that it had entered a conditional agreement with Molopo Australia, allowing it to acquire the remaining interests in PEL 426 and PEL 13.481 This acquisition would secure Metgasco a 100% ownership of the CSG permits in the Clarence Moreton Basin.482
478 Australian Government Geoscience Australia, Clarence-Moreton Basin, http://webmap.ga.gov.au/provexplorer/provinceDetails.do?eno=21916, July 2008. 479 G. baker & S. Slater, PESA Eastern Australasian Basins Symposium III, Sydney, The Increasing Significance of Coal Seam gas in Eastern Australia, 14-17 September 2008 at 385. 480 Proactive Investors Australia, Metgasco Drills Exploration Well Corella – E 17, http://www.proactiveinvestors.com.au/companies/news/1957, 13 July 2009. 481 Business Spectator, Metgasco Buys Clarence Moreton basin Interests for $7m + Royalty, http://www.businessspectator.com.au/bs.nsf/Article/Metgasco-buys-Clarence-Moreton-Basin-interests-for-WHVVQ!OpenDocument&Click=, 5 October 2009. 482 Gas Today Australia, Metgasco 100 per cent interested in Clarence Moreton CSG, 5 October 2009.
member firms affiliated with KPMG International, a Swiss cooperative. All rights reserved. Liability limited by a scheme approved under Professional Standards Legislation.
B Long term and medium term LNG contracts in force in 2008 (duration > 4 yrs) Ref. Trade Export Seller Import Buyer Nominal Duration Type Comments
member firms affiliated with KPMG International, a Swiss cooperative. All rights reserved. Liability limited by a scheme approved under Professional Standards Legislation.
Ref. Trade Export Seller Import Buyer Nominal Duration Type Comments
ACQ (Mtpa) of
contract
EqG-US Equatorial Guinea- Equatorial Guinea Equatorial Guinea Lake Charles, LA BGGM 3.4 2007/2023 F.O.B.
member firms affiliated with KPMG International, a Swiss cooperative. All rights reserved. Liability limited by a scheme approved under Professional Standards Legislation.
Ref. Trade Export Seller Import Buyer Nominal Duration Type Comments
ACQ (Mtpa) of
contract
NO-US Norway-U.S.A. Hammerfest StatoilHydro, RWE, Cove Point Statoil Natural Gas ~1.75 2006/2026 D.E.S. Hess, Petoro NO-SP Norway - Spain Hammerfest StatoilHydro, RWE, Spain Iberdrola 1.13 2006/2023 D.E.S. Hess, Petoro AE-JP Abu Dhabi-Japan Das Island Adgas Higashi-Ohgishima Tokyo Electric 4.30 1994/2019 D.E.S. Futtsu US-JP U.S.A.-Japan Kenai Phillips Marathon Negishi, Futtsu Tokyo Gas 1.22 1989/2009 D.E.S. Sodegaura Tokyo Electric TT I-SP T&T-Spain or U.S.A. Point Fortin Atlantic LNG Cart., Ba., H., Bil. Gas Natural 1.06 1999/2018 F.O.B. Aprovisionamientos TT II-SP " " Atlantic 2/3 " Gas Natural sdg 0.65 2002/2023 " TT-SP T&T-Spain Point Fortin Repsol Cartagena Gas Natural sdg 1.13 2006/2023 D.E.S.
TT-US 1 T&T-U.S.A. Point Fortin Atlantic LNG of T&T Everett/Penuelas GDF SUEZ 1.63 1999/2018
TT-US 2 " " Atlantic LNG 2/3 " " 0.34 2000/2020 TT-US 3 " " " USA, Other BP Gas Marketing 0.8 2002/2021 F.O.B. TT-US 4 " " PFLE, Trinling Elba Island, GA BGLS 2.2 2004/2020 " Lake Charles, LA TT-US 5 " " BP Elba Island, GA Marathon LNG 1.2 2005/2010 D.E.S. option to supply Marketing TT-US " " USA, Other BP 2.5 2006/2025 " TT-US " " Atlantic LNG 4 BG 1.50 2005/2026 " TT-US " " NGC 0.58 2006/2026 " BR-JP Brunei-Japan Lumut Brunei LNG Sodegaura, Negishi Tokyo Gas 6.01 1993/2013 D.E.S. Senboku, Futtsu Osaka Gas Higashi-Ohgishima Tokyo Electric
member firms affiliated with KPMG International, a Swiss cooperative. All rights reserved. Liability limited by a scheme approved under Professional Standards Legislation.
Ref. Trade Export Seller Import Buyer Nominal Duration Type Comments
ACQ (Mtpa) of
contract
MY-JP 1 Malaysia-Japan Bintulu Malaysia LNG Sodegaura Tokyo Gas 7.4 1983/2003 F.O.B./D.E.S. Extension 2018 Higashi-Ohgishima Tokyo Electric Futtsu, Negishi MY-JP 2 " " " Niigata Tohoku Electric 0.50 1996/2016 D.E.S. MY-JP 3 " " " Sodeshi Shizuoka Gas 0.45 1996/2016 " MY-JP 6 " " " Fukuoka, Nagasaki Saibu Gas 0.39 1993/2013 " MY-JP 8 " " " Sodegaura Tokyo Gas 2.1 1995/2015 " Negishi Osaka Gas Senboku, Himeji Kansai Electric Sakai Toho Gas Chita, Ohgishima MY-JP 9 " " " Shin-Minato Gas Bureau, 0.15 1997/2016 " City of Sendai
MY-JP 10 " " Malaysia LNG TIGA Niigata Japan Petroleum 0.48 2002/2021 "
Explorat° Co Ltd MY-JP 11 " " " Sodegaura Tokyo Gas 0.68 2004/2024 F.O.B./D.E.S. Negishi Toho Gas Ohgishima Osaka Gas Chita, Senboku Himeji
member firms affiliated with KPMG International, a Swiss cooperative. All rights reserved. Liability limited by a scheme approved under Professional Standards Legislation.
Ref. Trade Export Seller Import Buyer Nominal Duration Type Comments
ACQ (Mtpa) of
contract
MY-KR 1 Malaysia-Korea Bintulu Malaysia LNG Dua Pyeong-Taek Kogas 2 1995/2015 F.O.B. In-Chon Tong-Yeong
MY-KR 2 " " Malaysia LNG TIGA " " 1.5 2003/2010 D.E.S.
MY-KR 3 " " " " " 1.5 2008/2028 " MY-TW Malaysia-Taiwan Bintulu Malaysia LNG Dua Yung-An C.P.C. 2.25 1995/2015 D.E.S. ID-JP 1 Indonesia-Japan Bontang Pertamina Senboku Kansai Electric 8.45 1977/2000 D.E.S. Extension 2010 Himeji, Chita Chubu Electric Tobata, Ohita Kyushu Electric Sakai Osaka Gas Kawagoe Toho Gas Yokkaichi Nippon Steel ID-JP 2 " Blang Lancang " Higashi-Ohgishima Tokyo Electric 0.96 2005/2009 F.O.B. Futtsu, Niigata Tohoku Electric ID-JP 3 " Bontang " Chita-Senboku Chubu Electric 3.52 1983/2003 " Extension 2011 Himeji Kansai Electric Sakai Osaka Gas Yokkaichi Toho Gas Kawagoe ID-JP 8 " " " Senboku Osaka Gas 2.31 1994/2013 " Himeji Tokyo Gas Sodegaura Toho Gas Chita, Ohgishima
member firms affiliated with KPMG International, a Swiss cooperative. All rights reserved. Liability limited by a scheme approved under Professional Standards Legislation.
Ref. Trade Export Seller Import Buyer Nominal Duration Type Comments
ACQ (Mtpa) of
contract
ID-JP 9 Indonesia-Japan Bontang Pertamina Hatsukaichi Hiroshima Gas 0.39 1996/2015 D.E.S. Kagoshima Nippon Gas Senboku, Himeji Osaka Gas ID-KR 2 Indonesia-Korea B L-Bontang Pertamina Pyeong-Taek Kogas 2 1994/2014 F.O.B.
In Chon, Tong-Yeong
ID-KR 3 " Bontang " " " 1 1998/2017 " ID-KR 4 " Tanah Merah Tangguh PSC GwangYang Posco 0.55 2005/2024 D.E.S. ID-KR 5 " Tanah Merah Tangguh PSC GwangYang K-Power 0,6 2006/2026 D.E.S. Contractor Parties ID-MX1 Indonesia-Mexico Tanah Merah Tangguh PSC Energia Costa Azul Sempra LNG 3.9 2008/2029 D.E.S. Contractor Parties ID-TW 1 Indonesia-Taiwan Bontang Pertamina Yung-An C.P.C. 1.57 1990/2009 D.E.S. ID-TW 2 " " " " " 1.84 1998/2017 " Q-B Qatar-Belgium Ras Laffan RasGas Zeebrugge Distrigas 2.05 2007/2027 D.E.S. Q-IN Qatar-India Ras Laffan RasGas Dahej Petronet LNG 7.5 2004/2028 Q-JP 1 Qatar-Japan Ras Laffan Qatargas Chita/Kawagoe Chubu Electric 4 1997/2021 D.E.S. Yokkaichi Q-JP 2 " " " Niigata Tohoku Electric 2 1998/2021 " Ohgishima Tokyo Gas Senboku, Himeji Osaka Gas Sakai Kansai Electric Sodegaura Tokyo Electric Futtsu-Chita Toho Gas Yanai, Mizushima Chugoku Electric Higashi-Ohgishima
member firms affiliated with KPMG International, a Swiss cooperative. All rights reserved. Liability limited by a scheme approved under Professional Standards Legislation.
Ref. Trade Export Seller Import Buyer Nominal Duration Type Comments
member firms affiliated with KPMG International, a Swiss cooperative. All rights reserved. Liability limited by a scheme approved under Professional Standards Legislation.
Ref. Trade Export Seller Import Buyer Nominal Duration Type Comments
ACQ (Mtpa) of
contract
AU-Ch Australia-China Withnell Bay Woodside Dapeng, Shenzhen DPLNG** 3.7 2006/2031 F.O.B. Started in May 06
Japan Australia LNG
Shell Development Australia BHP Billiton Petroleum BP International Chevron Oil Trading CNOOC AU-JP1 Australia-Japan Withnell Bay Woodside Sodegaura, Futtsu Tokyo Electric 7.33 1989/2009 D.E.S.
Japan Australia LNG Higashi-Ohgishima Chubu Electric
Shell Development Chita, Senboku Kansai Electric Australia BHP Billiton Yanai, Ohita Chugoku Electric Petroleum BP International Negishi, Ohgishima Kyushu Electric Chevron Oil Trading Tobata, Yokkaichi Tokyo Gas Kawagoe Osaka Gas Himeji, Sakai Toho Gas Mizushima AU-JP2 " " " Sodegaura Tokyo Gas 1.37 2004/2029 F.O.B. Negishi Toho Gas Ohgishima, Chita
member firms affiliated with KPMG International, a Swiss cooperative. All rights reserved. Liability limited by a scheme approved under Professional Standards Legislation.
Ref. Trade Export Seller Import Buyer Nominal Duration Type Comments
ACQ (Mtpa) of
contract
AU-JP3 Australia-Japan Withnell Bay Woodside Himeji Osaka Gas 1.00 2004/2033 F.O.B.
Japan Australia LNG Senboku
Shell Development Australia BHP Billiton Petroleum BP International Chevron Oil Trading AU-JP4 " " " Sodeshi Shizuoka Gas 0.13 2004/2029 " AU-JP5 " " " Niigata Tohoku Electric 0.4 2005/2020 "
AU-JP Australia-Japan Darwin ConocoPhillips, ENI Futtsu, Sodegaura Tokyo Electric 2 2006/2022 F.O.B. Santos, Inpex,TTSR Negishi, Ohgishima Tokyo Gas 1 Higashi-Ohgishima
Source: ‘The LNG Industry 2008’, The International Group of Liquefied Natural Gas Importers, http://www.giignl.org/fr/home-page/lng-industry/