Page 1
GAS-PHASE ION CHEMISTRY OF HYDROXY AND AMINO-
SUBSTITUTED INTERSTELLAR POLYCYCLIC AROMATIC
HYDROCARBONS AND PROTONATED POLYCYCLIC AROMATIC
HYDROCARBONS
Mélanie Ouellette
Thesis submitted to the
Faculty of Graduate & Postdoctoral Studies
In partial fulfillment of the requirements for
the degree of Master of Science
In the Ottawa-Carleton Chemistry Institute
Department of Chemistry, University of Ottawa
Ottawa, Ontario, Canada
June 2014
Candidate Supervisor
Mélanie Ouellette Dr. Paul M. Mayer
© Mélanie Ouellette, Ottawa, Canada, 2014
Page 2
1
A mon père, Denis Ouellette et à ma mère, Andrée Ouellette
Page 3
2
Abstract
The gas-phase ion chemistry of hydroxyl- and amino-substituted polycyclic aromatic
hydrocarbons (PAHs) and their protonated counterparts were studied using mass spectrometry.
Ions were generated using an electron ionization (EI) source and the unimolecular chemistry of
metastable ions was studied by performing mass-analysed ion kinetic energy spectrometry
(MIKES) experiments with a magnetic sector tandem mass spectrometer. Collision-induced
dissociation (CID) experiments were used in conjunction with MIKES experiments to determine
ion structure. The ten molecules studied were: 1-naphthol, 2-naphthol, 1-naphthylamine, 2-
naphthylamine, 1-aminoanthracene, 2-aminoanthracene, 1-phenanthrol, 9-phenanthrol, 1-
hydroxypyrene and 1-aminopyrene. Since it is believed that larger PAHs, on the order of more
than 50 carbon atoms, populate the interstellar medium, the goal of this study was to attempt to
extrapolate the results from smaller systems to larger ones. The trends found include: hydroxy-
substituted PAH radical cations lose carbon monoxide spontaneously and amino-substituted
PAH radical cations lose HCN. Mechanisms for both processes are proposed, and it appears
from the present results that this process should extrapolate to larger PAHs. Another trend found
was that all the remaining fragment ions were always a closed ring.
Protonated amino-substituted PAHs were generated by electrospray ionization using a
quadruple time-of-flight mass spectrometer. By protonating 1-naphthol and 2-naphthol using
methane in the high-pressure EI source, it was found that they lost exclusively H2O. As for 2-
naphthylamine, 1-aminoanthracene and 2-aminoanthracene, it was found that 2-naphthylamine
lost NH3 and a hydrogen atom, NH3 being the dominant channel. However, as the ion size
Page 4
3
increases, the hydrogen-loss channel became the dominant channel. This means that larger PAHs
will likely lose exclusively a hydrogen atom to reform the parent radical cation.
Page 5
4
Acknowledgements
I would like to thank Dr. Paul M. Mayer for giving me the opportunity to work on this
project. He always had helpful tips, ideas and was always opened for new ideas. Also, I would
like to thank Dr. Sander Mommers who assisted me with everything concerning the ZAB. He is
very knowledgeable about everything in the laboratory and was a very helpful person to have
around. I would also like to thank Brandi West who helped me numerous times when I started
this project since she had experience with the instrument and the research. She provided her
much appreciated time and guidance at the beginning of my learning. A special thank goes to my
friends Jeffery Butson and Jenna Hamilton who provided their time for me when I needed it
throughout this project. Jenna Hamilton is a good friend who was there for me when I needed it
the most and who always believed in my abilities as a graduate student. Jeffery Butson is a friend
who was always there to help me in my research ideas and would always be there when I needed
it the most. I would like to thank Justin Renaud who provided guidance with the Q-TOF, with
the breakdown diagrams and who was also there for me when I needed it. A special thank goes
to Dr. John Holmes who proposed some experiments to help me confirm some questions I had
throughout this project. I would also like to thank the Mayer lab who was a great help for ideas,
support and who were great people to work with. I also want to thank my family and Pierre-
Olivier Roy for believing in my capacities as a graduate student. A special thank goes to my best
friend Karine Lacasse-Giroux who was always there for me and who believed in me throughout
this project.
Page 6
5
Table of Contents
A mon père, Denis Ouellette et à ma mère, Andrée Ouellette ...................................................................... 1
Abstract ......................................................................................................................................................... 2
Acknowledgements ....................................................................................................................................... 4
List of Figures ............................................................................................................................................... 7
List of Tables .............................................................................................................................................. 12
List of Abbreviations .................................................................................................................................. 13
Chapter 1. Introduction ............................................................................................................................... 15
1.1 Objectives ......................................................................................................................................... 15
1.2 Interstellar Chemistry ........................................................................................................................ 16
1.3 Mass Spectrometry ............................................................................................................................ 18
1.3.1 Magnetic Sector Instrument – VG ZAB .................................................................................... 19
1.3.2 Quadrupole time-of-flight mass spectrometer ........................................................................... 28
1.3.2b Quadrupole mass filters ........................................................................................................... 30
1.3.2d CID experiment and the breakdown diagram.......................................................................... 32
Chapter 2. Experimental setup .................................................................................................................... 33
2.1 VG-ZAB experiments ....................................................................................................................... 33
2.1 QTOF2 experiments .......................................................................................................................... 35
2.3 Calculations....................................................................................................................................... 38
Chapter 3. Radical Cations ......................................................................................................................... 40
3.1 –OH substituted PAHs ...................................................................................................................... 42
3.1.1 MIKES spectra ........................................................................................................................... 42
3.1.2 MI/CID spectra .......................................................................................................................... 46
3.1.3 CID spectra ................................................................................................................................ 50
3.1.4 Calculation results ...................................................................................................................... 51
3.1.5 Mechanisms ............................................................................................................................... 52
3.1.6 Extrapolation to larger PAHs ..................................................................................................... 57
Page 7
6
3.2 –NH2 substituted PAHs ................................................................................................................... 58
3.2.1 MIKES spectra ........................................................................................................................... 58
3.2.2 MI/CID spectra .......................................................................................................................... 62
3.2.3 CID spectra ................................................................................................................................ 64
3.2.4 Calculation results ...................................................................................................................... 65
3.2.5 Mechanisms ............................................................................................................................... 66
3.2.6 Extrapolation to larger PAHs ..................................................................................................... 69
Chapter 4. Protonated PAHs ...................................................................................................................... 70
4.1 Calculations....................................................................................................................................... 70
4.2 Protonation of 1-naphthol and 2-naphthol using the VG-ZAB ......................................................... 73
4.3 Protonation of the amines ................................................................................................................. 77
Chapter 5. Conclusions ............................................................................................................................... 84
References ................................................................................................................................................... 87
Page 8
7
List of Figures
FIGURE 1: HISTOGRAMS OF THE PEAK WAVELENGTH OF THE UIR 6.2 M BAND (ON THE LEFT) AND
7.7 M (ON THE RIGHT). EACH fiGURE CORRESPONDS TO AREAS I, II, III, AND IV FROM TOP TO
BOTTOM. THE DATA NUMBER IS NORMALIZED BY THE TOTAL NUMBER OF THE DATA WITHIN
EACH AREA. ............................................................................................................................ 17
FIGURE 2: REVERSE GEOMETRY BE MAGNETIC SECTOR MASS SPECTROMETER SCHEME. NUMBER 1
REPRESENTS THE ION SOURCE, NUMBER 2 THE FOCUSING LENS, NUMBER 3 THE MAGNETIC
SECTOR, NUMBER 4 THE 2ND FIELD-FREE REGION, NUMBER 5 THE BEAM RESOLVING SLITS,
NUMBER 6 THE ELECTROSTATIC SECTOR AND NUMBER 7 THE MULTIPLIER DETECTOR. IN THE
SECOND FIELD-FREE REGION, THERE ARE THE COLLISION CELLS AT NUMBER 8 AND THE BEAM
DEFLECTION ELECTRODES AT NUMBER 9. ............................................................................... 19
FIGURE 3: ELECTRON IONIZATION ION SOURCE SCHEME. NUMBER 1 REPRESENTS THE SOURCE
BLOCK, NUMBER 2 THE FILAMENT, NUMBER 3 THE TRAP ELECTRODE, NUMBER 4 THE REPELLER
ELECTRODE, NUMBER 5 THE ACCELERATION REGION AND NUMBER 6 THE FOCUSING LENS. .... 20
FIGURE 4: DIFFERENT FRAGMENT ION PEAK SHAPES POSSIBLE IN A MIKES SPECTRUM. A)
REPRESENTS A TYPICAL GAUSSIAN ENERGY PROFILE, B) KINETIC ENERGY RELEASE CAUSING
DISCRIMINATION IN THE Z-AXIAL PLANE FOR FRAGMENT IONS (DISH-SHAPED PEAK), C)
REPRESENTS COMPETING FRAGMENTATION CHANNELS RESULTING IN A COMPOSITE PEAK AND
D) REPRESENTS FRAGMENTATION THAT OCCURED FROM A DISSOCIATIVE EXCITED STATE. ..... 26
FIGURE 5: SCHEMATIC OF THE Q-TOF2 MASS SPECTROMETER ...................................................... 28
FIGURE 6: QUADRUPOLE MASS FILTER WITH RODS SEPARATED BY A RADIUS R .............................. 31
FIGURE 7: QTOF 2 SETUP TO ATTEMPT PROTONATION USING ACID SPRAY .................................... 36
Page 9
8
FIGURE 8: QTOF2 SETUP TO ATTEMPT PROTONATING USING ACID SPRAY. HERE IS SHOWN AN
ATTEMPTED SETUP TO BUILD UP ACIDITY IN GAS FORM. .......................................................... 37
FIGURE 9: POSITIONAL ISOMERS EMPLOYED IN THIS THESIS ........................................................... 40
FIGURE 10: MIKES MASS SPECTRA OF THE 1-NAPHTHOL ION M/Z 144 (SHOWN CUT OFF TO
EMPHASIS THE PRODUCT IONS). THE MASS SPECTRUM IN BLUE IS AT 8 KEV. ........................... 42
FIGURE 11: MIKES SPECTRA OF 2-NAPHTHOL AFTER SELECTING THE PARENT ION (144 M/Z). THE
SPECTRUM IN BLUE IS AT 8 KEV. (X) REFERS TO COLLISIONAL ARTIFACTS. ............................ 43
FIGURE 12: MIKES SPECTRA OF 1-PHENANTHROL AFTER SELECTING THE PARENT ION (194 M/Z).
THE SPECTRUM IN BLUE IS AT 8 KEV....................................................................................... 44
FIGURE 13: MIKES SPECTRA OF 9-PHENANTHROL AFTER SELECTING THE PARENT ION (194 M/Z).
THE SPECTRUM IN BLUE IS AT 8 KEV....................................................................................... 44
FIGURE 14: MIKES SPECTRA OF 1-HYDROXYPYRENE AFTER SELECTING THE PARENT ION (218 M/Z).
THE SPECTRUM IN BLUE IS AT 8 KEV....................................................................................... 45
FIGURE 15: MI/CID SPECTRA OF 1-NAPHTHOL, IN RED, AND 2-NAPHTHOL, IN BLUE, AFTER
SELECTING THE FRAGMENT ION AT 116 M/Z ............................................................................ 46
FIGURE 16: CID SPECTRA OF 1-PHENYL-1-PROPYNE, IN BLUE, AND INDENE, IN RED, AFTER
SELECTING THE PARENT ION FOR EACH AT 116 M/Z ................................................................. 47
FIGURE 17: MI/CID SPECTRUM FOR 1-PHENANTHROL AFTER SELECTING THE FRAGMENT ION AT 166
M/Z ......................................................................................................................................... 48
FIGURE 18: CID SPECTRUM OF FLUORENE IN BLUE AND CID SPECTRUM OF 9-PHENANTHROL WHEN
SELECTING DIRECTLY 166 M/Z FROM THE SOURCE IN PINK ...................................................... 49
FIGURE 19: MI/CID SPECTRUM OF 1-HYDROXYPYRENE AFTER SELECTING THE FRAGMENT ION AT
190 M/Z ................................................................................................................................... 50
Page 10
9
FIGURE 20: STRUCTURE OF INDENE (LEFT) AND 1-PHENYL-1-PROPYNE (RIGHT). ........................... 51
FIGURE 21: PROPOSED MECHANISM FOR THE LOSS OF CO FOR 1-NAPHTHOL ................................. 53
FIGURE 22: PROPOSED MECHANISM FOR THE LOSS OF CO FOR 2-NAPHTHOL ................................. 54
FIGURE 23: PROPOSED MECHANISM FOR THE LOSS OF CO FOR 1-PHENANTHROL ........................... 55
FIGURE 24: PROPOSED MECHANISM FOR THE LOSS OF CO FOR 9-PHENANTHROL ........................... 56
FIGURE 25: PROPOSED MECHANISM FOR THE LOSS OF CO FOR 1-HYDROXYPYRENE ...................... 57
FIGURE 26: MIKES SPECTRA OF 1-NAPHTHYLAMINE AFTER SELECTING THE PARENT ION (143 M/Z).
THE SPECTRUM IN BLUE IS AT 8 KEV. SOME H LOSS WAS ALSO OBSERVED. ............................ 59
FIGURE 27: MIKES SPECTRA OF 2-NAPHTHYLAMINE AFTER SELECTING THE PARENT ION (143 M/Z).
THE SPECTRUM IN BLUE IS AT 8 KEV. SOME H LOSS IS ALSO OBSERVED. ................................ 60
FIGURE 28: MIKES SPECTRA OF 1-AMINOANTHRACENE AFTER SELECTING THE PARENT ION (193
M/Z). THE SPECTRUM IN BLUE IS AT 8 KEV.............................................................................. 61
FIGURE 29: MIKES SPECTRA OF 2-AMINOANTHRACENE AFTER SELECTING THE PARENT ION (193
M/Z). THE SPECTRUM IN BLUE IS AT 8 KEV.............................................................................. 62
FIGURE 30: MI/CID SPECTRA OF 1-NAPHTHYLAMINE, IN BLUE, AND 2-NAPHTHYLAMINE, IN RED,
AFTER SELECTING THE FRAGMENT ION AT 116 M/Z ................................................................. 63
FIGURE 31: MI/CID SPECTRA OF 2-AMINOANTHRACENE, IN RED, AND 1-AMINOANTHRACENE, IN
BLUE, AFTER SELECTING THE FRAGMENT ION AT 166 M/Z ....................................................... 64
FIGURE 32: PROPOSED MECHANISM FOR THE LOSS OF HCN FOR 1-NAPHTHYLAMINE .................... 66
FIGURE 33: PROPOSED MECHANISM FOR THE LOSS OF HCN FOR 2-NAPHTHYLAMINE .................... 67
FIGURE 34: PROPOSED MECHANISM FOR THE LOSS OF HCN FOR 1-AMINOANTHRACENE ............... 67
FIGURE 35: PROPOSED MECHANISM FOR THE LOSS OF HCN FOR 2-AMINOANTHRACENE ............... 68
FIGURE 36: PROPOSED MECHANISM FOR THE LOSS OF HCN FOR 1-AMINOPYRENE ........................ 68
Page 11
10
FIGURE 37: MIKES SPECTRUM DEPICTING THE RELATIVE INTENSITY OF THE M+1 PEAK BEING A
MIX OF [M+H]+
AND 13
C M+.
AND THE M+.
PEAK .................................................................... 73
FIGURE 38: MIKES SPECTRUM OF PROTONATED 2-NAPHTHOL AFTER SELECTING M/Z 145. (X)
SHOWS COLLISIONAL ARTIFACTS ............................................................................................ 74
FIGURE 39: GRAPH SHOWING THE PROTONATION OF 1-NAPHTHOL USING METHANE AS A CHEMICAL
IONIZATION GAS. THE RATIOS BETWEEN LOSS OF 18 M/Z AND 28 M/Z WERE PLOTTED AS A
FUNCTION OF THE RATIO OF THE M+1 PROTONATED PEAK TO THE PARENT ION PEAK M. ........ 75
FIGURE 40: GRAPH SHOWING THE PROTONATION OF 2-NAPHTHOL USING METHANE AS A CHEMICAL
IONIZATION GAS. THE RATIOS BETWEEN LOSS OF 18 M/Z AND 28 M/Z WERE PLOTTED AS A
FUNCTION OF THE RATIO OF THE M+1 PROTONATED PEAK TO THE PARENT ION PEAK M. ........ 76
FIGURE 41: PROPOSED MECHANISM FOR THE LOSS OF WATER FROM PROTONATED 1-NAPHTHOL ... 77
FIGURE 42: PROPOSED MECHANISM FOR THE LOSS OF WATER FROM PROTONATED 2-NAPHTHOL ... 77
FIGURE 43: PROPOSED MECHANISM FOR THE LOSS OF AMMONIA FROM PROTONATED 2-
NAPHTHYLAMINE .................................................................................................................... 78
FIGURE 44: PROPOSED MECHANISM FOR THE LOSS OF HYDROGEN FROM PROTONATED 2-
NAPHTHYLAMINE. THE FIRST POSSIBILITY IS PROTON LOSS FROM THE NH3 GROUP (TOP) AND
THE SECOND POSSIBILITY IS HYDROGEN LOSS FOR THE AROMATIC RING (BOTTOM). ............... 79
FIGURE 45: BREAKDOWN DIAGRAM OF PROTONATED 2-NAPHTHYLAMINE USING MS/MS ON A Q-
TOF INSTRUMENT. THE COLLISION ENERGY USED WAS FROM 6.00 TO 35.00 EV (E LAB.) BY
INCREMENTS OF 1. THE BREAKDOWN DIAGRAM WAS PLOTTED USING THE RELATIVE
INTENSITIES OF EACH FRAGMENT ION. .................................................................................... 80
FIGURE 46: BREAKDOWN DIAGRAM OF PROTONATED 2-AMINOANTHRACENE USING MS/MS ON A
Q-TOF INSTRUMENT. THE COLLISION ENERGY USED WAS FROM 6.00 TO 35.00 EV (E LAB.) BY
Page 12
11
INCREMENTS OF 1. THE BREAKDOWN DIAGRAM WAS PLOTTED USING THE RELATIVE
INTENSITIES OF EACH FRAGMENT ION. .................................................................................... 81
FIGURE 47: PROPOSED MECHANISM FOR THE LOSS OF AMMONIA FROM PROTONATED 2-
AMINOANTHRACENE ............................................................................................................... 82
FIGURE 48: PROPOSED MECHANISM FOR THE LOSS OF A HYDROGEN FROM PROTONATED 2-
AMINOANTHRACENE. THE FIRST POSSIBILITY IS HYDROGEN LOSS FROM THE NH3 GROUP (TOP)
AND THE SECOND POSSIBILITY IS HYDROGEN LOSS FOR THE AROMATIC RING (BOTTOM). ....... 82
Page 13
12
List of Tables
TABLE 1: PROTON AFFINITIES (EV) OF THE PAHS STUDIED IN THIS THESIS, CALCULATED USING
TWO DIFFERENT METHODS ...................................................................................................... 71
Page 14
13
List of Abbreviations
CI Chemical ionization
CID Collision-induced dissociation
DFT Density functional theory
EI Electron impact
ESA Electrostatic analyser
ESI Electrospray ionization
FFR Field-free region
FUV Far-ultraviolet-pumped
IR Infrared
ISM Interstellar Medium
MI/CID Mass-analysed ion/collision-induced dissociation
MIKES Mass-analysed ion kinetic energy spectrometry
MP2 Second order Moller-Plesset perturbation theory
MS Mass spectrometry
PAH Polycyclic Aromatic Hydrocarbon
QTOF Quadrupole time-of-flight mass spectrometer
THF Tetrahydrofuran
Page 15
14
TOF Time-of-flight
ZAB Zero aberration
Page 16
15
Chapter 1. Introduction
1.1 Objectives
The goal of this thesis is to explore the gas-phase ion chemistry of small polycyclic
aromatic hydrocarbon (PAH) ions. This class of molecules is believed to account for twenty
percent of the organic carbon in the interstellar medium.1 2 Since PAHs (neutral and ions) are
suggested to play a significant role in the chemistry of the interstellar medium, the reactivity of
such ions were explored.3 These molecules are believed to behave as catalysts for the formation
of small molecules like H2, H2O, NH3, etc by acting as surrogate surfaces. In this case,
hydroxylated and aminated PAHs could be intermediates in the larger catalytic mechanism.
Thus, we are examining the fate of these intermediates by studying the unimolecular chemistry
of hydroxy and amino substituted PAHs and their protonated counterparts. The PAHs studied
were those available for purchase and cover a small range of PAH size from naphthalene to
pyrene: 1-naphthol, 2-naphthol, 1-naphthylamine, 2-naphthylamine, 1-phenanthrol, 9-
phenanthrol, 1-aminoanthracene, 2-aminoanthracene, 1-hydroxypyrene and 1-aminopyrene. The
chemistry of these ions probes the first step in H2O and NH3 formation, that is the intermediate
first formed by OH and NH2 substitution on the PAH ring system. The next step would be the
addition of hydrogen, and we selected to protonate the substituted PAHs to generate ionic
species that could possibly lose H2O and NH3. Two mass spectrometers were employed: a
modified VG ZAB magnetic sector instrument for the study of mass selected radical cations
formed by electron ionization and protonated hydroxyl-PAHs by chemical ionization, and a
Micromass Q-TOF 2 mass spectrometer equipment with an electrospray ionization source for the
study of protonated amino-PAHs. The Gaussian 09 suite of programs was used to perform
Page 17
16
calculations on all PAHs, their protonated counterparts and on their fragments to have a better
understanding of the chemistry and energetics of the way they break down. Extrapolation of the
results to larger PAHs can be possible if a trend is found in the small PAHs which in this study
have a maximum of four aromatic rings.
1.2 Interstellar Chemistry
Ground-base and airborne studies in the 1970s using infrared (IR) spectroscopy have
shown some broad emission features located in mid-infrared region of the IR (Figure 1).4 5 These
IR spectra were collected in the bright HII regions, planetary nebulae and reflection nebulae. All
IR spectra were showing the same features and bands, thus the region of the interstellar medium
(ISM) where they were measured did not matter. Arising from this observation, a great interest
was developed in the assignment of the mid-infrared bands of these IR spectra. After further
investigation, the broad features showing on the IR spectra were believed to be from the
combined IR fluorescence of a multitude of far-ultraviolet-pumped (FUV) polycyclic aromatic
hydrocarbons (PAH), mostly from those of at least 50 atoms of carbon like fullerene.6 The
argument for these assignments was made by stacking the IR spectra of many PAHs on top of
another and concluding that the profile of the bands was present in the same manner as in the IR
spectra collected from observations. From this reasoning, PAHs are believed to account for about
twenty percent of the organic carbon in the interstellar medium. Thus, an open question is how
PAHs would play a role in the gas-phase ion chemistry of the ISM. These molecules are present
in the heating of neutral gas and in the ionization balance in molecular clouds, making them
potentially extremely important in the ion-molecule chemistry of gas-phase species present in the
ISM.
Page 18
17
Figure 1: Histograms of the peak wavelength of the UIR 6.2 m band (on the left) and 7.7 m
(on the right). Each figure corresponds to areas I, II, III, and IV from top to bottom. The
data number is normalized by the total number of the data within each area.7
PAHs possess key features that make them viable in the ISM. They are from the
hydrocarbon family and thus are mostly composed of carbons and hydrogens. These carbons
and hydrogens are arranged in fused benzene rings with peripheral hydrogens. The system
formed by the network of fused benzene rings form rigid and stable species. They also show a
very planar nature and can thus be stacked in clusters bonded by Van Der Waals interactions.
Some PAHs have one hydrogen substituted for a methyl group or hydroxy group or in some
cases, one carbon can possess two hydrogens, which is called a superhydrogenated PAH. Given
the very low vapor pressure of PAHs over 50 carbons, which makes them difficult to make in the
Page 19
18
gas phase, studies have been conducted using smaller PAHs. Studies performed on positively
ionized PAHs were conducted since ionic species are believed to participate in the IR spectra.
1.3 Mass Spectrometry
The technique used in this thesis to study PAHs is mass spectrometry. As stated above,
this technique is used for its properties similar to the interstellar environment: low pressure. This
technique also permits ionization in the gas phase, an essential property that the technique must
possess for this type of study. Mass spectrometry is an analytical technique used to get
information about the mass-to-charge ratio of ionized molecules. The sample used can be solid,
liquid or gas as long as it can be ionized in the gas phase. The way the results are produced is by
producing a mass spectrum of the intensity vs the mass-to-charge when certain ions hit the
detector. Mass spectrometry is not an optical technique in the sense that there is no photon
involved. Depending on the system studied, the chemist will need to use a specific mass
spectrometer. For this study, replicating the conditions of the interstellar medium is essential to
ensure proper comparison with data collected previously. The instrument mostly used in this
study is a modified VG ZAB magnetic sector instrument. What differentiates the ZAB sector
instrument from other mass spectrometers is that it allows for the study of the spontaneous
dissociation of metastable ions. Spontaneous dissociation is a must given that molecules and
ions are very far from one another in the interstellar medium and their likelihood of hitting one
another is very low.
Page 20
19
1.3.1 Magnetic Sector Instrument – VG ZAB
The sector instrument used in this study is a VG-ZAB sector instrument. It is a mass
spectrometer consisting of both a magnetic and electrostatic sector. It is thus a double-focusing
mass spectrometer since the ion beam can be focused at two places in the apparatus. The VG-
ZAB used is a reverse-geometry tandem sector mass spectrometer of BE configuration. Here is a
scheme of a reverse-geometry mass spectrometer.8
Figure 2: Reverse geometry BE magnetic sector mass spectrometer scheme. Number 1
represents the ion source, number 2 the focusing lens, number 3 the magnetic sector,
number 4 the 2nd field-free region, number 5 the beam resolving slits, number 6 the
electrostatic sector and number 7 the multiplier detector. In the second field-free region,
there are the collision cells at number 8 and the beam deflection electrodes at number 9.8
Page 21
20
1.3.1a Ion Sources
To be able to perform an experiment, an ion source is needed. The three ion sources used
were an electron ionization (EI) source, a chemical ionization (CI) source and a high-pressure
source.
Figure 3: Electron ionization ion source scheme. Number 1 represents the source block,
number 2 the filament, number 3 the trap electrode, number 4 the repeller electrode,
number 5 the acceleration region and number 6 the focusing lens.8
Using an EI source, the sample can be introduced as a liquid or a solid in the source with
the help of an inlet. All PAHs studied were a solid. The vapor pressure of the solid is important
Page 22
21
since it determined the amount of sample introduced in the ion source. The molecules in the gas
phase in the source are ionized by electrons accelerated in the direction of the block using a
potential gradient. The electrons are produced by heating the filament in the source and are
collected in the trap electrode. The ions exit the source by the help of a repeller electrode through
the exit slit. The VG-ZAB used in this study can have ions accelerated between 6 keV and 9 keV
by increments of 1 keV. The real acceleration energy is a bit less since the repeller is used to
push the ions forward and ions naturally lose a bit of energy by colliding, breaking apart,
ionizing, etc. A pressure of around 6-7 mTorr is expected in the EI source. The electron energies
used in this instrument are around 70 eV. This results in a broad energy distribution that is a non-
Boltzmann distribution, making the discussion of the ion chemistry related to thermodynamic
temperature rather difficult.
In the CI source, a gas is introduced. In this study, the gas is methane. The methane will
get ionized by electron ionization and charge transfer to our molecule (M) after a series of steps.
Here is the general CI route using methane.
CH4 + e- → CH4
+ + 2e
-
CH4 + CH4+ → CH5
+ + CH3
M + CH5+
→ CH4 + MH+
The last source used was the high pressure source. This source was used to protonate the
molecules used in this study. The reason of using this source is that the pressure is greatly
Page 23
22
augmented within it, helping the protonation. The high pressure source used has only three small
orifices and the slit used is very small to help build up the pressure in the source. The second
orifice is to permit the vapor pressure from our sample to enter the source and the third orifice is
to enable the gas used to protonate, methane, to enter the source. The pressure can be raised to
about 4-5 Torr to get adequate protonation depending on the sample used. Usually, the settings
are really different from the simple EI source to get the ions to penetrate and ionize the sample
and effectively leave the source.
1.3.1b The Magnetic Sector
The second part of the VG-ZAB reverse-geometry mass spectrometer is the magnetic
sector. Two parallel electromagnets surround an iron core in the magnetic sector. The magnetic
field generated by magnet is perpendicular to the flight direction of the ion beam. This path is
said to be orthogonal to the magnetic field and is described by this relationship8:
The radius of the curvature of the ion path is r, the ion mass is m, the velocity is v, the
magnetic field strength is B, the number of charges of the ion is z and the elementary charge is e.
The VG-ZAB used has a fixed radius of curvature r. How it works is by passing ions of a
particular momentum mv by selecting a specific magnetic field strength B. Thus, the magnetic is
Page 24
23
used to select ions by their momentum and not their mass. Since the ion sources used operate
between 6 keV and 9 keV for the magnetic sector used, the ion kinetic energy must be taken into
account. The velocity becomes:
resulting in the final equation by rearranging equation (#):
1.3.1c The Field-Free Region
The third part of the VG-ZAB mass spectrometer is the field-free region (FFR). The
instrument used is composed of three FFRs8. They are located between the ion source and
magnetic sector, between the magnetic sector and first electrostatic sector, and between the first
electrostatic sector and second electrostatic sector. In the FFR, there are collision cells and ion
beam deflection electrodes to adjust the ion beam path. The collision cells are used to perform
certain experiments which will be discussed later. Those collision cells are made of steel about
two or three centimeters with a hole for the ion beam to pass through. A collision gas can be
introduced in the collision cell to perform several types of experiments like collision-induced
dissociation (CID) and mass-analysed ion kinetic energy spectrometry followed by collision-
induced dissociation (MI/CID). These experiments will be discussed later.
Page 25
24
1.3.1d The Electrostatic Sector
The fourth part of the VG-ZAB is the electrostatic sector (ESA)8. In the ESA, a potential
difference is applied between two curved parallel plates. This produces an electric field with a
strength E. The ion beam that passed through the ESA follows the following relationship:
Ions of selected translational kinetic energy are able to pass through. They are then
focused and hit the detector that monitor the flux of ions. The software then converts the
translational energy into mass-to-charge to produce the spectrum collected.
1.3.1e Mass-analysed ion kinetic energy spectrometry (MIKES)8
It takes the ions several microseconds to arrive in the FFR of the VG-ZAB while
accelerated out of the ion source with keV translational kinetic energies. Given this timescale,
the ions dissociating during this timeframe are called metastable ions. A+ and B, which are the
unimolecular decomposition fragments of the metastable ion AB+ will show lower translational
kinetic energy T because of the conservation of energy and momentum. These equations
illustrate this:
zTA+ = 1/2 mA+
. ʋ
2 zTB = 1/2 mB
. ʋ
2 zTAB
+. = 1/2 mAB ʋ
2
Page 26
25
where z is the number of charges, T is the translational kinetic energy, m refers to the mass of the
species in question and ʋ is their velocities.
Thus, we obtain:
TA+ = mA
+ TAB
+.
mAB+.
The fragments ions, since they possess lower translational energies, will pass in sequence
through to the detector when scanning the ESA. Also, since this experiment occurs on the
microseconds timescale, if isomeric ions interconvert during that timescale, they will have
almost identical MIKES spectra. During a MIKES experiment, there are several characteristic
peak shapes that are expected. As shown in figure 4 below there is a typical Gaussian energy
profile peak. This peak changes if there is a large average kinetic energy release that causes the
fragment ions to have z-axial discrimination, making the peak dished-shaped. Moreover, another
possible shape is possible when two competing channels are superimposed. This produces a
composite peak. Finally, another peak is possible when the fragment ions were the result of a
dissociative excited state and does not resemble a Gaussian profile.
Page 27
26
Figure 4: Different fragment ion peak shapes possible in a MIKES spectrum. a) represents
a typical Gaussian energy profile, b) kinetic energy release causing discrimination in the z-
axial plane for fragment ions (dish-shaped peak), c) represents competing fragmentation
channels resulting in a composite peak and d) represents fragmentation that occured from
a dissociative excited state.8
1.3.1f Collision-induced dissociation mass spectrometry (CID)8
By introducing a target gas into a collision cell in one of the FFR and by mass selecting
ions before colliding them with that target gas, a collision-induced mass spectrum is obtained.
This is achieved by producing a 10% beam reduction using the target gas desired, usually
helium. The CID mass spectra are obtained and analysed the same way as MIKES spectra, but
they represent a different situation. Those spectra represent all the possible dissociation
processes of the precursor ion, which is very different from MIKES experiments. New and
Page 28
27
important information can be obtained by performing CID on the precursor ion since the
timescale is very different from MIKES experiments. They range from the time of the collision
with the target gas to the time ions leave the FFR the collision cell was in. Since the timescale is
shorter, and ion internal energy higher, isomerization does not have a chance to compete with
bond cleavage, making keV CID mass spectra characteristic of ion connectivity.
1.3.1g Mass-analysed ion kinetic energy spectrometry followed by collision-induced dissociation
Another experiment that can be done on the VG-ZAB is to do a MIKES experiment
followed by a collision-induced dissociation. This experiment is helpful when comparing
fragments of different precursor ions that have the same m/z to see if those fragments have the
same connectivity. The chosen fragment ion is formed by the dissociation of the precursor ion in
a MIKES experiment and is then selected with the first ESA. Target gas is introduced in a
collision cell in the 3rd FFR. The third ESA is scanned and the ions hit the detector. Since CID
spectra are characteristic of ion connectivity, they can be compared to other fragment ions of the
same m/z.
Page 29
28
1.3.2 Quadrupole time-of-flight mass spectrometer
Protonated amino PAHs were studied on a Micromass quadrupole time-of-flight mass
spectrometer (QTOF2) shown in figure 5. The components will be addressed below.
Figure 5: Schematic of the Q-TOF2 mass spectrometer8
Page 30
29
1.3.2a Electrospray ionization (ESI)
Electrospray ionization (ESI) was developed by John Bennett Fenn in 1984. He received
the Nobel Prize in Chemistry in 2002 for the development of the ESI source.
The way the ions are made is what distinguishes this source from an EI source used in a
VG-ZAB sector instrument. The ions are produced in sequence. A solution of the analyte is
made and an acid might be introduced to help the production of ions if the analyte is polar. The
solution is then injected to a metal tube capillary using a flow from 1 µL/min to 1 mL/min.
An electric potential is applied to the tip of the capillary and a gas passes around the
capillary, which is usually N2. The source can be set to positive or negative mode. For example,
in the positive mode, the tip will have a high electric potential applied to it making the positive
ions travel further away from the tip and the negative ions stick to the tip. The liquid will expand
since the accumulated positive charges will repel each other and a Taylor cone will be formed.
The Taylor cone forms when the expanded liquid has the force of the accumulated positive
charges equal to the surface tension of the liquid. The Taylor cone will break down into
positively-charged droplets due to the high electric potential of the tip and those droplets will be
sprayed. The solvent in the droplets will start to evaporate, making the droplets shrink. As they
continue to shrink, the Coulomb repulsion becomes greater than the surface tension for each
droplet since the surface charge to surface area increases. This makes the droplets dissociate into
smaller droplets and is called Coulomb explosion. This phenomenon continues until gas-phase
ions are produced without any solvent remaining.
Page 31
30
1.3.2b Quadrupole mass filters
In a quadrupole mass filter, the potential ɸ in the field is represented by the following
equation:
ɸ0 is the applied potential, the distance between the hyperbolic rods is shown by r0 and
the coefficients are represented by a, b and c. This applied potential is the radio-frequency
potential (RF), V cos ɷt and the direct current (DC) potential U combined. This relationship is
expressed by the following equation:
The angular frequency of the radio-frequency field is expressed by ɷ and is 2π times the
frequency in Hertz. A hyperbolic geometry is preferred for the rods in a quadrupole mass filter.
The most common arrangement is four cylindrical rods which are separated by a distance of 2r
where r = 1.16 r0. With this geometry, an acceptable field geometry along the axis of the mass
filter is created. The field along the axis of the instrument is non-existent, simplifying the
equation to:
1 is the value given to a and -1 is the value given to b in this case. The equation then becomes:
Page 32
31
In this field, the equations of motion are as followed:
Here is a schematic of a quadrupole mass filter:
Figure 6: Quadrupole mass filter with rods separated by a radius r8
1.3.2c Time-of-flight mass spectrometry (TOF)
During a time-of-flight mass spectrometry experiment, large ions having the same kinetic
energy as small ions will travel slower since they possess lower velocities. The equation used is
the one for kinetic energy:
Page 33
32
The time the ions take to travel is represented by the following equation:
The time the ions take from the ESI source to the detector is given by td, the potential
drop is V and the translational kinetic energy of ions which are accelerated from the ESI source
is given by zeV.
1.3.2d CID experiment and the breakdown diagram
This mass spectrometer is useful to create breakdown diagrams of the ions studied. To create
such a breakdown diagram, a mass spectrum is collected at each lab frame collision energy in eV
between an interval of center-of-mass collisional energies at a set increment. After collecting
information on the relative intensities of each fragment and on the parent ion, a figure is created
plotting the relative intensity on the center-of-mass collision energy.
Page 34
33
Chapter 2. Experimental setup
2.1 VG-ZAB experiments
1-naphthol, 2-naphthol, 1-naphthylamine, 2-naphtylamine, 1-phenanthrol, 9-phenanthrol,
1-aminoanthracene, 2-aminoanthracene, 1-hydroxypyrene, 1-aminopyrene, indene, 1-phenyl-1-
propyne and fluorene were purchased at Sigma-Aldrich.910
They were used without further
purification. For MIKES experiments, a source using 7 eV, 8 eV and 9 eV was used. The CID
cell was not filled with any gas and the molecular ions were allowed to dissociate spontaneously
in the 2nd FFR. For 1-naphthol and 2-naphthol, the mass which the magnet was set was 144 m/z
for each of the voltages used. For 1-naphthylamine and 2-naphthylamine, the magnet was set to a
mass of 143 m/z for each voltages used. For 1-phenanthrol and 9-phenanthrol, the magnet was
set at 194 m/z. For 1-aminoanthracene and 2-aminoanthracene, the mass used for the magnet was
193 m/z for each of the voltage. For 1-hydroxypyrene, the mass used was 218 m/z for the magnet
at each voltages, and finally for 1-aminopyrene, the mass used was 217 m/z for the magnet for
each voltages. All these molecules are solids at room temperature and a solid probe was used to
insert the samples into the instrument. The pressure of the source on the gage of the instrument
while doing MIKES experiments was between 1.0 x 10⁻⁶
Torr and 9.0 X 10⁻⁶
Torr. Each MIKES
experiment was repeated at 10 times and 100 times amplification to know the relationship
between the parent ion and the fragments in terms of relative intensities. The first ESA was used
to scan the kinetic energy and then, each fragment ion hit the detector with its respective parent
ion.
Page 35
34
Afterwards, CID experiments were performed on each of the previously mentioned
molecular ions. The only difference in terms of experimental setup was that a gas was introduced
in one of the collision cells in the 2nd FFR. This gas was helium. This experiment was used to
determine the full fragmentation pattern of each molecular ion. This experiment was also
performed on indene, 1-phenyl-1-propyne and fluorene, which are possible fragments during the
MIKES experiments on 1-naphthol, 2-naphthol, 1-naphthylamine, 2-naphthylamine and 9-
phenanthrol, to determine if these were the fragments seen in the MIKES spectra of each parent
ion.
Afterwards, MI/CID experiments were performed on each molecular ion mentioned
previously except indene, 1-phenyl-1-propyne and fluorene. The setup was the same as a MIKES
experiment except that the fragment of interest is selected in the first ESA and allowed to go
through the 3rd FFR. In the 3rd FFR, one of the cells is filled with helium and the 2nd ESA is
used to scan. All fragments hit the detector. This experiment is used to compare the
fragmentation pattern to the CID experiments of indene, 1-phenyl-1-propyne and fluorene to
determine if the three molecular ions can be the fragment ions seen in the spectra during the
MIKES experiments.
A last experiment was performed on the VG-ZAB. Protonation was performed on 1-
naphthol and 2-naphthol using a high-pressure source and methane. Methane was introduced as a
gas using the gas inlet provided and the high-pressure source was introduced in the instruments
using the CI slit. The pressure of the source on the gage was between 1.0 x 10^-5
Torr and 9.0 x
Page 36
35
10^-4
Torr depending on the experiment done. The protonation was monitored using the ratio of
the M+1 parent ion peak over the parent ion peak M. Protonation was possible between 15% and
100%. Then, the experiment was performed as a normal MIKES experiment and a spectrum was
collected. The ratio between water loss and carbon monoxide loss was measured. This
experiment is performed to study if the M+1 protonated peak only leads to loss of water or if the
loss of carbon monoxide is also a fragment. Protonation on 1-naphtylamine and 2-naphthylamine
was also performed but not successful. Protonation was also performed on the bigger molecules
but not successful.
2.1 QTOF2 experiments
Protonation experiments were performed using the QTOF2. These were only successful
for 1-naphthylamine, 2-naphthylamine, 1-aminoanthracene and 2-aminoanthracene. The solution
used was at 0.1 mg/mL of each molecule of interest in a solution of 40:60 THF:Methanol. Using
ESI, the protonated molecular ions were allowed to dissociate using CID. The collision gas used
was argon. The breakdown diagram was done on each molecule using collision energies between
6 eV and 35 eV. To create these breakdown diagrams, a mass spectrum is collected at each
increment of 1 eV between 6 and 35 eV. Relative intensities of each fragment and of the parent
ion are calculated for each spectrum. Then, a figure is created plotting the relative intensity on
the center-of-mass collisional energy. The processed is repeated for each molecular ion studied.
Page 37
36
Protonation was attempted on 1-naphthol and 2-naphthol using an Acid Spray setup.
Figure 7: QTOF 2 setup to attempt protonation using acid spray
Page 38
37
Figure 8: QTOF2 setup to attempt protonating using acid spray. Here is shown an
attempted setup to build up acidity in gas form.
The solution was prepared at 0.1 mg/mL using 40:60 THF:Methanol. The ESI gas,
nitrogen, was introduced in a container which had glacial acetic acid to help protonation. The
resulting gas was then used to spray using the ESI source. Unfortunately, protonation was not
possible on 1-naphthol and 2-naphthol.
Page 39
38
2.3 Calculations
Two methods were used in this study. The first one was the MP2 method or Møller-
Plesset perturbation theory. This method is a post Hartree-Fock ab initio method that add
electron correlation to the original Hartree-Fock method. The electron correlation is added using
Rayleigh-Schrödinger perturbation theory. Perturbation theory is used to find an approximate
solution to a system that cannot be solved exactly. The system starts with a simple model and
Hamiltonians are added until the system becomes a little more complex or perturbed. The MP2
method is of the second order.
The second method used was the DFT method or density functional theory using B3LYP
or Becke, three-parameter, Lee-Yang-Parr functional. In DFT, electron density is used to
determine the ground state with the help of functionals. B3LYP is the functional is in conjecture
with DFT in this study and relies on the Becke 88 exchange functional and the Lee, Yang and
Parr correlation functionals. This functional is a hybrid functional since it takes into account the
exact exchange of Hartree-Fock theory and it is an approximation of the exchange-correlation in
DFT. The Kohn-Sham orbitals are used to express the exact energy functional instead of the
density in DFT.
Gaussian 09 calculations11
were performed to confirm experiments. HPCVL12
provided
the nodes for calculations. Gaussview was the program used to prepare each molecule, molecular
ion and protonated ion. Calculations were performed on each molecular ion, their neutral
counterparts and their protonated counterparts. Indene, 1-phenyl-1-propyne and fluorene did not
Page 40
39
have calculations for their protonated counterparts nor their neutral counterparts. Neutral and ion
calculations were used to determine the ionization energies and protonated calculations were
used to determine the proton affinity. The method and level of theory used was B3LYP/6-
311+G(d,p). Moreover, calculations on the ions of indene, 1-phenyl-1-propyne, fluorene and
other possible fragments were performed to determine which ion was a fragment in the MIKES
experiments performed.
Page 41
40
Chapter 3. Radical Cations
Figure 7 shows the structures of all of the molecules studied in this section.
1-naphthol 2-naphthol 1-naphthylamine 2-naphthylamine
1-phenanthrol 9-phenanthrol 1-aminoanthracene 2-aminoanthracene
1-hydroxypyrene 1-aminopyrene
Figure 9: Positional isomers employed in this thesis
Page 42
41
Two groups of molecular ions were studied. These two groups are PAHs with different
substituents: hydroxy-substituted PAHs and amino-substituted PAHs. Hydroxy- and amino-
substituted naphthalenes were studied for the smallest PAH with two rings. There were four of
those molecular ions which are 1-naphthol, 2-naphthol, 1-naphthylamine and 2-naphthylamine.
To study a trend, bigger PAHs were needed for this study. Thus, a group of PAHs with three
rings were studied: 1-phenanthrol, 9-phenanthrol, 1-aminoanthracene and 2-aminoanthracene.
Finally, the biggest substituted PAHs studied contained four rings: 1-aminopyrene and 1-
hydroxypyrene. The structures of those PAHs are shown in the figure 7. Two positions for the
hydroxy groups and amino groups are studied to observe if they have any influence on the ion
chemistry of those molecular ions. This discussion is divided to explain the ion chemistry of the
hydroxy-substituted PAHs and amino-substituted PAHs separately.
Page 43
42
3.1 –OH substituted PAHs
3.1.1 MIKES spectra
MIKES experiments were performed for five hydroxy-substituted PAHs. Two of those
PAHs have two aromatic rings: 1-naphthol and 2-naphthol. (Figure 10, 11) They are
constitutional isomers of the other, meaning the hydroxy groups are either on the alpha position
or beta position. Two of these PAHs have three aromatic rings: 1-phenanthrol and 9-phenanthrol.
Like the substituted naphthalene, the hydroxy-substituted phenanthrenes are molecular ions that
are also constitutional isomers of each other and the position of their hydroxy group differs by
the one position and nine position. The last group of PAHs studied consisted of four aromatic
rings – substituted pyrene. Only one hydroxy-substituted pyrene was studied since no other
constitutional isomer was available for purchase.
Figure 10: MIKES mass spectra of the 1-naphthol ion m/z 144 (shown cut off to emphasis
the product ions). The mass spectrum in blue is at 8 keV.
Page 44
43
Figure 11: MIKES spectra of 2-naphthol after selecting the parent ion (144 m/z). The
spectrum in blue is at 8 keV. (X) refers to collisional artifacts.
Molecular ions that were hydroxy-substituted were found to always lose a neutral
fragment of 28 mass units. (Figure 12-14) The neutral compound was found to be carbon
monoxide. The fragment ion was found to always be a closed-ring structure and evidence is
provided later in this section.
85 95 105 115 125 135
m/z
Page 45
44
Figure 12: MIKES spectra of 1-phenanthrol after selecting the parent ion (194 m/z). The
spectrum in blue is at 8 keV.
Figure 13: MIKES spectra of 9-phenanthrol after selecting the parent ion (194 m/z). The
spectrum in blue is at 8 keV.
100 110 120 130 140 150 160 170 180 190
m/z
100 120 140 160 180
m/z
Page 46
45
Figure 14: MIKES spectra of 1-hydroxypyrene after selecting the parent ion (218 m/z). The
spectrum in blue is at 8 keV.
170 175 180 185 190 195 200 205 210 215
m/z
Page 47
46
3.1.2 MI/CID spectra
The MI/CID spectra of all hydroxy-substituted PAHs were collected using helium as a
collision gas with 10% beam reduction. MI/CID is used to study the fragmentation pattern of the
fragment ion and compare it with the CID spectra of the speculated fragment ion. For hydroxy-
substituted naphthalenes, the two speculated fragment ions were indene and 1-phenyl-1-propyne
(C9H8+.
). The MI/CID spectra for 1-naphthol and 2-naphthol are shown below:
Figure 15: MI/CID spectra of 1-naphthol, in red, and 2-naphthol, in blue, after selecting the
fragment ion at 116 m/z
10 30 50 70 90 110
m/z
Page 48
47
This is to determine which of indene or 1-phenyl-1-propyne is the fragment ion for each
molecule. The CID spectra of indene and 1-phenyl-1-propyne are shown below:
Figure 16: CID spectra of 1-phenyl-1-propyne, in blue, and indene, in red, after selecting
the parent ion for each at 116 m/z
As shown with the MI/CID spectra of each naphthol (Figure 15), the spectra are identical.
This observation means that the fragment ion for 1-naphthol and 2-naphthol are the same. To
determine the ion structure for m/z 116, the MI/CID mass spectra were compared to the CID
spectra of ionized indene and 1-phenyl-1-propyne (Figure 16), the two speculated fragment ions
of the naphthols. Those results are discussed further on in this thesis.
As for 1-phenanthrol and 9-phenanthrol, the speculated fragment ions were closed-ring
structures. However, the only available molecule for purchase for the CID was fluorene, the
speculated fragment ion of 9-phenanthrol. As a result, the MI/CID spectra of 1-phenanthrol was
10 30 50 70 90 110
m/z
Page 49
48
compared to the CID mass spectrum of fluorene in figure 17 and 18. The MI/CID spectrum of 9-
phenanthrol compared to the CID spectrum of fluorene is explained further in figure 18. All three
spectra are similar and help confirm that the speculated fragment ions are closed-ring structures.
Figure 17: MI/CID spectrum for 1-phenanthrol after selecting the fragment ion at 166 m/z
For 9-phenanthrol, collecting an adequate MI/CID spectrum was challenging. To
compare this spectrum with the CID spectrum of fluorene, the MI/CID was not taken into
account. This is because the MI/CID of 9-phenanthrol gave the same pattern as the CID of
fluorene, but with different peak ratios. With this observation, it was impossible to affirm that the
fragment ion 9-phenanthrol was a mix of multiple fragments or only fluorene. The strategy to
overcome this problem was to take the CID spectrum for fluorene the same way as usual but to
change how the spectrum collected for 9-phenanthrol was taken. For comparison purposes,
instead of collecting the MI/CID of 9-phenanthrol, the CID spectra of the fragment ion was
70 80 90 100 110 120 130 140 150 160
m/z
Page 50
49
collected from the source. This means that the energy pattern of the fragment ion of 9-
phenanthrol and fluorene are similar since both CID spectra are taken in the same conditions. By
overlapping each spectra, the fragmentation pattern is as follows:
The peak ratios are now fixed and the fragmentation pattern is now similar to the CID of
0
100000
200000
300000
400000
500000
600000
700000
70 80 90 100 110 120 130 140 150 160 170
0
50000
100000
150000
200000
250000
300000
350000
400000
450000
CID Fluorene
CID 166 9-phenanthrol
Figure 18: CID spectrum of fluorene in blue and CID spectrum of 9-phenanthrol when
selecting directly 166 m/z from the source in pink
Page 51
50
Figure 19: MI/CID spectrum of 1-hydroxypyrene after selecting the fragment ion at 190
m/z
Finally, the MI/CID spectrum for 1-hydroxypyrene was collected. However, the same
scenario applies in this case as for 1-phenanthrol. The speculated closed-ring structure for the
fragment ion was not available for purchase.
3.1.3 CID spectra
The CID spectra of indene and 1-phenyl-1-propyne were collected using helium as a
collision gas with 10% beam reduction. The purpose of this experiment is to compare the CID
spectra of indene and 1-phenyl-1-propyne to the MI/CID spectra of 1-naphthol and 2-naphthol.
50 70 90 110 130 150 170 190
m/z
Page 52
51
The CID spectra of indene and 1-phenyl-1-propyne are indistinguishable and are shown
in figure 15 and 16. This means that indene and 1-phenyl-1-propyne fragment in the same way.
Since their fragmentation pattern is the same, further experiments are needed to determine
whether indene or 1-phenyl-1-propyne is the fragment ion for 1-naphthol and 2-naphthol.
3.1.4 Calculation results
The difference in energy between indene and 1-phenyl-1-propyne was calculated using
Gaussian 09. The calculations were performed at the B3LYP/6-311+G(d,p) level. Indene is more
stable in energy than 1-phenyl-1-propyne by 1.24 eV. These calculations help to confirm that the
fragment ion loss is indene, a closed-ring structure.
Figure 20: Structure of indene (left) and 1-phenyl-1-propyne (right).
In the case of the hydroxy-substituted phenanthrenes, the method used for calculations
was the same as for the hydroxy-substituted naphthalenes. Energies for closed-ring structures
and open-ring structures for the fragment ion of 1-phenanthrol and 9-phenanthrol were
calculated, although for these cases, every open-ring structure gave a closed-ring calculated
structure. This means that the fragment prefers to remain a closed-ring structure over an open-
ring structure.
Page 53
52
Many different open-ring and closed-ring starting structures were tried for calculations
for 1-hydroxypyrene, each time resulting in a closed-ring structure. Again, this means that the
closed-ring structure is preferred for the fragment ion loss of 1-hydroxypyrene since this
fragment ion prefers to remain a closed-ring structure over an open-ring structure.
3.1.5 Mechanisms
In the dissociation, internal energy of the precursor ion is converted into the relative
translational energy of the products, a process that is called “kinetic energy release”. If this
release, which can occur in all directions, is large, then ions having a large component of this in
the z-axis direction of the instrument can miss the entrance of the ESA, causing a depression in
signal at the centre of the beam (z-axial discrimination). The result is a dish-shaped peak. A
large kinetic energy release is common if the dissociation occurs on a potential energy surface
that has a large reverse activation barrier. The internal energy of the products tends to be
statistically distributed between translational, rotational and vibrational modes of the products,
the dish-shaped peak being the observable products of the translational portion of this process. A
large reverse activation barrier is usually indicative of a intra-molecular rearrangement process
that takes place prior to dissociation. Thus, naphthol ions undergo rearrangement before losing
neutral carbon monoxide. Figures 21-25 shows possible mechanisms based on previously
reported mechanisms for CO loss from ionized phenol.13
14
Page 54
53
Figure 21: Proposed mechanism for the loss of CO for 1-naphthol
Page 55
54
Figure 22: Proposed mechanism for the loss of CO for 2-naphthol
Page 56
55
Figure 23: Proposed mechanism for the loss of CO for 1-phenanthrol
Page 57
56
Figure 24: Proposed mechanism for the loss of CO for 9-phenanthrol
Page 58
57
Figure 25: Proposed mechanism for the loss of CO for 1-hydroxypyrene
3.1.6 Extrapolation to larger PAHs
In the interstellar medium, PAHs are speculated to be of at least 50 carbons. The findings
on the hydroxy-substituted PAHs serve to be extrapolated to these bigger PAHs. By
extrapolating, the bigger PAHs in the interstellar medium would lose carbon monoxide and the
Page 59
58
fragment ion would be a closed-ring structure. This can be speculated by using the proposed
mechanisms and extrapolating them to bigger PAHs. These mechanisms always lead to a closed-
ring product and always lead to a loss of carbon monoxide. As for the calculations, the same
speculation can be established since every speculated structure rearranged to give a closed-ring
structure. Finally, calculations, proposed mechanisms and MI/CID spectra go hand-in-hand and
predict a loss of carbon monoxide for hydroxy-substituted PAHs with a remaining closed-ring
structure for PAHs of 50 carbons or more that are speculated to be present in the interstellar
medium.
3.2 –NH2 substituted PAHs
3.2.1 MIKES spectra
MIKES data were collected for five amino-substituted PAHs. Two of those PAHs have
two aromatic rings: 1-naphthylamine and 2-naphthylamine. They are constitutional isomers of
the other, meaning the amino groups are either on the alpha position or beta position. Two of
those PAHs have three aromatic rings: 1-aminoanthracene and 2-aminoanthracene. Like the
substituted naphthalene, the amino-substituted anthracenes are molecular ions that are also
constitutional isomers of each other and the position of their amino group differs by the one
position and two position. The last group of PAHs studied consisted of four aromatic rings –
substituted pyrene. Only one amino-substituted pyrene was studied since no other constitutional
isomer was available for purchase.
Page 60
59
Figure 26: MIKES spectra of 1-naphthylamine after selecting the parent ion (143 m/z). The
spectrum in blue is at 8 keV. Some H loss was also observed.
50 60 70 80 90 100 110 120 130 140
m/z
Page 61
60
Figure 27: MIKES spectra of 2-naphthylamine after selecting the parent ion (143 m/z). The
spectrum in blue is at 8 keV. Some H loss is also observed.
Molecular ions that were amino-substituted were found to always lose a neutral fragment
of 27 (presumably HCN as it is significantly more stable than HCN). Some H loss was also
observed. Since the fragmentation pattern of the MI/CID of both naphthylamines are the same as
the fragmentation patter of the MI/CID of both naphthols, HCN is the neutral compound loss and
not C2H3 (see figure 15, 16 and 30) as the product ion is consistent with the
indene/phenylacetylene structure. The resulting fragment ion is at the same mass as the
hydroxy-substituted counterparts. For the amino- and hydroxy-substituted naphthalene molecular
ions, the fragment ion is found to always have a 116 m/z.
50 60 70 80 90 100 110 120 130 140
m/z
Page 62
61
The peak at 116 m/z for the amino substituted naphthalene was of a Gaussian shape
unlike hydroxy-substituted PAHs.
Figure 28: MIKES spectra of 1-aminoanthracene after selecting the parent ion (193 m/z).
The spectrum in blue is at 8 keV.
100 110 120 130 140 150 160 170 180 190
m/z
Page 63
62
Figure 29: MIKES spectra of 2-aminoanthracene after selecting the parent ion (193 m/z).
The spectrum in blue is at 8 keV.
3.2.2 MI/CID spectra
The MI/CID spectra of 1-naphthylamine and 2-naphthylamine were collected to
determine whether indene or 1-phenyl-1-propyne was the fragment ion in each case by
comparing them with the CID spectra for indene and 1-phenyl-1-propyne. The MI/CID spectra
of 1-naphthylamine and 2-naphthylamine were collected using helium as a collision gas with
10% beam reduction. The MI/CID spectra of 1-naphthylamine and 2-naphthylamine are shown
below:
100 110 120 130 140 150 160 170 180 190
m/z
Page 64
63
Figure 30: MI/CID spectra of 1-naphthylamine, in blue, and 2-naphthylamine, in red, after
selecting the fragment ion at 116 m/z
The scenario in this case is the same as for the naphthols: the spectra are identical. Again,
this means that the fragment ion for 1-naphthylamine and 2-naphthylamine are the same. Since
the two speculated fragment ions of the naphthylamines are indene and 1-phenyl-1-propyne,
determining which molecule the fragment ion is using the MI/CID spectra of each
naphthylamine by comparing them to the CID spectra of indene and 1-phenyl-1-propyne would
help distinguish them. As discussed earlier, the CID spectra of indene and 1-phenyl-1-propyne
are indistinguishable (figure 17) and thus we have to rely on calculations to conclude that indene
was the more stable product ion and thus the one most likely to be produced. It is then possible
10 30 50 70 90 110
Page 65
64
to conclude that the substituent does not matter and that indene is always the fragment ion for
both the naphthols and the naphthylamines.
As for the remaining amino-substituted PAHs, the speculated structure for each fragment
ion was not purchasable. Even then, the spectra were collected for 1-aminoanthracene, 2-
aminoanthracene and 1-aminopyrene. The spectra are shown below:
Figure 31: MI/CID spectra of 2-aminoanthracene, in red, and 1-aminoanthracene, in blue,
after selecting the fragment ion at 166 m/z
3.2.3 CID spectra
These experiments were important to perform on indene and 1-phenyl-1-propyne to
determine if they were the resulting fragments in the MIKES spectra of 1-naphthylamine and 2-
10 30 50 70 90 110 130 150 170
m/z
Page 66
65
naphthylamine. The figure comparing indene and 1-phenyl-1-propyne were presented earlier in
figure 16. As stated previously, the CID spectra for indene and 1-phenyl-1-propyne are the same.
Thus, the two structures are indistinguishable.
3.2.4 Calculation results
All amino-substituted PAHs lose HCN and the fragment ion is always a closed-ring
structure for every molecular ion. This can be explained by calculating the energy of a closed-
ring structure versus an open-ring structure. The two possibilities for the amino-substituted
naphthalenes were the same as for the hydroxy-substituted naphthalenes. Indene was the
possibility for a closed-ring structure and 1-phenyl-1-propyne was the possibility for an open-
ring structure. As stated earlier, indene is more stable in energy than 1-phenyl-1-propyne by 1.24
eV. These calculations help to confirm that the fragment ion loss is indene, a closed-ring
structure. These results mean that the position and the nature of the substituent is not an
important factor to obtain indene as a fragment ion. In all cases for substituted naphthalene, the
fragment ion was always a closed-ring structure, indene.
In the case of the amino-substituted anthracenes, the method used for calculations was the
same as for the amino-substituted naphthalenes. Energies for closed-ring structures and open-
ring structures for the fragment ion of 1-aminoanthracene and 2-aminoanthracene were
calculated, although for these cases, every open-ring structure gave a closed-ring calculated
structure. This means that the fragment prefers to remain a closed-ring structure over an open-
Page 67
66
ring structure. Confirmation of these calculations using MI/CID was discussed earlier in this
thesis.
Many different open-ring and closed-ring starting structures were tried for calculations
for 1-aminopyrene, each time resulting in a closed-ring structure. Again, this means that the
closed-ring structure is preferred for the fragment ion loss of 1-aminopyrene since this fragment
ion prefers to remain a closed-ring structure over an open-ring structure.
3.2.5 Mechanisms
The speculated rearrangements amino-substituted PAHs undergo are shown below
(figures 32-36):
Figure 32: Proposed mechanism for the loss of HCN for 1-naphthylamine
Page 68
67
Figure 33: Proposed mechanism for the loss of HCN for 2-naphthylamine
Figure 34: Proposed mechanism for the loss of HCN for 1-aminoanthracene
Page 69
68
Figure 35: Proposed mechanism for the loss of HCN for 2-aminoanthracene
Figure 36: Proposed mechanism for the loss of HCN for 1-aminopyrene
Page 70
69
3.2.6 Extrapolation to larger PAHs
Since the interstellar medium is believed to be populated by bigger PAHs of at least 50
carbons, extrapolation is needed. Those bigger PAHs are not possible to study using our setup
because their vapor pressure is too low. However, using the results found for the MIKES
experiments, extrapolation can be done. If the trend continues, bigger amino-substituted PAHs
should also lose 27 m/z which is HCN. The same trend could be seen for the bigger amines,
which would always lose 27 m/z which is HCN.
Page 71
70
Chapter 4. Protonated PAHs
Protonation of the PAHs studied in this thesis was attempted.15
16
17
18
The goal was to
investigate if the proton would attached to the hydroxy group and amino group to eventually lose
water and ammonia. Since the most abundant atom in the universe is hydrogen, the likelihood of
one proton finding a PAH to react with is greater than any other possibility. Finding how
hydroxy-substituted PAHs and amino-substituted PAHs reacted in presence of such a proton
would thus be interesting to investigate. Finding a trend to relate the results to larger PAHs was
also investigated and is further detailed later in this thesis.
Some calculations were performed to find the proton affinity of each compound being
studied to investigate if protonation was possible in the gas-phase. Calculations were performed
before protonating because the proton affinity needed to be investigated to determine if it was
worth attempting to protonate. If the proton affinity calculated would let protonation to occur, the
experiment to protonate each PAHs using a VG-ZAB and methane would thus begin.
4.1 Calculations
Calculations were performed using the High Performance Computing Virtual Laboratory
(HPCVL). The level of theory used for all calculations was B3LYP/6-311+G(d,p) and MP2/6-
311+G(d,p). The proton affinity of each molecular ion studied were calculated. The equation
used to calculate the proton affinity is as follow:
Page 72
71
Table 1: Proton affinities (eV) of the PAHs studied in this thesis, calculated using two
different methods
Molecules B3LYP MP2
1-naphthol 8.10 8.06
2-naphthol 7.83 7.79
1-naphthylamine 9.17 9.16
2-naphthylamine 9.15 9.16
1-phenanthrol 7.88 7.80
9-phenanthrol 7.84 7.78
1-aminoanthracene 9.25 9.22
2-aminoanthracene 9.22 9.22
1-hydroxypyrene 7.95 7.85
1-aminopyrene 9.25
Two methods were used for the calculations to ensure the reliability of the DFT
calculation. To ensure DFT was reliable, MP2 was used. By looking at the calculated proton
affinities, MP2 ensures that DFT is a reliable method of calculation because the numbers given
by each calculation are very close.
The results show that for the naphthols, it is easier to protonate 1-naphthol by 0.27 eV,
which is a much greater difference in proton affinity than the rest of the compounds when
comparing the constitutional isomers.
Page 73
72
The calculations showed that 1-hydroxypyrene and 1-aminopyrene were 1.30 eV apart
when looking at their proton affinities. As previously mentioned, the amino-substituted
counterparts were easier to protonate than the hydroxy-substituted compounds. Again, by
calculating the HOMO of the neutral molecule and the protonated molecular ion, the electronic
density around the –H2O was smaller than the one surrounding the –NH3 group. If the trend
continues, the observation would be that the proton affinity would increase with the size of the
PAH. However, even though bigger PAHs would have a higher proton affinity than smaller
PAHs, the proton affinity does not continue to get larger indefinitely.19
Since the interstellar
medium is believed to have bigger PAHs, this trend is important to establish. Protonation would
be possible on the bigger alcohols and amines PAHs.
Page 74
73
4.2 Protonation of 1-naphthol and 2-naphthol using the VG-ZAB
The protonation of 1-naphthol and 2-naphthol was achieved in a high-pressure source
using methane by performing chemical ionization. Two MI processes were observed in the
MIKES spectrum of protonated 1-naphthol and 2-naphthol, m/z 145 (Figures 37, 38).
Figure 37: Mass spectrum depicting the relative intensity of the M+1 peak being a mix of
[M+H]+
and 13
C M+.
and the M+.
peak
Page 75
74
Figure 38: MIKES spectrum of protonated 2-naphthol after selecting m/z 145. (X) shows
collisional artifacts
Loss of H2O and CO are evident. However, it is possible that CO loss is coming from the
M+. ion having one 13
C atom, which also has m/z 145 and has a relative abundance of 10% of
the peak at m/z 144, overlapping the peak for protonated naphthol. (Figure 37) To determine the
origin of the CO loss peak, the ratio of the intensity of the H2O loss vs the CO loss peaks in the
MIKES spectra were measured as a function of the relative intensity of M+.
at m/z 144 to the
peak of m/z 145 (Figures 37-38). As the protonation increases, the loss of H2O becomes more
and more dominant. This means that the CO loss comes exclusively from the carbon-13
contribution of M+.
and not from the protonated molecule. This can be explained since loss of
water becomes more and more dominant. If carbon monoxide loss came from the protonated
Page 76
75
molecule and not from the carbon-13 contribution, the ratio would stay the same for each ratio of
M+1 to M. This is clearly not the case in this study. The same trend is observed for the
protonation of 2-naphthol. The loss of water becomes more and more dominant as the
protonation increases, meaning that CO loss comes again exclusively from the carbon-13
contribution and not from the protonated species.
Protonation was studied using the above process since it was not possible to protonate 1-
naphthol and 2-naphthol to the point where their M+.
peak would be almost non-existent, making
the carbon-13 contribution to m/z 145 meaningless.
Figure 39: Graph showing the protonation of 1-naphthol using methane as a chemical
ionization gas. The ratios between loss of 18 m/z and 28 m/z were plotted as a function of
the ratio of the M+1 protonated peak to the parent ion peak M.
0
20
40
60
80
100
120
140
0 20 40 60 80 100 120
He
igh
t o
f H
2O
co
mp
are
d t
o C
O (
%)
Height of M+1 compared to M (%)
Protonation of 1-naphthol
Page 77
76
Figure 40: Graph showing the protonation of 2-naphthol using methane as a chemical
ionization gas. The ratios between loss of 18 m/z and 28 m/z were plotted as a function of
the ratio of the M+1 protonated peak to the parent ion peak M.
20
70
120
170
220
270
320
370
420
470
0 10 20 30 40 50 60 70 80 90 100 He
igh
t o
f H
2O
co
mp
are
d t
o C
O (
%)
Height of M+1 compared to M (%)
Protonation of 2-naphthol
Page 78
77
Based on these experiments, the proposed mechanism for the loss of water is shown
below:
Figure 41: Proposed mechanism for the loss of water from protonated 1-naphthol
Figure 42: Proposed mechanism for the loss of water from protonated 2-naphthol
4.3 Protonation of the amines
Protonation was not possible for amino-substituted molecules nor bigger hydroxy-
substituted PAHs since the ratio between the pressure of methane and the number of ions was not
Page 79
78
optimal for protonation. Thus, breakdown diagrams of protonated 2-naphthylamine and
protonated 2-aminoanthracene were obtained on a QTOF2 mass spectrometer using an ESI
source.
For the protonated 2-naphthylamine, which is the smallest amino-substituted PAH
studied, the dominant loss was NH3 loss and goes as high as 65% intensity around a center-of-
mass collision energy of 6 eV. Proton loss is also seen as the second-most dominant channel but
doesn't go as high as NH3 loss. The intensity of proton loss peaks around 15% at center-of-mass
collision energy of 5 eV. HCN loss is the third-most dominant channel for protonated 2-
naphthylamine, peaking around 10% intensity at around center-of-mass collision energy of 4.5
eV. The proposed mechanism for the loss of ammonia for 2-naphthylamine is as follow:
Figure 43: Proposed mechanism for the loss of ammonia from protonated 2-naphthylamine
The bond dissociation energy for N-H on a NH3 group is around 435 kJ/mol while the
bond dissociation energy for C-H on an aromatic ring is around 431 kJ/mol.20
Since the two bond
dissociation energies are so close, the proton could come from the NH3 group and from the PAH
Page 80
79
ring, given they have enough energy to dissociate. The proposed mechanism for proton loss is as
follow:
Figure 44: Proposed mechanism for the loss of hydrogen from protonated 2-
naphthylamine. The first possibility is proton loss from the NH3 group (top) and the second
possibility is hydrogen loss for the aromatic ring (bottom).
As for protonated 2-aminoanthracene, the same experiment as for 2-naphthylamine was
repeated to study if the same pattern was repeating for a larger protonated PAH. For this
protonated PAH with three rings, the dominant loss now is hydrogen loss and not ammonia loss.
The second-most dominant loss is NH3 loss for protonated 2-aminoanthracene. This is compared
in the following figures:
Page 81
80
Figure 45: Breakdown diagram of protonated 2-naphthylamine using MS/MS on a Q-TOF
instrument. The collision energy used was from 6.00 to 35.00 eV (E lab.) by increments of 1.
The breakdown diagram was plotted using the relative intensities of each fragment ion.
0%
10%
20%
30%
40%
50%
60%
70%
80%
90%
100%
0.00 1.00 2.00 3.00 4.00 5.00 6.00 7.00 8.00
2-naphthylamine (144.1)
-H (143.1)
-Nh3 (127)
126 (126)
-HCN (117.1)
116 (116)
115 (115)
101 (101)
91 (91)
77 (77)
Page 82
81
Figure 46: Breakdown diagram of protonated 2-aminoanthracene using MS/MS on a Q-
TOF instrument. The collision energy used was from 6.00 to 35.00 eV (E lab.) by
increments of 1. The breakdown diagram was plotted using the relative intensities of each
fragment ion.
As seen in these previous figures, ammonia loss is not the most dominant loss anymore
for a protonated PAH bigger than two rings. The most dominant loss is now hydrogen loss. To
compare, for 2-naphthylamine, ammonia loss has a relative intensity of about 65% whereas for
2-aminoanthracene, ammonia loss has a relative intensity of about 20%. The relative intensity of
ammonia loss dropped significantly. As for hydrogen loss, for 2-naphthylamine, the relative
intensity is about 15% whereas it is about 50% for 2-aminoanthracene. The intensity of hydrogen
loss is significantly higher when a ring is added to the protonated PAH. Again, the bond
dissociation energy for a hydrogen on an aromatic ring versus on a NH3 group differ for
approximately 4 kJ/mol.20
This means that the hydrogen could come either from the NH3 group
0%
10%
20%
30%
40%
50%
60%
70%
80%
90%
100%
0.00 2.00 4.00 6.00 8.00
2-aminoanthracene (194.1)
-H (193.1)
-NH3 (177.1)
-HCN (167.1)
166 (166.1)
165 (165.1)
152 (152.1)
151 (151.1)
141 (141)
naphthalene (128.1)
Page 83
82
or the aromatic or both. A proposed mechanism for ammonia loss and hydrogen loss from
protonated 2-aminoanthracene is shown below:
Figure 47: Proposed mechanism for the loss of ammonia from protonated 2-
aminoanthracene
Figure 48: Proposed mechanism for the loss of a hydrogen from protonated 2-
aminoanthracene. The first possibility is hydrogen loss from the NH3 group (top) and the
second possibility is hydrogen loss for the aromatic ring (bottom).
Page 84
83
By extrapolating to the bigger PAHs than three rings, hydrogen loss would probably be
the most dominant loss and ammonia would become non-existent or very small. Since that in the
interstellar medium, PAHs of at least 50 carbons are believed to exist, hydrogen loss from
protonated amino-substituted PAHs would be the dominant loss and the most important loss to
take into account to extrapolate to larger systems. Based on the bond dissociation energy of
proton loss from a NH3 group and an aromatic ring, hydrogen loss would occur most probably on
both sites. Thus, protonated amino PAHs are unlikely to produce NH3 in the ISM, drawing into
question the catalytic role of PAHs in this process.
Page 85
84
Chapter 5. Conclusions
The gas-phase ion chemistry of hydroxy-substituted and amino-substituted polycyclic
aromatic hydrocarbons and their protonated counterparts were studied using a VG-ZAB sector
mass spectrometer and a QTOF2 mass spectrometer. Hydroxy-substituted PAHs were found to
lose carbon monoxide whereas amino-substituted PAHs were found to lose HCN. The remaining
fragments from carbon monoxide and HCN loss were found to be closed rings. For ionized 1-
naphthol, 2-naphthol, 1-naphthylamine and 2-naphthylamine, the remaining fragment was found
to be ionized indene. For ionized 9-phenanthrol, the remaining fragment was found to be ionized
fluorene. All other fragments were found using DFT calculations with the B3LYP functional.
These trends can be extrapolated to the more meaningful and bigger PAHs of more than 50
carbons.
Protonation was achieved for 1-naphthol and 2-naphthol using a high-pressure source and
methane. It was found that carbon monoxide loss came exclusively from the carbon-13
contribution of the parent ion and that H2O loss was from the protonated 1-naphthol and 2-
naphthol. For the protonation of amino-substituted PAHs, the most dominant channel using a
QTOF2 breakdown diagram was NH3 loss for 2-naphthylamine and hydrogen loss from 2-
aminoanthracene, ammonia loss being the second-most dominant loss. Extrapolating to the
bigger PAHs of 50 carbons or more, the most dominant loss would most probably be hydrogen
loss from either the aromatic ring or the NH3 group based on their bond dissociation energies,
which are very close.
Page 86
85
The goal of this project was to extrapolate our findings to the bigger PAHs of more than
50 carbons believed to populate the interstellar medium. Hydroxy-substituted PAHs lose
spontaneously carbon monoxide and amino-substituted PAHs lose HCN. The remaining
structure is always a closed-ring structure as explained previously. As for protonated hydroxy-
substituted PAHs, water was spontaneously lost and carbon monoxide loss was only from the
carbon-13 contribution of the M+1 peak. However, for amino-substituted PAHs that were
studied using a QTOF2, as the PAHs got bigger, the dominant channel was hydrogen loss, but
for the smallest ones like 2-naphthylamine, the dominant channel was found to be ammonia loss.
In the future, it would be interesting to explore the reactions between clusters of PAHs and to
study the insertion of water and ammonia in PAHs that have lost a hydrogen to compare them to
the protonated hydroxy-substituted PAHs and amino-substituted PAHs. Again, extrapolation to
bigger PAHs will be important to compare the smaller systems studied to the systems believed to
be found in the interstellar medium.
Page 87
86
Contributions to Original Research
1- An EI source using a VG-ZAB mass spectrometer was used to determine a trend for the
fragmentation patterns using MIKES, CID and MI/CID of hydroxy-substituted PAHs and amino-
substituted PAHs and how they related to one another. Ten different PAHs were studied: 1-
naphthol, 2-naphthol, 1-phenanthrol, 9-phenanthrol, 1-hydroxypyrene, 1-naphthylamine, 2-
naphthylamine, 1-aminoanthracene, 2-aminoanthracene, 1-aminopyrene.
2- The effects of protonating 1-naphthol and 2-naphthol on the VG-ZAB mass spectrometer
using a high-pressure source with the help of methane was investigated for the first time.
3- Comparison with the protonation of 2-naphthylamine and 2-aminoanthracene on a QTOF2
apparatus was achieved for the first time. It would be therefore useful to try protonating these
PAHs using different mass spectrometers and comparing the results.
Page 88
87
References
1 Joblin C.; Tielens A.G.G.M., EAS Publications Series, 2011, 46, 427-440
2 Snow T. P.; Le Page V.; Keheyan Y.; Bierbaum V. M., Nature, 1998, 391, 269-260
3 Sebree J. A.; Kislov V. V.; Mebelb A. M.; Zwier T. S., Faraday Discuss., 2010, 147, 231–249
4 Sakon I.; Onaka T.; Ishihara D.; Ootsubo T.; Yamamura I.; Tanabe T.; Roellig T. L., ApJ,
2004, 609, 203-219
5 Chan K.-W.; Roellig T. L.; Onaka T.; Mizutani M.; Okumura K.; Yamamura I.; Tanabe T.;
Shibai H.; Nakagawa T.; Okuda H., ApJ, 2000, 546, 273-278
6 Tielens A.G.G.M., Annu. Rev. Astron. Astrophys., 2008, 46, 289–337
7 Sakon I.; Onaka T.; Ishihara D.; Ootsubo T.; Yamamura I.; Tanabe T.; Roellig T. L., ApJ, 2004,
609, 203-219 8 Mayer P. M., The Encyclopedia of Chemical Physics and Physical Chemistry Volume II:
Methods, 2001, 1147-1174 9 NIST Chemistry Webbook, NIST standard reference database national institute of standards
and technology, 2011-2014 10
Sigma-Aldrich, Sigma-Aldrich Co. LLC., 2011-2013 11
Gaussian 09, Revision D.01, Frisch, M. J.; Trucks, G. W.; Schlegel, H. B.; Scuseria, G. E.;
Robb, M. A.; Cheeseman, J. R.; Scalmani, G.; Barone, V.; Mennucci, B.; Petersson, G. A.;
Nakatsuji, H.; Caricato, M.; Li, X.; Hratchian, H. P.; Izmaylov, A. F.; Bloino, J.; Zheng, G.;
Sonnenberg, J. L.; Hada, M.; Ehara, M.; Toyota, K.; Fukuda, R.; Hasegawa, J.; Ishida, M.;
Nakajima, T.; Honda, Y.; Kitao, O.; Nakai, H.; Vreven, T.; Montgomery, J. A., Jr.; Peralta, J. E.;
Ogliaro, F.; Bearpark, M.; Heyd, J. J.; Brothers, E.; Kudin, K. N.; Staroverov, V. N.; Kobayashi,
R.; Normand, J.; Raghavachari, K.; Rendell, A.; Burant, J. C.; Iyengar, S. S.; Tomasi, J.; Cossi,
M.; Rega, N.; Millam, N. J.; Klene, M.; Knox, J. E.; Cross, J. B.; Bakken, V.; Adamo, C.;
Jaramillo, J.; Gomperts, R.; Stratmann, R. E.; Yazyev, O.; Austin, A. J.; Cammi, R.; Pomelli, C.;
Ochterski, J. W.; Martin, R. L.; Morokuma, K.; Zakrzewski, V. G.; Voth, G. A.; Salvador, P.;
Dannenberg, J. J.; Dapprich, S.; Daniels, A. D.; Farkas, Ö.; Foresman, J. B.; Ortiz, J. V.;
Cioslowski, J.; Fox, D. J. Gaussian, Inc., Wallingford CT, 2009. 12
High Performance Computing Virtual Laboratory, Compute Calcul Canada, 2011-2014 13
Boyd D. R.; Daly J. W.; Jerina D. M., Biochemistry, 1972, 11, 1961-1966
Page 89
88
14
Zhu L.; Bozzelli J. W.; J. Phys. Chem. A, 2003, 107, 3696-3703 15
Alata I.; Omidyan R.; Broquier M.; Dedonder C.; Dopferc O.; Jouvetab C.; Phys. Chem. Chem.
Phys., 2010, 12, 14456–14458
16
Auea D. H.; Guidonia M.; Betowski L.D.; Int. J. Mass Spec., 2000, 201, 283–295 17
Joblin C.; Tielens A.G.G.M., EAS Publications Series, 2011, 46, 373-379 18
Ricca A.; Bauschlicher C. W. Jr.; Allamandola L. J., ApJ, 2011, 727, 128-133 19
Lossing F. P.; Holmes J. L., J. Am. Chem. Soc., 1984, 106 (23), 6917–6920 20
Cottrell T. L., The Strengths of Chemical Bonds, 2d ed., Butterworth, London, 1958; Darwent
B. de B., National Standard Reference Data Series, National Bureau of Standards, 31,
Washington, 1970; Benson S. W., J. Chem. Educ. 42:502, 1965; Kerr J. A., Chem. Rev. 66:465,
1966


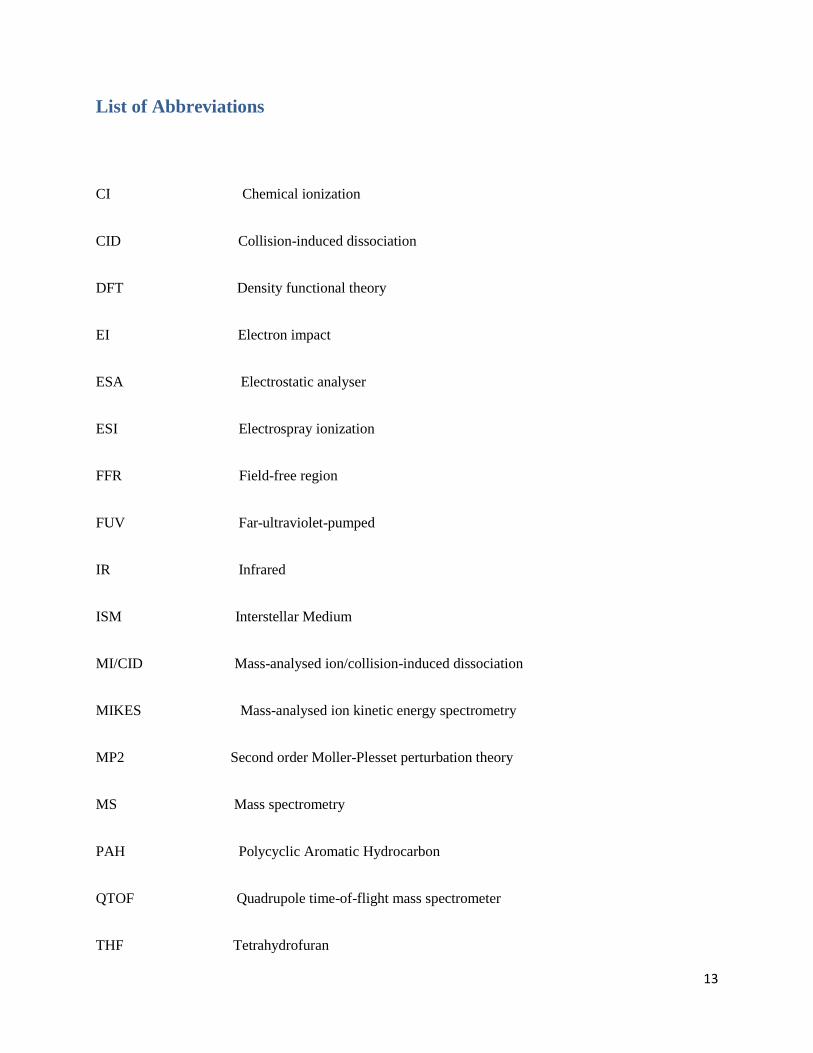

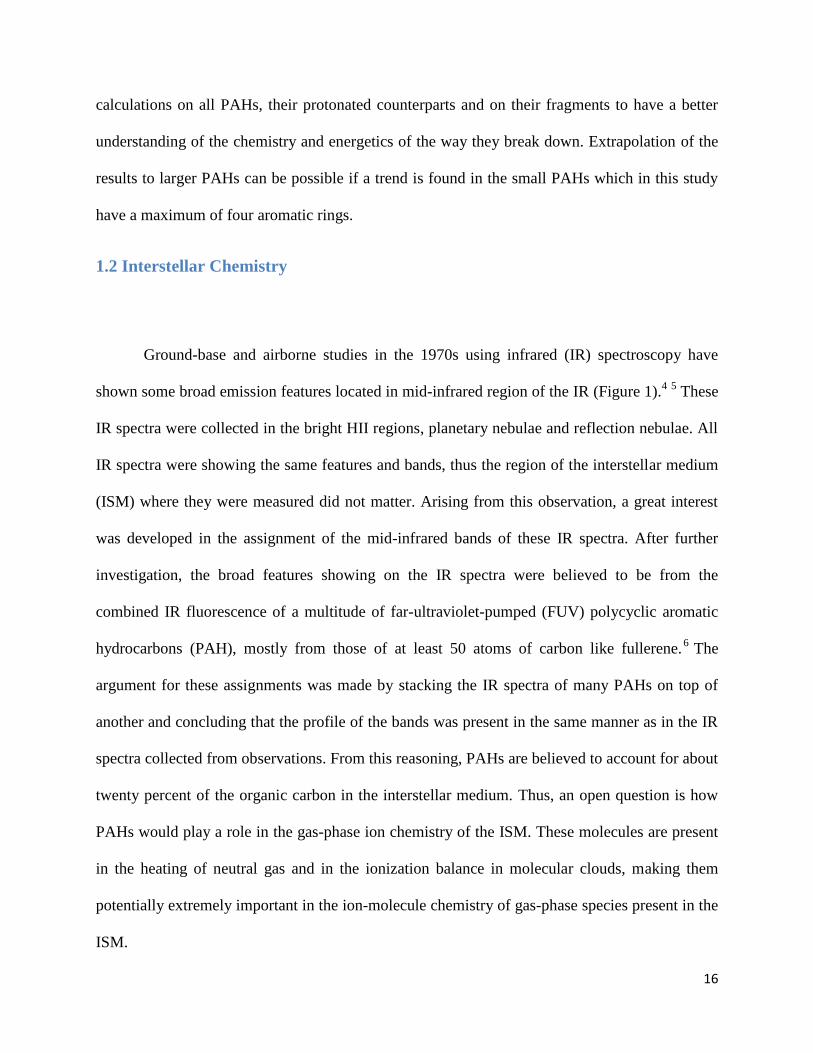
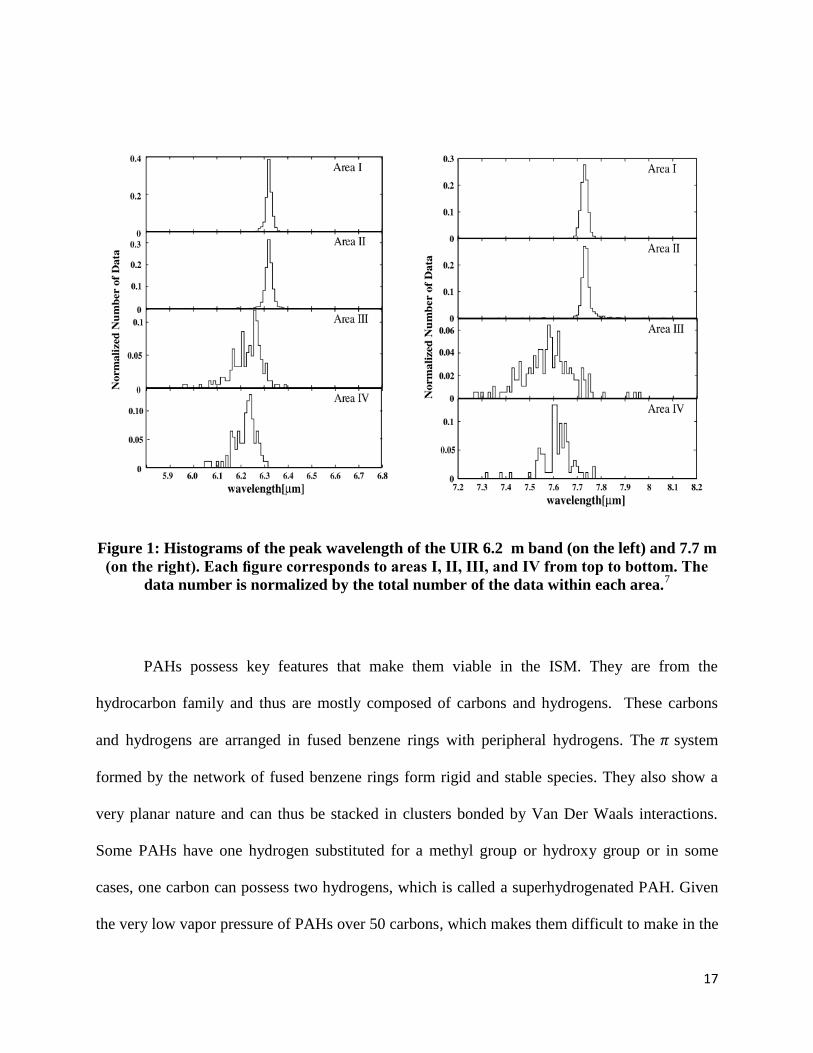
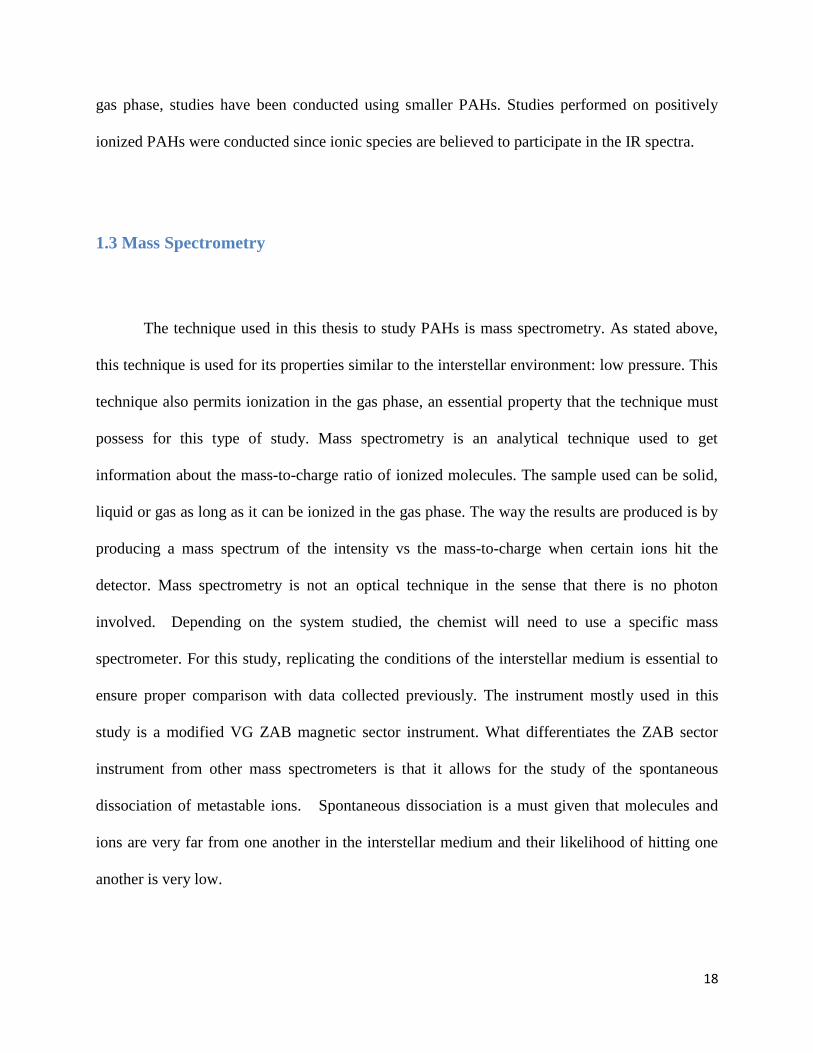
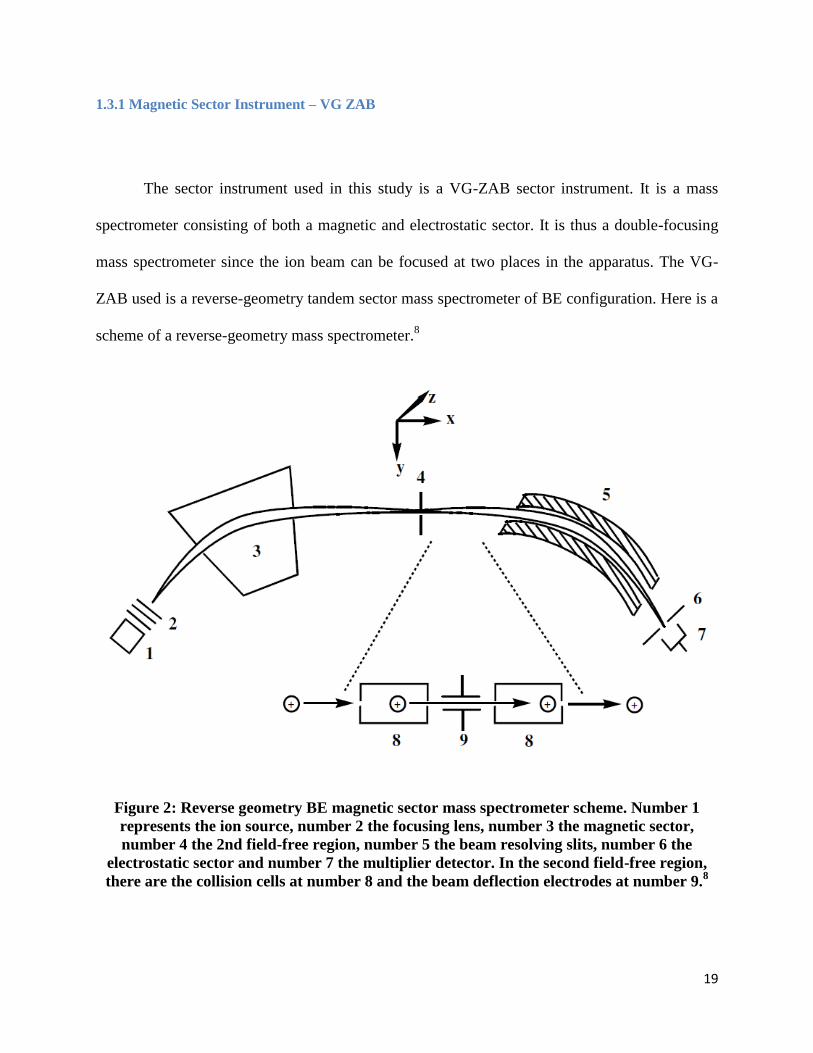
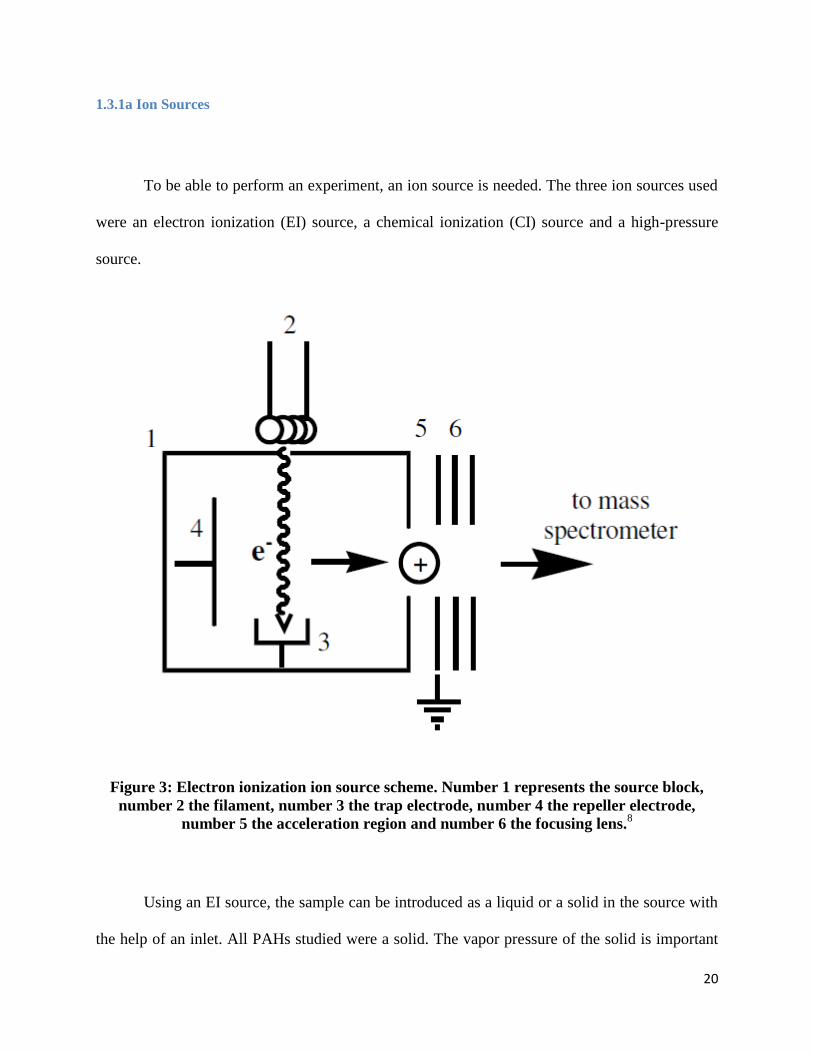
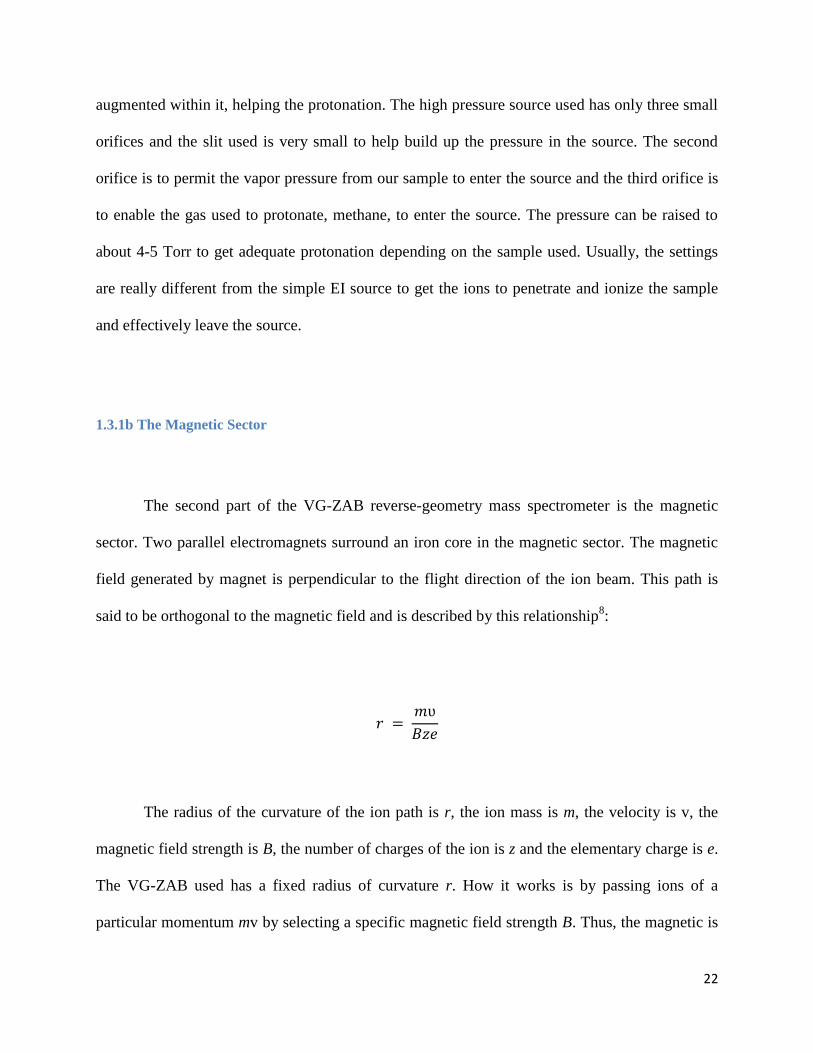
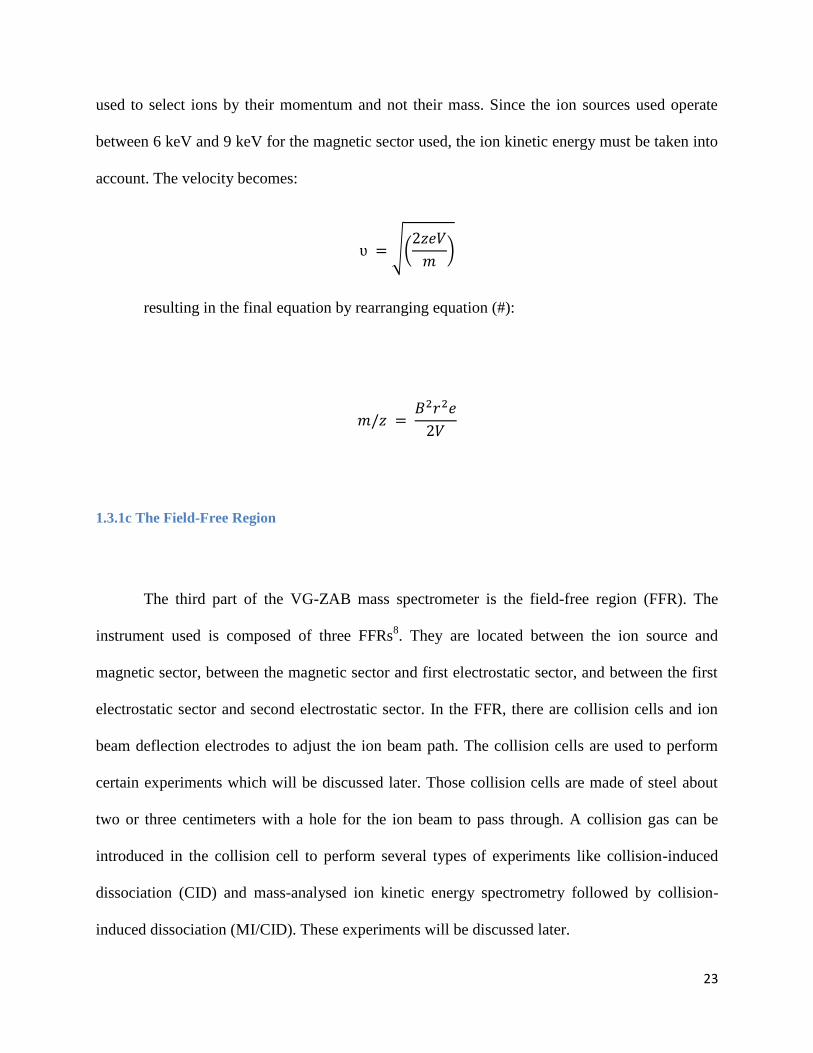
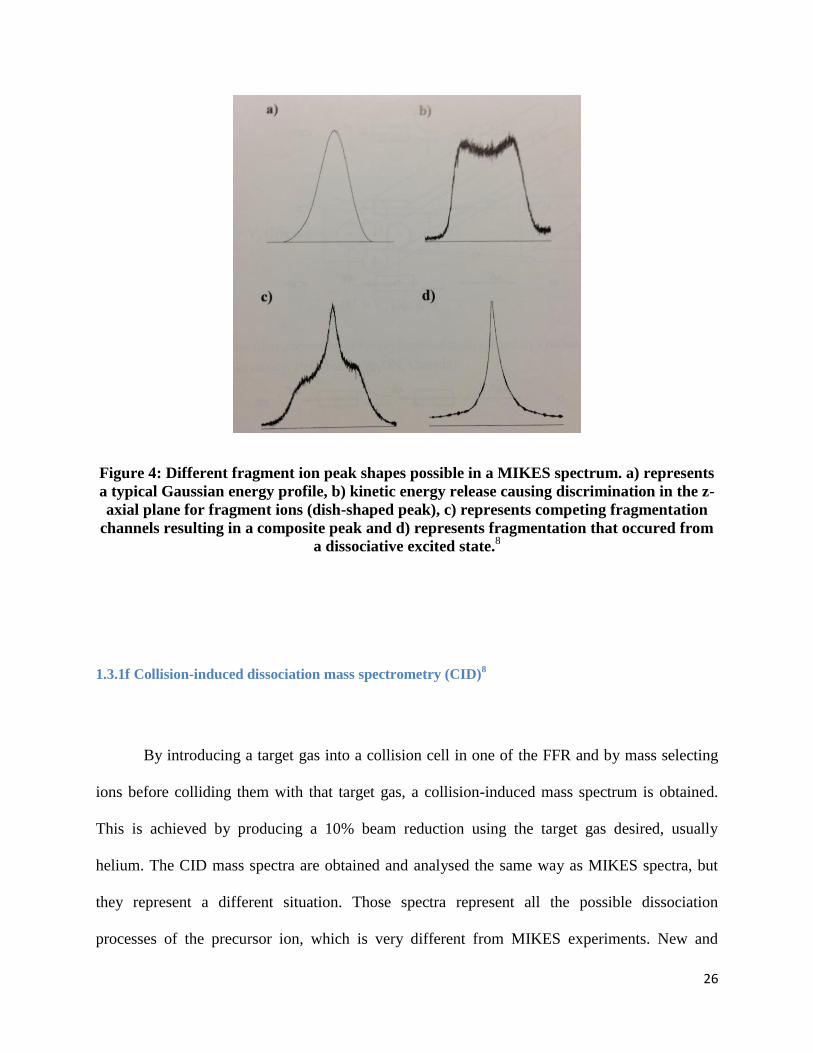
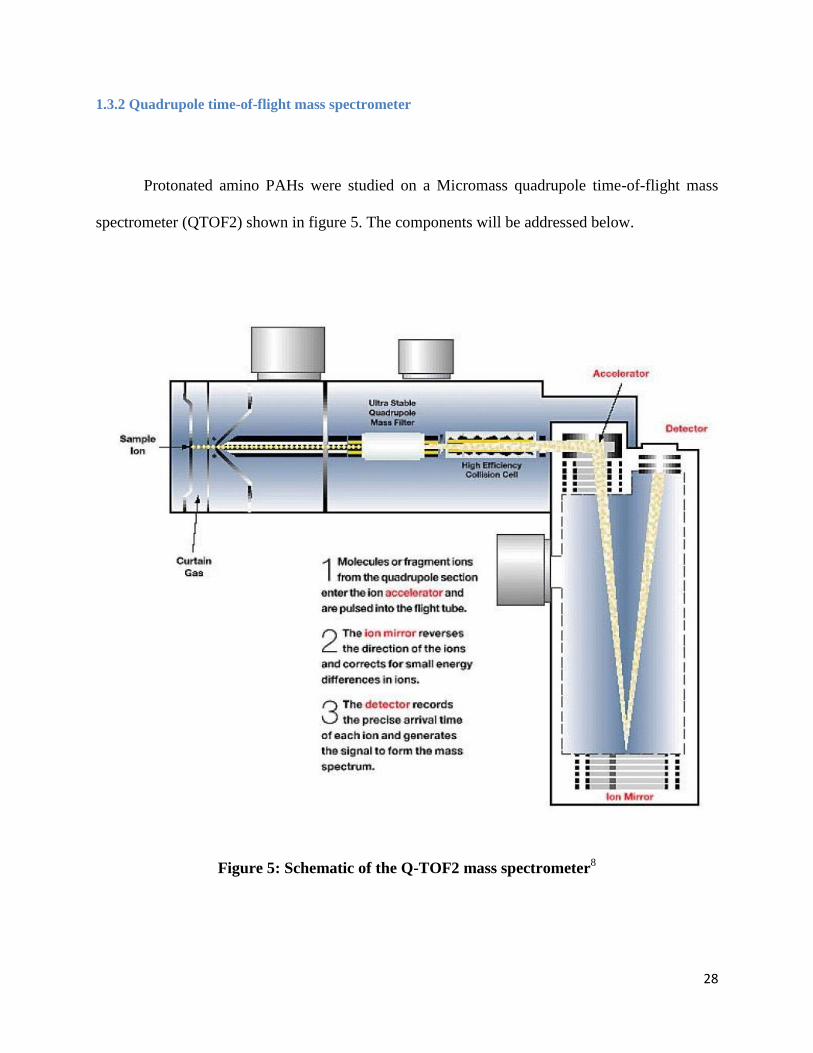
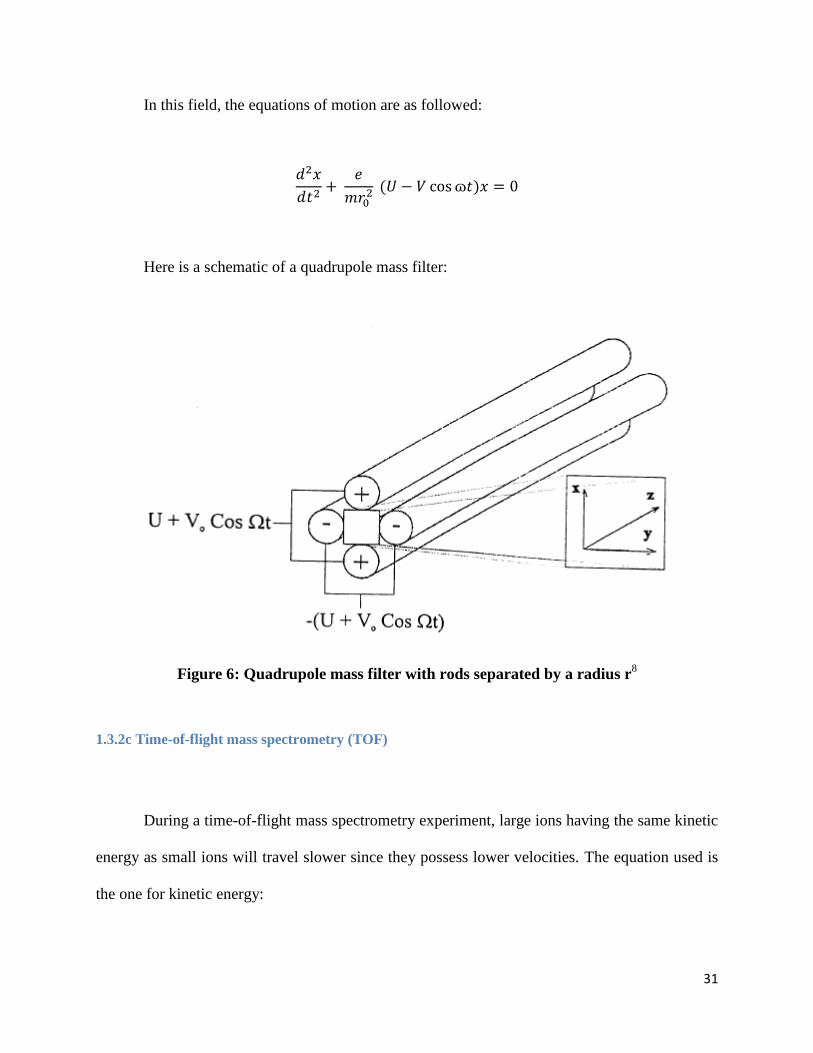
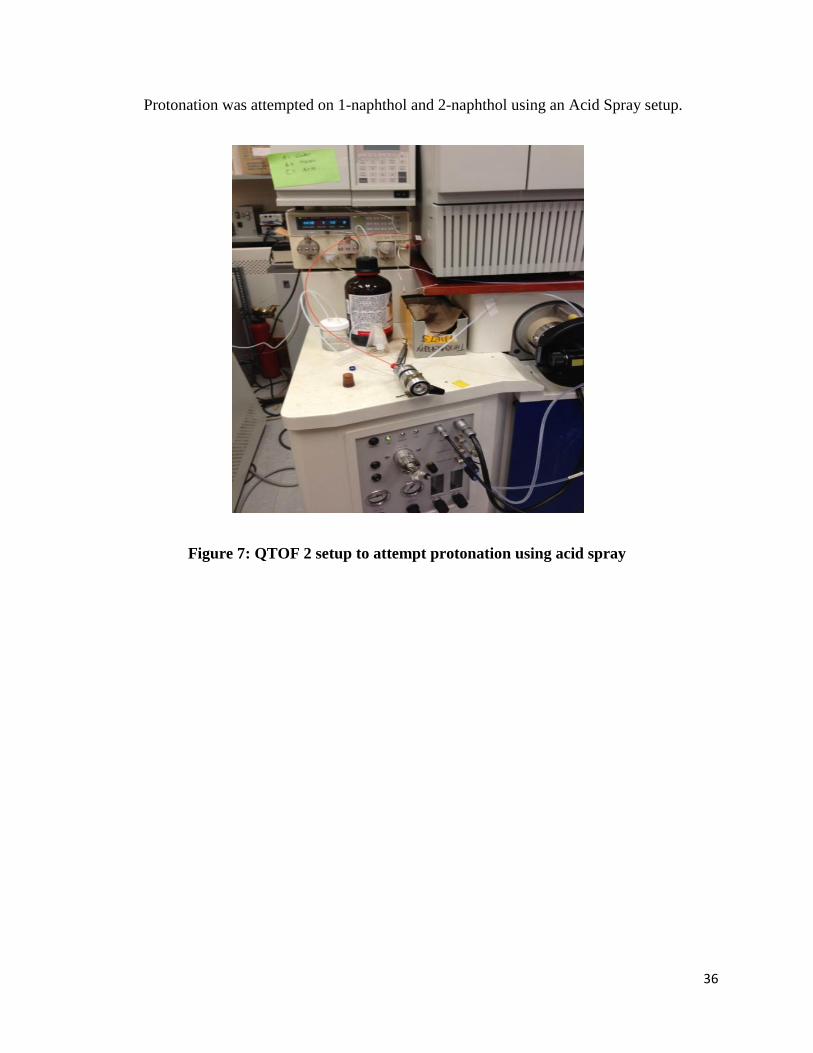
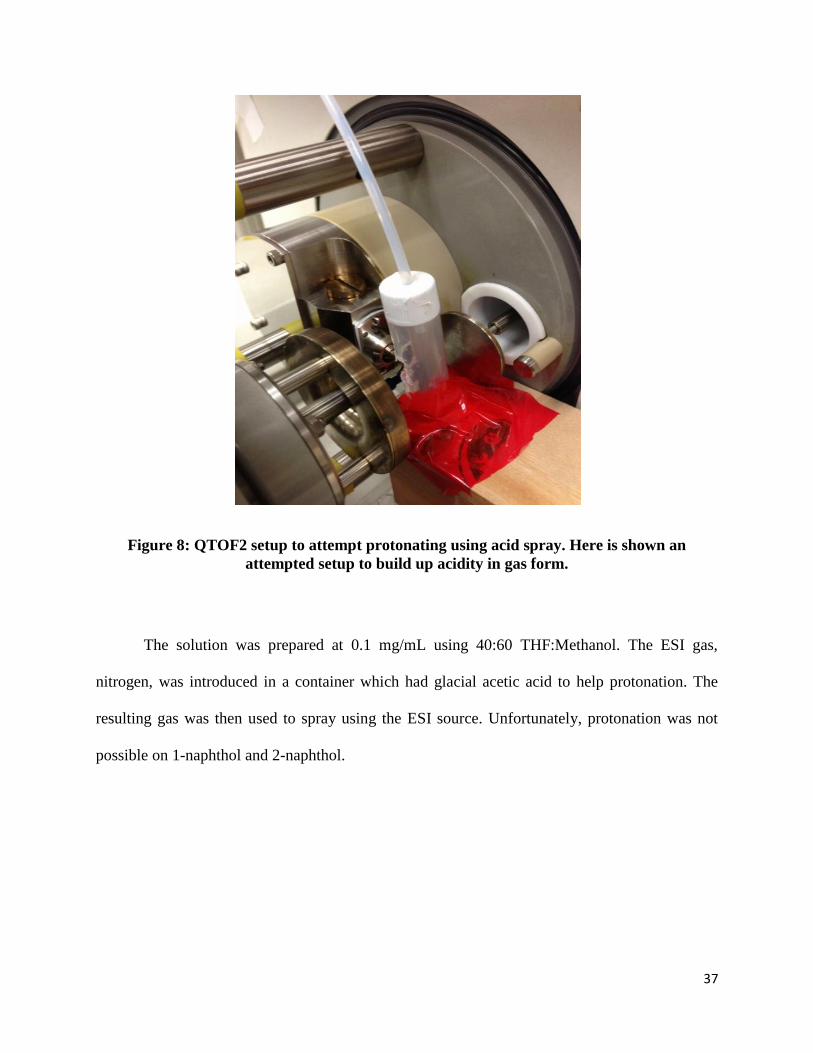
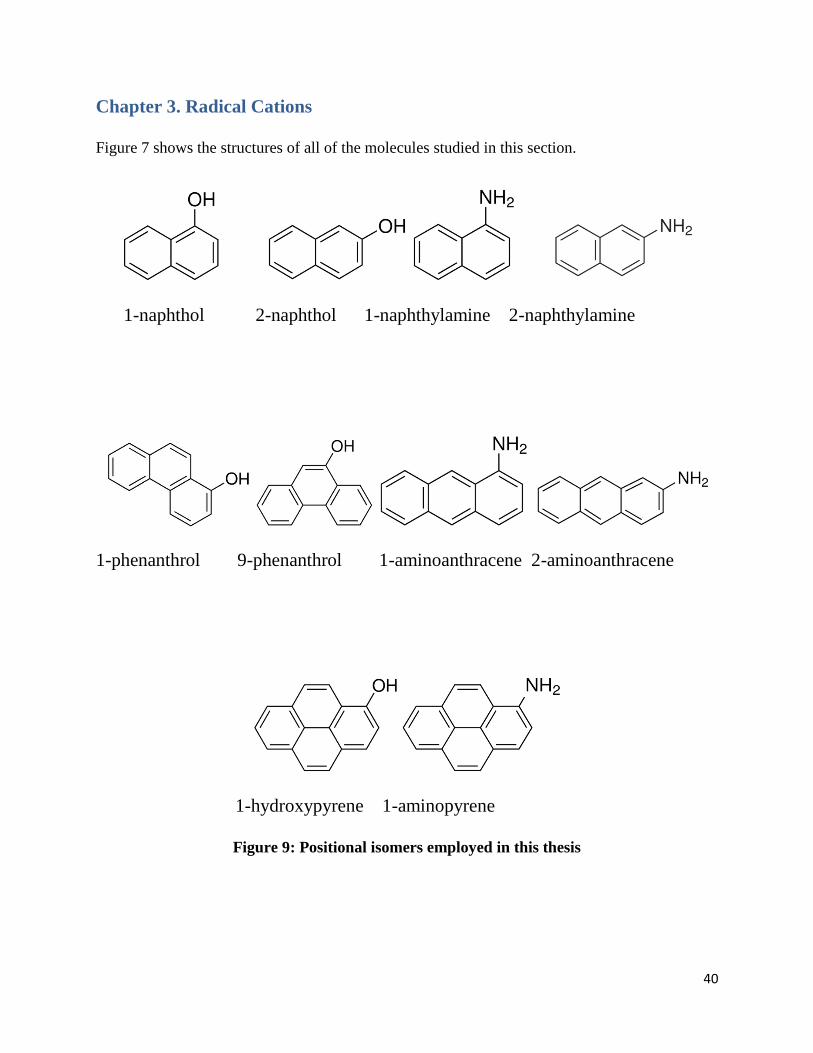
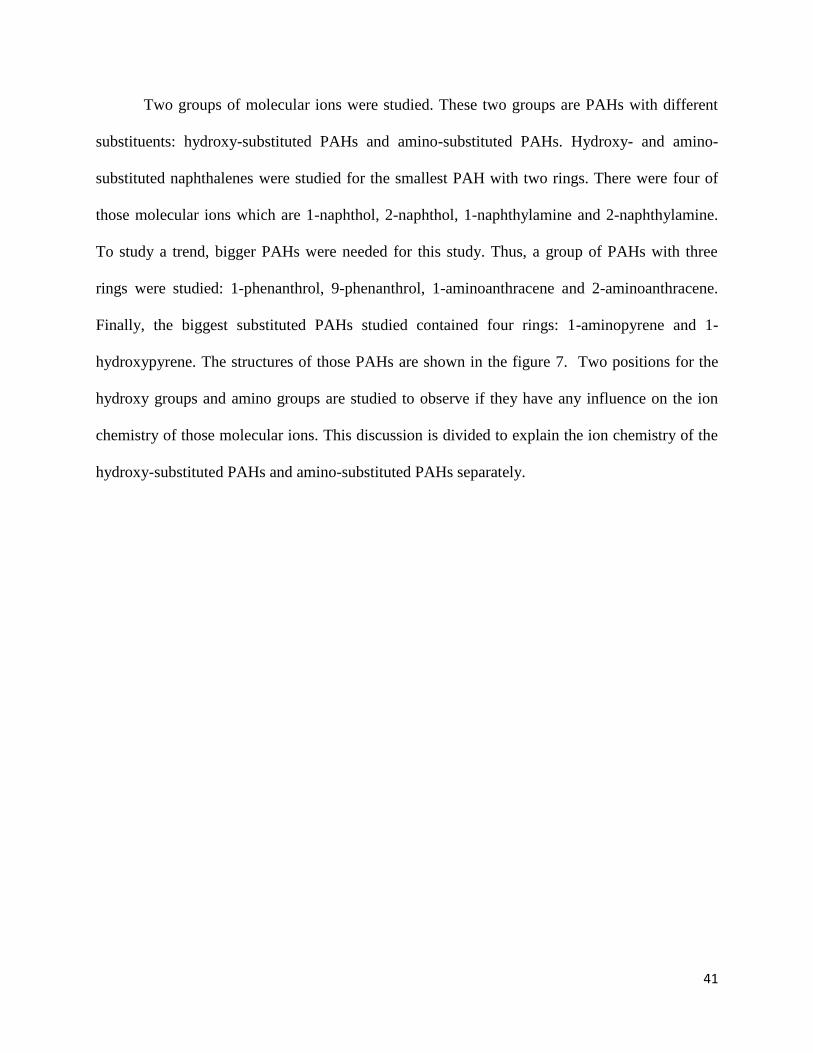
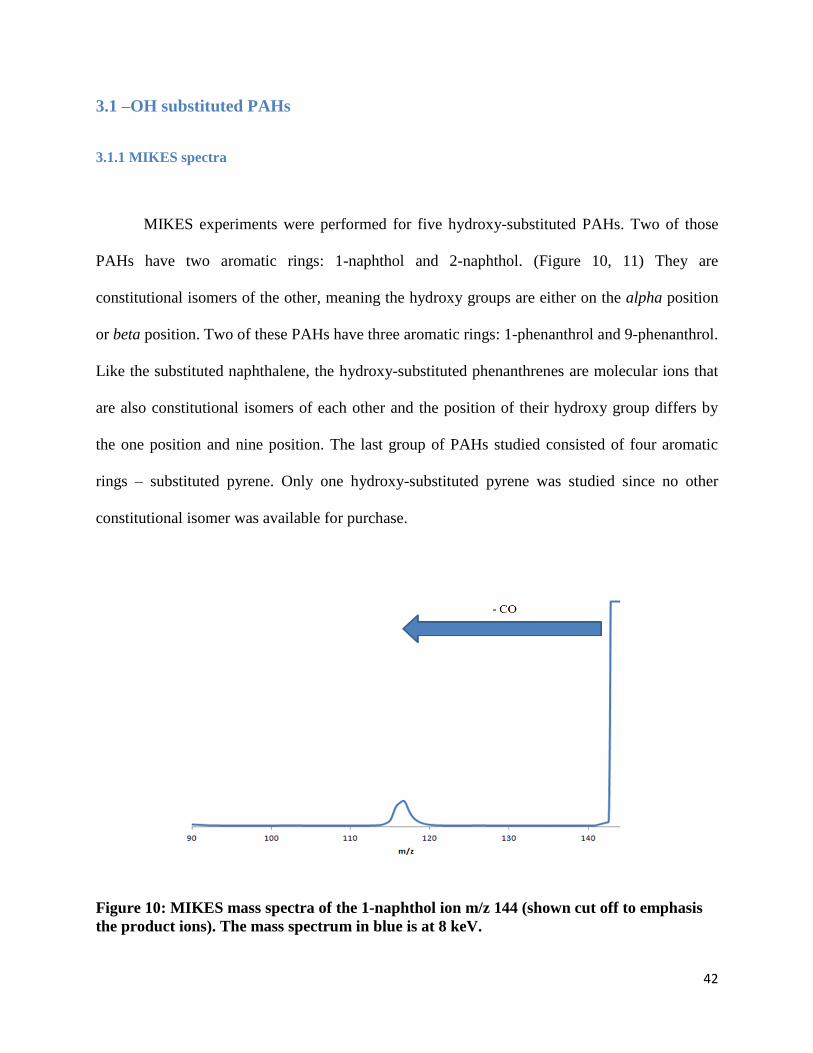
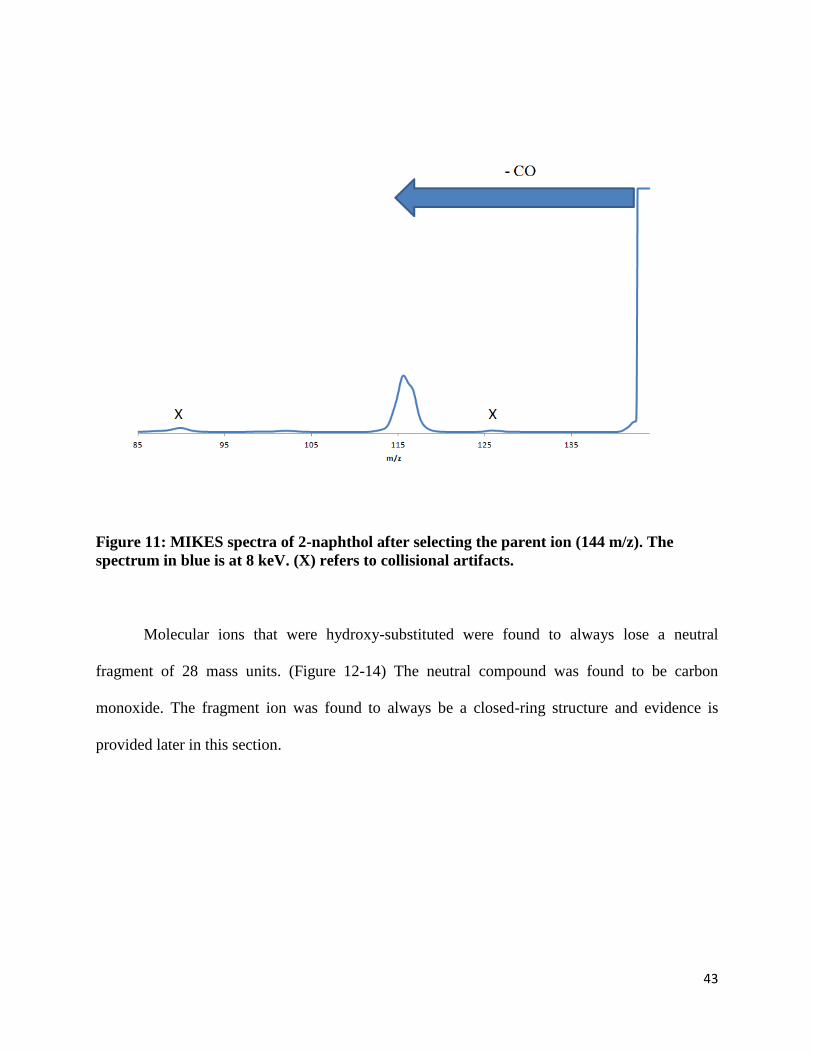
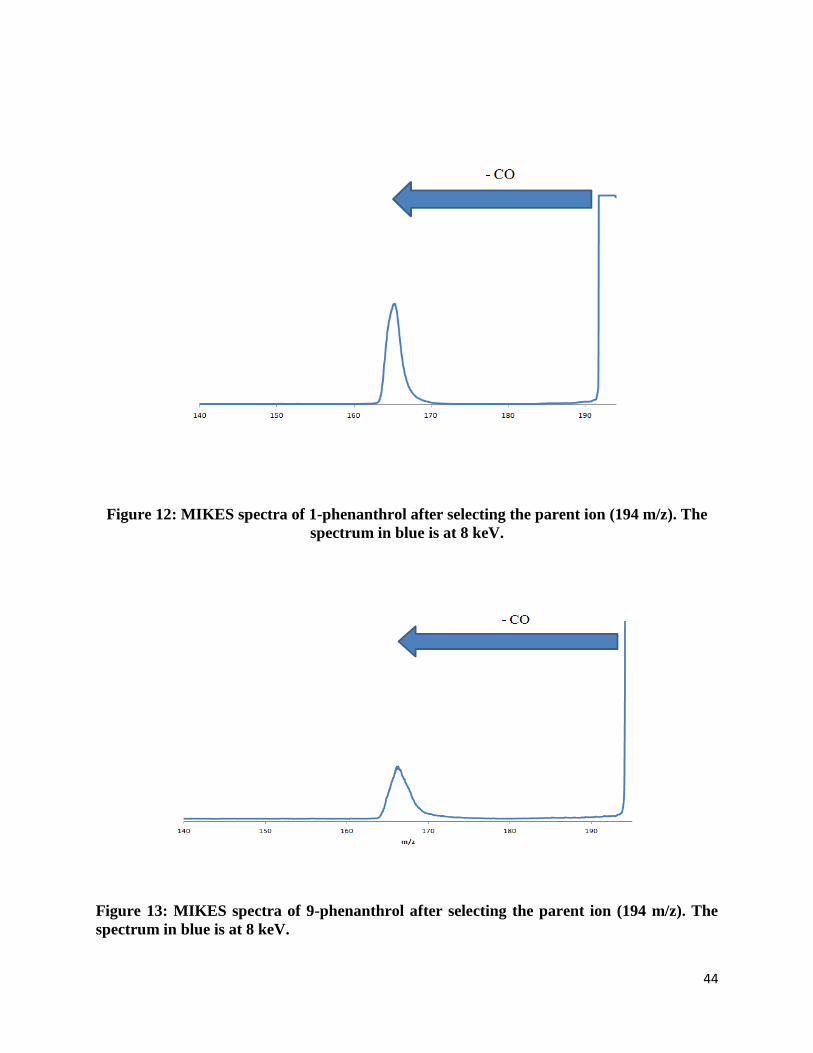
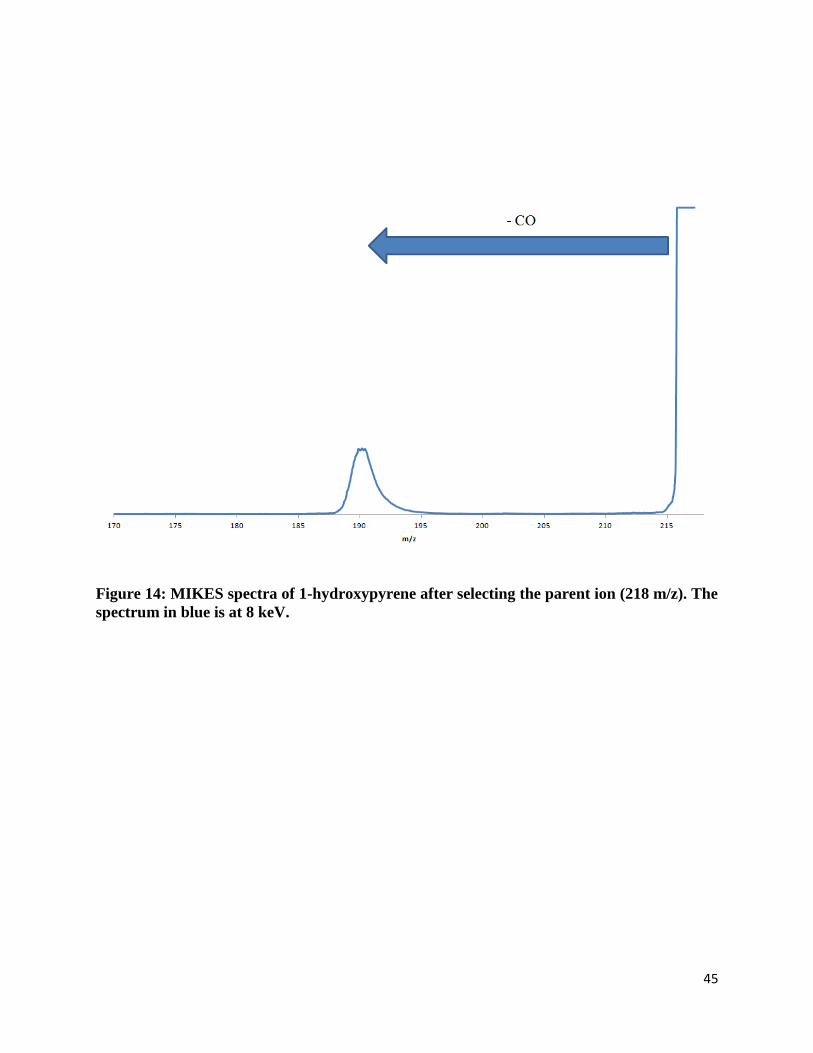
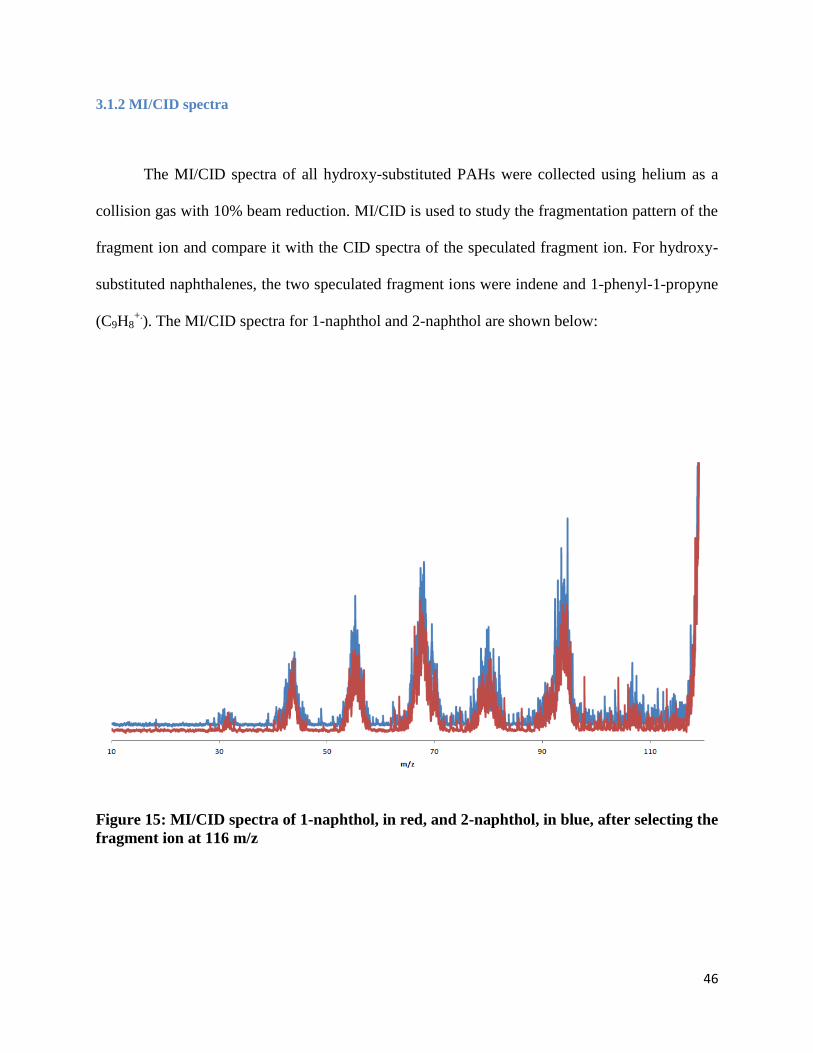
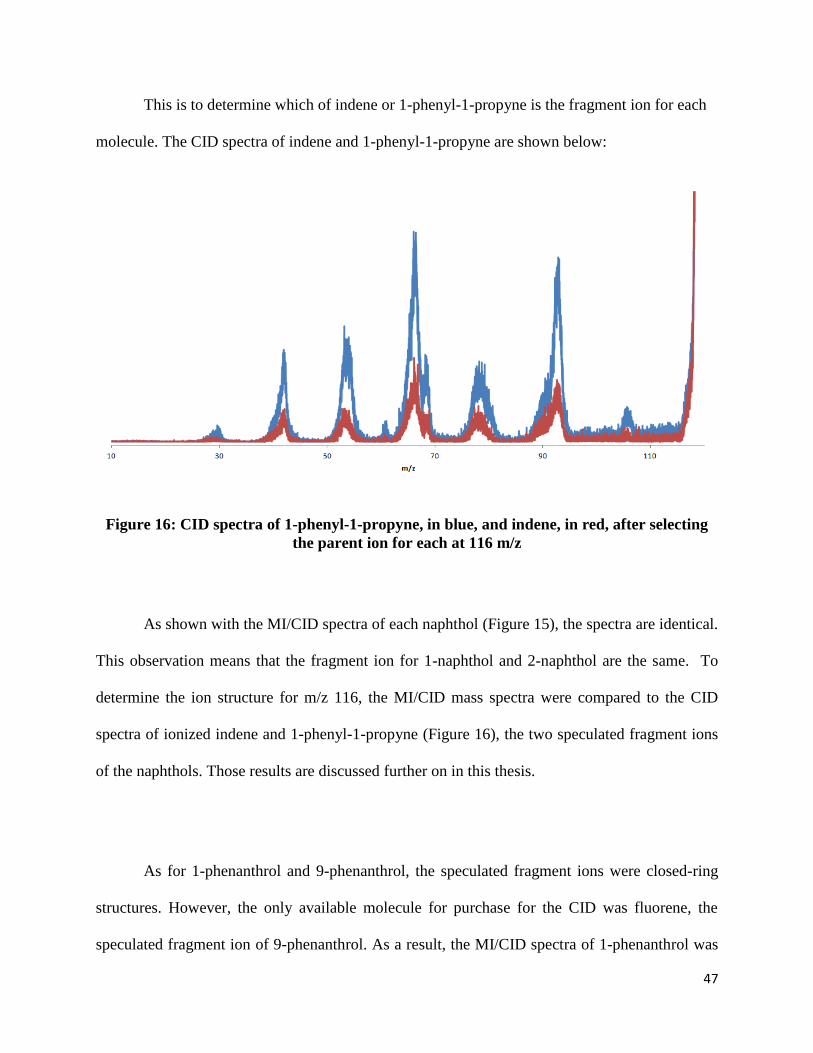
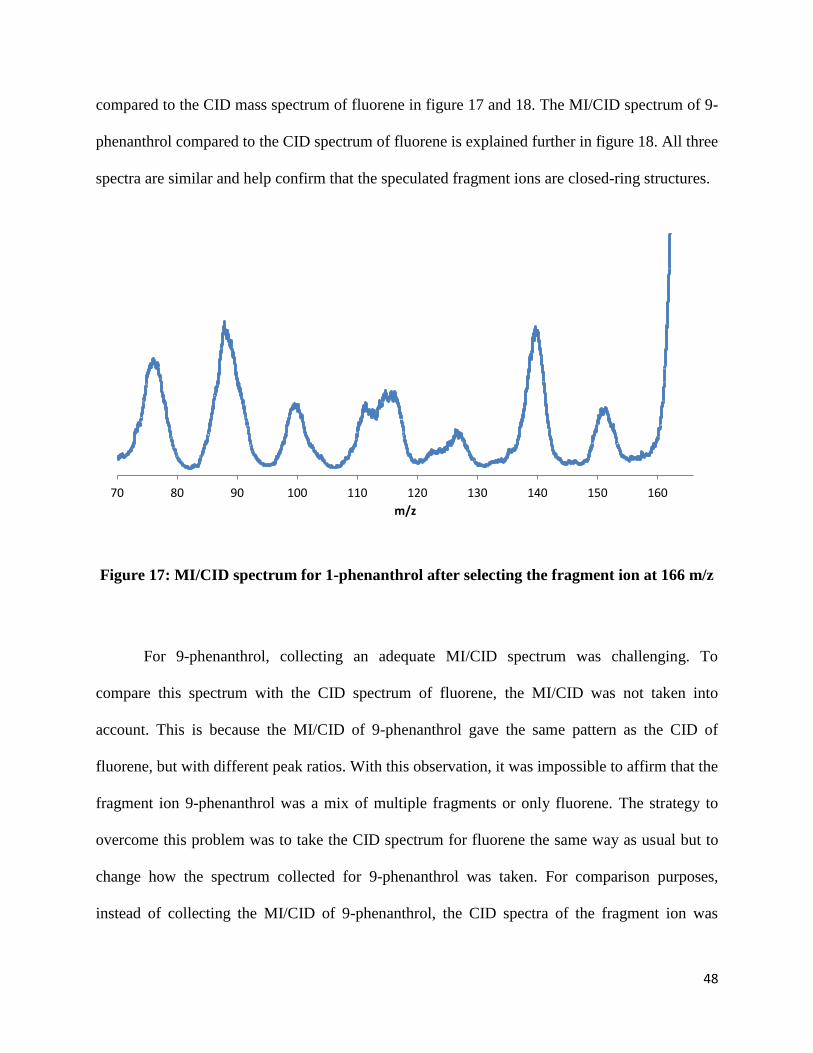
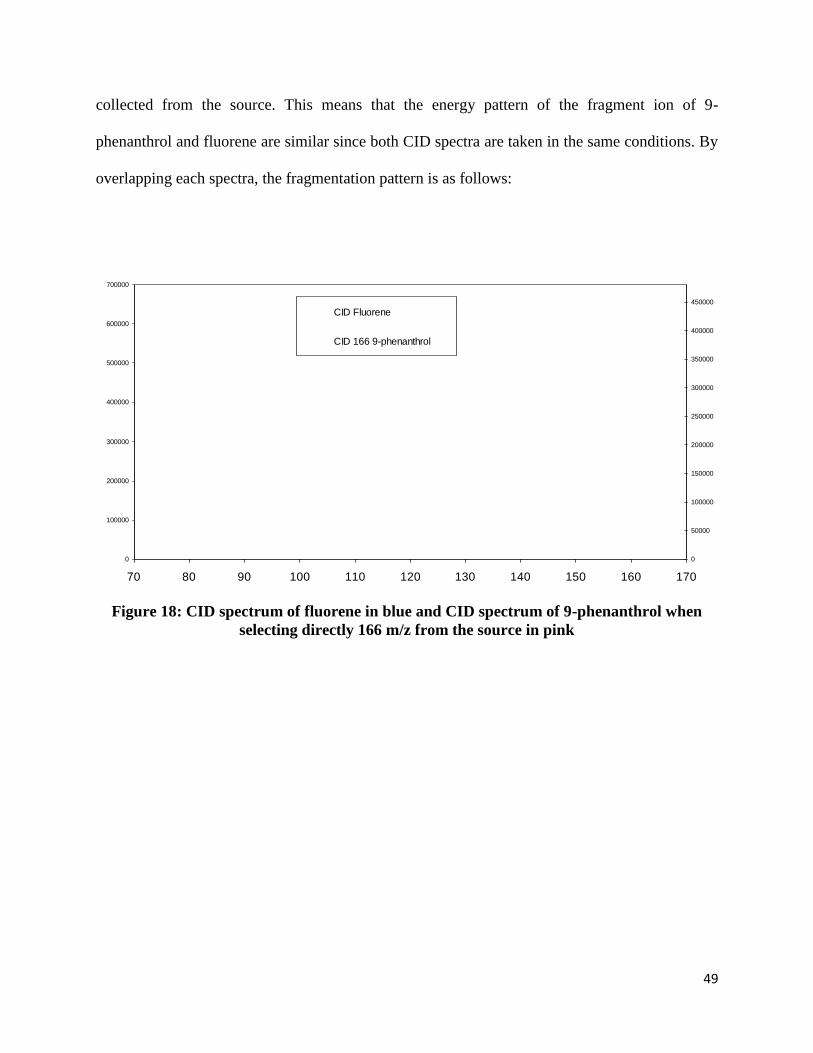
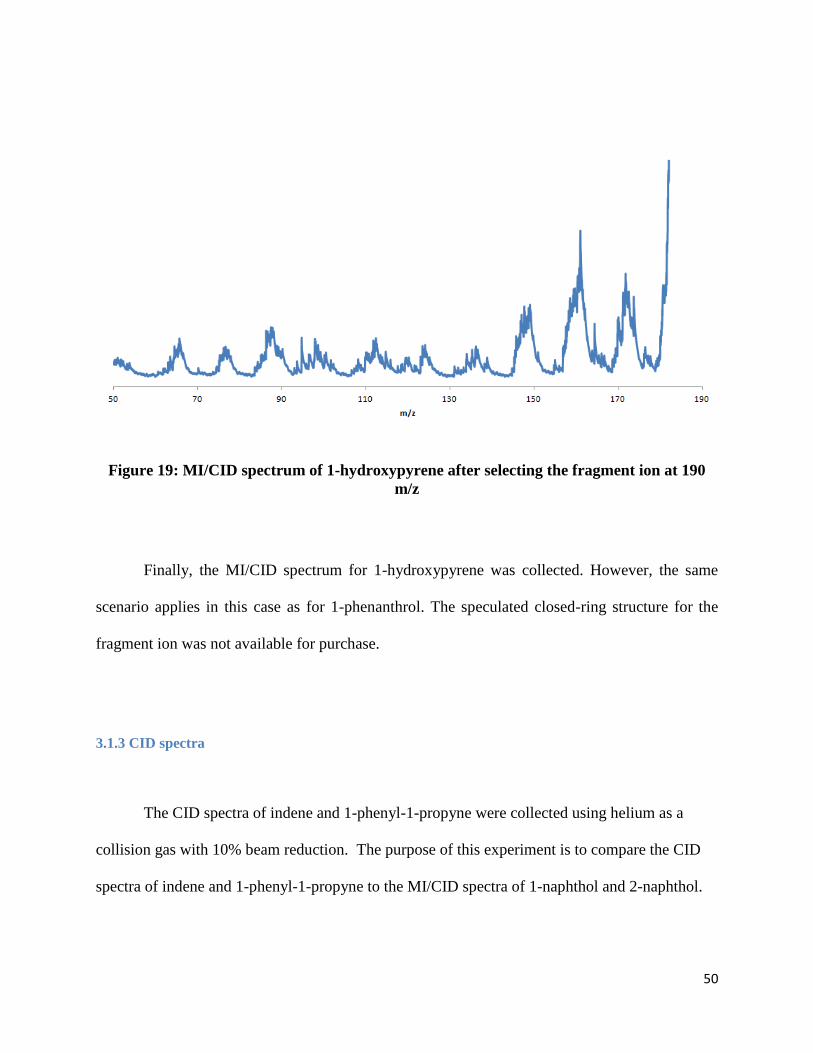
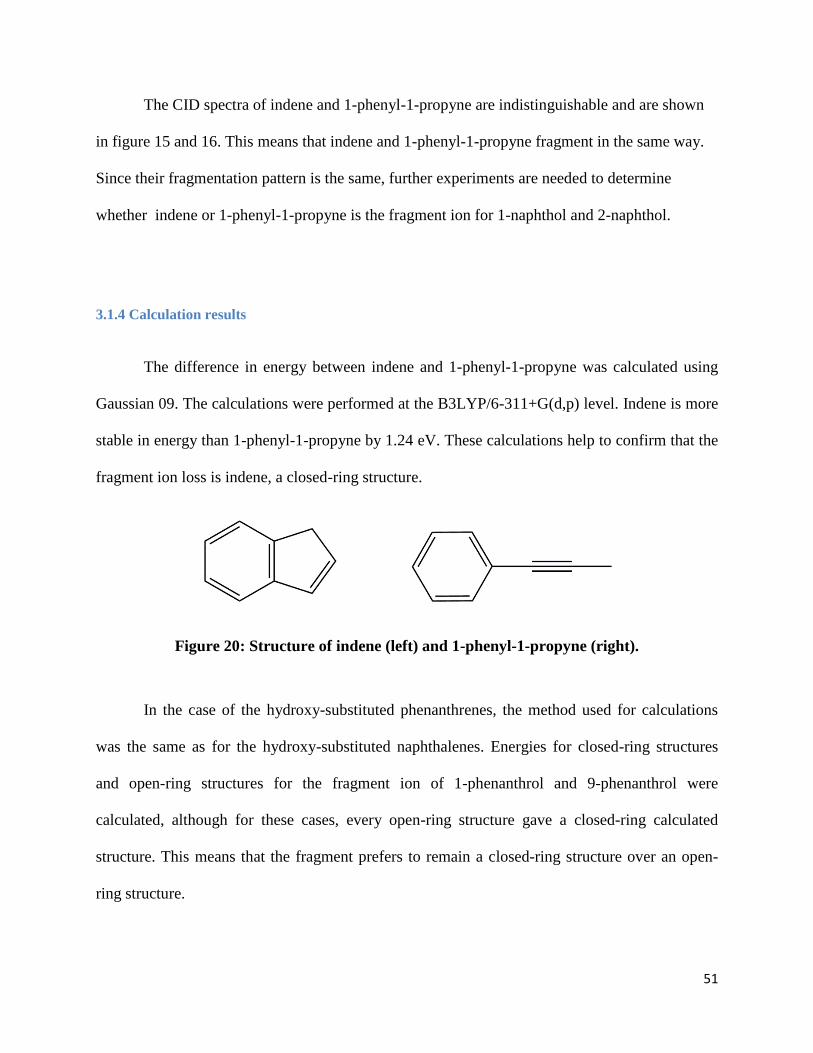
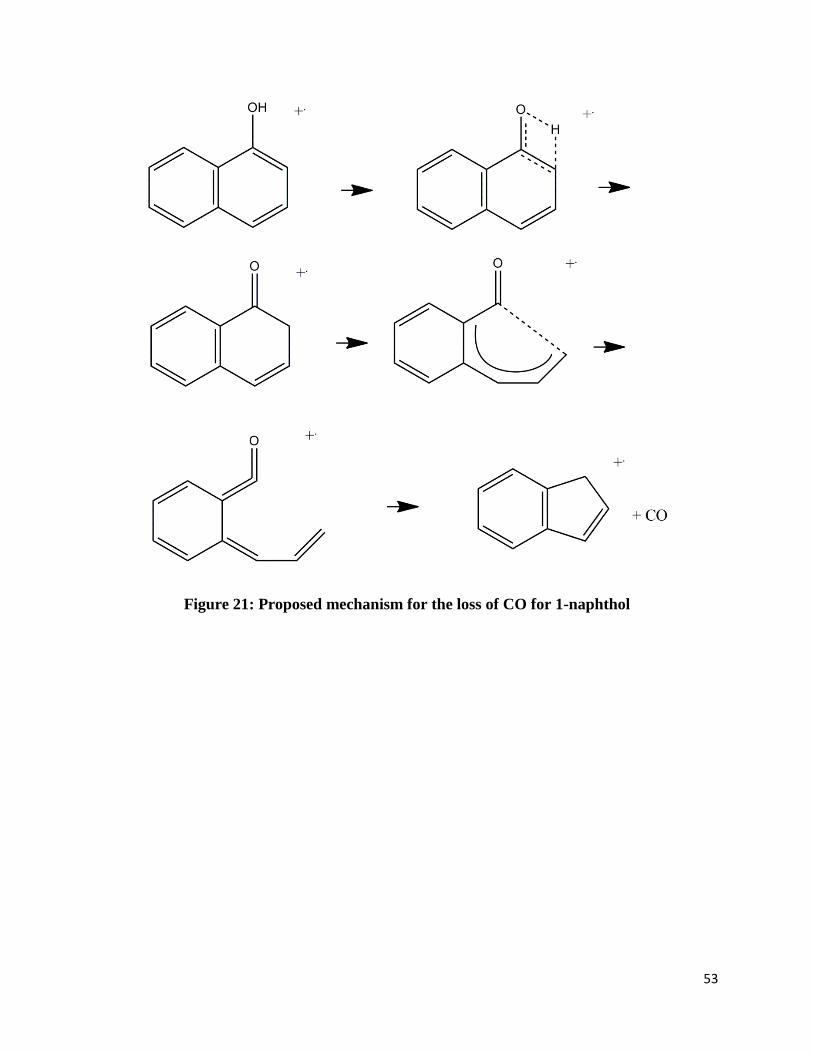
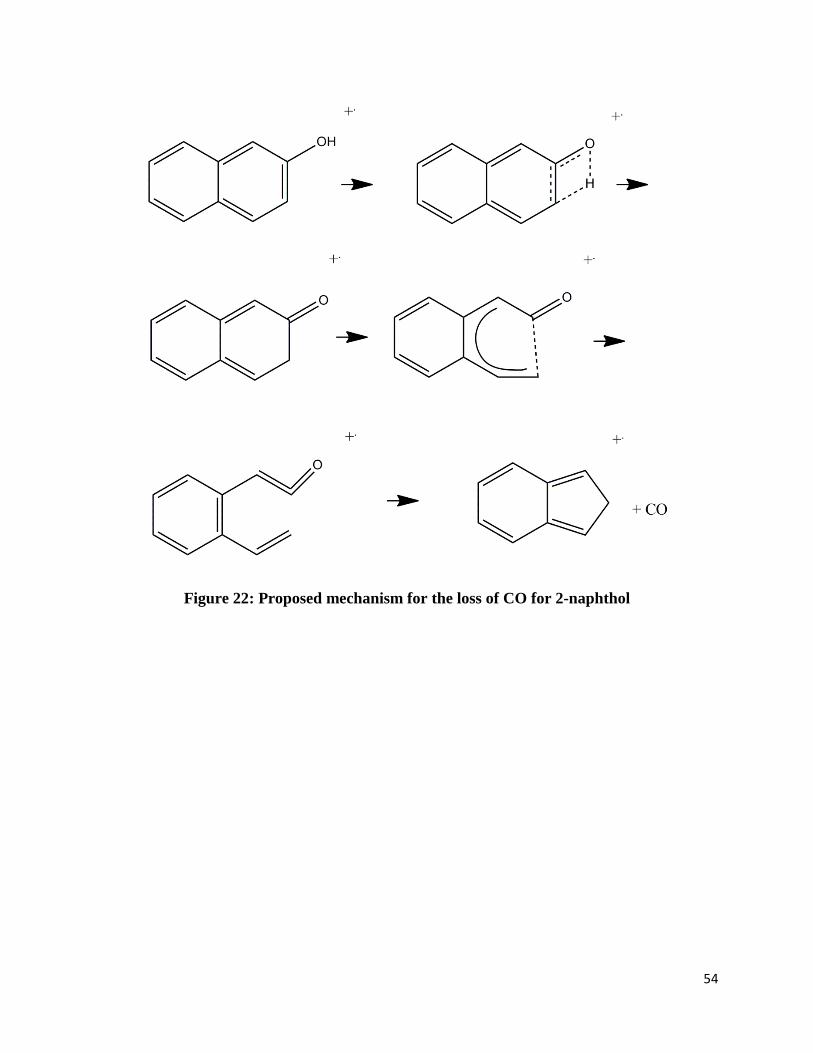
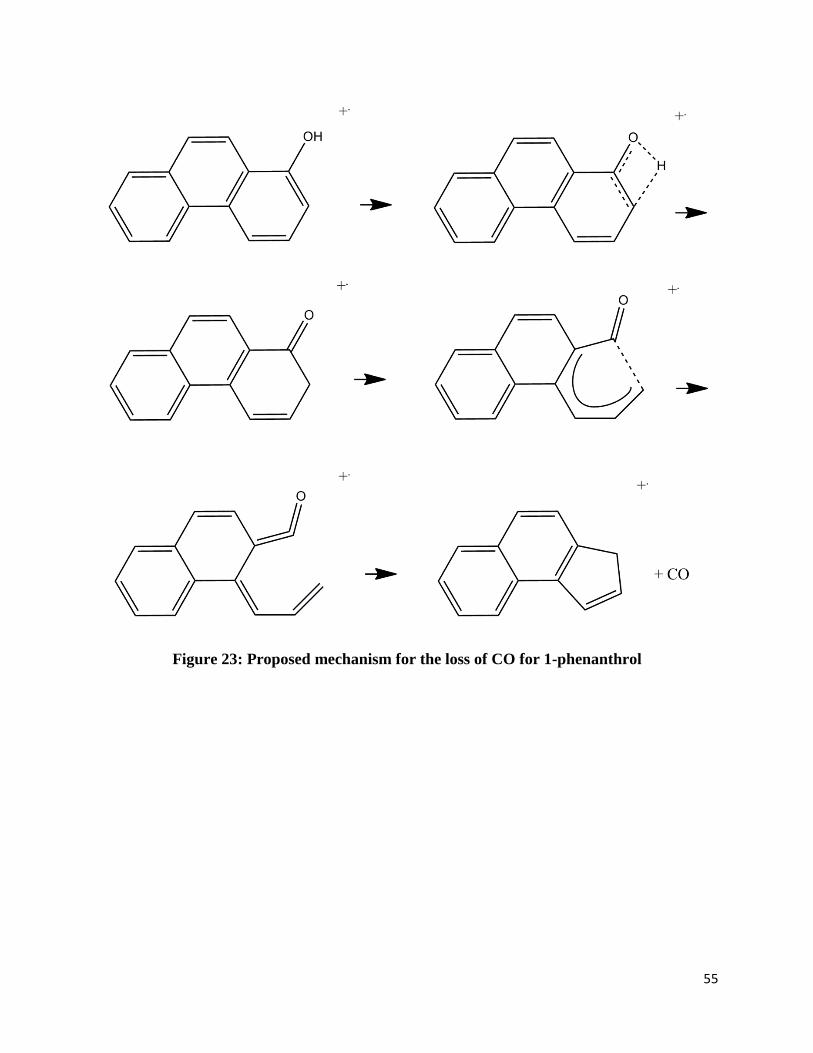
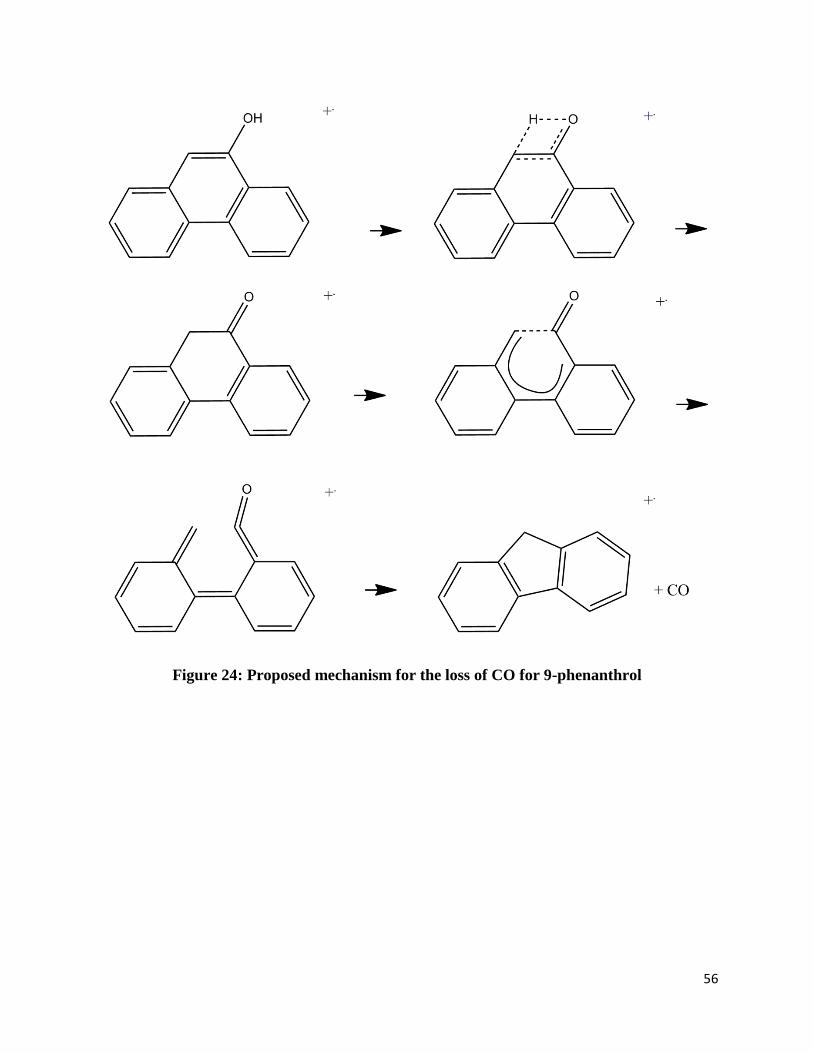
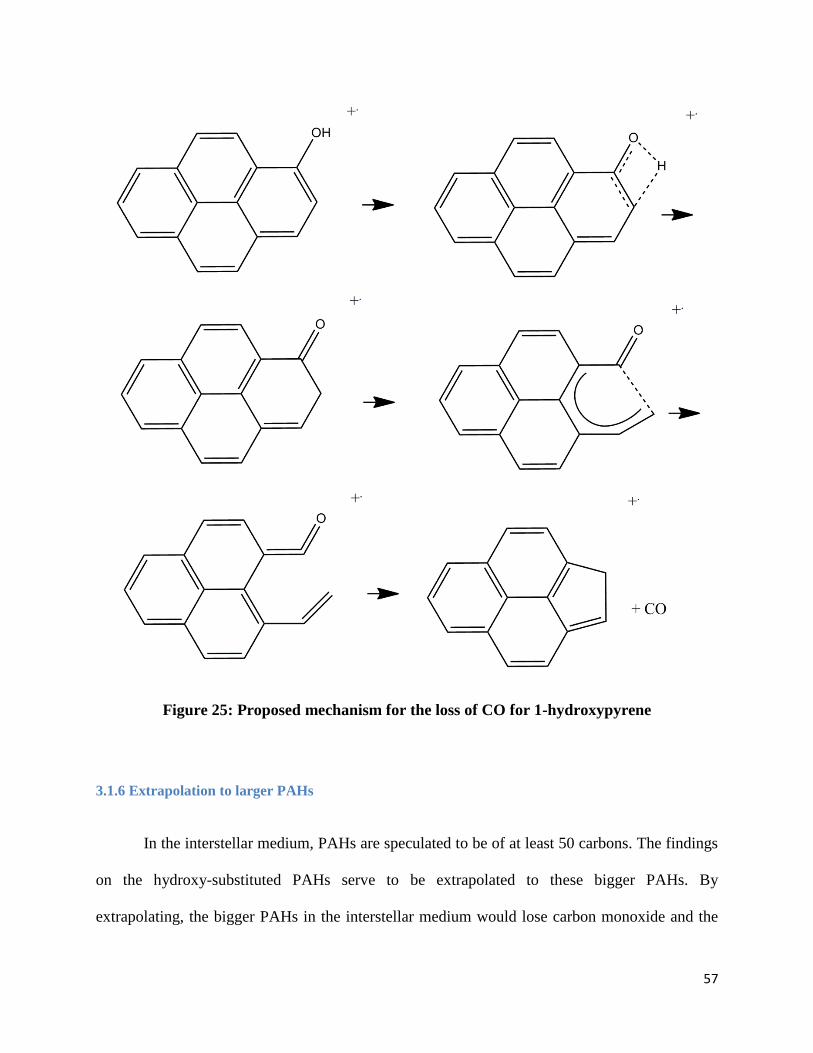
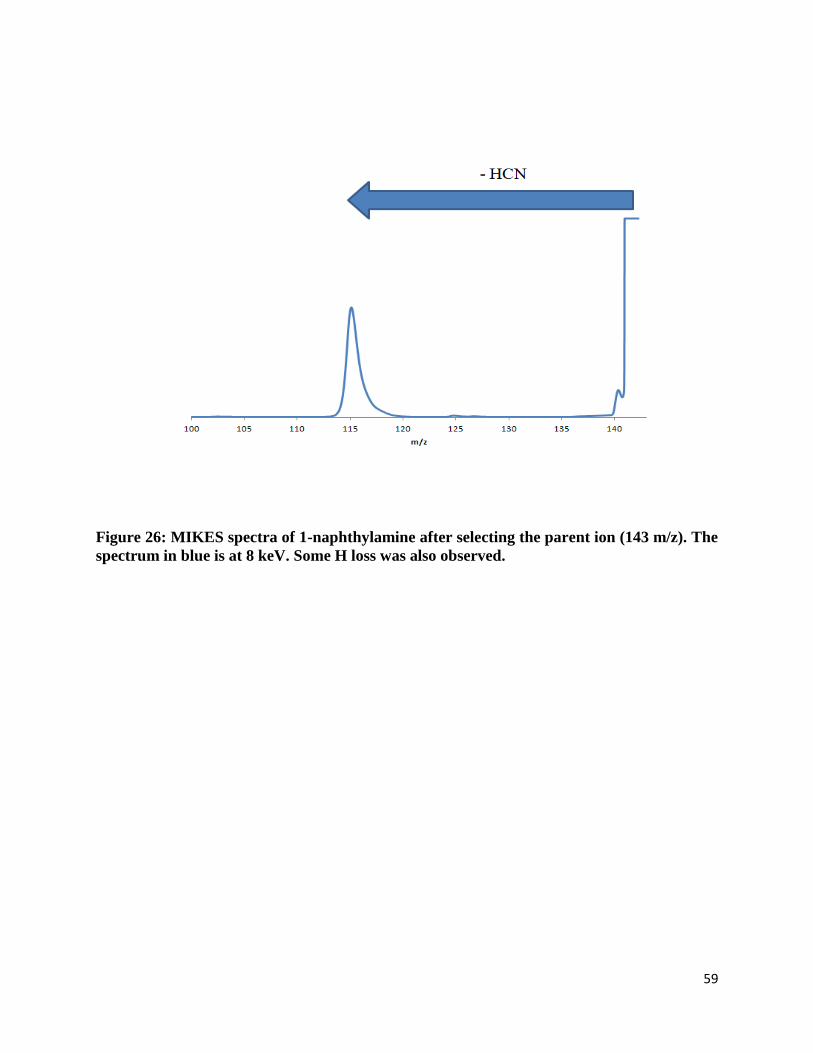
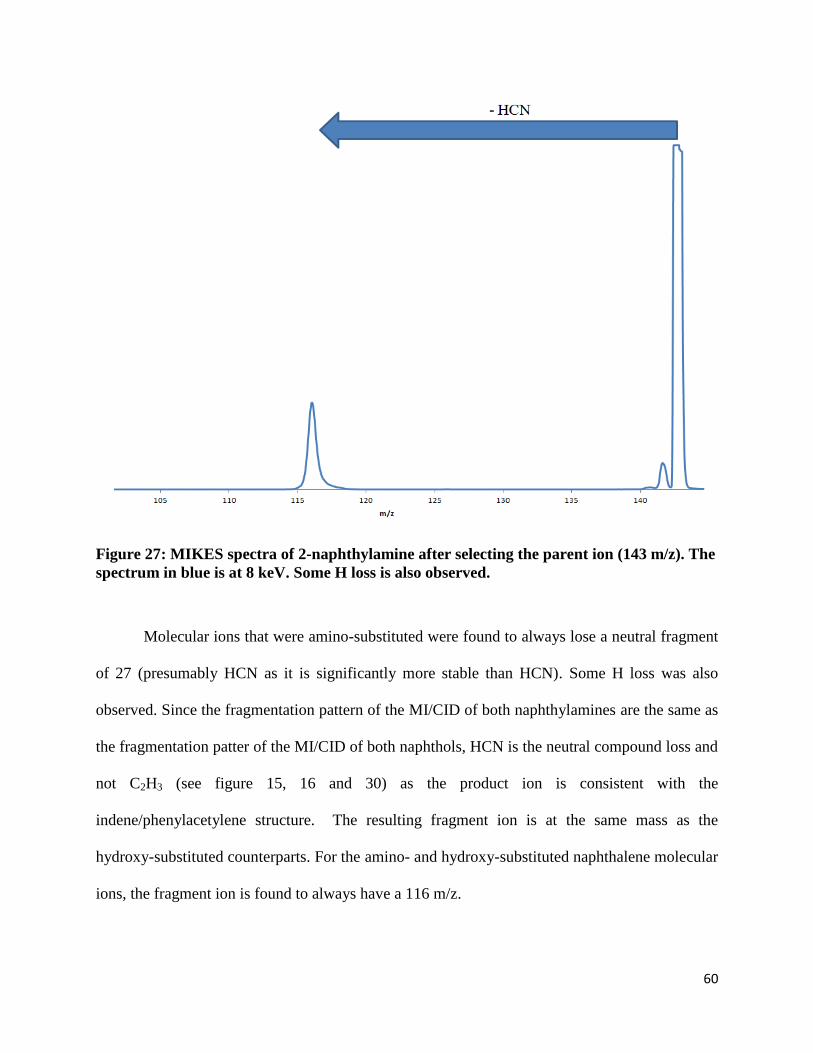
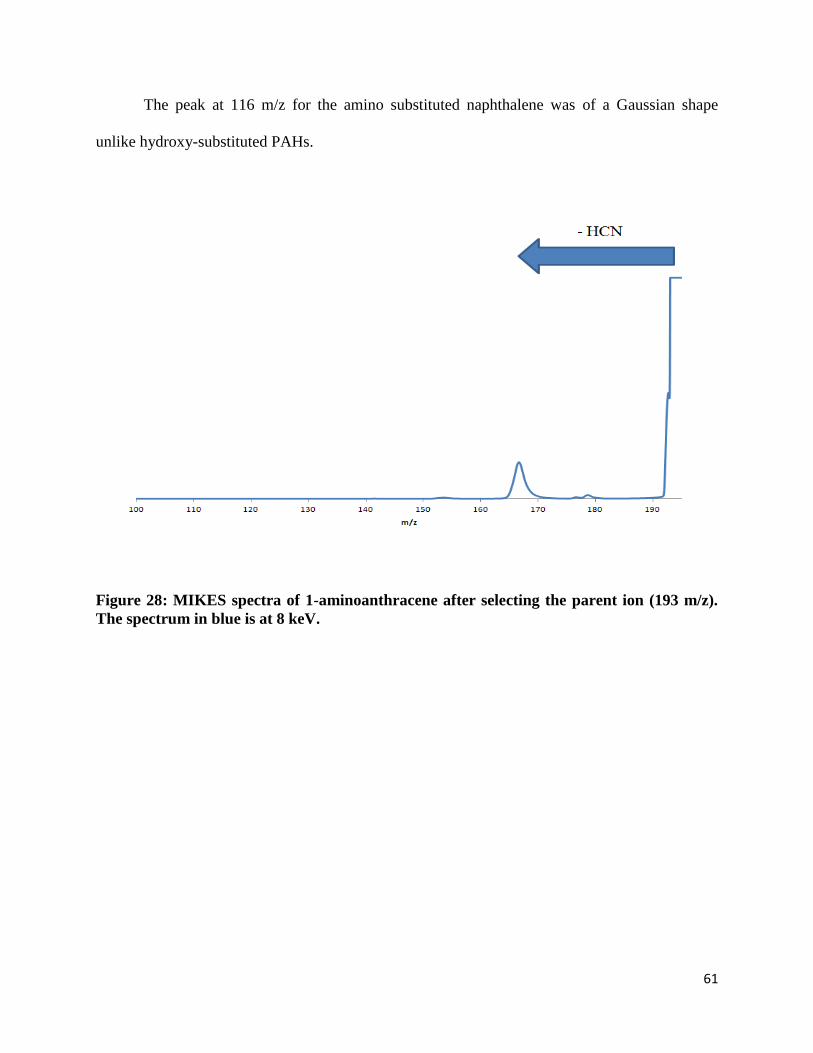
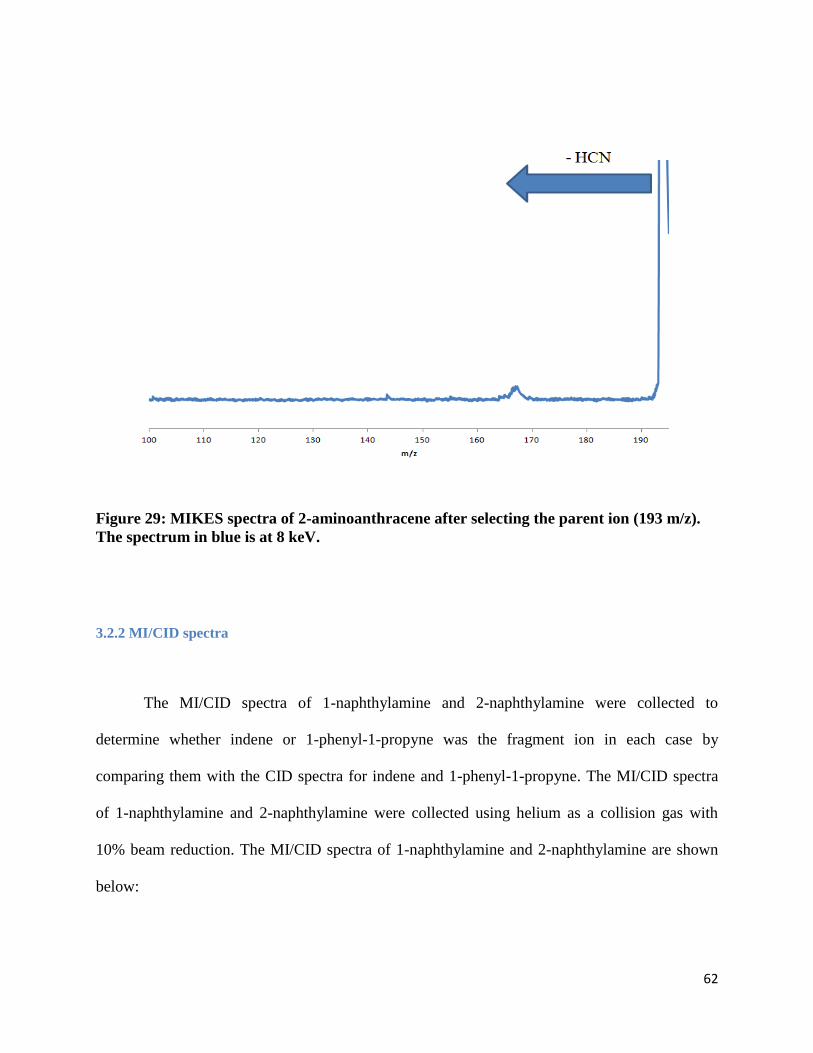
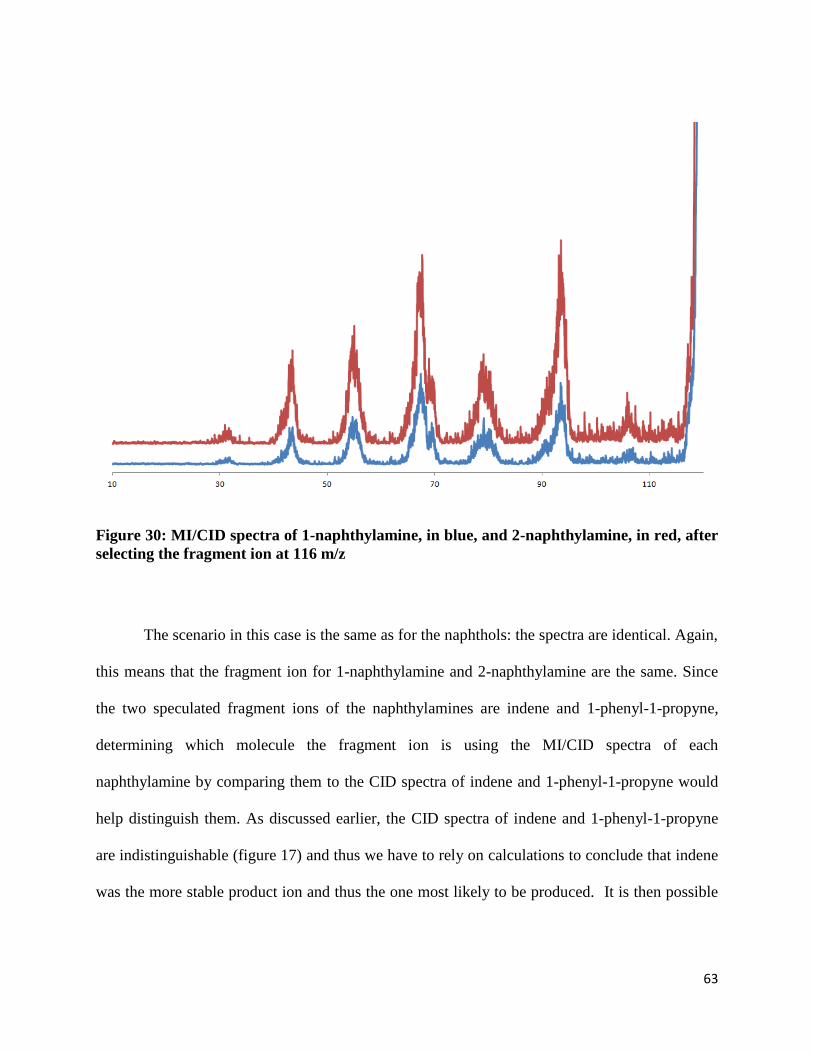
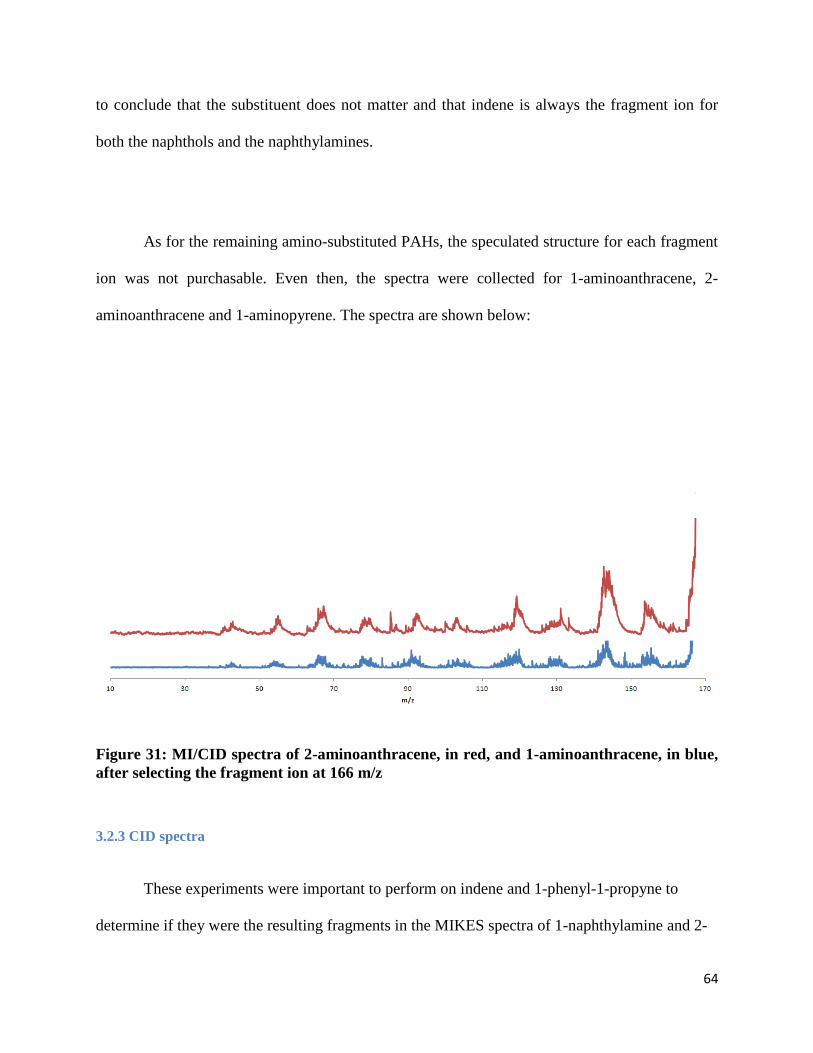
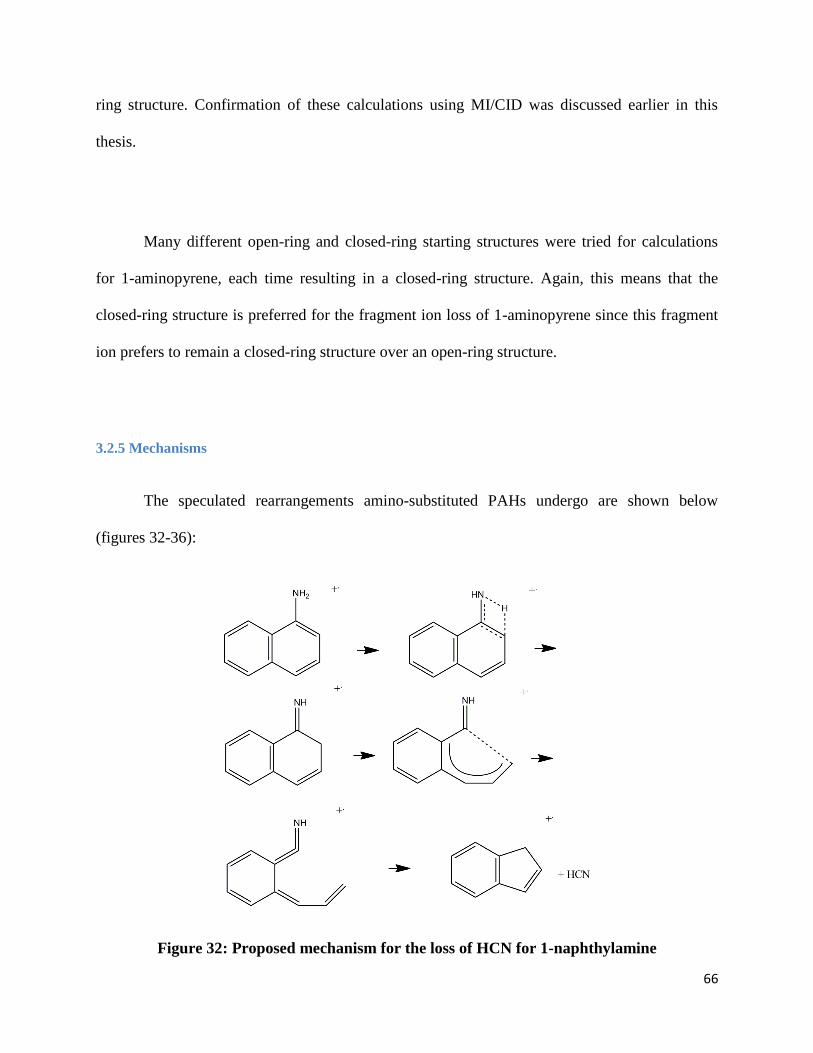
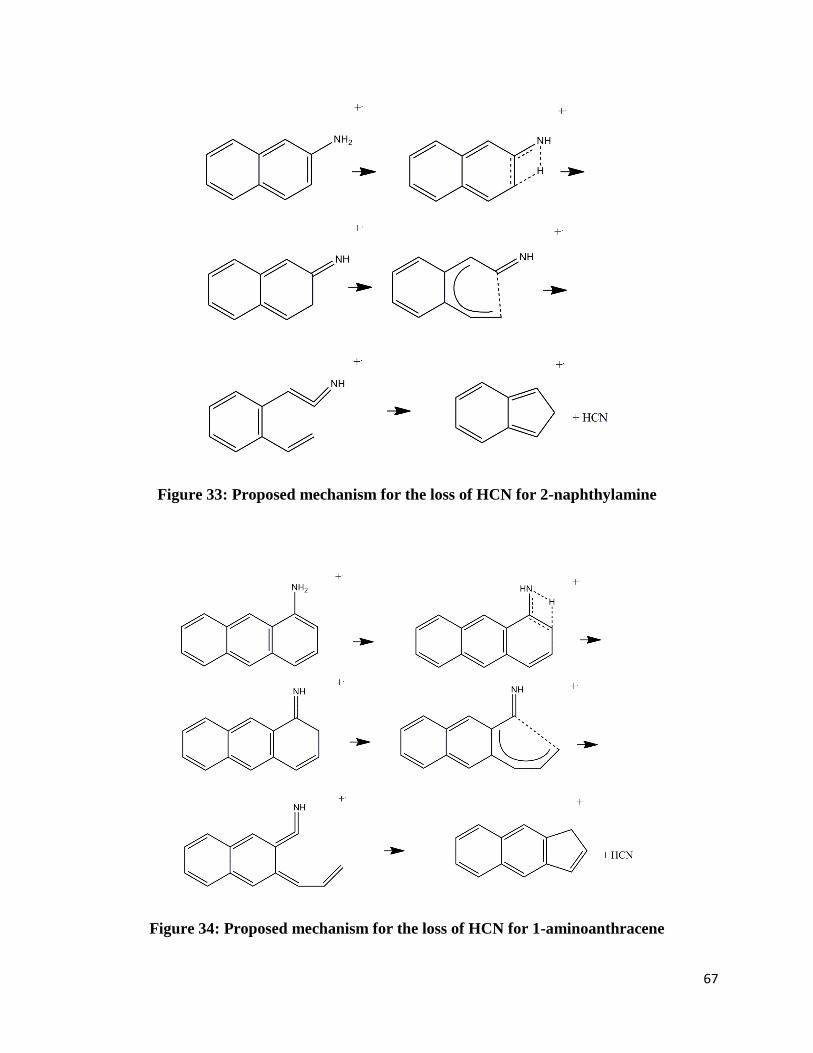
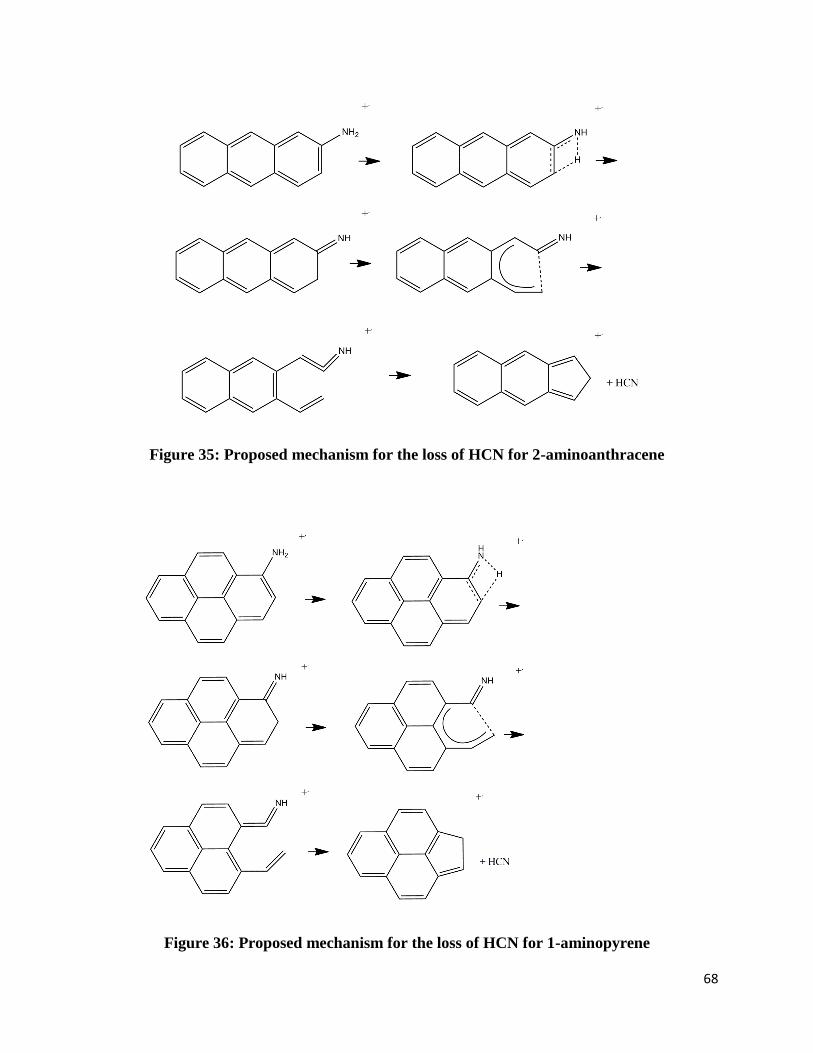
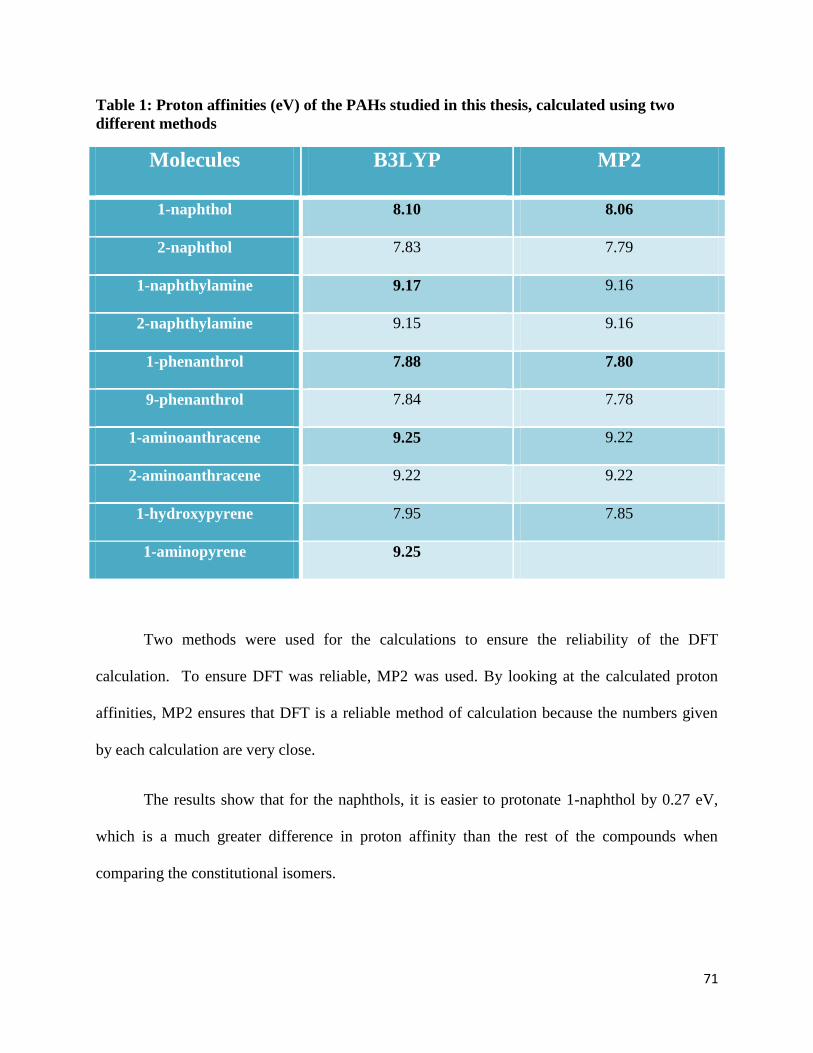
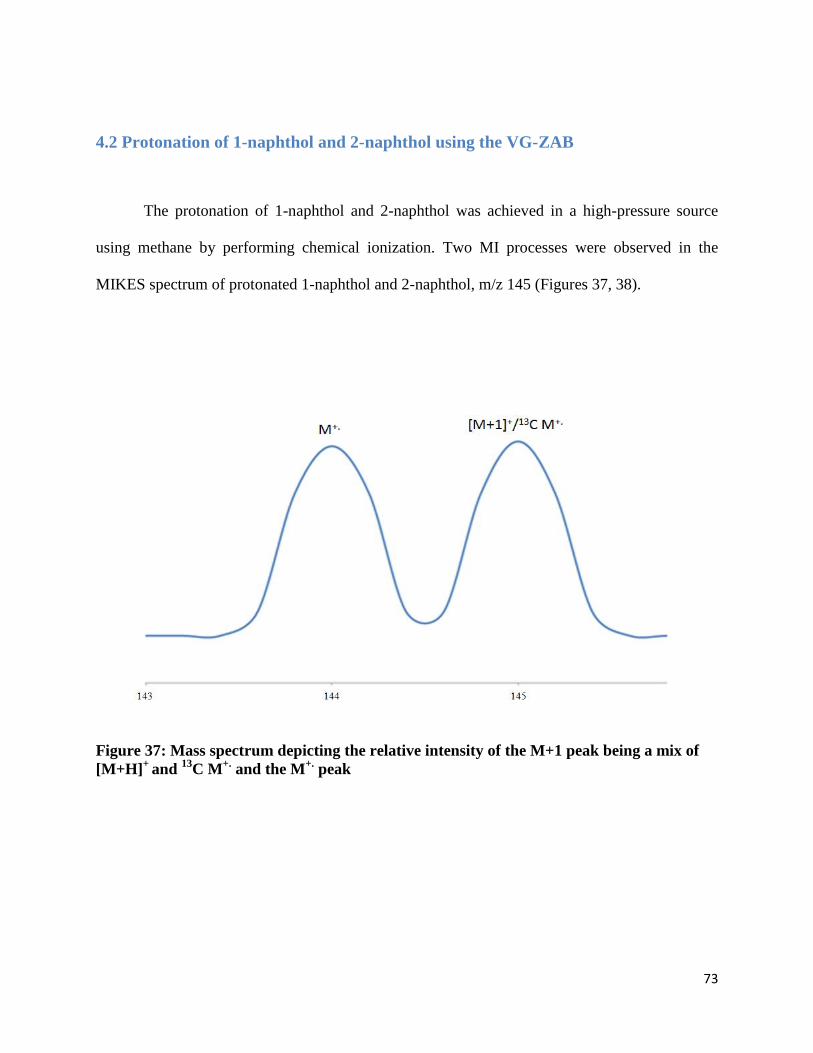
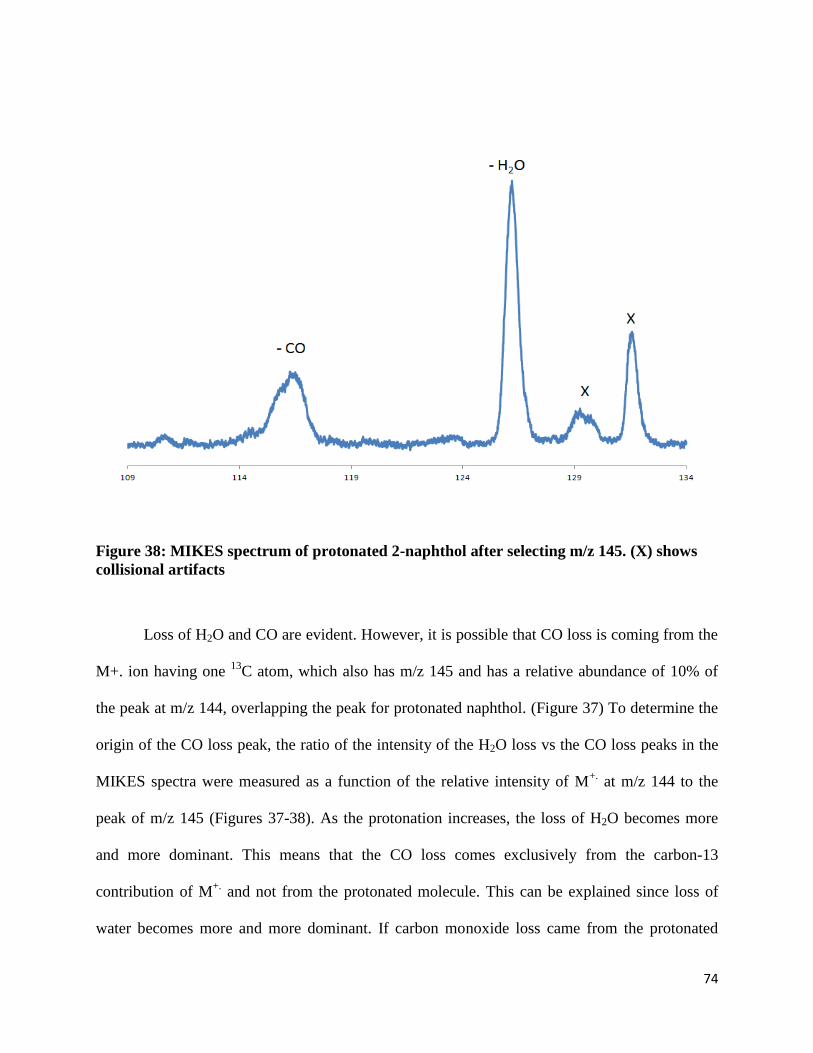
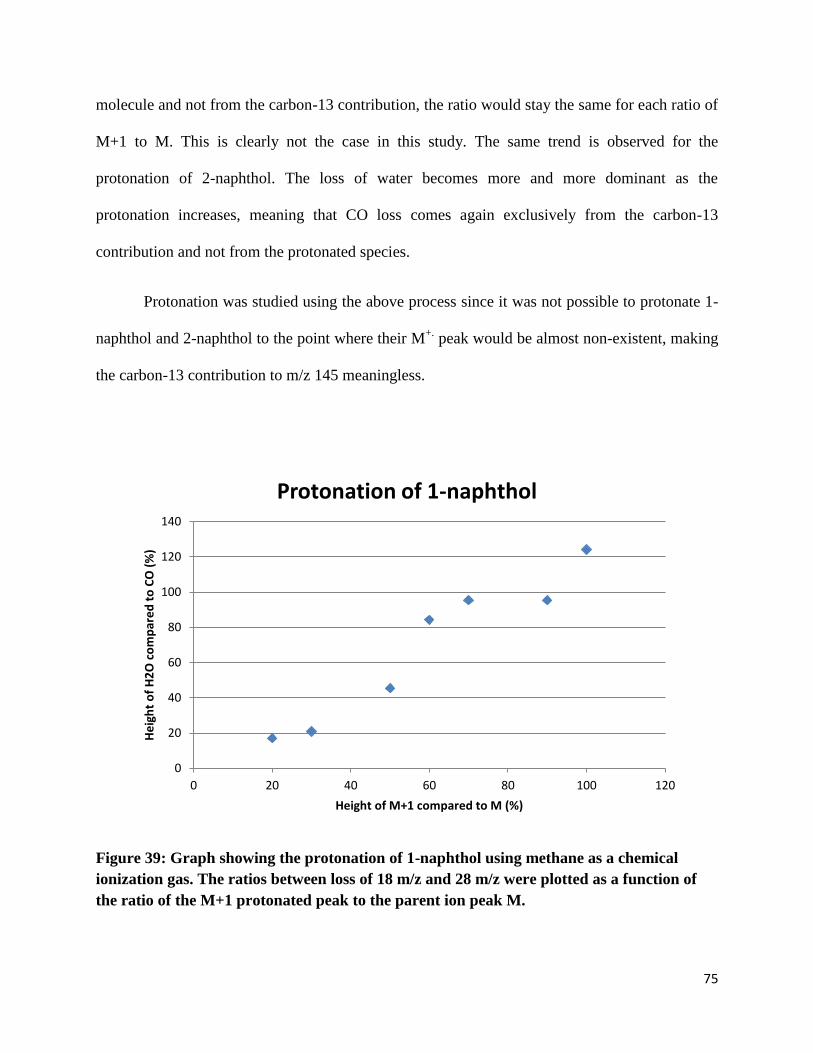
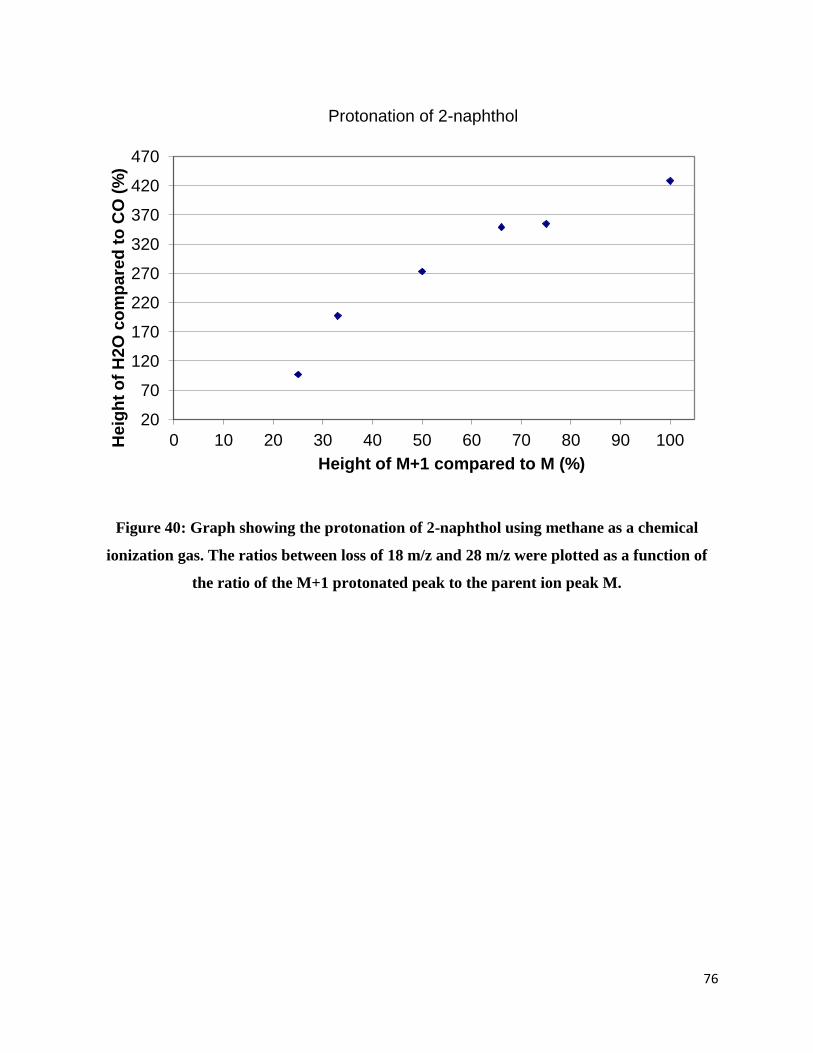
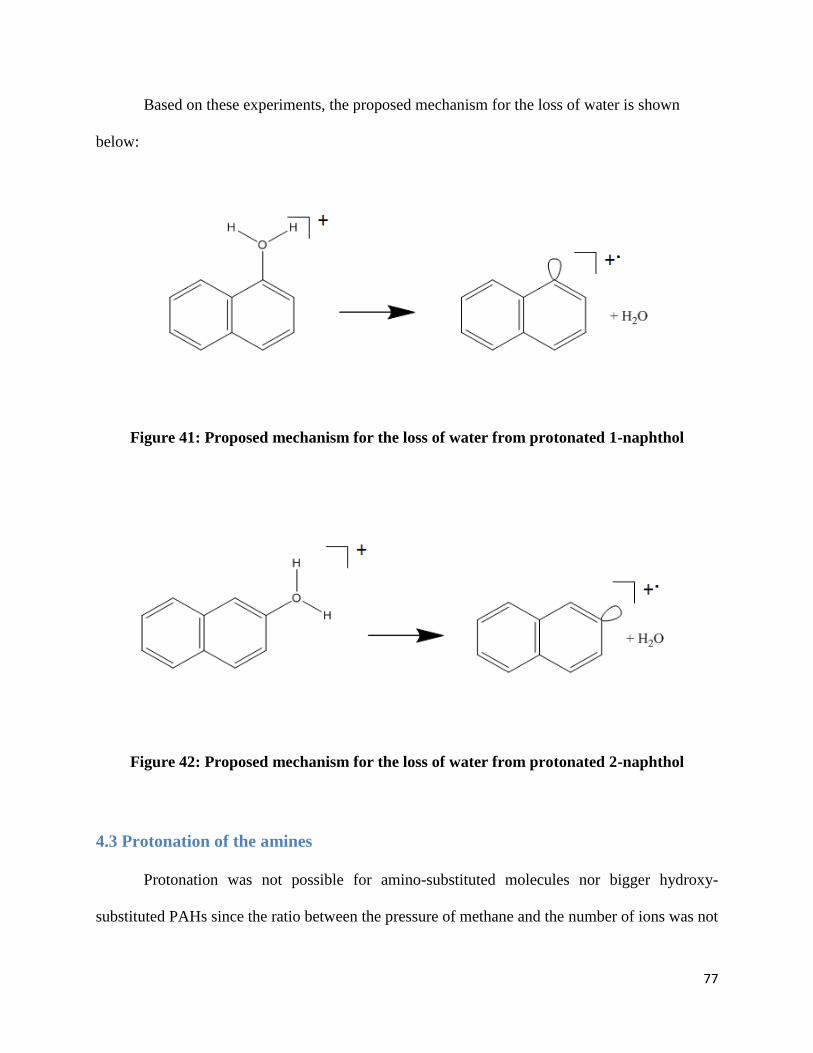
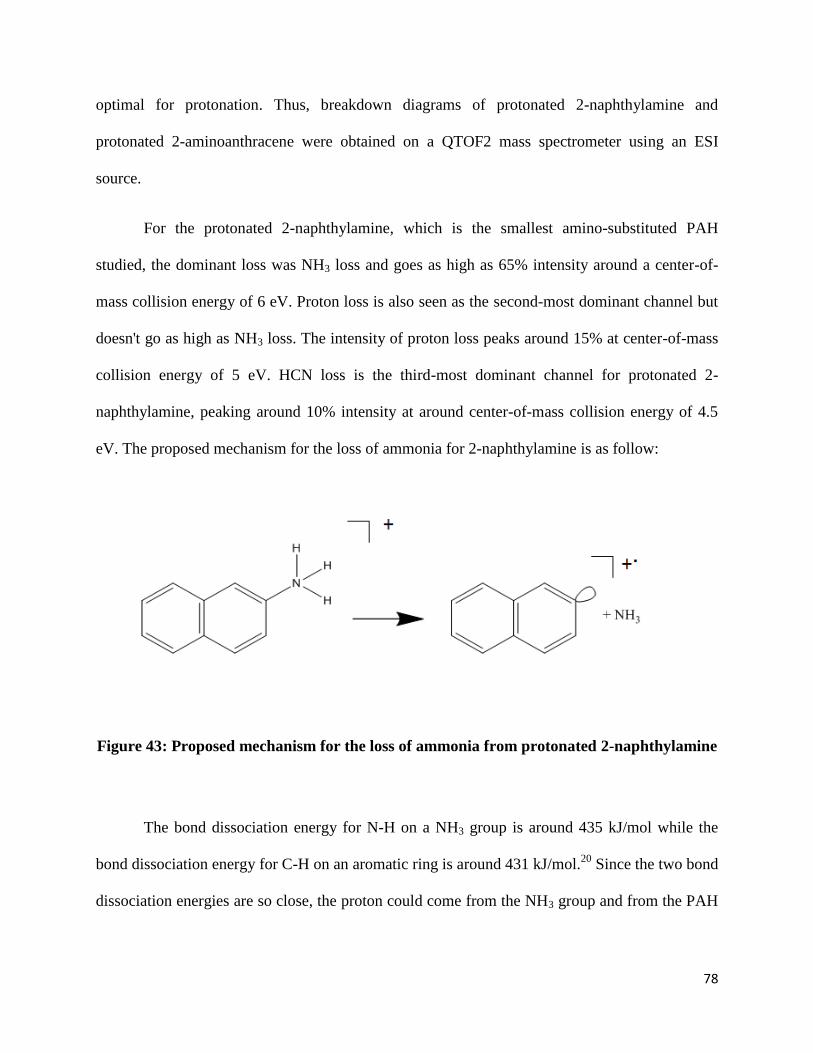
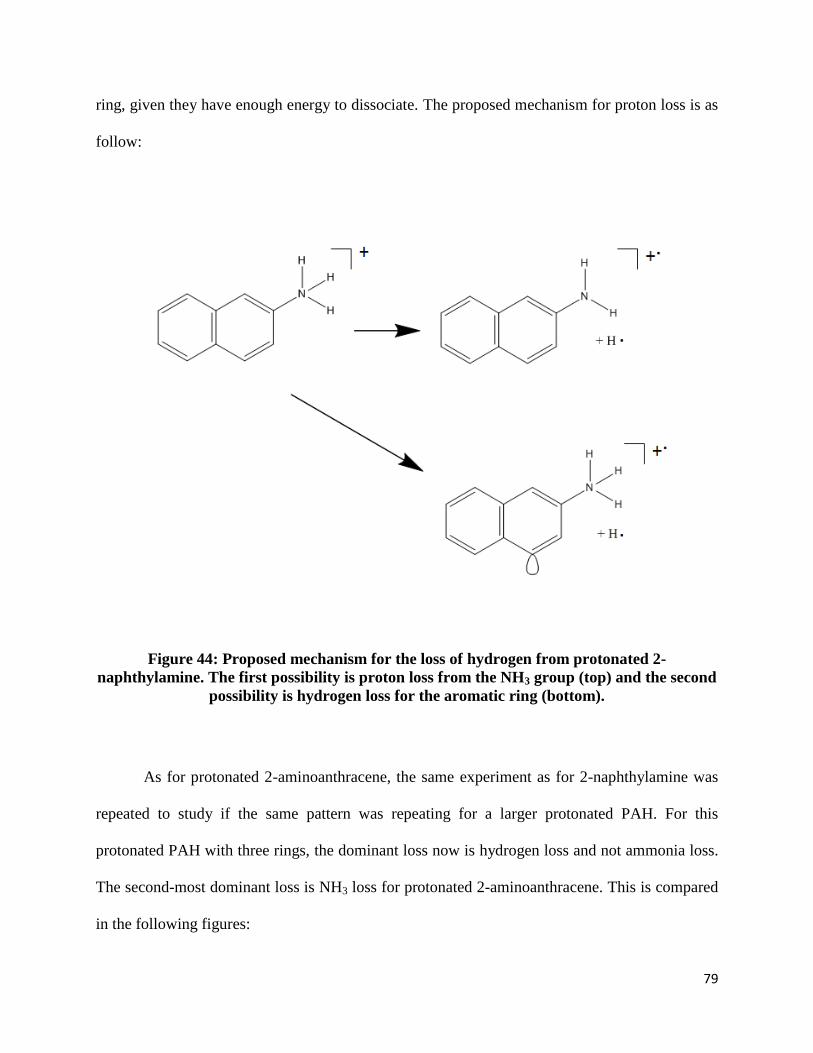
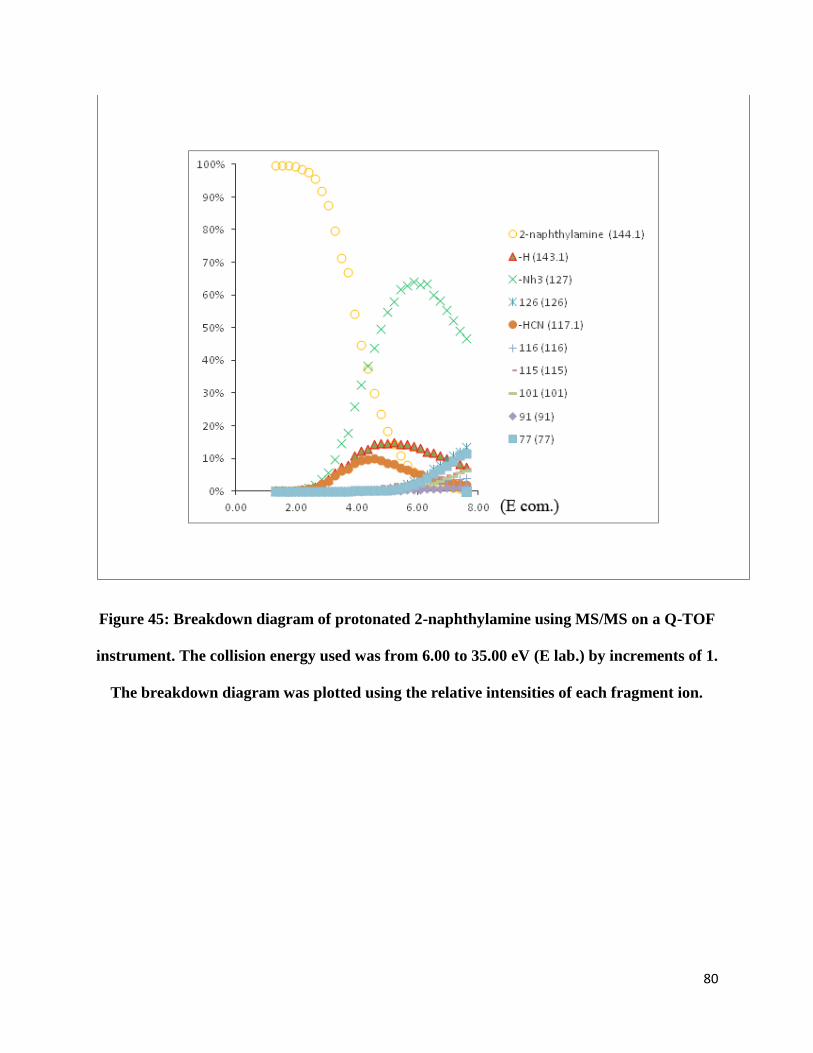
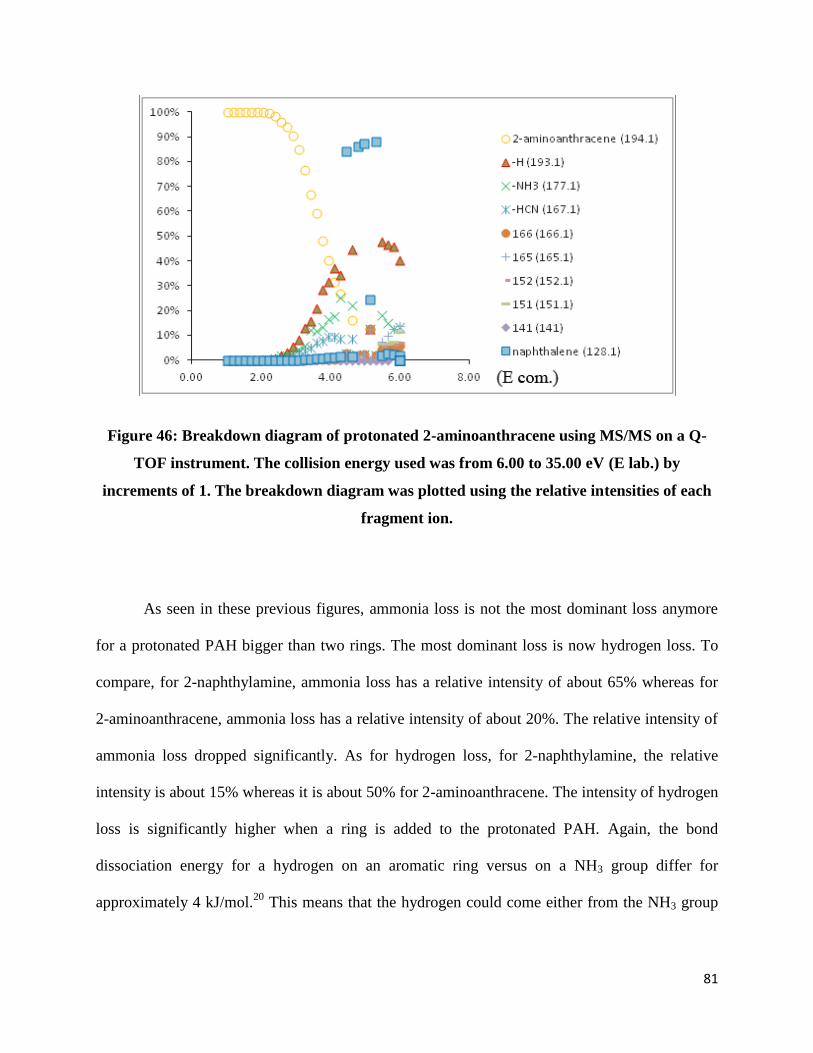
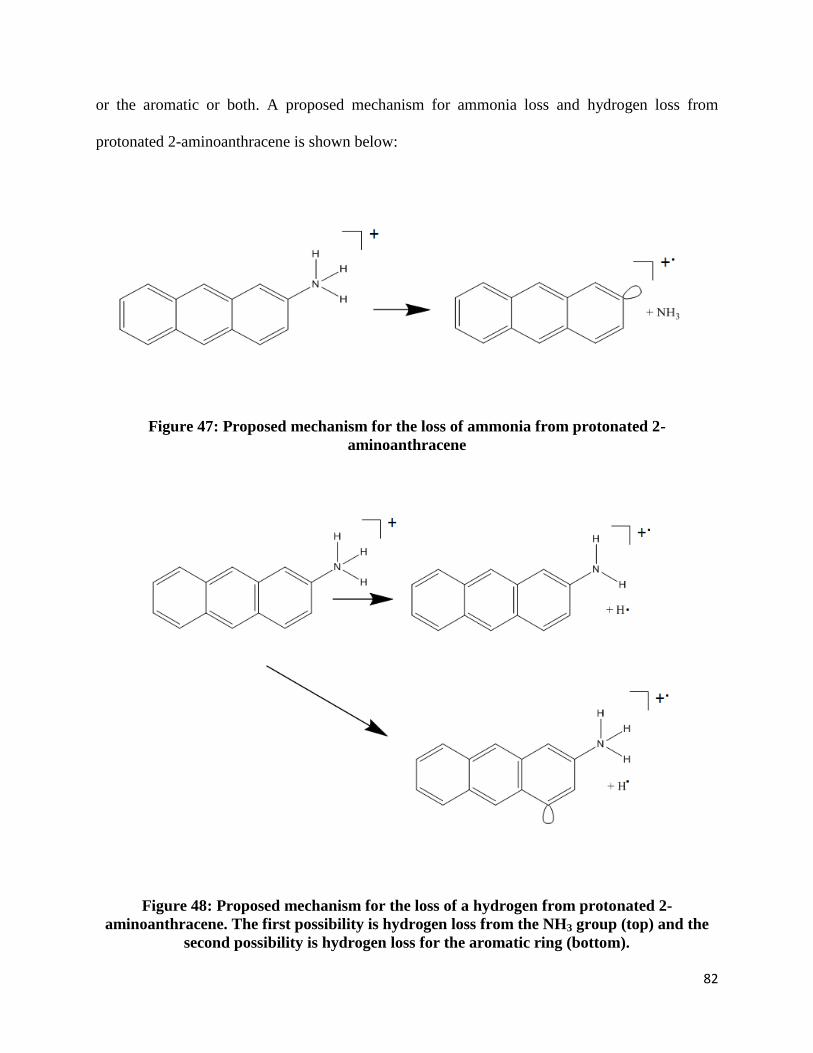
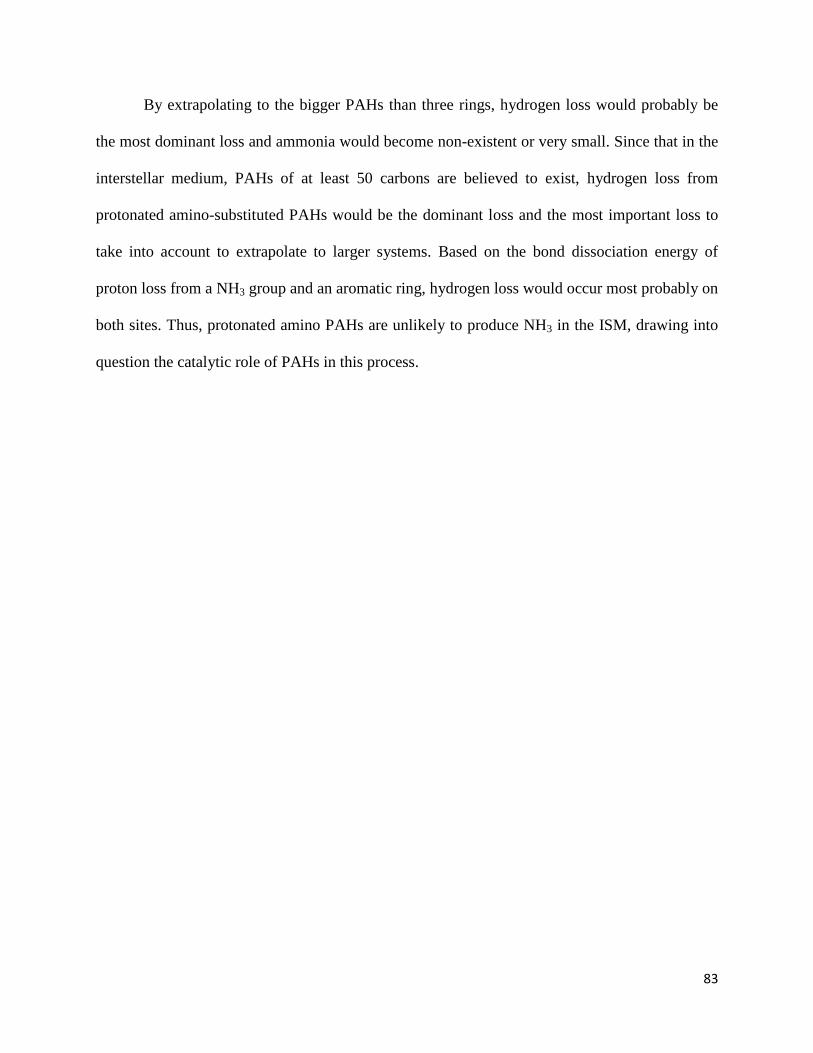


![Ping Li et al- Dual Potentiating and Inhibitory Actions of a Benz[e]indene Neurosteroid Analog on Recombinant alpha1-beta2-gamma2 GABA-A Receptors](https://static.documents.pub/doc/80x56/577d22da1a28ab4e1e9866f9/ping-li-et-al-dual-potentiating-and-inhibitory-actions-of-a-benzeindene.jpg)


![DOI:10.1002/cphc.200700609 ... Paper/p182.pdf · 2h point group (all four hydrogen atomsareinonesymmetryplane);[23–26] ontheotherhand,cu- ... properly are the allene-propyne isomerization](https://static.documents.pub/doc/80x56/5ab015737f8b9a59478e2e16/doi101002cphc200700609-paperp182pdf2h-point-group-all-four-hydrogen-atomsareinonesymmetryplane2326.jpg)


