Australian Domestic Gas Outlook 2017 Australian Domestic Gas Outlook 2017 Australian Domestic Gas Outlook 2017 Australian Domestic Gas Outlook 2017 16 March 2017 Gas Prices Across Jurisdictions, Potential Gas Prices Across Jurisdictions, Potential Gas Prices Across Jurisdictions, Potential Gas Prices Across Jurisdictions, Potential Scenarios and Implications for Users Scenarios and Implications for Users Scenarios and Implications for Users Scenarios and Implications for Users - - - Presentation Presentation Presentation Presentation
Transcript
Australian Domestic Gas Outlook 2017Australian Domestic Gas Outlook 2017Australian Domestic Gas Outlook 2017Australian Domestic Gas Outlook 201716 March 2017
Gas Prices Across Jurisdictions, Potential Gas Prices Across Jurisdictions, Potential Gas Prices Across Jurisdictions, Potential Gas Prices Across Jurisdictions, Potential Scenarios and Implications for Users Scenarios and Implications for Users Scenarios and Implications for Users Scenarios and Implications for Users ----
PresentationPresentationPresentationPresentation
Private and Confidential
The talk is based on this report
1
• This report was commissioned by the Commonwealth of Australia through the Department of Industry, Innovation and Science - OGW, MDQ Consulting (Craig Langford) and Energy Management Services (Jim Kelty)
• Started in March 2015 and completed in February 2016
– Detailed review of last 10 years of gas prices by component and jurisdiction
• Covers off the following market segments:
– Large Industrial
– Small Industrial
– Residential
• And opined on the drivers of gas prices over the following 5 years
Web: http://www.industry.gov.au/GasPriceTrends
Private and Confidential
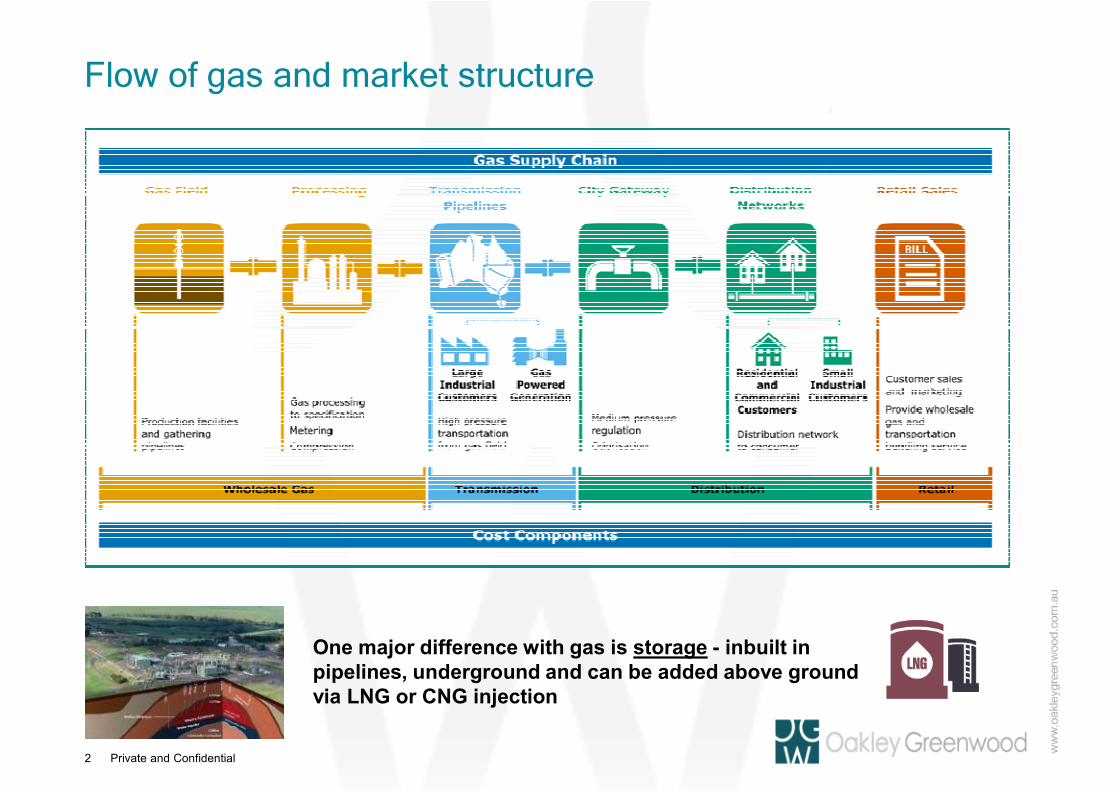
Flow of gas and market structure
2
One major difference with gas is storage - inbuilt in pipelines, underground and can be added above ground via LNG or CNG injection
Private and ConfidentialCopyright Oakley Greenwood
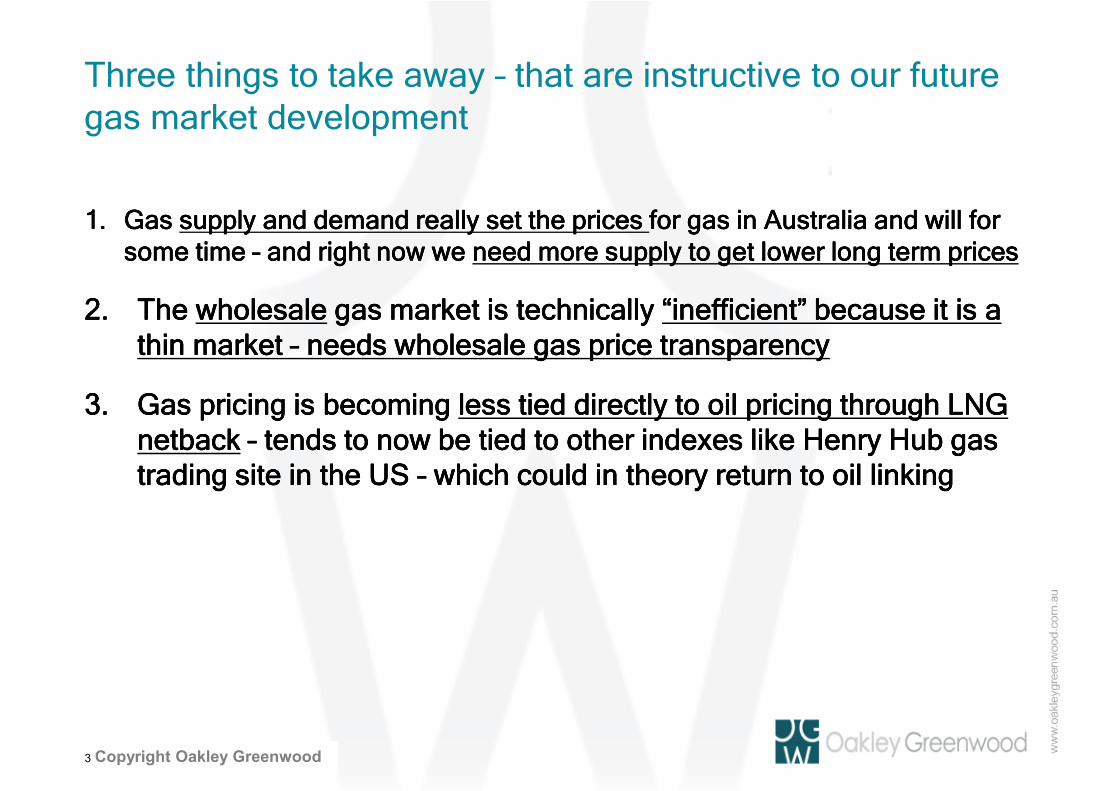
Three things to take away – that are instructive to our future gas market development
1.1.1.1. Gas Gas Gas Gas supply and demand really set the prices supply and demand really set the prices supply and demand really set the prices supply and demand really set the prices for gas in Australia and will for for gas in Australia and will for for gas in Australia and will for for gas in Australia and will for some time some time some time some time –––– and right now we and right now we and right now we and right now we need more supply to get lower long term pricesneed more supply to get lower long term pricesneed more supply to get lower long term pricesneed more supply to get lower long term prices
2.2.2.2. The The The The wholesalewholesalewholesalewholesale gas market is technically gas market is technically gas market is technically gas market is technically “inefficient” because it is a “inefficient” because it is a “inefficient” because it is a “inefficient” because it is a thin market thin market thin market thin market –––– needs wholesale gas price transparencyneeds wholesale gas price transparencyneeds wholesale gas price transparencyneeds wholesale gas price transparency
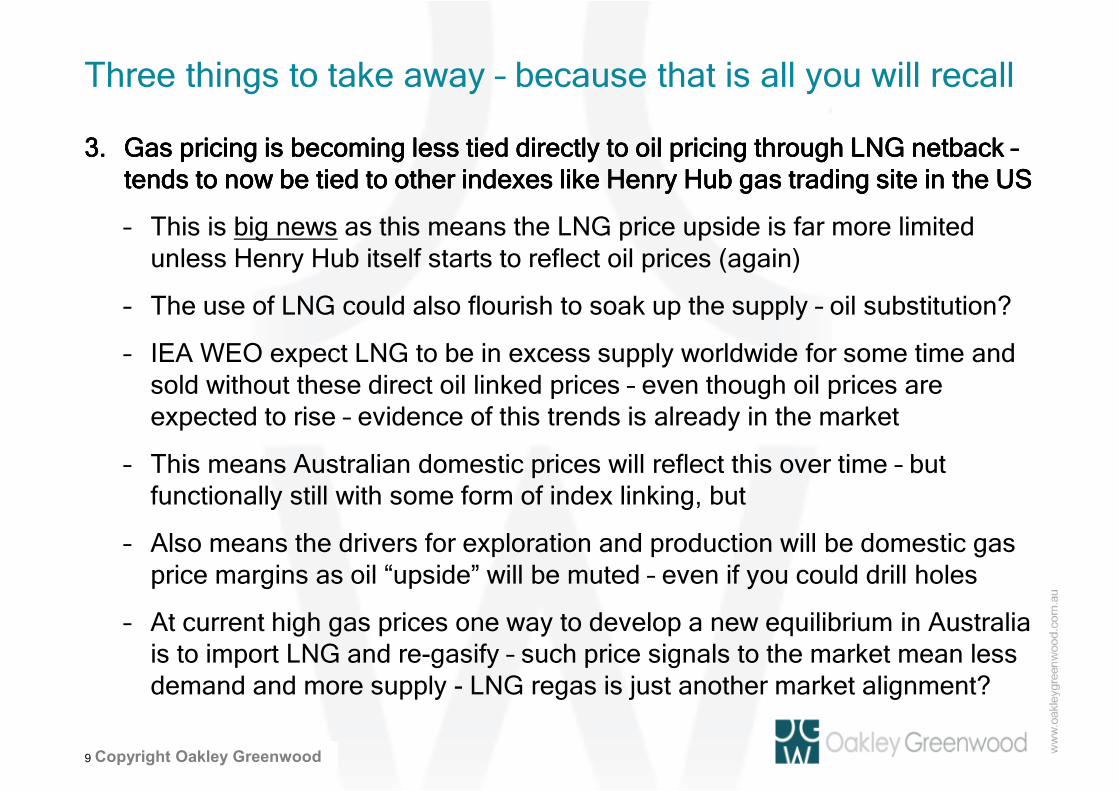
3.3.3.3. Gas pricing is becoming Gas pricing is becoming Gas pricing is becoming Gas pricing is becoming less tied directly to oil pricing through LNG less tied directly to oil pricing through LNG less tied directly to oil pricing through LNG less tied directly to oil pricing through LNG netbacknetbacknetbacknetback –––– tends to now be tied to other indexes like Henry Hub gas tends to now be tied to other indexes like Henry Hub gas tends to now be tied to other indexes like Henry Hub gas tends to now be tied to other indexes like Henry Hub gas trading site in the US trading site in the US trading site in the US trading site in the US –––– which could in theory return to oil linking which could in theory return to oil linking which could in theory return to oil linking which could in theory return to oil linking
3
Private and ConfidentialCopyright Oakley Greenwood
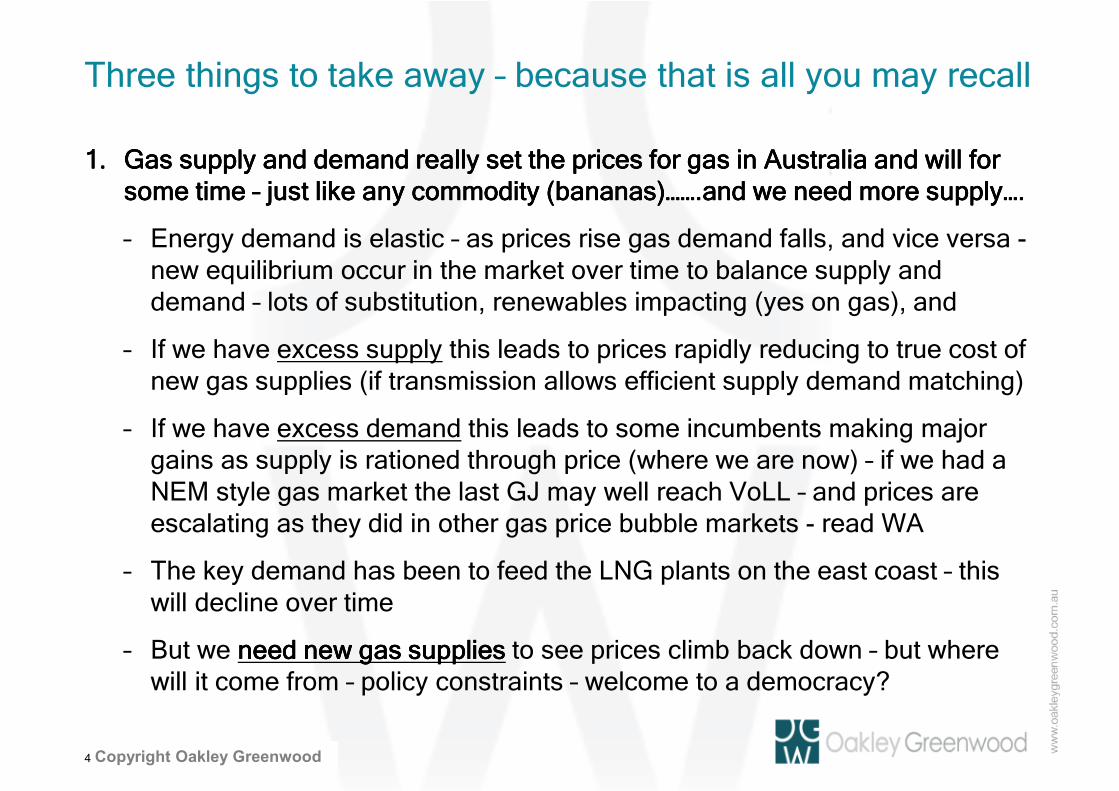
Three things to take away – because that is all you may recall
1.1.1.1. Gas supply and demand really set the prices for gas in Australia and will for Gas supply and demand really set the prices for gas in Australia and will for Gas supply and demand really set the prices for gas in Australia and will for Gas supply and demand really set the prices for gas in Australia and will for some time some time some time some time –––– just like any commodity (bananas)…….and we need more supply….just like any commodity (bananas)…….and we need more supply….just like any commodity (bananas)…….and we need more supply….just like any commodity (bananas)…….and we need more supply….
– Energy demand is elastic – as prices rise gas demand falls, and vice versa -new equilibrium occur in the market over time to balance supply and demand – lots of substitution, renewables impacting (yes on gas), and
– If we have excess supply this leads to prices rapidly reducing to true cost of new gas supplies (if transmission allows efficient supply demand matching)
– If we have excess demand this leads to some incumbents making major gains as supply is rationed through price (where we are now) – if we had a NEM style gas market the last GJ may well reach VoLL – and prices are escalating as they did in other gas price bubble markets - read WA
– The key demand has been to feed the LNG plants on the east coast – this will decline over time
– But we need new gas suppliesneed new gas suppliesneed new gas suppliesneed new gas supplies to see prices climb back down – but where will it come from – policy constraints – welcome to a democracy?
4
Private and Confidential
Lack of supply or excess demand rations supply through price and provides incentives to create more supply and reduce
demand
5
When bananas are $14/kg –
apples look good
Private and Confidential
Price Bubbles – WA gas market
6
Private and ConfidentialCopyright Oakley Greenwood
Three things to take away – because that is all you will recall
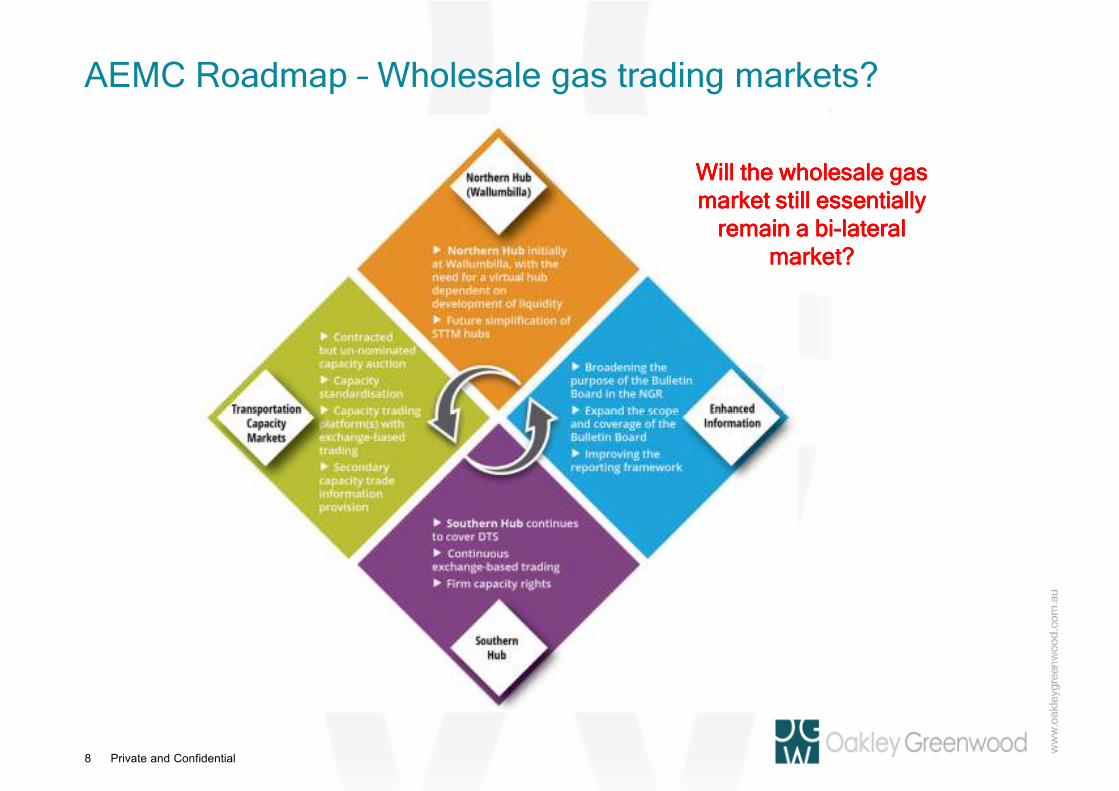
2.2.2.2. The The The The wholesalewholesalewholesalewholesale gas market is technically “inefficient” because it is a thin marketgas market is technically “inefficient” because it is a thin marketgas market is technically “inefficient” because it is a thin marketgas market is technically “inefficient” because it is a thin market
– At the wholesale level not a lot of buyers or sellers – sometimes just one trade - it is a bi-lateral contract market with very little real price discovery and inefficient wholesale gas trading, and
– Similarly little transparency of contract terms which are as important as price for gas and definitely change with supply and demand balances
– This “market” can be improved but mainly through price/terms discovery – a reason why the report was done – those in the market tend to use “intermediaries and market specialists” to make up for this currently
– ACCC Gas Market Review also said we need more gas but also focussed on gas transmission “re-regulation” due to concerns about market power
– This has led to the COAG Gas Market Reform Package and AEMC Gas Market Framework – hopefully we can see some real price discovery of wholesale gas prices – “continuous exchange based trading” model
– Dr Vertigan Gas Market Reform Group formed and has its work cut out for it –design through to early 2018, implementation by 2021?
7
Private and Confidential
AEMC Roadmap – Wholesale gas trading markets?
8
Will the wholesale gas Will the wholesale gas Will the wholesale gas Will the wholesale gas market still essentially market still essentially market still essentially market still essentially
remain a biremain a biremain a biremain a bi----lateral lateral lateral lateral market?market?market?market?
Private and ConfidentialCopyright Oakley Greenwood
Three things to take away – because that is all you will recall
3.3.3.3. Gas pricing is becoming less tied directly to oil pricing through LNG netback Gas pricing is becoming less tied directly to oil pricing through LNG netback Gas pricing is becoming less tied directly to oil pricing through LNG netback Gas pricing is becoming less tied directly to oil pricing through LNG netback ––––tends to now be tied to other indexes like Henry Hub gas trading site in the US tends to now be tied to other indexes like Henry Hub gas trading site in the US tends to now be tied to other indexes like Henry Hub gas trading site in the US tends to now be tied to other indexes like Henry Hub gas trading site in the US
– This is big news as this means the LNG price upside is far more limited unless Henry Hub itself starts to reflect oil prices (again)
– The use of LNG could also flourish to soak up the supply – oil substitution?
– IEA WEO expect LNG to be in excess supply worldwide for some time and sold without these direct oil linked prices – even though oil prices are expected to rise – evidence of this trends is already in the market
– This means Australian domestic prices will reflect this over time – but functionally still with some form of index linking, but
– Also means the drivers for exploration and production will be domestic gas price margins as oil “upside” will be muted – even if you could drill holes
– At current high gas prices one way to develop a new equilibrium in Australia is to import LNG and re-gasify – such price signals to the market mean less demand and more supply - LNG regas is just another market alignment?
9
Private and ConfidentialCopyright Oakley Greenwood
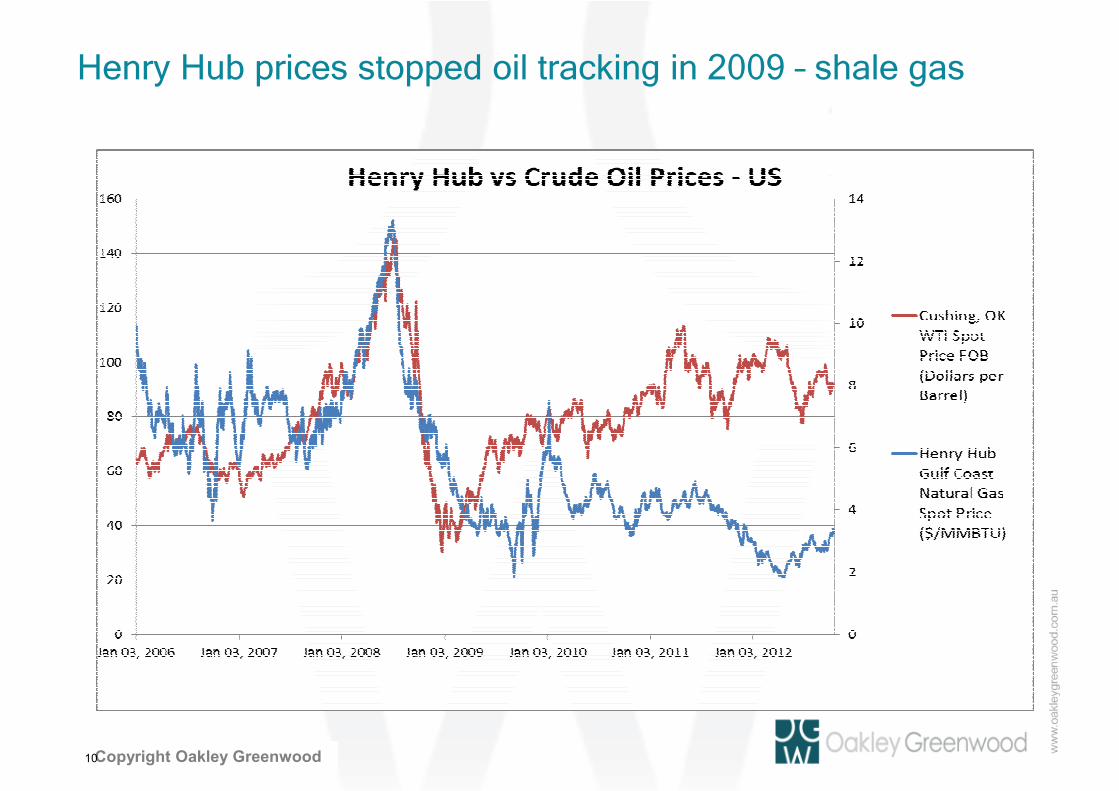
Henry Hub prices stopped oil tracking in 2009 – shale gas
10
Private and ConfidentialCopyright Oakley Greenwood
LNG prices not linked to oil at the moment – Henry Hub
11
Sources: METI and US Energy Information Administration
$-
$20
$40
$60
$80
$100
$120
Mar-
14
Ap
r-14
May-1
4
Ju
n-1
4
Ju
l-14
Au
g-1
4
Sep
-14
Oct-
14
No
v-1
4
Dec-1
4
Jan
-15
Feb
-15
Mar-
15
Ap
r-15
May-1
5
Ju
n-1
5
Ju
l-15
Au
g-1
5
Sep
-15
Oct-
15
No
v-1
5
Dec-1
5
Jan
-16
Feb
-16
Mar-
16
Ap
r-16
May-1
6
Ju
n-1
6
Ju
l-16
Au
g-1
6
Sep
-16
Oct-
16
No
v-1
6
Dec-1
6
Jan
-17
Japan Spot LNG (USD/MMBTu) Henry Hub (USD/MMBTu) Brent (USD/bbl)
$- $2 $4 $6 $8
$10 $12 $14 $16 $18 $20
Mar-
14
May-1
4
Ju
l-14
Sep
-14
No
v-1
4
Jan
-15
Mar-
15
May-1
5
Ju
l-15
Sep
-15
No
v-1
5
Jan
-16
Mar-
16
May-1
6
Ju
l-16
Sep
-16
No
v-1
6
Jan
-17
Private and Confidential
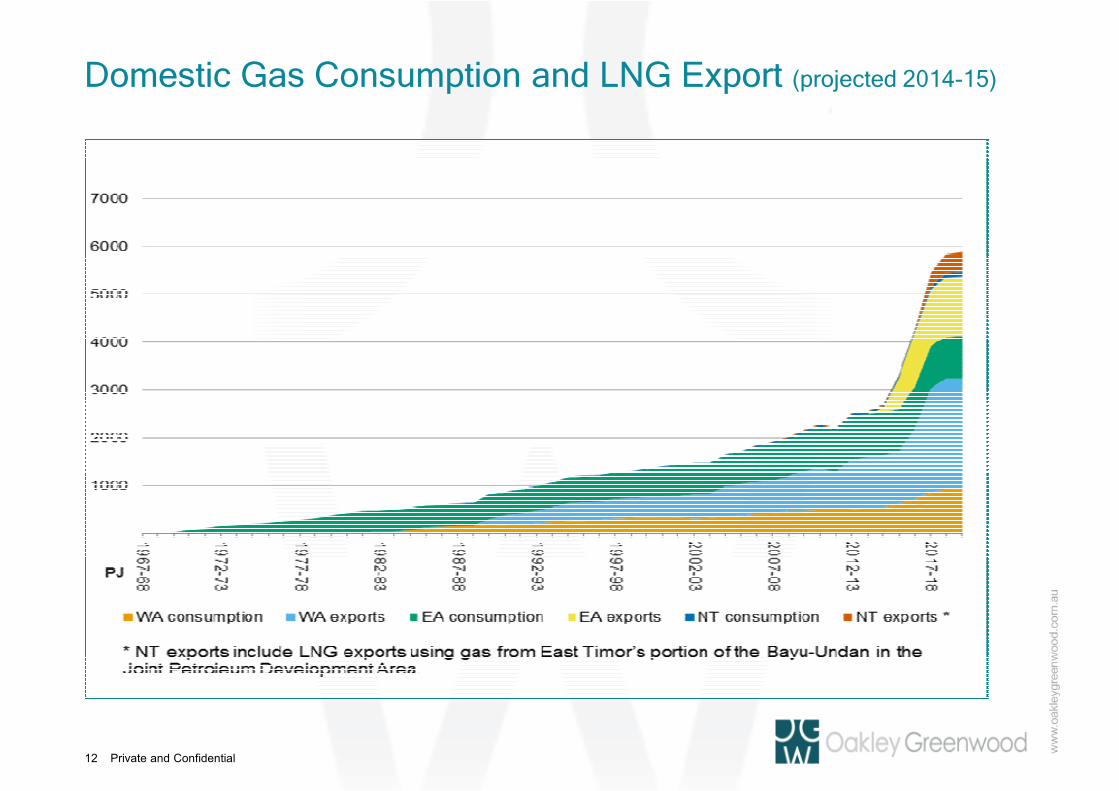
Domestic Gas Consumption and LNG Export (projected 2014-15)
12
Private and ConfidentialCopyright Oakley Greenwood
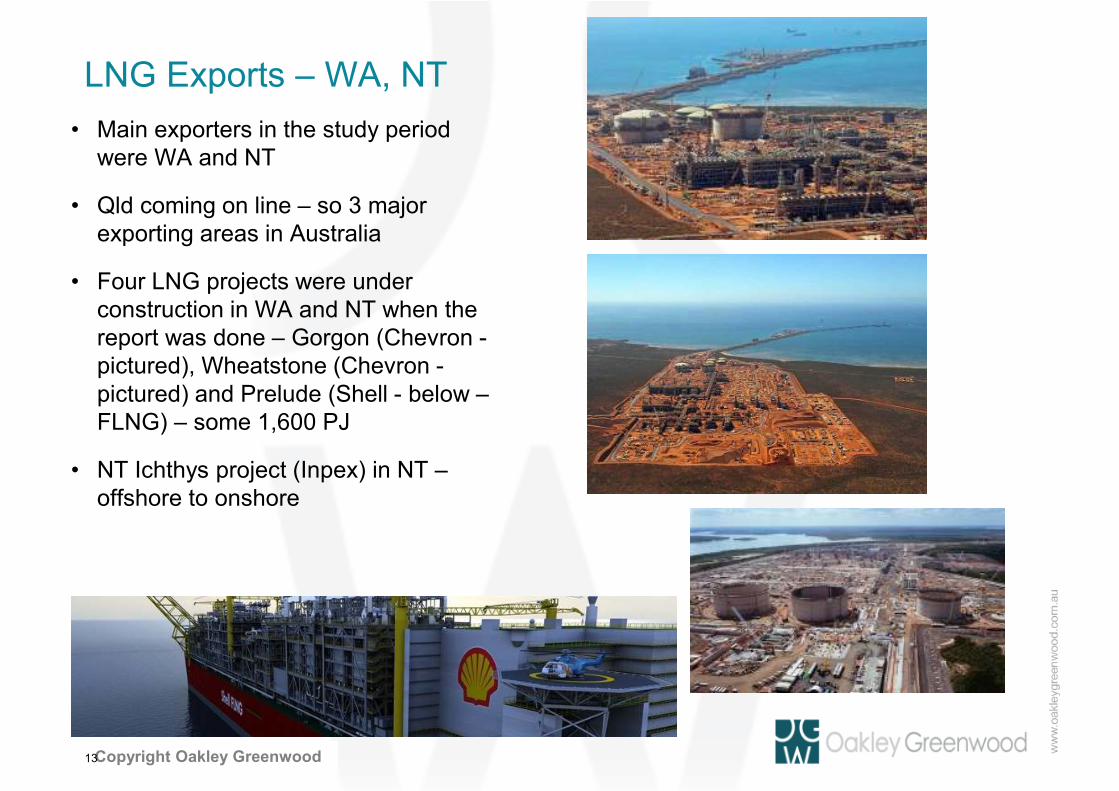
LNG Exports – WA, NT
• Main exporters in the study period were WA and NT
• Qld coming on line – so 3 major exporting areas in Australia
• Four LNG projects were under construction in WA and NT when the report was done – Gorgon (Chevron -pictured), Wheatstone (Chevron -pictured) and Prelude (Shell - below –FLNG) – some 1,600 PJ
• NT Ichthys project (Inpex) in NT –offshore to onshore
13
Private and ConfidentialCopyright Oakley Greenwood
LNG Exports - Qld
• Increase east coast demand by 1,400 PJ/yr –and is “hoovering” up east coast gas supplies –conventional and non-conventional
• Gladstone LNG –Santos
• Queensland Curtis LNG – British Gas –now Shell (with Arrow gas)
• Australian Pacific LNG – Origin/Conoco
• This is some 3 x the old gas demand for the east coast – which is now falling
14
Private and ConfidentialCopyright Oakley Greenwood
Key factors influencing Industrial gas prices
• Producer vs Retail Supplier
• Load Factors – swing gas?
• Contract Term – short or long
• Take or Pay levels – tightens when supply short
• GSA Price Reviews
• LNG Netback – or constraint pricing?
• Contract Timing and implications in 2011-2015
• Transmission
• Carbon tax
15
Private and ConfidentialCopyright Oakley Greenwood
Contract Term
• Short term contracts are less than 3 years
• Long term is typically longer than 3 years – used to be longer
• Major risks with longer term agreements when prices are volatile – buyers and buyers and buyers and buyers and sellerssellerssellerssellers then prefer short terms to manage market price risks, and
– The lack of a liquid market as such that has good price transparency and low transactional costs – cost benefit issues here on market designs
• Longer term agreements have predominated in some areas and for forms of supply e.g. common to find power station supplies on legacy long term agreements – resale of some of these has occurred with price increases
• The term of the agreement also specifies the total 2P reserves that must be allocated to the contract – this is a critical factor in the gas industry
• 2P reserves are finite until new gas can be “booked” by a Producer – important concept – especially when large volumes are contracted
16
Private and ConfidentialCopyright Oakley Greenwood
Contract Timing and implications in 2011-2015
• When market prices are escalating rapidly the timing for individual customers to seek renegotiation can have significant impacts on their prices over a 3 year period
• For example, some Industrial customers that recontracted a few years in advance of their requirement in 2009 and 2010, may still be under a gas supply agreement based on market fundamentals that did not have the full LNG impact.
• Other customers may have recently recontracted gas and have experienced a greater impact in the changes to the wholesale market price.
• In a period of substantial increase in price and market uncertainty, which the eastern Australian market has experienced during 2011 to 2015, the actual prices being paid by large Industrial customers can vary greatly, depending on their individual circumstances and the time they enter into a new supply agreement.
• Hence we have used the prevailing go forward wholesale gas supply price in the analysis
17
Private and ConfidentialCopyright Oakley Greenwood
LNG Netback – the Gladstone Effect
• LNG demand for gas feedstock and then linking the sale of this gas to oil prices has been the major factor that has driven up wholesale gas prices in Australia (east and west coast) – seeing a tripling of demand for gas in a short period
• But it also reflected the need to develop large scale new gas supplies –conventional and unconventional to meet this demand – and these also come at relatively higher prices than past conventional gas supplies
• Even as LNG prices have been hit by oil price reductions negotiations have focused onto this cost of new gas supply issue and scarcity pricing – more in future drivers
• The major impact for the southern gas markets (NSW, Vic, SA and Tasmania) has been the hoovering up of existing and new 2P reserves to meet LNG feedstock demands
• This has seen prices also rise there – slower and slightly less – but the linking of Moomba gas prices to LNG was the key – Bass Strait prices also escalated
18
Private and Confidential
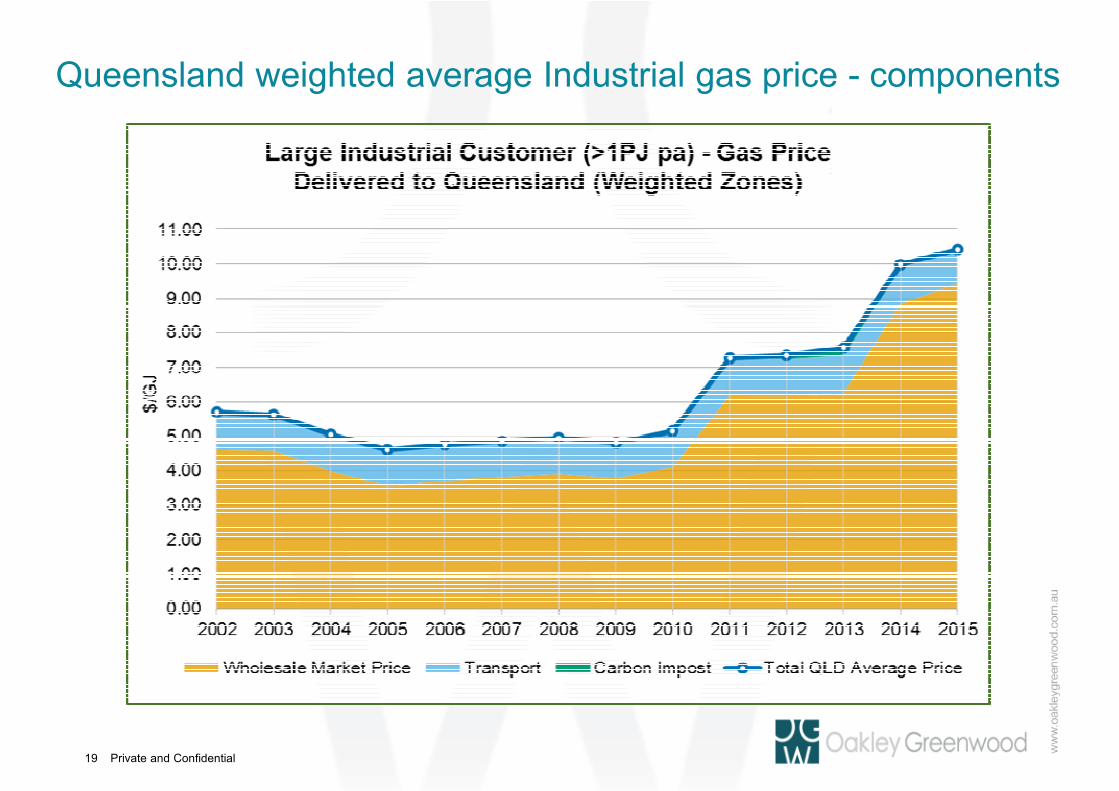
Queensland weighted average Industrial gas price - components
19
Private and Confidential
NSW & ACT large Industrial gas prices - components
20
Private and Confidential
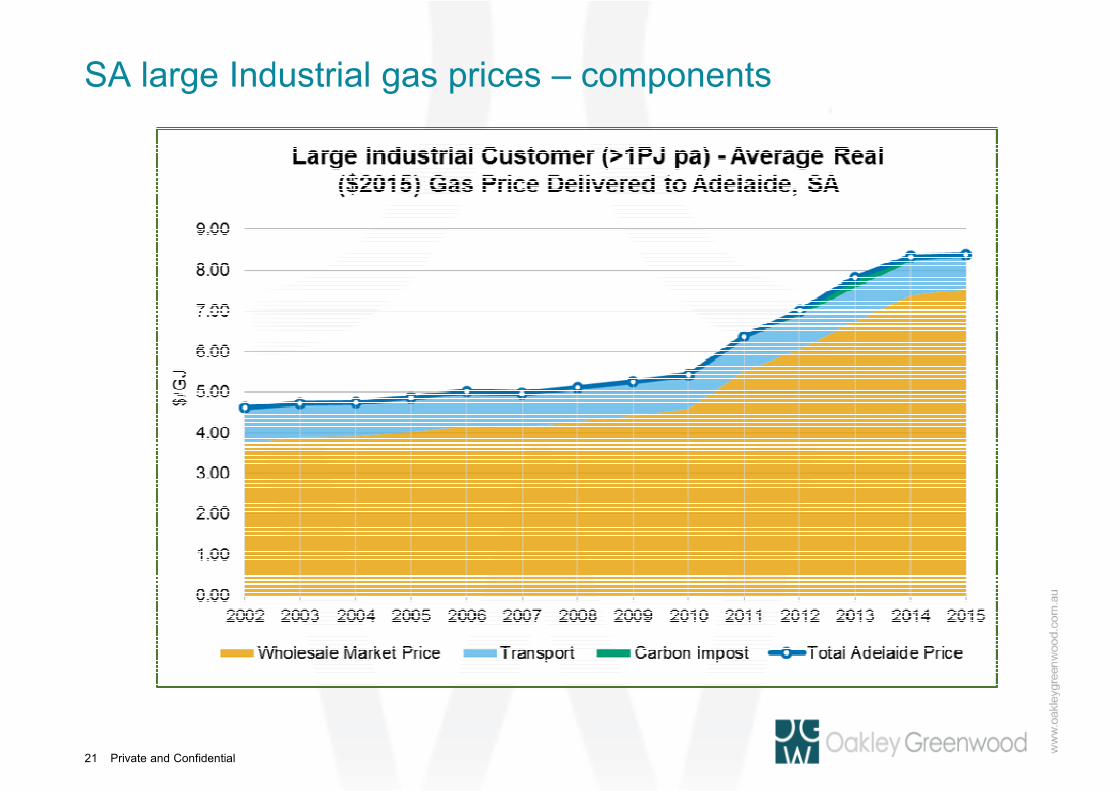
SA large Industrial gas prices – components
21
Private and Confidential
Victorian large Industrial customers - price components
22
Private and ConfidentialCopyright Oakley Greenwood
Some key points
• Many years of flat real prices to 2010 – associated with supply options from Moomba and Longford – EGP supply 2000 was very beneficial for competition
• Then prices started to rise due mainly to LNG demand/netback as Sydney market demand increased from Longford – as Moomba reserves were dedicated to Gladstone and major 2P reserves were sold at oil linked prices
• In October 2010 Santos sold 750 PJ of 2P reserves to GLNG oil price linked In October 2010 Santos sold 750 PJ of 2P reserves to GLNG oil price linked In October 2010 Santos sold 750 PJ of 2P reserves to GLNG oil price linked In October 2010 Santos sold 750 PJ of 2P reserves to GLNG oil price linked –––– the last remaining tranche of conventional gas that would have supported the last remaining tranche of conventional gas that would have supported the last remaining tranche of conventional gas that would have supported the last remaining tranche of conventional gas that would have supported competition in the NSW, Vic, SA and Tas domestic markets competition in the NSW, Vic, SA and Tas domestic markets competition in the NSW, Vic, SA and Tas domestic markets competition in the NSW, Vic, SA and Tas domestic markets –––– it was a game it was a game it was a game it was a game changer for these markets, andchanger for these markets, andchanger for these markets, andchanger for these markets, and
• The Cooper Basin production was in decline (next slide) and NSW has very little indigenous supply of gas
• The whole south east gas market is now more exposed to supply from Longford – Sydney was heavily impacted as it had been reliant on supply from Moomba with a balancing effect from Longford
23
Private and ConfidentialCopyright Oakley Greenwood
Some key points
• The NSW price rises were faster and higher than for Victoria due to the Moomba connection, and
• This is what has kicked off the Victorian price rises (and indicates what may happen to prices in Victoria)
• Sydney also has to pay additional haulage as there is no gas supply close to by and this does add more to the costs
24
Private and Confidential
WA large Industrial gas prices (Perth) - components
25
Private and Confidential
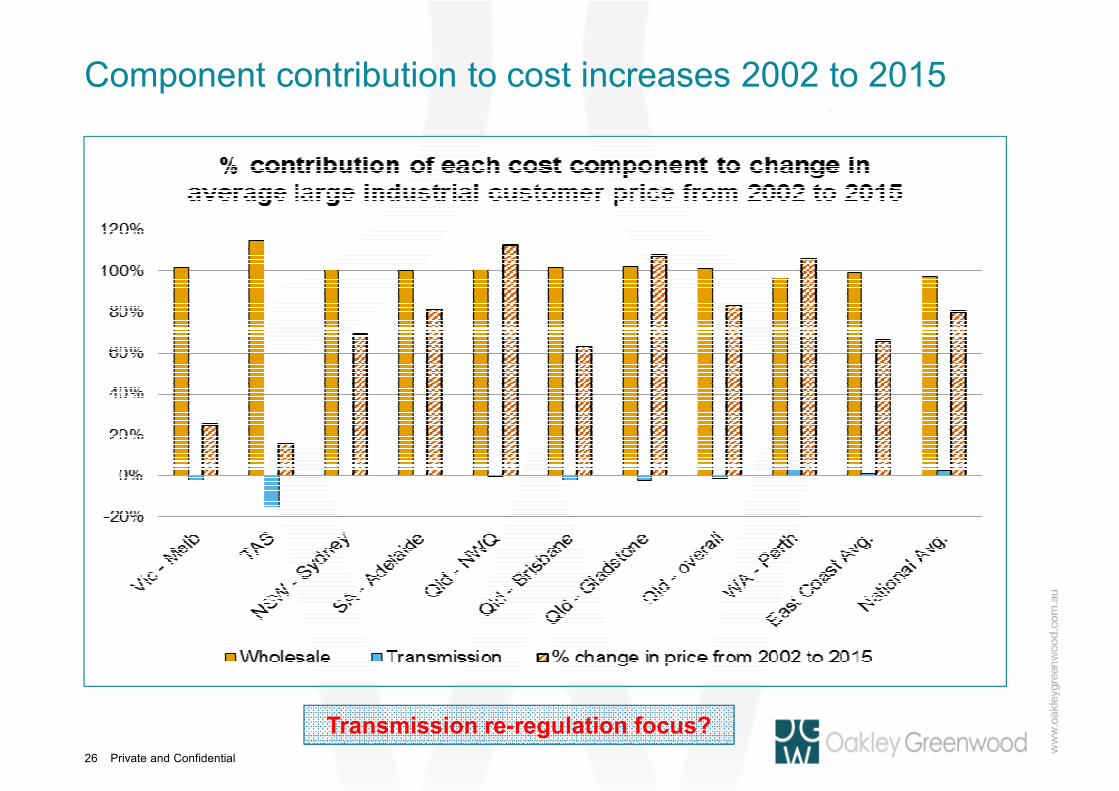
Component contribution to cost increases 2002 to 2015
26
Transmission re-regulation focus?
Private and ConfidentialCopyright Oakley Greenwood
Future trends affecting the East Coast Gas Market
27
Private and ConfidentialCopyright Oakley Greenwood
Key drivers of future wholesale gas prices?
• The key issue in nearly all the jurisdictional markets that will impact future wholesale gas prices is the supply and demand balance, including the ability to haul gas without undue transmission constraints.
• The simple economic models of supply and demand balances and clearing The simple economic models of supply and demand balances and clearing The simple economic models of supply and demand balances and clearing The simple economic models of supply and demand balances and clearing prices is always at play in this market. Indicates it is still very much a prices is always at play in this market. Indicates it is still very much a prices is always at play in this market. Indicates it is still very much a prices is always at play in this market. Indicates it is still very much a commodity market?commodity market?commodity market?commodity market?
• High prices develop, signalling scarcity, and this has seen the playing out of demand reductions and new supply entering the various jurisdictional markets to mitigate these prices or satisfy demand at the relevant clearing prices.
• For those with market power at the time price increases may seem to be a windfall but it can be seen from the Gas Price Trends report that this is also an essential component in the development of new supply (and in rationing demand at times).
28
Private and ConfidentialCopyright Oakley Greenwood
Key drivers of future wholesale gas prices?
• Individual results may vary in this market more that should probably be expected of a more mature market as it is a thin transactional market (intermittent transactions occurring rather than daily clearing exchange style market) based largely on bi-lateral contracting, and hence suffers from very poor price transparency (as evidenced by the need for this report) and relatively high transactional costs.
• More efficiency in the market would probably see more homogenise results across large off takers and a lot more volume trading between participants that may mitigate pricing, but probably would still not impact the underlying supply , but probably would still not impact the underlying supply , but probably would still not impact the underlying supply , but probably would still not impact the underlying supply and demand balances at the macro leveland demand balances at the macro leveland demand balances at the macro leveland demand balances at the macro level.
• Other market mechanisms have pervaded the market to try and compensate for these structural deficiencies and the underlying nature of the market in terms of being transactionally intermittent. The main mechanisms are shorter term gas supply agreements (3 to 5 years) where the market is tested more frequently and/or contractual market price reviews that can either be negotiate and arbitrate or agreement ending – again designed to retest market pricing at regular intervals.
29
Private and ConfidentialCopyright Oakley Greenwood
Key drivers of future Industrial gas prices?
• Both the east coast and west coast Australian markets have been at times linked to LNG export plant wholesale gas demand and this has driven pricing peaks to LNG netback levels (where oil was high priced) as this demand is satisfied.
• However we have also seen (and it is demonstrated in this report) that once supply in those markets exceeds the demand the prices start to almost immediately retreat to cost of supply pricing, as long as there is reasonable competition (and not substantial transmission constraints), or just a desire by a Producer or Retailer to dispose of their excess gas.
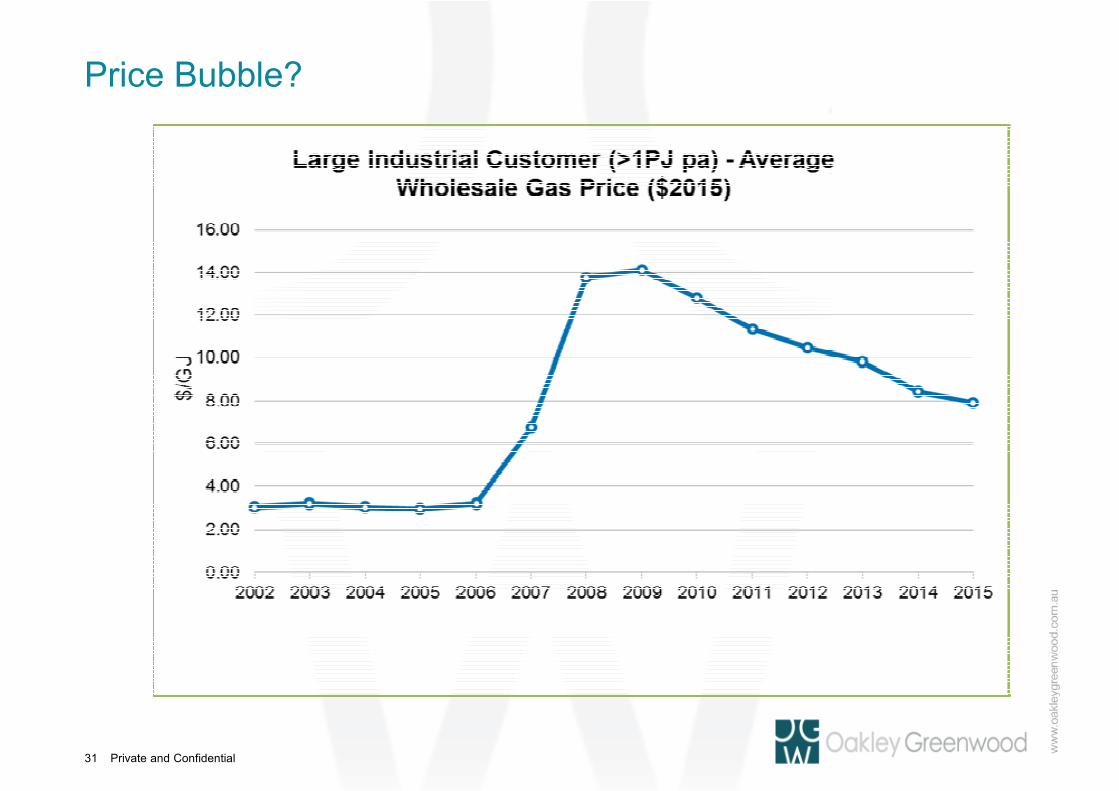
• This produces “pricing bubblespricing bubblespricing bubblespricing bubbles” where prices rise to signal the need for change in the market clearing volumes as supply becomes scarce, and then retreats once this occurs and supply can meet demand or is in excess of market need. In Australia’s case wholesale gas prices have escalated first to LNG netback and then retreated more to cost of supply.
• The Western Australia wholesale market price trend is a working example of this bubble pricing created by LNG demand, and then moving to more of a clearing price for excess volume based most likely on the costs of new supply
30
Private and Confidential
Price Bubble?
31
Private and ConfidentialCopyright Oakley Greenwood
Key drivers of future wholesale gas prices?
• The east coast gas market prices are in the rising, and maybe even topping out, stage of this cycle/bubble.
• This is clearly dependent on the market satisfying the current demand for LNG plant feedstock and there being no new LNG plant development in this region. This cycle has yet to be played out but for the east coast gas markets it is critical in terms of pricing over the next 5 years, and there are (were) a range of new explorers and developers that have entered the supply market.
• The impact of significant oil price reductions has been a distinct factor in wholesale gas price mitigation as it has negated LNG netback pricing cases. But this has simply exposed the true underlying problem of the need for new gas supply volumes to be developed, and that these look to be more expensive than the traditional gas supply.
• The interesting aspect of this cycle is how much it has affected the traditional market prices of Victoria, NSW and South Australia (and Tasmania). The transmission interconnectivity of the basins and markets has been enough to see the flow back of high Queensland prices that were more directly driven by LNG feedstock demand increases.
32
Private and ConfidentialCopyright Oakley Greenwood
Key drivers of future wholesale gas prices?
• The prices seen in the south eastern Australian gas markets have lagged those in Queensland and prices have been mitigated by distances and underlying contractual positions of Retailers and large Industrial customers (and greater competition for customers).
• The prices into the Sydney hub seem to be the clearing prices for this current market dynamic in the southern markets (largely because NSW does not have any major supplies of indigenous gas). Victoria is best served in this market as the available supply is so close to the market demand but it is also starting to suffer from price escalations as Sydney sets the clearing prices for Bass Strait Sydney sets the clearing prices for Bass Strait Sydney sets the clearing prices for Bass Strait Sydney sets the clearing prices for Bass Strait gas salesgas salesgas salesgas sales.
• The issue over the next 5 years is the cost of new gas supplies to service the market demand as this could be the new wholesale gas market clearing price.
• The pricing bubble effect will continue until the demand is satisfied (be that in total or through reduced demand) and new supply starts to seek out market demand. The outlier is if demand again escalates should there be a believable increase in oil prices that sparks new LNG capacity in Australia.
33
Private and Confidential
Lets look at LNG as it was the initial cause and linked domestic gas rices to international gas prices - it pays to understand this market and current and future dynamics
34
Private and ConfidentialCopyright Oakley Greenwood
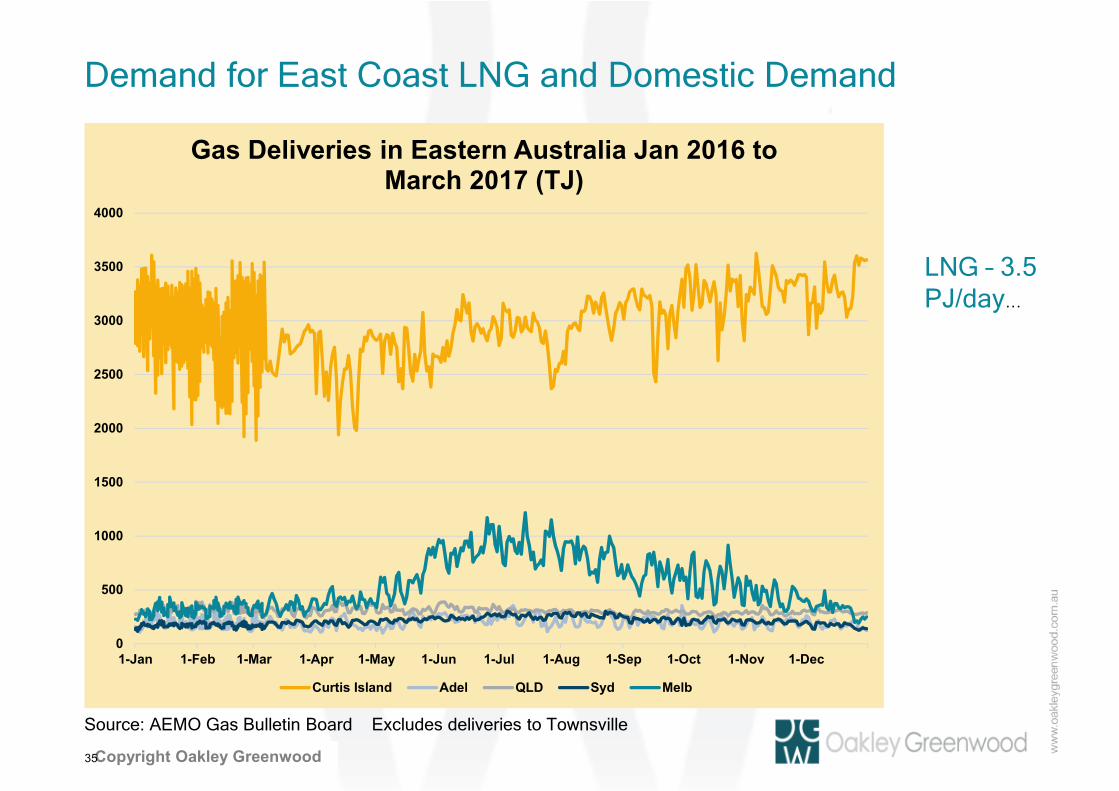
Demand for East Coast LNG and Domestic Demand
Source: AEMO Gas Bulletin Board Excludes deliveries to Townsville
Gas Deliveries in Eastern Australia Jan 2016 to March 2017 (TJ)
Curtis Island Adel QLD Syd Melb
LNG – 3.5 PJ/day…
Private and ConfidentialCopyright Oakley Greenwood
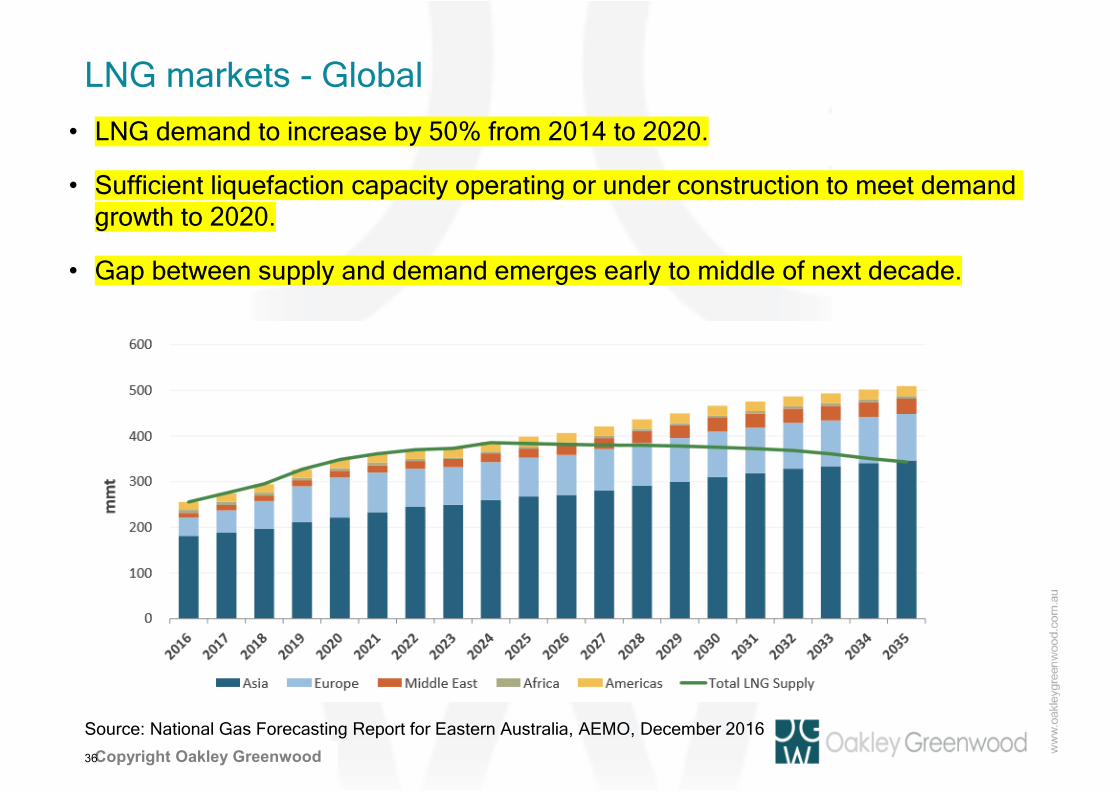
LNG markets - Global
• LNG demand to increase by 50% from 2014 to 2020.
• Sufficient liquefaction capacity operating or under construction to meet demand growth to 2020.
• Gap between supply and demand emerges early to middle of next decade.
36
Source: National Gas Forecasting Report for Eastern Australia, AEMO, December 2016
Private and ConfidentialCopyright Oakley Greenwood
LNG markets - Asia
• Shell predicting that Southeast Asia, where Malaysia and Indonesia are among the major LNG exporters in the world, will by 2035 be net importers.
• The rise in demand is driven by economic growth in the region and declining domestic gas supplies in countries such as Thailand.
37
Sources: National Gas Forecasting Report for Eastern Australia, AEMO, December 2016 and Shell LNG Outlook 2017
Private and ConfidentialCopyright Oakley Greenwood
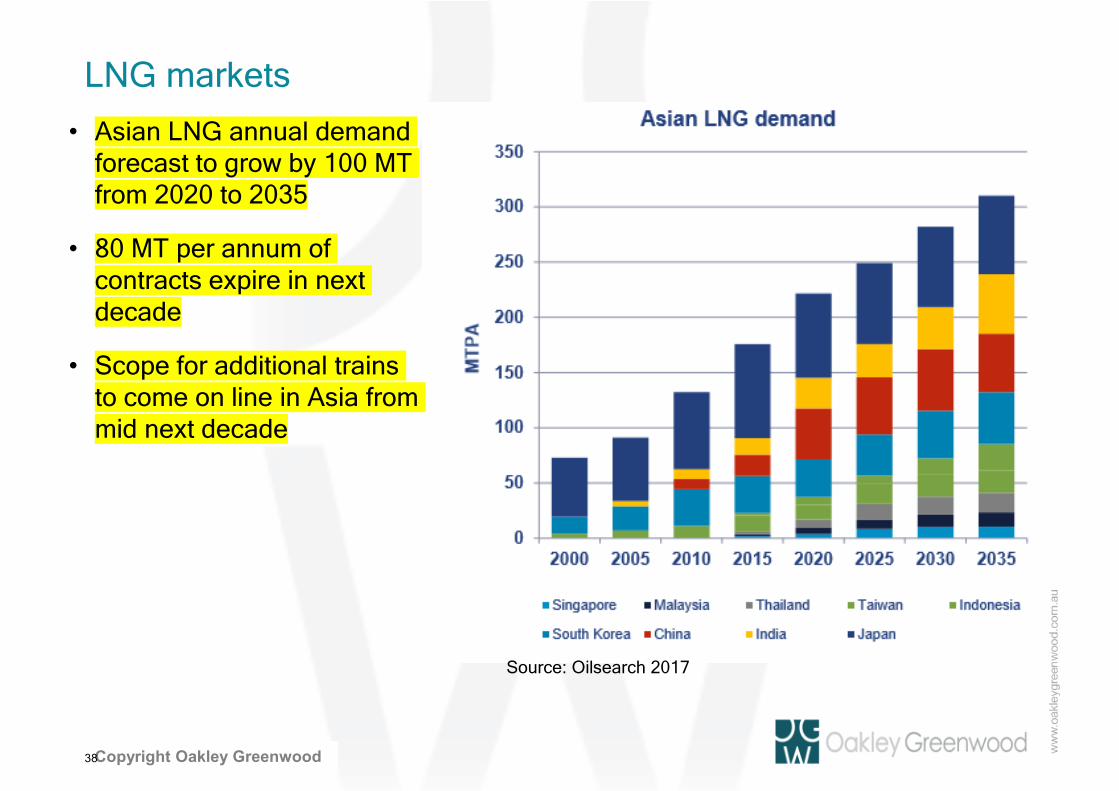
LNG markets
38
• Asian LNG annual demand forecast to grow by 100 MT from 2020 to 2035
• 80 MT per annum of contracts expire in next decade
• Scope for additional trains to come on line in Asia from mid next decade
Source: Oilsearch 2017
Private and ConfidentialCopyright Oakley Greenwood
LNG markets – Spot prices delivered Japan
39
Source: Ministry of Economy, Trade and Industry
• Prices driven higher in late 2016 due to an Gorgon Train 1 outage. The highest spot price was $9.50/MMBtu in late December.
• However prices have dropped since Train 1 returned to service with an average delivered price of $US8.80/MMBtu in February.
$-
$2
$4
$6
$8
$10
$12
$14
$16
$18
$20
USD/MMBTu
Private and ConfidentialCopyright Oakley Greenwood
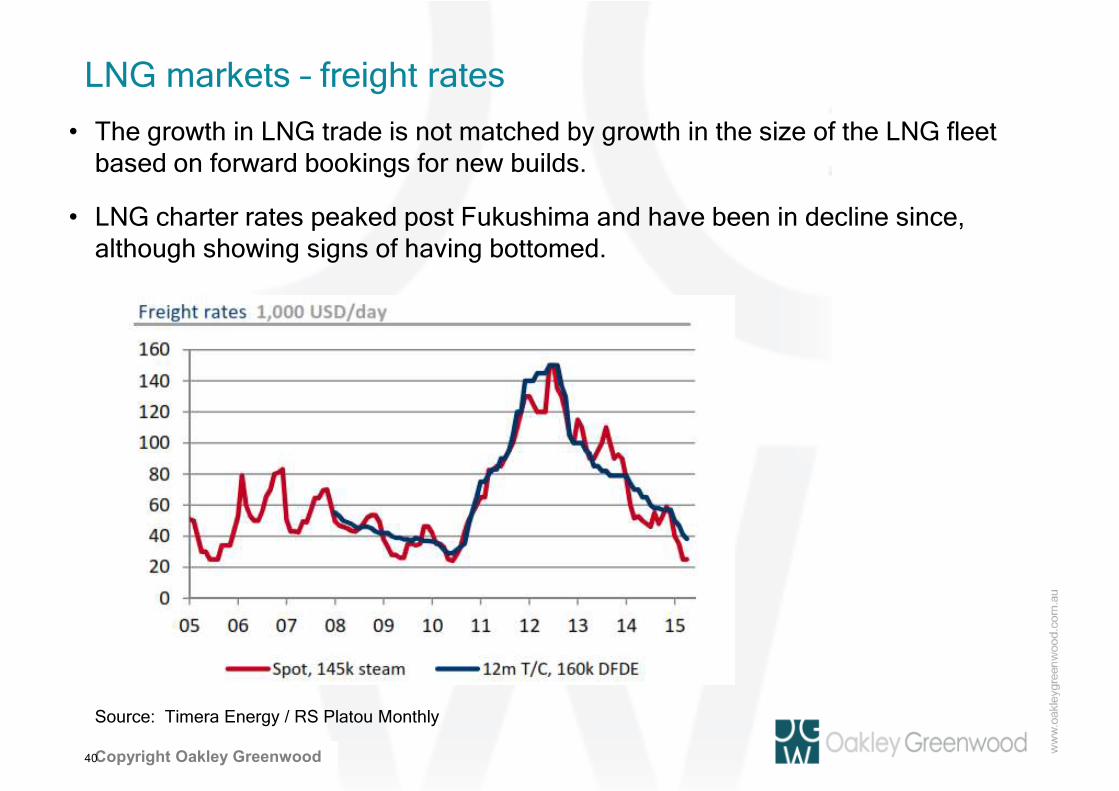
LNG markets – freight rates
• The growth in LNG trade is not matched by growth in the size of the LNG fleet based on forward bookings for new builds.
• LNG charter rates peaked post Fukushima and have been in decline since, although showing signs of having bottomed.
40
Source: Timera Energy / RS Platou Monthly
Private and ConfidentialCopyright Oakley Greenwood
Evolving LNG markets – pricing
41
Source: LNG Outlook 2017, Shell
* International Energy Outlook 2016, US Energy Information Administration # Cheniere Energy presentation October 2013
• Almost 80% of U.S. LNG exports from projects under construction have been priced on terms directly linked to the Henry Hub price, or under a hybrid pricing mechanism with links to Henry Hub*
• Sales (286,500,000 MMBtu/annum) from Sabine Pass (BG Group) priced with combination of Fixed Annual Fee (USD723 million), Fixed Fee per MMBtu fee ($2.25-3.00/MMBtu) and LNG Cost component (eg 115% of Henry Hub price)#
Private and ConfidentialCopyright Oakley Greenwood
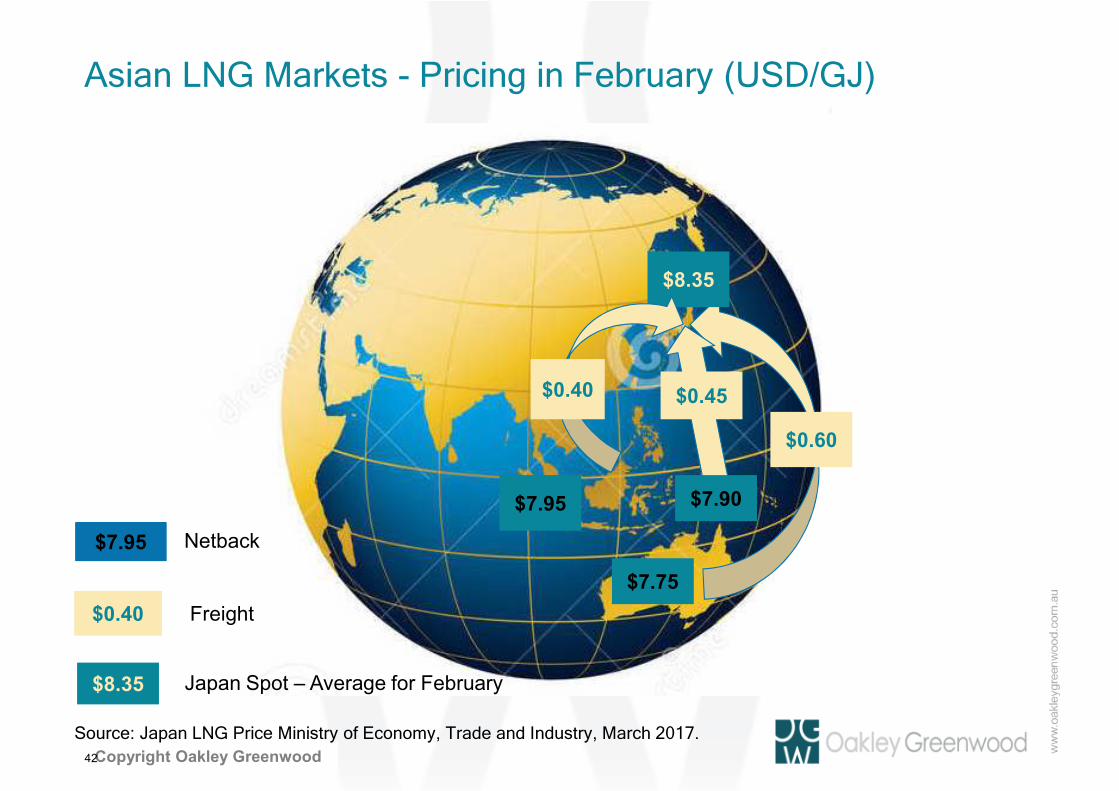
Asian LNG Markets - Pricing in February (USD/GJ)
42
$8.35
$0.40
$7.95
$0.60
$7.75
$0.45
$7.90
$7.95 Netback
$0.40 Freight
Japan Spot – Average for February$8.35
Source: Japan LNG Price Ministry of Economy, Trade and Industry, March 2017.
Private and ConfidentialCopyright Oakley Greenwood
Australian LNG Imports – Pricing in February (USD/GJ)
43
$7.95
$0.60
$7.75
$0.35
$0.30
$7.90
$8.20/$8.55
$8.10
$5.95 Delivered
$0.30 Freight
FOB LNG Plant$5.75
Private and ConfidentialCopyright Oakley Greenwood
LNG Imports – increasing flexibility
• Shell predicting that over the next two decades LNG will increasingly be used when there are shortages in domestic energy supply.
• Floating Storage Regasification Units (FSRUs) increasingly used as an alternative to onshore facilities – FSRUs account for 10% of regas capacity.
• Large proportion of new importing countries have developed FSRUs to meet seasonal peak demand by buying LNG on spot markets.
44
Photo Credit: Hoegh LNG
Private and ConfidentialCopyright Oakley Greenwood
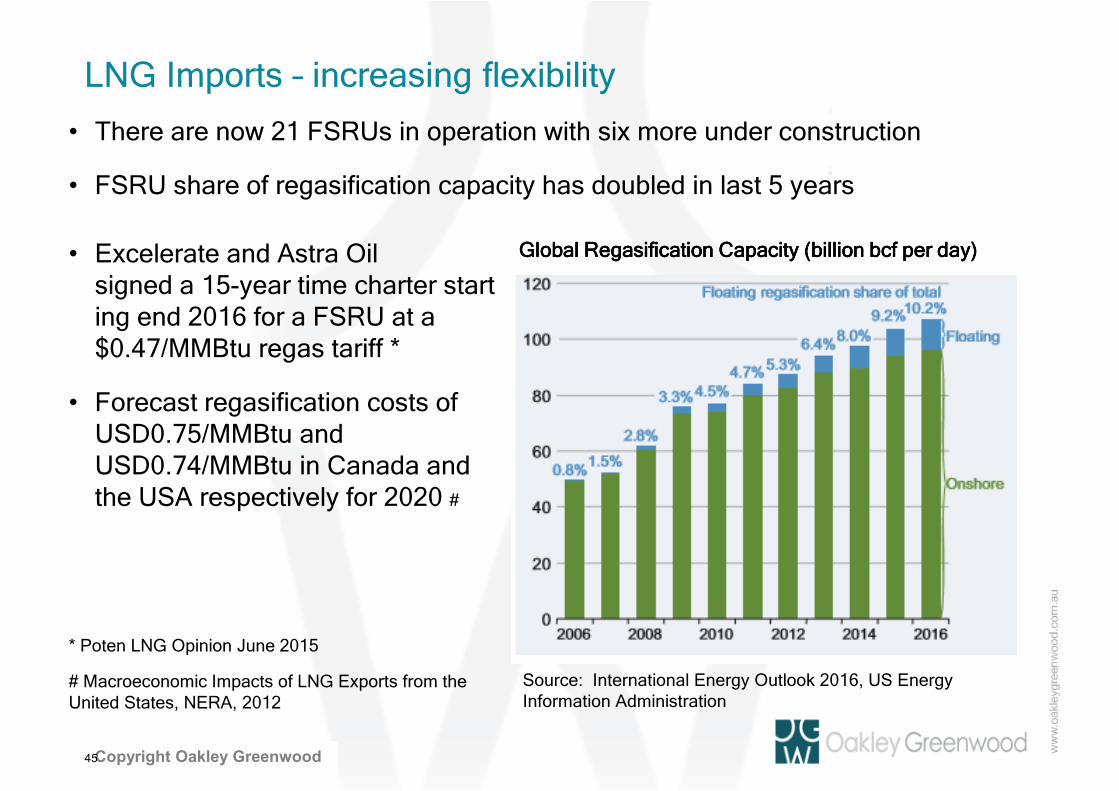
LNG Imports – increasing flexibility
• There are now 21 FSRUs in operation with six more under construction
• FSRU share of regasification capacity has doubled in last 5 years
45
Source: International Energy Outlook 2016, US Energy Information Administration
Global Regasification Capacity (billion Global Regasification Capacity (billion Global Regasification Capacity (billion Global Regasification Capacity (billion bcfbcfbcfbcf per day)per day)per day)per day)• Excelerate and Astra Oil signed a 15‐year time charter starting end 2016 for a FSRU at a $0.47/MMBtu regas tariff *
• Forecast regasification costs of USD0.75/MMBtu and USD0.74/MMBtu in Canada and the USA respectively for 2020 #
* Poten LNG Opinion June 2015
# Macroeconomic Impacts of LNG Exports from the United States, NERA, 2012
Private and Confidential
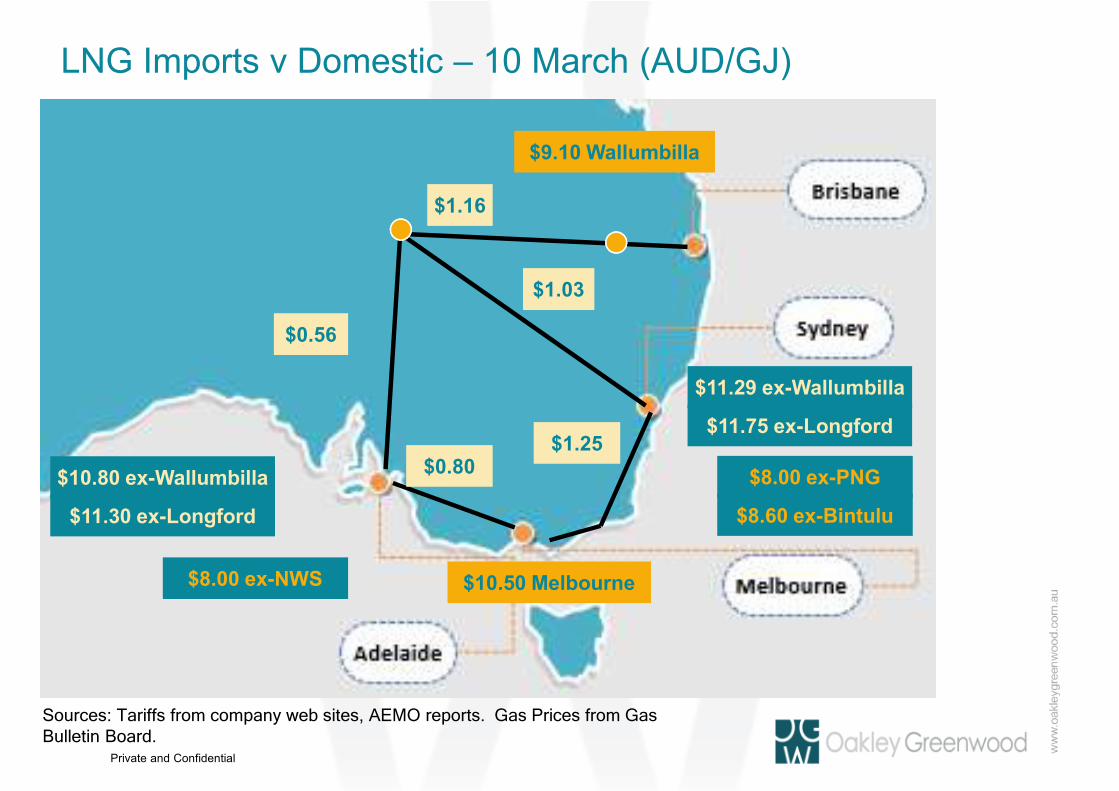
$8.00 ex-NWS
$1.16
$1.03
$0.56
$1.25
$11.29 ex-Wallumbilla
$11.75 ex-Longford
$9.10 Wallumbilla
$10.50 Melbourne
$10.80 ex-Wallumbilla
$11.30 ex-Longford
LNG Imports v Domestic – 10 March (AUD/GJ)
$8.00 ex-PNG
$8.60 ex-Bintulu
$0.80
Sources: Tariffs from company web sites, AEMO reports. Gas Prices from Gas Bulletin Board.
Private and ConfidentialCopyright Oakley Greenwood
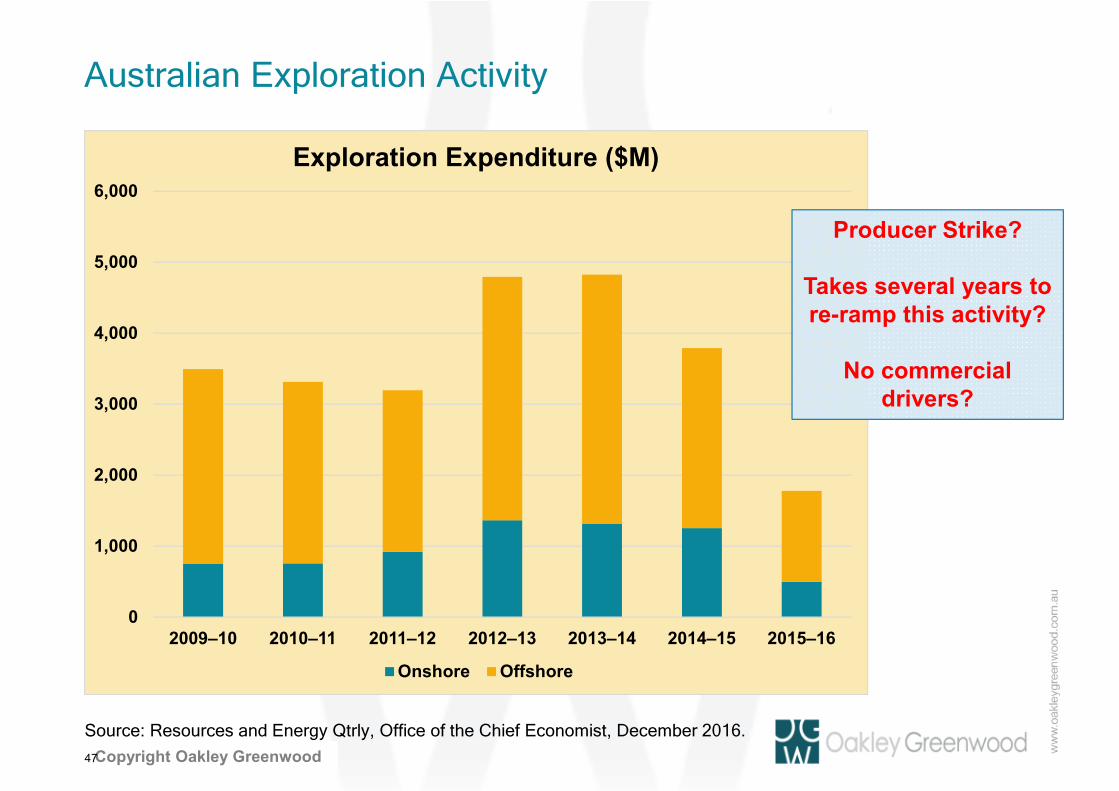
Australian Exploration Activity
47
Source: Resources and Energy Qtrly, Office of the Chief Economist, December 2016.
Private and ConfidentialCopyright Oakley Greenwood
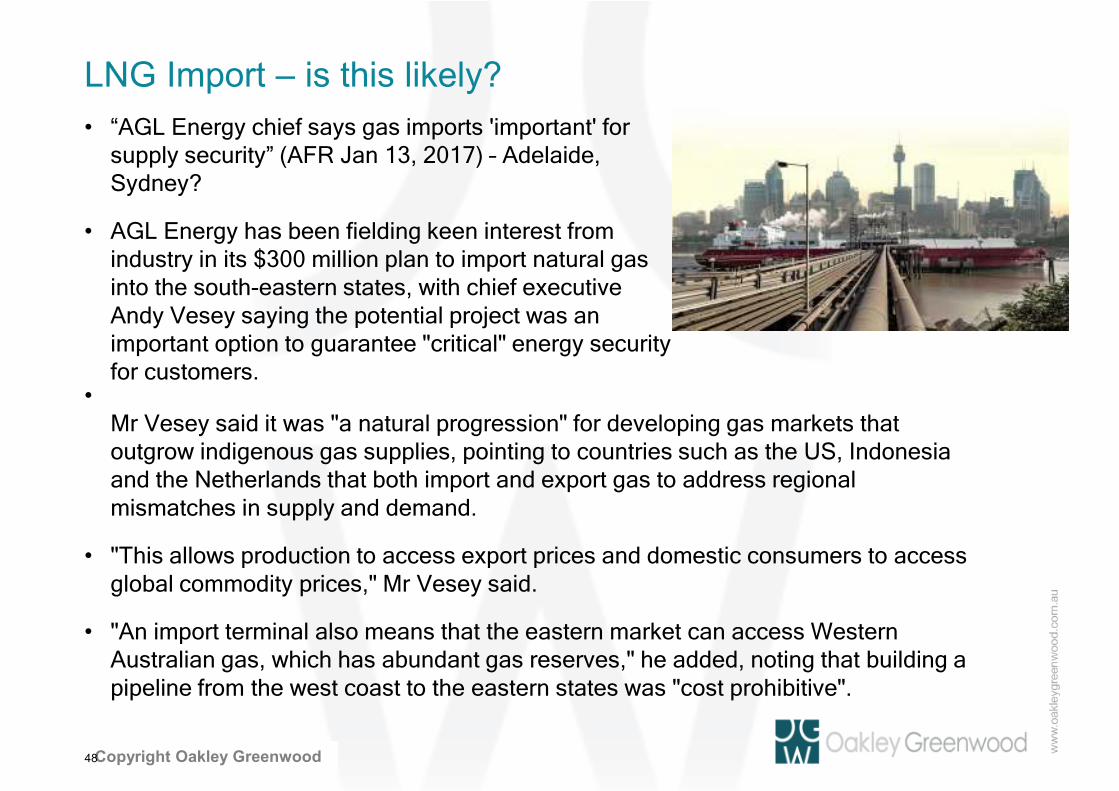
LNG Import – is this likely?
• “AGL Energy chief says gas imports 'important' for supply security” (AFR Jan 13, 2017) – Adelaide, Sydney?
• AGL Energy has been fielding keen interest from industry in its $300 million plan to import natural gas into the south-eastern states, with chief executive Andy Vesey saying the potential project was an important option to guarantee "critical" energy security for customers.
48
•Mr Vesey said it was "a natural progression" for developing gas markets that outgrow indigenous gas supplies, pointing to countries such as the US, Indonesia and the Netherlands that both import and export gas to address regional mismatches in supply and demand.
• "This allows production to access export prices and domestic consumers to access global commodity prices," Mr Vesey said.
• "An import terminal also means that the eastern market can access Western Australian gas, which has abundant gas reserves," he added, noting that building a pipeline from the west coast to the eastern states was "cost prohibitive".
Private and ConfidentialCopyright Oakley Greenwood
Declining domestic demand
49
Private and Confidential
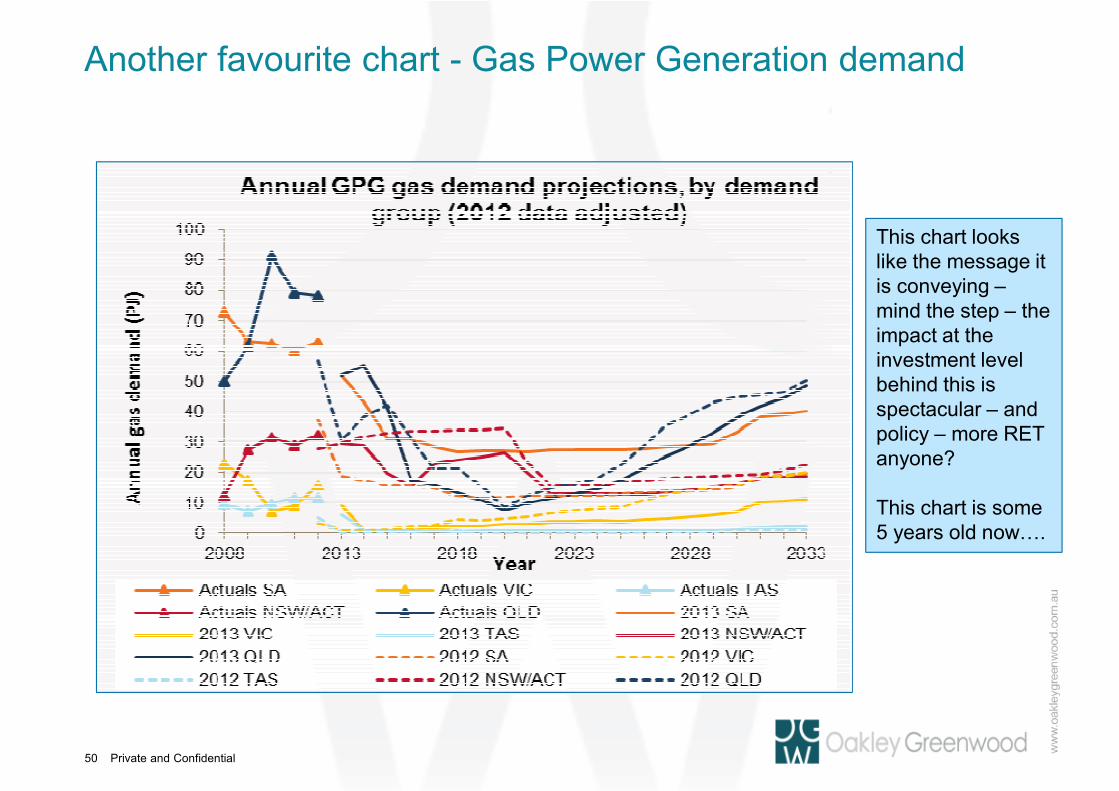
Another favourite chart - Gas Power Generation demand
50
This chart looks like the message it is conveying –mind the step – the impact at the investment level behind this is spectacular – and policy – more RET anyone?
This chart is some 5 years old now….
Private and ConfidentialCopyright Oakley Greenwood
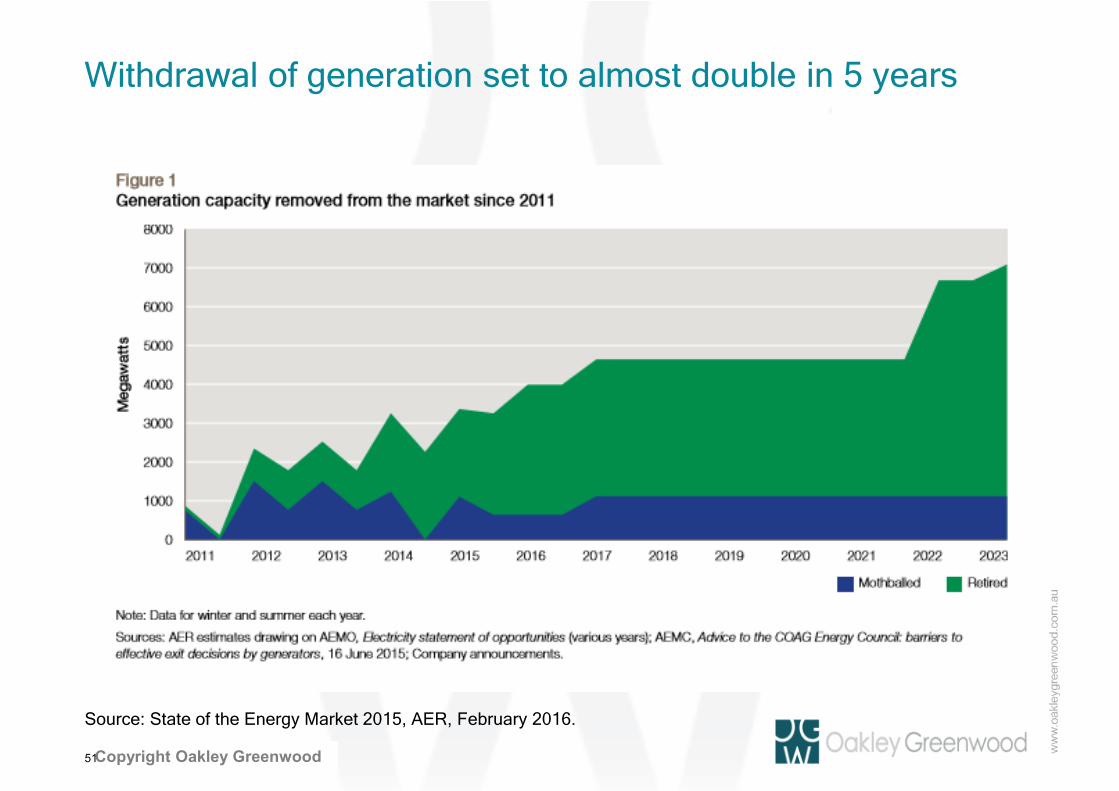
Withdrawal of generation set to almost double in 5 years
51
Source: State of the Energy Market 2015, AER, February 2016.
Private and ConfidentialCopyright Oakley Greenwood
Industrial demand – know for years….
52
AFR 7 Mar 2017
ABC 20 Feb 2017
The Australian 10 March 2017
The Australian 9 March 2017
The Australian 9 March 2017
The Australian 7 Nov 2016
0
50
100
150
200
250
300
350
2010
2012
2014
2016
2018
2020
2022
2024
2026
2028
2030
2032
2034
2036
Forecast East Coast Gas Consumption - excl LNG (PJ)
GPG Industrial ResidentialCommercial
Private and ConfidentialCopyright Oakley Greenwood
Gas Prices: What gas users are saying
• The Australian Industry Group surveyed 286 medium sized business in late 2016 to obtain anecdotal feedback on gas and electricity price increases.
53
Source: Energy Shock: No Power, No Gas, No Future, AIG, February 2017
0
5
10
15
20
25
Historic Average 2015 Contracts 2016 Offers December 2016Offers
February 2017 Offers
Wholesale Component of Gas Contract Prices ($/GJ)
Private and ConfidentialCopyright Oakley Greenwood
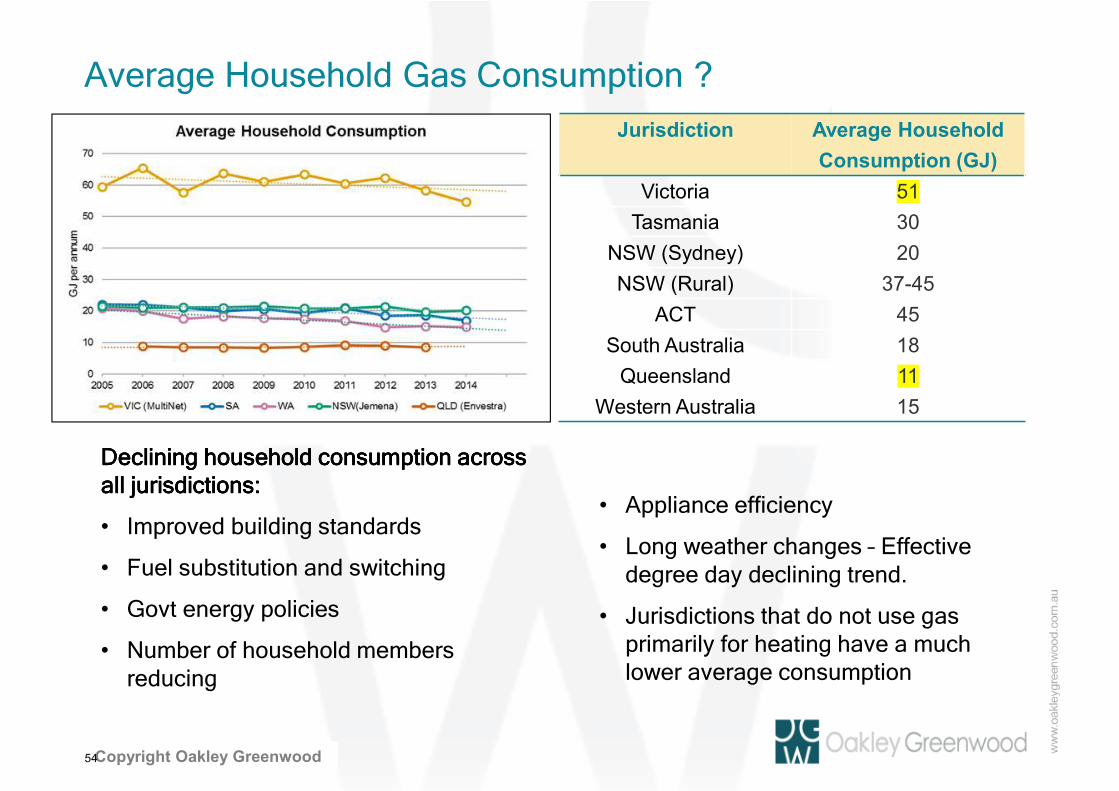
Average Household Gas Consumption ?
54
Declining household consumption across Declining household consumption across Declining household consumption across Declining household consumption across all jurisdictions: all jurisdictions: all jurisdictions: all jurisdictions:
• Improved building standards
• Fuel substitution and switching
• Govt energy policies
• Number of household members reducing
Jurisdiction Average Household
Consumption (GJ)
Victoria 51
Tasmania 30
NSW (Sydney) 20
NSW (Rural) 37-45
ACT 45
South Australia 18
Queensland 11
Western Australia 15
• Appliance efficiency
• Long weather changes – Effective degree day declining trend.
• Jurisdictions that do not use gas primarily for heating have a much lower average consumption
Private and ConfidentialCopyright Oakley Greenwood
Some key points – distribution cost analysis
• Graph highlights the economies of scale issues that face a number of the jurisdictions with regard to gas networks.
• As distribution density increases (e.g. Victoria) the overall distribution charge on an energy per unit charge decreases.
• Distribution business seem to be restructuring tariffs –fixed and declining block – defensive –and some Ramsey pricing to reduce switching
55
Allgas
AGN - Qld
JGN
ActewAGL
AusNetMultinet
AGN - Vic
AGN - SA
Tas Gas
0.00
5.00
10.00
15.00
20.00
25.00
30.00
35.00
40.00
45.00
0.0 0.5 1.0 1.5 2.0 2.5 3.0 3.5 4.0 4.5
$/G
J N
etw
ork
Ch
arg
es
Gas Distribution Energy Density (GJ/m network)
Distribution Network Benchmark 2013/2014
Private and Confidential
AEMC Roadmap – Wholesale gas trading markets?
56
Will the wholesale gas Will the wholesale gas Will the wholesale gas Will the wholesale gas market still essentially market still essentially market still essentially market still essentially
remain a biremain a biremain a biremain a bi----lateral lateral lateral lateral market?market?market?market?
Private and ConfidentialCopyright Oakley Greenwood
Gas market reform?
57
Private and ConfidentialCopyright Oakley Greenwood
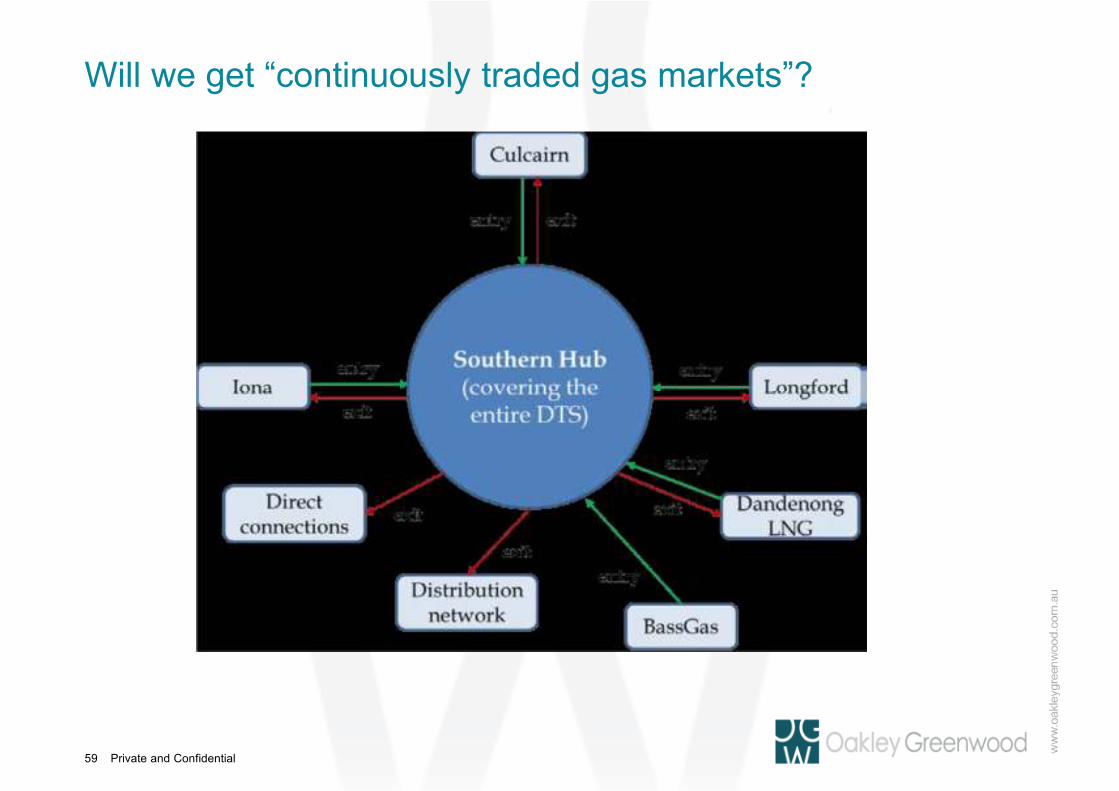
Will we get “continuously traded gas markets”?
58
Energy Council Reform Measure
2a. Northern Hub
Establish the Northern Hub at Wallumbilla, with existing physical trading limitations addressed in the first instance through implementation of Optional Hub Services.
Lead: Australian Energy Market Operator (AEMO)
Timeframe: Optional Hub Services model to be implemented in March 2017.
Approach: No changes to current process for implementation of Optional Hub Services.
2b. Southern Hub In-principle support for establishing the Southern Hub by transitioning the existing DWGM design to the proposed continuous exchange-based trading model, supported by a system of firm capacity rights.
The implementation of this reform will be subject to the final report of the AEMC Review of the Victorian Declared Wholesale Gas Market.
Lead: Gas Market Reform Group
Timeframe: The Gas Market Reform Group Chair to provide Ministers with an implementation plan following the publication of the AEMC’s final report.
In principle support of simplifying STTM hubs to balancing mechanisms following the development of the Northern and Southern hubs and pipeline capacity trading.
Lead: Gas Market Reform Group
Timeframe: To be considered by the AEMC's biennial report (Reform Measure 13) once the reform measures relating to the Northern and Southern hubs and to pipeline capacity trading have been implemented.
Approach: Potential changes to the National Gas Law (NGL), National Gas Regulations and National Gas Rules (NGR), procedure changes and transitional measures.
Private and Confidential
Will we get “continuously traded gas markets”?
59
Private and ConfidentialCopyright Oakley Greenwood
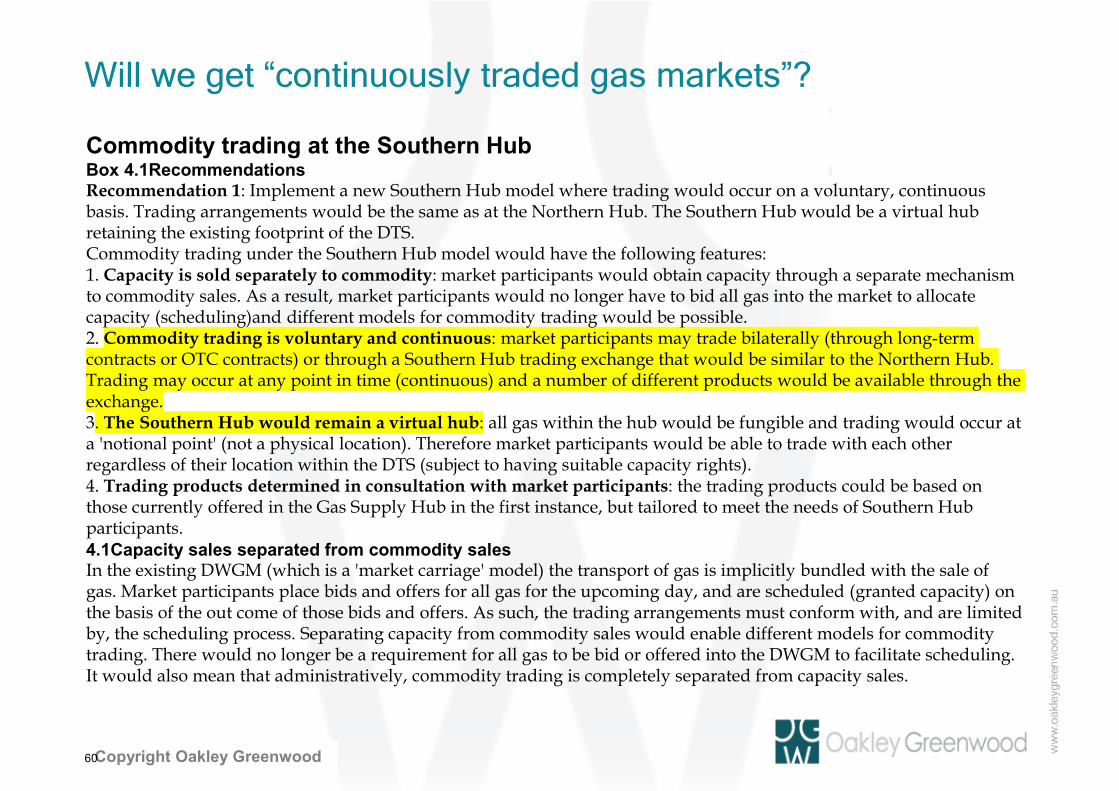
Will we get “continuously traded gas markets”?
60
Commodity trading at the Southern HubBox 4.1RecommendationsRecommendation 1: Implement a new Southern Hub model where trading would occur on a voluntary, continuous basis. Trading arrangements would be the same as at the Northern Hub. The Southern Hub would be a virtual hub retaining the existing footprint of the DTS.Commodity trading under the Southern Hub model would have the following features:1. Capacity is sold separately to commodity: market participants would obtain capacity through a separate mechanism to commodity sales. As a result, market participants would no longer have to bid all gas into the market to allocate capacity (scheduling)and different models for commodity trading would be possible.2. Commodity trading is voluntary and continuous: market participants may trade bilaterally (through long-term contracts or OTC contracts) or through a Southern Hub trading exchange that would be similar to the Northern Hub. Trading may occur at any point in time (continuous) and a number of different products would be available through the exchange.3. The Southern Hub would remain a virtual hub: all gas within the hub would be fungible and trading would occur at a 'notional point' (not a physical location). Therefore market participants would be able to trade with each other regardless of their location within the DTS (subject to having suitable capacity rights).4. Trading products determined in consultation with market participants: the trading products could be based on those currently offered in the Gas Supply Hub in the first instance, but tailored to meet the needs of Southern Hub participants.4.1Capacity sales separated from commodity salesIn the existing DWGM (which is a 'market carriage' model) the transport of gas is implicitly bundled with the sale of gas. Market participants place bids and offers for all gas for the upcoming day, and are scheduled (granted capacity) on the basis of the out come of those bids and offers. As such, the trading arrangements must conform with, and are limited by, the scheduling process. Separating capacity from commodity sales would enable different models for commodity trading. There would no longer be a requirement for all gas to be bid or offered into the DWGM to facilitate scheduling. It would also mean that administratively, commodity trading is completely separated from capacity sales.
Private and ConfidentialCopyright Oakley Greenwood
Will we get “continuously traded gas markets”?
61
The trading products currently available through the Gas Supply Hub (northern hub) are:• monthly;• weekly;• daily;• day-ahead; and• balance of day.These products typically require a uniform flow rate over the delivery period and a minimum parcel size of 1,000 GJ for each gas day in the delivery period (or 25 GJ/hour for the balance of day product). In addition, three physical spread products are available from Moomba to Wallumbilla. These are monthly, daily and day-ahead products.
Price discovery would occur via the exchange initially, in that prices struck for exchange traded products would be published (as is done on a stock exchange). The exchange would also publish a volume-weighted end of day price at the Southern Hub (as is currently provided for the GSH), which financial derivative products could reference.
Financially traded products typically require a standardised underlying physical product that is commonly traded to reference. This standardisation encourages transactional efficiency and the development of liquidity. The financial gas market is directly linked to the physical gas market and usually evolves from some form of standardised contract for the sale of physical gas.
The establishment of exchange-based trading allows for innovation in products offered and for standardised products to emerge (e.g. day-ahead products, monthly products and winter 2020 products) and market forces will determine the success of individual products – that is, products will be traded only to the extent that they are useful to participants. In well-established commodity markets, financial derivatives generally reference the price in the most liquid of these products.
Private and ConfidentialCopyright Oakley Greenwood
Will we get “continuously traded gas markets”?
62
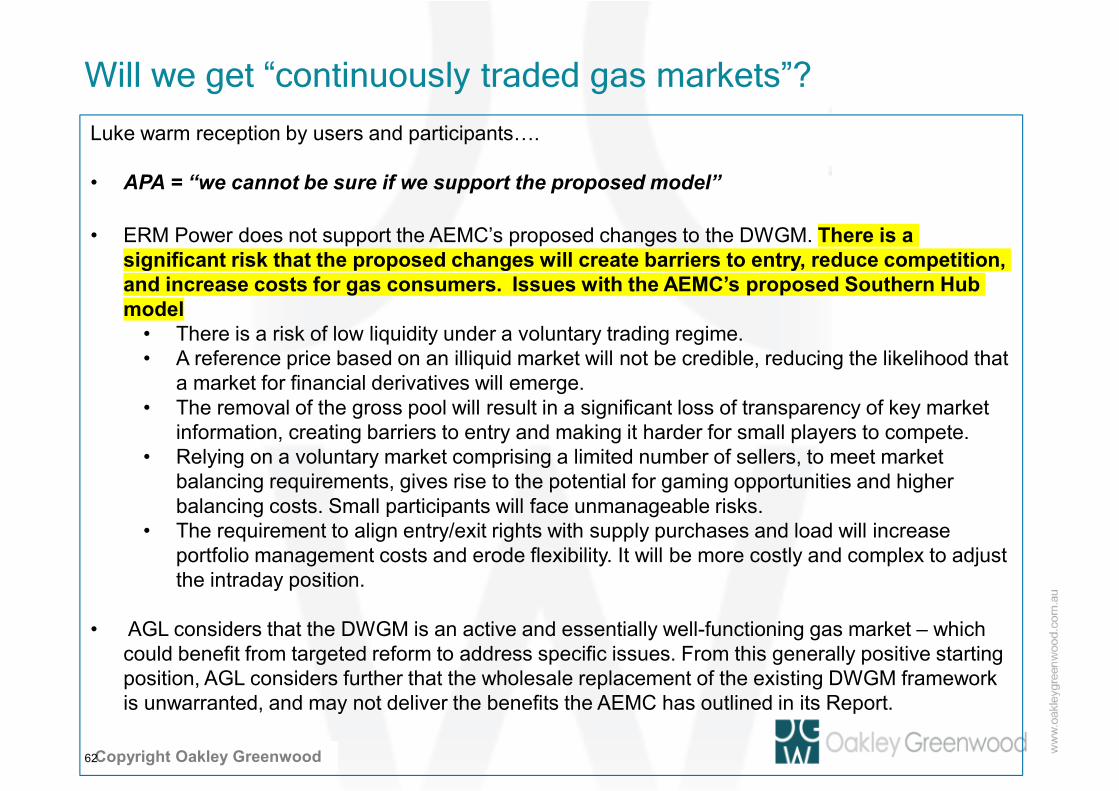
Luke warm reception by users and participants….
• APA = “we cannot be sure if we support the proposed model”
• ERM Power does not support the AEMC’s proposed changes to the DWGM. There is a significant risk that the proposed changes will create barriers to entry, reduce competition, and increase costs for gas consumers. Issues with the AEMC’s proposed Southern Hub model
• There is a risk of low liquidity under a voluntary trading regime. • A reference price based on an illiquid market will not be credible, reducing the likelihood that
a market for financial derivatives will emerge. • The removal of the gross pool will result in a significant loss of transparency of key market
information, creating barriers to entry and making it harder for small players to compete. • Relying on a voluntary market comprising a limited number of sellers, to meet market
balancing requirements, gives rise to the potential for gaming opportunities and higher balancing costs. Small participants will face unmanageable risks.
• The requirement to align entry/exit rights with supply purchases and load will increase portfolio management costs and erode flexibility. It will be more costly and complex to adjust the intraday position.
• AGL considers that the DWGM is an active and essentially well-functioning gas market – which could benefit from targeted reform to address specific issues. From this generally positive starting position, AGL considers further that the wholesale replacement of the existing DWGM framework is unwarranted, and may not deliver the benefits the AEMC has outlined in its Report.
Private and ConfidentialCopyright Oakley Greenwood
Will we get “continuously traded gas markets”?
63
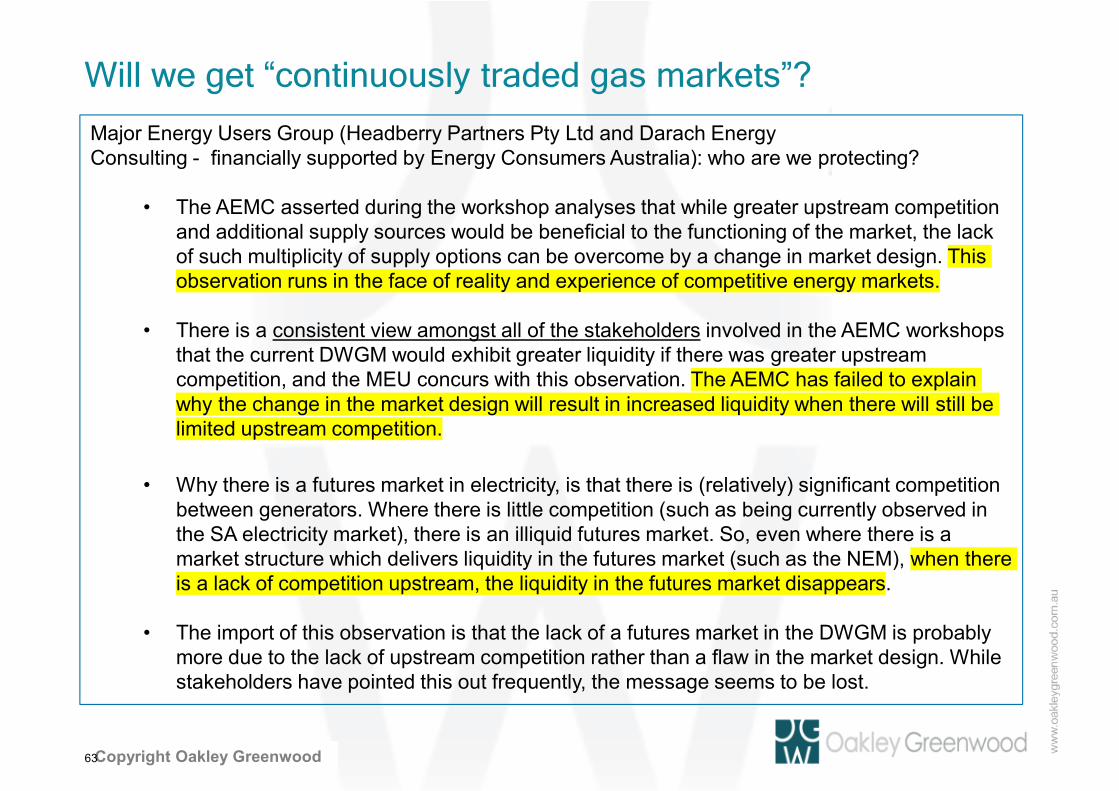
Major Energy Users Group (Headberry Partners Pty Ltd and Darach EnergyConsulting - financially supported by Energy Consumers Australia): who are we protecting?
• The AEMC asserted during the workshop analyses that while greater upstream competition and additional supply sources would be beneficial to the functioning of the market, the lack of such multiplicity of supply options can be overcome by a change in market design. This observation runs in the face of reality and experience of competitive energy markets.
• There is a consistent view amongst all of the stakeholders involved in the AEMC workshops that the current DWGM would exhibit greater liquidity if there was greater upstream competition, and the MEU concurs with this observation. The AEMC has failed to explain why the change in the market design will result in increased liquidity when there will still be limited upstream competition.
• Why there is a futures market in electricity, is that there is (relatively) significant competition between generators. Where there is little competition (such as being currently observed in the SA electricity market), there is an illiquid futures market. So, even where there is a market structure which delivers liquidity in the futures market (such as the NEM), when there is a lack of competition upstream, the liquidity in the futures market disappears.
• The import of this observation is that the lack of a futures market in the DWGM is probably more due to the lack of upstream competition rather than a flaw in the market design. While stakeholders have pointed this out frequently, the message seems to be lost.
Private and ConfidentialCopyright Oakley Greenwood
Vertigan on transmission
• “Getting the regulatory settings for gas transmission pipelines right is important to promote an efficient transportation sector with competitive prices and more efficient gas trading markets,“
• "In a tighter gas market, continued investment in pipelines and related services will be needed to provide flexibility and choice for consumers.”
• "Gas also has an important role to play in the transition to a lower carbon economy.”
• “More flexible and efficient pipeline services are an essential consideration in energy security planning and ensuring gas power generation is able to provide capacity when required to balance the intermittent nature of renewable electricity sources,"
• Vertigan has recommended a new era of transparency on the pricing and contract terms of pipeline access, a new framework for binding arbitration on access and pricing disputesand that the Gas Market Reform Group be charged with designing the new disclosure, transparency and arbitration frameworks with a deadline of mid-2017
64
Private and ConfidentialCopyright Oakley Greenwood
Jim SnowJim SnowJim SnowJim SnowExecutive DirectorExecutive DirectorExecutive DirectorExecutive Director
Adjunct Professor University of Adjunct Professor University of Adjunct Professor University of Adjunct Professor University of Queensland Energy Initiative Queensland Energy Initiative Queensland Energy Initiative Queensland Energy Initiative