Gas Processing Journal
Vol. 4, No.1 , 2016
http://gpj.ui.ac.ir
___________________________________________
* Corresponding Author. Authors’ Email Address: 1 Bahram Ghorbani ([email protected]), 2Mohammad-Hossein Hamedi ([email protected]),
3 Majid Amidpour ([email protected])
ISSN (Online): 2345-4172, ISSN (Print): 2322-3251 © 2016 University of Isfahan. All rights reserved
Exergoeconomic Evaluation of an Integrated Nitrogen Rejection
Unit with LNG and NGL Co-Production Processes Based on the
MFC and Absorbtion Refrigeration Systems
Bahram Ghorbani*1, Mohammad-Hossein Hamedi2, Majid Amidpour3 1,2 Mechanical Engineering Faculty, Energy Conversion Group, KNToosi University of
Technology, Tehran, Iran 3Mechanical Engineering Faculty, Energy System Group, KNToosi University of Technology,
Tehran, Iran
Article History Received: 21/08/2016 Revised: 09/09/2016 Accepted: 22/09/2016 Publish Online: 25/09/2016
Abstract
Natural gas is associated with nitrogen and heavy compounds. These heavy components in the
natural gas not only can feed downstream units, owing to the low temperature process, but may be
formed solid as well. Heavy components separation is a necessity and can they produce useful
products. All natural gases contain nitrogen which lower theirheating value. Removing nitrogen from
natural gas at a concentration of more than 4% is essential. Integration of the natural gas liquids
(NGL), liquefied natural gas (LNG) and nitrogen rejection unit processes is an effective procedure
which can reduce the required refrigeration. A new mixed fluid cascade natural gas liquefaction
process is assessed here through the exergy and exergoeconomic analysis methods. One of the vapor
compression cycles is replaced with a water-ammonia absorption refrigeration cycle. The results
include cost of exergy, exergoeconomic factor, exergy and exergy efficiency. Results of exergoeconomic
analysis indicates that the maximum exergoeconomic factor, 89.49%, is related to the HX8 in the
water-ammonia absorption refrigeration cycle and the minimum exergoeconomic factor, 0.0026%, is
related to the HX2 in the liquefaction cycle. In this process, the fourthcompressor has the highest
exergy destruction cost of (5750307$/hr) and HX8 in the absorption refrigeration cycle has the lowest
exergy destruction cost of (2.033 $/hr). Due to the high value of fuel cost in compressor, their exergy
destruction cost is much higher than other devices.
Keywords
LNG/NGL/NRU, MFC, Absorption Refrigeration, Exergoeconomic
1. Introduction
Natural gas contains heavy ingredients and
nitrogen. According to negative influence of
nitrogen on fuel heating value, it is necessary
to remove the nitrogen of more than 4%
concentration from natural gas streams.
Liquefied natural gas plants are increasing in
number because of the growing demand for
natural gas (Alabdulkarem, Mortazavi, Hwang,
Radermacher, & Rogers, 2011). Gas is widely
recognized as a clean and economical energy
source because of its low carbon intensity and
relatively low price in comparison with other
fossil fuel types (Wang, Khalilpour, & Abbas,
2014). The LNG facilities are equipped with an
intermediate pressure distillation column for
recovery ethane and heavier components from
the processed natural gas stream in a manner
where surges operational and capital costs
remain unchanged. (Ransbarger, 2006).Value
of the SPE changes from 0.2 to 0.6 kW/kg LNG
and at large scale liquefaction processes it
ranges from 0.4 to 0.25. However increasing
this value decreases the operating cost of the
plant, while the process configuration and
number of the equipment is another important
2 Gas Processing Journal
GPJ
factor which can affect the capital costs of the
plant significantly (Ghorbani, Hamedi, &
Amidpour, 2016; Ghorbani, Hamedi, Amidpour,
& Mehrpooya, 2016). Separation of Methane,
Ethane, Propane, and natural gas liquids
(NGL) from the natural gas is generally carried
out through one of the following alternativ
processes: i) external refrigeration (ER), ii)
turbo expansion TE), iii) JouleeThompson
expansion, and iv) absorption. In many
procedures, a combination of these processes is
applied to improve the energy efficiency or
obtain greater recoveries (Amidpour et al.,
2015; Ghorbani, Mafi, Shirmohammadi,
Hamedi, & Amidpour, 2014; Ghorbani, Salehi,
Ghaemmaleki, Amidpour, & Hamedi, 2012;
Shirmohammadi, Ghorbani, Hamedi, Hamedi,
& Romeo, 2015).
New methods in energy saving have led to the
development of analyses techniques based on
the second law of thermodynamics,
particularly, the concept of exergy. In
exergoeconomic analysis the quality of energy
(exergy) in allocating the production costs of a
process to its products is considered. A general
methodology for this kind of analysis is
presented by Electric Power Research Institute
(Bejan & Tsatsaronis, 1996; Fazelpour, 2015),
known as the Total Revenue Requirement
method (Total Revenue Requirement method).
A systematic method based on a combination of
mathematical methods and thermodynamic
viewpoints are adopted to acquire optimal
design configuration through non-linear
programming techniques (Ghorbani, Mafi,
Amidpour, Nayenian, & Salehi, 2013;
Lashkajani, Ghorbani, Amidpour, & Hamedi,
2016; Mafi, Ghorbani, Salehi, Amidpour, &
Nayenian). A superstructure optimization is
applied for a separation system which includes
distillation column units, heat exchangers and
heat integration (Lashkajani et al., 2016). LNG
production technologies of compression cooling
cycles are applied for cooling. Compression
cooling cycles are widely applied in various
fields, especially in oil and gas industry and
there exist many studies regarding how to
enhance their return. Where theim proved
performance of vapor compression cooling
cycles are applied. In this field the operational
characteristics like pressure, flow rate cooling
and combined cooling are optimized through
studies run by (Ghorbani, Hamedi,
Shirmohammadi, Mehrpooya, & Hamedi, 2016;
Ghorbani, Ziabasharhagh, & Amidpour, 2014;
Salehi et al., 2012).
When the design and integration of the
processes take place in a simultaneous manner,
the number of required equipment and energy
consumption decrease (Ghorbani, Mafi, et al.,
2013; Ghorbani, Maleki, Salehi, Salehi, &
Amidpour, 2013; Ghorbani, Salehi, Amidpour,
& Hamedi, 2012; B Ghorbani, GR Salehi, H
Ghaemmaleki, et al., 2012; Khan & Lee, 2013;
Lashkajani, Ghorbani, Salehi, & Amidpour,
2013a, 2013b). In order to integrate these
units, Conoco Phillips, APCI and Ortloff
Company have introduced new plants. Some
smaller companies have addressed several
patented design limitations in this respect. In
design plants based on ConocoPhillips cascade
cycle], for better separation in the column is
used lean liquid ethane in recycle. Pre-cooling
cycle runs through by pure propane or a
mixture of propane and ethane . The APCI
Company has introduced a method for the
production of these two products where the
kettle type heat exchanger, absorption tower,
and separation and external refrigeration cycle
are applied (Roberts & Brostow, 2005). Ortloff
Company has designed a process based on
recovery NGL process liquefied natural gas
(GSP). Lee et al designed and patented an
integrated process for the production of LNG
and NGL. This process used two columns that
work in different pressure in the NGL recovery.
[After initial cooling gas enter into this section
and the liquid recycle, that must be rich from
heavy hydrocarbons, produce from condensing
of gas exited from second column or
liquefaction section. M.S. Khan et al. analyzed
a new process of KSMR system for the
simultaneous production of natural gas
condensate and NGL. Integrated nitrogen
rejection unit for producing LNG is considered
using dedicated reinjection circuit (Chen, Liu,
Krishnamurthy, Ott, & Roberts, 2015a). In
addition, the integrated nitrogen rejection
process for the production of LNG is carried out
through the intermediate feed gas separator
(Ott, Krishnamurthy, Chen, Liu, & Roberts,
2015) . Integrated nitrogen removal in LNG
production is assessed through the refrigerated
heat pump (Ott, Krishnamurthy, Chen, Liu, &
Roberts, 2015)..As an alternative approach to
improving energy return cycles of absorption
cooling units, LNG can be used as the cooling
agent. Taking advantage of the energy
dissipation properties of absorption cooling
cycles from different parts of the unit is
possible in this cycles (Ghorbani, Salehi,
Esnaashary, & Amidpour, (2012); Mafi,
Ghorbani, Amidpour, & Naynian, (2013);
Salarian, Ghorbani, Amidpour, & Salehi,
(2014)).
Ghorbani et al. developed two integrated NGL-
LNG with nitrogen rejection by C3MR and
MFC refrigeration cycle. This introduced cycle
indicates that, integration due to the reduced
in equipment and increase the efficiency.
Vol. 4, N0. 1, 2016 3
GPJ
In this paper, exergy and exergoeconomic
analyses are applied to recently alternatives
integrated processes for cogeneration of LNG,
NGL and NRU with reasonable energy
consumption and high ethane recovery. Exergy
efficiency and exergy destruction of the process
components are calculated. Next all of the
equipment are sized and cost of them are
calculated with a suitable cost function.
Mathematical modeling of the process is done
in order to finding the exergoeconomic factors.
Exergoeconomic variables, exergy destruction
cost, relative cost difference, exergoeconomic
factor are computed and thermoeconomic
analysis of the process is investigated and
discussed.
2. Process Description
2.1. Conceptual Design
The MFC process consists of three pure
refrigerants of methane, ethylene, and propane
with different boiling temperatures, . First, the
natural gas is cooled up to -25 ºC in the
propane cycle, next up to -86 ºC in the ethylene
cycle; finally, it is liquefied to -160 ºC in the
methane cycle. The MFC process is highly
efficient due to the low shaft power
consumption of the three MRC compressors. A
structure of integrated process consisting of
recycling natural gas liquids, natural gas
liquefaction, and nitrogen removal from an
absorption refrigeration cycle for precooling
and two refrigeration cycle, (multi-component
refrigerant) for cooling and liquefaction are
proposed.
The absorption refrigeration cycle replaced by
compression refrigeration cycle (cycle 400) in
the integrated process of LNG, NGL, and NRU
with the objective to reduce energy
consumption is shown in Fig. (1). Natural gas
feed enters at about 37 ºC and 63.09 bar with a
14000 kg.mol/h flow rate. The Liquid produced
through this process is categorized into three:
Natural gas liquids (1578.8 kgmole/h), liquefied
natural gas (11559.3 kg.mol/h) and Removing
nitrogen (620.7 kg.mol/h). A propane
refrigeration cycle is applied to supply both the
required cooling for NGL recovery and
precooling for the LNG process.
Figure 1. Cascade refrigeration (combined refrigerant and absorption refrigeration) integrated in the NGL-LNG-
NRU consumption structure.
4 Gas Processing Journal
GPJ
2.2. Basic Design The relation between different equipment of
the integrated process of natural gas liquids,
natural gas liquefaction, and denitrification is
shown in Fig. (2). How the alternative
absorption refrigeration system is replaced by
precooling compression cycle (Cycle 400) is
clearly shown in this figure. Inlet feed stream
at 37 C and 63.09 bar enters the multi-stream
heat exchangers HX1 and HX2 and is cooled up
to 8 C and -27 C,respectively. The next
outlet stream, 103, is cooled -41 C. A part of
the required cooling is provided by a three
stage propane refrigeration cycle. The outlet
gas from the NGL recovery unit, 102, is
channeled into the D3 separator. The required
heating for the tower is supplied using three
side streams; side1, side2 and side3 at
approximately 14.5 C ,6.8 C
and -7.4 C,
respectively. These streams exit the column
and enter the multi-stream heat exchangers.
Side1 enters the HX1 heat exchanger and exits
at 35 C. Side1R is named as the backflow and
is marked on the PFD. Side2 and side3 are
channeled into the HX2 and HX3 respectively
and exit the heat exchangers at 0 C and -20
C, respectively. The outlet streams from the
heat exchanger return to the column. De-
ethanizertop gas is channelled to HX4 through
V-5 expansion valve where its temperature
reaches -119 C . Next the stream is ready to
enter the nitrogen rejection unit. Stream 118
containing methane and nitrogen with a
standard volume of about 1.2% from bottom of
the column T200 as the liquid product enters
HX-3 from the bottom. Stream 128 is
channeled to D2 flash drum and the gas
product of this separator returns to the HX-4.
Line 123 is branched into two: branch one,
(88%), stream 126, enters HX4 multi-stream
heat exchanger and its temperature decreases
up to -132 C and turns to liquid. This cooled
liquid passes through an expansion valve
where its pressure and the temperature reach
up to about 25 bar and -131 C. Then it is
channeled to the top of the nitrogen removal
column as washing liquid. Stream 124,
containing 12% of gas output from D2, enters
HX3 as well and is cooled up to -75 C. Next
stream 125 is channeled to column. After
eliminating the ethane plus hydrocarbons and
nitrogen from the gas stream, it is channeled to
the liquefaction section. Stream 129 is
compressed up to 63 bar and enters the HX4
heat exchanger. This stream is first heated up
to -99 C when passing through HX4 and it is
then super-cooled by HX4 super-cooling heat
exchanger up to 63 bar and at -164 C and
eventually becomes the final product after
passing through V8 where the pressure is
reduced to atmospheric pressure, and enters
phase D1. The final product is named LNG
stream which exits from the separator as gas
stream containing a high percentage of
nitrogen in which is channeled back into the
unit. To meet the cooling requirements, pre-
cooling and liquefaction systems are carried out
by applying an absorption refrigeration cycle
for precooling and two refrigeration cycle
(multi-component refrigerant).
Figure 2. Schematic of block flow diagram of the first stage for typical NGL-LNG-NRU plants
Vol. 4, N0. 1, 2016 5
GPJ
Table 1. Thermodynamic data for configuration process of material streams
Stream
no.
Temperature
( C)
Pressure
(kPa)
Flow
(kg.mol/h)
Physical
exergy
(kW)
Chemical
exergy
(kW)
Total
exergy
(kW)
Feed 37 6309 14000 37575.23 6750765.02 6788340.25
101 8 6309 14000 37635.72 6750765.02 6788400.75
102 -27 6309 14000 38762.02 6750765.02 6789527.05
103 -27 6309 13211.4 37226.85 5173680.15 5210907.01
104 -27 6309 788.5 1356.56 1577263.47 1578620.03
105 -27 6309 6605.7 18613.42 2586840.07 2605453.50
106 -27 6309 6605.7 18613.42 2586840.07 2605453.50
107 -66.4 2600 6605.7 16204.49 2586840.07 2603044.57
108 -88 6309 6605.7 23688.3 2586840.07 2610528.37
109 -27 6309 236.5 406.96 473179.04 473586.01
110 -27 6309 551.9 949.59 1104084.43 1105034.02
111 -30.43 2550 551.9 798.15 1104084.43 1104882.58
112 -50 6309 236.5 471.42 473179.04 473650.46
113 -51.2 2500 236.5 408.39 473179.04 473587.43
114 -102.3 2500 6605.7 22948.07 2586840.07 2609788.15
115 -98.9 2500 12421.1 32367.89 2716170.75 2748538.64
116 -113.3 1379 12421.1 28589.66 2716170.75 2744760.42
117 -119 1379 12421.1 38532.65 2716170.75 2754703.41
118 -119.7 1400 15079.3 59524.15 3434793.95 3494318.11
119 -118 1400 15079.3 53951.44 3434793.95 3488745.40
120 -164.1 1358 10346.6 29198.37 14303.69 43502.07
121 -164.1 1358 9725.8 27446.47 13445.47 40891.95
122 -170 1358 9725.8 47793.23 13445.47 61238.70
123 -118 1400 3311.4 7746.42 718797.52 726543.94
124 -118 1400 411.6 962.88 89346.53 90309.41
125 -75 1400 411.6 827.83 89346.53 90174.37
126 -118 1400 2899.7 6783.54 629450.99 636234.53
127 -132 1400 2899.7 12115.22 629450.99 641566.21
128 -131.9 1367 2899.7 12113.03 629450.99 641564.02
129 -118 1400 11772.5 46117.20 2717083.49 2763200.69
130 -99 1400 11772.5 25529.79 2717083.49 2742613.28
131 7.2 6300 11772.5 32531.14 2717083.49 2749614.63
132 -85.2 6300 11772.5 41428.45 2717083.49 2758511.94
133 -164 6300 11772.5 58282.65 2717083.49 2775366.14
134 -164.1 101.3 11772.5 56447.91 2717083.49 2773531.41
135 -164.1 101.3 213.2 214.93 39745.98 39960.92
136 -164.1 1358 620.7 1751.90 858.22 2610.12
6 Gas Processing Journal
GPJ
(Continuation)
Stream
no.
Temperature
( C)
Pressure
(bar)
Flow
(kg.mol/h)
Physical
exergy
(kW)
Chemical
exergy
(kW)
Total
exergy
(kW)
137 -30 1358 620.7 1137.18 858.22 1995.40
200 35 2790 18500 39355.95 7744424.76 7783780.71
201 3 2790 18500 40714.69 7744424.76 7785139.45
202 -31 2790 18500 45921.58 7744424.76 7790346.34
203 -85 2790 18500 54625.4 7744424.76 7799050.16
204 -86.6 600 18500 53681.77 7744424.76 7798106.53
205 -32.8 600 18500 24984.58 7744424.76 7769409.34
206 -27 600 18500 23502.11 7744424.76 7767926.87
207 30 1500 18500 32866.37 7744424.76 7777291.14
208 35 1500 18500 32903.43 7744424.76 7777328.20
209 77.9 2790 18500 40728.29 7744424.76 7785153.05
300 35 2790 18500 39355.95 7744424.76 7783780.71
301 8 2900 37000 83669.08 8303601.04 8387270.13
302 -29 2900 37000 86445.10 8303601.04 8390046.15
303 -50 2900 37000 93194.73 8303601.04 8396795.78
304 -173 2900 37000 190776.71 8303601.04 8494377.76
305 -177.5 330 37000 187617.77 8303601.04 8491218.82
306 -67.2 330 37000 36880.06 8303601.04 8340481.11
307 85.5 2500 37000 82416.34 8303601.04 8386017.39
308 35 2500 37000 80016.16 8303601.04 8383617.21
309 47.9 2900 37000 83823.71 8303601.04 8387424.75
500 31.9 120 153176.8 270.92 3843117.85 3843388.78
501 32 1300 153176.8 1437.09 3843117.85 3844554.95
502 122.8 1300 153176.8 51936.02 3843117.85 3895053.88
503 45.5 1300 17887.1 30286.07 1693908.89 1724194.96
504 146.2 1300 135278.1 61024.15 2154922.16 2215946.32
505 33.9 1300 17887.1 27219.46 1693908.89 1721128.36
506 33.4 1300 17887.1 27211.95 1693908.89 1721120.85
507 -29.5 120 17884.9 23516.64 1693706.62 1717223.26
508 -29.5 120 17884.9 9741.91 1693706.62 1703448.53
509 27.5 120 17884.9 2066 1693706.62 1695772.62
510 28.9 120 17829.7 2062.47 1688472.60 1690535.08
511 37 1300 135278.1 1697.18 2154922.16 2156619.35
LNG -164.1 101.3 11559.3 56172.09 2677398.39 2733570.48
NGL 27.4 2500 1578.8 2168.70 1271730.56 1273899.27
Nitrogen -80 1358 620.7 1234.72 858.22 2092.94
Exside1 14.5 2500 4000 7498.65 2254297.09 2261795.74
Exside2 6.7 2500 4000 7917.59 2137273.77 2145191.36
Exside1R 35 2500 4000 7377.91 2254297.09 2261675
Exside2R 0 2500 4000 7980.68 2137273.77 2145254.45
Vol. 4, N0. 1, 2016 7
GPJ
3. Exergy Analysis
Exergy is the maximum available work
when some forms of energy are transferred
in a reverse manner to a reference system,
which is in thermodynamic equilibrium
with the surroundings, and is disable.
Exergy is a measure of distance of a
system from global equilibrium; with
respect to the state variables of
temperature, pressure, and composition of
the system approaching surroundings].
therefore, the reference state is named the
dead state. The total exergy of
multicomponent streams is the sum of its
three contributions: change due to mixing,
chemical exergy, and physical exergy. The
exergy of mixing results from the
isothermal and isobaric mixing of streams
at the actual process conditions. The
chemical exergy is the difference between
the process and reference components in
their environmental concentration,
temperature, and pressure in chemical
potentials. The physical exergy is the
maximum obtainable amount of shaft work
(electrical energy) when a stream is
brought from process conditions (T, P) to
an equilibrium at ambient temperature by
a reversible heat exchange. In general
practice the exergy analysis is based on
the overall thermodynamic efficiency, the
ratio of the lost work to the ideal work
required for separation. The overall exergy
efficiency for distillation is the product of
external and internal exergy efficiencies.
(B Ghorbani, GR Salehi, M Amidpour, et
al., 2012; B Ghorbani, GR Salehi, H
Ghaemmaleki, et al., 2012; Meratizaman,
Amidpour, Jazayeri, & Naghizadeh, 2010;
Morosuk & Tsatsaronis, 2008; Romero
Gómez, Romero Gómez, López-González, &
López-Ochoa, 2016; Sheikhi, Ghorbani,
Shirmohammadi, & Hamedi, 2014, 2015).
The exergy of the process material streams
is tabulated in Table (2). In this study FE ,
PE and DE , are defined as the fuel exergy
rate, the product exergy and the exergy
destruction rate, respectively.
The exergy balance over the kth
component is
k,Dk,Pk,F EEE (1)
where, FE ,
PE and DE are the exergy
rates of fuel, product and destruction,
respectively. and yk is defined as the
exergy destruction ratio:
tot,F
k,D
kE
Ey
(2)
The streams operating conditions and
exergy analysis of refrigeration cascade
structure are tabulated in Table2. The
definitions applied for calculation of exergy
efficiency of the process components and
the exergy efficiency of the process
components are tabulated in this table.
8 Gas Processing Journal
GPJ
Table2. Definitions for exergy efficiencies of the process components
Exergy
efficiency
(%)
Component
identifier
Exergy
efficiency (%)
Component
identifier
Components and exergy efficiency
expression
Heat Exchanger
[{∑
∑
}
{∑
∑
}
]
Cooler
∑ ∑
97.35
97.81
98.24
96.38
HX5
HX6
HX7
HX8
87.78
91.35
94.03
86.35
HX1
HX2
HX3
Hx4
-
-
67.33
96.87
C6
C7
Ex
Pump
78.24
76.68
72.61
74.97
78.54
C1
C2
C3
C4
C5
Compressor and Pump
∑ ∑
16.73
6.2
34.64
63.17
22.91
51.63
V7
V8
V9
V10
V11
V12
13.3
34.8
80.8
17.08
43.01
63.82
V1
V2
V3
V4
V5
V6
Expansion valve
∫
,
99.19
-
AC4
AC5
99.12
98.27
98.26
AC1
AC2
AC3
Air cooler
∑
57.39 T300
79.37
49.88
T100
T200
Column[38,39]
∑ ∑
s
irr
Cycle/process
57.96
Vol. 4, N0. 1, 2016 9
GPJ
4. Exergoeconomic Analysis
All the costs associated with a project,
including a minimum required return on
investment is calculated through this
method. Based on the estimated total
capital investment and assumptions made
in economical, financial, operating, and
market input parameters, the total
revenue requirement is calculated on a
year-by-year basis. Finally, the non-
uniform annual monetary values
associated with the investment, operating
(excluding fuel), maintenance, and the fuel
costs of the system subject to analysis are
levelized وthat is, they are converted into
an equivalent series of constant payments
(Fazelpour & Morosuk, 2014; B Ghorbani,
GR Salehi, M Amidpour, et al., 2012).
4.1. Economic Model
Total Revenue Requirement method is
applied in this study for economic analysis.
The detailed descriptions on the economic
model and its terms are presented in Table
3. Economic constants and assumptions
are tabulated in Table 3.
The levelized annual total revenue
requirement is calculated as follows
through the Capital Recovery Factor:
BL
1j
eff
j
L)i1(
TRRCRFTRR (3)
where, TRRj is the total revenue
requirement in jth year of system
operation, BL is economic life cycle of the
system (yr) and ieff is the average annual
rate of effective devaluation. Capital
recovery factor (CRF) is calculated as
follows:
1)i1(
)i1(iCRF
BL
eff
BL
effeff
(4)
TRRj is the sum of four annual terms:
minimum return on investment (ROI),
total capital recovery (TCR), operation and
maintenance costs (OMC) and fuel costs
(FC)(Fazelpour & Morosuk, 2014; Wang et
al., 2014; Yang, Wei, & Chengzhi, 2009).
More explanation about the economic
terms and analysis are found in:
jj
jjj
OMCFC
ROITCRTRR
(5)
where, FC0 is the fuel cost at the beginning
point, the year and calculated as follows:
τWcFC w0
(6)
where: τ = total annual time (in hours) that is
7300 h year-1
Cw = unit cost of fuel (0.071 $ kWh-1)
W = power (kW)
Cost of electricity during the jth year is
computed as follows: j
FC0j )r1(FCFC (7)
The constant escalation levelization factor
(CELF) for the fuel is obtained through:
CRF)k1(
)k1(kFC
CELFFCFC
FC
BL
FCFC0
0L
(8)
where:
iff
FCFC
i1
r1k
constantrFC
(9)
rFC is the average annual escalation rate of
fuel cost. The levelized annual operating
and maintenance costs OMCL are
calculated as follows:
CRF)k(
)k(kOMC
CELFOMCOMC
OMC
BL
OMCOMC
L
1
10
0
(10)
where,
iff
OMCOMC
i1
r1k
constantrOMC
(11)
rOMC is the annual escalation rate for the
operating and maintenance costs. The levelized
carrying charges CCL is calculated as follows:
LLLL OMCFCTRRCC (12)
Capital investment CI
kZ and operating and
maintenance costs OM
kZ of the total plant
10 Gas Processing Journal
GPJ
are gained based on the process
components purchased cost.
k
k
kLCI
kPEC
PEC
τ
CCZ
(13)
k
k
kLOM
kPEC
PEC
τ
OMCZ
(14)
where, τ and PECk are the total annual
hours of plant operation and the
purchased-equipment cost of the kth
component, respectively. Symbol kZ is the
cost rate associated with the capital
investment and operating and
maintenance costs:
k
k
kLL
OM
k
CI
kk
PEC
PEC
τ
OMCCC
ZZZ
(15)
Rate of levelized costs is calculated as
follows:
τ
FCC L
F (16)
The cost functions used for calculation of
the process equipment cost and the
purchased equipment and investment
costs are tabulated, respectively in Tables
4 and 5.
Table 3. Economic constants and assumptions.
Economic parameters Value
Average annual rate of the cost of money (ieff) 10%
Average nominal escalation rate for the operating
and maintenance cost (rOMC) 5%
Average nominal escalation rate for fuel (rFC) 5%
Plant economic life (book life) 25 years
Total annual operating hours of the system, at full
load 7300
Vol. 4, N0. 1, 2016 11
GPJ
Table 4. Equations regarding the cost of the process components
Component Purchased equipment cost functions
Compressor
CC=7.90(HP)0.62
CC= Cost of Compressor (k$)
Expander CEx = 0.378(HP)0.81
CEx = Cost of Expander (k$)
Heat exchanger CE=a(V)b+c
CE= Cost of Heat exchanger ($)
Pump
CP=fMfTCb
CP= Cost of Pump ($)
Cb=1.39exp[8.833-
0.6019(lnQ(H)0.5)+0.0519(lnQ(H)0.5)2], Q in gpm, H in ft
head
fM= Material Factor
fT=exp[b1+b2(lnQ(H)0.5)+b3(lnQ(H)0.5)2]
b1= 5.1029, b2= -1.2217, b3= 0.0771
Air cooler
CAC=1.218fmfPexp[a+blnQ+c(lnQ)2], Q in KSCFM
CAC= Cost of Air cooler (k$)
fm=Material Factor
fP=Pressure Factor
a=0.4692, b=0.1203, c=0.0931
Drum
CD=fmCb+Ca
CD= Cost of Drum ($)
Cb=1.218exp[9.1-0.2889(lnW)+0.04576(lnW)2],
5000<W<226000 lb shell weight
Ca=300D0.7396 L0.7066, 6<D<10, 12<L<20 ft
fm= Material Factor
Cooler
CC =1.218k(1+fd+fp)Q0.86 , 20<Q<200 M BTU/hr CC=
Cost of cooler ($)
fm=Design Type
fP=Design Pressure (psi)
a=0.4692, b=0.1203, c=0.0931
Absorber
Cb=1.128exp(6.629+0.1826 (logW)+0.02297*(logW) 2)
Cp1=300 (D0.7395) (L0.7068)
C1=1.218 [(1.7Cb+23.9V1+Cp1) ]
C2=Cost of installed manholes, trays and nozzles
C3= Cost of Cooler
C4= Cost of Heater
CAb = C1+C2+C3+C4
CAb= Cost of Drum ($)
12 Gas Processing Journal
GPJ
Table 5. Purchased equipment and investment costs for configuration process components
Equipment PEC (×103 $) ZCI ($/hr) ZOM ($/hr) Z ($/hr)
HX1 1969 109.3 2.2986 111.6
HX2 2564 142.3 2.9923 145.3
HX3 1004 55.7 1.1721 56.9
HX4 1349 74.9 1.5750 76.5
HX5 306 17 0.3568 17.3
HX6 306 17 0.3568 17.3
HX7 306 17 0.3568 17.3
HX8 306 17 0.3568 17.3
C1 49835 2766.4 58.1660 2824.6
C2 15580 864.8 18.1843 883
C3 23511 1305.1 27.4417 1332.6
C4 27603 1532.2 32.2169 1564.5
C5 23993 1331.9 28.0039 1359.9
Ex 7786 432.2 9.0880 441.3
Pump1 2790 154.9 3.2559 158.1
AC1 18597 1032.3 21.7061 1054.1
AC2 18597 1032.3 21.7061 1054.1
AC3 6159 341.9 7.1883 349.1
AC4 9079 504 10.5964 514.6
D1 4294 238.4 5.0122 243.4
D2 5603 311 6.5399 317.6
D3 4294 238.4 5.0122 243.4
T100 4554 252.8 5.3151 258.1
T200 3160 175.4 3.6887 179.1
T300 2403 133.4 2.8051 136.2
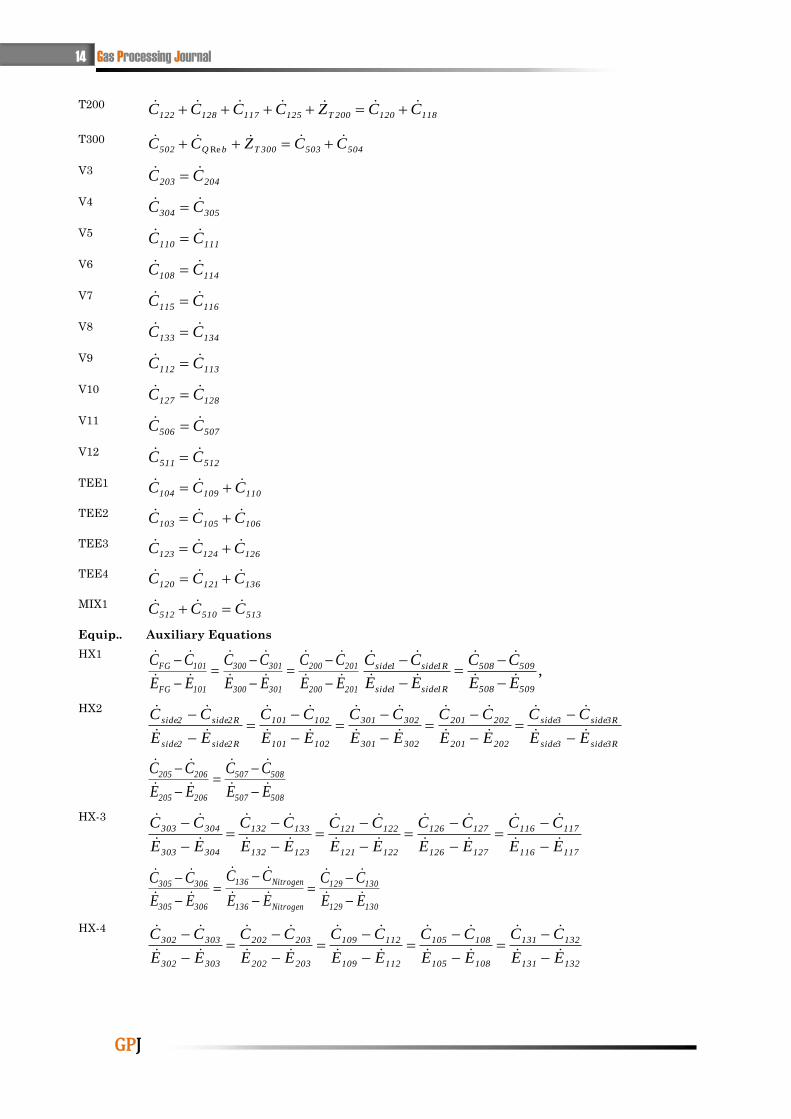
4.2. Cost Balance Equations
The exergy cost of the streams is gained by
writing the cost balance over each component.
The cost balance terms are: outlet streams
cost, inlet streams cost, primary investment
cost, CI
kZ , and the operation and maintenance
OM
kZ costs.
o
koo
OM
k
CL
k
i
kii )E(cZZ)E(c
(17)
For the components which have more than one
output, some auxiliary equations are written ;
therefore, based on the cost balances and
auxiliary equations for all components a set of
linear equations is yield as follows:
kkk ZcE (18)
where, kE , kc and kZ are exergy rate
matrix, costs per unit of exergy vector and
coefficient vector forkZ , respectively. The cost
balance and auxiliary equations for the process
components are tabulated in table 6.
Vol. 4, N0. 1, 2016 13
GPJ
Table 6. Main equations and auxiliary equations for the process components
Equip. Equation Main
HX1 R1side5092013011011HX5081side200300FG CCCCCZCCCCC
HX2
50820632202302102
250720532201301101
CCCCCCC
ZCCCCCCC
RsideRside
HXsideside
HX-3
137119125132108112205203303
3HXNitrogen118124131105109204202302
CCCCCCCCC
ZCCCCCCCCC
HX-4
130Nitrogen117127122133206304
4HX129136116126121132305303
CCCCCCCC
ZCCCCCCCC
HX5 5025115HX504501 CCZCC
HX6 5155056HX514503 CCZCC
HX7 5105067HX509505 CCZCC
HX8 5175008HX516513 CCZCC
C1 3071C1W306 CZCC
C2 3092C2W308 CZCC
C3 1313C3W130 CZCC
C4 2074C4W205 CZCC
C4 2095C5W208 CZCC
Ex 1078WEx106 CCZC
AC1 3001AC1W AC309 CZCC
AC2 3082AC2W AC307 CZCC
AC3 2083AC3W AC207 CZCC
AC4 2004AC4W AC209 CZCC
D1 LNG1351D134 CCZC
D2 1291232D119 CCZC
D3 1041031D102 CCZC
Pump 501Pump100W500 CZCC
T100
321115
100321113107111114
sidesidesideNGL
TRsideRsideRside
CCCCC
ZCCCCCCC
14 Gas Processing Journal
GPJ
T200 118120200T125117128122 CCZCCCC
T300 504503300TbQ502 CCZCC Re
V3 204203 CC
V4 305304 CC
V5 111110 CC
V6 114108 CC
V7 116115 CC
V8 134133 CC
V9 113112 CC
V10 128127 CC
V11 507506 CC
V12 512511 CC
TEE1 110109104 CCC
TEE2 106105103 CCC
TEE3 126124123 CCC
TEE4 136121120 CCC
MIX1 513510512 CCC
.Equip. Auxiliary Equations
HX1
,509508
509508
R1side1side
R1side1side
EE
CC
EE
CC
201200
201200
301300
301300
101FG
101FG
EE
CC
EE
CC
EE
CC
HX2
R3side3side
R3side3side
202201
202201
302301
302301
102101
102101
R2side2side
R2side2side
EE
CC
EE
CC
EE
CC
EE
CC
EE
CC
508507
508507
206205
206205
EE
CC
EE
CC
HX-3
117116
117116
127126
127126
122121
122121
123132
133132
304303
304303
EE
CC
EE
CC
EE
CC
EE
CC
EE
CC
130129
130129
Nitrogen136
Nitrogen136
306305
306305
EE
CC
EE
CC
EE
CC
HX-4
132131
132131
108105
108105
112109
112109
203202
203202
303302
303302
EE
CC
EE
CC
EE
CC
EE
CC
EE
CC
Vol. 4, N0. 1, 2016 15
GPJ
137Nitrogen
137Nitrogen
119118
119118
125124
125124
205204
205204
EE
CC
EE
CC
EE
CC
EE
CC
HX5
502
502
501
501
E
C
E
C
, 511
511
504
504
E
C
E
C
HX6
505
505
503
503
E
C
E
C
HX7
506
506
505
505
E
C
E
C
, 510
510
509
509
E
C
E
C
HX8
500
500
513
513
E
C
E
C
D1
LNG
LNG
135
135
E
C
E
C
D2
129
129
123
123
E
C
E
C
D3
104
104
103
103
E
C
E
C
T100
NGL
NGL
115
115
E
C
E
C
, 110
110
R3side
R3side
E
C
E
C
,
,101
101
R2side
R2side
E
C
E
C
111
111
R1side
R1side
E
C
E
C
T200
118
118
120
120
E
C
E
C
TEE1
110
110
109
109
E
C
E
C
TEE2
106
106
105
105
E
C
E
C
TEE3
126
126
124
124
E
C
E
C
TEE4
136
136
121
121
E
C
E
C
16 Gas Processing Journal
GPJ
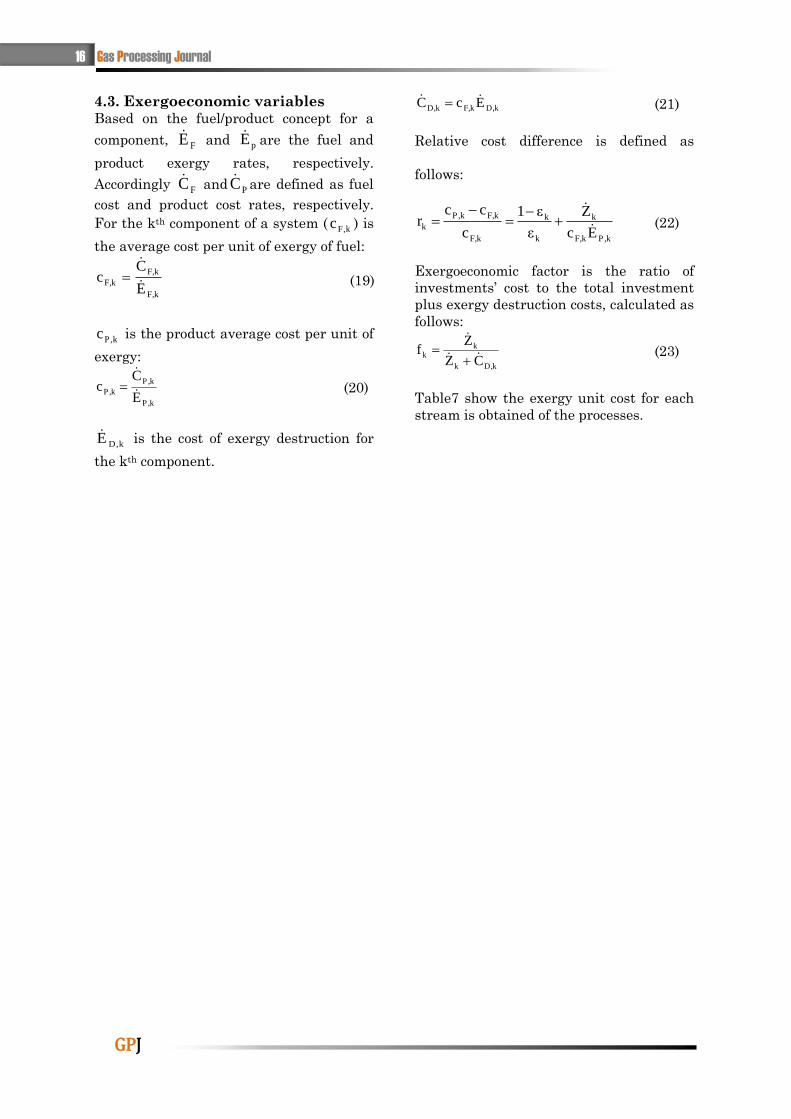
4.3. Exergoeconomic variables Based on the fuel/product concept for a
component, FE and pE are the fuel and
product exergy rates, respectively.
Accordingly FC and PC are defined as fuel
cost and product cost rates, respectively.
For the kth component of a system ( k,Fc ) is
the average cost per unit of exergy of fuel:
F,k
F,k
F,kE
Cc
(19)
k,Pc is the product average cost per unit of
exergy:
P,k
P ,k
P ,kE
Cc
(20)
k,DE is the cost of exergy destruction for
the kth component.
D,kF,kD,k EcC (21)
Relative cost difference is defined as
follows:
P,kF,k
k
k
k
F,k
F,kP,k
kEc
Z
ε
ε1
c
ccr
(22)
Exergoeconomic factor is the ratio of
investments’ cost to the total investment
plus exergy destruction costs, calculated as
follows:
D,kk
kk
CZ
Zf
(23)
Table7 show the exergy unit cost for each
stream is obtained of the processes.
Vol. 4, N0. 1, 2016 17
GPJ
Table 7. Unit exergy cost of configuration process streams
Stream
no.
hr
$C
Gj
$c Stream
no.
hr
$C
Gj
$c
Feed 59618 2.439 137 8500 131.15
101 10720 2.438 200 5770400 205.92
102 59490 2.433 201 5529700 197.30
103 45470 2.423 202 5854300 208.743
104 13780 2.423 203 5897700 210.059
105 22740 2.423 204 5897700 210.084
106 22740 2.423 205 5774500 206.452
107 22310 2.381 206 22300 0.797
108 48090 5.116 207 5772800 206.182
109 9640 5.655 208 5772400 206.169
110 22500 5.655 209 5770900 205.909
111 22500 5.656 300 5770400 205.927
112 4450 2.612 301 6474400 214.426
113 4450 2.612 302 6301400 208.626
114 48090 5.118 303 6267700 207.342
115 184960 18.692 304 5797300 189.578
116 184960 18.718 305 5797300 189.649
117 137030 13.817 306 6439000 214.447
118 38110 3.029 307 6442400 213.397
119 61910 4.929 308 6443500 213.493
120 185810 1186.453 309 6444400 213.427
121 174660 1186.453 500 6900 0.497
122 272740 1237.140 501 7100 0.509
123 12960 4.953 502 7100 0.509
124 1610 4.953 503 5700 0.917
125 2190 6.737 504 1300 0.167
126 11350 4.953 505 5700 0.917
127 14360 6.215 506 5700 0.917
128 14360 6.215 507 5700 0.919
129 49270 4.953 508 5600 0.919
130 137210 13.896 509 5600 0.919
131 138650 14.006 510 5600 0.919
132 94200 9.485 511 1300 0.167
133 139350 13.947 LNG 137500 13.971
134 139350 13.956 NGL 221500 48.292
135 2010 13.971 Nitrogen 8500 186.45
136 11150 186.453 Exside1 63500 7.793
18 Gas Processing Journal
GPJ
5. Results and Discussion
5.1. Exergy analysis
The highest rates for exergy destruction occurs
in the Modified MFC, in AC3 by 16.9%, in V11
by amount of 16.52% and in AC2 by of 13.23%,
respectively, Table 8. The least amount of
exergy destruction in the Modified MFC
structure occurs at 0.00001% in V10, 0.00002%
in HX7, and 0.00031% in V5 rates, respectively.
the Modified MFC structure exergetic efficiency
of expansion valves are less than in comparison
with the other equipment, while their
irreversibilities are low, Fig. (2). This fact
indicates that the equipment performance in
energy consumption must be analyzed in terms
of irreversibility and exergy efficiency. The
structure of Modified MFC exchanger HX7 with
efficiency of 98.24% has the most exergetic
efficiency and HX4 with efficiency of 86.35%
has the lowest exergetic efficiency. The
contribution of each heat exchanger in the total
exergy losses is shown in a pie chart Fig. (3),
wherethe most exergy loss occurs in the heat
exchangers HX4 and HX5 which are
responsible for more than 39.23% of the total
exergy loss among the heat exchangers.Among
the heat exchangers HX4 by 21784.68 kW has
the highest Exergy loss and HX7 with 4.6 kW
has the least amount of exergy loss.
Table 8. Results of exergy and exergoeconomic analysis of the process
Component )kW(ED
hr
$kCF
hr
$kCP
hr
$CD %YD
%r %f
hr
$ Z
hr
$CD
HX1 6223.92 17813.13 12066.5 520652.1 3.07 4.1 0.021 520763.7
HX2 5870.51 18272.64 12282.7 5530426 2.89 31.03 0.0188 5530571
HX3 5012.40 12590.52 18159.22 113427.4 2.47 0.6 0.0538 113484.3
HX4 21784.68 8.439625 12945.43 354910.9 10.75 2.9 0.0165 354987.4
HX5 8828.03 5.695625 8.383281 56.34397 4.35 5.2 23.51 73.64397
HX6 2227.6 11.29995 5.685495 10.13009 1.09 9.02 63.1 27.43009
HX7 4.6 6.88119 11.28258 17.36552 0.002 15.3 49.94 34.66552
HX8 5579.3 6442.407 6.879156 2.033333 2.755 8.02 89.49 19.33333
C1 12661.34 6444.398 6439.582 2824.555 6.25 0.1 50.91 5649.155
C2 1157.33 138.6452 6443.515 883.0313 0.57 9.4 49.99 1766.031
C3 2640.49 5772.753 137.3126 1332.575 1.3 8.6 50.19 2665.175
C4 3124.97 5770.937 22.44673 5750307 1.54 99.6 0.1586 5751872
C5 2137.56 22.73564 5772.512 1575.062 1.05 54.7 46.33 2934.962
Ex 786.9 7.050264 22.32937 406.2791 0.38 17.5 52.066 847.5791
Pump1 38 6447.223 6.892157 158.1064 0.018 22.4 50.21 316.2064
AC1 283.72 6443.461 6444.398 2824.555 0.14 40.42 27.17 3878.655
AC2 26797.68 5772.754 6442.407 1054.054 13.23 29.5 49.99 2108.154
AC3 34241.78 5770.422 5772.404 349.5285 16.9 43.5 49.96 698.6285
AC4 1438.15 488.0531 5770.937 515.181 0.71 27.3 49.97 1029.781
T100 37.63 426.3132 400.0469 88006.22 1.733 17.01 0.292 88264.32
T200 3511.14 17813.13 223.9185 202394.7 4.629 49.92 0.088 202573.8
T300 9374.73 18272.64 12066.5 520652.1 1.823 49.03 0.067 520788.3
Vol. 4, N0. 1, 2016 19
GPJ
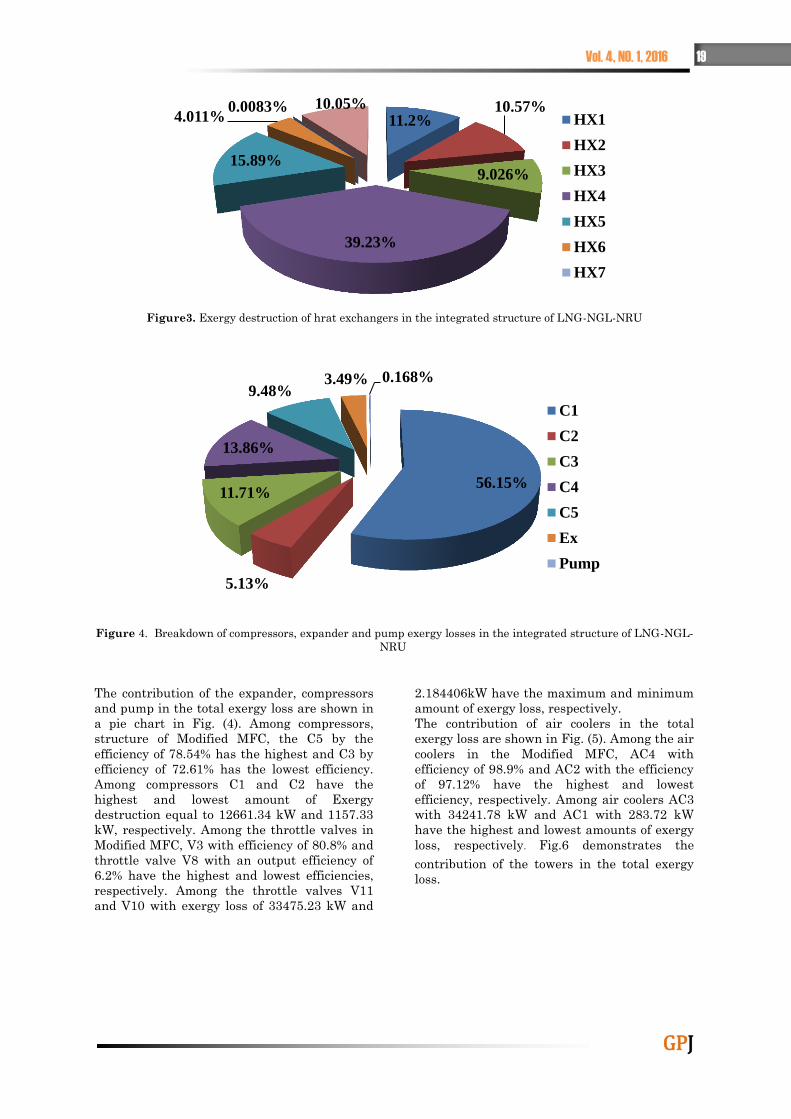
Figure3. Exergy destruction of hrat exchangers in the integrated structure of LNG-NGL-NRU
Figure 4. Breakdown of compressors, expander and pump exergy losses in the integrated structure of LNG-NGL-
NRU
The contribution of the expander, compressors
and pump in the total exergy loss are shown in
a pie chart in Fig. (4). Among compressors,
structure of Modified MFC, the C5 by the
efficiency of 78.54% has the highest and C3 by
efficiency of 72.61% has the lowest efficiency.
Among compressors C1 and C2 have the
highest and lowest amount of Exergy
destruction equal to 12661.34 kW and 1157.33
kW, respectively. Among the throttle valves in
Modified MFC, V3 with efficiency of 80.8% and
throttle valve V8 with an output efficiency of
6.2% have the highest and lowest efficiencies,
respectively. Among the throttle valves V11
and V10 with exergy loss of 33475.23 kW and
2.184406kW have the maximum and minimum
amount of exergy loss, respectively.
The contribution of air coolers in the total
exergy loss are shown in Fig. (5). Among the air
coolers in the Modified MFC, AC4 with
efficiency of 98.9% and AC2 with the efficiency
of 97.12% have the highest and lowest
efficiency, respectively. Among air coolers AC3
with 34241.78 kW and AC1 with 283.72 kW
have the highest and lowest amounts of exergy
loss, respectively. Fig.6 demonstrates the
contribution of the towers in the total exergy
loss.
11.2% 10.57%
9.026%
39.23%
15.89%
4.011% 0.0083% 10.05%
HX1
HX2
HX3
HX4
HX5
HX6
HX7
56.15%
5.13%
11.71%
13.86%
9.48% 3.49% 0.168%
C1
C2
C3
C4
C5
Ex
Pump
20 Gas Processing Journal
GPJ
Figure 5. Breakdown of air coolers exergy losses in the integrated structure of LNG-NGL-NRU
Figure 6. Breakdown of towers’ exergy losses in the integrated structure of LNG-NGL-NRU
5.2. Exergoeconomic analysis In TRR method, the capital cost of the system
is estimated first. Next, some economical
techniques are applied to calculate the revenue
requirement of the system in $/h and then, the
cost balance equations are written to calculate
the unit cost of exergy for each stream. The
exergoeconomic factor is defined and comments
are made on the balance between the capital
investment and operating costs of the system
inflicted by the exergy loss which have to be
compensated by more fuel consumption
(Ghorbani et al (2016))
There exists a distinct algorithm able to obtain
the abovementioned results, where:
1- All the components are put in descending
order based on their importance, known from
the magnitude of the sum
hr
$ Z
hr
$CD
,hence, the manner in modeling components
based on their importance. C4 column with
5751872
hr
$ has the greatest value.
Accordingly, to improve performance , the
components with high value of cost should be
considered.
2- The exergoeconomic factor is applied in
finding the prominent factor of the cost
infliction as follows:
a) if the value of f is large, we should check
whether it is economically justified to decrease
the capital cost of the equipments, because it is
assumed that the capital cost is so high that it
has lost its economical justification. The
exergoeconomic factor(s) of the process
components are illustrated, where, HX8 has
the greatest value of 89.49%.
b) if f is small, attempt should be made to
increase the efficiency even if it yields higher
capital cost, since it is assumed that low
efficiency of the system inflicts a high
expenditure on the system.
0.45%
42.69%
54.55%
2.29%
AC1
AC2
AC3
AC4
0.29%
27.16%
72.54%
T100
T200
T300
Vol. 4, N0. 1, 2016 21
GPJ
Table 9. Components, based on their f values
Component f%
HX8 89.49
HX6 63.1
Ex 52.066
C1 50.91
Pump1 50.21
C3 50.19
AC2 49.99
AC4 49.97
AC3 49.96
T100 0.292
T200 0.088
T300 0.067
HX3 0.050
HX4 0.021
HX1 0.021
HX2 0.0026
6. Sensitivity Analyses
In order to choose the appropriate decision
variables of the system it is necessary to
capture determine the behavior of the objective
function with respect to decision variables.
Since much of the electrical energy
consumption of the plant the compressors,
optimizing and reducing their exergy loss will
lead to a more economical approach of the
entire system.
The cost of exergy loss and exergoeconomic
factor of C4, HX2, HX3 and HX3 versus
pressure ratio of compressor C4, respectively
are shown in Figs. (7 and 10). Cost of exergy
destruction of of C4, HX2, HX3 and HX3 is
subject to pressure ratio; while, the decrease in
C4, HX2, HX3 and HX3 exergoeconomic factors
is subject pressure ratio. The C4 exergy
destruction rate increases with a higher rate
compared to the other components because
with an increase in the C4 pressure ratio its
power increases directly and the cost of exergy
destruction increases at a higher rate. The cost
of exergy loss and exergoeconomic factor of C1,
AC2 and HX4versus pressure ratio of
compressor C1, are shown in Figs. (11 and 12),
respectively. The cost of exergy destruction of
C1 decreases and cost of exergy destruction of
AC2 and HX4 increases as pressure drops. The
exergoeconomic factor of AC2 and HX4
decrease while the exergoeconomic factor of C1
increases with pressure ratio.
0.08
0.09
0.1
0.11
0.12
0.13
0.14
0.15
0.16
950000
1450000
1950000
2450000
2950000
3450000
2 3 4 5 6 7 8
Exer
goec
on
om
ic f
act
or
(%)
Cost
of
exer
gy d
estr
uct
ion
($/h
r)
Pressure ratio of compressore C4
Cost of exergy destruction ($/hr) Exergoeconomic factor (%)
22 Gas Processing Journal
GPJ
Figure 7. Variation of exergy loss and exergoeconomic factor of C4 with respect to compression ratio in C4
compressor
Figure 8. Variation of exergy destruction and exergoeconomic factor of HX2 with respect to compression ratio in
C4 compressor
Figure 9. Variation of exergy loss and exergoeconomic factor of HX3 with respect to compression ratio in C4
compressor
0.002
0.004
0.006
0.008
0.01
0.012
0.014
0.016
0.018
0.02
500000
1000000
1500000
2000000
2500000
3000000
2 3 4 5 6 7 8
Exer
goec
on
om
ic f
act
or
(%)
Cost
of
exer
gy d
estr
uct
ion
($/h
r)
Pressure ratio of compressore C4
Cost of exergy destruction ($/hr) Exergoeconomic factor (%)
0.03
0.035
0.04
0.045
0.05
0.055
110000
120000
130000
140000
150000
160000
170000
180000
190000
2 3 4 5 6 7 8
Exer
goec
on
om
ic f
act
or
(%)
Cost
of
exer
gy
des
tru
ctio
n (
$/h
r)
Pressure ratio of compressore C4
Cost of exergy destruction ($/hr)
Vol. 4, N0. 1, 2016 23
GPJ
Figure 10. Variation of exergy destruction and exergoeconomic factor of HX4 with respect to compression ratio in
C4 compressor
Figure11. Variation of exergy loss and exergoeconomic factor of C1 with respect to compression ratio in C1
compressor
0.015
0.0152
0.0154
0.0156
0.0158
0.016
0.0162
0.0164
0.0166
350000
355000
360000
365000
370000
375000
380000
385000
390000
395000
2 3 4 5 6 7 8
Exer
goec
on
om
ic f
act
or
(%)
Cost
of
exer
gy d
estr
uct
ion
($/h
r)
Pressure ratio of compressore C4
Cost of exergy destruction ($/hr) Exergoeconomic factor (%)
2600
2800
3000
3200
3400
3600
3800
47
47.5
48
48.5
49
49.5
50
50.5
51
6 8 10 12 14 16
Cost
of
exer
gy d
estr
uct
ion
($/h
r)
Exer
goec
on
om
ic f
act
or
(%)
Pressure ratio of compressore C1
Exergoeconomic factor (%) Cost of exergy destruction ($/hr)
24 Gas Processing Journal
GPJ
Figure 12. Variation of exergy destruction and exergoeconomic factor of AC2 with respect to compression ratio in
C1 compressor.
Figure 13. Variation of exergy loss and exergoeconomic factor of HX4 with respect to compression ratio in C1
compressor
The cost of exergy loss and exergoeconomic
factor of C4, HX2, HX3 and HX3 versus
pressure ratio of compressor C4, respectively
are shown in Figs. (7 and 10). Cost of exergy
destruction of of C4, HX2, HX3 and HX3 is
subject to pressure ratio; while, the decrease in
C4, HX2, HX3 and HX3 exergoeconomic factors
is subject pressure ratio. The C4 exergy
destruction rate increases with a higher rate
compared to the other components because
with an increase in the C4 pressure ratio its
power increases directly and the cost of exergy
destruction increases at a higher rate. The cost
of exergy loss and exergoeconomic factor of C1,
1052.5
1053
1053.5
1054
1054.5
1055
1055.5
49.5
50
50.5
51
51.5
52
52.5
53
6 8 10 12 14 16
Cost
of
exer
gy d
estr
uct
ion
($/h
r)
Exer
goec
on
om
ic f
act
or
(%)
Pressure ratio of compressore C1
Exergoeconomic factor (%) Cost of exergy destruction ($/hr)
320000
325000
330000
335000
340000
345000
350000
355000
360000
365000
0.015
0.018
0.021
0.024
0.027
0.03
0.033
0.036
0.039
6 8 10 12 14 16
Cost
of
exer
gy d
estr
uct
ion
($/h
r)
Exer
goec
on
om
ic f
act
or
(%)
Pressure ratio of compressore C1
Exergoeconomic factor (%) Cost of exergy destruction ($/hr)
Vol. 4, N0. 1, 2016 25
GPJ
AC2 and HX4versus pressure ratio of
compressor C1, are shown in Figs. (11 and 12),
respectively. The cost of exergy destruction of
C1 decreases and cost of exergy destruction of
AC2 and HX4 increases as pressure drops. The
exergoeconomic factor of AC2 and HX4
decrease while the exergoeconomic factor of C1
increases with pressure ratio.
7. Conclusions
In this study the exergoeconomic analysis of an
integrated NGL recovery, nitrogen rejection
and LNG process is assessed. Results obtained
from exergoeconomicanalysis are presented in
form of exergy destruction cost and
exergoeconomicfactor, as follows:
1. Most important elements in exergy loss cost
are related to the air coolers due to their high
fuel consumption.
2. Exergoeconomic factor in the heat
exchangers, expanders and compressors is
higherthan other elements, thus, in order to
reduce the total system cost,their cost must be
minimized.
3. Based on the exergoeconomic diagnosis the
cost of HX8 and HX6 is high, thus it is better to
replace them with loss expensive ones. while
C4 and HX2 have a high destruction cost. Here,
their efficiency improvement is a major
concern. . HX2 is in similar situation, that is, it
has small exergoeconomic factor. It is deduced
that the efficiency column should be increased
even it increases the initial investment cost.
HX-2 and HX-3 are at the second order of
magnitude for improvement.
Nomenclature BL book life
c unit exergy cost ($/kJ)
C exergy cost rate ($/h)
CC Carrying charge
CRF capital recovery factor
cw
Unit cost of the generated
electricity ($/kW)
e Specific flow exergy (kJ/kgmole)
Ė Exergy rate (kW)
Ex Exergy (kW)
F exergoeconomic factor (%)
FC Fuel cost ($/s)
I Irreversibility (kW)
ieff average annual discount rate (cost
of money)
j jth year of operation
m Number of cold streams
Flow rate (kgmole/s)
n Number of hot streams
OMC Operating and maintenance cost
PEC Purchase equipment cost ($)
Q Heat duty (kW)
r relative cost difference (%)
rFC
annual escalation rate for the fuel
cost
TCR Return on investment
rOM
Annual escalation rate for the
operating and maintenance cost
TCR Total capital recovery
TRR Total revenue requirement
W Work transfer rate (kW)
W Power (kW)
y Exergy destruction ratio
kZ
Total cost rate of kth component
including Capital investment and
operating-maintenance cost
CI
kZ Rate of capital investment of kth
component
OM
kZ Rate of operating and maintenance
cost of kth component
Greek Letters
τ annual operating hours (h)
ɛ Exergy efficiency
∆ Gradient
Subscripts
0 index for first year of operation
a Air
c Cold
D Destruction
F Fuel
h Hot
i Inlet
26 Gas Processing Journal
GPJ
k kth component
L levelized
o Outlet
P Production
Tot Total
Superscripts
CI Capital investment
OM Operating and maintenance
∆P Pressure component
∆T Thermal component
Abbreviations
AC Air cooler
APCI Air Products and Chemicals, Inc
C Compressor
D Flash drum
E Multi stream heat exchanger
LNG Liquefied Natural Gas
AB Absorption
MIX Mixer
MR Mixed Refrigerant
V Expansion valve
MFC Mixed Fluid Cascade
NGL Natural Gas Liquids
NRU Nitrogen Rejection Unit
References
Alabdulkarem, A., Mortazavi, A., Hwang, Y.,
Radermacher, R., & Rogers, P. (2011).
Optimization of propane pre-cooled mixed
refrigerant LNG plant. Applied Thermal
Engineering, 31(6), 1091-1098.
Amidpour, M., Hamedi, M., Mafi, M., Ghorbani,
B., Shirmohammadi, R., & Salimi, M.
(2015). Sensitivity analysis, economic
optimization, and configuration design of
mixed refrigerant cycles by NLP
techniques. Journal of Natural Gas
Science and Engineering, 24, 144-155.
Bejan, A., & Tsatsaronis, G. (1996). Thermal
design and optimization: John Wiley &
Sons.
Chen, F., Liu, Y., Krishnamurthy, G., Ott, C. M.,
& Roberts, M. J. (2015a). Integrated
Nitrogen Removal in the Production of
Liquefied Natural Gas Using Dedicated
Reinjection Circuit: US Patent
20,150,308,736.
Chen, F., Liu, Y., Krishnamurthy, G., Ott, C. M.,
& Roberts, M. J. (2015b). Integrated
Nitrogen Removal in the Production of
Liquefied Natural Gas Using
Intermediate Feed Gas Separation: US
Patent 20,150,308,737.
Fazelpour, F. (2015). Energetic and exergetic
analyses of carbon dioxide transcritical
refrigeration systems for hot climates.
Thermal Science, 19(3), 905-914.
Fazelpour, F., & Morosuk, T. (2014).
Exergoeconomic analysis of carbon
dioxide transcritical refrigeration
machines. International Journal of
Refrigeration, 38, 128-139.
Ghorbani, B., Hamedi, M.-H., & Amidpour, M.
(2016). Development and optimization of
an integrated process configuration for
natural gas liquefaction (LNG) and
natural gas liquids (NGL) recovery with a
nitrogen rejection unit (NRU). Journal of
Natural Gas Science and Engineering,
34, 590-603.
Ghorbani, B., Hamedi, M.-H., Amidpour, M., &
Mehrpooya, M. (2016). Cascade
refrigeration systems in integrated
cryogenic natural gas process (natural
gas liquids (NGL), liquefied natural gas
(LNG) and nitrogen rejection unit
(NRU)). Energy, 115, 88-106.
Ghorbani, B., Hamedi, M.-H., Shirmohammadi,
R., Hamedi, M., & Mehrpooya, M. (2016).
Exergoeconomic analysis and multi-
objective Pareto optimization of the
C3MR liquefaction process. Sustainable
Energy Technologies and Assessments,
17, 56-67.
doi:http://dx.doi.org/10.1016/j.seta.2016.0
9.001
Ghorbani, B., Hamedi, M., Shirmohammadi, R.,
Mehrpooya, M., & Hamedi, M.-H. (2016).
A novel multi-hybrid model for
estimating optimal viscosity correlations
of iranian crude oil. Journal of Petroleum
Science and Engineering.
Ghorbani, B., Mafi, M., Amidpour, M., Nayenian,
M., & Salehi, G. R. (2013). Mathematical
Method and Thermodynamic Approaches
to Design Multi-Component Refrigeration
Used in Cryogenic Process Part I:
Optimal Operating Conditions. Gas
Processing Journal, 1(2), 13-21.
Ghorbani, B., Mafi, M., Shirmohammadi, R.,
Hamedi, M.-H., & Amidpour, M. (2014).
Optimization of operation parameters of
refrigeration cycle using particle swarm
and NLP techniques. Journal of Natural
Gas Science and Engineering, 21, 779-
790.
Vol. 4, N0. 1, 2016 27
GPJ
Ghorbani, B., Maleki, M., Salehi, A., Salehi, G. R.,
& Amidpour, M. (2013). Optimization of
Distillation Column Operation by
Simulated Annealing. Gas Processing
Journal, 1(2), 49-63.
Ghorbani, B., Salehi, G., Amidpour, M., &
Hamedi, M. (2012). Exergy and
exergoeconomic evaluation of gas
separation process. Journal of Natural
Gas Science and Engineering, 9, 86-93.
Ghorbani, B., Salehi, G., Ghaemmaleki, H.,
Amidpour, M., & Hamedi, M. (2012).
Simulation and optimization of
refrigeration cycle in NGL recovery
plants with exergy-pinch analysis.
Journal of Natural Gas Science and
Engineering, 7, 35-43.
Ghorbani, B., Salehi, G. R., Esnaashary, P., &
Amidpour, M. (2012). Design and
Optimization of Heat Integrated
Distillation. Energy Science and
Technology, 3(2), 29-37.
Ghorbani, B., Ziabasharhagh, M., & Amidpour, M.
(2014). A hybrid artificial neural network
and genetic algorithm for predicting
viscosity of Iranian crude oils. Journal of
Natural Gas Science and Engineering,
18, 312-323.
Khan, M. S., & Lee, M. (2013). Design
optimization of single mixed refrigerant
natural gas liquefaction process using the
particle swarm paradigm with nonlinear
constraints. Energy, 49, 146-155.
Lashkajani, K. H., Ghorbani, B., Amidpour, M., &
Hamedi, M.-H. (2016). Superstructure
optimization of the olefin separation
system by harmony search and genetic
algorithms. Energy, 99, 288-303.
Lashkajani, K. H., Ghorbani, B., Salehi, G. R., &
Amidpour, M. (2013a). The Design and
Optimization of Distillation Column with
Heat and Power Integrated Systems.
Lashkajani, K. H., Ghorbani, B., Salehi, G. R., &
Amidpour, M. (2013b). The Design of the
Best Heat Integrated Separation Systems
Using Harmony Search Algorithm.
Mafi, M., Ghorbani, B., Amidpour, M., & Naynian,
S. M. (2013). Design of mixed refrigerant
cycle for low temperature processes using
a thermodynamic approach. Scientia
Iranica. Transaction B, Mechanical
Engineering, 20(4), 1254.
Mafi, M., Ghorbani, B., Salehi, G., Amidpour, M.,
& Nayenian, S. M. The Mathematical
Method and Thermodynamic Approaches
to Design Multi-Component Refrigeration
used in Cryogenic Process Part II:
Optimal Arrangement.
Meratizaman, M., Amidpour, M., Jazayeri, S. A.,
& Naghizadeh, K. (2010). Energy and
exergy analyses of urban waste
incineration cycle coupled with a cycle of
changing LNG to pipeline gas. Journal of
Natural Gas Science and Engineering,
2(5), 217-221.
Morosuk, T., & Tsatsaronis, G. (2008). A new
approach to the exergy analysis of
absorption refrigeration machines.
Energy, 33(6), 890-907.
Ott, C. M., Krishnamurthy, G., Chen, F., Liu, Y.,
& Roberts, M. J. (2015). Integrated
Nitrogen Removal in the Production of
Liquefied Natural Gas Using
Refrigerated Heat Pump: US Patent
20,150,308,738.
Ransbarger, W. L. (2006). Intermediate pressure
LNG refluxed NGL recovery process:
Google Patents.
Roberts, M., & Brostow, A. (2005). Integrated
NGL recovery and liquefied natural gas
production: Google Patents.
Romero Gómez, M., Romero Gómez, J., López-
González, L. M., & López-Ochoa, L. M.
(2016). Thermodynamic analysis of a
novel power plant with LNG (liquefied
natural gas) cold exergy exploitation and
CO2 capture. Energy, 105, 32-44.
doi:http://dx.doi.org/10.1016/j.energy.201
5.09.011
Salarian, H., Ghorbani, B., Amidpour, M., &
Salehi, G. (2014). Performance study on
the dehumidifier of a packed bed liquid
desiccant system. Scientia Iranica.
Transaction B, Mechanical Engineering,
21(1), 222.
Salehi, G., Salehi, A., Ghorbani, B., Amidpour, M.,
Maleki, M., & Kimiaghalam, F. (2012). A
Pareto Front Approach to Bi-objective of
Distillation Column Operation Using
Genetic Algorithm. Energy Science and
Technology, 3(2), 63-73.
Sheikhi, S., Ghorbani, B., Shirmohammadi, R., &
Hamedi, M.-H. (2014). Thermodynamic
and Economic Optimization of a
Refrigeration Cycle for Separation Units
in the Petrochemical Plants Using Pinch
Technology and Exergy Syntheses
Analysis. Gas Processing Journal, 2(2),
39-52. Retrieved from
http://uijs.ui.ac.ir/gpj/browse.php?a_code
=A-10-350-1&slc_lang=en&sid=1
Sheikhi, S., Ghorbani, B., Shirmohammadi, R., &
Hamedi, M.-H. (2015). Advanced Exergy
Evaluation of an Integrated Separation
Process with Optimized Refrigeration
System. Gas Processing Journal, 3(1), 1-
10. Retrieved from
http://uijs.ui.ac.ir/gpj/browse.php?a_code
=A-10-350-2&slc_lang=en&sid=1
28 Gas Processing Journal
GPJ
Shirmohammadi, R., Ghorbani, B., Hamedi, M.,
Hamedi, M.-H., & Romeo, L. M. (2015).
Optimization of mixed refrigerant
systems in low temperature applications
by means of group method of data
handling (GMDH). Journal of Natural
Gas Science and Engineering, 26, 303-
312.
Wang, M., Khalilpour, R., & Abbas, A. (2014).
Thermodynamic and economic
optimization of LNG mixed refrigerant
processes. Energy Conversion and
Management, 88, 947-961.
Yang, H., Wei, Z., & Chengzhi, L. (2009). Optimal
design and techno-economic analysis of a
hybrid solar–wind power generation
system. Applied Energy, 86(2), 163-169.
doi:http://dx.doi.org/10.1016/j.apenergy.2
008.03.008
Ghorbani, B., Hamedi, M., Shirmohammadi, R.,
Mehrpooya, M., & Hamedi, M. H. (2016). A
novel multi-hybrid model for estimating
optimal viscosity correlations of Iranian crude
oil. Journal of Petroleum Science and
Engineering, 142, 68-76