82
Gas Statement of Opportunities March 2021 For eastern and south-eastern Australia

Gas Statement of Opportunities
March 2021
For eastern and south-eastern Australia

Important notice
PURPOSE
The purpose of this publication is to provide information to assist registered participants and other persons in
making informed decisions about investment in pipeline capacity and other aspects of the natural gas
industry. AEMO publishes this Gas Statement of Opportunities in accordance with section 91DA of the
National Gas Law and Part 15D of the National Gas Rules. This publication is generally based on information
available to AEMO as at 31 December 2020, unless otherwise indicated.
DISCLAIMER
AEMO has made reasonable efforts to ensure the quality of the information in this publication but cannot
guarantee that information, forecasts and assumptions are accurate, complete or appropriate for your
circumstances. This publication does not include all of the information that an investor, participant or
potential participant might require, and does not amount to a recommendation of any investment. Anyone
proposing to use the information in this publication (which includes information and forecasts from third
parties) should independently verify its accuracy, completeness and suitability for purpose, and obtain
independent and specific advice from appropriate experts.
Accordingly, to the maximum extent permitted by law, AEMO and its officers, employees and consultants
involved in the preparation of this document:
• make no representation or warranty, express or implied, as to the currency, accuracy, reliability or
completeness of the information in this document; and
• are not liable (whether by reason of negligence or otherwise) for any statements, opinions, information or
any other matters contained in or derived from this publication, or any omissions from it, or in respect of a
person’s use of the information in this publication.
ACKNOWLEDGEMENT
AEMO acknowledges the support, co-operation and contribution of participants and project proponents in
providing data and information used in this publication.
COPYRIGHT
©2021 Australian Energy Market Operator Ltd. The material in this publication may be used in accordance
with the copyright permissions on AEMO’s website.
VERSION CONTROL
Version Release date Changes
1 29 March 2021 Initial release
© AEMO 2021 | Gas Statement of Opportunities 3
Executive summary
In the 2021 Gas Statement of Opportunities (GSOO), AEMO forecasts demand, and uses information from gas
producers about reserves and forecast production, to project the supply-demand balance and potential gaps
under a range of plausible scenarios for eastern and south-eastern Australian gas systems to 2040. AEMO’s
2021 Victorian Gas Planning Report (VGPR)1, which complements this GSOO, provides a focused assessment
of the supply-demand balance to 2025 in Victoria’s Declared Transmission System (DTS).
This GSOO distinguishes between geographical regions in the north and south of eastern Australia. Northern
regions generally refers to developments, consumers, and existing facilities in Queensland and those
Northern Territory assets with access to the Northern Gas Pipeline (NGP). Southern regions generally refers
to developments, consumers, and existing facilities in South Australia (including the Queensland component
of the Cooper–Eromanga basin), New South Wales, the Australian Capital Territory, Victoria, and Tasmania.
This GSOO forecasts an improved gas supply outlook compared to last year, largely due to
Australian Industrial Energy’s (AIE’s) commitment to the Port Kembla Gas Terminal (PKGT) in New
South Wales. This is Australia’s first liquified natural gas (LNG) import terminal, and is estimated to
inject up to 500 terajoules (TJ) per day into the domestic market.
• There is now projected to be sufficient supply to address the near-term shortfall forecasts of
recent GSOOs (deferring shortfall forecasts to at least 2026), provided the first gas from PKGT is
delivered ahead of winter 2023 and other committed field developments and pipeline expansions
proceed as planned.
• If PKGT project commissioning is delayed, southern supply scarcity risks have emerged for
winter 2023 under certain conditions such as extreme 1-in-20 maximum winter daily demand in
Victoria, coincident peaks across southern regions, events in the National Electricity Market (NEM) that
increase demand for gas-powered generation of electricity (GPG), or gas production outages.
• These southern supply scarcity risks appear one year earlier than projected last year, due to more
rapid decline in producers’ forecasts of maximum daily production from legacy southern fields
in Longford, Victoria. The last major southern gas field offering flexible supply is expected to be
depleted ahead of winter 2023, reducing gas system resilience.
• Most projects classified as anticipated in last year’s GSOO are now committed, but this GSOO reports
fewer new anticipated projects, with limited exploration investment incentivised in the past year,
even in northern regions.
• Development of all remaining anticipated projects on schedule, including Golden Beach and new
fields in the Gippsland Basin Joint Venture (GBJV), would build resilience to unexpected events.
This would help manage operational risks associated with unplanned outages, or project delays in
either the gas or electricity system, and defer projected gas supply gaps until the end of this decade.
• Additional demand management initiatives or proposed pipeline expansion could further assist
in mitigating supply scarcity risks associated with any potential PKGT commissioning schedule
slippage, or LNG cargo delays.
1 At https://www.aemo.com.au/energy-systems/gas/gas-forecasting-and-planning/victorian-gas-planning-report.

© AEMO 2021 | Gas Statement of Opportunities 4
This GSOO also highlights that the gas sector in eastern and south-eastern Australia is on the cusp of
transformation, with changes in consumption patterns forecast and alternate supply sources being
actively developed. It reports on current and projected trends and their implications for system
resilience, investment, and the role of gas in the future energy system.
The key transforming trends observed and projected in the gas sector are:
• Industrial demand for natural gas is not forecast to grow in the next 20 years, and could
potentially reduce significantly as industrial users in the gas sector start to decarbonise. With an
increase in variable renewable energy (VRE), GPG demand may become more ‘peaky’.
- Surveyed industrial users indicated their demand is unlikely to increase, even if prices fall. Their
current view remains that gas price reductions alone would not drive significant increases in their
consumption, but would reduce the risk of industrial closures. The potential impact of sustained
lower prices on new manufacturing demand was not modelled.
– By 2040, in a future world where economic production of hydrogen is strong, gas consumption for
direct use could decline by as much as 20% (based on scenario assumptions), with an even faster
decline then projected to 2050.
– Gas is expected to continue to play a critical role in the electricity sector particular during periods
of low VRE generation or prolonged coal-fired generation outages. While the volume of gas
consumed for generating electricity is forecast to decline in all scenarios, the value of that
generation is expected to increase in line with the growth of VRE and the retirement of coal
generation. Over time, daily GPG demand is projected to switch to peaking in winter instead of
summer.
• There are numerous initiatives underway at both federal and state government level that could
change the gas landscape and impact the outlook described here, including the Australian
Government’s gas fired recovery plan2.
• The introduction of PKGT and other LNG import terminal proposals currently being progressed
have potential to permanently change domestic gas market dynamics .
Further investments to address forecast supply gaps should be cognisant of the sector
transformation underway and be adaptable to manage future changes in gas consumption
patterns. Prudent options could include investments that can:
• Flexibly match supply with seasonal demand and deliver variable annual supply efficiently.
• Manage peak demand needs, potentially through electrification, fuel switching, and energy efficiency.
The National Gas Infrastructure Plan (NGIP) being developed by the federal Department of Industry,
Science, Energy and Resources (DISER) is considering a number of pathways to unlock gas supply and
improve efficiency in the east coast gas market, taking these considerations into account.
Legacy supply flexibility to meet winter demand is deteriorating, but investment is occurring
Over the last year, the market has committed to developing almost all previously anticipated projects. As a
result, annual production in southern regions is still in decline, but forecasts of existing and committed annual
production over the next five years have generally increased compared with the 2020 GSOO forecast. Much
of this increase in annual production is from fields in Moomba (South Australia) and Port Campbell (Victoria).
Without further expansion, constraints on existing pipeline infrastructure, in particular the Moomba–Sydney
Pipeline (MSP) and Victoria’s South West Pipeline (SWP), may limit the delivery of gas from these southern
producers to southern customers during peak demand periods.
2 See https://consult.industry.gov.au/energy/gas-fired-recovery-plan/.

© AEMO 2021 | Gas Statement of Opportunities 5
Maximum daily production in southern regions is falling significantly faster than annual production,
particularly in Longford (Victoria), where major legacy flexible supply fields are now expected to be depleted
by winter 2023 – one year earlier than forecast in the 2020 GSOO. In 2023, maximum daily capacity from
existing, committed, and anticipated southern fields is almost 20% lower than the producers’ forecasts in the
2020 GSOO; it is 25% lower if focusing only on Victorian producers3.
Unless new southern production is developed, Victoria will therefore need to rely more on supply from
outside the state to cover its winter demands for heating in future. While most previously anticipated
developments are now committed, new anticipated developments are becoming more limited. In southern
regions, anticipated projects may provide between 20 petajoules (PJ) and 40 PJ additional supply each year
across the project lifetimes. These include Golden Beach and new fields in the Gippsland Basin Joint Venture
(GBJV), all in Victoria. Encouragingly, Beach Energy has also recently reported more commercial quantities of
gas from the Enterprise gas field4 in Victoria’s Otway Basin than previously expected, but this project is not
yet committed.
More generally, lower gas prices have contributed to a challenging investment environment for new
production5. This impact is most evident across the coal seam gas (CSG) fields in Queensland, with producers
now projecting a slower development schedule for anticipated projects.
System resilience is rapidly reducing, and supply risks are projected if investment is delayed
The timely commissioning of committed developments, including the PKGT, is critically important given the
forecast reduction in maximum daily capacity from southern fields. If delivered to schedule, domestic supply
shortfalls during winter peak demand periods are not forecast until at least 2026. If these committed projects
are not delivered to schedule, greater reliance would be placed on storages, and gas shortfalls of up to 100 TJ
per day may eventuate in winter 2023 under extreme conditions.
Figure 1 shows the encroaching tightness forecast in southern supply-demand balance at times of extreme
1-in-20 daily demands6, along with the impact the PKGT is projected to have from winter 2023. The pipeline
capacity in the figure represents the contribution from northern production, up to the limit of the South West
Queensland Pipeline (SWQP). The constrained storage capacity represents southern storage’s potential
contributions up to the existing limit of the connecting pipelines7. Import of LNG cargoes for peak seasonal
supply is assumed to be limited by the capacity of the PKGT (approximately 500 TJ per day) and the pipelines.
The PKGT is complemented by compression on the Eastern Gas Pipeline (EGP) to enable bi-directional supply
between New South Wales and Victoria (200 TJ per day south is committed), improving the security of supply
to both states.
The strong seasonality of southern daily demand is clearly evident in Figure 1, with residential and commercial
heating applications in winter driving peak day demand.
Demand above the red dashed line ‘Production and pipeline capacity’ needs to be met either by storage or
PKGT, or both. Without further pipeline expansion, constraints on the SWP may restrict Victoria’s access to
supply from Iona Underground Storage (UGS), which has traditionally provided additional supply deliverability
during peak periods, unplanned trips, and outages of other equipment. Greater reliance will instead need to
be placed on import of LNG cargoes from PKGT to cover extreme winter peaks. This may present operational
challenges in the event of LNG cargoes to the new terminal being unavailable.
3 Victorian production forecasts are available in detail in the 2021 VGPR.
4 A production plan for this gas field is not yet available to AEMO and has therefore not been included in this analysis. This announcement is not expected to
materially change the supply adequacy assessment unless pipeline constraints on SWP are also addressed.
5 See https://www.afr.com/companies/energy/origin-slashes-qld-drilling-as-soft-gas-market-bites-20201030-p569zh. Gas producers were surveyed before
the rapid rise in Asian LNG markets, which may or may not result in increased anticipated supply in future years.
6 Maximum daily demand is forecast with a probability of exceedance (POE), meaning the likelihood the forecast will be met or exceeded. A 1-in-20 forecast
is expected to be exceeded, on average, only once in 20 years, while a 1-in-2 forecast is expected, on average, to be exceeded every second year.
7 Dandenong (Victoria) and Newcastle (New South Wales) LNG storages are assumed to be fully maximised, Victoria’s Iona Underground Storage (UGS) is
limited to the sum of filling the remaining capacity on the SWP, meeting the peak day demand at Port Campbell and meeting any unmet demand in
Adelaide on the specific peak day.

© AEMO 2021 | Gas Statement of Opportunities 6
Development of anticipated projects such as Golden Beach, demand management initiatives, greater focus
on energy efficiency and fuel-switching, or expansion of pipelines could all help mitigate supply scarcity risks
under these extreme conditions in winter 2023.
Figure 1 Actual daily southern gas demand since January 2019, and forecast to 2025, showing seasonality,
peakiness, southern production, and total system capacity available to meet southern demand using existing and committed projects (TJ)
Source: Gas Bulletin Board (GBB) and AEMO forecasts of 1-in-20 southern demand.
Over time, as maximum daily production continues to decline, the value of flexible seasonal “shaped” gas
supplies is expected to increase to help cover monthly winter demand, not just extreme peaks. Provided all
committed and anticipated projects are developed, there is projected to be sufficient supply to cover both
extreme peak demand conditions and seasonal demand requirements until at least 2029, as shown in
Figure 2. PKGT is forecast to provide the seasonal supply flexibility that is otherwise being eroded as legacy
southern fields deplete.
Figure 2 Projected eastern and south-eastern Australia gas production (including export LNG), Central scenario, existing, committed, and anticipated developments, 2021-40 (PJ)
0
1,000
2,000
3,000
1/01/2019 1/01/2020 1/01/2021 1/01/2022 1/01/2023 1/01/2024 1/01/2025
TJ
Actual southern demand Forecast southern demand
Max. southern production Production and pipeline capacity
Production, pipeline and constrained storage Production, pipeline, constrained storage and PKGT
0
500
1,000
1,500
2,000
2021
2022
2023
2024
2025
2026
2027
2028
2029
2030
2031
2032
2033
2034
2035
2036
2037
2038
2039
204
0
PJ
Developed Committed Anticipated LNG imports Forecast demand
© AEMO 2021 | Gas Statement of Opportunities 7
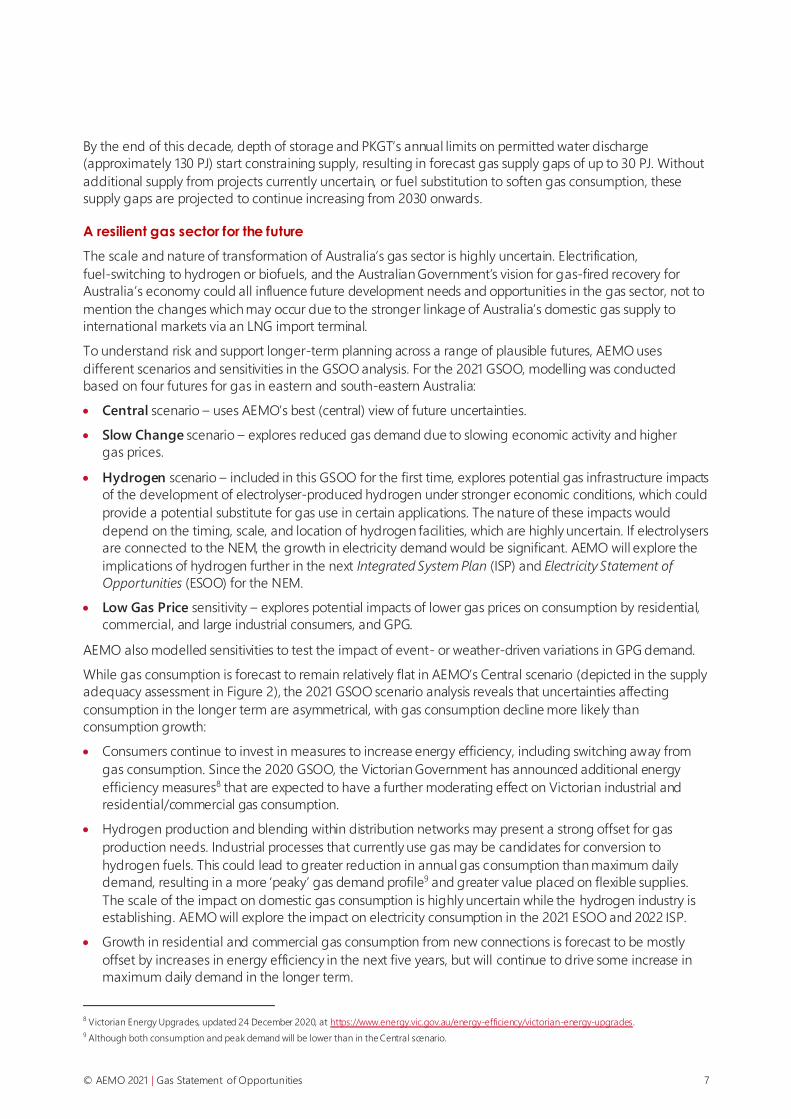
By the end of this decade, depth of storage and PKGT’s annual limits on permitted water discharge
(approximately 130 PJ) start constraining supply, resulting in forecast gas supply gaps of up to 30 PJ. Without
additional supply from projects currently uncertain, or fuel substitution to soften gas consumption, these
supply gaps are projected to continue increasing from 2030 onwards.
A resilient gas sector for the future
The scale and nature of transformation of Australia’s gas sector is highly uncertain. Electrification,
fuel-switching to hydrogen or biofuels, and the Australian Government’s vision for gas-fired recovery for
Australia’s economy could all influence future development needs and opportunities in the gas sector, not to
mention the changes which may occur due to the stronger linkage of Australia’s domestic gas supply to
international markets via an LNG import terminal.
To understand risk and support longer-term planning across a range of plausible futures, AEMO uses
different scenarios and sensitivities in the GSOO analysis. For the 2021 GSOO, modelling was conducted
based on four futures for gas in eastern and south-eastern Australia:
• Central scenario – uses AEMO’s best (central) view of future uncertainties.
• Slow Change scenario – explores reduced gas demand due to slowing economic activity and higher
gas prices.
• Hydrogen scenario – included in this GSOO for the first time, explores potential gas infrastructure impacts
of the development of electrolyser-produced hydrogen under stronger economic conditions, which could
provide a potential substitute for gas use in certain applications. The nature of these impacts would
depend on the timing, scale, and location of hydrogen facilities, which are highly uncertain. If electrolysers
are connected to the NEM, the growth in electricity demand would be significant. AEMO will explore the
implications of hydrogen further in the next Integrated System Plan (ISP) and Electricity Statement of
Opportunities (ESOO) for the NEM.
• Low Gas Price sensitivity – explores potential impacts of lower gas prices on consumption by residential,
commercial, and large industrial consumers, and GPG.
AEMO also modelled sensitivities to test the impact of event- or weather-driven variations in GPG demand.
While gas consumption is forecast to remain relatively flat in AEMO’s Central scenario (depicted in the supply
adequacy assessment in Figure 2), the 2021 GSOO scenario analysis reveals that uncertainties affecting
consumption in the longer term are asymmetrical, with gas consumption decline more likely than
consumption growth:
• Consumers continue to invest in measures to increase energy efficiency, including switching away from
gas consumption. Since the 2020 GSOO, the Victorian Government has announced additional energy
efficiency measures8 that are expected to have a further moderating effect on Victorian industrial and
residential/commercial gas consumption.
• Hydrogen production and blending within distribution networks may present a strong offset for gas
production needs. Industrial processes that currently use gas may be candidates for conversion to
hydrogen fuels. This could lead to greater reduction in annual gas consumption than maximum daily
demand, resulting in a more ‘peaky’ gas demand profile9 and greater value placed on flexible supplies.
The scale of the impact on domestic gas consumption is highly uncertain while the hydrogen industry is
establishing. AEMO will explore the impact on electricity consumption in the 2021 ESOO and 2022 ISP.
• Growth in residential and commercial gas consumption from new connections is forecast to be mostly
offset by increases in energy efficiency in the next five years, but will continue to drive some increase in
maximum daily demand in the longer term.
8 Victorian Energy Upgrades, updated 24 December 2020, at https://www.energy.vic.gov.au/energy-efficiency/victorian-energy-upgrades.
9 Although both consumption and peak demand will be lower than in the Central scenario.

© AEMO 2021 | Gas Statement of Opportunities 8
• Industrial consumers remain sensitive to energy costs, and closure of industrial facilities remains an
ever-present risk if energy costs are high. Manufacturing expansion continues to be driven by sectors that
consume relatively lower gas than historical industrial users. Based on user surveys, significant investments
in new large industrial processes (and consequent growth in demand) are considered unlikely at this time.
Lower gas prices alone are not expected to drive significant increases in consumption, but would reduce
the risk of industrial closures. The Australian Government’s gas-fired recovery plan may stimulate growth
in gas consumption, but it is assumed that this would be supported by actions in the plan to unlock supply
as needed10 and would therefore be unlikely to increase the risk of supply scarcity.
• Annual demand for gas from GPG is likely to materially reduce as more VRE connects and operates in the
NEM11. In 2020, the GPG gas demand of 127 PJ12 was approximately 23% lower than in 2019 and the lowest
GPG consumption in over a decade. While some of this GPG reduction may be attributed to COVID-19,
the main contributors appear to be mild weather, increased distributed photovoltaics (PV), and growth in
VRE. The electricity transmission network is also assumed to expand consistent with the 2020 ISP optimal
development path, further reducing expected future GPG volumes. However, GPG retains a critical role in
meeting demand during high temperatures in summer or low VRE periods in winter, so peak GPG demand
is projected to remain relatively constant over the next decade. Over time, as more energy storage is
developed and coal-fired generators retire, daily GPG demand is forecast to switch from summer to winter
peaking, further exaggerating existing seasonal variations in daily gas demand.
• Higher GPG demand is frequently event-driven, and AEMO forecasts continued volatility in GPG demand,
with large variances driven by the NEM’s operation of coal, hydro, and renewable energy generators.
Delays or deferral in developing new generation and transmission capacity, or earlier than expected
closure of coal-fired generation may temporarily increase annual GPG consumption.
The GSOO projects a wide variety of potential consumption forecast outcomes over the 20-year horizon
across different plausible scenarios and sensitivities that drive different supply adequacy outlooks and
investment needs. Figure 3 shows the range of consumption forecasts in this 2021 GSOO, and compares
Central and Slow Change scenario projections to equivalent forecasts in the 2020 GSOO.
10 The Gas Fired Recovery Plan was still open for consultation at the time this GSOO was published, and the proposed measures have therefore not been
included in this assessment. A GSOO update will be prepared if the final measures determined following consultation lead to a materially different
supply-demand outlook.
11 The 2021 GSOO analysis commenced prior to the announcement of the New South Wales Transformation Roadmap, so does not include the 12 gigawatts
(GW) of VRE targeted to commence construction in New South Wales by 2030. This would further reduce GPG demand, unless coal-fired generation
exited early in response.
12 This excludes the generator at Yarwun, which is captured as industrial consumption.

© AEMO 2021 | Gas Statement of Opportunities 9
Figure 3 Domestic gas consumption actual and forecast, 2014-40, excluding LNG, all scenarios, compared to 2020 GSOO scenarios (PJ)
Future gas infrastructure investments should be planned so they are robust to a range of possible futures,
including futures with lower demand for gas in the long term, and/or more peaky demand profiles.
As demonstrated in this 2021 GSOO:
• Additional peak management solutions, pipeline expansions or anticipated field development ahead of
winter 2023 would help minimise risk of unplanned disruption in southern regions under certain
conditions in the event PKGT’s construction or commissioning schedule is delayed.
• In the following years, while consumption may decline under some scenarios, peak and seasonal demands
are forecast to continue to grow with growing customer connections, and GPG may amplify seasonal
consumption patterns with shifts from summer to winter peaking. This uncertainty increases the value of
flexible supply and infrastructure options to meet projected seasonal supply gaps.
To this end, the preparation of the NGIP is timely and critically important to increase the resilience of the
eastern and south-eastern gas systems to both near-term supply scarcity risks and longer-term sectoral
transformation uncertainties.
0
100
200
300
400
500
600
7002014
2015
2016
2017
2018
2019
2020
2021
2022
2023
2024
2025
2026
2027
2028
2029
2030
2031
2032
2033
2034
2035
2036
2037
2038
2039
2040A
nnual co
nsu
mp
tio
n e
xcl.
UA
FG
(PJ)
Actual 2021 GSOO Central 2021 GSOO Hydrogen
2021 GSOO Low Gas Price 2021 GSOO Slow Change 2020 GSOO Central
2020 GSOO Slow Change

© AEMO 2021 | Gas Statement of Opportunities 10
Contents Executive summary 3
1. Introduction 14
1.1 A changing market 14
1.2 Scenarios and sensitivities 15
1.3 Improvements for the 2021 GSOO 18
1.4 Supplementary information 18
2. Gas consumption and demand forecasts 20
2.1 Total eastern and south-eastern gas consumption forecasts 21
2.2 Consumption forecasts by sector 27
2.3 Maximum daily gas demand forecasts 33
3. Gas supply and infrastructure 40
3.1 Reserves, resources, and production facilities 41
3.2 Midstream gas infrastructure 45
4. Gas supply adequacy 53
4.1 Supply adequacy in the Central scenario 54
4.2 Annual gas adequacy in other scenarios 58
5. Adding resilience to the eastern and south-eastern gas markets 60
A1. Hydrogen assumptions 65
A1.1 Building the assumption-based forecasts 66
A2. Forecast accuracy 68
Measures and abbreviations 79
Glossary 81
Tables Table 1 Scenario drivers of most relevance to the gas market 15
Table 2 Other relevant reference materials 18
Table 3 Total 1-in-2 and 1-in-20 forecast maximum demand, summer, all sectors excluding GPG,
including UAFG (TJ a day [TJ/d]) 35

© AEMO 2021 | Gas Statement of Opportunities 11
Table 4 Total 1-in-2 and 1-in-20 forecast maximum demand, winter, all sectors excluding GPG,
including UAFG (TJ/d) 35
Table 5 Actual and forecast GPG daily demand range at the time of maximum gas demand, winter,
Central, 1-in-20 year peak conditions (TJ/d) 37
Table 6 Actual and forecast GPG daily demand range at the time of maximum gas demand, summer,
Central,1-in-20 year peak conditions (TJ/d) 37
Table 7 Forecast of available annual production as provided by gas producers, 2021-25 (PJ) 43
Table 8 Additional major midstream infrastructure 49
Table 9 Key storage infrastructure within the eastern and south-eastern gas systems 50
Table 10 LNG receipt terminals 52
Table 11 Year ahead historical forecast accuracy, total for eastern and south-eastern Australia 69
Table 12 Year ahead historical forecast accuracy, residential and commercial 70
Table 13 Year ahead historical forecast accuracy, industrial 71
Table 14 Year ahead historical forecast accuracy, total for all Queensland LNG Facilities 72
Table 15 Year ahead historical forecast accuracy, GPG 73
Figures Figure 1 Actual daily southern gas demand since January 2019, and forecast to 2025, showing
seasonality, peakiness, southern production, and total system capacity available to meet
southern demand using existing and committed projects (TJ) 6
Figure 2 Projected eastern and south-eastern Australia gas production (including export LNG),
Central scenario, existing, committed, and anticipated developments, 2021-40 (PJ) 6
Figure 3 Domestic gas consumption actual and forecast, 2014-40, excluding LNG, all scenarios,
compared to 2020 GSOO scenarios (PJ) 9
Figure 4 Assumed hydrogen impact on natural gas consumption, 2021-50 (petajoules [PJ]) 17
Figure 5 Gas consumption actual and forecast, all sectors, Central scenario, 2014-40 (PJ) 21
Figure 6 Total gas consumption actual and forecast, all sectors, compared to 2020 GSOO scenarios,
2014-40 (PJ) 22
Figure 7 Domestic gas consumption actual and forecast, excluding LNG exports, compared to 2020
GSOO scenarios, 2014-40 (PJ) 22
Figure 8 Residential and commercial connections actual and forecasts for eastern and south-eastern
gas markets, by scenario and compared to the 2020 GSOO, 2020-40 24
Figure 9 Energy efficiency forecasts for eastern and south-eastern gas markets, by scenario and
compared to the 2020 GSOO, 2020-40 (PJ) 25
Figure 10 Wholesale price forecasts at the Wallumbilla Hub, all scenarios and compared to the 2020
GSOO, 2020-40 26
Figure 11 Residential retail price forecasts (Load weighted) for the East and South-East Coast, all
scenarios and compared to the 2020 GSOO, 2020-40 26

© AEMO 2021 | Gas Statement of Opportunities 12
Figure 12 Residential and commercial annual consumption actual and forecast, all scenarios and
compared to 2020 GSOO, 2014-40 (PJ) 27
Figure 13 Industrial annual consumption actual and forecast, all scenarios and compared to 2020
GSOO, 2014-40 (PJ) 28
Figure 14 LNG annual consumption actual and forecast, all scenarios and compared to 2020 GSOO,
2014-40 (PJ) 30
Figure 15 National Electricity Market GPG consumption actual and forecast, by scenario, 2005-40 (PJ) 32
Figure 16 Forecast variance in GPG consumption due to NEM events and weather variability,
2014-40 (PJ) 33
Figure 17 Actual daily gas demand in Victoria since January 2019, showing seasonality and
peakiness (TJ) 36
Figure 18 Actual and projected maximum daily GPG demand by month in the southern states, 2019-40 38
Figure 19 Victorian regional winter 1-in-2 peak demand, all scenarios including UAFG (TJ a day) 39
Figure 20 Reserves and resources reported in the 2020 GSOO and 2021 GSOO 42
Figure 21 Forecast annual production from southern gas fields, 2021-25 (PJ) 44
Figure 22 Forecast maximum daily production capacity from southern gas fields, 2021-25 (TJ/d) 45
Figure 23 Map of the basins and major pipelines and load centres in eastern and south-eastern
Australian gas system 46
Figure 24 Cumulative distribution of flows along the SWQP, 1 January 2016 to 31 December 2020 (TJ/d) 48
Figure 25 Observed gas supply used to meet peak southern demand in 2020 49
Figure 26 Cumulative distribution of net changes in storage level for Iona UGS, 1 January 2017 to
31 December 2020 ((TJ/d) 51
Figure 27 Projected eastern and south-eastern Australia gas production (including export LNG),
Central scenario, existing, committed, and anticipated developments, 2021-40 (PJ) 55
Figure 28 Forecast daily demand and southern maximum total system capacity available, Central
scenario*, 2021-25 (TJ) 56
Figure 29 Cumulative distribution of aggregate flows between New South Wales and Victoria (EGP and
VNI), Central scenario, assuming existing, committed, and anticipated developments,
2021-30 (TJ/d) 57
Figure 30 Forecast gas supply options to meet southern daily demand, Central scenario, 2030 (TJ/d) 57
Figure 31 Forecast gas supply relative to southern daily demand, Central scenario, 2035 (TJ/d) 58
Figure 32 Range of domestic supply gaps* forecast under Central, Slow Change, and Hydrogen
scenarios and Low Gas Price sensitivity, considering existing, committed, and anticipated
developments, 2026-35 (PJ) 59
Figure 33 Cumulative distribution curve of southern daily demand in 2040 59
Figure 34 Victorian gas consumption with no new residential gas connections, Central scenario,
to 2040 63
Figure 35 Various global hydrogen projections 67
Figure 36 Domestic hydrogen consumption per GSOO regions. 67
Figure 37 Gas annual consumption forecast comparison, total for eastern and south-eastern Australia 68

© AEMO 2021 | Gas Statement of Opportunities 13
Figure 38 Gas annual consumption forecast comparison, residential/commercial 69
Figure 39 Gas annual consumption forecast comparison, industrial 70
Figure 40 Gas annual consumption forecast comparison, LNG 72
Figure 41 NEM gas annual consumption forecast comparison, GPG 73
Figure 42 NEM monthly GPG consumption (September 2019 to August 2020), actual vs back-cast 74
Figure 43 Gas annual consumption forecast comparison for New South Wales, GPG 75
Figure 44 Gas annual consumption forecast comparison for Queensland, GPG 76
Figure 45 Gas annual consumption forecast comparison for South Australia, GPG 76
Figure 46 Gas annual consumption forecast comparison for Tasmania, GPG 77
Figure 47 Gas annual consumption forecast comparison for Victoria, GPG 78

© AEMO 2021 | Gas Statement of Opportunities 14
1. Introduction
In the 2021 Gas Statement of Opportunities (GSOO), AEMO assesses the adequacy of reserves, resources, and
infrastructure to meet the needs of domestic and export demands over a 20-year outlook period. The GSOO
analyses a range of potential futures, focusing on the adequacy of the system to deliver for future consumers.
The 2021 GSOO also identifies potential means to service the long-term needs of consumers via a portfolio of
potential developments.
This GSOO distinguishes between geographical regions in the north and south of eastern Australia:
• Northern regions generally refers to developments, consumers, and existing facilities in Queensland and
those Northern Territory assets with access to the Northern Gas Pipeline (NGP).
• Southern regions generally refers to developments, consumers, and existing facilities in South Australia
(including the Queensland component of the Cooper–Eromanga basin), New South Wales, the Australian
Capital Territory, Victoria, and Tasmania.
Information on the demand and supply forecasting inputs, assumptions, and methodologies used for this
GSOO is available on the 2021 GSOO webpage13. AEMO’s 2021 Victorian Gas Planning Report (VGPR)14, which
complements this GSOO, provides a focused assessment of the supply-demand balance to 2025 in Victoria’s
Declared Transmission System (DTS).
1.1 A changing market
Australia’s gas sector is on the cusp of transformation, with changes in consumption patterns forecast and
alternate supply sources, including liquified natural gas (LNG) import terminals, being actively developed.
Global recovery from COVID-19 may alleviate or compound the rate of change expected to influence the gas
sector. Domestically, the Australian Government has outlined its vision for a gas-fired recovery that will seek
to increase competition and transparency in Australia’s gas markets, and is to be delivered by focusing on
actions to unlock gas supply, improve transportation efficiency and empower consumers. The Department of
Industry, Science, Energy and Resources (DISER) is currently developing a National Gas Infrastructure Plan
(NGIP) which will identify priority infrastructure to support these aims.
Carbon emission reductions to achieve economy-wide net zero emissions (including contribution from the
gas sector) will have a transformative impact over the coming decades. Technological innovation and policy
support will significantly influence the pace of change and the role for the gas system in future. Current and
future investments in the energy sector, including the gas system, must recognise the challenges, risks, and
opportunities that emissions reductions will bring.
Rising prominence of hydrogen
For the first time, the 2021 GSOO includes consideration of hydrogen as a scenario within its modelling.
Momentum is building in the industry as the development of a hydrogen economy may provide a means to
achieve carbon emission reduction objectives. Since the 2020 GSOO, a number of significant developments,
funding initiatives, and strategies have demonstrated strong interest in and support for developing Australia’s
hydrogen potential. These include the:
13 At https://aemo.com.au/en/energy-systems/gas/gas-forecasting-and-planning/gas-statement-of-opportunities-gsoo.
14 At https://www.aemo.com.au/energy-systems/gas/gas-forecasting-and-planning/victorian-gas-planning-report.
© AEMO 2021 | Gas Statement of Opportunities 15
• National Hydrogen Strategy (CSIRO)15.
• Hydrogen Industry Strategy (Queensland)16.
• Hydrogen Technology Program (New South Wales)17.
• Hydrogen Investment Program and renewable hydrogen industry development plan (Victoria)18.
• Hydrogen Action Plans in both South Australia19 and Tasmania20.
• Renewable Hydrogen Strategy and Roadmap (Western Australia)21.
• Renewable Hydrogen Strategy (Northern Territory)22.
• Sustainable Energy Policy23 and Renewable Energy Innovation Fund24 (Australian Capital Territory).
With the progression of initiatives to support hydrogen development, it is increasingly important to consider
the impacts that hydrogen-blending, or even switching from gas to hydrogen consumption, may have on gas
infrastructure and future investment needs.
1.2 Scenarios and sensitivities
AEMO uses scenarios and sensitivities to explore the impact of future uncertainties. The 2021 GSOO has used
two scenarios from the 2020 Integrated System Plan (ISP) that are of most relevance to the gas sector,
specifically Central and Slow Change. To complement these scenarios, AEMO has considered additional
alternative futures to explore situations that may be relevant to opportunities and requirements for gas
investment; these are the Hydrogen scenario (for reasons discussed above) and the Low Gas Price sensitivity.
Table 1 summarises the key energy drivers considered of most relevance to the gas market across these four
alternative futures.
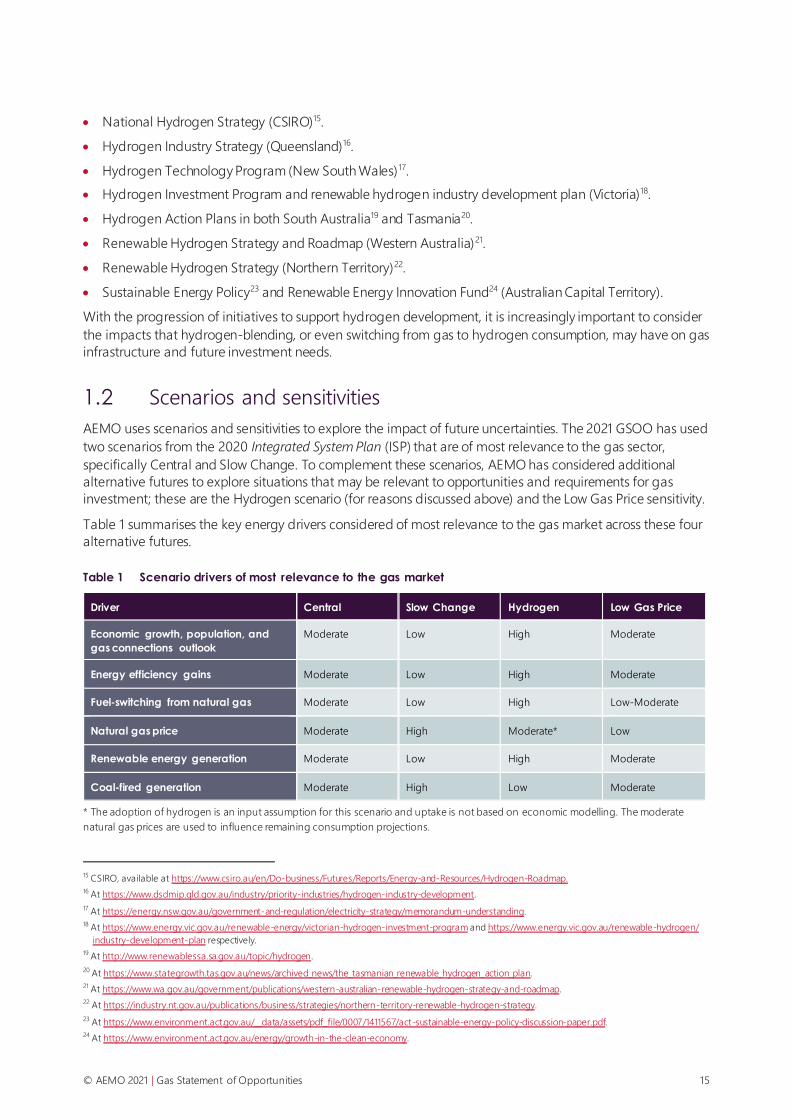
Table 1 Scenario drivers of most relevance to the gas market
Driver Central Slow Change Hydrogen Low Gas Price
Economic growth, population, and
gas connections outlook
Moderate Low High Moderate
Energy efficiency gains Moderate Low High Moderate
Fuel-switching from natural gas Moderate Low High Low-Moderate
Natural gas price Moderate High Moderate* Low
Renewable energy generation Moderate Low High Moderate
Coal-fired generation Moderate High Low Moderate
* The adoption of hydrogen is an input assumption for this scenario and uptake is not based on economic modelling. The moderate
natural gas prices are used to influence remaining consumption projections.
15 CSIRO, available at https://www.csiro.au/en/Do-business/Futures/Reports/Energy-and-Resources/Hydrogen-Roadmap.
16 At https://www.dsdmip.qld.gov.au/industry/priority-industries/hydrogen-industry-development.
17 At https://energy.nsw.gov.au/government-and-regulation/electricity-strategy/memorandum-understanding.
18 At https://www.energy.vic.gov.au/renewable-energy/victorian-hydrogen-investment-program and https://www.energy.vic.gov.au/renewable-hydrogen/
industry-development-plan respectively.
19 At http://www.renewablessa.sa.gov.au/topic/hydrogen.
20 At https://www.stategrowth.tas.gov.au/news/archived_news/the_tasmanian_renewable_hydrogen_action_plan.
21 At https://www.wa.gov.au/government/publications/western-australian-renewable-hydrogen-strategy-and-roadmap.
22 At https://industry.nt.gov.au/publications/business/strategies/northern-territory-renewable-hydrogen-strategy.
23 At https://www.environment.act.gov.au/__data/assets/pdf_file/0007/1411567/act-sustainable-energy-policy-discussion-paper.pdf.
24 At https://www.environment.act.gov.au/energy/growth-in-the-clean-economy.
© AEMO 2021 | Gas Statement of Opportunities 16
Central
In the Central scenario, the pace of transition is determined by market forces under current federal and state
government energy and environmental policies. Key assumptions include:
• Policies, rules and regulations regarding gas connections, energy efficiency, and fuel-switching,
specifically:
- The Victorian Energy Upgrades (VEU) program and Solar Homes scheme, as well as the recently
announced Household Energy Savings Package and Business Recovery Energy Efficiency Fund.
- The New South Wales Energy Savings Scheme.
- The Australian Capital Territory parliamentary agreement to ban new residential connections to gas.
- The National Construction Codes (Section J).
- The E3 Program managed by the Greenhouse Energy Minimum Standards (GEMS) regulator.
• Electricity sector infrastructure consistent with the 2020 ISP’s actionable ISP projects (excluding those with
decision rules) and Future ISP projects timed with the least-cost development path for the Central
scenario.
Slow Change
The Slow Change scenario is characterised by challenging economic conditions resulting in a slow-down of
the energy transition, reflected in slower changes in technology costs, and a more challenging environment in
which to make the upfront investments required for significant emissions reduction.
From a gas sector perspective, the key differences to the Central scenario include:
• Lower economic growth.
• Lower energy consumption.
• Lower carbon emissions reductions from the energy sector.
• Electricity sector infrastructure consistent with the 2020 ISP’s actionable ISP projects (excluding those with
decision rules), and Future ISP projects timed with the least-cost development path for the Slow Change
scenario.
With the reduced ambition for emissions reduction, some generator refurbishments extend the life of ageing
coal-fired generators, as was observed in the ISP’s Slow Change scenario, and less development of renewable
generation and distributed energy resources is applied.
Hydrogen
The Hydrogen scenario considers a future with a thriving Australian green hydrogen economy helping drive
stronger economic and population growth while taking stronger action to address climate change risks. In
this scenario, commitment to more rapid nation-wide emissions reductions is forecast to lead to accelerated
exits of existing fossil fuel consumption in the electricity sector, and hydrogen is used to replace up to 20% of
the domestic natural gas demand by 2040. Significant growth in green hydrogen consumption is expected in
this scenario beyond 2040 (outside the GSOO forecast horizon) to enable deeper emissions reductions. In this
scenario, the hydrogen is assumed to be produced from grid-connected electrolysers. The impacts this will
have on the electricity sector will be explored further in AEMO’s 2021 Electricity Statement of Opportunities
(ESOO) and 2022 ISP.
From a gas sector perspective, key differences to the Central scenario include:
• Faster technological improvements and more aggressive emissions reduction targets leading to faster
fuel-switching away from fossil fuels.
• Emissions reductions efforts driven by fuel-switching, energy efficiency improvements, and replaced
end-use demand from hydrogen substitution.

© AEMO 2021 | Gas Statement of Opportunities 17
• Higher population and economic growth, leading to higher energy consumption up until 2030.
• Greater uptake of electric and fuel-cell vehicles.
• Natural gas consumption from ammonia, steel, and oil refineries being assumed to switch to
electrolyser-produced hydrogen by 2040.
• The distribution grid being assumed to switch to 10% blended hydrogen (by energy) by 2038.
• Electricity sector infrastructure consistent with the 2020 ISP’s actionable ISP projects (excluding those with
decision rules) and Future ISP projects timed with the least-cost development path for the Step Change
scenario.
Figure 4 demonstrates the assumed hydrogen impact on natural gas consumption25, extending the horizon
out to 2050 to show the projected rapid acceleration of change forecast for the 2040s. See Appendix A1 for
more detail on the consultation process and hydrogen demand assumptions for this scenario.
Figure 4 Assumed hydrogen impact on natural gas consumption, 2021-50 (petajoules [PJ])
Low Gas Price
The Low Gas Price sensitivity explores the impact of lower gas prices on gas consumption from residential,
commercial, and industrial consumers, in addition to gas-powered generation of electricity (GPG). This
sensitivity exclusively focuses on the impact of lower gas prices on consumption; it makes no specific
assumptions in relation to the impact of other policy initiatives that could impact growth in consumption.
The sensitivity reflects the settings of the Central scenario, including the assumed changes in electricity sector
infrastructure.
Lower gas prices alone (with prices at the Wallumbilla Hub ranging from $5.90/gigajoule [GJ] to $6.70/GJ) are
forecast to provide some increases in gas consumption, mainly through increased GPG usage. Surveys of
existing major large industrial loads indicate that gas pricing alone would not be a sufficient driver for major
industrial investment for these users at this time.
25 AEMO consulted with stakeholders on the appropriate scale and timing of the hydrogen sector’s development in this scenario in a bespoke hydrogen
workshop, as well as in AEMO’s monthly Forecasting Reference Group (FRG) open forum. See Presentation 2, FRG Meeting pack 35, September 2020, at
https://aemo.com.au/en/consultations/industry-forums-and-working-groups/list-of-industry-forums-and-working-groups/forecasting-reference-group-
frg.
0
100
200
300
400
500
600
700
2021
2022
2023
2024
2025
2026
2027
2028
2029
2030
2031
2032
2033
2034
2035
2036
2037
2038
2039
204
0
204
1
204
2
204
3
204
4
204
5
204
6
204
7
204
8
204
9
2050
Annual co
nsu
mp
tio
n (
PJ)
Net Natural Gas Consumption Hydrogen in Distribution Grid Industrial Hydrogen Consumption
Increasing
displacement
of
natural gas
with
hydrogen

© AEMO 2021 | Gas Statement of Opportunities 18
1.2.1 Additional sensitivities
In some sections of this report, AEMO used targeted sensitivity analysis to explore the impact of variances in
GPG demand on gas supply adequacy. Specific sensitivities are included within the assessment of gas
consumption for GPG in Section 2.2.4, and include electricity infrastructure outages, weather variance, and
delayed connections of new renewable energy generation. Forecasting gas consumption for GPG is
challenging because it is driven by events, such as extreme weather or generation outages, that can be
difficult to predict and which lead to significant variations in forecasts. Appendix A2 compares AEMO’s GPG
forecast accuracy against actual consumption, and highlights that all recent forecasts have underestimated
consumption, due to a number of events that have resulted in higher GPG than that forecast.
1.3 Improvements for the 2021 GSOO
As part of continuous improvement, AEMO has applied improvements to the data and models used in this
2021 GSOO to better represent the existing system and future developments. These included:
• Migrating from using transmission survey data to Gas Bulletin Board (GBB) data for actual consumption for
large industrial users. This improved the accuracy of large industrial load (LIL) forecasts. Greater
information and transparency from the survey process has also led to improvements in forecasting
Tasmanian peak demands.
• Reflecting the high uncertainty associated with COVID-19. AEMO added a 95/5 confidence interval on the
Tariff V (residential and small commercial) consumption forecasts in the first forecast year between
Hydrogen (applying a +5% interval) and Slow Change (applying a -5% interval), with Central (and Low Gas
Price sensitivity) taking the model average value. This short-term consumption range is less about the
uncertainties represented through scenario drivers, and more about capturing the breadth of potential
outcomes that may particularly affect residential and commercial gas consumption and demand.
• The use of affine linear heat rates curves rather than constant average heat rates to estimate GPG
consumption. This approach improves the accuracy of forecast and historical consumption for GPG, and
has been applied to 2020 estimate and the 2021 GSOO forecast.
1.4 Supplementary information
Supporting material including supply input data files, methodology reports, and figures and data is available
on AEMO’s website26, along with previous GSOO reports. The supply input data files provide information
(including capacity) about pipelines, production facilities, storage facilities, field developments, and any new
projects or known upgrades considered in this GSOO analysis. These files also provide an update of reserves
and resources and cost estimates used for the GSOO modelling27.
Other relevant reference materials are listed in Table 2 below.
Table 2 Other relevant reference materials
Information source Website address and link
2021 Victorian Gas Planning Report https://www.aemo.com.au/energy-systems/gas/gas-
forecasting-and-planning/victorian-gas-planning-report
Demand forecasting data portal http://forecasting.aemo.com.au
Gas Bulletin Board – Map and Reports https://www.aemo.com.au/energy-systems/gas/gas-bulletin-
board-gbb
26 At https://aemo.com.au/en/energy-systems/gas/gas-forecasting-and-planning/gas-statement-of-opportunities-gsoo.
27 The published file showing reserves and resources was produced by Wood Mackenzie

© AEMO 2021 | Gas Statement of Opportunities 19
Information source Website address and link
2020 Inputs, Assumptions and Scenarios Report, and
Excel Workbook
https://www.aemo.com.au/energy-systems/major-
publications/integrated-system-plan-isp/2022-integrated-
system-plan-isp/current-inputs-assumptions-and-scenarios
BIS Oxford Economics, 2020 Macroeconomic forecasts* Economic forecasts applied following 2020 COVID-19
update:
https://aemo.com.au/-
/media/files/electricity/nem/planning_and_forecasting/inputs-
assumptions-methodologies/2021/bis-oxford-economics--
macroeconomic-forecasts-update-october-2020.pdf?la=en
Original economic forecasting report:
https://aemo.com.au/-
/media/files/electricity/nem/planning_and_forecasting/inputs-
assumptions-methodologies/2020/bis-oxford-economics-
macroeconomic-projections.pdf
* In developing the forecasts for the GSOO, AEMO applied the October 2020 COVID-19 updated economic forecasts provided by BIS
Oxford Economics. This update was an incremental update to the economic variables; the original report has a complete description of
the methodologies deployed by BIS Oxford.

© AEMO 2021 | Gas Statement of Opportunities 20
2. Gas consumption and demand forecasts
This chapter outlines forecasts of the annual quantity of gas used (consumption) and the maximum daily
quantity of gas consumed (demand) across the various customer sectors of gas. These gas demand forecasts
for the 2021 GSOO are available on the AEMO Forecasting data portal28.
Key forecast trends
• Annual gas consumption in the next 20 years is uncertain, with downside risks outweighing the
likelihood of gas consumption growth. Across AEMO’s scenarios, while the Central outlook is for a
relatively flat trajectory of gas consumption, alternative scenarios show decline, either from economic
decline and closure risks, or through fuel substitution towards hydrogen fuel sources.
- In the next five years, reduced consumption is forecast from energy efficiency savings,
fuel-switching, and declining GPG consumption (at an annual measure) with increasing variable
renewable energy (VRE) generation entering the National Electricity Market (NEM). Industrial
closures remain possible under extended weak economic conditions. Furthermore, while energy
costs continue to be a key issue for large gas users, reduced gas prices alone are not expected to
lead to significant increased gas consumption, particularly from industrial consumers.
- Increasing investments in energy efficiency and fuel-switching are forecast to lower consumption,
moderating the growth that will naturally occur through new gas connections (except in the
Australian Capital Territory, where new gas connections are banned).
- To 2040, the potential for fuel substitution towards hydrogen29 (and blending) is increasing. In the
scenarios considered, gas consumption in the industrial sector is assumed to be the first impacted
by hydrogen fuel substitution in the next 20 years.
• Daily gas demand is highly seasonal, and southern states in particular have significant variation from
heating appliance loads in winter. By 2030, GPG daily peak demand for gas may switch from being
summer peaking to winter peaking, further exaggerating differences between summer and winter
daily gas demand in southern states.
• GPG retains a critical role in meeting electricity demand during high temperatures in summer or low
VRE periods in winter. GPG demand is frequently event-driven, and AEMO forecasts continued
volatility in GPG demand, heavily dependent on the operation of coal, hydro, and renewable energy
generators. Delays or deferral in developing new generation and transmission capacity, or earlier than
expected closure of coal-fired generation, are forecast to increase annual GPG consumption.
28 At www.forecasting.aemo.com.au – select ‘GSOO 2021’ from the publication drop-down.
29 As forecast by various publications, including the Energy Networks Australia’s Gas Vision 2050 publication, at https://www.energynetworks.com.au/
projects/gas-vision-2050/.

© AEMO 2021 | Gas Statement of Opportunities 21
2.1 Total eastern and south-eastern gas consumption forecasts
Figure 5 shows the 20-year total consumption forecast for eastern and south-eastern gas markets under the
Central scenario, broken down by consumer types. In the Central scenario, to 2040:
• The LNG sector is forecast to remain flat; by 2040 gas consumption for LNG is assumed to be only
79 petajoules (PJ) higher than the 2020 actual consumption of 1,338 PJ.
• Industrial consumption is forecast to remain stable through to 2040, at around 256 PJ.
• The residential/commercial forecast is also stable through to 2040, and is forecast to be approximately
195 PJ by the end of the 20-year horizon.
• GPG is a volatile consumer of gas, as it provides a firming function to fill periods of low VRE production,
and can substitute for lost coal-fired generation during periods of outages (planned or unplanned), as
detailed in Section 2.2.4.
- The downward GPG consumption trend over recent years is projected to continue and accelerate in
the next five years as more VRE projects come online to meet various state renewable energy targets.
- By 2040, GPG consumption across scenarios is forecast to be between 70 PJ and 90 PJ, which is 30% to
45% lower than the 127 PJ consumed in 2020.
Figure 5 Gas consumption actual and forecast, all sectors, Central scenario, 2014-40 (PJ)
Figure 6 compares the consumption forecasts of each scenario presented in the 2021 GSOO, showing the
spread of outcomes, including comparisons to comparable 2020 GSOO forecasts (Central and Slow Change
scenarios). For most consumer types, the forecast consumption in this 2021 GSOO, by scenario, is consistent
with the 2020 GSOO forecast. The material difference between the 2020 and 2021 GSOO forecasts in the Slow
Change scenario is explained in Chapter 2.2.3.
Individual consumption forecasts for each state are provided on AEMO’s National Electricity and Gas
Forecasting portal30. This portal also allows the user to drill through each state’s component forecasts.
30 At http://forecasting.aemo.com.au.
0
200
400
600
800
1,000
1,200
1,400
1,600
1,800
2,000
2014
2015
2016
2017
2018
2019
2020
2021
2022
2023
2024
2025
2026
2027
2028
2029
2030
2031
2032
2033
2034
2035
2036
2037
2038
2039
204
0
Annual co
nsu
mp
tio
n e
xcl.
UA
FG
(P
J)
Industrial Residential/Commercial GPG LNG 2020 GSOO

© AEMO 2021 | Gas Statement of Opportunities 22
Figure 6 Total gas consumption actual and forecast, all sectors, compared to 2020 GSOO scenarios, 2014-40 (PJ)
Figure 7 shows only the domestic market, excluding LNG exports, so domestic trends are easier to identify.
The figure demonstrates that:
• Across the scenario forecasts, domestic gas consumption decline is more likely than growth, as consumers
invest in measures to increase energy efficiency, including switching away from gas consumption.
• Hydrogen production and blending within distribution networks may present a strong offset for gas
production needs, but the scale and timing of this possible alternative fuel is highly uncertain. Industrial
processes that currently use gas may be first candidates for conversion to hydrogen fuels.
• Dispersion of 2021 GSOO consumption forecasts across scenarios increases over time, highlighting
increasing future gas sector uncertainty.
Figure 7 Domestic gas consumption actual and forecast, excluding LNG exports, compared to 2020 GSOO scenarios, 2014-40 (PJ)
0
500
1,000
1,500
2,000
2,5002014
2015
2016
2017
2018
2019
2020
2021
2022
2023
2024
2025
2026
2027
2028
2029
2030
2031
2032
2033
2034
2035
2036
2037
2038
2039
204
0Annual co
nsu
mp
tio
n e
xcl.
UA
FG
(PJ)
Actual 2021 GSOO Central 2021 GSOO Hydrogen
2021 GSOO Low Gas Price 2021 GSOO Slow Change 2020 GSOO Central
2020 GSOO Slow Change
0
100
200
300
400
500
600
700
2014
2015
2016
2017
2018
2019
2020
2021
2022
2023
2024
2025
2026
2027
2028
2029
2030
2031
2032
2033
2034
2035
2036
2037
2038
2039
2040
Annual co
nsu
mp
tio
n e
xcl.
UA
FG
(P
J)
Actual 2021 GSOO Central 2021 GSOO Hydrogen
2021 GSOO Low Gas Price 2021 GSOO Slow Change 2020 GSOO Central
2020 GSOO Slow Change

© AEMO 2021 | Gas Statement of Opportunities 23
Other key highlights include:
• The 2021 Slow Change scenario reflects a lower forecast domestic consumption of 431 PJ by 2040,
compared with 549 PJ in the Central scenario (a difference of over 21%), driven by fewer connections, less
economic activity, and industrial closure risks. This reflects a similar trend to the 2020 GSOO, although
forecast consumption is almost 10% lower by 2040. This change is largely driven by lower GPG
consumption forecasts in this year’s Slow Change scenario which is due to greater assumed uptake of
electricity storages both at consumer premises, and at grid-scale, compared to the 2020 GSOO.
• The 2021 Hydrogen scenario has approximately 20% lower forecast consumption by 2040 than for the
Central scenario, and even lower than the 2021 Slow Change domestic forecast. The scenario captures
greater domestic fuel-switching to hydrogen (pure hydrogen or blended with natural gas), and also
reflects increased electricity demand flexibility from electrolyser facilities, reducing reliance on GPG to firm
VRE resources, explained further in Section 2.2.4.
• The Low Gas Price sensitivity demonstrates that gas prices alone are unlikely to lead to significant
increases in gas consumption, with only marginal increases in domestic consumption forecast relative to
the scale of reductions observed across other scenarios. GPG and residential and commercial consumers
are forecast to provide a marginal response to lower prices, but industrial consumers (as surveyed) would
need more than just low gas prices to stimulate growth and development.
2.1.1 Trends in consumption drivers
Economic and population outlook
AEMO engaged BIS Oxford Economics (BIS Oxford) to develop long-term economic forecasts for each
Australian state and territory as a key input to AEMO’s demand forecasts.
Impacts of COVID-19
The COVID-19 pandemic continues to bring an unprecedented level of near-term uncertainty around the
international and domestic economic outlook. While the initial impact on the Australian economy was less
severe than anticipated, a slower rebound is expected across all key indicators.
Diverging industry trends mean some regions are already seeing signs of recovery while others are expected
to experience a much more gradual return to trend. New South Wales and Victoria are expected to be the
worst affected, both due to their greater reliance on the services sector, and to being the states most affected
by social and economic lockdowns. Although the projected shock to the services sector was neutralised by
significant public sector growth, particularly in public administration and health services, the sector is
projected to contract by 2.8% in 2020-21.
As 2021 progresses, government spending is expected to slow and private sector activity is expected to
remain limited due to lingering restrictions and low consumer confidence. Estimates of how COVID-19 has
impacted gas consumption are discussed in Section 2.2.
Gross State Product and industrial production
In the short term (0-5 years), Gross State Product (GSP) is forecast to grow at 2.2% annually on average
across eastern and south-eastern Australia in the BIS Oxford Central case (used for AEMO’s 2021 GSOO
Central scenario and Low Gas Price sensitivity), prompted by government expenditure, loose monetary policy,
and the anticipated easing of COVID-19 restrictions.
GSP is then forecast to transition to a long-term (10-20 years) average annual growth rate of 2.3%, supported
by demographics. The loss of migration in 2020-21 is not expected to be recovered in subsequent years,
prompting GSP forecasts to be cumulatively lower in all scenarios in the long term compared to the 2020
GSOO.
The manufacturing sector, which consumes a large proportion of domestic gas, is projected to continue to
decrease as a proportion of economic output in the long term.

© AEMO 2021 | Gas Statement of Opportunities 24
Population and connections
Updated population forecasts reflect a slower re-opening of international borders, with ‘normal’ international
mobility not expected at least until 2021-22. Birth rates have also been revised down slightly, as a marginally
older population with reduced immigration is forecast to slow natural population growth. The combined
impact of these factors leads to permanently lower levels of population by 2040 in the Central scenario
relative to the same outlook in 2020.
While projected population growth is lower, AEMO’s updated connections forecast presents a marginal
increase relative to the 2020 GSOO, reflecting updated trends in construction activity and dwelling growth
rates. The Australian Bureau of Statistics (ABS) 2020 December release of building approvals showed a
seasonally adjusted estimate of an increase in building approvals of 10.9% in the last quarter of 2020.
Therefore, despite a slightly lower population outlook, 1.6 million additional households and commercial
businesses are forecast to be connected with gas by 2040, reaching 6.1 million connections – approximately
100,000 higher than the 2020 GSOO Central connections forecast. This growth is particularly apparent in
Victoria (primarily in the outer suburbs of Melbourne and Geelong) and New South Wales, with their higher
population bases. The forecast connections growth is after taking account of government policies tempering
growth in gas connections; for example, the Australian Capital Territory has reached a parliamentary
agreement31 to ban new residential gas connections.
Figure 8 compares the 2021 GSOO connections forecast with the 2020 GSOO connections forecast. Scenario
mapping for the connections forecasts is detailed in Table 1.
Figure 8 Residential and commercial connections actual and forecasts for eastern and south-eastern gas markets, by scenario and compared to the 2020 GSOO, 2020-40
Energy efficiency
Energy efficiency and gas to electric fuel-switching continue to show high potential to reduce future usage of
gas. Energy efficiency impacts are linked to current or planned energy efficiency schemes, as forecast for
AEMO by Strategy.Policy.Research in 2019,32 and updated to include an expansion of state-based schemes in
31 Refer to Appendix 1 of the Parliamentary Agreement of the 10th Legislative Assembly, at https://www.cmtedd.act.gov.au/__data/assets/pdf_file/0003/
1654077/Parliamentary-Agreement-for-the-10th-Legislative-Assembly.pdf.
32 Strategy.Policy.Research, Energy Efficiency Forecasts: 2019 – 2041: Final Report, July 2019, at https://www.aemo.com.au/-/media/Files/Electricity/NEM/%20
Planning_and_Forecasting/Inputs-Assumptions-Methodologies/2019/StrategyPolicyResearch_2019_Energy_Efficiency_Forecasts_Final_Report.pdf.
0
1
2
3
4
5
6
7
2014
2015
2016
2017
2018
2019
2020
2021
2022
2023
2024
2025
2026
2027
2028
2029
2030
2031
2032
2033
2034
2035
2036
2037
2038
2039
204
0
Nu
mb
er
of
Gas
Co
nn
ect
ion
s (m
illio
ns)
Actual 2020 GSOO Moderate Growth
2020 GSOO Lower Growth 2020 GSOO Higher Growth
2021 GSOO Moderate Growth 2021 GSOO Slower Growth

© AEMO 2021 | Gas Statement of Opportunities 25
Victoria33 and New South Wales34. In Victoria, these changes are projected to result in larger consumption
savings than the 2020 GSOO forecast for residential and commercial customers, and the addition of savings
for industrial customers35. Also in Victoria, new state budget measures are targeted to increase savings for
both small and large industrial gas users. Scenario mapping for the energy efficiency forecasts is detailed in
Table 1.
Figure 9 shows the prevailing trajectory of the forecast energy efficiency impacts in aggregate. The forecast
savings from expansion of the state-based schemes in Victoria are based on legislated targets to 2025 for the
VEU Program. While the scheme continues to 2030, the energy efficiency impact is forecast to taper off after
2025, as no targets have been legislated beyond this date.
Figure 9 Energy efficiency forecasts for eastern and south-eastern gas markets, by scenario and compared to the 2020 GSOO, 2020-40 (PJ)
Retail prices
Retail prices influence consumers’ use of gas, with wholesale gas prices representing the biggest driver for
retail prices. For this 2021 GSOO, AEMO engaged Lewis Grey Advisory36 (LGA) to update the forecast for
wholesale gas prices.
LGA applied a bottom-up approach to estimating gas prices, applying an updated view of production costs37
given the progression of some upcoming gas fields to production. An updated review of production costs
considered that undeveloped 2P resources38 were at a lower production cost than estimated in the 2020
33 Refer to Victorian Energy Upgrades - Future targets to support ambitious expansion, 8 December 2020, at https://www.energy.vic.gov.au/energy-
efficiency/victorian-energy-upgrades.
34 Refer to Energy Security Target and Safeguard Consultation Paper, April 2020, at https://energy.nsw.gov.au/media/2031/download.
35 The savings for the VEU Program are based on published targets to 2025.
36 Lewis Grey Advisory, Gas Price Projections for the 2021 GSOO, at https://aemo.com.au/-/media/files/electricity/nem/planning_and_forecasting/inputs-
assumptions-methodologies/2021/gas-price-projections-for-the-2021-gsoo-public-final-13-12-20.pdf?la=en.
37 The estimated production costs, reserves and resources were provided by Wood Mackenzie, at https://aemo.com.au/en/energy-systems/gas/gas-
forecasting-and-planning/gas-statement-of-opportunities-gsoo.
38 Gas reserves and resources are categorised according to the level of technical and commercial uncertainty associated with developing them. Reserves are
quantities of gas which are anticipated to be commercially recovered from known accumulations, and proved and probable (2P) is cons idered the best
estimate of commercially recoverable reserves. See Section 3.1.1.
-16
-14
-12
-10
-8
-6
-4
-2
0
Energ
y eff
icie
ncy
savi
ng
s (P
J)
GSOO 2021 Low GSOO 2021 Moderate GSOO 2021 High
GSOO 2020 Low GSOO 2020 Moderate GSOO 2020 High

© AEMO 2021 | Gas Statement of Opportunities 26
GSOO. Uncertain resources that need to be developed were conversely considered to have a higher
production cost than previously estimated, particularly in the southern fields.
The LGA approach considered increasing competition in the domestic market, a recalibration of the
proportion of oil-linked gas contracts considering updated information with the 2020 Australian Competition
and Consumer Commission (ACCC) Interim gas inquiry report, and an updated outlook for international oil
prices. The LGA forecast wholesale gas prices at the Wallumbilla Hub are shown in Figure 10.
Figure 10 Wholesale price forecasts at the Wallumbilla Hub, all scenarios and compared to the 2020 GSOO, 2020-40
Updated retail prices are being driven by lower wholesale costs across all regions, and to a lesser extent by
lower distribution costs and/or retail margins (depending on the region). Figure 11 compares the retail price
forecasts used for the 2021 GSOO and the 2020 GSOO across the eastern and south-eastern gas markets.
This figure includes the Low Gas Price sensitivity, and shows the relatively tight banding around all scenario
prices.
Figure 11 Residential retail price forecasts (Load weighted) for the East and South-East Coast, all scenarios and compared to the 2020 GSOO, 2020-40
0
2
4
6
8
10
12
2020
2021
2022
2023
2024
2025
2026
2027
2028
2029
2030
2031
2032
2033
2034
2035
2036
2037
2038
2039
2040
Who
lesa
le g
as
pri
ce f
ore
cast
at
Wallu
mb
illa ($)
2021 GSOO Central 2021 GSOO Slow Change
2021 GSOO Hydrogen 2021 GSOO Low Gas Price
2020 GSOO Central (translated to Wallumbilla)
0
5
10
15
20
25
30
35
40
2020
2021
2022
2023
2024
2025
2026
2027
2028
2029
2030
2031
2032
2033
2034
2035
2036
2037
2038
2039
2040
Resi
denta
il R
eta
il G
as
Pri
ce F
ore
cast
s
($2020/G
J, r
eal)
2020 GSOO Central 2021 GSOO Central 2021 GSOO Slow Change
2021 GSOO Low Gas Price 2021 GSOO Hydrogen

© AEMO 2021 | Gas Statement of Opportunities 27
Global LNG demand and international market dynamics
The COVID-19 pandemic reduced international demand for oil and gas as the world was impaired by social
and economic lockdowns, resulting in an oversupplied market for these products, including LNG39. Lower
spot prices have occurred as a result, both domestically and internationally. While there are signs of recovery
in the near term40, international LNG demand remains uncertain. LNG export volumes reached record levels
in 2020, but were lower than producers had forecast would occur prior to COVID-19.
2.2 Consumption forecasts by sector
This section discusses actual consumption in the past year and forecasts for consumption to 2040 in the
residential/commercial, industrial, and LNG sectors, and for GPG.
2.2.1 Residential and commercial consumption
Over the past year, comparing 2020 with 2019 data, commercial and residential consumption has grown by
3%, predominantly due to a cooler winter in Victoria, despite economic and social restrictions due to
COVID-19.
AEMO’s residential and commercial consumption forecasts use forward estimates of consumption on a per
connection basis. The forecast number and type of new connections therefore drive the growth trajectory,
subject to other behavioural influences, such as consumers’ response to pricing stimuli, appliance
fuel-switching, and broader energy efficiency impacts. A 95/5 confidence interval was included in the 2021
GSOO to account for the present uncertainty in consumption, with the lower estimate used for the Slow
Growth scenario, the upper band for the Hydrogen scenario, and the model mean for the Central scenario
and Low Gas Price sensitivity. This improvement is listed in Section 1.3.
In the Central scenario, residential and commercial consumption is projected to gradually decline from 194 PJ
to 190 PJ over the next five years, mostly due to energy efficiency measures. These savings are expected to
moderate, without additional investments, and consumption is projected to increase with the rate in new
connections, influenced by the forecast trend in retail prices.
Figure 12 Residential and commercial annual consumption actual and forecast, all scenarios and compared to 2020 GSOO, 2014-40 (PJ)
39 See https://www.mckinsey.com/industries/oil-and-gas/our-insights/how-covid-19-and-market-changes-are-shaping-lng-buyer-preferences.
40 See https://www.spglobal.com/platts/en/market-insights/latest-news/natural-gas/123020-commodities-2021-global-lng-to-continue-growth-trajectory-in-
2021-but-at-slower-pace#:~:text=S%26P%20Global%20Platts%20Analytics%20expects,offsets%20a%20decline%20in%20Europe.
0
50
100
150
200
250
2014
2015
2016
2017
2018
2019
2020
2021
2022
2023
2024
2025
2026
2027
2028
2029
2030
2031
2032
2033
2034
2035
2036
2037
2038
2039
204
0
Annual co
nsu
mp
tio
n e
xcl.
UA
FG
(P
J)
Actual 2021 GSOO Central 2021 GSOO Hydrogen
2021 GSOO Low Gas Price 2021 GSOO Slow Change 2020 GSOO Central
2020 GSOO Slow Change

© AEMO 2021 | Gas Statement of Opportunities 28
In the new 2021 GSOO Hydrogen scenario, forecast residential and commercial annual gas consumption is
higher in the next five years due to assumed stronger economic conditions, however in the following decade,
gas blending of hydrogen into the distribution network, combined with stronger energy efficiency and
fuel-switching, is forecast to lead to relatively flat gas consumption.
The outlook for the Low Gas Price sensitivity provides a slight uplift on residential and commercial
consumption forecasts above the Central scenario, due to behavioural responses that stimulate consumption
at a lower forecast retail price, and reduced fuel-switching from gas to electricity as the payback for such
investments are weaker at a lower gas price.
2.2.2 Industrial consumption
AEMO forecasts the consumption of the industrial sector based on two41 categories:
• Large Industrial Loads (LILs) – facilities are forecast individually, and include industries with consumption
greater than or approximately equal to 500 terajoules (TJ) per annum. This class represents over 70% of
total industrial sector consumption, and comprises primary metal, paper and chemical producers, oil
refineries, large food processors, mining, and on-site GPG42. AEMO forecasts this category individually.
• Small to Medium Industrial Loads (SMILs) – facilities are forecast in aggregate, incorporating customers
with consumption between 10 TJ and 499 TJ per annum at individual sites. This includes loads such as
food manufacturing, shopping centres, hospitals, and universities. Growth for these customers is forecast
to be slow in the long term, because newly connecting SMIL facilities on average use less gas than existing
industrial users of gas, as observed over the last decade.
Under the Central scenario, overall industrial consumption is projected to hold at 260 PJ to 2022, before
trending down to 250 PJ by 2026. This reflects variations in surveyed industrial customers’ expected
consumption across sectors, with slight reductions in mining loads and lowering SMILs following recent
trends, offsetting minor increases from sectors such as steel and food manufacturing. Figure 13 shows the
industrial consumption forecast for the Central scenario compared with other GSOO 2021 scenarios, and
comparable Central and Slow Change scenarios from the 2020 GSOO.
Figure 13 Industrial annual consumption actual and forecast, all scenarios and compared to 2020 GSOO, 2014-40 (PJ)
41 In the 2020 GSOO, AEMO labelled gas users whose consumption was between 500 TJ and 1,000 TJ as medium industrial loads. For consistency with the
ACCC, and based on an improved understanding of facility operations, AEMO is now labelling industrials larger than 500 TJ as Large Industrial Loads and
those below 500 TJ as Small to Medium Industrial Loads.
42 On-site GPG reflects embedded generation that is “behind the meter”, servicing the customer’s own load rather than the NEM at large. These facilities are
included in the LIL forecast category, rather than the GPG category.
0
50
100
150
200
250
300
2014
2015
2016
2017
2018
2019
2020
2021
2022
2023
2024
2025
2026
2027
2028
2029
2030
2031
2032
2033
2034
2035
2036
2037
2038
2039
204
0Annual co
nsu
mp
tio
n e
xcl.
UA
FG
(PJ)
Actual 2021 GSOO Central 2021 GSOO Hydrogen
2021 GSOO Low Gas Price 2021 GSOO Slow Change 2020 GSOO Central
2020 GSOO Slow Change

© AEMO 2021 | Gas Statement of Opportunities 29
In other scenarios:
• The softer economic environment (domestically and internationally) present in the Slow Change scenario
is reflected by applying industrial closures to those segments considered more exposed to deteriorating
business conditions.
• The availability of hydrogen is forecast to increase the opportunity for fuel-switching, with ammonia and
steel production, and oil refineries, considered most likely to adopt electrolyser-produced hydrogen as an
alternative fuel. Hydrogen blending within the distribution networks for smaller industrial loads may also
reduce gas consumption. AEMO forecasts a potential reduction in industrial consumption from these
offsets of 80 PJ by 2040 (31% lower consumption compared with today), even with increased energy
consumption due to stronger economic conditions.
• The Low Gas Price sensitivity includes lower gas prices, but surveyed industrials considered that lower
prices alone would not result in a strong enough incentive to trigger new investment. They would,
however, reduce the risk of industrial closures. The sensitivity therefore captures only a marginal increase
in gas consumption from industrial consumers relative to the Central scenario, with some deferred
investment in energy efficiency measures.
2.2.3 LNG consumption
To produce LNG export forecasts, AEMO surveys LNG producers for their expected, minimum, and maximum
consumption over the next five years (and to 2040 where available). The same surveys also include
information about their expected production, to be used in determining the supply-demand balance. These
responses are linked; increased LNG exports will increase consumption, but will also likely result in
acceleration of production from the coal seam gas (CSG) fields43.
AEMO has forecast two LNG scenarios, applied across the GSOO scenarios in 2021:
• A central forecast based on expected consumption, used to assess gas adequacy in the Central scenario,
Hydrogen scenario, and Low Gas Price sensitivity.
- These consumption forecasts are approximately 20 PJ to 25 PJ per year lower than the 2020 GSOO
Central scenario forecast, due to reduced international LNG demand in response to COVID-19, but are
still expected to grow over 2021 and exceed 1,400 PJ per year.
• A lower forecast based on minimum expected consumption (minimum consumption levels required to
meet contractual obligations, based on survey responses), used to assess gas adequacy in the Slow
Change scenario.
- In this forecast, contracts that are due to expire in the forecast period were assumed to be renewed or
replaced, which was not assumed in the 2020 GSOO. This approach was adopted, and supported by
stakeholder feedback, to maintain existing margins of supply relative to LNG demand given the
continuation of production from existing, committed, and anticipated fields. For the years 2021 to 2028,
survey information indicated that that minimum consumption will also increase by approximately 20 PJ
per year, compared with forecasts from the 2020 GSOO.
This sector is expected to expand production of anticipated projects to match at least the contracted export
demand. A new Heads of Agreement between the Australian Government and the east coast LNG
companies44 is designed to ensure that gas above minimum LNG contract levels is offered to the domestic
market on competitive terms. In the modelling, AEMO therefore assumed Queensland LNG exporters will
redirect gas southwards when required if gas is available above minimum contracts, provided there is
sufficient pipeline capacity.
43 The CSG fields operate with many small wells and production can be increased or slowed based on annual well development.
44 Available at https://www.pm.gov.au/media/jobmaker-plan-secures-australias-domestic-gas-supply.

© AEMO 2021 | Gas Statement of Opportunities 30
LNG consumption in 2020 was 1,338 PJ, a 12 PJ increase on 2019 levels, but 77 PJ lower than the 2020 GSOO
forecast. As noted in Section 2.1.1, the sector has been affected by significant disruption in the international
market, with international gas prices being suppressed in 2020 (at least partially) as a response to COVID-19.
Figure 14 LNG annual consumption actual and forecast, all scenarios and compared to 2020 GSOO, 2014-40 (PJ)
2.2.4 GPG consumption
The long-term operation of GPG in the NEM is uncertain and highly dependent on the evolution of the NEM’s
generation technology mix, particularly VRE developments, coal-fired generation retirements45, and the
timing, location, and scale of new transmission infrastructure or augmentations in the NEM.
AEMO’s 2020 ISP forecast reducing annual consumption of gas for GPG, but emphasised the importance of
flexible and firm energy supplies to respond to sudden changes in the supply/demand balance and effectively
manage renewable generation variability. The 2021 GSOO assumed electricity interconnector development in
line with the 2020 ISP46, with similar projections for the development of generation capacity.
Strategic bidding behaviour of generators is also a key driver of GPG. GPG dispatch volumes will depend on
participants’ actual bidding strategies, and how they change over time as the portfolio of generation changes
to incorporate more VRE. AEMO uses a bidding model (trained on past portfolio behaviour) to develop
possible future operations in the NEM. This model takes account of the availability of VRE that operates at
relatively low cost but is subject to weather variability, while respecting the technical capabilities of all
generator technologies to respond to demand and supply variations.
With increasing VRE, GPG operation will also depend highly on weather, as GPG represents some of the most
flexible existing technology available to firm VRE or meet extreme electricity demand. Power system events
such as transmission and generation failures have also often been major drivers of periods of elevated GPG,
as explained in Appendix A2. Due to its flexibility, GPG – particularly open-cycle gas turbines (OCGTs) and
reciprocating engines – is well positioned to cover for sudden electricity demand-supply imbalances.
45 The GPG forecast does not include the recent announcement from Energy Australia that it would close the Yallourn power station mid-2028; earlier than
previously expected. The impact of this announcement on GPG consumption will depend on what, if any, new firming capacity is developed in response.
46 2020 ISP, at https://aemo.com.au/en/energy-systems/major-publications/integrated-system-plan-isp/2020-integrated-system-plan-isp. Each scenario
applies the actional ISP projects without decision rules, and the least-cost optimal pathway of the respective scenario longer term. For the Hydrogen
scenario, the Step Change developments have been applied.
0
300
600
900
1,200
1,500
2014
2015
2016
2017
2018
2019
2020
2021
2022
2023
2024
2025
2026
2027
2028
2029
2030
2031
2032
2033
2034
2035
2036
2037
2038
2039
204
0
Annual co
nsu
mp
tio
n e
xcl.
UA
FG
(PJ)
Actual 2021 GSOO Central/Hydrogen/Low Gas Price
2021 GSOO Slow Change 2020 GSOO Central
2020 GSOO Slow Change
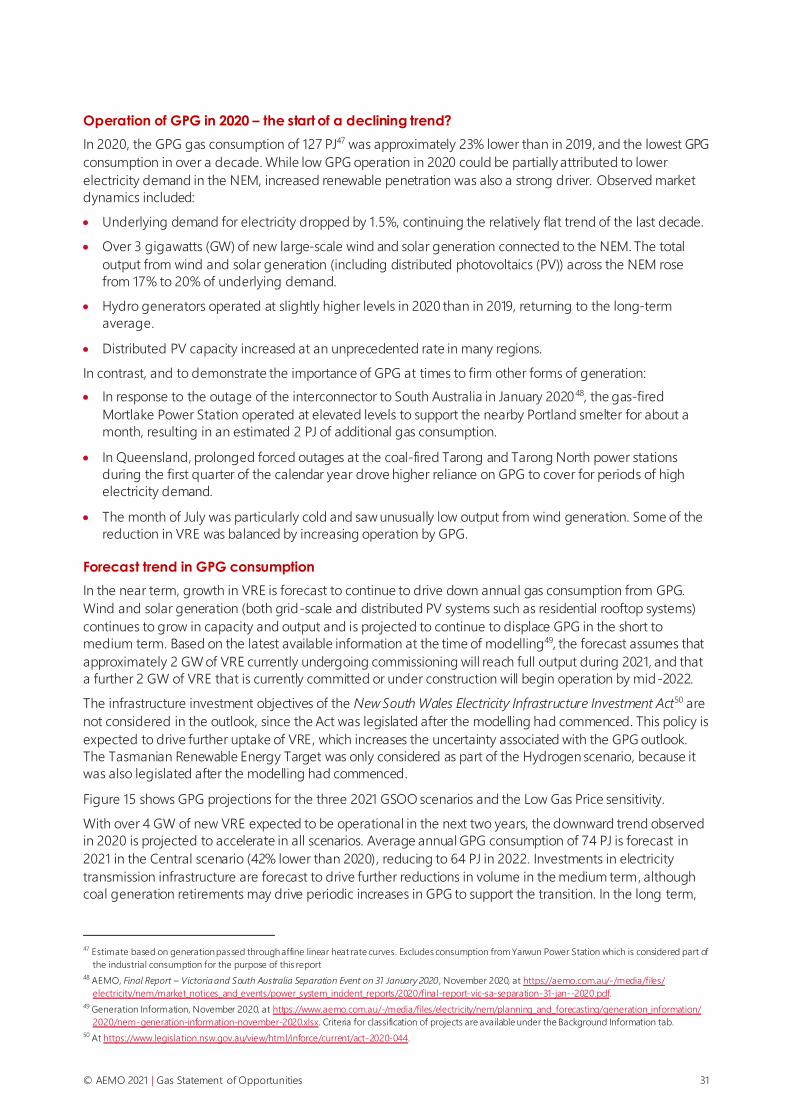
© AEMO 2021 | Gas Statement of Opportunities 31
Operation of GPG in 2020 – the start of a declining trend?
In 2020, the GPG gas consumption of 127 PJ47 was approximately 23% lower than in 2019, and the lowest GPG
consumption in over a decade. While low GPG operation in 2020 could be partially attributed to lower
electricity demand in the NEM, increased renewable penetration was also a strong driver. Observed market
dynamics included:
• Underlying demand for electricity dropped by 1.5%, continuing the relatively flat trend of the last decade.
• Over 3 gigawatts (GW) of new large-scale wind and solar generation connected to the NEM. The total
output from wind and solar generation (including distributed photovoltaics (PV)) across the NEM rose
from 17% to 20% of underlying demand.
• Hydro generators operated at slightly higher levels in 2020 than in 2019, returning to the long-term
average.
• Distributed PV capacity increased at an unprecedented rate in many regions.
In contrast, and to demonstrate the importance of GPG at times to firm other forms of generation:
• In response to the outage of the interconnector to South Australia in January 202048, the gas-fired
Mortlake Power Station operated at elevated levels to support the nearby Portland smelter for about a
month, resulting in an estimated 2 PJ of additional gas consumption.
• In Queensland, prolonged forced outages at the coal-fired Tarong and Tarong North power stations
during the first quarter of the calendar year drove higher reliance on GPG to cover for periods of high
electricity demand.
• The month of July was particularly cold and saw unusually low output from wind generation. Some of the
reduction in VRE was balanced by increasing operation by GPG.
Forecast trend in GPG consumption
In the near term, growth in VRE is forecast to continue to drive down annual gas consumption from GPG.
Wind and solar generation (both grid-scale and distributed PV systems such as residential rooftop systems)
continues to grow in capacity and output and is projected to continue to displace GPG in the short to
medium term. Based on the latest available information at the time of modelling49, the forecast assumes that
approximately 2 GW of VRE currently undergoing commissioning will reach full output during 2021, and that
a further 2 GW of VRE that is currently committed or under construction will begin operation by mid-2022.
The infrastructure investment objectives of the New South Wales Electricity Infrastructure Investment Act50 are
not considered in the outlook, since the Act was legislated after the modelling had commenced. This policy is
expected to drive further uptake of VRE, which increases the uncertainty associated with the GPG outlook.
The Tasmanian Renewable Energy Target was only considered as part of the Hydrogen scenario, because it
was also legislated after the modelling had commenced.
Figure 15 shows GPG projections for the three 2021 GSOO scenarios and the Low Gas Price sensitivity.
With over 4 GW of new VRE expected to be operational in the next two years, the downward trend observed
in 2020 is projected to accelerate in all scenarios. Average annual GPG consumption of 74 PJ is forecast in
2021 in the Central scenario (42% lower than 2020), reducing to 64 PJ in 2022. Investments in electricity
transmission infrastructure are forecast to drive further reductions in volume in the medium term, although
coal generation retirements may drive periodic increases in GPG to support the transition. In the long term,
47 Estimate based on generation passed through affine linear heat rate curves. Excludes consumption from Yarwun Power Station which is considered part of
the industrial consumption for the purpose of this report
48 AEMO, Final Report – Victoria and South Australia Separation Event on 31 January 2020 , November 2020, at https://aemo.com.au/-/media/files/
electricity/nem/market_notices_and_events/power_system_incident_reports/2020/final-report-vic-sa-separation-31-jan--2020.pdf.
49 Generation Information, November 2020, at https://www.aemo.com.au/-/media/files/electricity/nem/planning_and_forecasting/generation_information/
2020/nem-generation-information-november-2020.xlsx. Criteria for classification of projects are available under the Background Information tab.
50 At https://www.legislation.nsw.gov.au/view/html/inforce/current/act-2020-044.
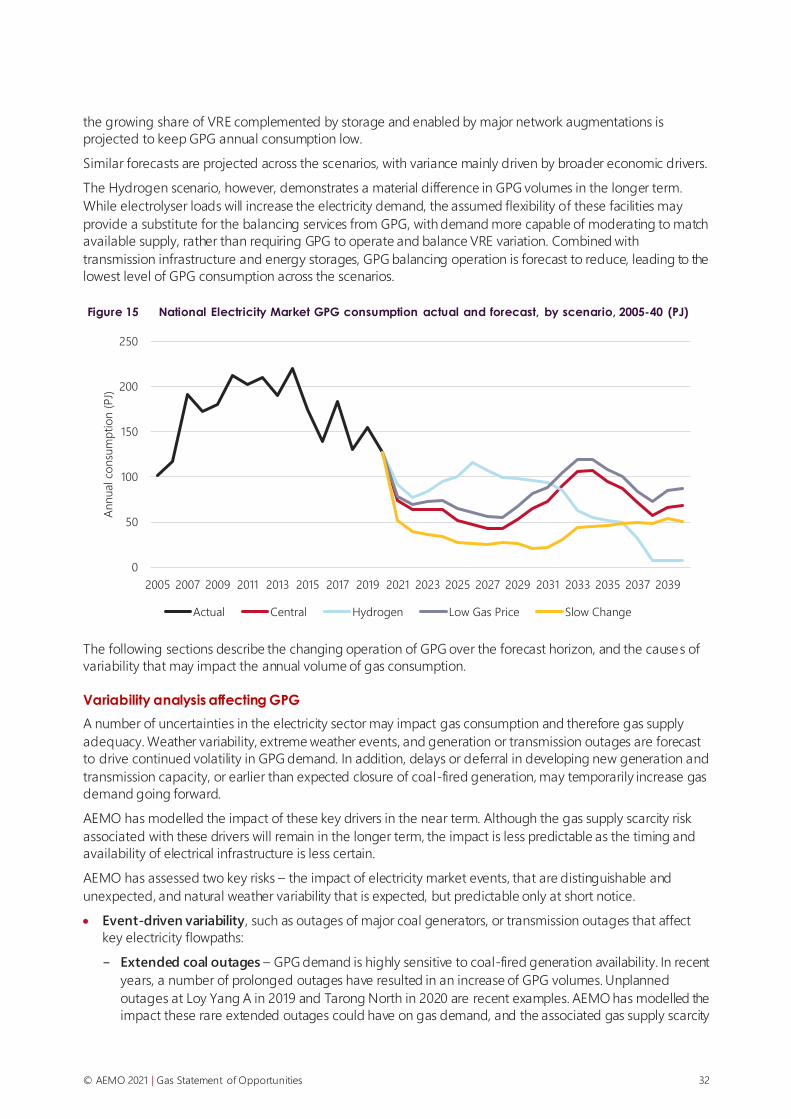
© AEMO 2021 | Gas Statement of Opportunities 32
the growing share of VRE complemented by storage and enabled by major network augmentations is
projected to keep GPG annual consumption low.
Similar forecasts are projected across the scenarios, with variance mainly driven by broader economic drivers.
The Hydrogen scenario, however, demonstrates a material difference in GPG volumes in the longer term.
While electrolyser loads will increase the electricity demand, the assumed flexibility of these facilities may
provide a substitute for the balancing services from GPG, with demand more capable of moderating to match
available supply, rather than requiring GPG to operate and balance VRE variation. Combined with
transmission infrastructure and energy storages, GPG balancing operation is forecast to reduce, leading to the
lowest level of GPG consumption across the scenarios.
Figure 15 National Electricity Market GPG consumption actual and forecast, by scenario, 2005-40 (PJ)
The following sections describe the changing operation of GPG over the forecast horizon, and the causes of
variability that may impact the annual volume of gas consumption.
Variability analysis affecting GPG
A number of uncertainties in the electricity sector may impact gas consumption and therefore gas supply
adequacy. Weather variability, extreme weather events, and generation or transmission outages are forecast
to drive continued volatility in GPG demand. In addition, delays or deferral in developing new generation and
transmission capacity, or earlier than expected closure of coal-fired generation, may temporarily increase gas
demand going forward.
AEMO has modelled the impact of these key drivers in the near term. Although the gas supply scarcity risk
associated with these drivers will remain in the longer term, the impact is less predictable as the timing and
availability of electrical infrastructure is less certain.
AEMO has assessed two key risks – the impact of electricity market events, that are distinguishable and
unexpected, and natural weather variability that is expected, but predictable only at short notice.
• Event-driven variability, such as outages of major coal generators, or transmission outages that affect
key electricity flowpaths:
- Extended coal outages – GPG demand is highly sensitive to coal-fired generation availability. In recent
years, a number of prolonged outages have resulted in an increase of GPG volumes. Unplanned
outages at Loy Yang A in 2019 and Tarong North in 2020 are recent examples. AEMO has modelled the
impact these rare extended outages could have on gas demand, and the associated gas supply scarcity
0
50
100
150
200
250
2005 2007 2009 2011 2013 2015 2017 2019 2021 2023 2025 2027 2029 2031 2033 2035 2037 2039
Annual co
nsu
mp
tio
n (
PJ)
Actual Central Hydrogen Low Gas Price Slow Change

© AEMO 2021 | Gas Statement of Opportunities 33
risk, through a sensitivity that includes an outage of a Victorian coal generation unit from April to
October inclusive.
- Major transmission outage – outages on key transmission flowpaths can result in elevated GPG
consumption. For example, higher volumes of GPG might be required in the southern regions should
South Australia separate again from the rest of the NEM due to an interconnector outage. AEMO has
modelled this risk by assuming the month-long February 2020 outage of the Heywood interconnector
(joining Victoria and South Australia) was repeated in June 2021. This timing was chosen to test the
impact of the outage during the peak season for gas consumption in Victoria.
• Weather variability – AEMO captures multiple weather patterns and conditions when forecasting GPG
(and gas adequacy). These weather conditions impact the output from wind, solar and hydro generators,
and commensurately impact thermal dispatch from coal and GPG. AEMO has also considered extreme
weather conditions, such as those experienced in 2006-07. This was one of the driest years on record,
reducing output from major hydro-electric generators in the NEM to 25% below the average, particularly
during winter and spring.
Figure 16 below demonstrates the annual GPG consumption variation from these uncertainties over the
longer-term forecast. These variations have been simulated independently. It is possible for more than one of
these events to occur in the same year, which would compound the impact on annual GPG consumption.
Weather variability and power system events such as electricity infrastructure outages will continue to be key
drivers of uncertainty in the long-term forecast. Higher reliance on VRE will increasingly expose the NEM to
weather variability, which drives a larger forecast range in GPG consumption over time, as can be seen in
Figure 16 below. It also drives a larger forecast range for daily GPG demand, as discussed in the next section.
Figure 16 Forecast variance in GPG consumption due to NEM events and weather variability, 2014-40 (PJ)
2.3 Maximum daily gas demand forecasts
Across Australia’s eastern and south-eastern gas system, maximum daily demand is strongly seasonal and
driven by heating demand in winter. Much of this variation comes from residential and commercial
consumers in the southern states, with a smaller influence due to industrial businesses.
Key regional observations in maximum daily gas demands (excluding GPG) are as follows:
0
50
100
150
200
250
2014
2015
2016
2017
2018
2019
2020
2021
2022
2023
2024
2025
2026
2027
2028
2029
2030
2031
2032
2033
2034
2035
2036
2037
2038
2039
204
0
An
nual co
nsu
mp
tio
n (
PJ)
Weather Variability Event Variability Actual Central Forecast
© AEMO 2021 | Gas Statement of Opportunities 34
• New South Wales is projected to steadily increase its maximum demand to the end of the forecast
horizon, driven mainly by the projected growth in connections, partially offset by investments in energy
efficiency and fuel-switching.
• Queensland demand is not strongly seasonal, unlike the other states, with much less penetration of gas
heating loads in residential and commercial premises. Queensland maximum demand is forecast to
decline to 2026, due to advised reductions in future industrial consumption, then to remain relatively
stable for the remainder of the forecast horizon, due to moderate industrial production and household
and commercial business consumption.
- LNG demand in Queensland has a small amount of seasonality, as production and exports tend to be
higher in summer months, aligned with the greater international demand during the northern
hemisphere winter.
• South Australia is expected to have a relatively flat daily maximum demand over the 20 years.
• An upwards trend is forecast for maximum demand in Tasmania. The projected increase is primarily
driven by forecast new connections growth in households and commercial businesses.
• Victoria is the state with the highest seasonal maximum demand, and therefore has the greatest reliance
on flexible and reliable gas infrastructure. Victorian winter maximum demand is projected to decline until
2025, due to improvements in energy efficiency. From the mid-2020s onwards, maximum gas demand is
expected to increase, as new gas connections are forecast to continue to grow (contributing to roughly a
0.5% increase in daily peak demand each year), while new investments in energy efficiency in gas-fuelled
appliances is assumed to slow.
Over the forecast horizon, compared to the 2020 GSOO, maximum daily demand forecasts are higher in
Victoria, South Australia, and Tasmania, but lower in New South Wales and Queensland. This is primarily due
to the net effect of revisions in drivers of daily gas demand, including:
• In New South Wales, residential and commercial peak daily demand has been shifting historically from late
June to early August over the past five years, resulting in lower coincident peak demand with LILs.
Assuming this trend continues, it is responsible for the relative shift down in maximum daily demand
across the forecast horizon. The underlying reason behind this shift is unclear, and could be due to a
variety of drivers including increased temperature fatigue, where consumers increase gas usage for
heating after sustained periods of cold weather, and/or behavioural changes unrelated to weather, like a
transition to a service economy (with more weather-sensitive load). This observed shift could also be
spurious or circumstantial, however this is unlikely.
• In Victoria, reduced consumption in the short term due to energy efficiency forecast revisions is driving up
to a 10% forecast reduction in maximum daily demand by 2025, compared to what was observed in 2020.
Increased consumption in the long term drives growth in daily demand, due to a growth in connections
and fewer ongoing energy efficiency improvements.
Table 3 and Table 4 show the seasonal forecasts for residential, commercial, and industrial maximum daily
gas demand in the Central scenario across the summer and winter seasons. These forecasts include
unaccounted for gas (UAFG) that is lost while being transported through the gas network.
Maximum daily demand is forecast with a probability of exceedance (POE), meaning the likelihood the
forecast will be met or exceeded. A 1-in-20 forecast is expected to be exceeded, on average, only once in 20
years, while a 1-in-2 forecast is expected, on average, to be exceeded every second year.
The tables show that:
• The difference between the 1-in-2 and 1-in-20 forecasts is smaller in Queensland and Tasmania than in
other regions. This is because Queensland and Tasmania are less sensitive to weather, having
proportionally higher demand from LILs.
• New South Wales, South Australia, and Victoria have a greater degree of weather sensitivity, due to the
proportionally higher residential and commercial demand. For example, on the maximum demand day,

© AEMO 2021 | Gas Statement of Opportunities 35
approximately 80% of the Victorian demand comes from residential and commercial customers, primarily
for heating.
Table 3 Total 1-in-2 and 1-in-20 forecast maximum demand, summer, all sectors excluding GPG, including UAFG (TJ a day [TJ/d])
NSW QLD (incl LNG) QLD (excl LNG) SA TAS VIC
1-in-2 1-in-20 1-in-2 1-in-20 1-in-2 1-in-20 1-in-2 1-in-20 1-in-2 1-in-20 1-in-2 1-in-20
2020* 251 4,331 330 94 19 410
2021 283 306 4,519 4,540 351 372 107 115 21 23 453 585
2023 285 309 4,537 4,558 351 372 108 116 21 23 442 571
2025 286 311 4,556 4,578 341 363 108 116 22 24 435 563
2030 288 312 4,537 4,556 322 341 108 116 22 24 442 573
2040 295 320 4,538 4,558 323 343 108 116 24 26 483 636
* The 2020 values show actual maximum demand.
Table 4 Total 1-in-2 and 1-in-20 forecast maximum demand, winter, all sectors excluding GPG, including UAFG (TJ/d)
NSW QLD (incl LNG) QLD (excl LNG) SA TAS VIC
1-in-2 1-in-20 1-in-2 1-in-20 1-in-2 1-in-20 1-in-2 1-in-20 1-in-2 1-in-20 1-in-2 1-in-20
2020* 438 4,347 346 147 21 1,213
2021 457 485 4,527 4,549 359 381 156 165 23 25 1,153 1,265
2023 463 489 4,545 4,566 359 380 158 166 23 25 1,124 1,237
2025 465 493 4,565 4,586 350 371 158 166 23 25 1,101 1,205
2030 468 497 4,546 4,565 331 350 158 167 24 26 1,144 1,252
2040 478 507 4,548 4,568 333 353 158 167 26 28 1,267 1,390
* The 2020 values show actual maximum demand.
Seasonal variance and extreme peaks
The most extreme southern daily gas demands observed each year typically only occur on a relatively small
number of days, when conditions compound to lead to very high utilisation of residential and commercial
heating appliances.
Figure 17 below demonstrates the historical volatility in gas demand in Victoria, which is the region with the
highest regional peak demand. The figure demonstrates the strong seasonality to the daily peak demands.
Industrial loads such as aluminium and chemical production, as well as some household and commercial
loads, such as cooking and hot water demand, operate consistently across the year. Over the winter months
(June to August in particular), additional gas is used for heating in households and business premises. On
average, winter peaks in Victoria are two to three times higher than summer peaks, due predominately to
heating load (see Table 3 and Table 4).
Figure 17 also highlights that the extreme peaks – for instance, the top five demand days – are on average
25% higher than an average winter day. The peak winter days are typically defined by a combination of high

© AEMO 2021 | Gas Statement of Opportunities 36
system demand and high GPG demand, depending on the degree of extreme conditions prevailing in both
the electricity and gas systems. This is further explored in Section 4.1.
On these days, demand side participation or controlled interruption of gas demand could help moderate
these peaks and maintain gas system security. Intermittent electrification through demand side participation
activities would only be a viable option if the extreme gas peaks are not driven by cold, still and foggy, or
overcast weather conditions that limit availability of VRE and therefore increase demand for gas for GPG (see
below for discussion of GPG daily demand).
Figure 17 Actual daily gas demand in Victoria since January 2019, showing seasonality and peakiness (TJ)
Source: Gas Bulletin Board (GBB).
GPG retains a critical role despite falling consumption
While annual gas consumption from GPG is forecast to decline significantly, GPG remains an important
source of peaking capacity for the NEM. Displacement of GPG by VRE is forecast to primarily impact
mid-merit generators such as combined-cycle gas turbines (CCGTs). In a grid with high VRE penetration, the
flexibility provided by GPG, particularly OCGTs and reciprocating engine units, is expected to play a key role
to help meet evening peak electricity demand once solar generation declines, or overnight under low wind
conditions.
Development of energy storage may enable energy shifting to cover low VRE operation periods, but storage
is unlikely to be able to cover all conditions during extended high electricity demand periods or wind
droughts, or to cover generator and/or transmission outages. AEMO forecasts that there will be a few hours
in most years in which almost all GPG units in a region will be generating to meet peak electricity demand.
GPG is forecast to remain a volatile contributor to total gas system peak demands. Table 5 and Table 6 below
demonstrate the range of winter and summer GPG daily demand outcomes observed at time of system
maximum daily demand in the 2021 GSOO forecasts, for the Central scenario. The range reflects variations in
utilisation of GPG to meet electricity demand on peak gas days under various future weather conditions
estimated by sampling across a collection of recent historical ‘reference’ years and assuming these historical
weather conditions were to be repeated in future. While GPG annual consumption is projected to decline, the
contribution that GPG may have to overall system peaks is expected to vary greatly, depending upon the
coincident availability of other forms of electricity generation within the NEM.
As shown in the tables, forecast outcomes provide risks of higher, and lower, GPG consumption on the peak
demand days than has been observed in 2020. GPG demand at time of daily maximum winter gas demand is
projected to decline in South Australia as new synchronous condensers are installed alleviating the need to
direct GPG on at times to maintain power system security. On the other hand, in New South Wales and
0
200
400
600
800
1,000
1,200
1,400
1/01/2019 1/07/2019 1/01/2020 1/07/2020
TJ
System Demand GPG Demand

© AEMO 2021 | Gas Statement of Opportunities 37
Queensland, daily GPG demand at times of daily maximum winter gas demand is projected to increase
significantly over the forecast horizon to cover periods of low VRE once coal-fired generation retires.
Coincident daily GPG demand has potential to be even higher in the event of wind or hydro droughts,
prolonged coal-fired generation outages, transmission outages, or extreme peak electricity demand. In the
gas sensitivities (discussed in previous section) the daily GPG demand was found to be up to 100 TJ a day
(TJ/d) higher in southern regions in 2023 than under the Central scenario. This could significantly increase the
risk and impact of shortfalls if supply-demand balance is tight, as the system would lack resilience to cope
with these high impact low probability events.
Table 5 Actual and forecast GPG daily demand range at the time of maximum gas demand, winter, Central, 1-in-20 year peak conditions (TJ/d)
NSW QLD** SA TAS VIC
2020* 91 228 314 19 65
2021 98-356 177-245 169-245 0-5 23-81
2023 129-173 188-260 184-227 1-6 25-100
2025 12-163 203-232 119-172 0-0 21-125
2030 111-283 202-254 147-248 0-2 35-98
2040 232-463 364-446 56-93 4-20 20-166
* The 2020 values show actual GPG consumption demand, estimated from the electricity dispatch observed on the peak day.
** For Queensland, the coincident peak GPG demand considers the peak demand from domestic consumption (residential and
commercial consumption, and GPG itself), and does not consider daily variations in LNG consumption.
Table 6 Actual and forecast GPG daily demand range at the time of maximum gas demand, summer, Central,1-in-20 year peak conditions (TJ/d)
NSW QLD** SA TAS VIC
2020* 179 266 300 6 299
2021 100-234 180-323 224-333 0-6 179-355
2023 110-202 147-232 186-273 0-0 0-203
2025 120-253 99-307 164-257 0-9 0-190
2030 61-205 190-229 143-244 0-13 0-169
2040 113-227 250-415 37-60 0-14 0-78
* The 2020 values show estimated, actual GPG consumption demand, estimated from the electricity dispatch observed on the peak day.
** For Queensland, the coincident peak GPG demand considers the peak demand from domestic consumption (residential and
commercial consumption, and GPG itself), and does not consider daily variations in LNG consumption.
Historically, GPG has operated with higher daily maximum gas consumption in summer than winter. From
around 2030, as additional coal retires and more VRE is installed in the NEM, the maximum daily GPG
demand is forecast to shift towards a higher winter daily maximum than in summer. In winter, when PV
generation is lower and coal-fired capacity may often be withdrawn for strategic maintenance, GPG is
projected to retain its critical role, with mid-merit generators needed to meet high energy demand over
longer timeframes. This is demonstrated in Figure 18 below.
The emergence of winter as the highest season for daily consumption of gas from GPG compounds the
seasonal variations in gas demand and demonstrates the continued need for flexible gas infrastructure to
meet the variable needs of gas consumers, particularly in the southern regions.

© AEMO 2021 | Gas Statement of Opportunities 38
Figure 18 Actual and projected maximum daily GPG demand by month in the southern states, 2019-40
Coincident southern daily peak demand may pose risk to system security
Maximum regional daily gas demands tend not to occur across the entire gas system at the same time, as the
weather extremes in New South Wales and Victoria in particular tend not to coincide. The maximum daily
demand is therefore measured and forecast at the regional level.
For instance, in 2023 the individual regional 1-in-2 winter peaks are 463 TJ, 158 TJ, 23 TJ and 1,124 TJ for New
South Wales, South Australia, Tasmania and Victoria, respectively. If all these regions were to peak
simultaneously, the total peak demand would be 1,768 TJ. By reflecting the weather diversity that has been
observed across the last 20 years, the forecast coincident 1-in-2 winter southern peak is 1,552 TJ, 12% lower
than if the regions peaked simultaneously. However, if the maximum daily demands were to coincide, even
under 1-in-2 year weather events, this analysis demonstrates that total southern maximum daily demand in
2023 could be up to 200 TJ higher than currently assumed in this 2021 GSOO.
To maintain gas system security, gas infrastructure needs to be able to manage high seasonal variations in
daily gas demand while retaining flexibility to cover high impact, low probability daily demand peaks that
could foreseeably occur.
Maximum daily demand trends follow regional consumption trends
The scenarios capture uncertainty across forecast connections, energy efficiency, energy prices, and emission
reduction ambitions, leading to variance in daily maximum demands. The regional maximum daily demand
variance across scenarios is generally consistent with the consumption forecast scenario variance, as both are
driven by the same underlying drivers.
In Victoria, the state with the highest maximum daily gas demand and greatest residential demand, peak day
gas demands are trending upwards in most scenarios, as seen in Figure 19, following policy-driven reductions
in the next five years. The trend is directionally similar to the residential and commercial annual consumption
trend (see Figure 8 and Figure 33). While not considered in the scenario collection for this year’s GSOO, a
scenario with greater electrification of residential heating (or other heating alternatives to gas) would drive
down Victoria’s maximum daily demand for gas much faster than currently forecast. This possibility will be
explored in more detail in future GSOOs, and AEMO’s 2022 Integrated System Plan.
0
100
200
300
400
500
600
700
800
900
1,000
Jan
Mar
May
Jul
Sep
No
v
Jan
Mar
May
Jul
Sep
No
v
Jan
Mar
May
Jul
Sep
No
v
Jan
Mar
May
Jul
Sep
No
v
2019 2020 2030 2040
So
uth
ern
Maxi
mu
m D
aily
GPG
Dem
and
(TJ/
day)
Actual GPG Demand Forecast GPG Demand (Central Scenario)
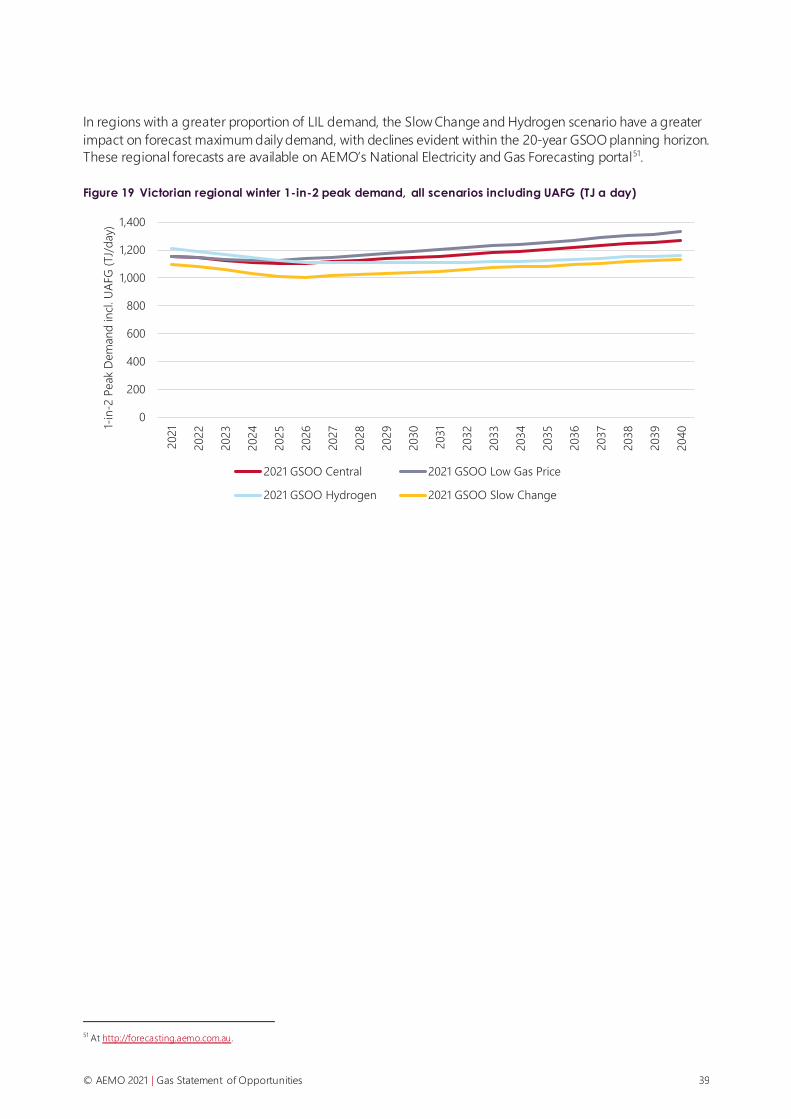
© AEMO 2021 | Gas Statement of Opportunities 39
In regions with a greater proportion of LIL demand, the Slow Change and Hydrogen scenario have a greater
impact on forecast maximum daily demand, with declines evident within the 20-year GSOO planning horizon.
These regional forecasts are available on AEMO’s National Electricity and Gas Forecasting portal51.
Figure 19 Victorian regional winter 1-in-2 peak demand, all scenarios including UAFG (TJ a day)
51 At http://forecasting.aemo.com.au.
0
200
400
600
800
1,000
1,200
1,400
2021
2022
2023
2024
2025
2026
2027
2028
2029
2030
2031
2032
2033
2034
2035
2036
2037
2038
2039
204
01-in
-2 P
eak
Dem
and
in
cl. U
AFG
(TJ/
day)
2021 GSOO Central 2021 GSOO Low Gas Price
2021 GSOO Hydrogen 2021 GSOO Slow Change

© AEMO 2021 | Gas Statement of Opportunities 40
3. Gas supply and infrastructure
This chapter provides an overview of the reserves, resources and production forecasts for supplies connected
to the eastern and south-eastern gas system, as well as an overview of the system’s midstream infrastructure
(that is, pipelines, storages, and LNG import terminals).
Key insights
• Traditional sources of flexible southern gas supply are declining faster than previously forecast,
particularly in terms of maximum daily production capacity.
- A major flexible gas supply source at Longford in Victoria’s Gippsland Basin is now projected by
the producer to be depleted ahead of winter 2023, one year earlier than forecast last year.
- Consequently, in 2023, the forecast maximum daily capacity from existing and committed reserves
is 10% lower than previous projections, even after accounting for newly committed supplies.
- Maximum daily production capacity forecast from existing, committed, and anticipated
developments is as much as 19% lower in winter 2023 than previously forecast.
• Developments over the last 12 months have seen an increase in committed annual production
compared with the 2020 GSOO, with almost all annual production anticipated in last year’s GSOO now
committed. However, southern annual production is still in decline, and the producers forecast very
little new anticipated production.
- The forecast upper bound on available annual southern production from existing, committed, and
anticipated projects is 11 PJ lower in 2022 than projected last year, and 16 PJ lower in 2023.
- The forecast upper bound on available annual southern production from existing, committed, and
anticipated projects is 43 PJ higher in 2024 than projected last year, with the anticipated Golden
Beach and other Gippsland Basin production primarily contributing to this increase.
• Estimates of the total volume of reserves that are considered to be both technically and economically
feasible (2P) have fallen by over 2,400 PJ (7%) compared with the 2020 GSOO. There is also a much
lower forecast of less certain 2C52 resources.
• As traditional sources of gas supply continue to decline, the reliance on gas pipelines and storages has
been increasing, and this trend is forecast to continue.
- There is a committed upgrade to the Moomba – Sydney Pipeline (MSP) that would increase the
operationally available capacity by approximately 40 TJ/d (to about 450 TJ/d) by winter 2021.
Even with this upgrade, the MSP is forecast to start limiting southwards peak supply flows as early
as 2023.
52 Contingent resources are not yet considered commercially viable; 2C is considered the best estimate of those sub-commercial resources. See Section 3.1.1.

© AEMO 2021 | Gas Statement of Opportunities 41
- Deep storages such as Iona Underground storage (UGS) have traditionally been relied on to meet
winter maximum gas demand. From 2017 through to 2019, the gas system each year successively
drew on more storage to help supply peak and seasonal demands.
• With the binding development agreement executed between Australian Industrial Energy (AIE) and
Jemena in March 202153, AEMO now considers the Port Kembla Gas Terminal (PKGT)54 to have
obtained all necessary approvals and to be ready to commence implementation. It is therefore
classified as a committed project for this GSOO. The PKGT will provide increased flexibility to offset
southern domestic production decline, increasing the capacity of the gas systems to support both
seasonal and peak supply needs.
3.1 Reserves, resources, and production facilities
Gas supply to consumers relies on continued investment to identify, prove, and then exploit gas reserves and
resources. AEMO’s production forecasts in the first five years of the outlook rely heavily on surveys of
producers to determine the available quantities of gas, the plans for extraction, and the capability and
capacity of the gas processing plant. When forecasting gas production, uncertainties on both technical and
commercial grounds must be considered.
To allow consistent comparison of the supply chain, AEMO applied the following project classifications55:
• Existing and committed – gas fields and production facilities that are already operating or have obtained
all necessary approvals, with implementation ready to commence or already underway.
• Anticipated – developers consider the project to be justified on the basis of a reasonable forecast of
commercial conditions at the time of reporting, and reasonable expectations that all necessary approvals
(such as regulatory approvals) will be obtained and final investment decision (FID) made.
• Uncertain – these projects are at earlier stages of development or face challenges in terms of commercial
viability or approval.
Under this classification structure, each project represents a specific investment decision, with an associated
quantity of recoverable gas reserves and resources, that may be more, or less, certain.
3.1.1 Reserves and resources
Gas developments are categorised according to the level of technical and commercial uncertainty associated
with recoverability. These uncertainties could include securing finance, obtaining government approvals,
negotiating contracts, overcoming geological challenges, or the quality/purity of the gas.
The following categories are applied across the industry:
• A gas reserve is a quantity of gas expected to be commercially recovered from known accumulations.
When estimating the existing, committed, and anticipated gas reserves, the best estimate values are
quoted as “proven and probable” (2P) reserves. When probabilistic methods are used, there should be at
least a 50% probability that the quantities actually recovered will equal or exceed the sum of estimated
proved plus probable reserves.
• Gas resources are defined as less certain, and potentially less commercially viable sources of gas. When
estimating these uncertain resources, the best estimate of contingent resources (2C) is used.
53 See https://jemena.com.au/about/newsroom/article/2021/more-gas-for-victoria-by-2023.
54 See https://ausindenergy.com/our-project.
55 Following stakeholder consultation, these classifications were implemented in the 2020 GSOO and were aligned with the Society of Petroleum Engineers –
Petroleum Resource Management System (PRMS) project maturity sub-classes.
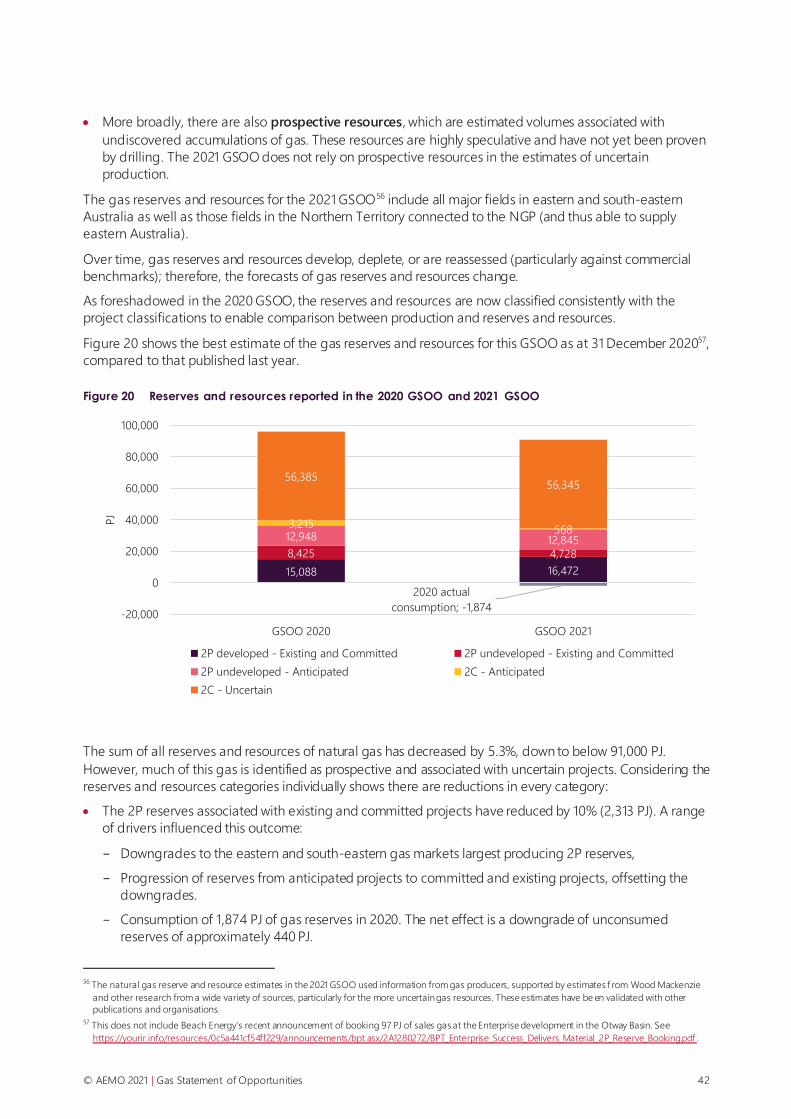
© AEMO 2021 | Gas Statement of Opportunities 42
• More broadly, there are also prospective resources, which are estimated volumes associated with
undiscovered accumulations of gas. These resources are highly speculative and have not yet been proven
by drilling. The 2021 GSOO does not rely on prospective resources in the estimates of uncertain
production.
The gas reserves and resources for the 2021 GSOO56 include all major fields in eastern and south-eastern
Australia as well as those fields in the Northern Territory connected to the NGP (and thus able to supply
eastern Australia).
Over time, gas reserves and resources develop, deplete, or are reassessed (particularly against commercial
benchmarks); therefore, the forecasts of gas reserves and resources change.
As foreshadowed in the 2020 GSOO, the reserves and resources are now classified consistently with the
project classifications to enable comparison between production and reserves and resources.
Figure 20 shows the best estimate of the gas reserves and resources for this GSOO as at 31 December 202057,
compared to that published last year.
Figure 20 Reserves and resources reported in the 2020 GSOO and 2021 GSOO
The sum of all reserves and resources of natural gas has decreased by 5.3%, down to below 91,000 PJ.
However, much of this gas is identified as prospective and associated with uncertain projects. Considering the
reserves and resources categories individually shows there are reductions in every category:
• The 2P reserves associated with existing and committed projects have reduced by 10% (2,313 PJ). A range
of drivers influenced this outcome:
- Downgrades to the eastern and south-eastern gas markets largest producing 2P reserves,
- Progression of reserves from anticipated projects to committed and existing projects, offsetting the
downgrades.
- Consumption of 1,874 PJ of gas reserves in 2020. The net effect is a downgrade of unconsumed
reserves of approximately 440 PJ.
56 The natural gas reserve and resource estimates in the 2021 GSOO used information from gas producers, supported by estimates f rom Wood Mackenzie
and other research from a wide variety of sources, particularly for the more uncertain gas resources. These estimates have be en validated with other
publications and organisations.
57 This does not include Beach Energy’s recent announcement of booking 97 PJ of sales gas at the Enterprise development in the Otway Basin. See
https://yourir.info/resources/0c5a441cf54ff229/announcements/bpt.asx/2A1280272/BPT_Enterprise_Success_Delivers_Material_2P_Reserve_Booking.pdf .
2020 actual
consumption; -1,874
15,088 16,472
8,425 4,728
12,948 12,845
3,215568
56,38556,345
-20,000
0
20,000
40,000
60,000
80,000
100,000
GSOO 2020 GSOO 2021
PJ
2P developed - Existing and Committed 2P undeveloped - Existing and Committed
2P undeveloped - Anticipated 2C - Anticipated
2C - Uncertain

© AEMO 2021 | Gas Statement of Opportunities 43
• Reserves associated with anticipated developments have reduced by over 17% (2,751 PJ). While there has
been a major shift of undeveloped 2P reserves from projects previously classified as committed, primarily
in northern regions, other projects and associated reserves have progressed from anticipated to
committed, and some projects are no longer considered anticipated due to downgrading of reserves from
2P to 2C by major producers.
• The resources associated with uncertain projects remained broadly constant with the estimates provided
for the 2020 GSOO.
3.1.2 Available annual production
Gas must be extracted and processed before it can be injected into pipelines for consumers. The rate of
production is determined by a variety of factors, including but not limited to:
• Capacity of the production plant, including maintenance and potential downtimes.
• Capacity of the additional processing plant (to manage specific impurities in the raw gas stream from the
gas field, such as mercury or CO2).
• Pressure in the gas well, determining the rate of flow, particularly for conventional gas.
• The drilling program to access gas pockets, particularly for CSG.
• The quality of the gas, particularly in terms of the need for additional processing.
Table 7 shows the annual forecast of available production from 2021 to 202558, provided to AEMO by gas
producers through the GSOO survey process. These estimates provide an upper bound on possible annual
production, with actual production relying on the quantity of gas demand for domestic consumption or
international exports. The total forecast existing, committed and anticipated available annual production is
lower than the available annual production forecast in the 2020 GSOO. Much of the reduction is attributable
to lower rates of drilling planned from northern producers.
Table 7 Forecast of available annual production as provided by gas producers, 2021-25 (PJ)
Commitment criteria 2021 2022 2023 2024 2025
North
(QLD / NT)
Existing and committed 1,599 1,586 1,554 1,462 1,371
Anticipated 0 29 111 180 226
Total 1,599 1,615 1,666 1,642 1,596
Difference from 2020 GSOO* -19 -96 -72 -47 N/A
South
(VIC / NSW /
SA^)
Existing and committed 467 445 406 377 321
Anticipated 0 0 25 39 22
Total 467 445 430 417 343
Difference from 2020 GSOO 4 -11 -16 43 N/A
Total east coast gas production 2,066 2,060 2,096 2,059 1,939
Difference from 2020 GSOO -15 -107 -88 -3 N/A
* The equivalent tables in the 2020 GSOO (Table 1 and Table 7) included a publication error. The error was limited to the published data
table, not the underlying analysis and modelling. The comparison in this table includes corrected 2020 production forecasts.
^ The Queensland component of the Cooper Eromanga basin appears in the South Australia category.
58 Few producers provide forecasts beyond the first five years for either the voluntary GSOO surveys or the mandatory (five -year) VGPR surveys. The 2021
GSOO has a modelling horizon out to 2040. For GSOO purposes, the producers’ last forecast values are projected forward, limited by the remaining
volume of gas in a reserve or resource.

© AEMO 2021 | Gas Statement of Opportunities 44
Figure 21 shows that while available annual southern production from existing and committed projects is
generally higher than was forecast in the 2020 GSOO, it is still forecast to decline over the next five years. The
commencement of PKGT will provide an offset to field production decline upon commissioning, however
continued decline in southern field production will likely challenge long-term supply-demand adequacy (as
highlighted in Section 4).
Figure 21 Forecast annual production from southern gas fields, 2021-25 (PJ)
In the north, existing and committed production from LNG producers is slightly higher than forecast in the
2020 GSOO, but anticipated projects are forecast to be developed more slowly over the next five years. This
slow down reflects the less favourable investment conditions associated with the COVID-19 pandemic’s
impacts on gas markets59. However, gas producers were surveyed for the 2021 GSOO before the rapid rise in
Asian LNG markets in early 2021, which may result in increased anticipated northern supply in future years.
For LNG producers, the GSOO assumes that rates of CSG development are well aligned with at least
minimum export contract levels and will be incentivised to flex with changes in the international outlook.
Domestic gas supplies are not diverted to meet export LNG contract volumes, but CSG production above
minimum LNG contract volumes could be redirected to help support domestic demand.
3.1.3 Maximum daily production capacity
The maximum daily production capacity defines the quantity of total gas that can be injected into the system
each day and how much may need to be extracted from storages (subject to the withdrawal capacity of
storage). This maximum daily production capacity is a key influence on the operation of the gas markets to
ensure sufficient gas is available to meet peak winter demands. For many facilities, the annual production
forecast is strongly proportional to the peak production capacity, as the processing plant may normally
operate near capacity, although this is not exclusively the case.
Producers forecast maximum daily production capacity to fall faster than annual available production in the
southern regions. Figure 22 highlights that in 2023, maximum daily production capacity from existing and
committed southern fields is forecast to be 10% lower than producers’ forecasts in the 2020 GSOO; including
anticipated production makes the relative reduction almost 20%. In contrast, available annual southern
production from existing, committed, and anticipated projects forecast for 2023 is less than 4% lower than
forecast in the 2020 GSOO.
59 See https://www.afr.com/companies/energy/origin-slashes-qld-drilling-as-soft-gas-market-bites-20201030-p569zh.
0
50
100
150
200
250
300
350
400
450
500
Annual p
rod
uct
ion (
PJ)
2021 2022 2023 2024 2025
Classification:
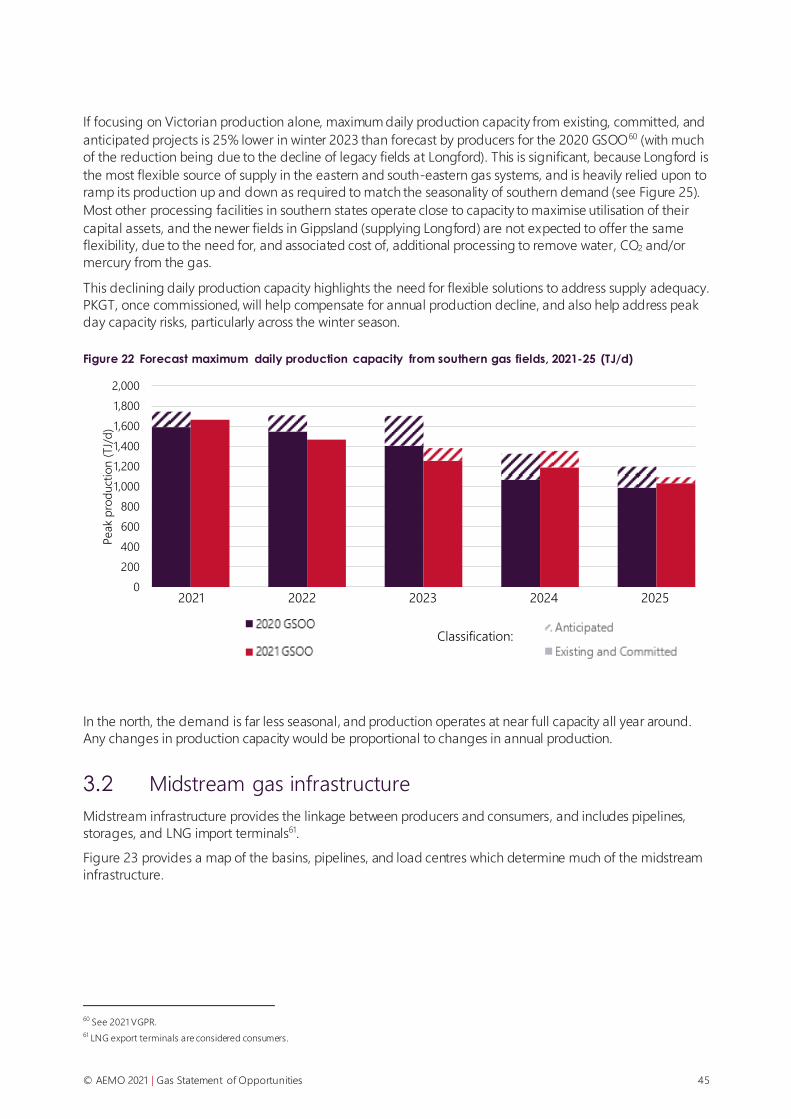
© AEMO 2021 | Gas Statement of Opportunities 45
If focusing on Victorian production alone, maximum daily production capacity from existing, committed, and
anticipated projects is 25% lower in winter 2023 than forecast by producers for the 2020 GSOO60 (with much
of the reduction being due to the decline of legacy fields at Longford). This is significant, because Longford is
the most flexible source of supply in the eastern and south-eastern gas systems, and is heavily relied upon to
ramp its production up and down as required to match the seasonality of southern demand (see Figure 25).
Most other processing facilities in southern states operate close to capacity to maximise utilisation of their
capital assets, and the newer fields in Gippsland (supplying Longford) are not expected to offer the same
flexibility, due to the need for, and associated cost of, additional processing to remove water, CO2 and/or
mercury from the gas.
This declining daily production capacity highlights the need for flexible solutions to address supply adequacy.
PKGT, once commissioned, will help compensate for annual production decline, and also help address peak
day capacity risks, particularly across the winter season.
Figure 22 Forecast maximum daily production capacity from southern gas fields, 2021-25 (TJ/d)
In the north, the demand is far less seasonal, and production operates at near full capacity all year around.
Any changes in production capacity would be proportional to changes in annual production.
3.2 Midstream gas infrastructure
Midstream infrastructure provides the linkage between producers and consumers, and includes pipelines,
storages, and LNG import terminals61.
Figure 23 provides a map of the basins, pipelines, and load centres which determine much of the midstream
infrastructure.
60 See 2021 VGPR.
61 LNG export terminals are considered consumers.
0
200
400
600
800
1,000
1,200
1,400
1,600
1,800
2,000
Peak
pro
duct
ion (
TJ/
d)
2021 2022 2023 2024 2025
Classification:

© AEMO 2021 | Gas Statement of Opportunities 46
Figure 23 Map of the basins and major pipelines and load centres in eastern and south-eastern Australian gas system

© AEMO 2021 | Gas Statement of Opportunities 47
As production and consumption patterns change, the requirements on the midstream infrastructure may also
change. For example, the reduction in southern maximum daily production capacity discussed above means
that, during periods of high demand, there will be greater reliance on withdrawals from southern storage
facilities such as Iona UGS, and pipelines to deliver supplies from the north. Furthermore, with the forecast
decline of Victorian maximum daily production capacity (particularly at Longford), Victoria will need to rely
more heavily on gas from outside the state, unless new local supply sources are secured. Without further
expansion, constraints on existing pipeline infrastructure, in particular the MSP and Victoria’s South West
Pipeline (SWP), may limit the delivery of gas from southern producers to southern customers during peak
demand periods, meaning other supply options would need to be used at such times.
In assessing gas adequacy, AEMO bases its modelling of midstream infrastructure on technical capability and
does not consider contracted positions62. The ACCC Gas Inquiry 2021 interim report provides valuable context
on potential implications of pipeline contracts63.
3.2.1 Major gas transmission and pipelines
Across the eastern and south-eastern gas system, there are a number of major pipelines that connect regions
or geographically separated supply and demand centres. For context, this chapter lists some of those major
pipelines, which are part of the supply-demand adequacy discussion in Section 4. This list is not trying to be
comprehensive or undermine the importance of other major pipelines.
Moomba – Sydney Pipeline (MSP)
The MSP connects the Moomba Gas Hub in northern South Australia to Sydney. It also intersects with the
Victorian Northern Interconnect (VNI) at Young, and therefore also provides for additional gas sharing with
Victorian consumers.
At present64, any gas flowing from northern Australia into New South Wales, Victoria, or Tasmania must pass
through the MSP. Similarly, at times, surplus Victorian gas supply has been piped north to supplement
northern supply, and this must also pass through the MSP. As such, the MSP, as well as the South West
Queensland Pipeline (SWQP), are key to maintaining the capability to share gas between northern and
southern regions.
There is a committed upgrade to the MSP that would increase the operationally available capacity65 by
approximately 40 TJ/d (to about 450 TJ/d) by winter 2021. However, even with this upgrade, without new
southern supply sources, the MSP is forecast to start limiting southward peak supply flows as early as 2023 (as
discussed in Section 4.1).
There are proposed projects that could expand the capacity of the MSP up to 750 TJ/d, as early as 2023, by
increasing compression.
Eastern Gas Pipeline (EGP)
The EGP runs from the Longford and Orbost Gas Plants in the Gippsland Basin in Victoria to Sydney,
connecting to Canberra with a spur pipeline. The EGP is presently uni-directional, however there is a
committed upgrade to add southwards compression allowing 200 TJ/d into Victoria to complement the
development of PKGT. The pipeline south of Orbost will be sufficient to allow up to 70 TJ/d of supply from
Orbost to be added to the 200 TJ/d. This will provide a second pathway to send gas south into Victoria, along
with the VNI.
With additional compression, this could be increased to almost 400 TJ/d, although this is not considered
either committed or anticipated within the 2021 GSOO.
62 The gas price modelling which is used as an input to the demand modelling and gas adequacy modelling does consider contracts and competition.
63 At https://www.accc.gov.au/publications/serial-publications/gas-inquiry-2017-2025/gas-inquiry-january-2021-interim-report.
64 Additional pipelines, such as the Queensland-Hunter Gas Pipeline, or an LNG receipt terminal in the south, may change this situation.
65 The nameplate capacity is 489 TJ/d, but the hydraulic pressures of the receiving systems have the effect of reducing the operational capacity.

© AEMO 2021 | Gas Statement of Opportunities 48
South West Queensland Pipeline (SWQP)
The SWQP runs from Wallumbilla to Moomba, and connects with the Carpentaria Gas Pipeline (CGP), which
receives gas from the Northern Gas Pipeline (NGP) after servicing Mt Isa loads. The SWQP acts as a gateway
between the large northern gas fields (including the LNG export terminal at Gladstone) and southern regions,
where much of the highly seasonal demand is located. Given the depleting southern supply (see Section 3.1.2)
the availability of infrastructure that enables north-south flow is expected to be increasingly important.
Figure 24 shows the historical distribution of flows on the SWQP over the last five years.
Figure 24 Cumulative distribution of flows along the SWQP, 1 January 2016 to 31 December 2020 (TJ/d)
The trend in flows in recent years shows an increasingly southern flow, particularly as the NGP and growing
CSG investment has increased accessible resources in the north. While 2020 showed somewhat of a reversal
in operation, with reduced southern consumption and record levels of LNG export (1,338 PJ), the trend of
increasingly strong flows southwards on peak demand days during winter still continued.
Figure 25 shows the daily profile of supply sources used to meet southern demand across 2020, including:
• Production from Moomba, Longford, and other southern fields.
• Withdrawal (and injection) from gas storages within the southern states.
• Gas produced within fields from the northern regions (Queensland and Northern Territory), sent south via
the SWQP.
Figure 25 highlights that production from the southern fields has needed support from northern gas to meet
the peak demand, even accounting for the use of southern storages. There are proposed projects that could
expand the capacity of the SWQP up to 600 TJ/d, as early as 2023, by increasing compression.
-500
-400
-300
-200
-100
0
100
200
300
400
500
0% 10% 20% 30% 40% 50% 60% 70% 80% 90% 100%
TJ
per
day
Percentage of days in year
2016 2017 2018 2019 2020
Flo
w t
ow
ard
s
Qu
eensl
and
Flo
w t
ow
ard
s
south
ern
sta
tes

© AEMO 2021 | Gas Statement of Opportunities 49
Figure 25 Observed gas supply used to meet peak southern demand in 2020
Other pipelines
Additional major midstream infrastructure servicing domestic consumers is listed in Table 8 below.
Table 8 Additional major midstream infrastructure
Name Description and relevant information
Moomba-Adelaide Pipeline System
(MAPS)
Connects Adelaide to the Moomba gas production facility in northern South
Australia.
South East Australian Gas Pipeline
(SEAGas)
Connects Adelaide to supply from Otway Basin in Victoria, including Iona UGS .
This pipeline cannot presently transfer gas from Adelaide to Port Campbell and is not
connected to MAPS. This may be plausible, but has no proponent.
Northern Gas Pipeline (NGP) Connects the Blacktip and Mereenie gas fields in the Northern Territory to Mt Isa and
the CGP (described below).
Has potential to increase capacity to as high as 1,000 TJ/d with additional
compression*.
Carpentaria Gas Pipeline (CGP) Connects Mt Isa and the NGP to Queensland’s pipeline system, at Ballera on the
SWQP.
Victoria Northern Interconnect (VNI) Connects Wollert (on the Melbourne ring) to Young, intersecting with the MSP.
Projected to frequently reach southward flow constraints in later years.
Longford-Melbourne Pipeline (LMP) Connects Melbourne to supply from Longford Gas Plant. Does not provide access to
the Orbost Gas Plant.
Roma-Brisbane Pipeline (RBP) Connects Brisbane to supply from Wallumbilla Gas Hub.
South West Pipeline (SWP) Connects Melbourne to supply from Otway Basin, including access to Iona UGS.
Projected to constrain flows during peak demand periods when the full capacity of
the Iona UGS is most needed. Additional supply from the Otway Basin could not help
support winter peak demand without upgrading or duplicating this pipeline.
Tasmanian Gas Pipeline (TGP) Connects Bell Bay to supply from Longford Gas Plant
0
500
1,000
1,500
2,000
2,500
Jan-20 Feb-20 Mar-20 Apr-20 May-20 Jun-20 Jul-20 Aug-20 Sep-20 Oct-20 Nov-20 Dec-20
TJ
per
day
Other southern production Moomba Longford
Southern storage Transported via SWQP Total southern production
Southern demand

© AEMO 2021 | Gas Statement of Opportunities 50
Name Description and relevant information
North Queensland Gas Pipeline
(NQGP)
Connects Townsville to supply from Moranbah Gas Plant
Sydney-Newcastle Pipeline (SNP) Connects Newcastle to Sydney (and draws supply from the MSP and EGP).
Presently this is not considered to be a transmission pipeline, but is a large full
regulation distribution pipeline. However, given Newcastle proposals for a new LNG
import terminal, a new GPG or the QHGP, this pipeline may need expansion or even
duplication.
Proposed developments relevant to understanding modelled options
Western Slopes Pipeline Would connect the proposed Narrabri Gas Plant to the MSP at Mount Hope.
Proposals would also include expansion of the MSP in line with the values presented
previously.
Queensland-Hunter Gas Pipeline
(QHGP)
Would connect the proposed Narrabri Gas Plant to Newcastle and also to
Wallumbilla, providing a new pathway for north/south gas transfer.
If this progressed it is likely that expansion of the SNP would also be required to
connect down to the EGP, which would also be developed to be reversible.
* At https://www.energymagazine.com.au/jemena-to-extend-northern-gas-pipeline-with-mou/.
3.2.2 Storages
Storage facilities provide additional flexibility to help meet maximum demand requirements by storing surplus
gas supplies produced in summer for use in winter. The market facing storages are listed in Table 9. The
ability for storages to be refilled to capacity and/or to deliver gas at maximum withdrawal rate may at times
be limited by pipeline capacity.
Table 9 Key storage infrastructure within the eastern and south-eastern gas systems
Name Connecting location Storage capacity (PJ) Maximum withdrawal rate (TJ/d)
Silver Springs Wallumbilla, QLD 36 30
Iona UGS Otway Basin, VIC 23.5 520
Newcastle LNG Storage Newcastle, NSW 1.5 120
Dandenong LNG Storage Melbourne, VIC 0.86 87*
* This storage can supply at faster rates for short periods of time, but that is non-firm supply and not able to be supported across a 24
hour period.
Over recent years, as maximum daily production capacity in southern states has reduced, there has been an
increased reliance on storages. Figure 26 shows that from 2017 through to 2019, each year successively drew
on more storage to help supply peak and seasonal demands. In 2020, this observed trend was disrupted due
to reduced total consumption, particularly from GPG consumption, despite a small increase in southern
residential and commercial consumption, impacted by colder winter conditions.

© AEMO 2021 | Gas Statement of Opportunities 51
Figure 26 Cumulative distribution of net changes in storage level for Iona UGS, 1 January 2017 to 31 December 2020 ((TJ/d)
The critical role for gas storage is expected to increase as the maximum daily production capacity decreases
further, particularly after 2023, although this may depend on the cost-competitiveness of PKGT relative to
storage. Existing storages alone cannot provide sufficient flexibility in the system long term to manage the
seasonality of southern demand as the storage capacities (shown in Table 9) are simply not deep enough.
3.2.3 LNG import terminals
LNG import terminals represent an alternative way to supply gas to consumers.
While PKGT is now committed, there are also a number of other LNG import terminals proposed across the
eastern and south-eastern Australian gas system, shown in Table 10. The proposals are at different stages of
development, on different timelines, and face different challenges.
The LNG import terminals could source gas from both international and domestic markets (effectively
operating as a virtual pipeline from Australia’s northern gas fields to southern demand centres). The total
annual volume that could be injected would depend on shipment schedules and approvals.
-300
-200
-100
0
100
200
300
400
500
0% 50% 100%
TJ/
day
Percentage of days in year
2017 2018 2019 2020

© AEMO 2021 | Gas Statement of Opportunities 52
Table 10 LNG import terminals
Name Region Earliest
assumed
timing
Capacity Additional considerations
Port Kembla Gas
Terminal (PKGT)A
New
South
Wales
Early 2023 500 TJ/d • Recently committed. Annual production limitation of
approximately 130 PJ.B
• Located near Sydney with a pipeline connecting into the EGP.
• EGP to be upgraded to become bidirectional. Jemena has
committed to upgrading the EGP to allow 200 TJ/d in reverse
flows south to Victoria.
Proposed developments relevant to understanding future options
Crib PointC Victoria Winter
2023
530 TJ/d • No downstream pipeline limitations, connecting into LMP
• There may be benefits to make LMP bilateral
• Government approvals for this project are yet to be received.
GeelongD Victoria 2024 500-600
TJ/d
• Located at the site of the Geelong Oil Refinery.
• Would require pipeline duplication of the SWP.
NewcastleE New
South
Wales
Not yet
confirmed
Not yet
confirmed
• Presently undertaking an environmental impact statement.
• Declared New South Wales Critical State Significant
Infrastructure (August 2019).
• Would require multiple pipeline upgrades, expansions, or
duplications.
Port AdelaideF South
Australia
Not yet
confirmed
Not yet
confirmed
Would likely need pipeline expansions, upgrades, or
duplication to be able to move gas directly into Victoria (for
example, reversing the SEAGas pipeline, as discussed in Section
5.1.3).
Port Phillip BayG Victoria 2024 Not yet
confirmed
Recently announced, with details still to be clarified.
A. For more, see https://ausindenergy.com/. Modelled as available from Q2 2023.
B. AEMO understands that the PKGT has environmental restrictions that will limit water discharge and reduce the volume of imports to
130 PJ per annum.
C. For more, see https://www.agl.com.au/about-agl/how-we-source-energy/gas-import-project.
D. For more, see https://www.vivaenergy.com.au/operations/geelong/geelong-energy-hub/viva-energy-gas-terminal-project.
E. For more, see https://www.epiklng.com/ngdc.html.
F. For more, see https://veniceenergy.com/south-australian-power-project/.
G. For more, see https://www.vopak.com/newsroom/news/news-vopak-lng-studies-feasibility-develop-lng-import-terminal-victoria and
https://www.argusmedia.com/en/news/2197082-vopak-eyes-lng-import-terminal-in-australias-victoria.

© AEMO 2021 | Gas Statement of Opportunities 53
4. Gas supply adequacy
Key insights
The forecast decline in legacy flexible southern gas supply is increasing the importance of timely
development of alternative flexible supply options to maintain eastern and south-eastern gas system
resilience. This GSOO forecasts:
• An improved outlook for gas supply adequacy in the next five years compared to what was forecast in
the 2020 GSOO, largely due to the recent commitment of PKGT. Producers’ forecasts of existing and
committed maximum daily production capacity would be sufficient to avoid domestic peak day gas
shortfalls until at least 2026 under most circumstances, provided all developments proceed to
schedule.
• If PKGT is delayed, or gas cargoes are delayed once operational, peak day shortfalls of up to 100 TJ/d
could occur in southern regions as early as winter 2023 under extreme peak demand conditions,
unless additional supply sources are developed or demand management options are implemented.
- With declining flexible southern gas supplies, more reliance is projected to be placed on PKGT and
existing storages, such as Iona UGS, to provide much needed capacity. Located in Port Campbell,
Iona UGS' ability to service peak demand to the largest load centres in Victoria may be limited by
constraints on the SWP unless expanded.
- Current infrastructure constraints on the MSP limit the ability for northern supply to help cover
southern shortfalls during maximum daily demand periods. At these times, and without further
pipeline expansions, attempts to redirect gas earmarked for LNG export are unlikely to be effective
in maintaining gas security.
• Anticipated developments – including Golden Beach and new fields in the Gippsland Basin Joint
Venture (GBJV) – could further improve the supply outlook, particularly adding resilience to the earlier
years. While these projects are considered likely to progress, they are not yet committed. The
development of all committed and anticipated projects would delay peak day shortfalls until 2029 in
the Central scenario.
• Additional flexible sources of gas supply (beyond committed and anticipated projects), or stronger
energy efficiency achievements are needed towards the end of the decade to avoid southern seasonal
supply gaps of between 8 PJ and 23 PJ over winter months. Without anticipated developments, these
supply gaps could be up to 40 PJ per year.
• The LNG exporters continue to be dominant producers (and consumers) of gas. Current production
forecasts are increasingly insufficient to match minimum contracted levels, as early as 2025, without
continued investment in new production. The LNG exporters anticipated projects are forecast to
provide sufficient production to meet (or exceed) current contracts until 2033, if all are developed.

© AEMO 2021 | Gas Statement of Opportunities 54
Defining a shortfall or supply gap
For GSOO purposes, an inability to supply gas to meet domestic (industrial, commercial, residential or GPG)
demand is identified as a supply gap and becomes a shortfall if projected in the next five years. There are two
classes of shortfall (or supply gap) identified:
• Peak day shortfall – a shortfall driven by insufficient capacity to meet demand on an extreme peak day.
• Seasonal shortfall – a shortfall driven by a broader lack of available gas rather than just capacity on a
single day. Note that the seasonal shortfalls can also be caused by prolonged infrastructure constraints.
LNG exporters are assumed to offer any available production above minimum contracted volumes66 to
domestic consumers, in accordance with the Heads of Agreement. While the current Heads of Agreement is
in place until 1 January 2023, it is assumed that this agreement is extended indefinitely.
For the purpose of identifying supply gaps and shortfalls, total production from LNG exporters is modelled,
but only domestic supply gaps and shortfalls are reported. The supply adequacy assessment takes into
account all pipeline transmission capacity and constraints, and energy limitations from production facilities,
storage and PKGT.
4.1 Supply adequacy in the Central scenario
Production, particularly peak production, from existing and committed developments is projected to decline
rapidly over the coming years (see Section 3.1.3). Following the commissioning of the PKGT, available supply
to domestic consumers is forecast to be sufficient to meet all consumer demand until 2026 in the Central
scenario, even without the development of anticipated projects. With these additional domestic production
projects, peak day supply gaps are not anticipated until 2029. At this time, seasonal supply gaps are also
expected, and this is consistent across all scenarios except for Slow Change, which only projects seasonal
supply gaps in 2032.
To meet winter demands in Victoria (the state with the largest winter gas heating load), supply from outside
the state will need to be relied upon in the coming decade, unless new local supplies or LNG import terminals
are developed. The domestic supply gaps are projected to be limited to Victoria and Tasmania until at least
2034, at which point South Australia is also forecast to experience some supply gaps. Substantial redirection
of export LNG is not expected to be required until 2031.
Figure 27 shows the expected production forecast if existing, committed, and anticipated projects are
developed and all associated reserves and resources67 are commercially recoverable to meet demand in the
long term68. The figure shows that new supply options will be required across eastern and south-eastern
Australia towards the end of the decade to ensure domestic and LNG export demand is met to the end of the
outlook period.
66 The Slow Change scenario does not feature production from LNG exporters above minimum contracted volumes, and therefore does not include the
ability to offer surplus gas to domestic consumers.
67 The figure assumes a small volume of 2C resources (approximately 500 PJ) associated with an anticipated project in the northern region becomes
commercially recoverable.
68 The figure displays the supply from developed, committed and anticipated developments, showing the utilisation of anticipated production as early as
2022. Without this anticipated production, developed and committed production can service 2022 and 2023 consumption and maximum daily demand
but these fields would then be depleted earlier than shown in this figure .

© AEMO 2021 | Gas Statement of Opportunities 55
Figure 27 Projected eastern and south-eastern Australia gas production (including export LNG), Central scenario, existing, committed, and anticipated developments, 2021-40 (PJ)
Risks of peak and seasonal shortfalls
Gas demand is highly seasonal, and AEMO forecasts that with depleting southern production, flexible supply
will become increasingly important to meet southern peak and seasonal demand. Without new supply
options, and if PKGT’s commissioning and operation was delayed until after winter 2023, then peak day
shortfalls of up to 100 TJ/d could occur in Victoria in the 2023 winter season under extreme peak demand
conditions. This risk of peak shortfalls in the short term could be avoided if anticipated projects are also
developed according to their respective best estimates on commissioning, increasing the resilience of the
system to commissioning delays.
Figure 28 shows daily data to demonstrate the seasonality of demand in the south forecast in the Central
scenario, as well as the decreasing peak supply capacity considering all existing and committed projects69.
In Figure 28:
• The solid red line shows the maximum available southern production, the dashed red lines represent the
additional maximum daily capacity available from SWQP.
• The red dotted line adds the capacity that is available from storages, accounting for pipeline constraints in
the south70.
• Finally, the orange solid line shows the capacity available to the south with the construction of the PKGT.
During winter, the use of pipelines to bring gas from north to the south plays a major role in meeting the
seasonal southern demand (evidenced by the current volume of demand above maximum southern
production shown in Figure 28). This midstream infrastructure has clear transfer limits and cannot solve all
capacity challenges. The use of storages – particularly deep storages that can be filled outside of the winter
69 The total system capacity available was calculated for the actual and modelled peak days for each year with the following assumptions:
• Southern production is maximised first, northern production is produced up to the limit of the SWQP.
• Storage capacity is then provided to the limit of the connecting pipelines, Dandenong and Newcastle LNG storages are full maximised, Iona UGS i s
limited to the sum of filling the remaining capacity on the SWP, meeting the peak day demand at Port Campbell and meeting any unmet demand in
Adelaide on the specific peak day.
• The final piece of the analysis is including the PKGT up to the maximum capacity of pipelines to deliver the gas into Victoria. In this way, the
infrastructure limitations are respected.
70 Victoria’s SWP is projected to restrict the state’s access to the full available capacity from Iona UGS during some critical periods, even accounting for the
development of the Western Ring Outer Main (WORM) in late 2022. Further proposed expansions would need to be developed to address this limitation.
0
500
1,000
1,500
2,0002021
2022
2023
2024
2025
2026
2027
2028
2029
2030
2031
2032
2033
2034
2035
2036
2037
2038
2039
204
0
PJ
Developed Committed Anticipated LNG imports Forecast demand
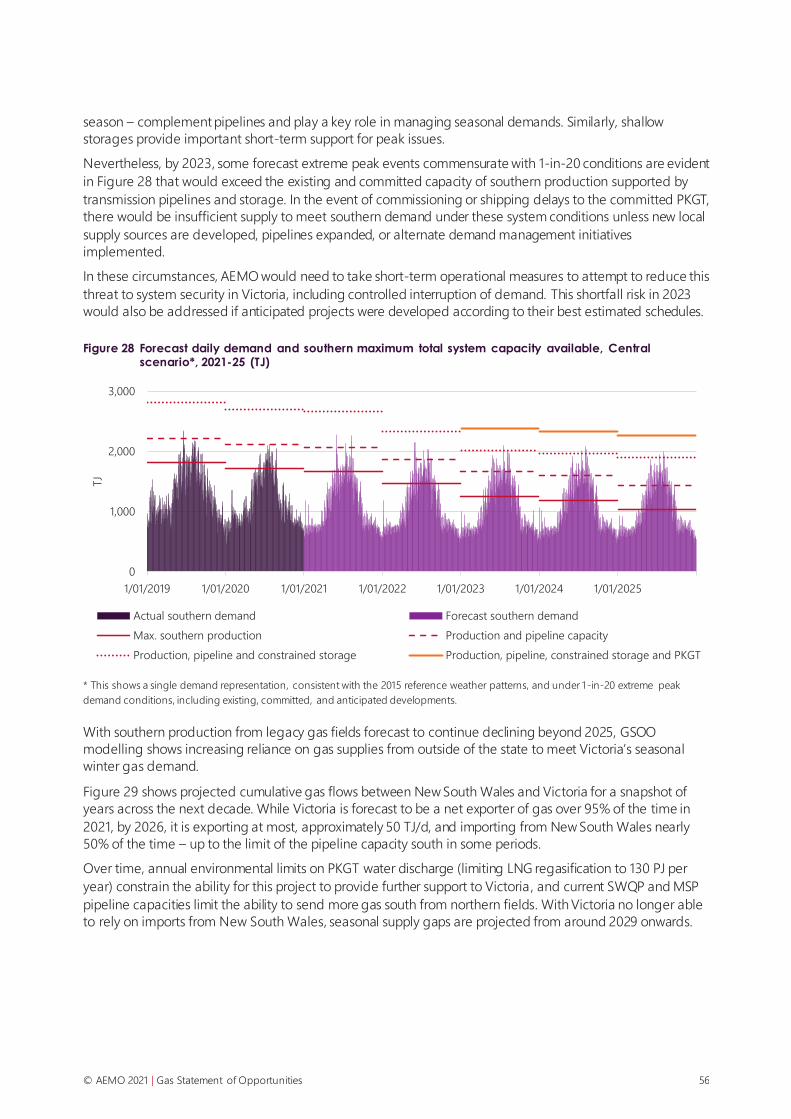
© AEMO 2021 | Gas Statement of Opportunities 56
season – complement pipelines and play a key role in managing seasonal demands. Similarly, shallow
storages provide important short-term support for peak issues.
Nevertheless, by 2023, some forecast extreme peak events commensurate with 1-in-20 conditions are evident
in Figure 28 that would exceed the existing and committed capacity of southern production supported by
transmission pipelines and storage. In the event of commissioning or shipping delays to the committed PKGT,
there would be insufficient supply to meet southern demand under these system conditions unless new local
supply sources are developed, pipelines expanded, or alternate demand management initiatives
implemented.
In these circumstances, AEMO would need to take short-term operational measures to attempt to reduce this
threat to system security in Victoria, including controlled interruption of demand. This shortfall risk in 2023
would also be addressed if anticipated projects were developed according to their best estimated schedules.
Figure 28 Forecast daily demand and southern maximum total system capacity available, Central scenario*, 2021-25 (TJ)
* This shows a single demand representation, consistent with the 2015 reference weather patterns, and under 1 -in-20 extreme peak
demand conditions, including existing, committed, and anticipated developments.
With southern production from legacy gas fields forecast to continue declining beyond 2025, GSOO
modelling shows increasing reliance on gas supplies from outside of the state to meet Victoria’s seasonal
winter gas demand.
Figure 29 shows projected cumulative gas flows between New South Wales and Victoria for a snapshot of
years across the next decade. While Victoria is forecast to be a net exporter of gas over 95% of the time in
2021, by 2026, it is exporting at most, approximately 50 TJ/d, and importing from New South Wales nearly
50% of the time – up to the limit of the pipeline capacity south in some periods.
Over time, annual environmental limits on PKGT water discharge (limiting LNG regasification to 130 PJ per
year) constrain the ability for this project to provide further support to Victoria , and current SWQP and MSP
pipeline capacities limit the ability to send more gas south from northern fields. With Victoria no longer able
to rely on imports from New South Wales, seasonal supply gaps are projected from around 2029 onwards.
0
1,000
2,000
3,000
1/01/2019 1/01/2020 1/01/2021 1/01/2022 1/01/2023 1/01/2024 1/01/2025
TJ
Actual southern demand Forecast southern demand
Max. southern production Production and pipeline capacity
Production, pipeline and constrained storage Production, pipeline, constrained storage and PKGT

© AEMO 2021 | Gas Statement of Opportunities 57
Figure 29 Cumulative distribution of aggregate flows between New South Wales and Victoria (EGP and VNI), Central scenario, assuming existing, committed, and anticipated developments, 2021-30 (TJ/d)
Figure 30 shows how LNG imports, storage, currently anticipated projects, and northern production
transported via SWQP are forecast to be utilised in 2030 to minimise supply gaps, as southern seasonal
production declines. With falling available production, storages are utilised to manage seasonal consumption,
but there is insufficient storage depth to completely support sustained seasonal demand. From June to
August, gas is being withdrawn from storage nearly every day until empty, with no opportunity for depleted
inventory to be replenished until spring.
Figure 30 Forecast gas supply options to meet southern daily demand, Central scenario, 2030 (TJ/d)
-400
-300
-200
-100
0
100
200
300
400
0% 10% 20% 30% 40% 50% 60% 70% 80% 90% 100%
TJ/
day
Percentage of days in the year
2021 2023 2025 2026 2028 2030
Flo
ws to
NSW
Flo
ws to
VIC
0
500
1,000
1,500
2,000
2,500
Jan-30 Feb-30 Mar-30 Apr-30 May-30 Jun-30 Jul-30 Aug-30 Sep-30 Oct-30 Nov-30 Dec-30
TJ/
d
Southern production Transported via SWQP LNG receipts
Southern storage Supply Gap Southern demand
0
400
800
1,200
Jan-30 Feb-30 Mar-30 Apr-30 May-30 Jun-30 Jul-30 Aug-30 Sep-30 Oct-30 Nov-30 Dec-30Sup
ply
Gap
(TJ/
d)

© AEMO 2021 | Gas Statement of Opportunities 58
In the absence of new flexible supply sources in the south or increased pipeline capacity, increased storage
depth could allow more gas from northern fields to be stored outside winter periods at times when pipeline
capacity is not constrained and gas supplies are surplus to requirement, and provide it back to the market to
help meet higher seasonal demand at times when flows are constrained. However, Figure 31 demonstrates
that by 2035, without additional sources of supply, there is simply not enough gas to meet demand and fill
depleted inventory in storages, so storages can no longer be used.
While it may be implausible to consider no further gas infrastructure between now and 2035, this analysis
emphasises that there is no one solution that can meet all the future gas system needs. A suite of
complementary investments in new gas fields, LNG import terminals, pipeline infrastructure, and storage may
provide the most efficient, reliable, and secure outcomes for gas consumers.
Figure 31 Forecast gas supply relative to southern daily demand, Central scenario, 2035 (TJ/d)
Further risk assessments affecting gas supply
Consideration of specific GPG sensitivities resulted in maximum daily demands as much as 100 TJ/d higher.
Figure 28 shows that an increase of 100 TJ/d would not be enough to risk supply shortfalls while LNG cargoes
are available, and also not enough to result in shortfalls in the earlier year of 2022. Without the LNG cargoes,
there is already a peak day risk in 2023, but higher than expected GPG demand would further exacerbate this
risk. If non-gas electricity generation alternatives are not available, this could lead to both electricity and gas
supply shortfalls under these extreme conditions. Delayed or deferred investment in the actionable ISP
projects assumed in this GSOO analysis is not expected to materially affect gas supply adequacy risks, with
the impact on GPG demand estimated to be less than the variance observed across the GSOO scenarios.
4.2 Annual gas adequacy in other scenarios
Figure 32 shows the forecast range of domestic gas supply gaps out to 2035 under each scenario, assessed
across a range of modelled weather conditions and POEs. As the figure demonstrates, all scenarios except
Slow Change experience similar supply gaps in 2029, but by the mid-2030s the Hydrogen scenario has
enough hydrogen substitution that it more closely approximates the supply gaps in the Slow Change scenario
(despite assumed population and economic growth being stronger). In 2035, the Hydrogen scenario has a
0
500
1,000
1,500
2,000
2,500
Jan-35 Feb-35 Mar-35 Apr-35 May-35 Jun-35 Jul-35 Aug-35 Sep-35 Oct-35 Nov-35 Dec-35
TJ/
d
Southern production Transported via SWQP LNG receipts
Southern storage Supply Gap Southern demand
0
400
800
1,200
Jan-35 Feb-35 Mar-35 Apr-35 May-35 Jun-35 Jul-35 Aug-35 Sep-35 Oct-35 Nov-35 Dec-35
(TJ/
d)
Sup
ply
Gap
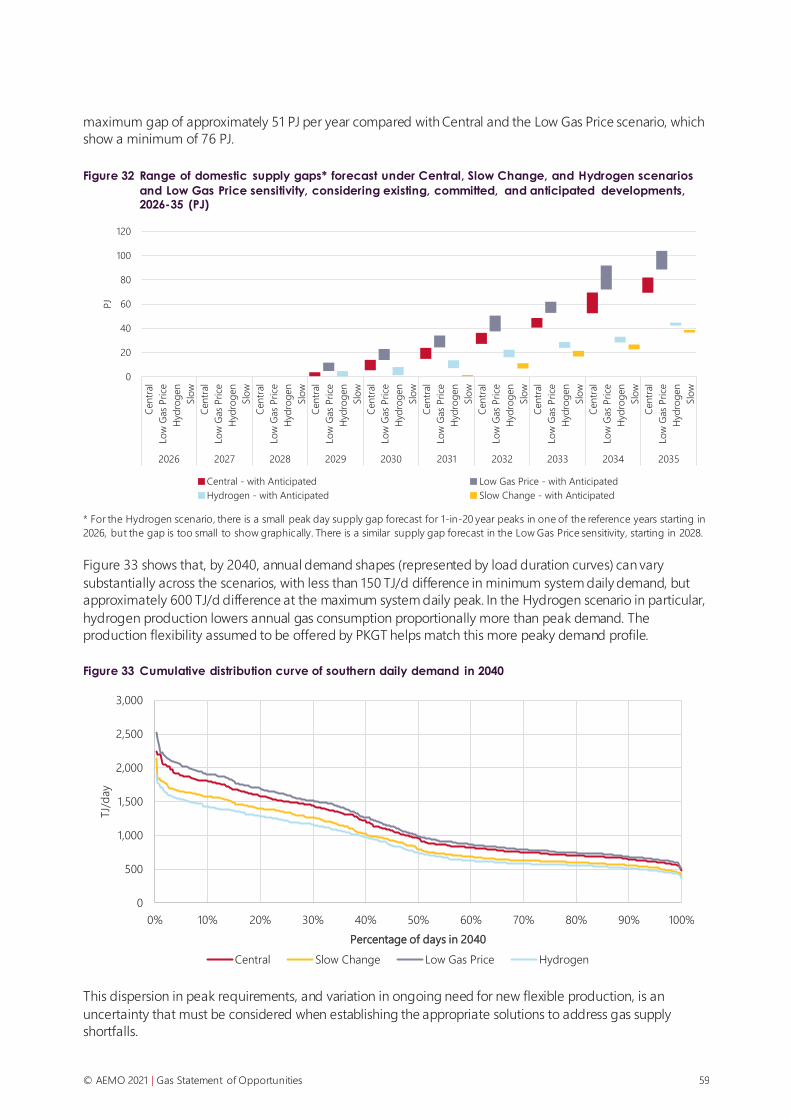
© AEMO 2021 | Gas Statement of Opportunities 59
maximum gap of approximately 51 PJ per year compared with Central and the Low Gas Price scenario, which
show a minimum of 76 PJ.
Figure 32 Range of domestic supply gaps* forecast under Central, Slow Change, and Hydrogen scenarios
and Low Gas Price sensitivity, considering existing, committed, and anticipated developments, 2026-35 (PJ)
* For the Hydrogen scenario, there is a small peak day supply gap forecast for 1-in-20 year peaks in one of the reference years starting in
2026, but the gap is too small to show graphically. There is a similar supply gap forecast in the Low Gas Price sensitivity, starting in 2028.
Figure 33 shows that, by 2040, annual demand shapes (represented by load duration curves) can vary
substantially across the scenarios, with less than 150 TJ/d difference in minimum system daily demand, but
approximately 600 TJ/d difference at the maximum system daily peak. In the Hydrogen scenario in particular,
hydrogen production lowers annual gas consumption proportionally more than peak demand. The
production flexibility assumed to be offered by PKGT helps match this more peaky demand profile.
Figure 33 Cumulative distribution curve of southern daily demand in 2040
This dispersion in peak requirements, and variation in ongoing need for new flexible production, is an
uncertainty that must be considered when establishing the appropriate solutions to address gas supply
shortfalls.
0100200300400500600700800
2023 2024 2025 2026 2027 2028 2029 2030
PJ
Central - with Anticipated Low Gas Price - with Anticipated
Hydrogen - with Anticipated Slow Change - with Anticipated
0
20
40
60
80
100
120
Centr
al
Low
Gas
Pri
ce
Hyd
rog
en
Slo
w
Centr
al
Low
Gas
Pri
ce
Hyd
rog
en
Slo
w
Centr
al
Low
Gas
Pri
ce
Hyd
rog
en
Slo
w
Centr
al
Low
Gas
Pri
ce
Hyd
rog
en
Slo
w
Centr
al
Low
Gas
Pri
ce
Hyd
rog
en
Slo
w
Centr
al
Low
Gas
Pri
ce
Hyd
rog
en
Slo
w
Centr
al
Low
Gas
Pri
ce
Hyd
rog
en
Slo
w
Centr
al
Low
Gas
Pri
ce
Hyd
rog
en
Slo
w
Centr
al
Low
Gas
Pri
ce
Hyd
rog
en
Slo
w
Centr
al
Low
Gas
Pri
ce
Hyd
rog
en
Slo
w
2026 2027 2028 2029 2030 2031 2032 2033 2034 2035
PJ
0
500
1,000
1,500
2,000
2,500
3,000
0% 10% 20% 30% 40% 50% 60% 70% 80% 90% 100%
TJ/
day
Percentage of days in 2040
Central Slow Change Low Gas Price Hydrogen
© AEMO 2021 | Gas Statement of Opportunities 60
5. Adding resilience to the eastern and south-eastern gas markets
With the development of newly committed infrastructure there is increased supply in the gas sector. However,
while existing and committed supply has substantially increased, there are several key single point
dependencies that result in a system that still has little resilience – especially since the LNG cargoes are relied
on during peak days, and delayed shipments occur much more frequently than production outages.
Developing both committed and anticipated projects will go a long way to mitigating risk of peak shortfalls in
the next five years, and will strengthen the gas system’s resilience. This section considers some of the
additional investments or actions that may be considered now or in the future to enable an even stronger,
more robust domestic gas market that is better able to meet the current and future needs of energy
consumers.
Conceptually, the additional investments or actions considered cover one, or a combination, of several
options:
• Focus on demand options to manage the supply-demand balance.
- Demand side responses can progressively reduce the need for new gas supplies; these could include
peak day demand management contracts, demand reduction via energy efficiency, fuel-switching (to
electricity or hydrogen), and alternative methane production pathways such as biomethane.
• Minimise investment in midstream infrastructure and expand existing assets.
- Continued exploration, discovery, drilling and development of contingent and prospective resources
near operating gas processing facilities would increase the domestic production capacity, increasing
resilience and potentially reducing the reliance on imported gas from other markets.
• Increase access to new basins to take advantage of untapped gas resources.
- Development of new basins such as Beetaloo, Galilee or Narrabri would require complementary
investment in pipeline infrastructure to enable delivery of new gas to southern consumers, and more
southern storage to increase the flexibility of managing demand seasonality.
• Additional LNG import terminals.
- There are a range of LNG import terminals that could provide “shaped” gas to supply seasonal
demand to southern customers.
The NGIP being developed by DISER is considering a number of pathways to unlock gas supply and improve
efficiency in the east coast gas market.
5.1.1 Addressing peak shortfall risks
Through until 2029, the major risk that the threatens gas supply adequacy is peak day shortfalls. The nature
of these risks is that they tend to occur for just a few days a year and only on the highest peak demand days.
© AEMO 2021 | Gas Statement of Opportunities 61
Additional supply, infrastructure, or demand management options to better manage the shortfalls will
increase the resilience of the system.
Focus on demand options
Peak shaving of up to 100 TJ on a very high peak demand day across Victoria, Tasmania, and/or New South
Wales is projected to allow enough of a buffer to avoid southern peak day shortfalls across most modelled
conditions71, even if an LNG cargo were delayed. This would require the development of a market mechanism
or direct contracts to enable and remunerate demand-side response in those regions.
The nature of these agreements would likely have relatively low cost, depending on the frequency and
duration of their use. However, if the demand is notably higher than forecast, or unexpectedly higher than
forecast day ahead with limited time to respond, there may be insufficient contracted loads to manage
extreme peak demands or coincident peak conditions across southern states. Combining targeted demand
response with broader investments in energy efficiency, electrification or alternative fuels, that gradually
reduce the demand for natural gas, would increase the robustness of this approach.
To quantify the potential scale of demand response:
• 100 TJ of demand response would be equivalent to almost 25% of combined Victorian, New South Wales,
and Tasmanian industrial (Tariff D) gas demand on a 1-in-20 peak day. If this 100 TJ were to be sourced
from residential and commercial demand, it would account for approximately 5% of the Victorian, New
South Wales, and Tasmanian Tariff V gas demand.
• Approximately 80% of the winter maximum daily demand in Victoria comes from the residential and
commercial sector. Improvements in the efficiency of appliances which operate most on peak days (such
as heating) are forecast to have a large impact on reducing system peaks, saving approximately 40 TJ/d
on Victorian winter peaks in 2030 in the Central scenario (for example). Increased investments in this area
may contribute to managing the risk of peak day shortfalls, although the focus on residential and
commercial customers may need to increase if the intent is to support the adequacy of peak gas supply
in 2023.
Curtailment of GPG during conditions of high gas demand may be an option72, but may risk electricity load
shedding if there are insufficient alternative non-gas energy sources across the NEM.
In the short term, the capital costs of these actions are likely to be low, with minimal investment regret,
although the resilience of the solution relies on coordinated responses, switching demand to alternative
energy sources and effective uptake of energy efficiency programs.
Expand existing assets
Expanding the SWP could improve access to the full capacity from Iona UGS, providing an additional source
of near-term capacity. Expansion via additional compression is relatively cheap, timely and has low
environmental impact so could feasibly be delivered ahead of winter 2023. However, expanding the SWP via
compression alone would likely result in only a small increase in capacity, (up to 60 TJ/d based on AEMO’s
preliminary assessments), and may not be enough to protect against peak day shortfalls under 1-in-20
demand conditions, in the event that LNG cargoes are delayed.
Compression expansion along MSP and SWQP could also be delivered as early as 2023 or in staged
increments as required73, and would provide southern states with greater access to northern gas supplies,
including redirected LNG. APA has proposed options to expand MSP and SWQP by an additional
71 No solution can resolve all risks to supply adequacy – high impact, low probability events would likely lead to shortfalls and gas restrictions if coincident
with peak demands. This includes major outages of gas production facilities, gas transmission or multiple electricity generator failures impacting the GPG
required.
72 Operating GPG in South Australia or Queensland instead of Victoria, New South Wales, or Tasmania would be one such option if the electricity
transmission system was not heavily congested. The use of liquid fuels in place of gas may be another possibility.
73 Delivered up to 18-24 months from FID.

© AEMO 2021 | Gas Statement of Opportunities 62
approximately 300 TJ/d and 200 TJ/d respectively, although the projects have not yet reached FID and have
not been included in the supply adequacy assessments.
Further expansion of the southwards flow on the EGP, up to around 400 TJ/d, would enable greater peak
support to Victoria.
Additional LNG import terminal
As identified in Section 3.2.3, there are several additional LNG import terminals proposed to connect to the
eastern and south-eastern gas systems, at different stages of development, on different timelines. Assuming
shipping schedules provide reliable cargoes during winter months, additional southern terminal(s) and any
requisite pipeline expansion would provide additional resilience to peak day shortfall risks, providing an
additional form of flexible supply.
5.1.2 Addressing seasonal supply requirements
Towards the end of the next decade, seasonal shortfalls are still forecast in all scenarios and some kind of
future action will be required to manage gas supply adequacy.
Access to new basins
Development of new basins in the north (such as Beetaloo), coupled with expansions of MSP, SWQP, CGP
and NGP, could provide the eastern and south-eastern gas systems access to large gas supplies that could
produce cost-effective gas for many years. Modelling showed that once developed, these assets would flow
gas south all year – directly to consumers in winter, and into storages during summer.
Developing the Narrabri Gas Plant in the Gunnedah Basin could deliver up to 70 PJ of gas each year. This is a
level of production consistent with the Memorandum of Understanding74 signed between the Australian
Government and the New South Wales Government.
Two alternative pipeline investments are proposed to access Narrabri.
• The Western Slopes arrangement would require the MSP and VNI developments, yet the increased
capacity of 200 TJ/d would not be sufficient. An additional source of supply would be required as early as
2026 in some scenarios. It was found that a southern LNG terminal would meet this need.
• The Queensland-Hunter Gas Pipeline (QHGP) arrangement would provide additional access to gas from
Wallumbilla to help meet southern demand, and would avoid additional pipeline augmentations. To
complement these actions and avoid additional investments, developing the Golden Beach storage in
2027 would enable increased seasonal flexibility.
The pipeline options associated with the development of Narrabri produce quite different outcomes. The
Western Slopes option, similar to accessing gas from northern basins (such as Beetaloo), would connect into
the MSP and would require some expansion of this pipeline. By contrast, the QHGP option is proposed to
connect to Wallumbilla and provides a second pathway for gas to flow south from Queensland.
Focus on demand options
The demand side options that are expected to be called upon infrequently (if at all) may be highly effective at
managing peak day risks; however, to address seasonal supply gaps, options such as energy efficiency and
fuel-switching (either to electricity or alternative gas) are more viable. These take time to transition and this
limits their scale. Nevertheless, demand options may viably contribute to maintaining gas supply adequacy in
the long term.
To demonstrate the potential size and scale of an example gas demand management option, AEMO has
estimated the impact on the annual consumption of Victorian consumers if new residential connections
ceased, similar to the recent approach adopted by the Australian Capital Territory, and assuming that fuel
switching (for example, to electric heating and cooking) does not indirectly increase demand for gas through
74 At https://energy.nsw.gov.au/government-and-regulation/electricity-strategy/memorandum-understanding.

© AEMO 2021 | Gas Statement of Opportunities 63
GPG. Such an action would lower gas connections by approximately 740,000 by 2040. The estimated scale of
impact is shown in Figure 34 below, on an annual consumption basis, with the reduced consumption
identifiable by the gap presented, relative to the Central scenario trajectory.
• By 2030, annual residential consumption could be approximately 16 PJ lower, and with approximately
120 TJ/d lower peaks.
• By 2040, annual residential consumption may be approximately 32 PJ lower, and with approximately
230 TJ/d lower peaks.
Figure 34 Victorian gas consumption with no new residential gas connections, Central scenario, to 2040
Reducing demand would directly address the strong seasonal variability and has the potential to reduce the
scale of flexibility required from production across the gas system. While the above estimate is focused on
Victorian connections, if applied to other southern regions then additional savings could be expected, further
reducing the scale of supply investment required in the longer term.
To complement pure demand solutions, it is also possible to consider alternative supply developments, such
as biomethane. Uncertain developments of up to 15 PJ per year from 2029 are proposed, demonstrating the
potential for this alternative supply. Further actions to temper demand growth, supplemented with
biomethane could provide sufficient adequacy of supply to 2040 in the Hydrogen and Slow Change
scenarios, without any further gas infrastructure development beyond what is already committed and
anticipated.
Expand existing assets
By their nature, uncertain resources are at an early stage of development or face challenges in terms of
commercial viability or approval, and are not yet proven. Nevertheless, new discoveries can be made, as
recently identified in the Otway Basin75 and if these come from existing fields this approach minimises the
need for new infrastructure.
While the 2C resources in the southern states may have higher estimated production costs than some
northern options, the increased estimated cost of production may be offset by the avoided infrastructure
investment, resulting in a lower overall cost of delivered gas.
75 See https://www.smh.com.au/business/companies/beach-energy-hits-otway-basin-drilling-success-as-gas-crunch-looms-20210215-p572o7.html.
0
50
100
150
200
250
2014
2015
2016
2017
2018
2019
2020
2021
2022
2023
2024
2025
2026
2027
2028
2029
2030
2031
2032
2033
2034
2035
2036
2037
2038
2039
204
0
Annual C
onsu
mp
tio
n e
xcl.
UA
FG
(P
J)
Industrial Residential / Commercial GPG 2021 GSOO Central

© AEMO 2021 | Gas Statement of Opportunities 64
Expansion of existing pipelines will increase the resilience of the gas system to future supply gaps, increasing
the capacity to flow gas from supply to customer. As identified in this report, the EGP, MSP, SWQP, NGP and
SWP all are candidates for expansion via compression, or duplication.
Additional LNG import terminals
Import terminals provide an opportunity to delay the extraction of existing reserves and resources, increasing
the longevity of southern facilities, and potentially delaying the timing of future supply gaps. Subject to
shipping or operational limitations, additional import terminals and requisite pipeline expansions would
provide flexible supply, providing resilience to peak day and seasonal supply gaps.

© AEMO 2021 | Gas Statement of Opportunities 65
A1. Hydrogen assumptions
AEMO has included a new Hydrogen scenario in this GSOO considering stakeholder feedback and the
increased momentum and potential significance of developing a hydrogen economy, as described in
Chapter 1.1. There is substantial uncertainty regarding hydrogen development, in terms of both scale and
timing, and AEMO’s Hydrogen scenario considers one possible future with strong developments to support
both domestic and export opportunities. Many alternative futures regarding hydrogen deployment exist, and
the assumptions applied are not intended to be appropriate or robust for all potential alternatives.
To develop a representative scenario, AEMO engaged with stakeholders via two forums:
• An open stakeholder workshop on 18 September 2020, specifically to identify suitable dimensions for this
scenario. The workshop provided in-session opportunities for discussion and collaboration, supported by
a pre-workshop survey which canvassed initial opinions. Included representatives from energy producers,
transmission and distribution providers, energy retailers, industry bodies, consumer groups, governments,
academia, and consultants.
• A session in AEMO’s open stakeholder Forecasting Reference Group (FRG), held on 30 September 2020, to
discuss the workshop insights and gather further feedback.
With a focus on the impact of high hydrogen deployment on Australia’s energy infrastructure , stakeholders in
these forums offered their feedback on a number of key assumptions and scenario parameters:
• Perceived importance of emissions reductions.
• Potential scale of production internationally and in Australia.
• Timeline of hydrogen development and consumption in Australia.
• Location of hydrogen development and consumption in Australia.
• Production options and potential shift from existing production methods to electrolysers.
• Potential share of production from off-grid vs grid-connected electrolysers.
• Potential share of each target market (domestic and export).
• Potential share of different domestic applications.
The narrative for the Hydrogen scenario was developed and validated through stakeholder engagement at
both forums, with the following key messages concluded:
• Consensus on strong hydrogen potential – there was consensus that hydrogen could become economic
within the next 20 years and could play a major role in Australia’s future from 2030, and that emissions
reduction objectives will highly influence hydrogen uptake.
• Consensus on key hydrogen drivers – these drivers included consumers’ perceived willingness to
decarbonise, falling cost of electrolysers, government support and policies, and a market framework to
recognise the full value of hydrogen.
• Uncertainties on paths to a large hydrogen economy – areas of uncertainty included Australia’s share
of global hydrogen demand, early target market(s), early production technology, level of grid connection
© AEMO 2021 | Gas Statement of Opportunities 66
for electrolysers, role of residential sector as early adopters, and scale of hydrogen production in each
state. The scenario’s assumptions and consumption forecasts therefore reflect only one possible future.
• Proposed qualitative narrative settings – the proposed qualitative narrative settings derived from the
workshop outcomes included assumptions that:
- Australia’s share of global production could be of similar scale to LNG, or beyond.
- Consumption would start from the domestic market and transition to export.
- Production would be highly driven by electrolysers from the start.
- The need for high electrolyser utilisation (to reach cost-competitiveness) would favour grid-connected
electrolysers, rather than off-grid applications which may have reduced resilience to electricity supply
variance.
- The role of gas and hydrogen blending within the gas distribution system could play a major role as an
enabler of early adoption.
- Production per state would be relatively even initially, due to supportive policies in all states, but export
opportunities would be more likely in regions with greater access to renewable electricity supply, water,
and appropriate export port facilities. This favoured longer-term hydrogen production in states such as
Queensland, Western Australia, and the Northern Territory; only Queensland is in 2021 GSOO scope.
AEMO then leveraged the insights from these engagements, informed by publicly available data76, to quantify
inputs for the Hydrogen scenario. These insights were also used to derive assumption-based forecasts of
hydrogen and natural gas consumption. For this scenario, an assumption-based approach to forecasting was
considered more appropriate than relying on detailed models due to the high level of uncertainty
surrounding future commercial and technical inputs associated with hydrogen production and consumption.
A1.1 Building the assumption-based forecasts
Currently, the existing global consumption of hydrogen is estimated to be about 70 megatonnes (Mt) per
annum. However, the global estimates of additional hydrogen production varies substantially across different
reports and under different scenario settings defined in those reports (Figure 35).
Under AEMO’s assumptions for the 2021 GSOO, Australia’s contribution to additional hydrogen production
would start relatively small (3 kilotonnes [kT]) in 2022 and ramp up to 2.8 Mt in 2030 and 13 Mt in 2040. The
2040 assumptions roughly fall between estimations in the Energy of the Future scenario in Deloitte ’s 2019
Australian and Global Hydrogen Demand Growth Scenario Analysis (pale blue bar) and the Hydrogen
Council’s 2017 Hydrogen, Scaling Up study (yellow blue bar)77. As Figure 35 shows, the scenario intentionally
explores strong growth. The hydrogen production rates ramp up to an assumed market share that would be
consistent with east coast Australia’s existing market share of global LNG exports by the mid 2030s.
To convert the national hydrogen forecast into grid-connected hydrogen in the GSOO states, AEMO made
further assumptions for the share of national production from Western Australia and Northern Territory (30%
aggregated), share of production from off-grid electrolysers in the GSOO states (5%), and potential shift from
existing production methods such as steam methane reforming (SMR) to electrolysers (200 kt by 2040). It was
also assumed that the additional hydrogen production is produced by electrolysers to reflect the influence of
emissions reductions and to capture the high end of impact on the electricity system and in turn GPG.
Assumption-based forecasts of hydrogen consumption took into account overall energy consumption scale
including gas and diesel, potential renewable energy zones (REZs) with more suitable renewable resources,
76 The workshop survey and materials were developed on the basis of various national and international reports on hydrogen development, as well as
information about hydrogen technology from specific projects and studies.
77 See https://www2.deloitte.com/content/dam/Deloitte/au/Documents/future-of-cities/deloitte-au-australian-global-hydrogen-demand-growth-scenario-
analysis-091219.pdf and https://hydrogencouncil.com/en/study-hydrogen-scaling-up/. Figure 35 also took data from https://irena.org/publications/2018/
Sep/Hydrogen-from-renewable-power, https://acilallen.com.au/uploads/projects/149/ACILAllen_OpportunitiesHydrogenExports_2018pdf -1534907204.pdf,
and https://data.bloomberglp.com/professional/sites/24/BNEF-Hydrogen-Economy-Outlook-Key-Messages-30-Mar-2020.pdf.
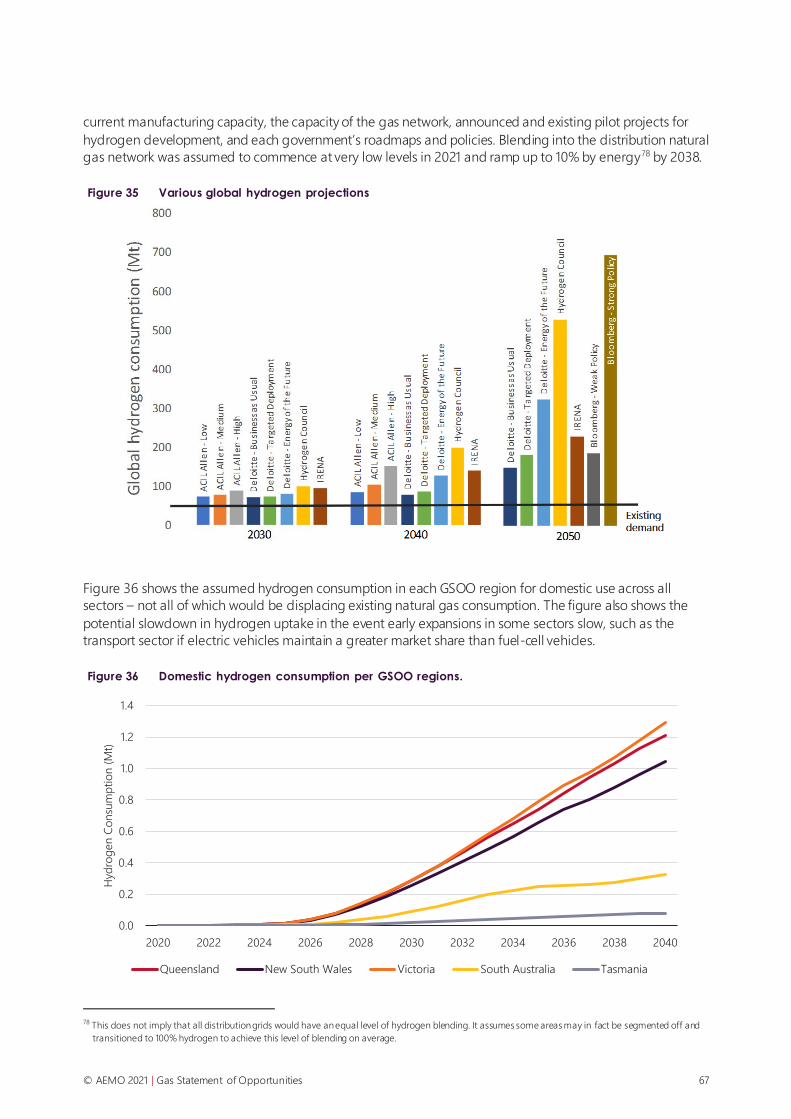
© AEMO 2021 | Gas Statement of Opportunities 67
current manufacturing capacity, the capacity of the gas network, announced and existing pilot projects for
hydrogen development, and each government’s roadmaps and policies. Blending into the distribution natural
gas network was assumed to commence at very low levels in 2021 and ramp up to 10% by energy78 by 2038.
Figure 35 Various global hydrogen projections
Figure 36 shows the assumed hydrogen consumption in each GSOO region for domestic use across all
sectors – not all of which would be displacing existing natural gas consumption. The figure also shows the
potential slowdown in hydrogen uptake in the event early expansions in some sectors slow, such as the
transport sector if electric vehicles maintain a greater market share than fuel-cell vehicles.
Figure 36 Domestic hydrogen consumption per GSOO regions.
78 This does not imply that all distribution grids would have an equal level of hydrogen blending. It assumes some areas may in fact be segmented off and
transitioned to 100% hydrogen to achieve this level of blending on average.
0.0
0.2
0.4
0.6
0.8
1.0
1.2
1.4
2020 2022 2024 2026 2028 2030 2032 2034 2036 2038 2040
Hyd
rog
en C
onsu
mp
tio
n (
Mt)
Queensland New South Wales Victoria South Australia Tasmania
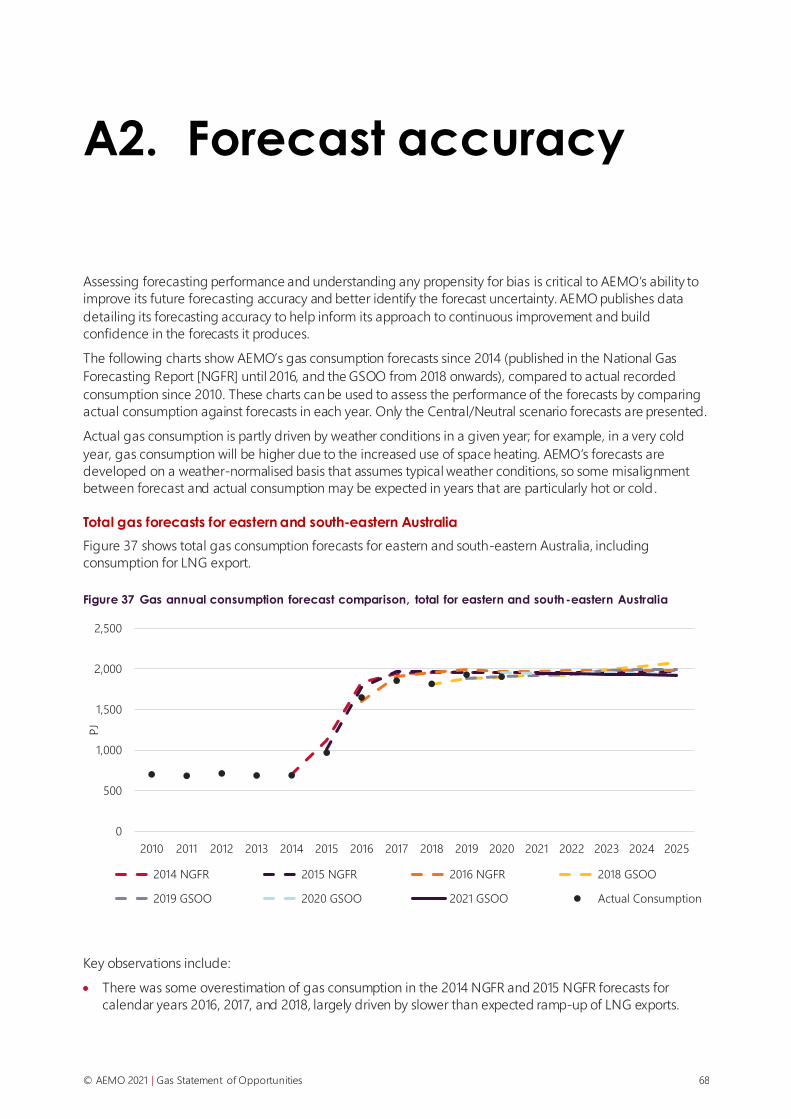
© AEMO 2021 | Gas Statement of Opportunities 68
A2. Forecast accuracy
Assessing forecasting performance and understanding any propensity for bias is critical to AEMO’s ability to
improve its future forecasting accuracy and better identify the forecast uncertainty. AEMO publishes data
detailing its forecasting accuracy to help inform its approach to continuous improvement and build
confidence in the forecasts it produces.
The following charts show AEMO’s gas consumption forecasts since 2014 (published in the National Gas
Forecasting Report [NGFR] until 2016, and the GSOO from 2018 onwards), compared to actual recorded
consumption since 2010. These charts can be used to assess the performance of the forecasts by comparing
actual consumption against forecasts in each year. Only the Central/Neutral scenario forecasts are presented.
Actual gas consumption is partly driven by weather conditions in a given year; for example, in a very cold
year, gas consumption will be higher due to the increased use of space heating. AEMO’s forecasts are
developed on a weather-normalised basis that assumes typical weather conditions, so some misalignment
between forecast and actual consumption may be expected in years that are particularly hot or cold .
Total gas forecasts for eastern and south-eastern Australia
Figure 37 shows total gas consumption forecasts for eastern and south-eastern Australia, including
consumption for LNG export.
Figure 37 Gas annual consumption forecast comparison, total for eastern and south-eastern Australia
Key observations include:
• There was some overestimation of gas consumption in the 2014 NGFR and 2015 NGFR forecasts for
calendar years 2016, 2017, and 2018, largely driven by slower than expected ramp-up of LNG exports.
0
500
1,000
1,500
2,000
2,500
2010 2011 2012 2013 2014 2015 2016 2017 2018 2019 2020 2021 2022 2023 2024 2025
PJ
2014 NGFR 2015 NGFR 2016 NGFR 2018 GSOO
2019 GSOO 2020 GSOO 2021 GSOO Actual Consumption

© AEMO 2021 | Gas Statement of Opportunities 69
• The 2018 GSOO and 2019 GSOO both forecast gas consumption for calendar year 2019 and 2020
reasonably well, whereas the 2020 GSOO over-estimated gas consumption in the 2020 calendar year,
mainly due to the LNG market disruption that occurred in 2020 due to COVID-19.
Table 11 provides an overview of the forecast accuracy of the calendar year immediately following the
forecast. Forecast accuracy in this case is measured as the percentage error, and calculated as the difference
between the forecast and the actual, divided by the actual. Due to the large size of the LNG sector (which
represents approximately 70% of total gas consumption), small changes in operations from individual facilities
make a large contribution to forecast error. The following sections break down the gas forecast accuracy into
the individual sectors to enable a closer inspection of the individual drivers contributing to forecast
uncertainty.
Table 11 Year ahead historical forecast accuracy, total for eastern and south-eastern Australia
2016 2017 2018 2019 2020
Year ahead forecast 1,773 1,903 1,810 1,889 1,959
Actual consumption* 1,649 1,856 1,817 1,931 1,916
Forecast accuracy 7.5% 2.6% -0.4% -2.2% 2.3%
Source 2015 NGFR 2016 NGFR 2018 GSOO 2019 GSOO 2020 GSOO
* Historical consumption for transmission industrial consumers has been updated this year due to improved reporting from all cu stomers
listed on the GBB, so values will differ slightly compared to previous GSOO reports. Previously, AEMO relied on voluntary annual survey
data to be completed.
Residential and commercial segment consumption forecasts
Figure 38 shows AEMO’s residential and commercial gas consumption forecasts. The starting point of the
2021 GSOO forecast has been calibrated to recent consumption data, with the overall trend reflecting AEMO’s
assumptions relating to connections and population growth and the impacts of energy efficiency, gas to
electric fuel-switching, gas prices, and climate change. These factors are described in more detail in
Section 2.2.
Figure 38 Gas annual consumption forecast comparison, residential/commercial
0
50
100
150
200
250
2010 2011 2012 2013 2014 2015 2016 2017 2018 2019 2020 2021 2022 2023 2024 2025
PJ
2014 NGFR 2015 NGFR 2016 NGFR 2018 GSOO
2019 GSOO 2020 GSOO 2021 GSOO Actual Consumption

© AEMO 2021 | Gas Statement of Opportunities 70
Table 12 provides an overview of the residential and commercial gas consumption forecast accuracy of the
calendar year immediately following the forecast. AEMO’s 2020 GSOO residential and commercial projection
was 2.3% lower than actual consumption levels in calendar year 2020. This variance was largely due to
weather, with several cold fronts79 in Victoria contributing nearly 6 PJ of extra consumption than when
compared to a median weather year.80
Table 12 Year ahead historical forecast accuracy, residential and commercial
2016 2017 2018 2019 2020
Year ahead forecast 188 190 188 190 191
Actual consumption* 187 193 190 191 195
Forecast accuracy 0.5% -1.4% -0.9% -0.4% -2.3%
Source 2015 NGFR 2016 NGFR 2018 GSOO 2019 GSOO 2020 GSOO
* Historical consumption for transmission industrial consumers has been updated this year due to improved reporting from all cu stomers
listed on the GBB, so values will differ slightly compared to previous GSOO reports. Previously, AEMO relied on voluntary annual survey
data to be completed.
Industrial segment consumption forecasts
Figure 39 shows AEMO’s industrial gas consumption forecasts, incorporating AEMO’s assumptions on
forecast changes in economic drivers and data obtained by surveying large gas users. These factors are
described in more detail in Section 2.2.
Figure 39 Gas annual consumption forecast comparison, industrial
Table 13 provides an overview of the industrial gas consumption forecast accuracy of the calendar year
immediately following the forecast.
79 Refer to the Bureau of Meteorology 2020 Victorian Climate report, at http://www.bom.gov.au/climate/current/season/vic/archive/202008.summary.shtml.
80 AEMO uses an Effective Degree Day (EDD) weather standard. The median EDD from 2000-2020 is 1,371 adjusting for climate change. In 2020 the
calculated EDD was 1,434, Refer to the AEMO Gas Methodology Paper for details on the EDD formulation, historical climate change adjustment and use as
a weather standard.
0
50
100
150
200
250
300
350
2010 2011 2012 2013 2014 2015 2016 2017 2018 2019 2020 2021 2022 2023 2024 2025
PJ
2014 NGFR 2015 NGFR 2016 NGFR 2018 GSOO
2019 GSOO 2020 GSOO 2021 GSOO Actual Consumption

© AEMO 2021 | Gas Statement of Opportunities 71
Table 13 Year ahead historical forecast accuracy, industrial
2016 2017 2018 2019 2020
Year ahead forecast 285.7 257.4 260.4 261.0 261.7
Actual consumption* 263.1 257.9 260.0 259.3 256.2
Forecast accuracy 8.6% -0.2% 0.2% 0.7% 2.2%
Source 2015 NGFR 2016 NGFR 2018 GSOO 2019 GSOO 2020 GSOO
* Historical consumption for transmission industrial consumers has been updated this year due to improved reporting from all cu stomers
listed on the GBB, so values will differ slightly compared to previous GSOO reports. Previously, AEMO relied on annual voluntary survey
data to be completed.
In the 2014 NGFR, AEMO predicted an inflection point in industrial consumption. AEMO’s increased
engagement with large industrial users was key to identifying this inflection point in consumption trends. This
process has helped AEMO develop richer insights into the key trend drivers for this sector and identify
structural and behavioural changes. This 2021 GSOO has further increased the number of surveys, interviews,
and separate customer forecasts (approximately 70% of industrial consumption). Since the 2019 GSOO, a
long-term flattening trend in industrial demand is forecast, reflecting an increased vulnerability of industrial
load to higher gas prices, as continually reported in surveys and interviews.
Variations from forecasts to actual industrial consumption arise primarily due to stochastic factors such as
weather variations, market shocks, or operational issues that result in unforeseen step changes in large
industrial loads, both temporary and permanent. AEMO’s 2020 GSOO industrial projection over-forecast
actual consumption in 2020 by approximately 5.5 PJ. This variation was largely driven by lower usage in New
South Wales, although other states also reported lower usage in this year. Discussions with a number of
facilities in 2020 with regards to the impact of the COVID-19 pandemic on their business revealed that some
were taking equipment offline for maintenance as well as running with less staff and reduced operations.
Observation of meter data also showed noticeable lowering of usage throughout different regions,
suggesting that COVID-19 did have an impact in reducing industrial consumption in 2020.
LNG export segment consumption forecasts
The largest proportion of gas consumption within the eastern and south-eastern gas markets is that
consumed by LNG facilities in Queensland. LNG operation is informed by various drivers, including:
• Minimum contractual LNG demand of each facility.
• Contractual terms (including LNG prices) of each short- and long-term LNG contract associated to each
LNG facility.
• The relationship between each contract to the LNG facility’s joint venture partners’ international LNG
portfolio.
• Cost of producing gas from each gas field associated with each LNG facility.
• Spot international oil and LNG prices.
• Winter weather in the Northern hemisphere that affects the number of LNG cargoes supplied by each
facility into the spot international LNG market.
• Efficiency of the on-site generators supplying electricity to the LNG facilities.
• Efficiency and losses associated with the liquefaction, storage and ship loading processes.
• Operational issues at LNG facilities (outages).
Figure 40 and Table 14 compare AEMO’s LNG forecasts against actual consumption by LNG facilities. It shows
that forecasts have overestimated consumption for all years except for 2018. As the LNG facilities increased
their operations in the early years, there were some operational run-in issues that slowed production in the

© AEMO 2021 | Gas Statement of Opportunities 72
LNG export. By 2018 and 2019, the forecasts were more accurate: both were within 3% of actuals. The GSOO
2020’s LNG consumption forecast was just under 6% too high. While LNG export volumes reached record
levels, the market disruption that occurred in 2020 due to COVID-19 caused international LNG buyers to only
purchase minimum contract quantities and reduce the number of spot cargoes from these LNG facilities.
Figure 40 Gas annual consumption forecast comparison, LNG
Table 14 Year ahead historical forecast accuracy, total for all Queensland LNG Facilities
2016 2017 2018 2019 2020
Year ahead forecast 1,167.90 1,291.50 1,208.10 1,346.39 1,414.81
Actual consumption* 1,059.92 1,220.85 1,237.42 1,325.40 1,337.53
Forecast accuracy 10.2% 5.8% -2.4% 1.6% 5.8%
Source 2015 NGFR 2016 NGFR 2018 GSOO 2019 GSOO 2020 GSOO
* Historical consumption for transmission industrial consumers has been updated this year due to improved reporting from all cu stomers
listed on the GBB, so values will differ slightly compared to previous GSOO reports. Previously , AEMO relied on voluntary annual survey
data to be completed.
GPG consumption forecasts
Forecasting gas consumption for GPG is challenging because it is driven by events, such as extreme weather
or generation outages, that can be difficult to predict and which lead to significant variations in forecasts. As
demonstrated in Figure 41, which compares AEMO’s GPG forecast accuracy against actual consumption, all
recent forecasts have underestimated consumption, due to a number of events that have resulted in higher
GPG than that forecast. These events have negated the forecast reductions in GPG volumes due to increasing
penetration of renewable energy at large and small scale. The events include:
• The Basslink interconnector outage in 2015.
• The extended outage at Eraring Power Station in 2016.
• The unforeseen closure of the Hazelwood Power Station and extended outage at Yallourn in 2017.
• The Loy Yang A2 and Mortlake unit outages and coal shortages at Mount Piper Power Station in 2019.
• Extended hot weather across December and January 2019, which led to a slightly higher electricity
consumption than forecast.
0
200
400
600
800
1,000
1,200
1,400
1,600
2016 2017 2018 2019 2020 2021 2022 2023 2024 2025
PJ
2015 NGFR 2016 NGFR 2018 GSOO 2019 GSOO
2020 GSOO 2021 GSOO Actual consumption
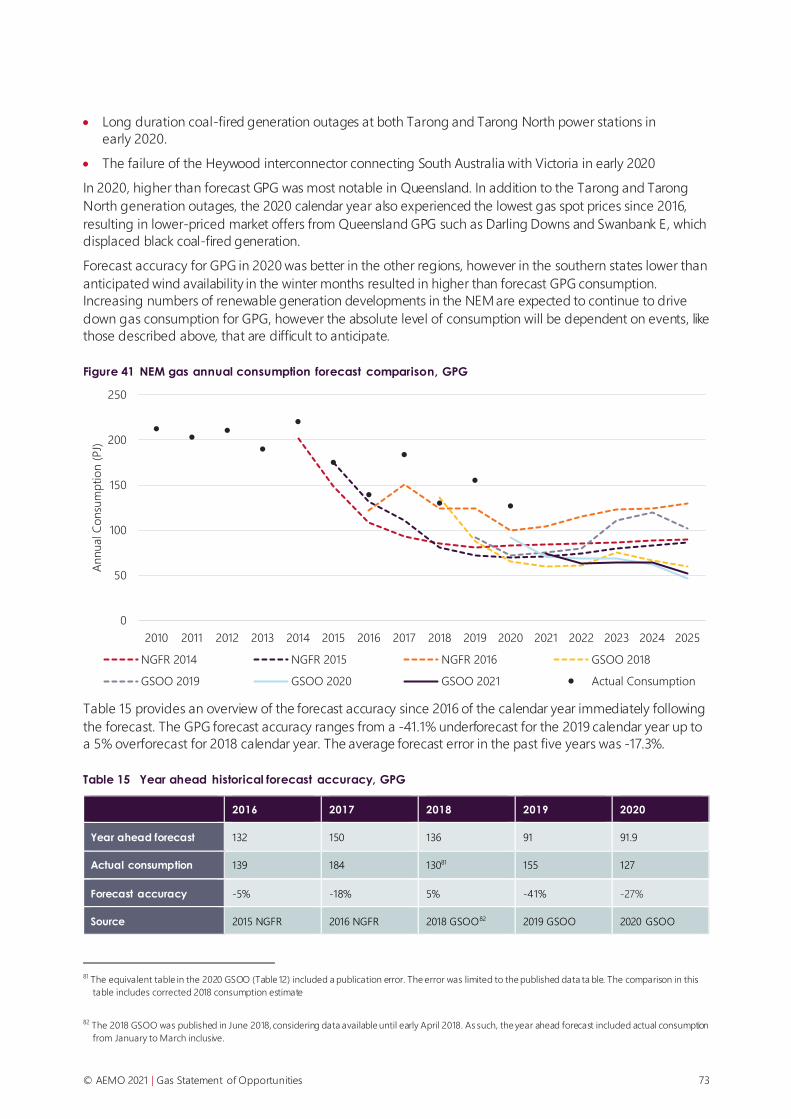
© AEMO 2021 | Gas Statement of Opportunities 73
• Long duration coal-fired generation outages at both Tarong and Tarong North power stations in
early 2020.
• The failure of the Heywood interconnector connecting South Australia with Victoria in early 2020
In 2020, higher than forecast GPG was most notable in Queensland. In addition to the Tarong and Tarong
North generation outages, the 2020 calendar year also experienced the lowest gas spot prices since 2016,
resulting in lower-priced market offers from Queensland GPG such as Darling Downs and Swanbank E, which
displaced black coal-fired generation.
Forecast accuracy for GPG in 2020 was better in the other regions, however in the southern states lower than
anticipated wind availability in the winter months resulted in higher than forecast GPG consumption.
Increasing numbers of renewable generation developments in the NEM are expected to continue to drive
down gas consumption for GPG, however the absolute level of consumption will be dependent on events, like
those described above, that are difficult to anticipate.
Figure 41 NEM gas annual consumption forecast comparison, GPG
Table 15 provides an overview of the forecast accuracy since 2016 of the calendar year immediately following
the forecast. The GPG forecast accuracy ranges from a -41.1% underforecast for the 2019 calendar year up to
a 5% overforecast for 2018 calendar year. The average forecast error in the past five years was -17.3%.
Table 15 Year ahead historical forecast accuracy, GPG
2016 2017 2018 2019 2020
Year ahead forecast 132 150 136 91 91.9
Actual consumption 139 184 13081 155 127
Forecast accuracy -5% -18% 5% -41% -27%
Source 2015 NGFR 2016 NGFR 2018 GSOO82 2019 GSOO 2020 GSOO
81 The equivalent table in the 2020 GSOO (Table 12) included a publication error. The error was limited to the published data ta ble. The comparison in this
table includes corrected 2018 consumption estimate
82 The 2018 GSOO was published in June 2018, considering data available until early April 2018. As such, the year ahead forecast included actual consumption
from January to March inclusive.
0
50
100
150
200
250
2010 2011 2012 2013 2014 2015 2016 2017 2018 2019 2020 2021 2022 2023 2024 2025
Annual C
onsu
mp
tio
n (
PJ)
NGFR 2014 NGFR 2015 NGFR 2016 GSOO 2018
GSOO 2019 GSOO 2020 GSOO 2021 Actual Consumption

© AEMO 2021 | Gas Statement of Opportunities 74
As outlined above, the primary causes of forecast inaccuracy are power system events and weather variability.
To demonstrate this, and to validate the model used for the GPG forecasts, AEMO performed a back-cast for
the 12-month period from September 2019 to August 2020, where all significant events and sources of
uncertainty during this timeframe (refer above) were explicitly modelled.
Figure 42 shows monthly NEM-wide GPG consumption from the back-cast, compared with actual
consumption. The mean absolute error in the back-cast is 1.35 PJ per month. The total annual difference in
the back-cast is 0.19%, which is lower than the average forecast error since 2016. Forecast accuracy therefore
improves significantly when the impact of power system events and weather variability is removed, providing
confidence that the GPG model used to generate the GPG forecasts is robust. This also demonstrates how
much these events have impacted GPG consumption in the past, and why AEMO has focused on GPG risks
that could lead to increased demand in the gas supply adequacy assessment outlined in Section 4.
Figure 42 NEM monthly GPG consumption (September 2019 to August 2020), actual vs back-cast
The following sections provide a regional breakdown of the GPG forecasts, which allows NEM event patterns
to be more clearly understood. The GPG back-cast forecasts can also be seen in each of the regional charts.
New South Wales GPG forecasts
Figure 43 shows New South Wales GPG forecasts and actual GPG consumption since 2010.
The forecasts have generally trended down since 2014 and correctly capture declining consumption, however
a number of events have caused GPG volumes to deviate from the projections:
• In 2017, the unforeseen retirement of Hazelwood Power Station in Victoria contributed to increased GPG
generation in New South Wales, above what was forecast.
• In 2018, GPG consumption was below projections, due to a significant increase in output from new
renewable generation that was not reflected in the forecast.
• In 2019, coal shortages at Mount Piper Power Station and the extended outage at Loy Yang A2 unit drove
an increase in GPG consumption, well above the forecast.
• In 2020, consumption was well aligned to the 2019 and 2020 GSOO forecasts. Average electricity spot
prices were lower in 2020 compared to recent years, with lower demand and increased output from VRE.
The majority of the year also saw no major coal outages in the region and increased output at Mount
Piper, which meant there was a reduced need for GPG.
0
2
4
6
8
10
12
14
16
18
20
Sep-19 Oct-19 Nov-19 Dec-19 Jan-20 Feb-20 Mar-20 Apr-20 May-20 Jun-20 Jul-20 Aug-20
Mo
nth
ly C
onsu
mp
tio
n (
PJ)
Back-cast Actual Consumption
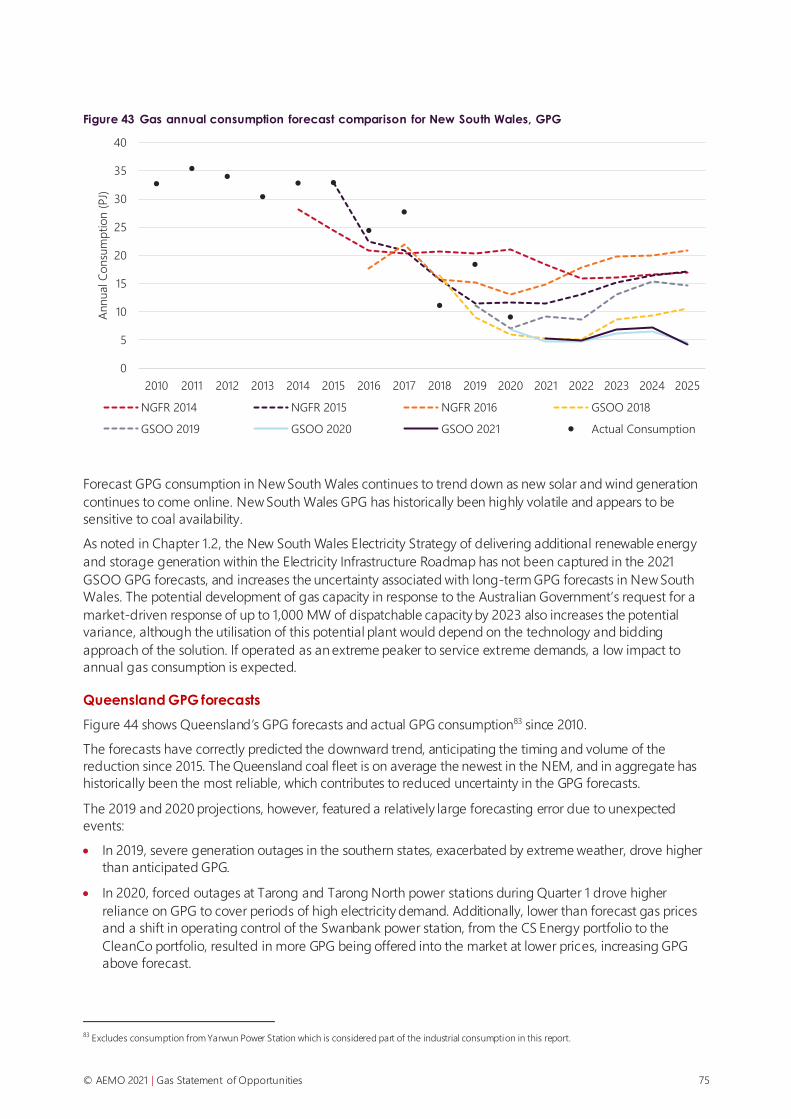
© AEMO 2021 | Gas Statement of Opportunities 75
Figure 43 Gas annual consumption forecast comparison for New South Wales, GPG
Forecast GPG consumption in New South Wales continues to trend down as new solar and wind generation
continues to come online. New South Wales GPG has historically been highly volatile and appears to be
sensitive to coal availability.
As noted in Chapter 1.2, the New South Wales Electricity Strategy of delivering additional renewable energy
and storage generation within the Electricity Infrastructure Roadmap has not been captured in the 2021
GSOO GPG forecasts, and increases the uncertainty associated with long-term GPG forecasts in New South
Wales. The potential development of gas capacity in response to the Australian Government’s request for a
market-driven response of up to 1,000 MW of dispatchable capacity by 2023 also increases the potential
variance, although the utilisation of this potential plant would depend on the technology and bidding
approach of the solution. If operated as an extreme peaker to service extreme demands, a low impact to
annual gas consumption is expected.
Queensland GPG forecasts
Figure 44 shows Queensland’s GPG forecasts and actual GPG consumption83 since 2010.
The forecasts have correctly predicted the downward trend, anticipating the timing and volume of the
reduction since 2015. The Queensland coal fleet is on average the newest in the NEM, and in aggregate has
historically been the most reliable, which contributes to reduced uncertainty in the GPG forecasts.
The 2019 and 2020 projections, however, featured a relatively large forecasting error due to unexpected
events:
• In 2019, severe generation outages in the southern states, exacerbated by extreme weather, drove higher
than anticipated GPG.
• In 2020, forced outages at Tarong and Tarong North power stations during Quarter 1 drove higher
reliance on GPG to cover periods of high electricity demand. Additionally, lower than forecast gas prices
and a shift in operating control of the Swanbank power station, from the CS Energy portfolio to the
CleanCo portfolio, resulted in more GPG being offered into the market at lower prices, increasing GPG
above forecast.
83 Excludes consumption from Yarwun Power Station which is considered part of the industrial consumption in this report.
0
5
10
15
20
25
30
35
40
2010 2011 2012 2013 2014 2015 2016 2017 2018 2019 2020 2021 2022 2023 2024 2025
Annual C
onsu
mp
tio
n (
PJ)
NGFR 2014 NGFR 2015 NGFR 2016 GSOO 2018
GSOO 2019 GSOO 2020 GSOO 2021 Actual Consumption
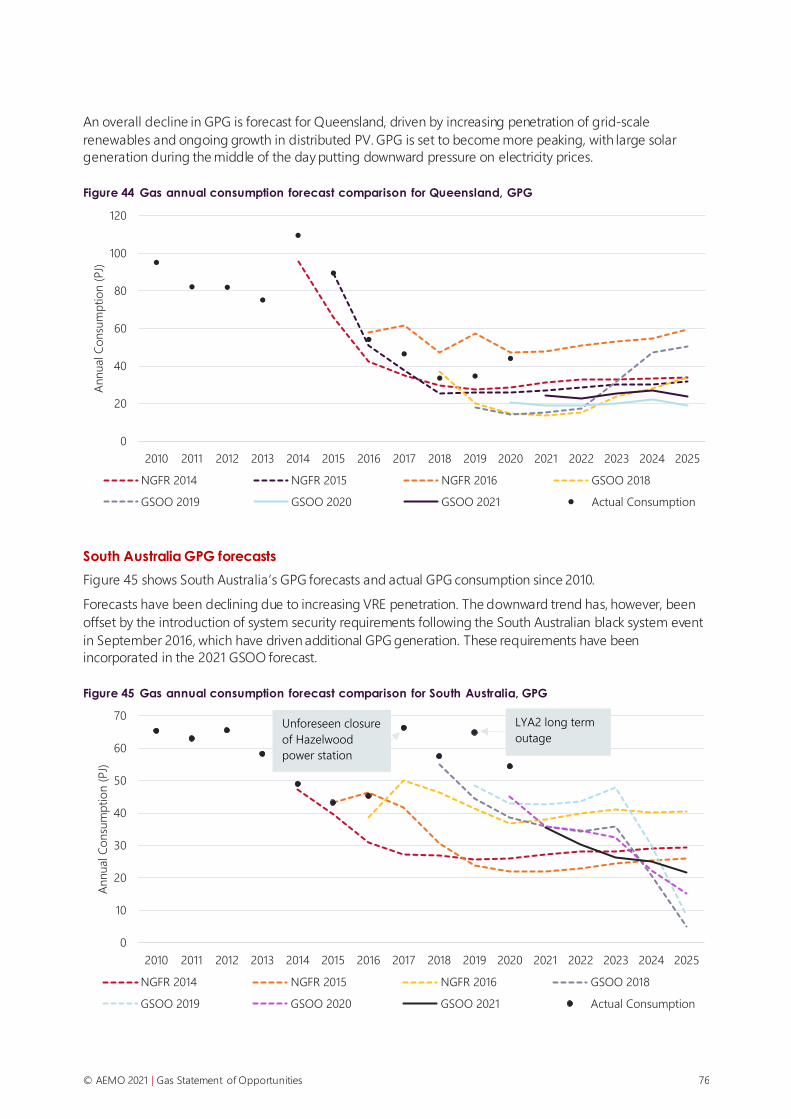
© AEMO 2021 | Gas Statement of Opportunities 76
An overall decline in GPG is forecast for Queensland, driven by increasing penetration of grid-scale
renewables and ongoing growth in distributed PV. GPG is set to become more peaking, with large solar
generation during the middle of the day putting downward pressure on electricity prices.
Figure 44 Gas annual consumption forecast comparison for Queensland, GPG
South Australia GPG forecasts
Figure 45 shows South Australia’s GPG forecasts and actual GPG consumption since 2010.
Forecasts have been declining due to increasing VRE penetration. The downward trend has, however, been
offset by the introduction of system security requirements following the South Australian black system event
in September 2016, which have driven additional GPG generation. These requirements have been
incorporated in the 2021 GSOO forecast.
Figure 45 Gas annual consumption forecast comparison for South Australia, GPG
0
20
40
60
80
100
120
2010 2011 2012 2013 2014 2015 2016 2017 2018 2019 2020 2021 2022 2023 2024 2025
Annual C
onsu
mp
tio
n (
PJ)
NGFR 2014 NGFR 2015 NGFR 2016 GSOO 2018
GSOO 2019 GSOO 2020 GSOO 2021 Actual Consumption
0
10
20
30
40
50
60
70
2010 2011 2012 2013 2014 2015 2016 2017 2018 2019 2020 2021 2022 2023 2024 2025
An
nual C
onsu
mp
tio
n (
PJ)
NGFR 2014 NGFR 2015 NGFR 2016 GSOO 2018
GSOO 2019 GSOO 2020 GSOO 2021 Actual Consumption
Unforeseen closure
of Hazelwood
power station
LYA2 long term
outage

© AEMO 2021 | Gas Statement of Opportunities 77
In 2017 and 2019, GPG actual consumption was substantially higher than the forecasts. Key drivers of the
underforecast were the Hazelwood Power Station closure in 2017 and a major outage at Loy Yang A2 unit in
Victoria in 2019.
GPG consumption in South Australia is projected to continue to trend down as high-inertia synchronous
condensers are brought online, reducing the need for GPG operation to maintain system security, and the
growing share of renewable generation, particularly distributed PV systems, continues to reduce operational
demand. Consumption will also be contingent on the retirement of existing GPG assets such as Osborne
Power Station (announced by 2023-24) and development of Project Energy Connect (2024-25), a high
voltage transmission line that is proposed to connect South Australia and New South Wales.
Tasmania GPG forecasts
Figure 46 shows Tasmania’s GPG forecasts and actual GPG consumption since 2010.
GPG consumption in Tasmania followed a steady decline between 2012 and 2015. AEMO’s forecasts
effectively captured this trend, and since 2015 have projected volumes settling on a flat trajectory of low
consumption, reflecting the average abundance of hydro generation in the region and increasing wind
penetration:
• In the past five years, however, actual consumption has been very volatile and event-driven, reducing the
accuracy of the forecast.
• In 2016, Tasmanian GPG increased due to a failure of the Basslink interconnector which led Tasmania to
operate in islanding mode from December 2015 until mid-2016.
• In 2017 and 2019, the spike can be partially attributed to the Hazelwood closure and outage at Loy Yang
A2 unit.
• In 2020, the forecast was particularly accurate, as there were no major power disturbances and weather
event that increased reliance on GPG.
As VRE increases both locally and on the mainland, GPG in Tasmania is likely to continue to play a marginal
role, primarily as a back-up fuel when hydro reservoirs are low or when renewable generation is not available.
Figure 46 Gas annual consumption forecast comparison for Tasmania, GPG
0
2
4
6
8
10
12
14
2010 2011 2012 2013 2014 2015 2016 2017 2018 2019 2020 2021 2022 2023 2024 2025
Annual C
onsu
mp
tio
n (
PJ)
NGFR 2014 NGFR 2015 NGFR 2016 GSOO 2018
GSOO 2019 GSOO 2020 GSOO 2021 Actual Consumption
Unforeseen closure of
Hazelwood power station
LYA2 long term
outage

© AEMO 2021 | Gas Statement of Opportunities 78
Victoria GPG forecasts
Figure 47 shows Victoria’s GPG forecasts and actual GPG consumption since 2010. Following five years of
sustained growth in GPG usage, since 2015 actual consumption has recorded a large year on year variability
not reflected in the forecasts. The forecast error has largely been driven by events, particularly brown coal
outages which have resulted in higher than expected GPG.
Figure 47 Gas annual consumption forecast comparison for Victoria, GPG
Spikes above forecast in 2017 and 2019 can be attributed to Hazelwood’s closure and a major outage at Loy
Yang A respectively. No severe outages occurred in 2020, and increasing penetration of VRE drove GPG
reduction. This was accurately forecast at an aggregate level. However, there were a number of events that
led to a larger than projected intra-year variability. The South Australia islanding event in February 2020, for
example, required additional generation from Mortlake, which resulted in approximately 2 PJ of increased
consumption. This was more than offset by lower GPG throughout the year as a result of new VRE and the
COVID-19 lockdowns.
AEMO forecasts a decline in GPG gas consumption, driven by energy surplus from Victorian Renewable
Energy Target (VRET) projects and the ongoing growth in distributed PV. However, as reliability of the coal
fleet deteriorates and capacity withdraws84, GPG remains vital in Victoria, as a capacity reserve in the event of
weather events and power system shocks. The Victorian GPG fleet is dominated by OCGTs which are peaking
in nature and mostly operating at the margin. This makes their dispatch patterns much more volatile and less
predictable than that of CCGTs.
84 The GSOO 2021 forecast did not include the recent announcement of Energy Australia that it would close the Yallourn power sta tion earlier than
anticipated.
0
5
10
15
20
25
30
35
40
2010 2011 2012 2013 2014 2015 2016 2017 2018 2019 2020 2021 2022 2023 2024 2025
Annual C
onsu
mp
tio
n (
PJ)
NGFR 2014 NGFR 2015 NGFR 2016 GSOO 2018
GSOO 2019 GSOO 2020 GSOO 2021 Actual Consumption
Unforeseen closure
of Hazelwood
power station
LYA2 long term
outage

© AEMO 2021 | Gas Statement of Opportunities 79
Measures and abbreviations
Units of measure
Abbreviation Full name
GW gigawatts
GJ gigajoules
MW megawatts
PJ petajoules
TJ terajoules
TJ/d terajoules a day
Abbreviations
Abbreviation Full name
2C (best estimate of) contingent resources
2P proved and probable
ABS Australian Bureau of Statistics
ACCC Australian Competition and Consumer Commission
CCGT closed-cycle gas turbine
CGP Carpentaria Gas Pipeline
CSG coal seam gas
DISER Department of Industry, Science, Energy and Resources (federal)
DTS Declared Transmission System (Victoria)
EGP Eastern Gas Pipeline
ESOO Electricity Statement of Opportunities
FID final investment decision
FRG Forecasting Reference Group
GBB Gas Bulletin Board

© AEMO 2021 | Gas Statement of Opportunities 80
Abbreviation Full name
GEMS Greenhouse Energy Minimum Standards
GPG gas-powered generation
GSOO Gas Statement of Opportunities
GSP Gross State Product
ISP Integrated System Plan
LIL Large Industrial Load
LNG liquefied natural gas
MSP Moomba – Sydney Pipeline
NEM National Electricity Market
NGFR National Gas Forecasting Report
NGIP National Gas Infrastructure Plan
NGP Northern Gas Pipeline
POE probability of exceedance
PRMS Petroleum Resource Management System
PV photovoltaic
SMIL Small to Medium Industrial Load
SWQP South West Queensland Pipeline
UAFG unaccounted for gas
UGS Underground Storage
VEU Victorian Energy Upgrades
VGPR Victorian Gas Planning Report
VNI Victorian Northern Interconnect
VRE variable renewable energy
VRET Victorian Renewable Energy Target
WORM Western Outer Ring Main

© AEMO 2021 | Gas Statement of Opportunities 81
Glossary
Term Definition
1-in-2 The 1-in-2 maximum demand projection has a 50% probability of exceedance (POE). This projected
level of demand is expected, on average, to be exceeded once in two years.
1-in-20 The 1-in-20 maximum demand projection (for severe weather conditions) has a 5% probability of
exceedance (POE). This is expected, on average, to be exceeded once in 20 years.
2C contingent resources Best estimate of contingent resources – equivalent to 2P reserves, except for one or more
contingencies or uncertainties currently impacting the likelihood of development. Can move to 2P
classification once the contingencies are resolved.
2P reserves The sum of proved and probable estimates of gas reserves. The best estimate of commercially
recoverable reserves, often used as the basis for reports to share markets, gas contracts, and project
economic justification.
Anticipated supply Considers gas supply from undeveloped reserves or contingent resources that producers forecast to
be available as part of their best production estimates provided to AEMO.
basin A geological formation that may contain coal, gas, and oil.
coal seam gas (CSG) Gas found in coal seams that cannot be economically produced using conventional oil and gas
industry techniques. Also referred to in other industry sources as coal seam methane (CSM) or coal
bed methane (CBM).
Committed supply Considers developments or projects which have successfully passed a financial investment decision
(FID), and are progressing through the engineering, procurement, and construction (EPC) phase, but
are not currently operational.
consumption The measure of gas usage over time, typically one year. When forecasting, the consumption represents
the total demand for energy over the given period.
contingent resources Gas resources that are known but currently considered uncommercial based on one or more
uncertainties (contingencies) such as commercial viability, quantities of gas, technical issues, or
environmental approvals.
conventional gas Gas that is produced using conventional or traditional oil and gas industry practices.
demand Capacity or gas flow on an hourly or daily basis, or the electrical power requirement met by generating
units.
developed reserves Gas supply from existing wells.
distributed PV Photovoltaic systems that are small, such as rooftop installations.
domestic gas Gas that is used within Australia for residences, businesses, power generators, etc. This excludes gas
demand for LNG exports.
gas-powered
generation (GPG)
The generation of electricity using gas as a fuel for turbines, boilers, or engines.
large industrial loads
(LIL)
A segment of the gas market defined to include businesses that consume more than 10 TJ a year.

© AEMO 2021 | Gas Statement of Opportunities 82
Term Definition
large-scale solar All scheduled solar PV generators on the NEM. Includes all installations larger than 30 MW.
liquefied natural gas
(LNG)
Natural gas that has been converted into liquid form for ease of storage or transport.
market segments For purposes of developing gas demand projections, gas consumers are grouped into domestic
market segments (residential/commercial, large industrial, and gas demand for GPG), and gas demand
for LNG export.
National Electricity
Market (NEM)
The wholesale market for electricity supply in Queensland, New South Wales, the Australian Capital
Territory, Victoria, Tasmania, and South Australia.
probability of
exceedance (POE)
Refers to the probability that a forecast electricity maximum demand figure will be exceeded. For
example, a forecast 5% probability of exceedance (POE) maximum demand will, on average, be
exceeded only one year in every 20, and is equivalent to 1-in-20 terminology.
probable reserves Estimated quantities of gas that have a reasonable probability of being produced under existing
economic and operating conditions. Proved-plus-probable reserves added together make up 2P
reserves.
production In the context of defining gas reserves, gas that has already been recovered and produced.
prospective resources Gas volumes estimated to be recoverable from a prospective reservoir that has not yet been drilled.
These estimates are therefore based on less direct evidence than other categories.
proved and probable See 2P reserves.
reserves Reserves are quantities of gas which are anticipated to be commercially recovered from known
accumulations.
reservoir In geology, a naturally occurring storage area that traps and holds oil and/or gas. Iona Underground
Storage (UGS) is also referred to as a reservoir for gas storage.
resources More uncertain and less commercially viable than reserves. See contingent resources and prospective
resources.
scenario analysis Identifying and projecting internally consistent political, economic, social, and technological trends into
the future and exploring the implications.
sensitivity analysis A technique used to determine how different values of an independent variable will impact a particular
dependent variable under a given set of assumptions. For example, in the GSOO, new supply options
are tested as a sensitivity to the Neutral scenario.
Small to medium
industrial load (SMIL)
A segment of the gas market defined to include business with consumption between 10 TJ and 499 TJ
per annum at individual sites.
undeveloped reserves Gas supply from wells yet to be drilled.
Variable renewable
energy (VRE)
Electricity generation from solar and wind energy whose availability is determined by weather
conditions.


