GASB 45 Reporting and Disclosure Requirements As the Phase II governments prepare to implement GASB 45 on June 30, 2009, the VGFOA Education Committee thought it might be useful to provide an overview of GASB 45’s reporting and disclosure requirements and to provide examples of the financial statements, footnotes and required supplemental information from several Virginia governments. The current examples include two types of funding including establishing a trust fund and providing no funding. Reporting Overview : Annual OPEB cost must be shown in government-wide financial statements or in the financial statements of proprietary or fiduciary funds from which OPEB contributions are made. Any Net OPEB obligation should be reflected as a liability (if under funded) or an asset (if over funded) in government-wide financial statements or the financial statements of proprietary or fiduciary funds depending upon which fund type is used for OPEB contributions. If contributions are made to a pooled trust where contributions are irrevocable the reports should show the OPEB expense/expenditures for the contractually required contributions. Disclosure Overview: GASB 45 requires that notes to the financial statements include: • Description of Plan • Funding Policy • Amounts and Components of Cost • Annual Required Contribution • Annual OPEB Cost • Net OPEB Obligation • Actual Contribution Rate • Actuarial valuation date • Actuarial accrued liability (AAL) • Actuarial value of assets • Funded ratio (actuarial value of plan assets/AAL) • Unfunded Actuarial Accrued Liability (UAAL) • UAAL to covered payroll • Actuarial Methods and Assumptions Required Supplemental Information must include: • Multi-Year (Current and two past years) Schedule of Funding Progress • Annual Required Contribution • Actual Percentage Contributed
Transcript
GASB 45 Reporting and Disclosure Requirements
As the Phase II governments prepare to implement GASB 45 on June 30, 2009, the VGFOA Education Committee thought it might be useful to provide an overview of GASB 45’s reporting and disclosure requirements and to provide examples of the financial statements, footnotes and required supplemental information from several Virginia governments. The current examples include two types of funding including establishing a trust fund and providing no funding.
Reporting Overview:
Annual OPEB cost must be shown in government-wide financial statements or in the financial statements of proprietary or fiduciary funds from which OPEB contributions are made. Any Net OPEB obligation should be reflected as a liability (if under funded) or an asset (if over funded) in government-wide financial statements or the financial statements of proprietary or fiduciary funds depending upon which fund type is used for OPEB contributions.
If contributions are made to a pooled trust where contributions are irrevocable the reports should show the OPEB expense/expenditures for the contractually required contributions.
Disclosure Overview:
GASB 45 requires that notes to the financial statements include:
• Description of Plan
• Funding Policy
• Amounts and Components of Cost
• Annual Required Contribution
• Annual OPEB Cost
• Net OPEB Obligation
• Actual Contribution Rate
• Actuarial valuation date
• Actuarial accrued liability (AAL)
• Actuarial value of assets
• Funded ratio (actuarial value of plan assets/AAL)
• Unfunded Actuarial Accrued Liability (UAAL)
• UAAL to covered payroll
• Actuarial Methods and Assumptions
Required Supplemental Information must include:
• Multi-Year (Current and two past years) Schedule of Funding Progress
• Annual Required Contribution
• Actual Percentage Contributed
The following includes excerpts are from the 2008 CAFRs of Fairfax County and Hanover County which show the relevant disclosures for employers who have established trust funds; and Prince William County Schools and Loudoun County which provided no FY2008 funding and therefore utilized the government-wide approach.
Fairfax County COUNTY OF FAIRFAX, VIRGINIA
Statement of Net Assets
June 30, 2008 Primary Government Total Governmental Business-type Primary Activities Activities Government ASSETS
Equity in pooled cash and temporary investments $ 1,168,266,363 97,729,775 1,265,996,138
Other 26,474 - 26,474 Due from intergovernmental units (net of allowances): Property tax relief: Property tax relief - not yet due 211,313,944 - 211,313,944 Other 105,836,233 24,594,832 130,431,065 Due from primary government - - -
Due from component units 1,502,528 - 1,502,528 Loan to component unit 15,375,000 - 15,375,000 Lease to component unit 57,805,000 - 57,805,000 Interfund receivables 331,222 (331,222) -
Inventories of supplies 3,165,831 563,125 3,728,956 Prepaid and other assets 189,381 - 189,381 Restricted assets: Equity in pooled cash and temporary investments 39,521,240 30,300,590 69,821,830 Cash with fiscal agents 839,598 - 839,598 Certificates of deposit - performance bonds 58,790 - 58,790 Investments - 11,725,477 11,725,477 Land held for sale -
Capital assets: Non-depreciable: Land 416,738,664 17,630,088 434,368,752 Construction/Equipment in progress 90,252,484 51,343,979 141,596,463 Depreciable/amortizable: Equipment 312,131,811 11,002,819 323,134,630 Library collections 70,034,685 - 70,034,685 Purchased capacity - 684,908,046 684,908,046 Buildings and improvements 1,194,500,839 961,400,289 2,155,901,128 Infrastructure 543,396,449 - 543,396,449 Accumulated depreciation (699,990,213) (421,067,023) (1,121,057,236) Accumulated amortization - (144,380,755) (144,180,755) Net OPEB Asset 27,032,610 - 27,032,610 Deferred bond issuance costs (net of amortization) 8,978,536 315,015 9,293,551
Total assets $ 6,043,654,199 1,326,238,468 7,369,892,667
See accompanying notes to the financial statements.
COUNTY OF FAIRFAX, VIRGINIA COMPREHENSIVE ANNUAL FINANCIAL REPORT
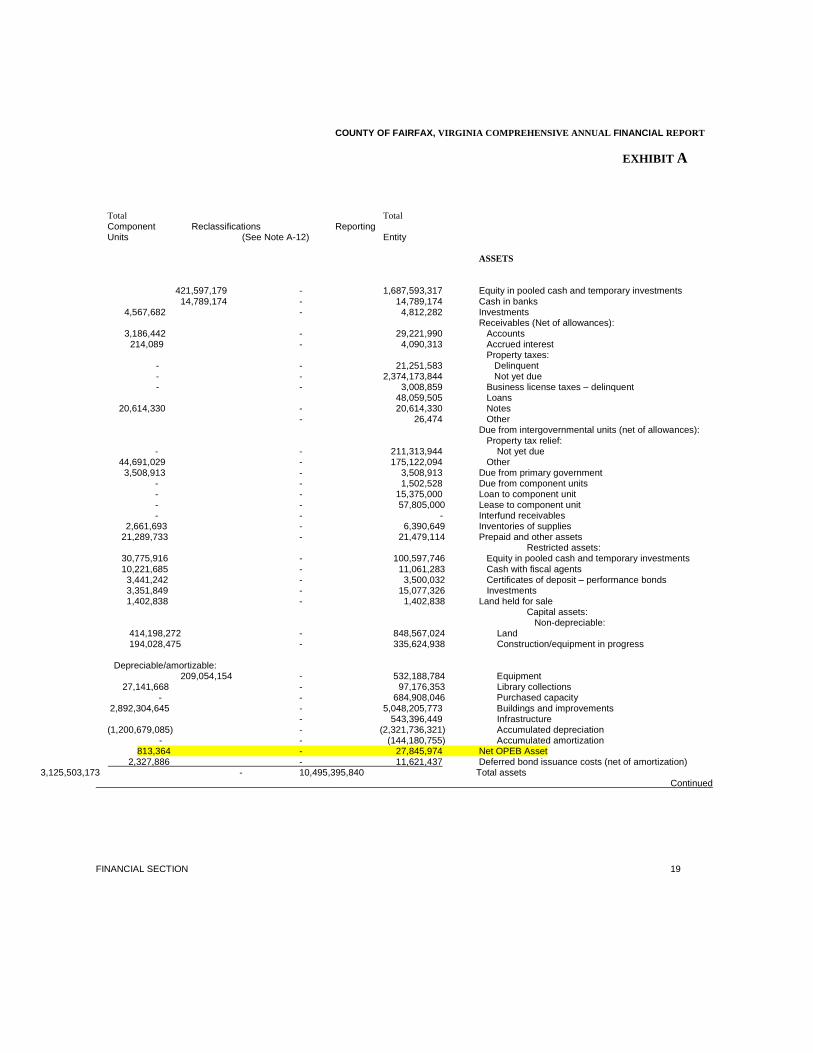
EXHIBIT A
Total Total
Component Reclassifications Reporting Units (See Note A-12) Entity
ASSETS
421,597,179 - 1,687,593,317 Equity in pooled cash and temporary investments 14,789,174 - 14,789,174 Cash in banks
214,089 - 4,090,313 Accrued interest Property taxes: - - 21,251,583 Delinquent - - 2,374,173,844 Not yet due - - 3,008,859 Business license taxes – delinquent 48,059,505 Loans
20,614,330 - 20,614,330 Notes - 26,474 Other Due from intergovernmental units (net of allowances): Property tax relief: - - 211,313,944 Not yet due 44,691,029 - 175,122,094 Other 3,508,913 - 3,508,913 Due from primary government - - 1,502,528 Due from component units - - 15,375,000 Loan to component unit - - 57,805,000 Lease to component unit - - - Interfund receivables 2,661,693 - 6,390,649 Inventories of supplies 21,289,733 - 21,479,114 Prepaid and other assets Restricted assets: 30,775,916 - 100,597,746 Equity in pooled cash and temporary investments 10,221,685 - 11,061,283 Cash with fiscal agents 3,441,242 - 3,500,032 Certificates of deposit – performance bonds 3,351,849 - 15,077,326 Investments 1,402,838 - 1,402,838 Land held for sale Capital assets: Non-depreciable: 414,198,272 - 848,567,024 Land 194,028,475 - 335,624,938 Construction/equipment in progress Depreciable/amortizable:
813,364 - 27,845,974 Net OPEB Asset 2,327,886 - 11,621,437 Deferred bond issuance costs (net of amortization)
3,125,503,173 - 10,495,395,840 Total assets Continued FINANCIAL SECTION 19
BASIC FINANCIAL STATEMENTS
COUNTY OF FAIRFAX, VIRGINIA EXHIBIT A-2 Reconciliation of the Balance Sheet to the Statement of Net Assets concluded Governmental Funds
June 30, 2008
Fund balances - Total governmental funds $ 734,766,447 Amounts reported for governmental activities in the statement of net assets (Exhibit A) are different because:
Capital assets used in governmental fund activities are not financial resources and, therefore, are not reported in the funds:
Non-depreciable assets:
Land $ 414,799,976
Construction in progress 88,643,103 Depreciable assets: Equipment 212,466,460 Library collections 70,034,685 Buildings and improvements 1,176,098,587 Infrastructure 543,396,449 Total capital assets 2,505,439,260 Less accumulated depreciation (628,656,129) 1,876,783,131
Some of the County’s receivables will not be collected soon enough to pay for the current period’s expenditures and, therefore, are reported as deferred revenue in the funds:
Delinquent taxes (net of allowances):
Property $ 17,010,238
Business license 3,008,859 Sales and use and other taxes 22,017,715 EMS transport and other charges for services 6,569,431 Lease to component unit 57,805,000 106,411,243
Costs incurred from the issuance of long-term debt are recognized as expenditures in the fund statements, but are deferred in the government-wide statements. 8,978,536
OPEB costs are recognized as expenditures in the fund statements, but are deferred in the government-wide statements. 27,032,610
Internal service funds are used by management to provide certain goods and services to governmental funds. The assets and liabilities of the internal service funds are included in governmental activities in the statement of net assets.
Assets:
Current assets $ 164,405,550
Capital assets 121,615,672 Less accumulated depreciation (71,334,084) Liabilities (51,892,121) 162,795,017
Long-term liabilities related to governmental fund activities are not due and payable in the current period and, therefore, are not reported in the funds:
General obligation bonds payable, net $ (1,921,839,941)
Revenue bonds payable, net (227,716,430) Notes payable (49,944,128) Compensated absences payable (98,854,932) Landfill closure and postclosure obligation (58,829,096) Obligations under capital leases and installment purchases (32,985,557) Net pension obligation (51,676,866) Other long-term liabilities (1,760,000) Accrued interest on long-term debt (23.571,136) (2,467,178,086) Net assets of governmental activities $ 449,588,898
FINANCIAL SECTION 25
BASIC FINANCIAL STATEMENTS
COUNTY OF FAIRFAX, VIRGINIA EXHIBIT A-3
Reconciliation of the Statement of Revenues, Expenditures, and Changes in Fund Balances concluded to the Statement of Activities
Governmental Funds
For the fiscal year ended June 30, 2008
Net change in fund balances - Total governmental funds $ (132,059,947) Amounts reported for governmental activities in the statement of activities (Exhibit A-i) are different because:
Governmental funds report capital outlays as expenditures. However, in the statement of activities, the cost of capital assets is allocated over their estimated useful lives and reported as depreciation expense.
Capital outlays $ 269,431,452 Less depreciation expense (55,892,984) 213,538,468
In the statement of activities, the gain or loss on the disposition of capital assets is reported. However, in the governmental funds, only the proceeds from sales are reported, which increase fund balance. Thus, the
difference is the net book value (i.e., depreciated cost) of the capital asset dispositions. (2,549,765)
Donations of capital assets increase net assets in the statement of activities, but do not appear in the governmental funds because they are not financial resources. 27,225,529
Some revenues will not be collected for several months after the fiscal year ends, hence, they are not considered ―available‖ revenues and are deferred in the governmental funds. Deferred revenues increased (decreased) by this amount this year:
Delinquent property taxes $ (28,709) Delinquent business license taxes 73,254 Sales and use and other taxes 2,712,493 EMS transport and other charges for services 1,625,121 4,382,159
The receipt of principal payments for the lease to the component unit does not result in a revenue in the statement of activities. (1,150,000)
The issuance of long-term debt, including premiums, is reported as other financing sources in the governmental funds and thus, increases fund balance. In the government-wide statements, however, issuing debt increases long-term liabilities in the statement of net assets and does not affect the statement of activities. The following were issued:
Series 2008A General Obligation Bonds $ (250,487,439) Bond Anticipation Note (38,771,498) (289,258,937)
The costs incurred from the issuance of long-term debt are recognized as expenditures in the fund statements, but are deferred and amortized in the government-wide statements, resulting in a net difference. 517,198
OPEB costs are recognized as expenditures in the fund statements, but are deferred and amortized
in the government-wide statements, resulting in a net difference. 27,032,610
The repayment of the principal amounts of long-term debt is reported as an expenditure or as an other financing use when debt is refunded in governmental funds and thus, reduces fund balance. However, the principal payments reduce the liabilities in the statement of net assets and do not result in an expense in the statement of activities.
Principal repayments of matured bonds, notes, and loans $ 170,249,170 Principal payments of capital leases and installment purchases 2,586,318 172,835,488
Interest on long-term debt is reported as an expenditure in the governmental funds when it is due. In the statement of activities, however, interest expense is affected as this interest accrues and as bond-related items are amortized. This difference in interest reporting is as follows:
Accrued interest on bonds, loans, and capital leases $ (2,142,928) Amortization of bond premiums 14,876,077 Amortization of deferred losses on bond refundings (3,594,646) 9,138,503
Under the modified accrual basis of accounting used in the governmental funds, expenditures for the following are not recognized until they mature. In the statement of activities, however, they are reported as expenses and liabilities as they accrue. The timing differences are as follows:
Landfill closure and postclosure costs $ (56,949) Compensated absences (5,632,934) Net pension obligation (14,159,623) Other 305,521 (19,543,985)
Internal service funds are used by management to provide certain goods and services to governmental funds. The increase in net assets is reported with governmental activities. (20,266,144) Change in net assets of governmental activities $ (10,158,823)
FINANCIAL SECTION 27
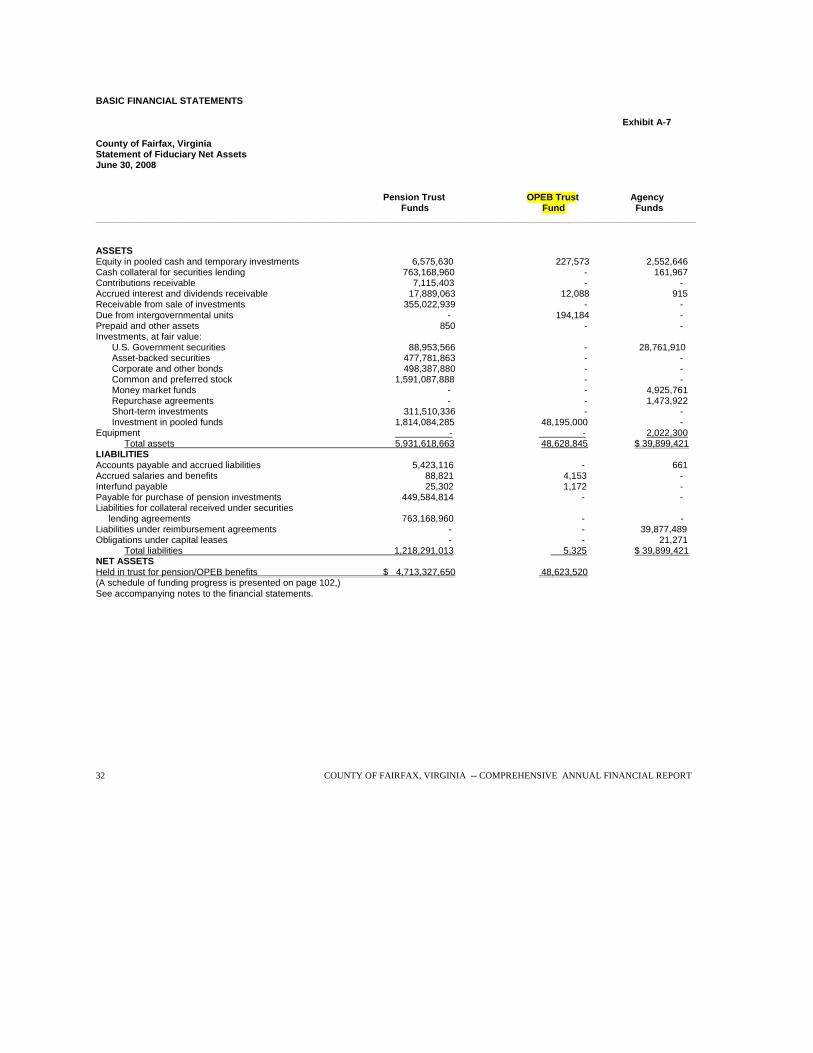
BASIC FINANCIAL STATEMENTS Exhibit A-7 County of Fairfax, Virginia Statement of Fiduciary Net Assets June 30, 2008 Pension Trust OPEB Trust Agency Funds Fund Funds ____________________________________________________________________________________________________________________ ASSETS Equity in pooled cash and temporary investments 6,575,630 227,573 2,552,646 Cash collateral for securities lending 763,168,960 - 161,967 Contributions receivable 7,115,403 - - Accrued interest and dividends receivable 17,889,063 12,088 915 Receivable from sale of investments 355,022,939 - - Due from intergovernmental units - 194,184 - Prepaid and other assets 850 - - Investments, at fair value:
U.S. Government securities 88,953,566 - 28,761,910 Asset-backed securities 477,781,863 - - Corporate and other bonds 498,387,880 - - Common and preferred stock 1,591,087,888 - - Money market funds - - 4,925,761 Repurchase agreements - - 1,473,922 Short-term investments 311,510,336 - - Investment in pooled funds 1,814,084,285 48,195,000 -
Equipment - - 2,022,300 Total assets 5,931,618,663 48,628,845 $ 39,899,421
LIABILITIES Accounts payable and accrued liabilities 5,423,116 - 661 Accrued salaries and benefits 88,821 4,153 - Interfund payable 25,302 1,172 - Payable for purchase of pension investments 449,584,814 - - Liabilities for collateral received under securities lending agreements 763,168,960 - - Liabilities under reimbursement agreements - - 39,877,489 Obligations under capital leases - - 21,271
Total liabilities 1,218,291,013 5,325 $ 39,899,421 NET ASSETS Held in trust for pension/OPEB benefits $ 4,713,327,650 48,623,520 (A schedule of funding progress is presented on page 102,) See accompanying notes to the financial statements. 32 COUNTY OF FAIRFAX, VIRGINIA -- COMPREHENSIVE ANNUAL FINANCIAL REPORT
BASIC FINANCIAL STATEMENTS
COUNTY OF FAIRFAX, VIRGINIA EXHIBIT A-8 Statement of Changes in Plan Net Assets
Trust Funds
For the fiscal year ended June 30, 2008 Pension Trust OPEB Trust Funds Fund ________________________________________________________________________________________________________________________ ADDITIONS Contributions: Employer $ 123,169,690 58,680,610 Plan members 53,294,769 -
Other - 501,658 Total contributions 176,464,459 59,182,268 Investment income: From investment activities: Net appreciation in fair value of investments (204,007,121) -
Total income from investment activities (44,688,606) 12,088 Less investment activities expenses: Management fees 19,695,717 -
Other 899,769 5,000 Total investment activities expenses 20,595,486 5,000 Net income from investment activities (65,284,092) 7,088 From securities lending activities: Securities lending income 31,428,127 -
Less securities lending expenses: Borrower rebates 24,566,393 -
Management fees 1,885,127 -
Total securities lending activities expenses 26,451,520 Net income from securities lending activities 4,976,607 -
Net investment income (60,307,485) 7,088 Total additions 116,156,974 59,189,356 DEDUCTIONS Benefits 217,531,411 10,480,610 Refunds of contributions 5,817,979 -
Administrative expenses 2,719,217 85,226 Total deductions 226,068,607 10,565,836 Net increase (decrease) (109,911,633) 48,623,520 Net assets, July 1, 2007 4,823,239,283 -
Net assets, June 30, 2008 $ 4,713,327,650 48,623,520 See accompanying notes to the financial Statements.
FINANCIAL SECTION 33
H. OTHER POST-EMPLOYMENT BENEFITS
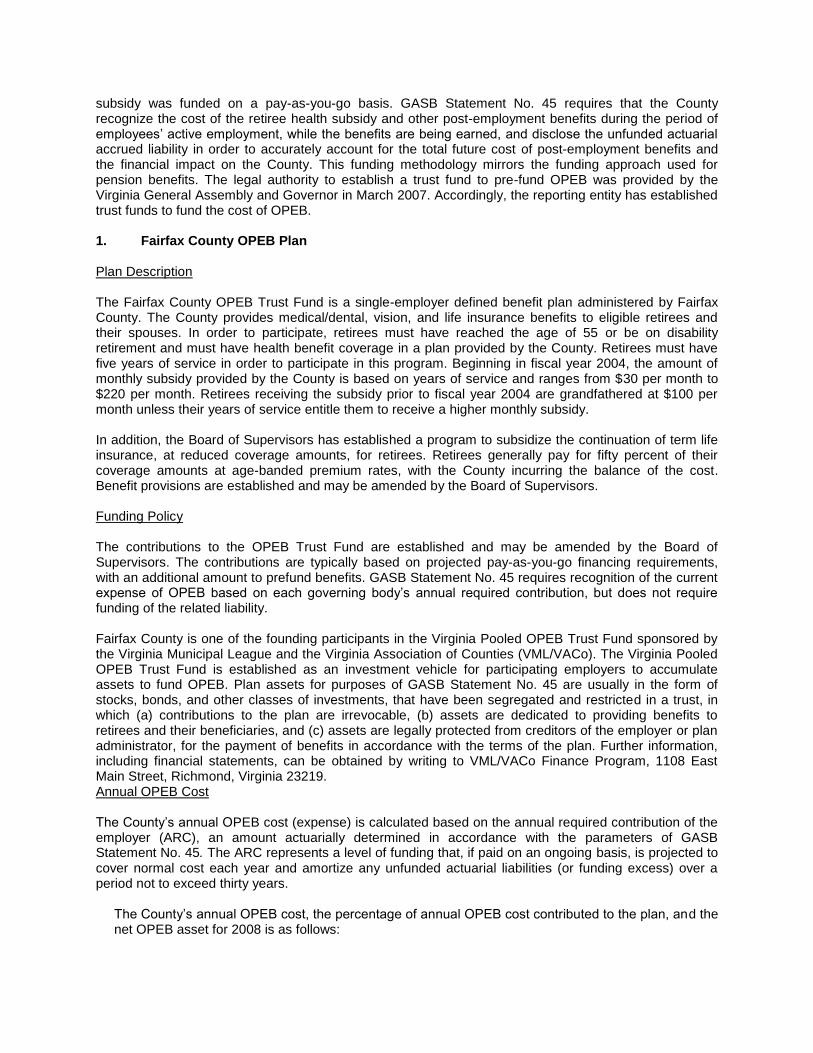
Beginning in fiscal year 2008, the reporting entity is required to implement Governmental Accounting Standards Board (GASB) Statement No. 45 for other post-employment benefits (OPEB) including health care, life insurance, and other non-pension benefits offered to retirees. This new standard addresses how the reporting entity should account for and report its costs related to post-employment health care and other non-pension benefits, such as County’s retiree health benefit subsidy. Historically, the County’s
subsidy was funded on a pay-as-you-go basis. GASB Statement No. 45 requires that the County recognize the cost of the retiree health subsidy and other post-employment benefits during the period of employees’ active employment, while the benefits are being earned, and disclose the unfunded actuarial accrued liability in order to accurately account for the total future cost of post-employment benefits and the financial impact on the County. This funding methodology mirrors the funding approach used for pension benefits. The legal authority to establish a trust fund to pre-fund OPEB was provided by the Virginia General Assembly and Governor in March 2007. Accordingly, the reporting entity has established trust funds to fund the cost of OPEB. 1. Fairfax County OPEB Plan Plan Description The Fairfax County OPEB Trust Fund is a single-employer defined benefit plan administered by Fairfax County. The County provides medical/dental, vision, and life insurance benefits to eligible retirees and their spouses. In order to participate, retirees must have reached the age of 55 or be on disability retirement and must have health benefit coverage in a plan provided by the County. Retirees must have five years of service in order to participate in this program. Beginning in fiscal year 2004, the amount of monthly subsidy provided by the County is based on years of service and ranges from $30 per month to $220 per month. Retirees receiving the subsidy prior to fiscal year 2004 are grandfathered at $100 per month unless their years of service entitle them to receive a higher monthly subsidy. In addition, the Board of Supervisors has established a program to subsidize the continuation of term life insurance, at reduced coverage amounts, for retirees. Retirees generally pay for fifty percent of their coverage amounts at age-banded premium rates, with the County incurring the balance of the cost. Benefit provisions are established and may be amended by the Board of Supervisors. Funding Policy The contributions to the OPEB Trust Fund are established and may be amended by the Board of Supervisors. The contributions are typically based on projected pay-as-you-go financing requirements, with an additional amount to prefund benefits. GASB Statement No. 45 requires recognition of the current expense of OPEB based on each governing body’s annual required contribution, but does not require funding of the related liability. Fairfax County is one of the founding participants in the Virginia Pooled OPEB Trust Fund sponsored by the Virginia Municipal League and the Virginia Association of Counties (VML/VACo). The Virginia Pooled OPEB Trust Fund is established as an investment vehicle for participating employers to accumulate assets to fund OPEB. Plan assets for purposes of GASB Statement No. 45 are usually in the form of stocks, bonds, and other classes of investments, that have been segregated and restricted in a trust, in which (a) contributions to the plan are irrevocable, (b) assets are dedicated to providing benefits to retirees and their beneficiaries, and (c) assets are legally protected from creditors of the employer or plan administrator, for the payment of benefits in accordance with the terms of the plan. Further information, including financial statements, can be obtained by writing to VML/VACo Finance Program, 1108 East Main Street, Richmond, Virginia 23219. Annual OPEB Cost The County’s annual OPEB cost (expense) is calculated based on the annual required contribution of the employer (ARC), an amount actuarially determined in accordance with the parameters of GASB Statement No. 45. The ARC represents a level of funding that, if paid on an ongoing basis, is projected to cover normal cost each year and amortize any unfunded actuarial liabilities (or funding excess) over a period not to exceed thirty years.
The County’s annual OPEB cost, the percentage of annual OPEB cost contributed to the plan, and the net OPEB asset for 2008 is as follows:
2008
ARC, for the year ended June 30 $ 31,648,000
Interest on net OPEB asset from prior year -
Actuarial adjustment -
Annual OPEB cost 31,648,000
Actual contributions (58,680,610)
Increase (decrease) in net OPEB asset, for the year ended June 30 (27,032,610)
Net OPEB asset, beginning of year -
Net OPEB asset, end of year $ (27,032,610)
Percentage of annual OPEB cost contributed 185.42%
Actuarial valuations of an ongoing plan involve estimates of the value of reported amounts and assumptions about the probability of occurrence of events far into the future. Examples include assumptions about future employment, mortality, and the healthcare cost trend. Amounts determined regarding the funded status of the plan and the annual required contributions of the employer are subject to continual revision as actual results are compared with past expectations and new estimates are made about the future. The schedule of funding progress, also presented as required supplementary information following the notes to the financial statements, presents multi-year trend information about whether the actuarial value of plan assets is increasing or decreasing over time relative to the actuarial accrued liabilities for benefits.
For the year ended June 30, 2008, the County’s OPEB funding progress is as follows:
Actuarial Unfunded UAAL (Funding
Actuarial Accrued AAL (UAAL) Excess) as a
Actuarial Value of Liability (AAL) (Funding Funded Covered Percentage of Valuation Assets - Entry Age Excess) Ratio Payroll Covered Payroll
Projections of benefits for financial reporting purposes are based on the substantive plan (the plan as understood by the employer and the plan members) and include the types of benefits provided at the time of each valuation and the historical pattern of sharing of benefit costs between the employer and plan members to that point. The actuarial methods and assumptions used include techniques that are designed to reduce the effects of short-term volatility in actuarial accrued liabilities and the actuarial value of assets, consistent with the long-term perspective of the calculations.
The ARC for fiscal year 2008 was determined as part of the July 1, 2007, actuarial valuation using the entry age actuarial cost method. Significant actuarial assumptions used in the valuation include:
a. A rate of return on the investment of present and future assets of 7.5 percent per year
compounded annually, including an inflation component of 4.0 percent. b. An annual healthcare cost trend rate of 9.0 percent initially, reduced by decrements to an
ultimate rate of 5.0 percent after five years (8.00%, 7.00%, 6.00%, 5.50%, 5.00%), including an inflation component of 4.0 percent.
The actuarial value of the OPEB assets was determined using techniques that smooth the effects of short-term volatility in the market value of investments over a five-year period. Any excess of these assets over actuarial accrued liability is amortized as a level percentage of projected payroll over an open 30 year period. The remaining amortization period is 30 years. The Fairfax County OPEB Trust Fund does not issue a stand-alone financial report and is not included in the report of a public employee retirement system or of another entity. Concentrations
The Fairfax County OPEB Trust Fund does not have investments (other than U.S. Government and U.S. Government guaranteed obligations) in any one organization that represent 5.0 percent or more of net assets held in trust for OPEB benefits.
REQUIRED SUPPLEMENTARY INFORMATION
COUNTY OF FAIRFAX, VIRGINIA
Schedule of Employer Contributions
For the fiscal year ended June 30, 2008
Primary Government Component Unit - Public Schools Other Post-Employment Other Post-Employment Benefits
C. OTHER POST-EMPLOYMENT BENEFITS (OPEB) TREND DATA
Actuarial valuations of an ongoing plan involve estimates of the value of reported amounts and assumptions about the probability of occurrence of events far into the future. Examples include assumptions about future employment, mortality, and the healthcare cost trend. Amounts determined regarding the funded status of the plan and the annual required contributions of the employer are subject to continual revision as actual results are compared with past expectations and new estimates are made about the future. The schedule of funding progress, presented as required supplementary information following the notes to the financial statements, presents multiyear trend information about whether the actuarial value of plan assets is increasing or decreasing over time relative to the actuarial accrued liabilities for benefits.
Information pertaining to the OPEB plans administered by the reporting entity can be found in Note H to the financial statements.
COUNTY OF HANOVER
COUNTY OF HANOVER, VIRGINIA
Statement of Net Assets
Economic
Governmental Business-type Development
Activities Activities Total School Authority
ASSETS
Current Assets:
Cash, cash equivalents and investments 57,255,849$ 32,399,982 89,655,831 15,288,158 265,123
Receivables (net of allowance for uncollectibles) 62,939,651 3,927,912 66,867,563 4,750,851 -
Inventories 216,041 - 216,041 131,330 -
Total current assets 120,411,541 36,327,894 156,739,435 20,170,339 265,123
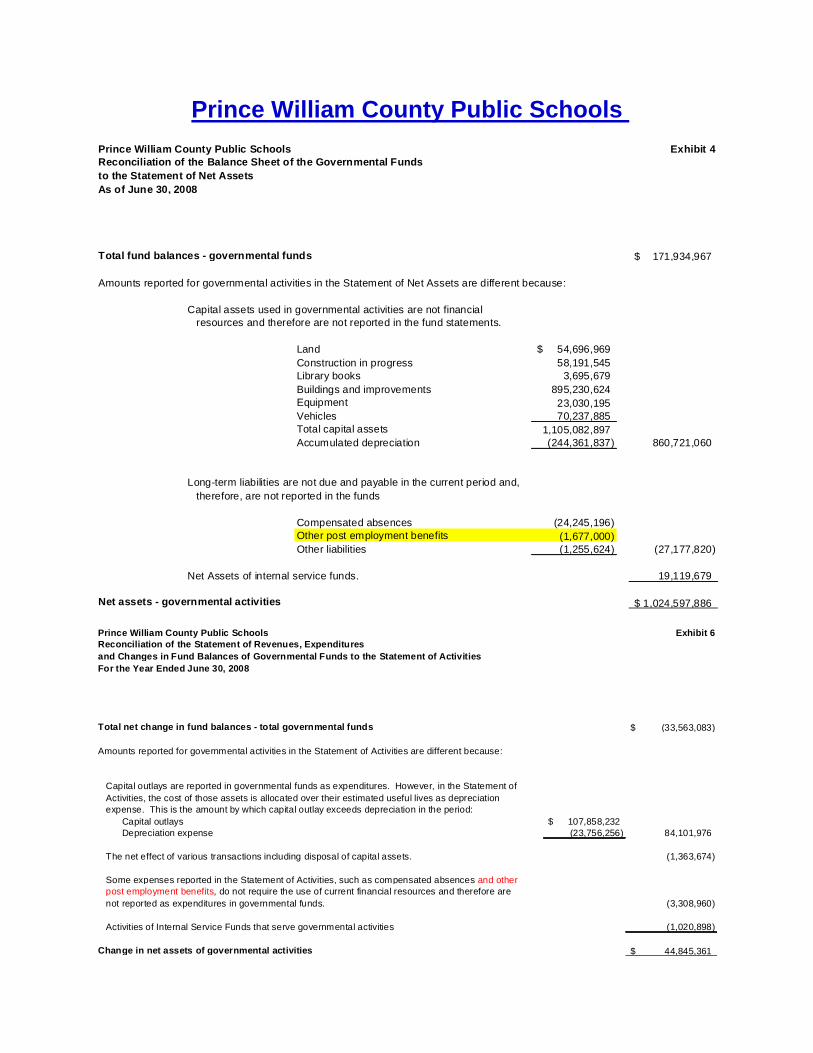
Long-term liabilities are not due and payable in the current period and,
therefore, are not reported in the funds
Compensated absences (24,245,196)
Other post employment benefits (1,677,000)
Other liabilities (1,255,624) (27,177,820)
Net Assets of internal service funds. 19,119,679
Net assets - governmental activities 1,024,597,886$ Prince William County Public Schools Exhibit 6
Reconciliation of the Statement of Revenues, Expenditures
and Changes in Fund Balances of Governmental Funds to the Statement of Activities
For the Year Ended June 30, 2008
Total net change in fund balances - total governmental funds (33,563,083)$
Amounts reported for governmental activities in the Statement of Activities are different because:
Capital outlays are reported in governmental funds as expenditures. However, in the Statement of
Activities, the cost of those assets is allocated over their estimated useful lives as depreciation
expense. This is the amount by which capital outlay exceeds depreciation in the period:
Capital outlays 107,858,232$
Depreciation expense (23,756,256) 84,101,976
The net effect of various transactions including disposal of capital assets. (1,363,674)
Some expenses reported in the Statement of Activities, such as compensated absences and other
post employment benefits, do not require the use of current financial resources and therefore are
not reported as expenditures in governmental funds. (3,308,960)
Activities of Internal Service Funds that serve governmental activities (1,020,898)
Change in net assets of governmental activities 44,845,361$
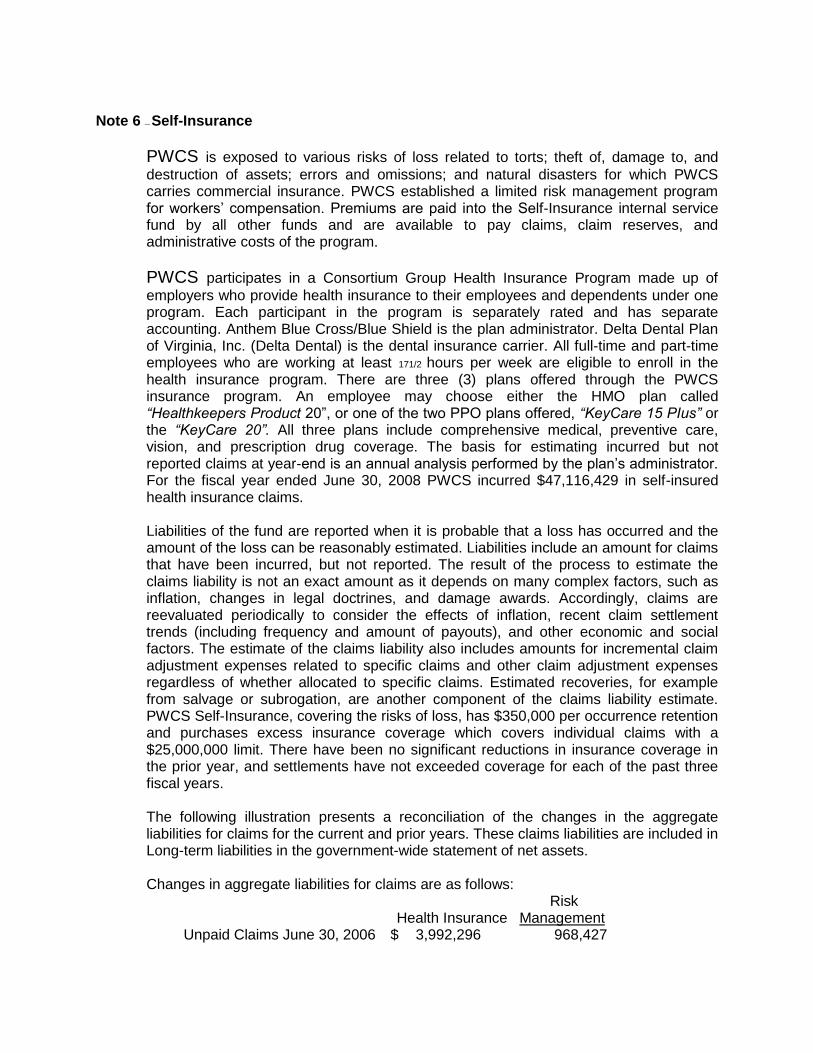
Note 6 — Self-Insurance
PWCS is exposed to various risks of loss related to torts; theft of, damage to, and
destruction of assets; errors and omissions; and natural disasters for which PWCS carries commercial insurance. PWCS established a limited risk management program for workers’ compensation. Premiums are paid into the Self-Insurance internal service fund by all other funds and are available to pay claims, claim reserves, and administrative costs of the program.
PWCS participates in a Consortium Group Health Insurance Program made up of
employers who provide health insurance to their employees and dependents under one program. Each participant in the program is separately rated and has separate accounting. Anthem Blue Cross/Blue Shield is the plan administrator. Delta Dental Plan of Virginia, Inc. (Delta Dental) is the dental insurance carrier. All full-time and part-time employees who are working at least 171/2 hours per week are eligible to enroll in the health insurance program. There are three (3) plans offered through the PWCS insurance program. An employee may choose either the HMO plan called “Healthkeepers Product 20‖, or one of the two PPO plans offered, “KeyCare 15 PIus” or the “KeyCare 20”. All three plans include comprehensive medical, preventive care, vision, and prescription drug coverage. The basis for estimating incurred but not reported claims at year-end is an annual analysis performed by the plan’s administrator. For the fiscal year ended June 30, 2008 PWCS incurred $47,116,429 in self-insured health insurance claims.
Liabilities of the fund are reported when it is probable that a loss has occurred and the amount of the loss can be reasonably estimated. Liabilities include an amount for claims that have been incurred, but not reported. The result of the process to estimate the claims liability is not an exact amount as it depends on many complex factors, such as inflation, changes in legal doctrines, and damage awards. Accordingly, claims are reevaluated periodically to consider the effects of inflation, recent claim settlement trends (including frequency and amount of payouts), and other economic and social factors. The estimate of the claims liability also includes amounts for incremental claim adjustment expenses related to specific claims and other claim adjustment expenses regardless of whether allocated to specific claims. Estimated recoveries, for example from salvage or subrogation, are another component of the claims liability estimate. PWCS Self-Insurance, covering the risks of loss, has $350,000 per occurrence retention and purchases excess insurance coverage which covers individual claims with a $25,000,000 limit. There have been no significant reductions in insurance coverage in the prior year, and settlements have not exceeded coverage for each of the past three fiscal years.
The following illustration presents a reconciliation of the changes in the aggregate liabilities for claims for the current and prior years. These claims liabilities are included in Long-term liabilities in the government-wide statement of net assets.
Changes in aggregate liabilities for claims are as follows:
Risk Health Insurance Management Unpaid Claims June 30, 2006 $ 3,992,296 968,427
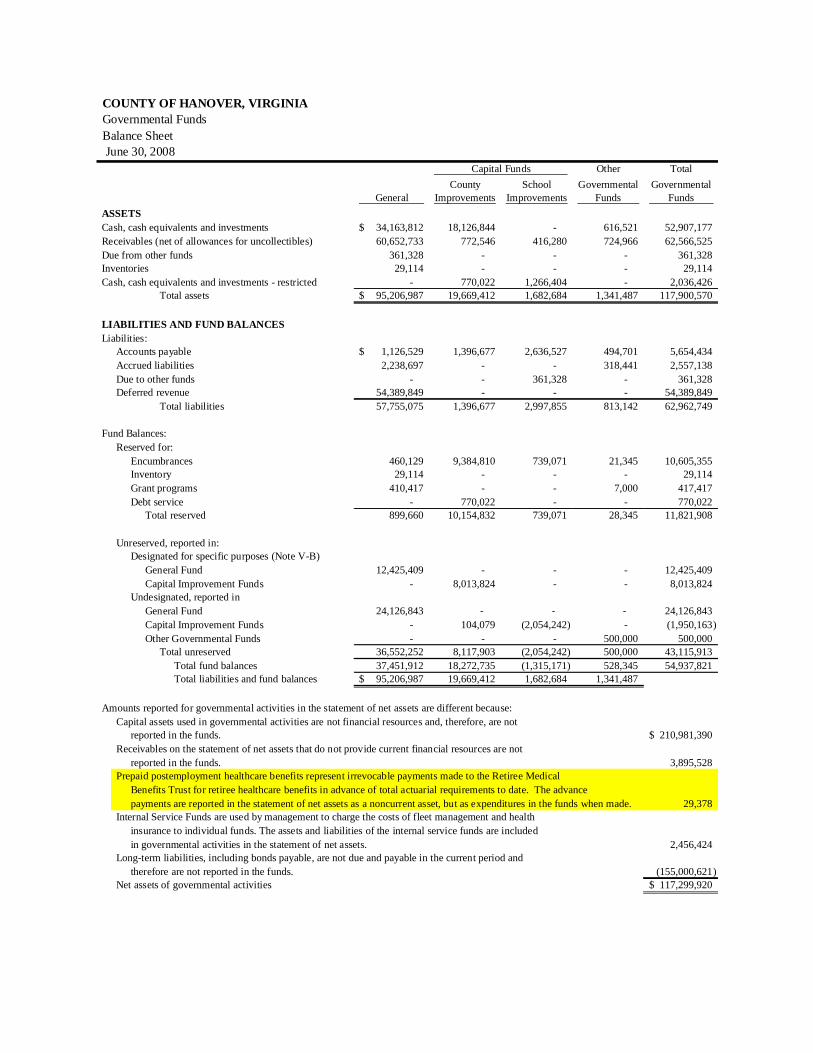
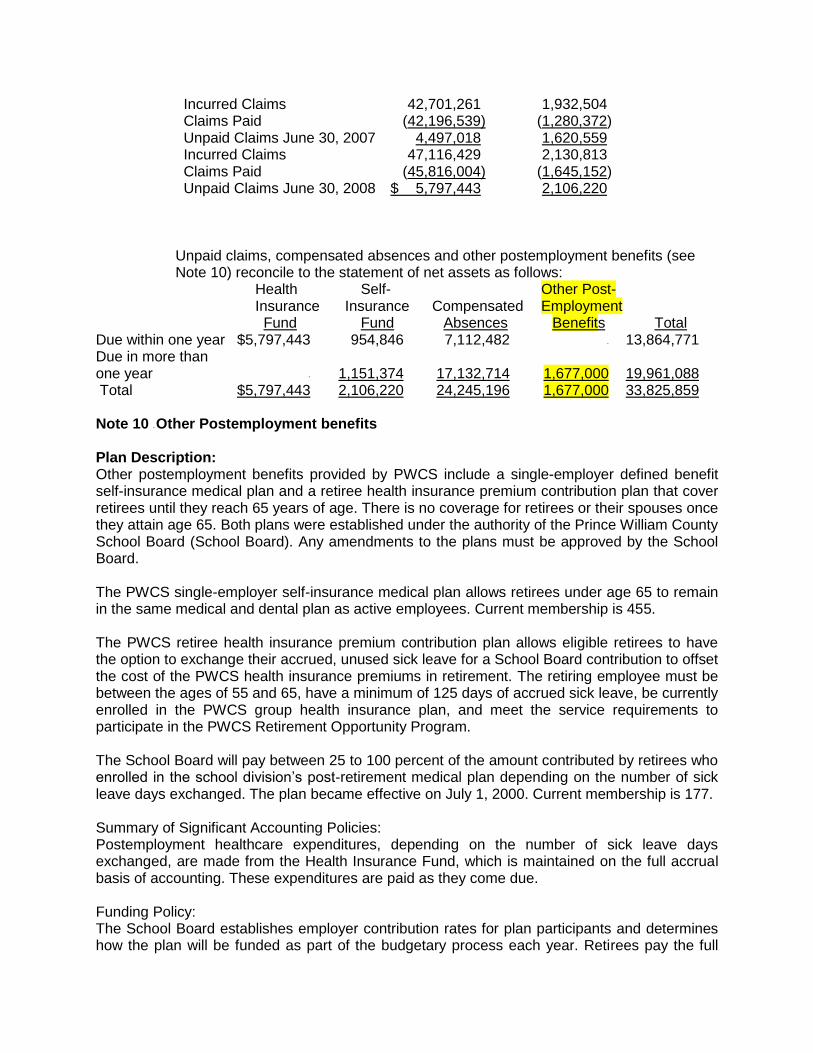
Unpaid claims, compensated absences and other postemployment benefits (see Note 10) reconcile to the statement of net assets as follows:
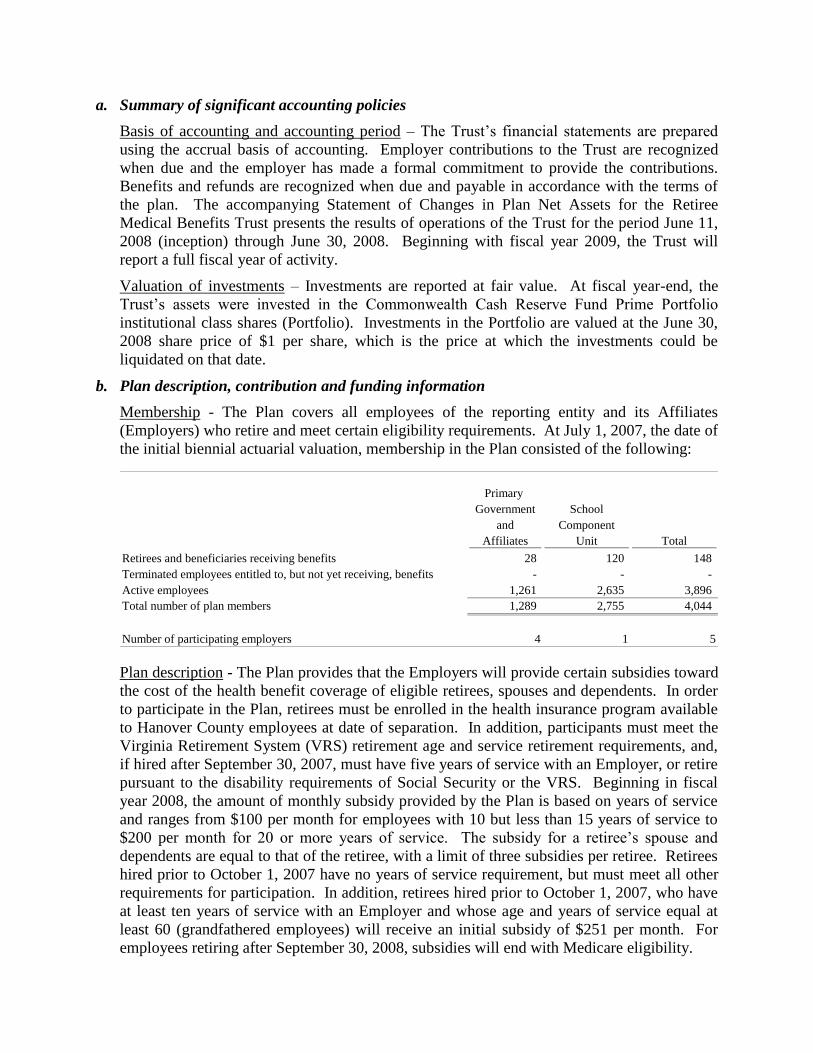
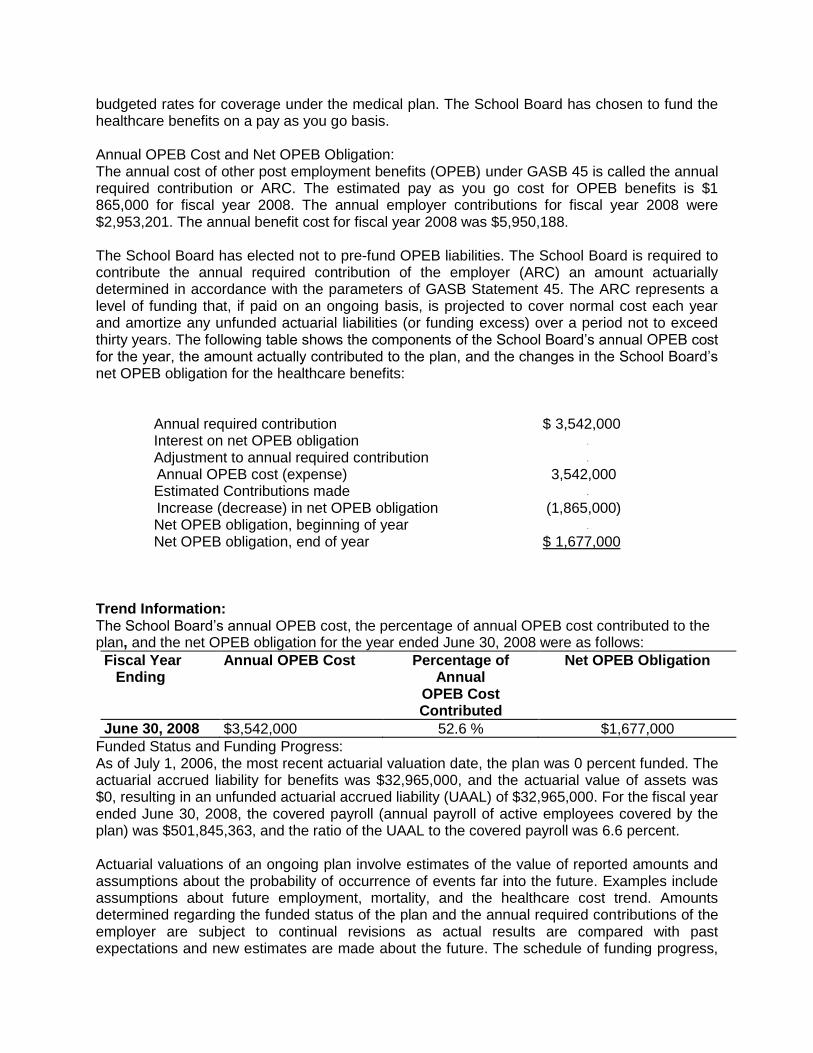
Health Self- Other Post- Insurance Insurance Compensated Employment Fund Fund Absences Benefits Total Due within one year $5,797,443 954,846 7,112,482 - 13,864,771 Due in more than one year - 1,151,374 17,132,714 1,677,000 19,961,088 Total $5,797,443 2,106,220 24,245,196 1,677,000 33,825,859 Note 10 - Other Postemployment benefits Plan Description: Other postemployment benefits provided by PWCS include a single-employer defined benefit self-insurance medical plan and a retiree health insurance premium contribution plan that cover retirees until they reach 65 years of age. There is no coverage for retirees or their spouses once they attain age 65. Both plans were established under the authority of the Prince William County School Board (School Board). Any amendments to the plans must be approved by the School Board. The PWCS single-employer self-insurance medical plan allows retirees under age 65 to remain in the same medical and dental plan as active employees. Current membership is 455. The PWCS retiree health insurance premium contribution plan allows eligible retirees to have the option to exchange their accrued, unused sick leave for a School Board contribution to offset the cost of the PWCS health insurance premiums in retirement. The retiring employee must be between the ages of 55 and 65, have a minimum of 125 days of accrued sick leave, be currently enrolled in the PWCS group health insurance plan, and meet the service requirements to participate in the PWCS Retirement Opportunity Program. The School Board will pay between 25 to 100 percent of the amount contributed by retirees who enrolled in the school division’s post-retirement medical plan depending on the number of sick leave days exchanged. The plan became effective on July 1, 2000. Current membership is 177. Summary of Significant Accounting Policies: Postemployment healthcare expenditures, depending on the number of sick leave days exchanged, are made from the Health Insurance Fund, which is maintained on the full accrual basis of accounting. These expenditures are paid as they come due. Funding Policy: The School Board establishes employer contribution rates for plan participants and determines how the plan will be funded as part of the budgetary process each year. Retirees pay the full
budgeted rates for coverage under the medical plan. The School Board has chosen to fund the healthcare benefits on a pay as you go basis. Annual OPEB Cost and Net OPEB Obligation: The annual cost of other post employment benefits (OPEB) under GASB 45 is called the annual required contribution or ARC. The estimated pay as you go cost for OPEB benefits is $1 865,000 for fiscal year 2008. The annual employer contributions for fiscal year 2008 were $2,953,201. The annual benefit cost for fiscal year 2008 was $5,950,188. The School Board has elected not to pre-fund OPEB liabilities. The School Board is required to contribute the annual required contribution of the employer (ARC) an amount actuarially determined in accordance with the parameters of GASB Statement 45. The ARC represents a level of funding that, if paid on an ongoing basis, is projected to cover normal cost each year and amortize any unfunded actuarial liabilities (or funding excess) over a period not to exceed thirty years. The following table shows the components of the School Board’s annual OPEB cost for the year, the amount actually contributed to the plan, and the changes in the School Board’s net OPEB obligation for the healthcare benefits: Annual required contribution $ 3,542,000 Interest on net OPEB obligation -
Adjustment to annual required contribution -
Annual OPEB cost (expense) 3,542,000 Estimated Contributions made -
Increase (decrease) in net OPEB obligation (1,865,000) Net OPEB obligation, beginning of year -
Net OPEB obligation, end of year $ 1,677,000 Trend Information: The School Board’s annual OPEB cost, the percentage of annual OPEB cost contributed to the plan, and the net OPEB obligation for the year ended June 30, 2008 were as follows:
Fiscal Year Ending
Annual OPEB Cost Percentage of Annual
OPEB Cost Contributed
Net OPEB Obligation
June 30, 2008 $3,542,000 52.6 % $1,677,000
Funded Status and Funding Progress: As of July 1, 2006, the most recent actuarial valuation date, the plan was 0 percent funded. The actuarial accrued liability for benefits was $32,965,000, and the actuarial value of assets was $0, resulting in an unfunded actuarial accrued liability (UAAL) of $32,965,000. For the fiscal year ended June 30, 2008, the covered payroll (annual payroll of active employees covered by the plan) was $501,845,363, and the ratio of the UAAL to the covered payroll was 6.6 percent. Actuarial valuations of an ongoing plan involve estimates of the value of reported amounts and assumptions about the probability of occurrence of events far into the future. Examples include assumptions about future employment, mortality, and the healthcare cost trend. Amounts determined regarding the funded status of the plan and the annual required contributions of the employer are subject to continual revisions as actual results are compared with past expectations and new estimates are made about the future. The schedule of funding progress,
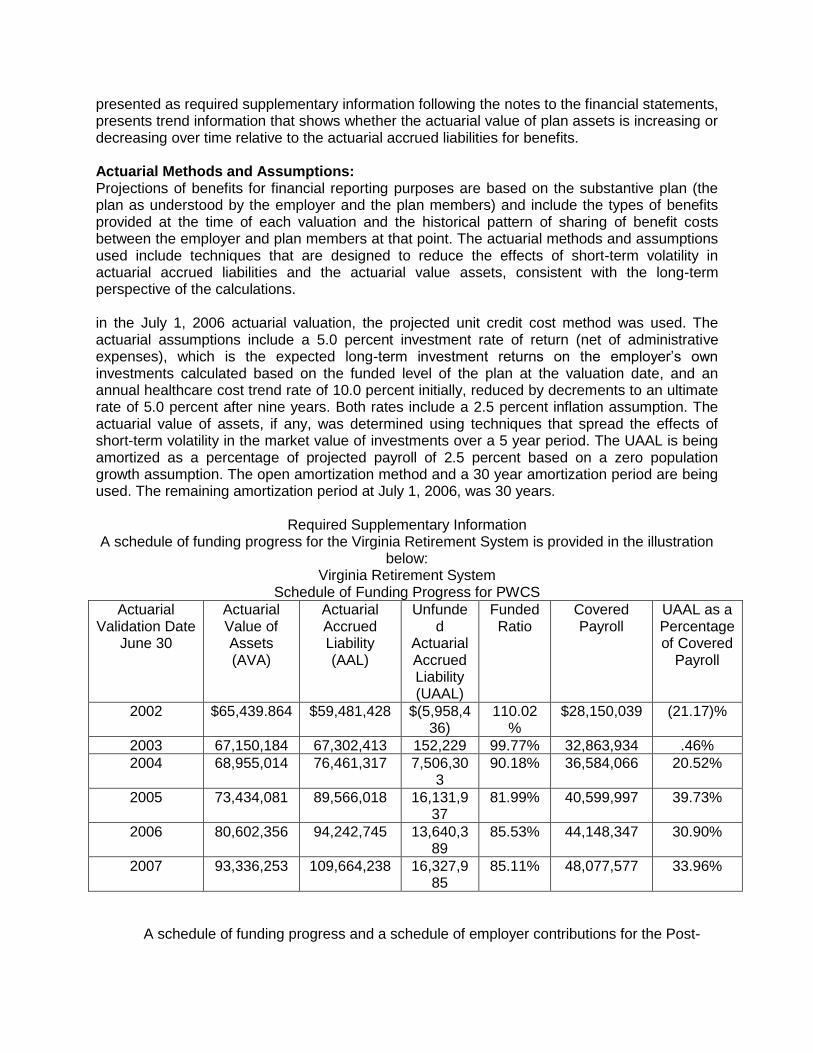
presented as required supplementary information following the notes to the financial statements, presents trend information that shows whether the actuarial value of plan assets is increasing or decreasing over time relative to the actuarial accrued liabilities for benefits. Actuarial Methods and Assumptions: Projections of benefits for financial reporting purposes are based on the substantive plan (the plan as understood by the employer and the plan members) and include the types of benefits provided at the time of each valuation and the historical pattern of sharing of benefit costs between the employer and plan members at that point. The actuarial methods and assumptions used include techniques that are designed to reduce the effects of short-term volatility in actuarial accrued liabilities and the actuarial value assets, consistent with the long-term perspective of the calculations. in the July 1, 2006 actuarial valuation, the projected unit credit cost method was used. The actuarial assumptions include a 5.0 percent investment rate of return (net of administrative expenses), which is the expected long-term investment returns on the employer’s own investments calculated based on the funded level of the plan at the valuation date, and an annual healthcare cost trend rate of 10.0 percent initially, reduced by decrements to an ultimate rate of 5.0 percent after nine years. Both rates include a 2.5 percent inflation assumption. The actuarial value of assets, if any, was determined using techniques that spread the effects of short-term volatility in the market value of investments over a 5 year period. The UAAL is being amortized as a percentage of projected payroll of 2.5 percent based on a zero population growth assumption. The open amortization method and a 30 year amortization period are being used. The remaining amortization period at July 1, 2006, was 30 years.
Required Supplementary Information A schedule of funding progress for the Virginia Retirement System is provided in the illustration
A schedule of funding progress and a schedule of employer contributions for the Post-
retirement Medical and the Retiree Health Insurance Premium Contribution plan are provided in the illustrations below: Virginia Retirement System Health Insurance Credit Program Schedule of Funding Progress for PWCS
COUNTY OF LOUDOUN, VIRGINIA STATEMENT OF NET ASSETS
AS OF JUNE 30, 2008
Primary Component Government Unit Total Governmental School Reporting Activities Board Entity ASSETS Cash and Cash Equivalents $ 294365324 $ 149,900,484 $ 444,265808
Cash and Investments with Fiscal Agents 182,763,001 94,523,885 277,286,886 Receivables, Net: Taxes: Delinquent 23,657,997 - 23,657,997 Not Yet Due 393,926,384 - 393,926,384 Accounts 4,852,965 1033,177 5,886,142 Due from Other Governments 38,044,553 10,901,662 48,946,215 Advances to Employees 65,350 213 65,563 Inventory of Supplies 524,856 594,125 1,118,981 Prepaid Items 1,628,040 284,413 1,912,453 Notes and Loans Receivable, Net 3,731,794 - 3,731,794 Capital Assets: Non-depreciable 219,653,422 457,644,470 677,297,892 Depreciable, Net 462,503,488 640,711,864 1,103,215,352 Capital Assets, Net 682,156,910 1,098,356,334 1,780,513,244
Total Assets 1,625,717,174 1,355,594,293 2,981,311,467
LIABILITIES Accounts Payable 20,778,431 18,189,317 38,967,748 Accrued Interest Payable 10,506,424 669,269 11,175,693 Accrued Liabilities 9,910,842 43,942,677 53,853,519 Prepaid Revenue 2,950,680 - 2,950,680 Unearned Revenue: Property Taxes Not Yet Due 393,926,384 - 393,926,384 Other 4,529,924 1,129,597 5,659,521 Other Liabilities 8,233,495 43,103 8,276,598 Long-term Liabilities: Due Within One Year: Compensated Absences 974,696 1,018,302 1,992,998 Claims Liabilities 11,325,076 - 11,325,076 Bonds Payable 74,302,946 - 74,302,946 Bonds Premium 4,499,004 - 4,499,004 Leases Payable 9,194,348 9,210,454 18,404,802 Due in More Than One Year: Compensated Absences 17,769,462 14,554,357 32,323,819 Claims Liabilities 4,088,764 - 4,088,764 Landfill Closure and Postclosure Care Costs 6,942,576 - 6,942,576 Net OPEB Obligation 13,273,788 40,389,848 53,663,636 Bonds Payable 844,977,247 - 844,977,247 Bonds Premium 33,131,069 - 33,131,069 Leases Payable 46,456,097 15,179,364 61,635,461
Total Liabilities 1,517,771,253 144,326,288 1,662,097,541
NET ASSETS Invested in Capital Assets, Net of Related Debt 489,278,522 1,073,966,516 743,562,715 A Restricted for: Capital Projects 120,692,734 93,039,260 213,731,994 Cafeteria Sales - 949,381 949,381 Permanent Fund-Expendable 3,185 - 3,185 Permanent Fund-Nonexpendable 35,721 - 35,721 Unrestricted (502,064,241) 43,312,848 360,930,930 A
Total Net Assets $ 107,945,921 $ 1,211,268,005 $ 1,319,213,926
A The sum of the columns does not equal the Total Reporting Entity column by a difference of $819,682,323 because the debt related to the School Board Component Unit is reflected in the primary government’s governmental activities column reducing unrestricted net assets. The assets are reflected in the School Board Component Unit column as Invested in Capital Assets, net of related debt. The Total Reporting Entity column matches the asset with the debt and reports the net amount on the Invested in Capital Assets, net of related debt line.
See accompanying notes to the financial statements.
Exhibit IV
COUNTY OF LOUDOUN, VIRGINIA RECONCILIATION OF THE GOVERNMENTAL FUNDS FUND BALANCE
TO THE STATEMENT OF NET ASSETS GOVERNMENTAL ACTMTIES NET ASSETS AS OF JUNE 30, 2008
Fund balances - total governmental funds $ 455,964,921
Amounts reported for governmental activities in the Statement of Net Assets (Exhibit I) are different because:
Capital assets used in governmental activities are not financial resources and therefore are not reported in the governmental funds.
Governmental capital assets 810,481,220
Less accumulated depreciation (147,749,203) 662,732,017
Delinquent taxes and other long-term assets not available to pay for current period expenditures are deferred in the governmental funds.
9,060,520
Long-term liabilities, including bonds payable, are not due and payable in the current period and therefore are not reported in the governmental funds.
Compensated absences (18,744,158) Landfill closure and postclosure care costs (6,942,576) Net OPEB Obligation (13,273,788) Governmental bonds payable (919,280,193) Governmental leases payable (55,650,445) Unamortized bond premium (37,630,073) (1,051,521,233)
Interest on long-term liabilities is not accrued in the governmental funds, but is rather recognized as an expenditure when due. (10,506,424)
Internal service funds are used by management to charge the costs of certain activities to individual funds. The assets and liabilities of internal service funds are
included in governmental activities in the Statement of Net Assets. 42,216,120
Net Assets of Governmental Activities $ 107,945,921
See accompanying notes to the financial statements.
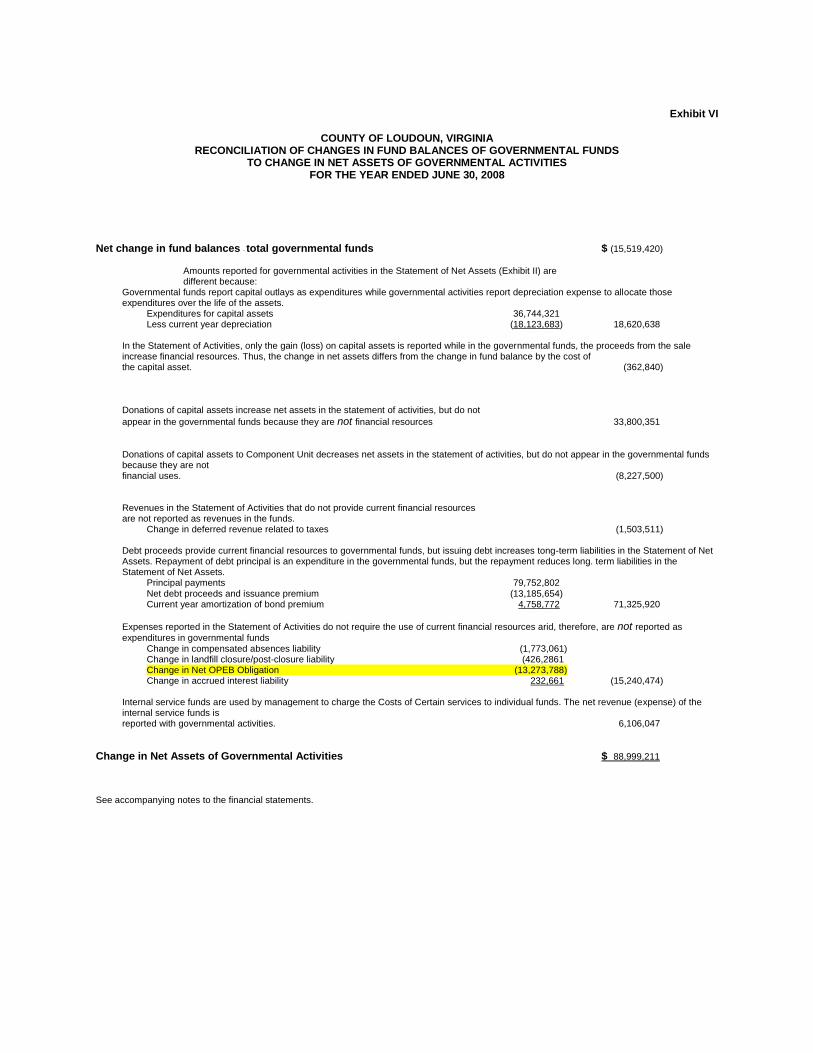
Exhibit VI
COUNTY OF LOUDOUN, VIRGINIA
RECONCILIATION OF CHANGES IN FUND BALANCES OF GOVERNMENTAL FUNDS TO CHANGE IN NET ASSETS OF GOVERNMENTAL ACTIVITIES
FOR THE YEAR ENDED JUNE 30, 2008 Net change in fund balances - total governmental funds $ (15,519,420)
Amounts reported for governmental activities in the Statement of Net Assets (Exhibit II) are different because:
Governmental funds report capital outlays as expenditures while governmental activities report depreciation expense to allocate those expenditures over the life of the assets.
Expenditures for capital assets 36,744,321 Less current year depreciation (18,123,683) 18,620,638
In the Statement of Activities, only the gain (loss) on capital assets is reported while in the governmental funds, the proceeds from the sale increase financial resources. Thus, the change in net assets differs from the change in fund balance by the cost of
the capital asset. (362,840)
Donations of capital assets increase net assets in the statement of activities, but do not
appear in the governmental funds because they are not financial resources 33,800,351
Donations of capital assets to Component Unit decreases net assets in the statement of activities, but do not appear in the governmental funds because they are not
financial uses. (8,227,500)
Revenues in the Statement of Activities that do not provide current financial resources are not reported as revenues in the funds.
Change in deferred revenue related to taxes (1,503,511)
Debt proceeds provide current financial resources to governmental funds, but issuing debt increases tong-term liabilities in the Statement of Net Assets. Repayment of debt principal is an expenditure in the governmental funds, but the repayment reduces long. term liabilities in the Statement of Net Assets.
Principal payments 79,752,802 Net debt proceeds and issuance premium (13,185,654) Current year amortization of bond premium 4,758,772 71,325,920
Expenses reported in the Statement of Activities do not require the use of current financial resources arid, therefore, are not reported as
expenditures in governmental funds Change in compensated absences liability (1,773,061) Change in landfill closure/post-closure liability (426,2861 Change in Net OPEB Obligation (13,273,788) Change in accrued interest liability 232,661 (15,240,474)
Internal service funds are used by management to charge the Costs of Certain services to individual funds. The net revenue (expense) of the internal service funds is
reported with governmental activities. 6,106,047
Change in Net Assets of Governmental Activities $ 88,999,211
See accompanying notes to the financial statements.
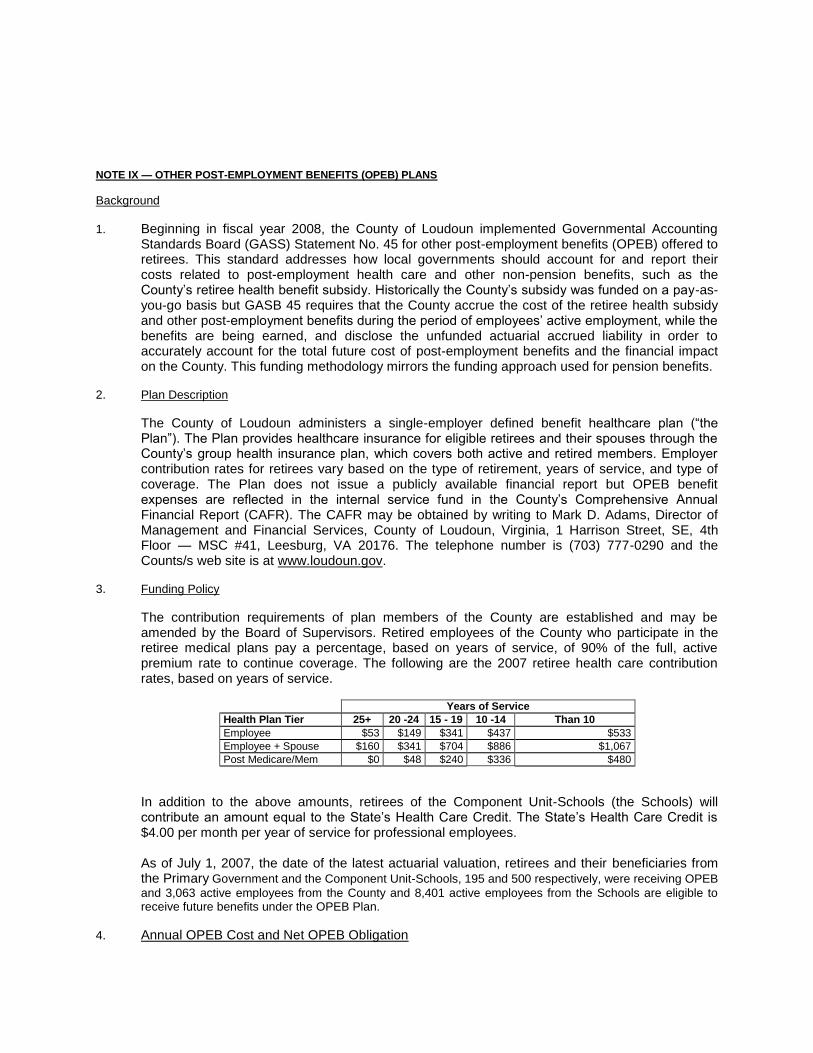
NOTE IX — OTHER POST-EMPLOYMENT BENEFITS (OPEB) PLANS
Background
1. Beginning in fiscal year 2008, the County of Loudoun implemented Governmental Accounting Standards Board (GASS) Statement No. 45 for other post-employment benefits (OPEB) offered to retirees. This standard addresses how local governments should account for and report their costs related to post-employment health care and other non-pension benefits, such as the County’s retiree health benefit subsidy. Historically the County’s subsidy was funded on a pay-as-you-go basis but GASB 45 requires that the County accrue the cost of the retiree health subsidy and other post-employment benefits during the period of employees’ active employment, while the benefits are being earned, and disclose the unfunded actuarial accrued liability in order to accurately account for the total future cost of post-employment benefits and the financial impact on the County. This funding methodology mirrors the funding approach used for pension benefits.
2. Plan Description
The County of Loudoun administers a single-employer defined benefit healthcare plan (―the Plan‖). The Plan provides healthcare insurance for eligible retirees and their spouses through the County’s group health insurance plan, which covers both active and retired members. Employer contribution rates for retirees vary based on the type of retirement, years of service, and type of coverage. The Plan does not issue a publicly available financial report but OPEB benefit expenses are reflected in the internal service fund in the County’s Comprehensive Annual Financial Report (CAFR). The CAFR may be obtained by writing to Mark D. Adams, Director of Management and Financial Services, County of Loudoun, Virginia, 1 Harrison Street, SE, 4th Floor — MSC #41, Leesburg, VA 20176. The telephone number is (703) 777-0290 and the Counts/s web site is at www.loudoun.gov.
3. Funding Policy
The contribution requirements of plan members of the County are established and may be amended by the Board of Supervisors. Retired employees of the County who participate in the retiree medical plans pay a percentage, based on years of service, of 90% of the full, active premium rate to continue coverage. The following are the 2007 retiree health care contribution rates, based on years of service.
Years of Service
Health Plan Tier 25+ 20 -24 15 - 19 10 -14 Than 10
Employee $53 $149 $341 $437 $533
Employee + Spouse $160 $341 $704 $886 $1,067
Post Medicare/Mem $0 $48 $240 $336 $480
In addition to the above amounts, retirees of the Component Unit-Schools (the Schools) will contribute an amount equal to the State’s Health Care Credit. The State’s Health Care Credit is $4.00 per month per year of service for professional employees.
As of July 1, 2007, the date of the latest actuarial valuation, retirees and their beneficiaries from the Primary Government and the Component Unit-Schools, 195 and 500 respectively, were receiving OPEB
and 3,063 active employees from the County and 8,401 active employees from the Schools are eligible to receive future benefits under the OPEB Plan.
The County is required to contribute the annual required contribution of the employer (ARC), an amount actuarially determined in accordance with the parameters of GASB Statement 45. The ARC represents a level of funding that, if paid on an ongoing basis, is projected to cover normal cost each year and amortize any unfunded actuarial liabilities (or funding excess) over a period not to exceed thirty years. The current employer contribution rates for the County and the Schools are 13.23 percent and 9.18 percent, respectively.
The County and the Schools’ annual OPEB cost and the net OPEB obligation based on a 4.0% discount rate, including an inflation component of 2.5%, and amortizing the initial unfunded actuarial liability over 30 years based on a level percent of payroll method for 2008 is as follows:
Primary Government
Component Unit – Schools
Discount Rate 4% 4% Annual Required Contribution (ARC) $15,297,727 $44,484,651 Interest on Net OPEB Obligation 0 0 Adjustment to Annual Required Contribution 0 0
Net OPEB Obligation, End of Year $13,273,788 $40,398,848
Actual Contribution Rate 13.23% 9.18%
5. Actuarial Methods and Assumptions
Projections of benefits for financial reporting purposes are based on the substantive plan (the plan as understood by the employer and the plan members) and include the types of benefits provided at the time of each valuation and the historical pattern of sharing of benefit costs between the employer and plan members to that point. The actuarial methods and assumptions used include techniques that are designed to reduce the effects of short-term volatility in actuarial accrued liabilities and the actuarial value of assets, consistent with the long-term perspective of the calculations.
The valuation of the liabilities as of July 1, 2007 is based on a closed group. Current employees and retirees only are considered; no provision is made for future hires. Using the actuarial assumptions, the number of retired participants is projected each year in the future. Costs are projected for each future year at each age using the trend and aging assumptions. Retiree post employment benefit expenses are determined under the Projected Unit Credit actuarial cost method. Under this method, benefits are projected for life and their present value is determined.
On April 1, 2008 the County Board of Supervisors approved the establishment of $10,000,000 trust fund which will be reported in Pension Fund. The County is in the process of setting up this trust.
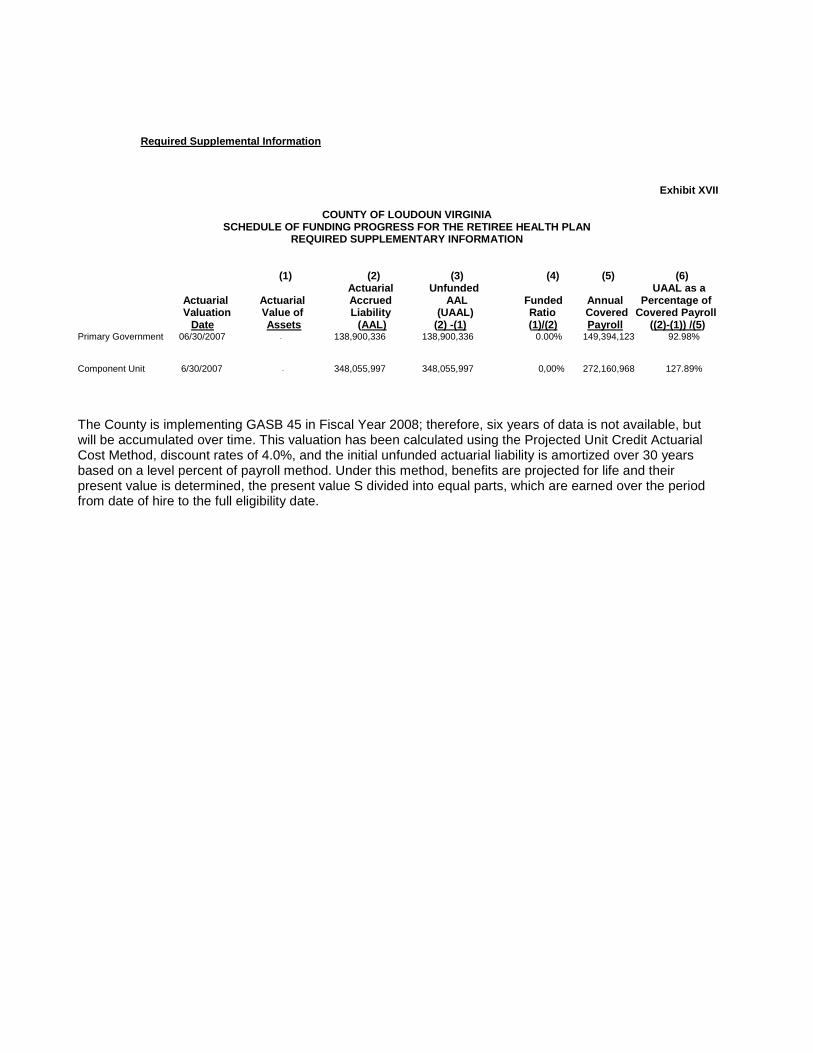
Required Supplemental Information
Exhibit XVII
COUNTY OF LOUDOUN VIRGINIA SCHEDULE OF FUNDING PROGRESS FOR THE RETIREE HEALTH PLAN
REQUIRED SUPPLEMENTARY INFORMATION
(1) (2) (3) (4) (5) (6) Actuarial Unfunded UAAL as a Actuarial Actuarial Accrued AAL Funded Annual Percentage of Valuation Value of Liability (UAAL) Ratio Covered Covered Payroll Date Assets (AAL) (2) -(1) (1)/(2) Payroll ((2)-(1)) /(5)
Primary Government 06/30/2007 - 138,900,336 138,900,336 0.00% 149,394,123 92.98% Component Unit 6/30/2007 - 348,055,997 348,055,997 0,00% 272,160,968 127.89%
The County is implementing GASB 45 in Fiscal Year 2008; therefore, six years of data is not available, but will be accumulated over time. This valuation has been calculated using the Projected Unit Credit Actuarial Cost Method, discount rates of 4.0%, and the initial unfunded actuarial liability is amortized over 30 years based on a level percent of payroll method. Under this method, benefits are projected for life and their present value is determined, the present value S divided into equal parts, which are earned over the period from date of hire to the full eligibility date.